Water-Short Years or
47
Irrigation Strategies for Water - Short Years or Efficient Water Use Northern Utah Water Conference Logan, Utah April 2, 2014 Presentation by L. Niel Allen Extension Irrigation Engineer
Transcript of Water-Short Years or
Irrigation Strategies for
Water-Short Years or
Efficient Water Use
Northern Utah Water Conference
Logan, Utah
April 2, 2014
Presentation by
L. Niel Allen
Extension Irrigation Engineer
Definition of Water Use Efficiency
Yield per unit of water applied (example tons/acre-foot of
applied water)
Yield per unit of crop ET (example tons/acre-foot of ET)
Yield or production per unit of water diverted (incorporates
irrigation conveyance and distribution)
Yield per unit of precipitation (incorporates practices that reduce
precipitation runoff and deep percolation)
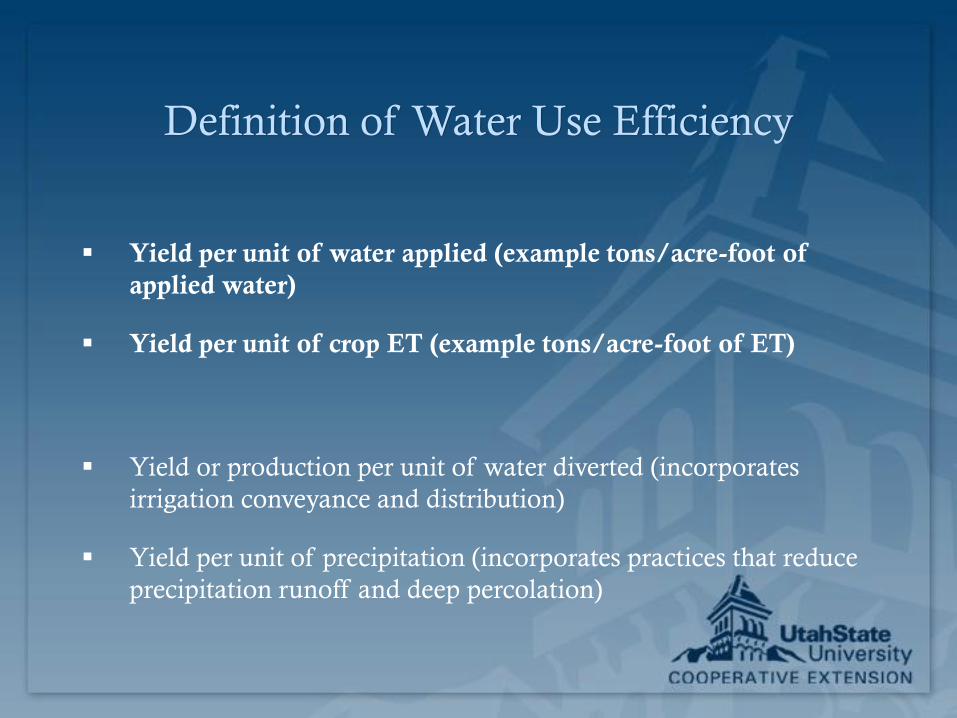
When are Irrigation Strategies for Improved
Water Use Efficiency Important?
Limited irrigation water
supplies
Allocation of water
between different crops
High irrigation water costs
Drought
Always

Presentation Overview
Irrigation System Improvements
Strategies to improve water use efficiency
General – Irrigation Scheduling
Alfalfa
Small Grains
Pasture, vegetables, fruit
Safflower

Strategy – Improve Irrigation System
Coefficient of Uniformity (Sprinklers)
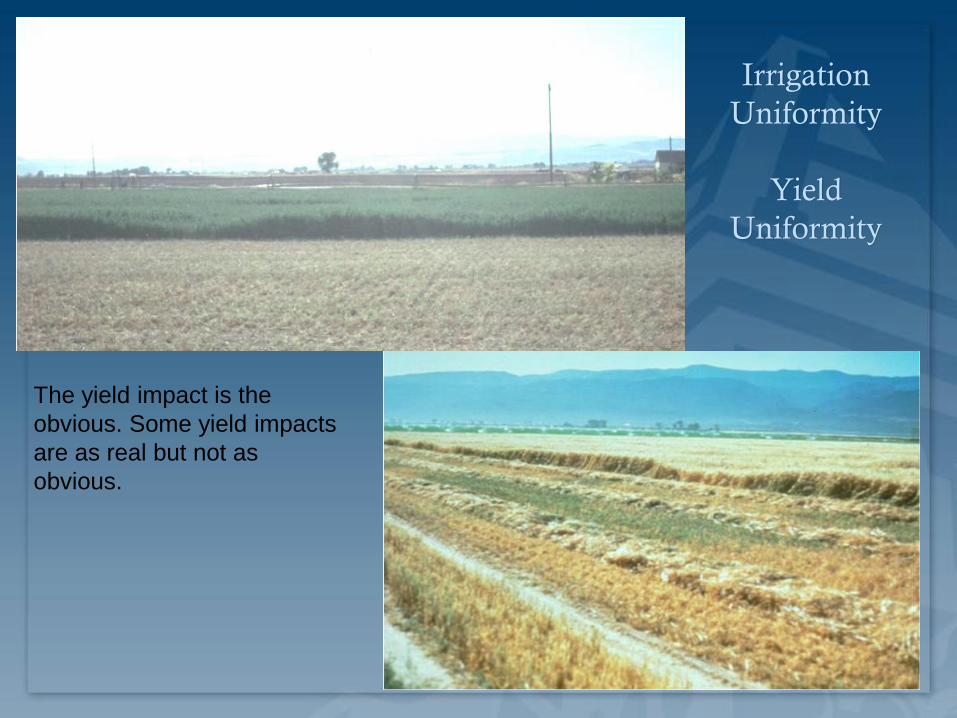
Irrigation
Uniformity
Yield
Uniformity
The yield impact is the
obvious. Some yield impacts
are as real but not as
obvious.
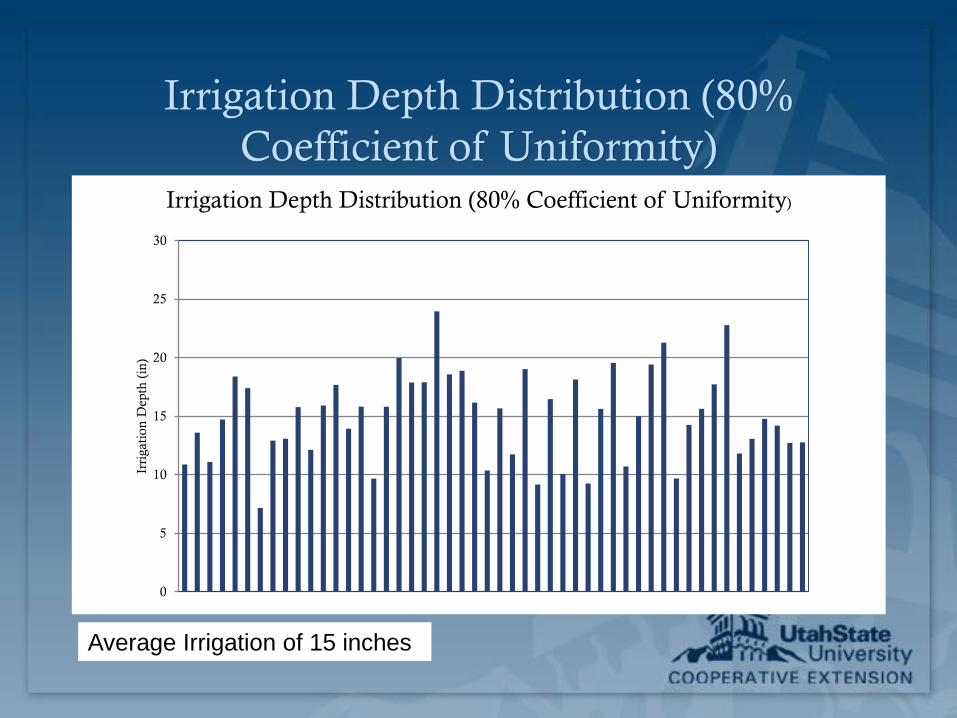
Irrigation Depth Distribution (80%
Coefficient of Uniformity)
0
5
10
15
20
25
30
Irri
gati
on
Dep
th (
in)
Irrigation Depth Distribution (80% Coefficient of Uniformity)
Average Irrigation of 15 inches
0
5
10
15
20
25
30
0 10 20 30 40 50 60 70 80 90 100
Irri
gati
on
Dep
th (
in)
Area Receiving less than Indicated Depth (%)
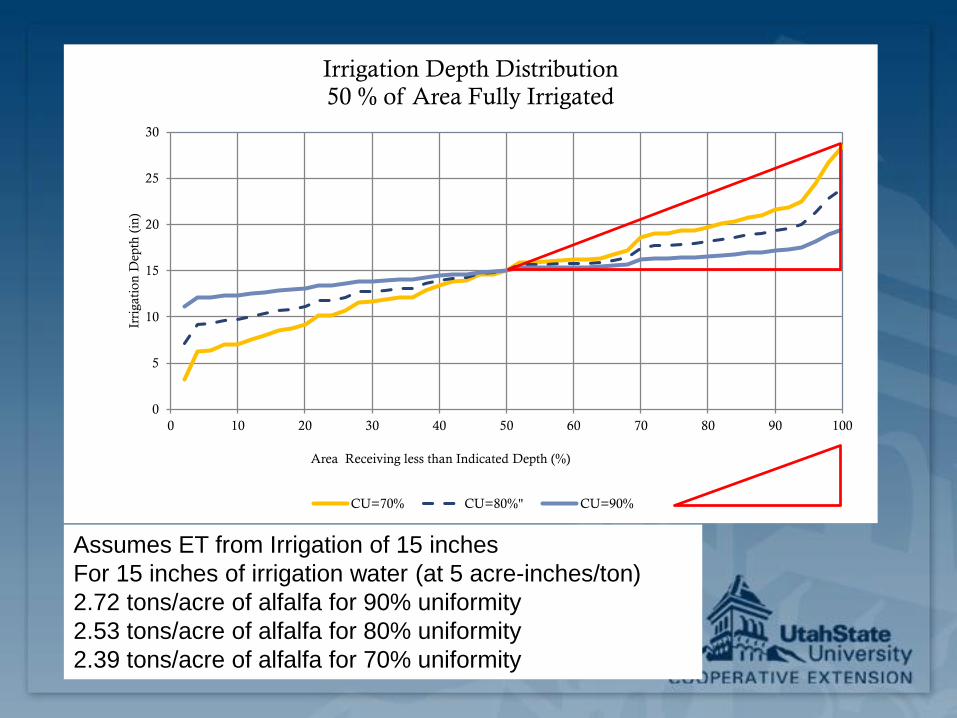
Irrigation Depth Distribution
50 % of Area Fully Irrigated
CU=70% CU=80%" CU=90%
Assumes ET from Irrigation of 15 inches
For 15 inches of irrigation water (at 5 acre-inches/ton)
2.72 tons/acre of alfalfa for 90% uniformity
2.53 tons/acre of alfalfa for 80% uniformity
2.39 tons/acre of alfalfa for 70% uniformity
0
5
10
15
20
25
30
35
40
45
0 10 20 30 40 50 60 70 80 90 100
Irri
gati
on
Dep
th (
in)
Area Receiving less than Indicated Depth (%)
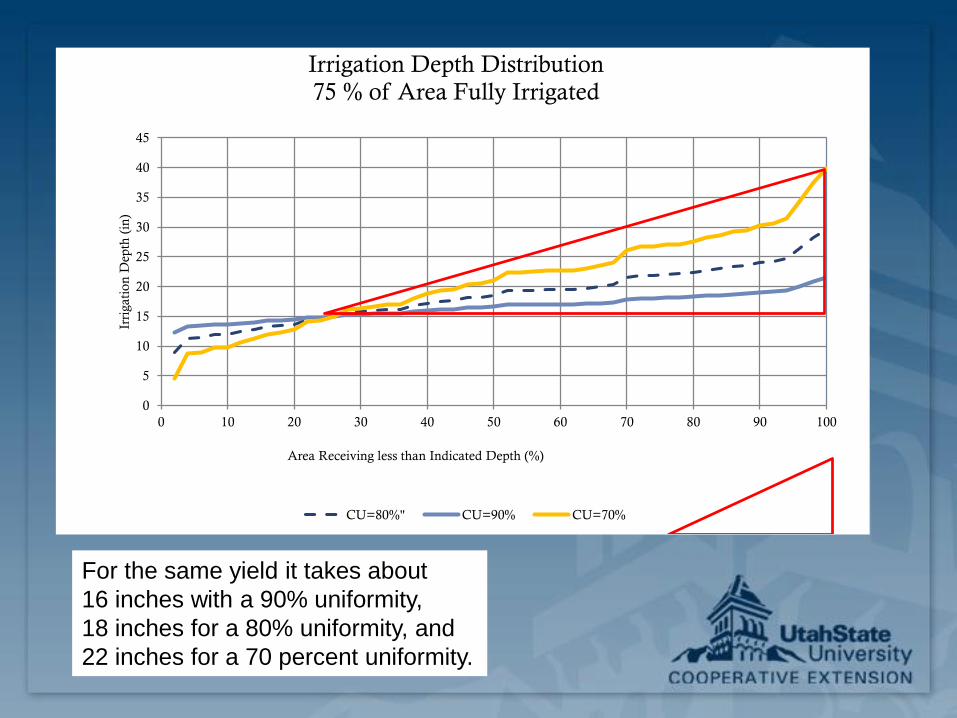
Irrigation Depth Distribution
75 % of Area Fully Irrigated
CU=80%" CU=90% CU=70%
For the same yield it takes about
16 inches with a 90% uniformity,
18 inches for a 80% uniformity, and
22 inches for a 70 percent uniformity.
Efficient Water Use for all Crops Improve Irrigation System Uniformity (minimize deep
percolation)
Replace sprinklers, gaskets, and fix leaks
Upgrade irrigation system
Level fields to uniform and proper grade
Adjust furrow or border flow rate
Irrigation Scheduling (minimize crop stress and deep percolation)
Crop Rotation
An excellent farmer told me - The best thing about growing green beans is the crop of wheat that follows.
Shallow rooted crops (onions, beans, potatoes, etc.) followed deep rooted crops (small grains, safflower, field corn).
10
Basic Principles Alfalfa
Alfalfa uses water is most efficient during spring growth (1st and perhaps 2nd cutting).
About 5 acre-inches of ET per ton (1st cutting)
About 7 acre-inches of ET per ton (later cuttings)
Under-irrigation results in higher irrigation efficiencies (slight deficit irrigation)
Better to stop watering alfalfa than to just keep it a dull green with little or no growth.
Most alfalfa varieties will go into dormancy with no long term impact.
Alfalfa is generally considered drought tolerant.
11

Basic Principles for Alfalfa (Continued)
Focus on most productive alfalfa land (best soils, best
alfalfa stem density, least weeds, youngest alfalfa, best
irrigation systems, best variety).
Focus on land with most efficient irrigation application.
Extra water does not produce extra yield.
Enough but not extra
12

Limited Irrigation of Alfalfa in the Great Plains and Intermountain West
Troy Bauder, Neil Hansen, Brad Lindenmeyer, Jim Bauder, and Joe Brummer
13

Irrigation Strategy for Wheat or Barley
Don’t stress your crop, but no need to have a full soil moisture profile at harvest.
It takes about 3 inches from soft dough to harvest.
In general you can stop irrigating at soft dough. Another irrigation of about 1 inch may be needed.
An advantage of a pivot over wheel line is that you can maintain the entire field near field capacity so that at soft it doesn’t take a week or more to irrigate.
Use irrigation scheduling
14
Other Important Considerations (Small grains)
Soil tillage to reduce runoff and soil moisture evaporation
Planting dates (plant early as possible in spring – fall is
better for wheat)
Irrigation scheduling
Variety has an impact on yield and water use efficiency.
Soil fertility has an impact on yield and water use
efficiency. Water is used more efficiently when nutrients
are available.
15

Last Irrigation of Wheat Information
0
5
10
15
20
25
1-Apr 1-May 31-May 30-Jun 30-Jul 29-Aug
ET
(in
ches)
Water Use and Stages of Winter Wheat
Spring growth
Jointing
Boot Stage
Flowering
Dough
Maturity
Harvest
Milk
Stop Irrigation with Full Soil Moisture Profile
16

Scheduling the Last Irrigation on Wheat and Barley
Howard Neibling and Zahid Qureshi, University of Idaho
17
Pasture Early water is the most important (cool season grasses).
Provide proper fertilization
Don’t over graze.
Consider the variety of grass if you are in a deficit irrigation condition.
Bromegrass and wheatgrass were more drought tolerant than tall fescue or orchardgrass, but they didn’t tolerate full-season irrigation, and when fully irrigated their stands were dramatically reduced. Orchardgrass tolerated a single season of deficit irrigation but over several years it didn’t persist as well as tall fescue. (Orloff and Putnam, UC 2010)
Irrigation Scheduling
18

Vegetables
Best Strategy is to have an irrigation system with good
uniformities and flexibility.
Many high value vegetable crops (i.e. green beans, fresh
peas, sweet corn) are harvested during a high water use
period. Don’t stress these crops prior to harvest time.
Maintain adequate soil moisture, especially during critical
development periods.
19
Fruit Production
Best Strategy is to have an irrigation system with good
uniformities and flexibility.
Consider micro-irrigation
Many high value crops are harvested during a high water
use period, so don’t sacrifice quality due to irrigation
Maintain adequate soil moisture.
20

Safflower Irrigation Research
Questions Investigated:
1. When and how often should safflower be
irrigated?
2. At what growth stage should irrigation
be terminated? and
3. How does irrigation impact Alternaria
leaf spot?
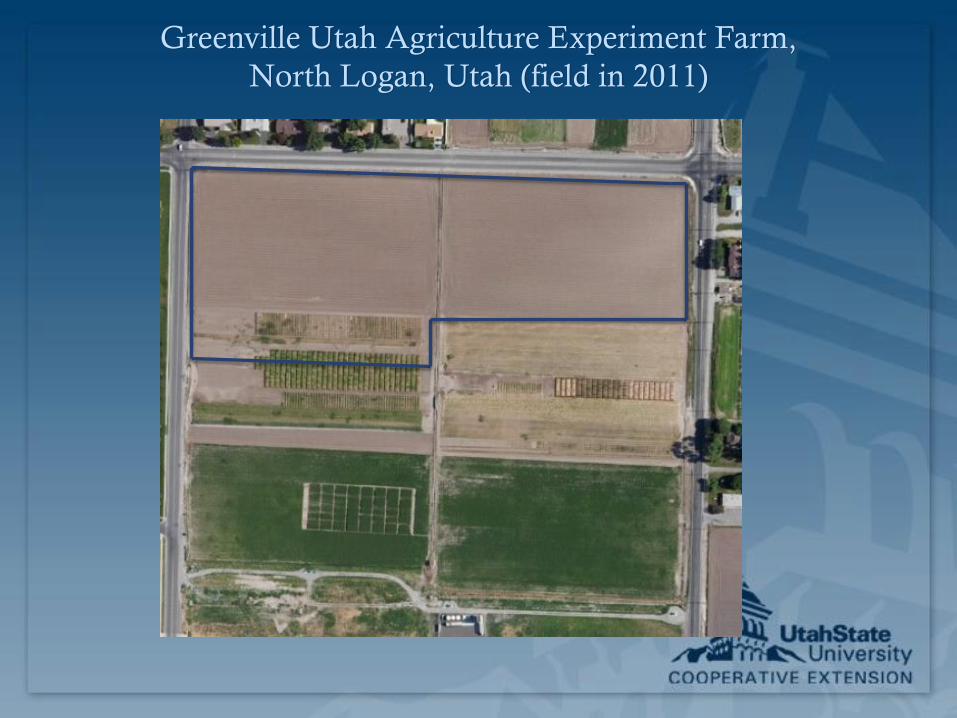
Greenville Utah Agriculture Experiment Farm,
North Logan, Utah (field in 2011)

Irrigation Plot Layout
Safflower Irrigation Research (2013) Greenville Farm
First Irrigation
A B C D E F
1 0 1 2 0 3 0
2
3 0 1 3 0 3 1
4
5 2 3 1 2 3 0
6
7 1 1 3 Treatments
8 0 - No irrigation.
9 2 2 2 1 - One irrigation (elongation).
10 2 - Two irrigations (elongation and branching).
11 3 - Three irrigations (elongation, branching, flowering).
12 Plots are 50 feet by 210 feet
13
Irrigation buffer - not used
Irrigation treatment
1800 North
80
0 East
Sprinkler Line
Main Line
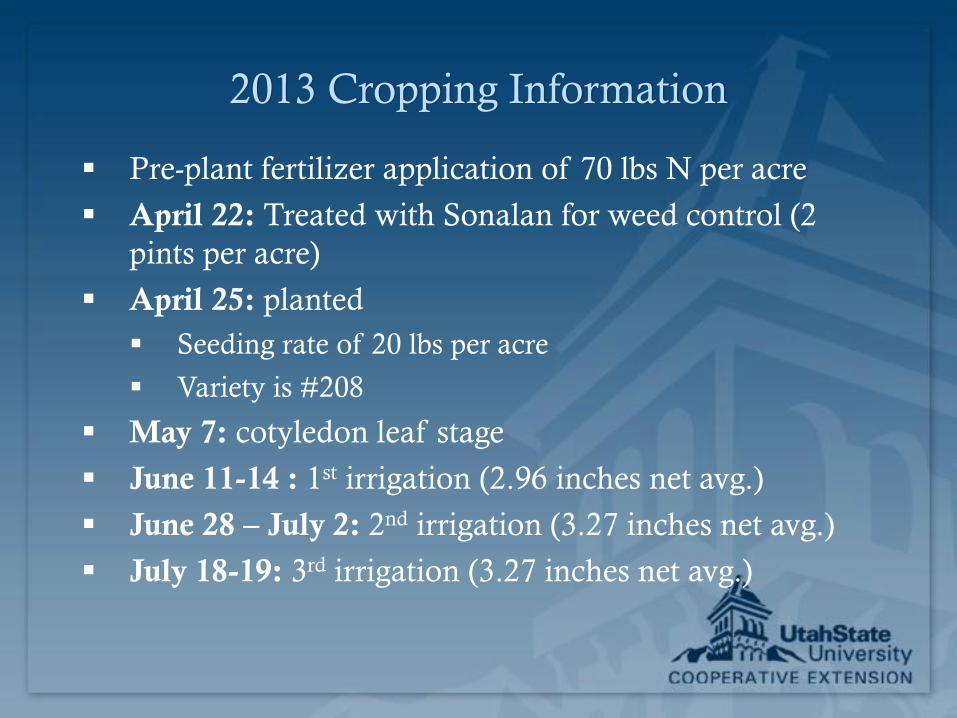
2013 Cropping Information
Pre-plant fertilizer application of 70 lbs N per acre
April 22: Treated with Sonalan for weed control (2
pints per acre)
April 25: planted
Seeding rate of 20 lbs per acre
Variety is #208
May 7: cotyledon leaf stage
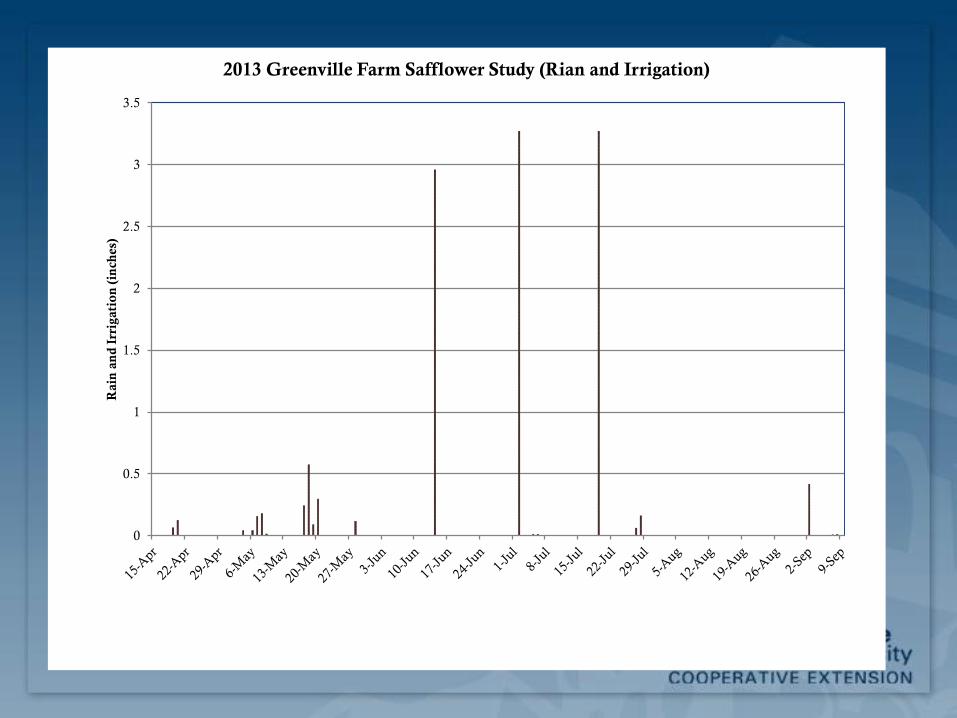
June 11-14 : 1st irrigation (2.96 inches net avg.)
June 28 – July 2: 2nd irrigation (3.27 inches net avg.)
July 18-19: 3rd irrigation (3.27 inches net avg.)

Cropping Information
August 3: Obtained imagery of field.
August 9: Fungicide application on half of each plot
(Quadris Flowable) at 12 oz. per acre and (Exit
Activator Adjuvant) at about 6 oz. per acre.
Oct 9: Harvested 9 of 48 sub-plots (a portion of the
east side) Combine broke and then it rained.
Oct 21: Harvested remainder of plots
Total yield of field (all buffers and plots) was 38,000 lbs
or about 2,990 lbs. per acre
Data Collected
Weather data from USU Greenville Farm station
Initial soil moisture samples taken at 3 locations on
May 10.
Soil moisture samples taken every two weeks at 6
locations June 7 through September 3.
Yield data for plots
Oil content, bushel weight, moisture percent
Seed Color Score – color scale, dark ends, papus,
immature seeds, slight yellowing, sprouting
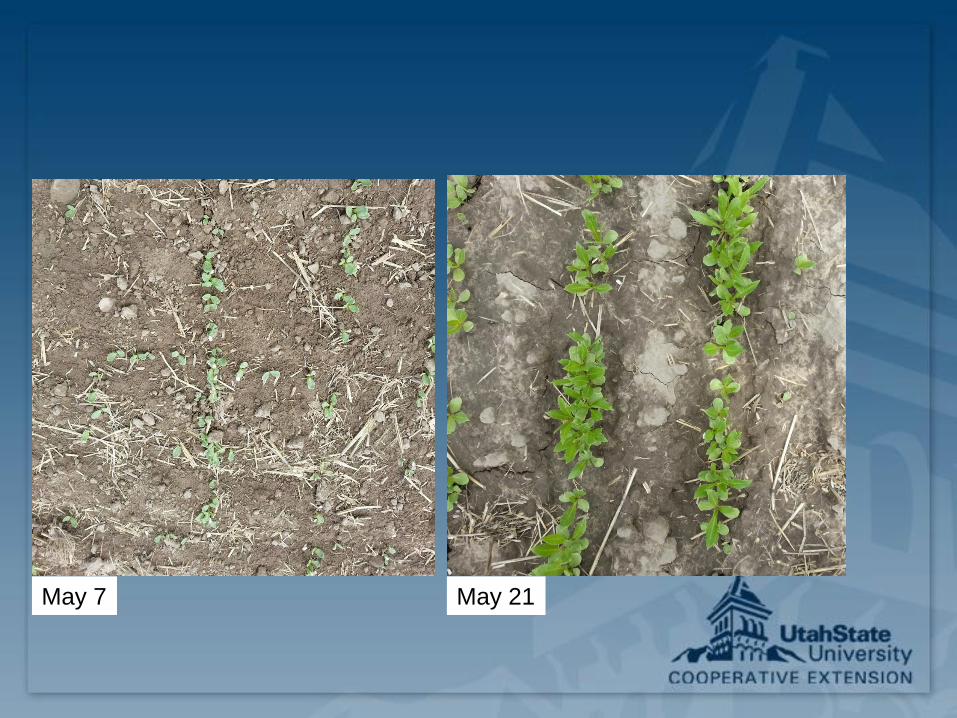
May 7 May 21

May 29 June 7

June 17 (first Irrigation June 11) June 24
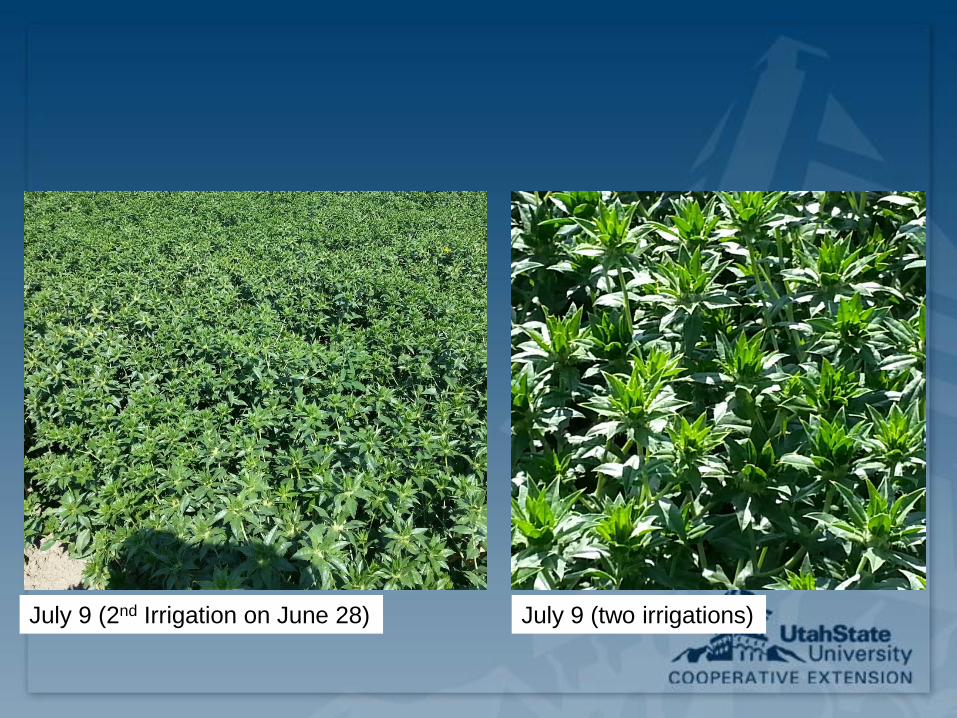
July 9 (2nd Irrigation on June 28) July 9 (two irrigations)

July 9 (no irrigations)

July 9 (two irrigations, slight Alternaria leaf spot
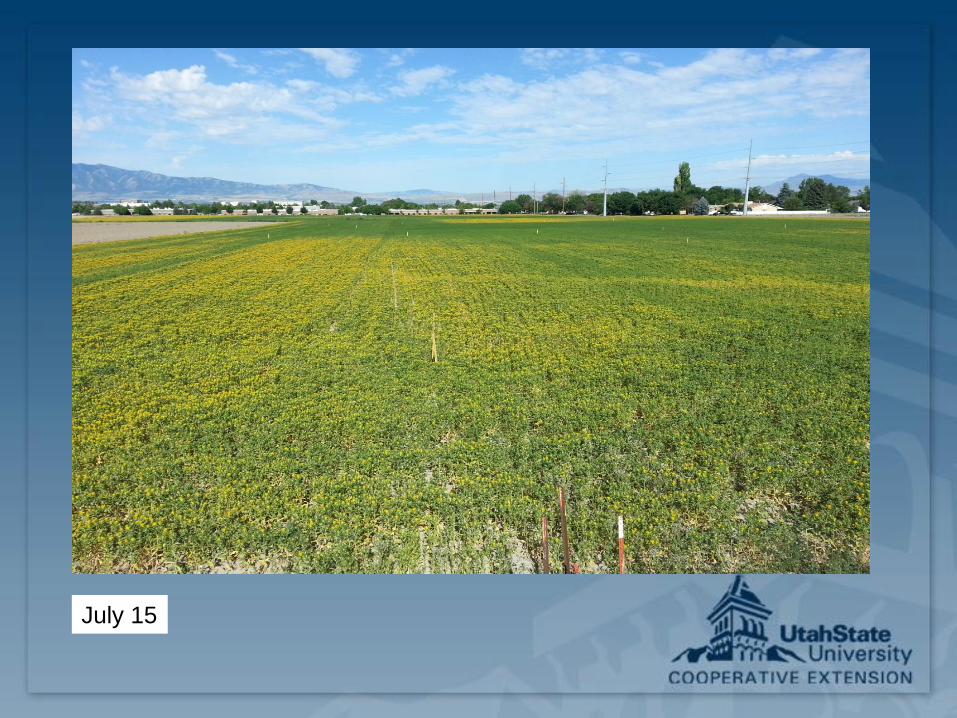
July 15
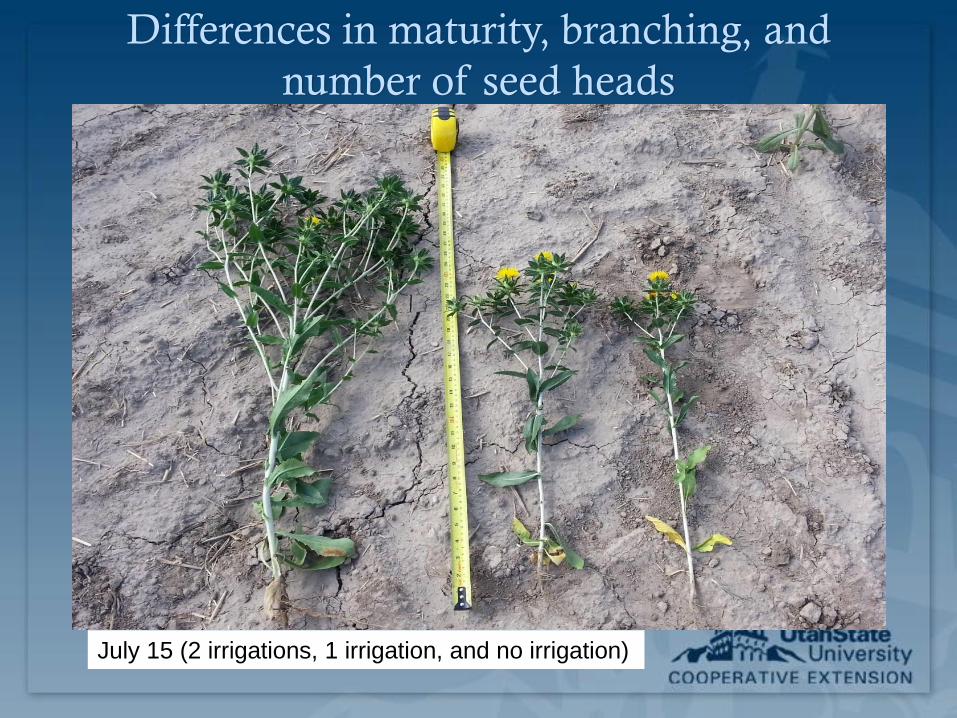
Differences in maturity, branching, and
number of seed heads
July 15 (2 irrigations, 1 irrigation, and no irrigation)

July 18 (third and last irrigation)

July 22 (3 irrigations) July 22 (no irrigations)
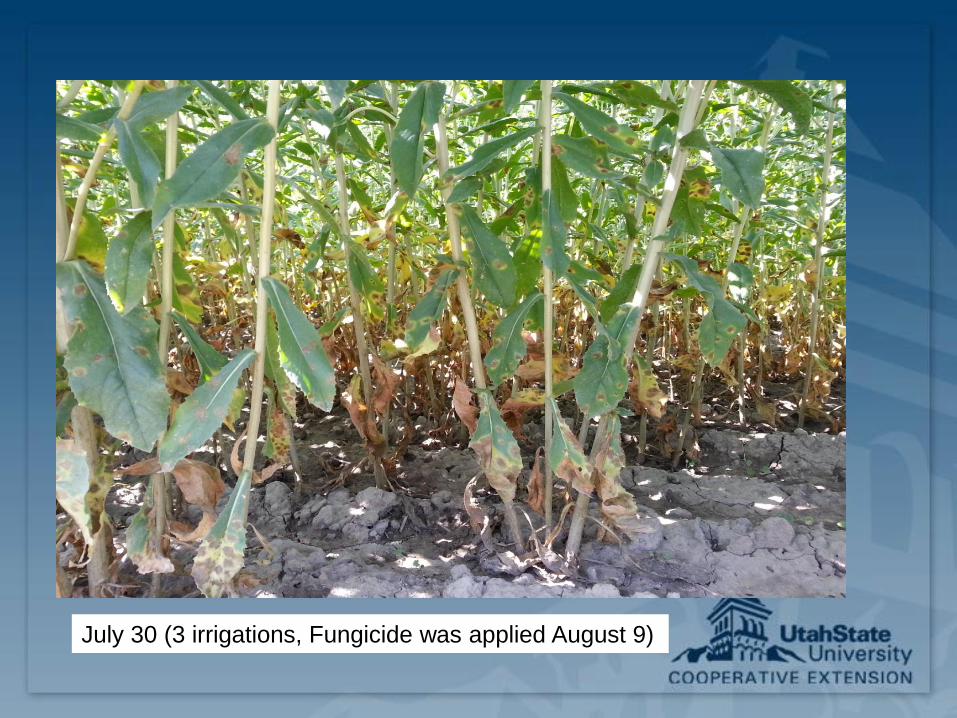
July 30 (3 irrigations, Fungicide was applied August 9)
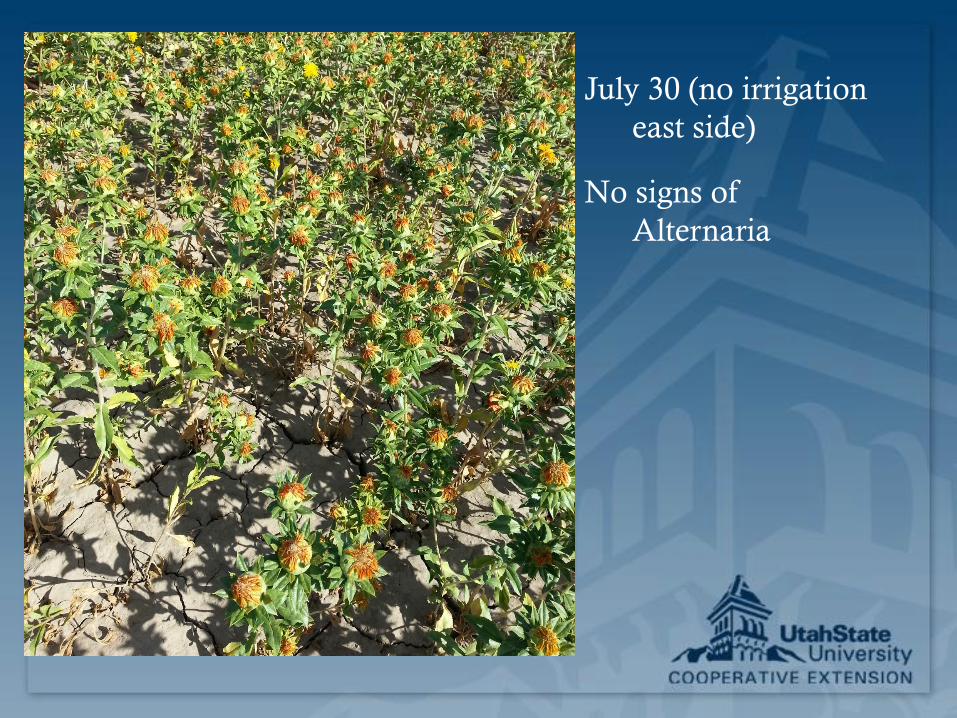
July 30 (no irrigation
east side)
No signs of
Alternaria

False Color Image (red is well irrigated)
August 3 (Aerial Photo and
Irrigation level)
0
0
2
1
2
0
0
0
0
2 2
22 3
3
3
3
3
3
1
1
1
1
1

Difference between area treated with and
without fungicide
September 19
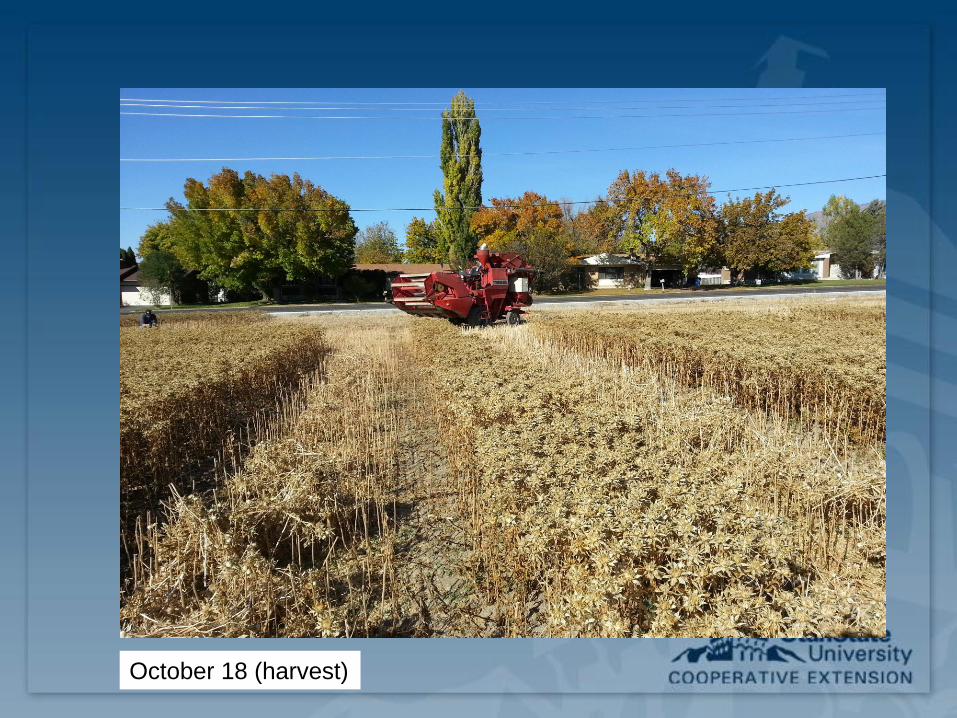
October 18 (harvest)

Safflower Yields
0
500
1,000
1,500
2,000
2,500
3,000
3,500
4,000
4,500
0 2 4 6 8 10 12
Yie
ld (
lbs.
/a
c.)
Irrigation Amounts (inches)
Safflower Yield for Irrigation Levels

Average Yields for by Irrigation Levels
0
500
1,000
1,500
2,000
2,500
3,000
3,500
4,000
I-0 I-1 I-2 I-3
Yie
ld (
lbs/
acr
e)
Irrigation Level (0 to 3 Irrigations)
Safflower Yields v Number of Irrigations
Greenville Farm 2013
2013 Greenville Farm Rain and Irrigation
0
0.5
1
1.5
2
2.5
3
3.5R
ain
an
d I
rrig
ati
on
(in
ches)
2013 Greenville Farm Safflower Study (Rian and Irrigation)

0
2
4
6
8
10
12
14
16
18
20
ET
(in
.)Total Cumulative ET for Irrigation Levels Safflower 2013based on Soil
Moisture Measurement (top 5 feet), Precipitation and Irrigation
I-3 I-1 I-0 I-2 I-1 I-2
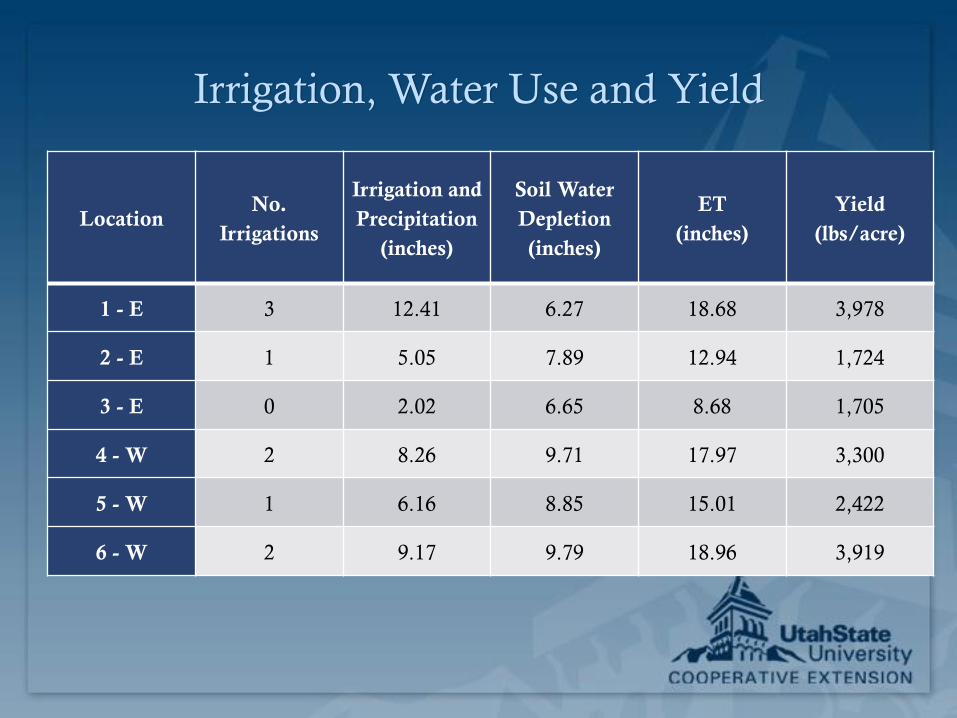
Irrigation, Water Use and Yield
LocationNo.
Irrigations
Irrigation and
Precipitation
(inches)
Soil Water
Depletion
(inches)
ET
(inches)
Yield
(lbs/acre)
1 - E 3 12.41 6.27 18.68 3,978
2 - E 1 5.05 7.89 12.94 1,724
3 - E 0 2.02 6.65 8.68 1,705
4 - W 2 8.26 9.71 17.97 3,300
5 - W 1 6.16 8.85 15.01 2,422
6 - W 2 9.17 9.79 18.96 3,919
Summary
The number of irrigations made effected the yields
with a high significance level. There was the least
difference in yield moving from 2 to 3 irrigations.
The alternaria leaf spot disease was not a significant
factor in the yield.
The fungicide treatment resulted in improvement dark
ends.
In 2013 there was very little rain in June, July, and
August while the was maturing. The results could
change during a year with higher precipitation.