Water Services National Training Group 12th Annual Conference 11 th September, 2008.
35
Water Services National Training Group 12th Annual Conference 11 th September, 2008
-
Upload
lucas-green -
Category
Documents
-
view
213 -
download
0
Transcript of Water Services National Training Group 12th Annual Conference 11 th September, 2008.

Water Services National Training Group
12th Annual Conference
11th September, 2008

Water Services National Training Group
Training & Development

Water Conservation/Leakage Reduction
Lar Spain
Senior Engineer
Fingal County Council

Leakage Control - Context
Financial – Treatment, Pumping, etc.Leakage Control pays for itself.Service to customer improves.Ecological – Waste of resources,
Sustainability.Public Health – WTP’s overstretched

What is Leakage Control/Reduction?
?

What is Leakage Control?
Is it this….
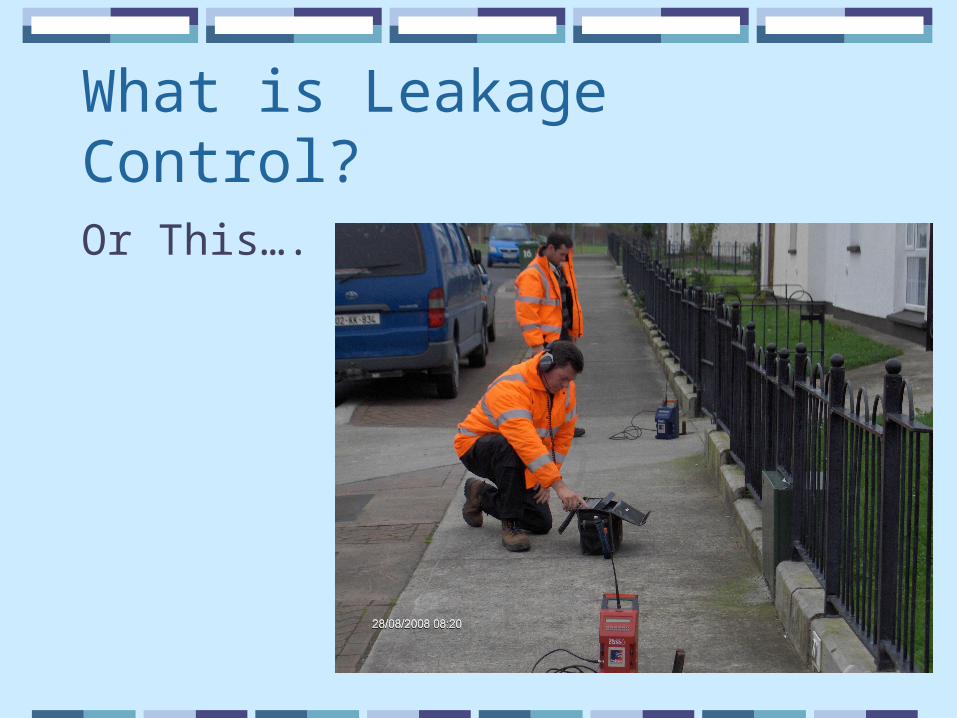
What is Leakage Control?
Or This….
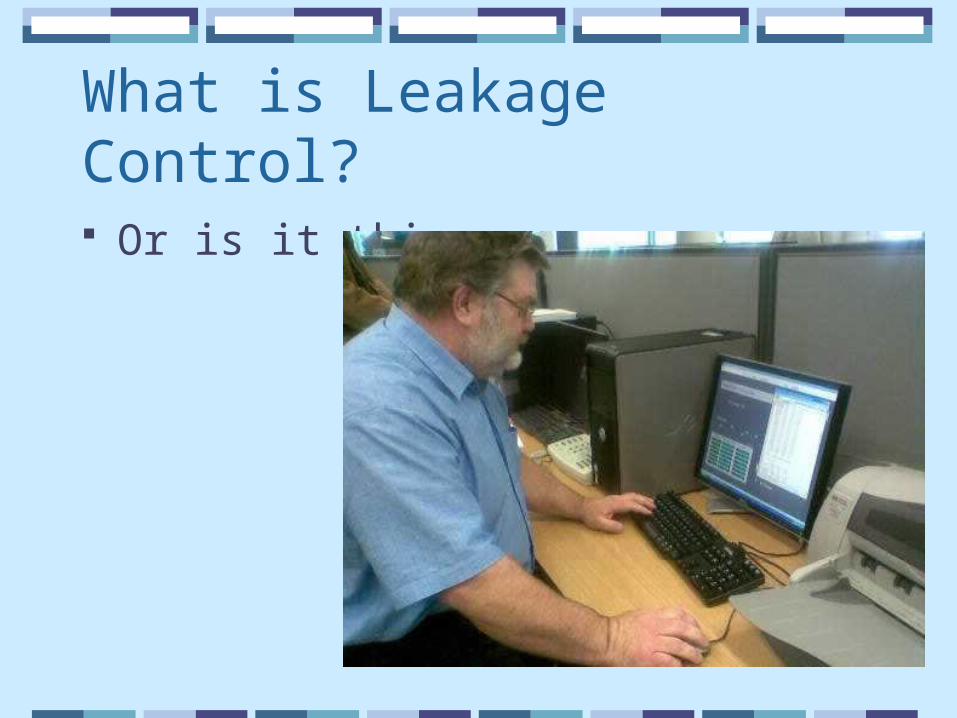
What is Leakage Control?
Or is it this…
What is Leakage Control?
Active Leakage Control Leak finds you – Easy. You find leak – Hard.
70% to 80% of Active Leakage Control is spent gathering and refining data.
DATA IS THE KEY!

Spot the Difference…..Both are Leaks.LHS Service Leak – RHS a 150 mm Burst.LHS “Reported” – RHS “Unreported”.
Active Leakage Control - DMA’s Looking for unreported bursts/leaks in a county is like
looking for needles in a field of haystacks. DMA’s - tell you which haystacks (DMA’s) have
needles and which don’t. Allows you to target your resources.
Subdivide county into District Metered Areas (DMAs) and measure flow into each DMA.
Try to have no more than 1,000 properties in each DMA (Urban Areas – Rural dictated by geography).

Benefits of DMA’s
Identify unreported bursts and leaks.Reduce leakage runtime.Prioritisation of target areas for leakage
inspectors.Can tell you number of Service Leaks
and/or Mains Bursts that you have to find.Network performance can be monitored.Data available for design, planning and
forecasting.

District Meter AreasDistrict Meter Areas are:
• Metered Areas feed by a single supply (not always).
• Designed to accommodate a
maximum of 1,000 properties
(Domestic and Non Domestic –
Urban/Rural differences).
• Connected to the regional
Telemetry Network or logged to
enable remote monitoring.
Fingal has:
• 111 DMA’s County wide
• 3 New DMA’s will be created every year for the next 5 years
Typical DMA Meter

Water Audits
DMA Inflow - Domestic Demand - Non-Domestic Demand - Customer Losses - Operational Usage
Net Distribution Losses (UFW)
Leakage is part (most) of UFW

Domestic Demand
Has to be estimated – we use 148 l/person/day.
The Per Capita Consumption (PCC) Figure can be exceeded (>148 l/person/day) – makes UFW increase (in hot weather for example).
Accurate Population Figure also needed.

Non-Domestic Demand
Meter error.Meters being bypassed.Unmetered Non-domestics (should be gone). Illegal tappings off mains.Mobile Vehicles eg. Road
sweepers/commercial tankers filling from hydrants.
Fire Flows.

Losses and Usage
Customer Losses - 64.36 l/prop/day (average)
Operational Usage – 1.2 l/person/day (fire hydrants, flushing mains, road sweepers etc. by the Local Authority)

Leakage Team - Tasks
Tracking house counts/population.Better estimates for PCC.Gathering Meter Readings – question.Metering missed Non-Domestics.Chasing new Non-Domestics.Chasing as-built drawings.Confirming/correcting record drawings.

Leakage Team - Tasks
Drop-Testing DMA’s – to check for integrity and/or breaches.
Checking Boundary Valves.Drop-Testing Reservoirs. Installation/Retrieval of Loggers.Step Testing.Sounding.Correlating.

Leakage Team - Training
Large commitment to Training required.Can take some time to “get up to speed”. Issue when staff changes – particularly
Engineer.WSNTG – existing training courses – being
updated – ready Spring 2009.

Network Management & UFW•Network Management - understanding Network - where water is being used.
•Identifying Unaccounted-for Water (UFW) - big challenge.
Achieved by undertaking a series of analytical steps:
• Water Audits (Trunk and Distribution Mains).• Water Supply Area (WSA) and District Meter Area (DMA) Audits.• Commercial Audits.• Domestic Usage Audits (Per Capita Consumption).

Locating Leaks
•Audits confirm a leak as the reason for the UFW.•Locate the Leak(s)• Step Testing - Breaking a DMA into sections to narrow down where the leak may be.• Leak Location – Aural Sounding using listening sticks (Traditional Method) or using electronic acoustic equipment to identify the leak
Mains Burst
The most important activity in this process is to EXPEDITE the leak repair.
Mains Burst when identified should be repaired within 24 hours.

Operational BarriersOperational Barriers (UFW Show Stoppers)
• Lack of clear as-laid information on new infrastructure constructed by
others
• Quality of Workmanship
• Standard of Materials used
• Boundary Breaches – operational changes.
• Getting repairs done quickly.
Recent Example of Qualtiy of Workmanship:
•In 5 NEW Estates in Balbriggan [2,000 Houses] – 111 Leaks were located.
•All of these were down to the Quality of Workmanship
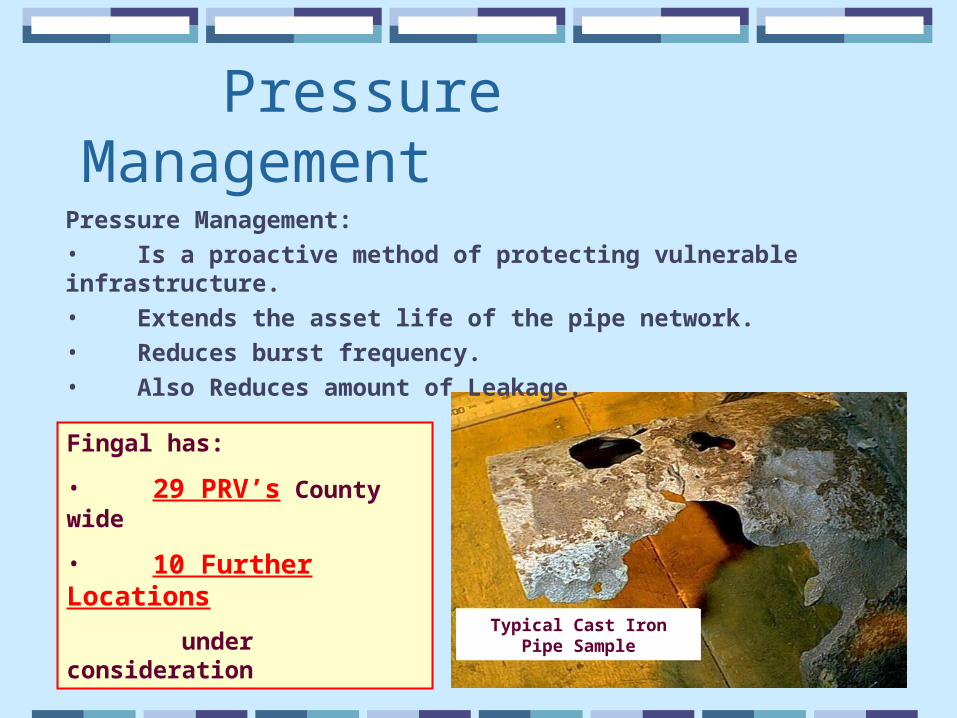
Pressure ManagementPressure Management:
• Is a proactive method of protecting vulnerable infrastructure.
• Extends the asset life of the pipe network.
• Reduces burst frequency.
• Also Reduces amount of Leakage.
Fingal has:
• 29 PRV’s County wide
• 10 Further Locations
under consideration
Typical Cast Iron Pipe Sample
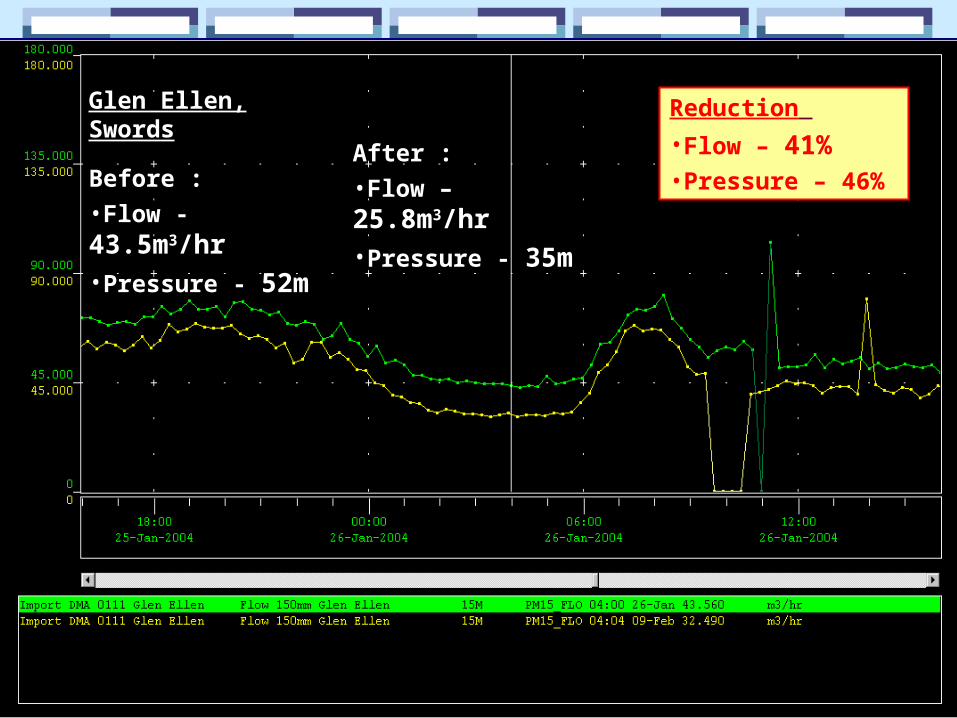
Pressure Management
Glen Ellen, Swords Before :
•Flow - 43.5m3/hr•Pressure - 52m
After :
•Flow – 25.8m3/hr•Pressure - 35m
Reduction
•Flow – 41%•Pressure – 46%

Pressure Management
Day/Night ControllersDay/Night Controller on trial in Donabate
DMA.Night-time pressures (0:00 to 06:00) reduced
from 28m to 20m.Reduced flows by 10m3/hr for this period.Total saving over 6 hrs =60m3 =approx. daily
water supply for 130 houses.

Fingal DMA’s
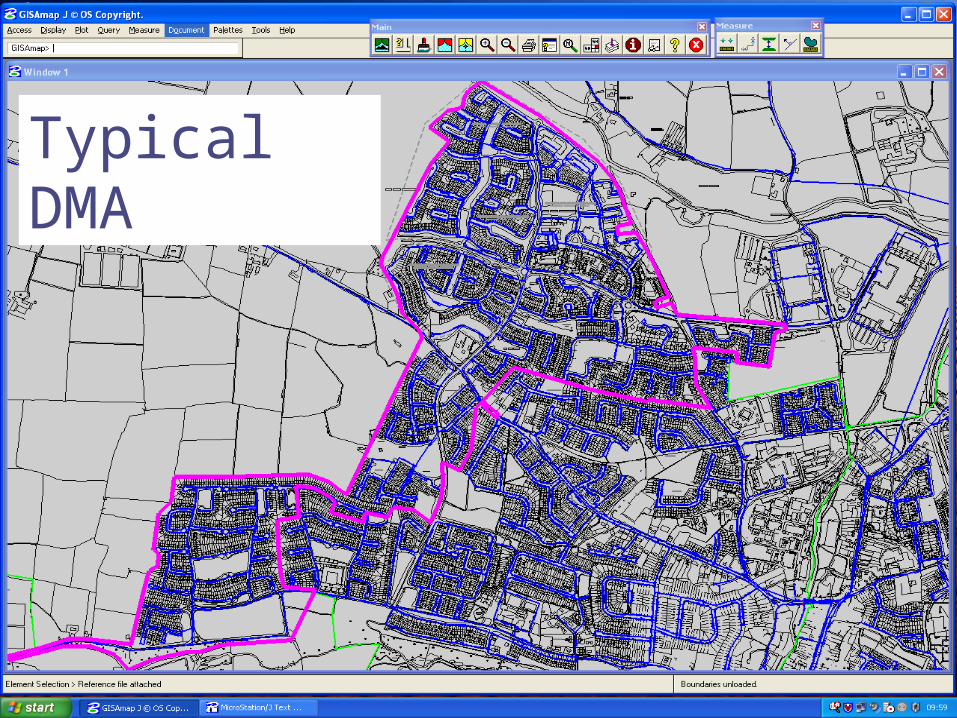
Typical DMA

Fingal’s Leakage Team
1 Leakage Engineer (Exec).1 Leakage Supervisory Inspector.4 Leakage Inspectors.1 General Operative.All DMA meters connected to Regional
Telemetry System.
Repairs by Maintenance Crews.

Example - SavingsExample: River Valley DMA
16 No. Leaks Detected between 19th Sept. – 3rd Oct 2006
16 No. Leaks repaired between 22nd Sept. – 17th Oct 2006
Compare flows into DMA before leaks detected (5th – 8th Sept.)
v’s after leaks repaired (12th – 15th Dec.)
Saving of approx. 25 m3/hr at 4am = 500 m3/day= daily usage for 1,100 houses.

Leaks Found Aug 07 – Jul 08Aug 07 26
Sept 07 13
Oct 07 23
Nov 07 17
Dec 07 12
Jan 08 32
Feb 08 108
Mar 08 40
Apr 08 57
May 08 36
Jun 08 27
Jul 08 12
Total = 403

Leaks Found by TypeLeak on Main 12 (3.0%)
Leak on Fitting (hydrant, stopcock,valve, etc.)
145 (36.0%)
Leak on Meter Box 23 (5.7%)
Leak on Communication Pipe
158 (39.2%)
Private side leaks 65 (16.1%)
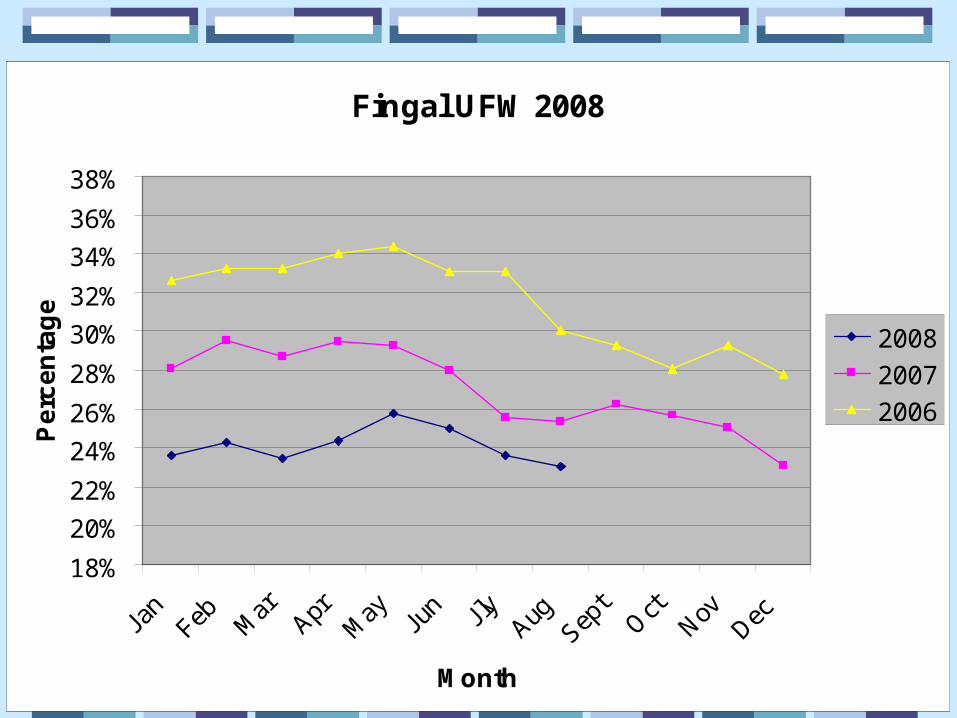
Fingal UFW 2008
18%
20%
22%
24%
26%
28%
30%
32%
34%
36%
38%
Jan
Feb Mar Apr
May Ju
n Jly AugSep
tOct
NovDec
Month
Pe
rce
nta
ge
2008
2007
2006

Summary
Active Leakage Control – the only way.Accurate data is the key – continue to refine.Leakage Teams need long-term support.Water Conservation is not a “Project” – it’s never ending.Resources need to be committed for the long term.

Water Services National Training Group
12th Annual Conference
11th September, 2008