Water Security 2020 - Nestlé
43
Nestlé - Water Security 2020 W0. Introduction W0.1 (W0.1) Give a general description of and introduction to your organization. Nestlé is the world’s largest food and beverage company. We have more than 2000 brands ranging from global icons to local favorites, and we are present in 187 countries around the world. Nestlé's purpose is "We unlock the power of food to enhance quality of life for everyone, today and for generations to come". We want to help shape a better and healthier world. This is how we contribute to society while ensuring the long-term success of our company. Our values are reflected in the way we do business, always acting with respect both for our own people and those we do business with. Creating Shared Value remains the fundamental guiding principle for how Nestlé does business. CSV is the strategy tool that Nestlé uses to operationalize and manage all the actions it takes to ensure it creates value for shareholders and for society. Our focus areas are firmly embedded in our purpose of enhancing quality of life and contributing to a healthier future. Individuals and families, our communities and the planet as a whole are interconnected, and our efforts in each of these areas are supported through 36 specific commitments towards 2020 . These commitments will, in turn, enable us to meet our ambitions for 2030 in line with the timescale of the Sustainable Development Goals (SDGs). Our 2030 Ambitions are to: Help 50 million children live healthier lives; Help to improve 30 million livelihoods in communities directly connected to our business activities; Strive for zero environmental impact in our operations. The Nestlé Corporate Business Principles rule the way we do business and form the basis of our culture and values. The business principles are to be found here : https://www.nestle.com/sites/default/files/asset-library/documents/library/documents/corporate_governance/corporate-business-principles-en.pdf W-FB0.1a (W-FB0.1a) Which activities in the food, beverage, and tobacco sector does your organization engage in? Processing/Manufacturing Distribution W0.2 (W0.2) State the start and end date of the year for which you are reporting data. Start date End date Reporting year January 1 2019 December 31 2019 W0.3 (W0.3) Select the countries/areas for which you will be supplying data. Algeria Angola Argentina Australia Bahrain Bangladesh Belgium Bolivia (Plurinational State of) Brazil Bulgaria Cameroon Canada Chile China Colombia Costa Rica Côte d'Ivoire Cuba Czechia Democratic People's Republic of Korea Denmark Dominican Republic Ecuador Egypt Ethiopia Finland France CDP Page of 43 1
Transcript of Water Security 2020 - Nestlé

Nestlé - Water Security 2020
W0. Introduction
W0.1
(W0.1) Give a general description of and introduction to your organization.
Nestlé is the world’s largest food and beverage company. We have more than 2000 brands ranging from global icons to local favorites, and we are present in 187 countriesaround the world. Nestlé's purpose is "We unlock the power of food to enhance quality of life for everyone, today and for generations to come". We want to helpshape a better and healthier world. This is how we contribute to society while ensuring the long-term success of our company. Our values are reflected in the way we dobusiness, always acting with respect both for our own people and those we do business with.
Creating Shared Value remains the fundamental guiding principle for how Nestlé does business. CSV is the strategy tool that Nestlé uses to operationalize and manageall the actions it takes to ensure it creates value for shareholders and for society.
Our focus areas are firmly embedded in our purpose of enhancing quality of life and contributing to a healthier future. Individuals and families, our communities and the planetas a whole are interconnected, and our efforts in each of these areas are supported through 36 specific commitments towards 2020 . These commitments will, in turn,enable us to meet our ambitions for 2030 in line with the timescale of the Sustainable Development Goals (SDGs). Our 2030 Ambitions are to: Help 50 million children livehealthier lives; Help to improve 30 million livelihoods in communities directly connected to our business activities; Strive for zero environmental impact in our operations.
The Nestlé Corporate Business Principles rule the way we do business and form the basis of our culture and values. The business principles are to be found here : https://www.nestle.com/sites/default/files/asset-library/documents/library/documents/corporate_governance/corporate-business-principles-en.pdf
W-FB0.1a
(W-FB0.1a) Which activities in the food, beverage, and tobacco sector does your organization engage in?Processing/ManufacturingDistribution
W0.2
(W0.2) State the start and end date of the year for which you are reporting data.
Start date End date
Reporting year January 1 2019 December 31 2019
W0.3
(W0.3) Select the countries/areas for which you will be supplying data.AlgeriaAngolaArgentinaAustraliaBahrainBangladeshBelgiumBolivia (Plurinational State of)BrazilBulgariaCameroonCanadaChileChinaColombiaCosta RicaCôte d'IvoireCubaCzechiaDemocratic People's Republic of KoreaDenmarkDominican RepublicEcuadorEgyptEthiopiaFinlandFrance
CDP Page of 431
GermanyGhanaGreeceGuatemalaHungaryIndiaIndonesiaIran (Islamic Republic of)IraqIrelandIsraelItalyJapanJordanKenyaLebanonMalaysiaMexicoMoroccoMyanmarNetherlandsNew ZealandNicaraguaNigerPakistanPanamaPapua New GuineaPeruPhilippinesPolandPortugalQatarRomaniaRussian FederationSaudi ArabiaSenegalSerbiaSingaporeSlovakiaSouth AfricaSpainSri LankaSwedenSwitzerlandSyrian Arab RepublicThailandTrinidad and TobagoTunisiaTurkeyUkraineUnited Arab EmiratesUnited Kingdom of Great Britain and Northern IrelandUnited States of AmericaUruguayUzbekistanViet NamZimbabwe
W0.4
(W0.4) Select the currency used for all financial information disclosed throughout your response.CHF
W0.5
(W0.5) Select the option that best describes the reporting boundary for companies, entities, or groups for which water impacts on your business are beingreported.Companies, entities or groups over which operational control is exercised
W0.6
(W0.6) Within this boundary, are there any geographies, facilities, water aspects, or other exclusions from your disclosure?Yes
CDP Page of 432
W0.6a
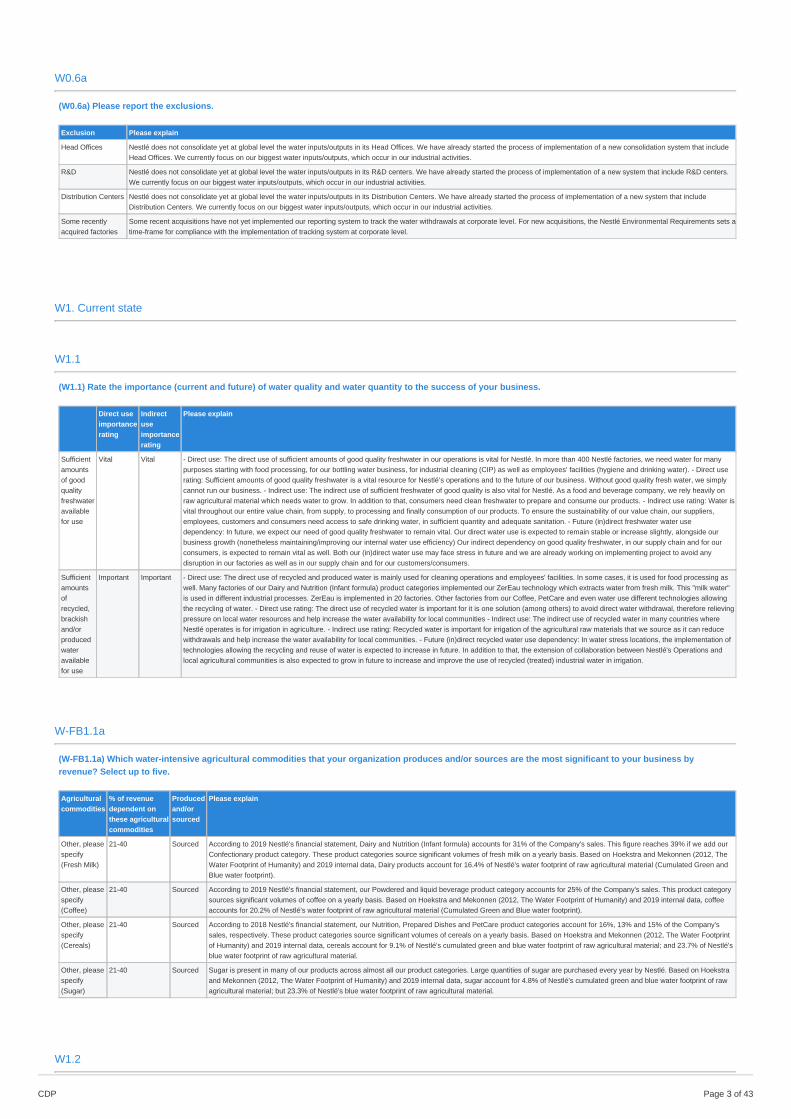
(W0.6a) Please report the exclusions.
Exclusion Please explain
Head Offices Nestlé does not consolidate yet at global level the water inputs/outputs in its Head Offices. We have already started the process of implementation of a new consolidation system that includeHead Offices. We currently focus on our biggest water inputs/outputs, which occur in our industrial activities.
R&D Nestlé does not consolidate yet at global level the water inputs/outputs in its R&D centers. We have already started the process of implementation of a new system that include R&D centers.We currently focus on our biggest water inputs/outputs, which occur in our industrial activities.
Distribution Centers Nestlé does not consolidate yet at global level the water inputs/outputs in its Distribution Centers. We have already started the process of implementation of a new system that includeDistribution Centers. We currently focus on our biggest water inputs/outputs, which occur in our industrial activities.
Some recentlyacquired factories
Some recent acquisitions have not yet implemented our reporting system to track the water withdrawals at corporate level. For new acquisitions, the Nestlé Environmental Requirements sets atime-frame for compliance with the implementation of tracking system at corporate level.
W1. Current state
W1.1
(W1.1) Rate the importance (current and future) of water quality and water quantity to the success of your business.
Direct useimportancerating
Indirectuseimportancerating
Please explain
Sufficientamountsof goodqualityfreshwateravailablefor use
Vital Vital - Direct use: The direct use of sufficient amounts of good quality freshwater in our operations is vital for Nestlé. In more than 400 Nestlé factories, we need water for manypurposes starting with food processing, for our bottling water business, for industrial cleaning (CIP) as well as employees' facilities (hygiene and drinking water). - Direct userating: Sufficient amounts of good quality freshwater is a vital resource for Nestlé’s operations and to the future of our business. Without good quality fresh water, we simplycannot run our business. - Indirect use: The indirect use of sufficient freshwater of good quality is also vital for Nestlé. As a food and beverage company, we rely heavily onraw agricultural material which needs water to grow. In addition to that, consumers need clean freshwater to prepare and consume our products. - Indirect use rating: Water isvital throughout our entire value chain, from supply, to processing and finally consumption of our products. To ensure the sustainability of our value chain, our suppliers,employees, customers and consumers need access to safe drinking water, in sufficient quantity and adequate sanitation. - Future (in)direct freshwater water usedependency: In future, we expect our need of good quality freshwater to remain vital. Our direct water use is expected to remain stable or increase slightly, alongside ourbusiness growth (nonetheless maintaining/improving our internal water use efficiency) Our indirect dependency on good quality freshwater, in our supply chain and for ourconsumers, is expected to remain vital as well. Both our (in)direct water use may face stress in future and we are already working on implementing project to avoid anydisruption in our factories as well as in our supply chain and for our customers/consumers.
Sufficientamountsofrecycled,brackishand/orproducedwateravailablefor use
Important Important - Direct use: The direct use of recycled and produced water is mainly used for cleaning operations and employees' facilities. In some cases, it is used for food processing aswell. Many factories of our Dairy and Nutrition (Infant formula) product categories implemented our ZerEau technology which extracts water from fresh milk. This "milk water"is used in different industrial processes. ZerEau is implemented in 20 factories. Other factories from our Coffee, PetCare and even water use different technologies allowingthe recycling of water. - Direct use rating: The direct use of recycled water is important for it is one solution (among others) to avoid direct water withdrawal, therefore relievingpressure on local water resources and help increase the water availability for local communities - Indirect use: The indirect use of recycled water in many countries whereNestlé operates is for irrigation in agriculture. - Indirect use rating: Recycled water is important for irrigation of the agricultural raw materials that we source as it can reducewithdrawals and help increase the water availability for local communities. - Future (in)direct recycled water use dependency: In water stress locations, the implementation oftechnologies allowing the recycling and reuse of water is expected to increase in future. In addition to that, the extension of collaboration between Nestlé's Operations andlocal agricultural communities is also expected to grow in future to increase and improve the use of recycled (treated) industrial water in irrigation.
W-FB1.1a
(W-FB1.1a) Which water-intensive agricultural commodities that your organization produces and/or sources are the most significant to your business byrevenue? Select up to five.
Agriculturalcommodities
% of revenuedependent onthese agriculturalcommodities
Producedand/orsourced
Please explain
Other, pleasespecify(Fresh Milk)
21-40 Sourced According to 2019 Nestlé's financial statement, Dairy and Nutrition (Infant formula) accounts for 31% of the Company's sales. This figure reaches 39% if we add ourConfectionary product category. These product categories source significant volumes of fresh milk on a yearly basis. Based on Hoekstra and Mekonnen (2012, TheWater Footprint of Humanity) and 2019 internal data, Dairy products account for 16.4% of Nestlé's water footprint of raw agricultural material (Cumulated Green andBlue water footprint).
Other, pleasespecify(Coffee)
21-40 Sourced According to 2019 Nestlé's financial statement, our Powdered and liquid beverage product category accounts for 25% of the Company's sales. This product categorysources significant volumes of coffee on a yearly basis. Based on Hoekstra and Mekonnen (2012, The Water Footprint of Humanity) and 2019 internal data, coffeeaccounts for 20.2% of Nestlé's water footprint of raw agricultural material (Cumulated Green and Blue water footprint).
Other, pleasespecify(Cereals)
21-40 Sourced According to 2018 Nestlé's financial statement, our Nutrition, Prepared Dishes and PetCare product categories account for 16%, 13% and 15% of the Company'ssales, respectively. These product categories source significant volumes of cereals on a yearly basis. Based on Hoekstra and Mekonnen (2012, The Water Footprintof Humanity) and 2019 internal data, cereals account for 9.1% of Nestlé's cumulated green and blue water footprint of raw agricultural material; and 23.7% of Nestlé'sblue water footprint of raw agricultural material.
Other, pleasespecify(Sugar)
21-40 Sourced Sugar is present in many of our products across almost all our product categories. Large quantities of sugar are purchased every year by Nestlé. Based on Hoekstraand Mekonnen (2012, The Water Footprint of Humanity) and 2019 internal data, sugar account for 4.8% of Nestlé's cumulated green and blue water footprint of rawagricultural material; but 23.3% of Nestlé's blue water footprint of raw agricultural material.
W1.2
CDP Page of 433

(W1.2) Across all your operations, what proportion of the following water aspects are regularly measured and monitored?
% ofsites/facilities/operations
Please explain
Water withdrawals –total volumes
100% This information is consistent across most indicators addressed in this current section. This parameter is monitored in 100% of our factories. It is part of ourstandard internal environmental monitoring and reporting routine. It is measured "in continuous" by flow-meters in each of our factories. It is consolidated on amonthly basis at factory level and reported in our internal environmental reporting system - SHE-PM. The data is then consolidated at the HQ level of thecompany, in Vevey Switzerland. The data is used to track and evaluate our internal water use efficiency as well as our overall environmental performance. It isreported to different stakeholders within the company (including top management) to continuously drive improvement and is also publicly reported in our AnnualCSV Report:https://www.nestle.com/csv/performance
Water withdrawals –volumes by source
100% This information is consistent across most indicators addressed in this current section. This parameter is monitored in 100% of our factories. It is part of ourstandard internal environmental monitoring and reporting routine. It is measured "in continuous" by flow-meters in each of our factories. It is consolidated on amonthly basis at factory level and reported in our internal environmental reporting system - SHE-PM. The data is then consolidated at the HQ level of thecompany, in Vevey Switzerland. The data is used to track and evaluate our internal water use efficiency as well as our overall environmental performance. It isreported to different stakeholders within the company (including top management) to continuously drive improvement and is also publicly reported in our AnnualCSV Report:https://www.nestle.com/csv/performance
Entrained waterassociated with yourmetals & miningsector activities -total volumes [onlymetals and miningsector]
<Not Applicable> <Not Applicable>
Produced waterassociated with youroil & gas sectoractivities - totalvolumes [only oil andgas sector]
<Not Applicable> <Not Applicable>
Water withdrawalsquality
100% This parameter is monitored in 100% of our factories. It is part of our standard internal environmental monitoring and reporting routine. Compliance with local andinternal water quality regulations is monitored "in continuous" by dedicated quality sensors and probes in each of our factories. Additional monitoring for specificlocal quality parameters are added, when necessary, based on regular sampling and analysis of local water quality. All this information is consolidated on amonthly basis at factory level and reported in our internal environmental reporting system - SHE-PM. The data is then consolidated at the HQ level of thecompany, in Vevey Switzerland. The data is used to track and evaluate our water quality and prevent quality-related issues (internal and external). It is reported todifferent stakeholders within the company (including top management). Key parameters are reported in our Annual CSVReport:https://www.nestle.com/csv/performance
Water discharges –total volumes
100% This information is consistent across most indicators addressed in this current section. This parameter is monitored in 100% of our factories. It is part of ourstandard internal environmental monitoring and reporting routine. It is measured "in continuous" by flow-meters in each of our factories. It is consolidated on amonthly basis at factory level and reported in our internal environmental reporting system - SHE-PM. The data is then consolidated at the HQ level of thecompany, in Vevey Switzerland. The data is used to track and evaluate our internal water use efficiency as well as potential impact on downstream users andecosystems. It is reported to different stakeholders within the company (including top management) to continuously drive improvement and is also publiclyreported in our Annual CSV Report:https://www.nestle.com/csv/performance
Water discharges –volumes bydestination
100% This information is consistent across most indicators addressed in this current section. This parameter is monitored in 100% of our factories. It is part of ourstandard internal environmental monitoring and reporting routine. It is measured "in continuous" by flow-meters in each of our factories. It is consolidated on amonthly basis at factory level and reported in our internal environmental reporting system - SHE-PM. The data is then consolidated at the HQ level of thecompany, in Vevey Switzerland. The data is used to track and evaluate our internal water use efficiency as well as potential impact on downstream users andecosystems. It is reported to different stakeholders within the company (including top management) to continuously drive improvement.
Water discharges –volumes bytreatment method
100% This information is consistent across most indicators addressed in this current section. This parameter is monitored in 100% of our factories. It is part of ourstandard internal environmental monitoring and reporting routine. It is measured "in continuous" by flow-meters in each of our factories. It is consolidated on amonthly basis at factory level and reported in our internal environmental reporting system - SHE-PM. The data is then consolidated at the HQ level of thecompany, in Vevey Switzerland. The data is used to track and evaluate our internal water use efficiency as well as potential impact on downstream users andecosystems. It is reported to different stakeholders within the company (including top management) to continuously drive improvement.
Water dischargequality – by standardeffluent parameters
100% This information is consistent across most indicators addressed in this current section. This parameter is monitored in 100% of our factories. It is part of ourstandard internal environmental monitoring and reporting routine. It is measured "in continuous" by flow-meters in each of our factories. It is consolidated on amonthly basis at factory level and reported in our internal environmental reporting system - SHE-PM. The data is then consolidated at the HQ level of thecompany, in Vevey Switzerland. The data is used to track and evaluate our internal water use efficiency as well as potential impact on downstream users andecosystems. It is reported to different stakeholders within the company (including top management) to continuously drive improvement.
Water dischargequality –temperature
100% This information is consistent across most indicators addressed in this current section. This parameter is monitored in 100% of our factories. It is part of ourstandard internal environmental monitoring and reporting routine. It is measured "in continuous" by flow-meters in each of our factories. It is consolidated on amonthly basis at factory level and reported in our internal environmental reporting system - SHE-PM. The data is then consolidated at the HQ level of thecompany, in Vevey Switzerland. The data is used to track and evaluate our internal water use efficiency as well as potential impact on downstream users andecosystems. It is reported to different stakeholders within the company (including top management) to continuously drive improvement.
Water consumption– total volume
100% This information is consistent across most indicators addressed in this current section. This parameter is monitored in 100% of our factories. It is part of ourstandard internal environmental monitoring and reporting routine. It is measured "in continuous" by flow-meters in each of our factories. It is consolidated on amonthly basis at factory level and reported in our internal environmental reporting system - SHE-PM. The data is then consolidated at the HQ level of thecompany, in Vevey Switzerland. The data is used to track and evaluate our internal water use efficiency as well as our overall environmental performance. It isreported to different stakeholders within the company (including top management) to continuously drive improvement and is also publicly reported in our AnnualCSV Report:https://www.nestle.com/csv/performance
Waterrecycled/reused
100% This information is consistent across most indicators addressed in this current section. This parameter is monitored in 100% of our factories. It is part of ourstandard internal environmental monitoring and reporting routine. It is measured "in continuous" by flow-meters in each of our factories. It is consolidated on amonthly basis at factory level and reported in our internal environmental reporting system - SHE-PM. The data is then consolidated at the HQ level of thecompany, in Vevey Switzerland. The data is used to track and evaluate our internal water use efficiency as well as our overall environmental performance. It isreported to different stakeholders within the company (including top management) to continuously drive improvement.
The provision of fully-functioning, safelymanaged WASHservices to allworkers
100% Nestlé is a signatory of the WBCSD WASH Pledge and is therefore committed to implementing it. We monitor the progress and implementation in all our factoriesthrough regular rounds of self-assessment by factories. The data is collected and consolidated by the HQ of the company, in Vevey Switzerland. The data is usedto track and evaluate our compliance with the WBCSD WASH Pledge. It is reported to different stakeholders within the company (including top management) tocontinuously drive improvement and publicly in our Annual Report.
W1.2b
CDP Page of 434

(W1.2b) What are the total volumes of water withdrawn, discharged, and consumed across all your operations, and how do these volumes compare to theprevious reporting year?
Volume(megaliters/year)
Comparisonwithpreviousreportingyear
Please explain
Totalwithdrawals
121000 Lower Over the years, we have consistently reduced our water withdrawals even though our production volumes increased. This is explained by our continuous efforts toimprove our internal water use efficiency. Water efficiency programs in our operations ensure the implementation of "water-saving" projects in our factories,eventually leading to lower our water needs, even when we increase our production volumes. We expect our business will continue to grow but we will continue toimprove the water efficiency of our factories whenever it is possible, both in terms of opportunities and technologies available. While we will continue to commit onbeing best in class in water use efficiency within our factory, we also start to focus and invest strongly in external water saving initiatives, at catchment level,preserving local resources, through water stewardship initiatives. In future, we expect total water withdrawals to remain within the same range while continuing toincrease our production of finished goods.
Totaldischarges
67000 Lower Over the years, we have consistently reduced our water discharges even though our production volumes increased. This is explained by our continuous efforts toimprove our internal water use efficiency. Water efficiency programs in our operations ensure the implementation of "water-saving" projects in our factories,eventually leading to lower our water needs, even when we increase our production volumes. We expect our business will continue to grow but we will continue toimprove the water efficiency of our factories whenever it is possible, both in terms of opportunities and technologies available. While we will continue to commit onbeing best in class in water use efficiency within our factory, we also start to focus and invest strongly in external water saving initiatives, at catchment level,preserving local resources, through water stewardship initiatives. In future, we expect total water withdrawals to remain within the same range while continuing toincrease our production of finished goods.
Totalconsumption
54000 About thesame
Over the years, we have consistently reduced our water consumption even though our production volumes increased. This is explained by our continuous efforts toimprove our internal water use efficiency. Water efficiency programs in our operations ensure the implementation of "water-saving" projects in our factories,eventually leading to lower our water needs, even when we increase our production volumes. We expect our business will continue to grow but we will continue toimprove the water efficiency of our factories whenever it is possible, both in terms of opportunities and technologies available. While we will continue to commit onbeing best in class in water use efficiency within our factory, we also start to focus and invest strongly in external water saving initiatives, at catchment level,preserving local resources, through water stewardship initiatives. In future, we expect total water withdrawals to remain within the same range while continuing toincrease our production of finished goods.
W1.2d
(W1.2d) Indicate whether water is withdrawn from areas with water stress and provide the proportion.
Withdrawalsare fromareas withwater stress
%withdrawnfromareas withwaterstress
Comparisonwithpreviousreportingyear
Identificationtool
Please explain
Row1
Yes 26-50 About thesame
WRIAqueduct
We use an internal method to assess water stress at the location of all our factories - the Combined Water Stress Index (CWSI). This method not onlyuses data from WRI-Aqueduct, but also includes data from WWF-WRF, Pfister-WSI and Earth Stat Water Depletion. Each one of our factories isscored using these four datasets. The average score of physical water risk gives the CWSI score. Using the CWSI assessment scores of 2019 showsthat 28.7% of our water withdrawals occur in water-stressed areas. These withdrawals occur in the 27.8% of our factories located in water-stressedlocations, as defined by the CWSI assessment. The proportions of both factories and water withdrawals in water-stressed regions are within the samerange as last year (2018). The reason being that there have not been significant changes in the total number and location of our ~400 factoriesworldwide.
W-FB1.2e
CDP Page of 435

(W-FB1.2e) For each commodity reported in question W-FB1.1a, do you know the proportion that is produced/sourced from areas with water stress?
Agriculturalcommodities
Theproportionof thiscommodityproducedin areaswith waterstress isknown
Theproportionof thiscommoditysourcedfrom areaswith waterstress isknown
Please explain
Othercommoditiesfrom W-FB1.1a,pleasespecify(Fresh Milk)
Notapplicable
Yes Nestlé does not produce any raw agricultural material itself - we only source agricultural raw materials through direct sourcing programs and/or third party suppliers. OurFresh Milk supply chain of direct sourcing is assessed/mapped (in terms of vulnerability to water-stress). Water-related risk in our supply chains are assessed throughannual assessment of water risk at the sourcing location of key agricultural commodities, using the CWSI method which combines results from four publicly available tools;namely WRI Aqueduct, WWF Water Risk Filter, Pfister Water Stress Index and the Water Depletion dataset by EarthStat, applied here to entire "sourcing areas". This isalso done for future trends using WRI Aqueduct 2040 global water risk. The mapping allows us to implement relevant actions to address water-related issues and preventfuture serious issues.
Othercommoditiesfrom W-FB1.1a,pleasespecify(Coffee)
Notapplicable
Yes Nestlé does not produce any raw agricultural material itself - we only source agricultural raw materials through direct sourcing programs and/or third party suppliers. OurCoffee supply chain of direct sourcing is assessed/mapped (in terms of vulnerability to water-stress). Water-related risk in our supply chains are assessed through annualassessment of water risk at the sourcing location of key agricultural commodities, using the CWSI method which combines results from four publicly available tools; namelyWRI Aqueduct, WWF Water Risk Filter, Pfister Water Stress Index and the Water Depletion dataset by EarthStat, applied here to entire "sourcing areas". This is also donefor future trends using WRI Aqueduct 2040 global water risk. The mapping allows us to implement relevant actions to address water-related issues and prevent futureserious issues.
Othercommoditiesfrom W-FB1.1a,pleasespecify(Cereals)
Notapplicable
No, notcurrentlybut weintend tocollect thisdata withinthe nexttwo years
Nestlé does not produce any raw agricultural material itself - we only source agricultural raw materials through direct sourcing programs and/or third party suppliers. We arein the process of assessing the exact geographical origin of cereals, as for most of our main agricultural raw materials through our commitment on Responsible Sourcingand traceability. Tracing back the origin of our raw agricultural material as close as possible to the location where it was produced allows us to map and define theirrespective water-related risks (and opportunities). Water-related risk in our supply chains are assessed through annual assessment of water risk at the sourcing location ofkey agricultural commodities, using the CWSI method which combines results from four publicly available tools; namely WRI Aqueduct, WWF Water Risk Filter, PfisterWater Stress Index and the Water Depletion dataset by EarthStat, applied here to entire "sourcing areas". This is also done for future trends using WRI Aqueduct 2040global water risk. This geo-information is used to assess the water-stress encountered at the location where key commodities are produced/sourced from and implementrelevant actions to address water-related issues and prevent future serious issues. We expect to have our main Cereals supply chains, fully assessed within the next 2years. (2020/2021).
Othercommoditiesfrom W-FB1.1a,pleasespecify(Sugar)
Notapplicable
No, notcurrentlybut weintend tocollect thisdata withinthe nexttwo years
Nestlé does not produce any raw agricultural material itself - we only source agricultural raw materials through direct sourcing programs and/or third party suppliers. We arein the process of assessing the exact geographical origin of Sugar, as for most of our main agricultural raw materials through our commitment on Responsible Sourcingand traceability. Tracing back the origin of our raw agricultural material as close as possible to the location where it was produced allows us to map and define theirrespective water-related risks (and opportunities). Water-related risk in our supply chains are assessed through annual assessment of water risk at the sourcing location ofkey agricultural commodities, using the CWSI method which combines results from four publicly available tools; namely WRI Aqueduct, WWF Water Risk Filter, PfisterWater Stress Index and the Water Depletion dataset by EarthStat, applied here to entire "sourcing areas". This is also done for future trends using WRI Aqueduct 2040global water risk. This geo-information is used to assess the water-stress encountered at the location where key commodities are produced/sourced from and implementrelevant actions to address water-related issues and prevent future serious issues. We expect to have our main Sugar supply chains, fully assessed within the next 2years. (2020/2021).
W-FB1.2g
(W-FB1.2g) What proportion of the sourced agricultural commodities reported in W-FB1.1a originate from areas with water stress?
Agriculturalcommodities
% of totalagriculturalcommoditysourced fromareas withwater stress
Please explain
Other sourcedcommoditiesfrom W-FB1.2e, pleasespecify (FreshMilk)
26-50 This figure is based on a preliminary internal assessment of mapping of sourcing origin and related water-stress assessment. According to current future climatic scenarios(IPCC), if no action is taken in the coming years, it is expected that the proportion of raw agricultural material sourcing in water-stressed regions will increase in future, in manyparts of the world where we source milk. We track the proportion of Milk sourced from water-stressed locations in order to implement everything that is necessary to prevent supplychain slow-down or disruption. To avoid critical water-related issues and ensure access to water in all in these regions, we follow the principles Water Stewardship. This is actuallyalready the case in some critical regions (Pakistan, India, Mexico, South Africa..).
Other sourcedcommoditiesfrom W-FB1.2e, pleasespecify(Coffee)
26-50 This figure is based on a preliminary internal assessment of mapping of sourcing origin and related water-stress assessment. According to current future climatic scenarios(IPCC), if no action is taken in the coming years, it is expected that the proportion of raw agricultural material sourcing in water-stressed regions will increase in future, in manyparts of the world where we source coffee. We track the proportion of Coffee sourced from water-stressed locations in order to implement everything that is necessary to preventsupply chain slow-down or disruption. To avoid critical water-related issues and ensure access to water in all in these regions, we follow the principles Water Stewardship. This isactually already the case in some critical regions (Vietnam and Brazil).
Other sourcedcommoditiesfrom W-FB1.2e, pleasespecify(Cereals)
26-50 This figure is a reasonable estimate based on publicly available WRI data. We will be able to provide more accurate data within the next two years to better assess risk and targetrelevant actions. We are currently in the process of mapping the sourcing origin and related water-stress assessment for cereals. This exercise considers current and future trendsas we expect this % to increase in future, according to global climatic scenarios (IPCC), if nothing is done. Accordingly, Nestlé will implement everything necessary to preventcritical water-related issues and ensure access to water to all in these regions, through Water Stewardship Initiatives.
Other sourcedcommoditiesfrom W-FB1.2e, pleasespecify (Sugar)
26-50 This figure is a reasonable estimate based on publicly available WRI data. We will be able to provide more accurate data within the next two years (2020/2021) to better assessrisk and target relevant actions. We are currently in the process of mapping of sourcing origin and related water-stress assessment for sugar. This exercise considers current andfuture trends as we expect this % to increase in future, according to global climatic scenarios (IPCC), if nothing is done. Accordingly, Nestlé will implement everything necessary toprevent critical water-related issues and ensure access to water to all in these regions, through Water Stewardship Initiatives.
W1.2h
CDP Page of 436

(W1.2h) Provide total water withdrawal data by source.
Relevance Volume(megaliters/year)
Comparisonwithpreviousreportingyear
Please explain
Fresh surface water,including rainwater,water from wetlands,rivers, and lakes
Relevant 9000 Lower As a food and Beverage company, we need good quality water in our daily operations and freshwater is our third source of water (in volume).Even though our business is growing, we are committed to continuously improve the water use efficiency of our operations. This has led to adecrease in the volumes of surface freshwater we withdraw annually.
Brackish surfacewater/Seawater
Notrelevant
<Not Applicable> <NotApplicable>
Brackish/Sea Water is not a source of water we use. Unlike other industries, as a Food and Beverage company, this type of water source is notrelevant, from a qualitative point of view, nor financially viable as it requires specific technology.
Groundwater –renewable
Relevant 71000 About thesame
As a food and Beverage company, we need good quality water in our daily operations and groundwater is our first source of water (in volume),especially for our bottled water business (spring and mineral water). Even though our business is growing, we are committed to improve thewater use efficiency of our operations. This has led to a stabilization of the volumes of groundwater we withdraw annually.
Groundwater – non-renewable
Notrelevant
<Not Applicable> <NotApplicable>
At Nestlé, we strive to ensure that the groundwater we use is managed sustainably, in line with our commitment on Water Stewardship and ourinternal Nestlé Environmental Requirements (NER).
Produced/Entrainedwater
Relevant 1200 About thesame
As a food and Beverage company, we need good quality water in our daily operations and produced water is an alternative source of waterthat helps preserve local natural water resources. Using our ZerEau technology, in 2019, we were able to "recover" more than a million cubicmeter of water from fresh milk. This volume is similar to that of last year but nevertheless continuously increasing year after year as we continueto implement this technology in as many of our factories as possible, since the first implementation of ZerEau technology in 2011.
Third party sources Relevant 41000 Lower As a food and Beverage company, we need good quality water, in sufficient quantity, in our daily operations, and third party is our secondsource of water (in volume). Even though our business is growing, we are committed to improve the water use efficiency of our operations. Thishas led to a decrease in the volumes of third-party water we use annually.
W1.2i
(W1.2i) Provide total water discharge data by destination.
Relevance Volume(megaliters/year)
Comparisonwithpreviousreportingyear
Please explain
Fresh surfacewater
Relevant 32000 Much lower Even though our business is growing, continuous efforts in water efficiency within our operations, the promotion of water recycling and improvementsin effluents treatment has led to a decrease in the volumes of water we discharge annually in surface freshwater bodies. Many of our factories areoperating their own effluent treatment plant to ensure that the water we discharge to the environment not only complies with local regulations but alsocomplies with our internal standard on water quality returned to the environment. This is relevant to us, as all volumes treated on our sites are returnedto surface freshwater bodies. Depending on future business needs and growth, we expect these volumes to remain stable, as we continue to promoterecycling and efficiency technologies within our factories.
Brackishsurfacewater/seawater
Notrelevant
<Not Applicable> <NotApplicable>
We do not discharge effluents into brackish surface water nor sea water. This is not relevant to us as all volumes treated on our sites are returned tosurface freshwater bodies.
Groundwater Notrelevant
<Not Applicable> <NotApplicable>
We do not discharge water into groundwater bodies. Of all water volumes that we treat in our internally operated effluent treatment plant, none isreturned to groundwater aquifers. These volumes are discharged to surface freshwater bodies.
Third-partydestinations
Relevant 35000 About thesame
Even though our business is growing, continuous efforts in water efficiency within our operations and the promotion of water recycling has led to astabilization in the volumes of water we discharge annually to third parties for effluents treatment. For factories not operating internal effluent treatmentplants, we rely on third-party operated plants to treat our effluents. Even though we do not operate these, we ensure they comply with localregulations. This is relevant for us as >50% of our effluents are treated that way. Depending on future business needs and growth, we expect thesevolumes to remain stable, as we continue to promote recycling and efficiency technologies within our factories.
W-FB1.3
(W-FB1.3) Do you collect/calculate water intensity for each commodity reported in question W-FB1.1a?
Agriculturalcommodities
Water intensityinformation for thisproduced commodityiscollected/calculated
Water intensityinformation for thissourced commodityiscollected/calculated
Please explain
Othercommoditiesfrom W-FB1.1a,please specify(Fresh Milk)
Not applicable Yes This information is consistent across all our commodities. Nestlé does not produce any raw agricultural material itself - we only source rawagricultural commodities. We assess the water footprint of Fresh Milk we purchase annually, using the method and data from The WaterFootprint Network (Hoekstra and Mekonnen, 2012, The Water Footprint of Humanity) and (https://waterfootprint.org/en/). In addition, whereavailable, we use specific, local figures, calculated by our agricultural services.
Othercommoditiesfrom W-FB1.1a,please specify(Coffee)
Not applicable Yes This information is consistent across all our commodities. Nestlé does not produce any raw agricultural material itself - we only source rawagricultural commodities. We assess the water footprint of Coffee we purchase annually, using the method and data from The Water FootprintNetwork (Hoekstra and Mekonnen, 2012, The Water Footprint of Humanity) and (https://waterfootprint.org/en/). In addition, where available, weuse specific, local figures, calculated by our agricultural services.
Othercommoditiesfrom W-FB1.1a,please specify(Cereals)
Not applicable Yes This information is consistent across all our commodities. Nestlé does not produce any raw agricultural material itself - we only source rawagricultural commodities. We assess the water footprint of Cereals we purchase annually, using the method and data from The Water FootprintNetwork (Hoekstra and Mekonnen, 2012, The Water Footprint of Humanity) and (https://waterfootprint.org/en/). In addition, where available, weuse specific, local figures, calculated by our agricultural services.
Othercommoditiesfrom W-FB1.1a,please specify(Sugar)
Not applicable Yes This information is consistent across all our commodities. Nestlé does not produce any raw agricultural material itself - we only source rawagricultural commodities. We assess the water footprint of Sugar we purchase annually, using the method and data from The Water FootprintNetwork (Hoekstra and Mekonnen, 2012, The Water Footprint of Humanity) and (https://waterfootprint.org/en/). In addition, where available, weuse specific, local figures, calculated by our agricultural services.
CDP Page of 437

W-FB1.3b
(W-FB1.3b) Provide water intensity information for each of the agricultural commodities identified in W-FB1.3 that you source.
Agricultural commoditiesOther sourced commodities from W-FB1.3, please specify (Fresh Milk)
Water intensity value (m3)6100000000
Numerator: Water aspectOther, please specify (Total Green and Blue Water (Mekonnen and Hoekstra, 2012))
DenominatorTons
Comparison with previous reporting yearAbout the same
Please explainThe water intensity value is calculated using internal annual purchased volumes and water footprint data from Mekonnen & Hoekstra. We do not expect it to grow biggerthan our business growth (only few % change from one year to another). This data is used to prioritize commodities with the biggest impact in order to define and implementactions accordingly. This is how we selected Fresh Milk as one of the biggest "virtual" water footprint volumes within the range of our agricultural supply chain commodities.Focusing on regions and commodities where the impact, but also opportunities, are the biggest, we promote and implement targeted actions aiming at better watermanagement practices. In addition to that, we have teams of agronomist in our R&D centers working on selecting varieties/species of lower water intensity nature and/orbetter adapted to water-scarce locations. We promote the adoption of such varieties/species by local farmers through our network of agronomist worldwide.
Agricultural commoditiesOther sourced commodities from W-FB1.3, please specify (Coffee)
Water intensity value (m3)14000000000
Numerator: Water aspectOther, please specify (Total Green and Blue Water (Mekonnen and Hoekstra, 2012))
DenominatorTons
Comparison with previous reporting yearAbout the same
Please explainThe water intensity value is calculated using internal annual purchased volumes and water footprint data from Mekonnen & Hoekstra. We do not expect it to grow biggerthan our business growth (only few % change from one year to another). This data is used to prioritize commodities with the biggest impact in order to define and implementactions accordingly. This is how we selected Coffee as one of the biggest "virtual" water footprint volumes within the range of our agricultural supply chain commodities.Focusing on regions and commodities where the impact, but also opportunities, are the biggest, we promote and implement targeted actions aiming at better watermanagement practices. In addition to that, we have teams of agronomist in our R&D centers working on selecting varieties/species of lower water intensity nature and/orbetter adapted to water-scarce locations. We promote the adoption of such varieties/species by local farmers through our network of agronomist worldwide.
Agricultural commoditiesOther sourced commodities from W-FB1.3, please specify (Cereals)
Water intensity value (m3)6800000000
Numerator: Water aspectOther, please specify (Total Green and Blue Water (Mekonnen and Hoekstra, 2012))
DenominatorTons
Comparison with previous reporting yearAbout the same
Please explainThe water intensity value is calculated using internal annual purchased volumes and water footprint data from Mekonnen & Hoekstra. We do not expect it to grow biggerthan our business growth (only few % change from one year to another). This data is used to prioritize commodities with the biggest impact in order to define and implementactions accordingly. This is how we selected Cereals as one of the biggest "virtual" water footprint volumes within the range of our agricultural supply chain commodities.Focusing on regions and commodities where the impact, but also opportunities, are the biggest, we promote and implement targeted actions aiming at better watermanagement practices. In addition to that, we have teams of agronomist in our R&D centers working on selecting varieties/species of lower water intensity nature and/orbetter adapted to water-scarce locations. We promote the adoption of such varieties/species by local farmers through our network of agronomist worldwide.
Agricultural commoditiesOther sourced commodities from W-FB1.3, please specify (Sugar)
Water intensity value (m3)3500000000
Numerator: Water aspectOther, please specify (Total Green and Blue Water (Mekonnen and Hoekstra, 2012))
DenominatorTons
CDP Page of 438

Comparison with previous reporting yearAbout the same
Please explainThe water intensity value is calculated using internal annual purchased volumes and water footprint data from Mekonnen & Hoekstra. We do not expect it to grow biggerthan our business growth (only few % change from one year to another). This data is used to prioritize commodities with the biggest impact in order to define and implementactions accordingly. This is how we selected Sugar as one of the biggest "virtual" water footprint volumes within the range of our agricultural supply chain commodities.Focusing on regions and commodities where the impact, but also opportunities, are the biggest, we promote and implement targeted actions aiming at better watermanagement practices. In addition to that, we have teams of agronomist in our R&D centers working on selecting varieties/species of lower water intensity nature and/orbetter adapted to water-scarce locations. We promote the adoption of such varieties/species by local farmers through our network of agronomist worldwide.
W1.4
(W1.4) Do you engage with your value chain on water-related issues?Yes, our suppliers
W1.4a
(W1.4a) What proportion of suppliers do you request to report on their water use, risks and/or management information and what proportion of your procurementspend does this represent?
Row 1
% of suppliers by number76-100
% of total procurement spend76-100
Rationale for this coverageNestle works with almost 165'000 direct suppliers and 695'000 individual farmers worldwide. We’re committed to fostering responsible practices in our supply chain, whileensuring that our sourcing and supplier relationships deliver a competitive advantage and meet our social, environmental and ethical requirements. Our "Nestlé ResponsibleSourcing Standard" describes the requirements and ways of working that we apply together with our suppliers to ensure the sustainable long-term supply of materials andservices to Nestlé. The "Nestlé Responsible Sourcing Standard" is a non-negotiable, integral part of all our purchase orders and supply contracts. It sets out basic, non-negotiable standards as well as important and urgent sustainability practices - including "Water Resource Management Practices" - that we ask our suppliers, theiremployees, agents and subcontractors to respect and to adhere to at all times when conducting business.
Impact of the engagement and measures of successNestlé committed to have more than 80% of the total spend and volume sourced from audited and compliant tier 1 suppliers by 2020. Results end-2019 were 76%. Throughour Sustainable Sourcing Tier 1 program, we verify compliance with our "Nestlé Responsible Sourcing Standard" by our direct suppliers through independent, third-partyaudits, following the SMETA Best Practice Guidance. Nestlé also committed to have 80% of the spend and volume of our priority categories to be traceable and 70% to beresponsibly sourced, by 2020. Results end-2019 were 70%. We have identified 15 key commodities that present higher risk of environmental and/or social issues. We workclosely with our direct suppliers and partners to conduct mappings of our upstream supply chains and carry out farm assessments, together with partner organizations. Inmany cases, issues identified require long-term, tailored interventions to tackle their root causes for greater impact.
CommentIf non-compliance, issues or gaps with the "Nestlé Responsible Sourcing Standard" are found, a time-bound action plan is developed and implemented by the supplier. Theimplementation of this plan will be later verified by the auditor. In case a supplier refuses to undergo an audit or to close gaps, we may terminate the business relationship.
W1.4b
CDP Page of 439

(W1.4b) Provide details of any other water-related supplier engagement activity.
Type of engagementIncentivizing for improved water management and stewardship
Details of engagementWater management and stewardship is integrated into supplier evaluation processesWater management and stewardship is featured in supplier awards schemeOffer financial incentives to suppliers reducing your operational water impacts through the products they supply to youOffer financial incentives to suppliers improving water management and stewardship across their own operations and supply chain
In selected Markets, premiums on the supplied raw material is given to farmers who implemented sustainable practices.
% of suppliers by number1-25
% of total procurement spend1-25
Rationale for the coverage of your engagementOur greatest challenge to reducing water consumption lies in addressing the impacts of our complex agricultural supply chains. Water management and conservation isvery local-specific and oftentimes varies in time as well. Our research indicates that we can already achieve significant improvements in water use by introducing betteragricultural techniques at a farm level. Our approach to ensure sustainable water use in our agricultural supply chain is based on the principle of ‘Do what matters, where itmatters’. We are currently involved in 10 major projects in agricultural supply chains located in water-stressed areas.
Impact of the engagement and measures of successIn Pakistan, Morocco and Iran, where drought and water-stressed areas are issues, we are working with dairy farmers to implement the use of water meters and developwater saving techniques for animal feed production. In Brazil, we are supporting farmers to install water meters and improve manure management techniques. Togetherwith Embrapa, the Brazilian Agricultural Research Corporation, we are working on projects to train farmers in good farming and manure management practices. In 2019, weconcluded a major project in Vietnam, in partnership with the Swiss Development and Cooperation. Through the training of close to 50'000 farmers on best irrigationprojects, this project resulted in 50 million m3 of water saved annually and generated more than 8 mio USD added value in the local economy of smallholder coffeegrowers. We just launched a similar project in Brazil.
CommentIn addition to best water management practices in agriculture, we respect the human right to water and we support access to water in communities surrounding ouroperations and in our upstream supply chains. In 2018, we continued to roll out our Nestlé Guidelines on Respecting the Human Rights to Water and Sanitation, to ensureour operations and upstream supply chain do not have a negative impact on the human right to water.
W2. Business impacts
W2.1
(W2.1) Has your organization experienced any detrimental water-related impacts?Yes
W2.1a
(W2.1a) Describe the water-related detrimental impacts experienced by your organization, your response, and the total financial impact.
Country/Area & River basin
Ireland Not known
Type of impact driver & Primary impact driver
Physical Severe weather events
Primary impactImpact on company assets
Description of impactIn September of 2019, a severe rainfall event damaged assets in one of our factory in Ireland. The financial impact equals to the insurance claim.
Primary responseOther, please specify (Infrastructure maintenance)
Total financial impact200000
Description of responseThe response consisted in a timely fixing and re-building of the damaged assets.
W2.2
CDP Page of 4310

(W2.2) In the reporting year, was your organization subject to any fines, enforcement orders, and/or other penalties for water-related regulatory violations?No
W3. Procedures
W-FB3.1
(W-FB3.1) How does your organization identify and classify potential water pollutants associated with its food, beverage, and tobacco sector activities that couldhave a detrimental impact on water ecosystems or human health?
Our internal (mandatory) Nestlé Environmental Requirements (NER) defines mandatory safety measures and thresholds limits to prevent any detrimental impact toecosystems or human health due to our activities. For instance, increased turbidity, eutrophication, pH/redox variations, contamination by hydrocarbon or any hazardousmaterial and over-exploitation (limiting water volume with consequences on dissolved elements concentration) can all have detrimental consequences on natural waterecosystems, fauna and flora as well as human beings.
That is why our standard aims at preventing such issues, covering construction norms within our factories (prevent contaminant spills), operations of water wells within ourfactories and threshold value limits of various physico-chemical parameters in our effluent water.
Example of sources of contamination requiring specific buildings/operations include:
· oils, grease and lubricants from scrap,
· impounded rainwater within chemical storage spill containment (bunding), and similar,
· bio solids from waste activated sludge
· compressor and compressed air blowdown
Oil containment measures include permeable surfaces, oil water separators, absorbents, infiltration ditches, soakways etc.
The sustainability of an internally operated water well, withdrawing water from a local resource, must be demonstrated through a local hydrogeological study. This preventover-exploitation of water resources and potential detrimental damages to local water-dependent ecosystems. This must be renewed every five years.
Any water discharged into rivers and waterways must be treated effectively to ensure the water returned to the environment is of a high quality. We apply the most efficienttechnologies and internal standards to treat the water we use, prior to reuse or release into the environment.
The following physico-chemical parameters are continuously monitored in our effluents (reported monthly), with defined thresholds: pH, BOD, COD, Total Suspended Solids,Total Nitrogen, Total Phosphorus, Oil and Grease, Color.
The type risks as well as adapted response varies across our operations (worldwide) but our NER standard covers all necessary topics to ensure no "special case" is missed.To ensure that, we have rolled out a digital NER compliance assessment and monitoring tool to ensure all our plants comply with our standard. We have also improvedtraining on water effluents through our Environmental Sustainability workshops.
W-FB3.1a
CDP Page of 4311

(W-FB3.1a) Describe how your organization minimizes the adverse impacts of potential water pollutants on water ecosystems or human health associated withyour food, beverage, and tobacco sector activities.
Potential water pollutantOther, please specify (Chemical Oxygen Demand (COD))
Activity/value chain stageManufacturing – direct operations
Description of water pollutant and potential impactsEffluent water generated from our operating sites and factories is managed in on-site treatment plants or diverted to a local municipal facility. In 2019, we continued toinvest in maintenance and improved treatment facilities. Through such actions, the average water quality we discharged in 2019 was 55 mg COD (Chemical OxygenDemand) per liter. We have also reduced the amount of water discharged per ton of product by 42.6% since 2009 (ten years). Many governments impose strict regulationsregarding the maximum chemical oxygen demand allowed in waste water before waste water or industrial water can be returned to the environment.
Management proceduresWaste water managementFollow regulation standardsAdapt food containers and packaging
Please explainBy quantifying the amount of oxidizable pollutants found in (waste)water, COD is useful when it comes to water quality as it provides a global metric to determine the effectan effluent will have on the receiving water body. By monitoring (and reporting) closely on this indicator, we ensure the water we discharge to the environment will not beharmful to water ecosystem and/or downstream users. Our internal limit, mandatory in all our Operations, is 125 ppm. We measure success of compliance with thisthreshold value by consolidating 12 month rolling average values for each of our factories discharging water in water bodies. This is the minimum internal requirement.When local regulations are stricter than our internal regulations, we must comply with local (stricter) regulations To ensure our COD level remain within limits, weimplement various techniques ranging from flocculation, ozone oxidation or specific chemical reactants. We monitor the COD level "in-line" and know instantaneously whatthe levels are and perform necessary adjustments if needed. In addition to ensuring high quality standard of the water we discharge from our factories, Nestlé committed tohave 100% of our packaging recyclable or reusable by 2025. Our vision is that none of our packaging, including plastics, ends up in landfill, in oceans, lakes and rivers. Weare determined to reduce our use of single-use plastics, by introducing reusable packaging, new delivery systems and innovative business models everywhere we operateand sell our products. Building on our commitment, we will reduce the use of virgin plastics by one third by 2025. To drive innovation and understanding of a circulareconomy for plastics, Nestlé became a partner of the New Plastics Economy. This initiative, led by the Ellen MacArthur Foundation, was designed to bring together keystakeholders to rethink and redesign the future of plastic.
W3.3
(W3.3) Does your organization undertake a water-related risk assessment?Yes, water-related risks are assessed
W3.3a
(W3.3a) Select the options that best describe your procedures for identifying and assessing water-related risks.
CDP Page of 4312

Direct operations
CoverageFull
Risk assessment procedureWater risks are assessed as part of an enterprise risk management framework
Frequency of assessmentAnnually
How far into the future are risks considered?More than 6 years
Type of tools and methods usedTools on the marketEnterprise Risk ManagementInternational methodologiesDatabases
Tools and methods usedWater Footprint Network Assessment toolWRI AqueductWWF Water Risk FilterEnvironmental Impact AssessmentLife Cycle AssessmentIPCC Climate Change ProjectionsAlliance for Water Stewardship StandardFAO/AQUASTAT
CommentWe assess annually the water risks at all locations where our factories are located. We use an internal methodology - the Combined Water Stress Index (CWSI). Itcombines results from four publicly available tools; namely WRI Aqueduct, WWF Water Risk Filter, Pfister Water Stress Index and the Water Depletion dataset by EarthStat.Combining the scores of all four tool, we obtain a singular water-stress assessment score for each of our manufacturing sites. Cross-referencing these scores with annualwater consumptions of our factories, we defined a list of "Where It Matters (WIM) sites, where priority actions must be implemented. On top of that, we also use the WRIAqueduct water risk projections for 2040 (using IPCC scenarios), in order to evaluate potential future risk to our operations within the next 20 years. We are also involved inthe certification by the Alliance for Water Stewardship (AWS) of several of our factories (all factories for our bottled water category, by 2025). We conduct regular, on-site,audit/assessment of the local water resources and water use inside and outside our factories, including stakeholder engagement activities. Furthermore, the Nestlé GroupEnterprise Risk Management Framework (ERM) identifies water risks and opportunities in order to minimize/seize their potential impact. This annual top-down assessmentat Group level allows to understand the company’s mega-risks in business, social, physical, regulatory, reputational and environment.
Supply chain
CoveragePartial
Risk assessment procedureWater risks are assessed as part of an enterprise risk management framework
Frequency of assessmentAnnually
How far into the future are risks considered?More than 6 years
Type of tools and methods usedTools on the marketEnterprise Risk ManagementInternational methodologiesDatabases
Tools and methods usedWater Footprint Network Assessment toolWRI AqueductWWF Water Risk FilterLife Cycle AssessmentIPCC Climate Change ProjectionsAlliance for Water Stewardship StandardFAO/AQUASTATOther, please specify (Internal Responsible Sourcing Standard)
CommentAll Nestlé suppliers must comply with our internal Responsible Sourcing Standard. This standard is mandatory for all Nestlé suppliers, and requires them to comply with aset of legal and environmental requirements (including for water) and to demonstrate continuous improvement. Nestlé committed to have more than 80% of the total spendand volume sourced from audited and compliant tier 1 suppliers by 2020. Results end-2019 were 76%. Nestlé also committed to have 80% of the spend and volume of ourpriority categories to be traceable and 70% to be responsibly sourced, by 2020. Results end-2019 were 70%. On top of this mandatory compliance with our ResponsibleSourcing Standard, we conduct annual assessment of water risk at the sourcing location of key agricultural commodities (Coffee, Dairy, Sugar, Cereals, Meat, ...), using theCWSI method which combines results from four publicly available tools; namely WRI Aqueduct, WWF Water Risk Filter, Pfister Water Stress Index and the Water Depletiondataset by EarthStat, applied here to entire "sourcing areas". This is also done for future trends using WRI aqueduct 2040 global water risk. Finally, we also use the WaterFootprint Network methodology to assess the water footprint of key agricultural commodities. Benchmarking the results of the water footprint assessment and the water riskbrings accurate identification of risk and prioritization of actions in our supply chains.
CDP Page of 4313

Other stages of the value chain
CoverageNone
Risk assessment procedure<Not Applicable>
Frequency of assessment<Not Applicable>
How far into the future are risks considered?<Not Applicable>
Type of tools and methods used<Not Applicable>
Tools and methods used<Not Applicable>
Comment
W3.3b
(W3.3b) Which of the following contextual issues are considered in your organization’s water-related risk assessments?
Relevance&inclusion
Please explain
Wateravailability at abasin/catchmentlevel
Relevant,alwaysincluded
The long-term supply of water in sufficient quantity is vital for all manufacturing processes within our factories. Insufficient water availability would negatively impact our activitiesthrough potential production slow-down or even total production disruption. That is because water is an essential ingredient in all our manufactured products and also essential for theoperation of our factories in industrial processes, for cleaning purposes and employees' facilities. It is also essential for our suppliers, neighbors and customers - any stakeholdersomehow linked to our factories and activities. We assess the water availability and water risk, at local catchment level, using our internal Combined Water Stressed Index method,which combines water risk scores from 4 publicly available datasets, namely WRI Aqueduct, WWF Water Risk Filter, Water Stress Index by Pfister and Earth Stat Water Depletion.Furthermore, we conduct regular, on-site, audit/assessment of the local water resources and water use inside and outside our factories, including stakeholder engagement activities.Water Resources Reviews, our internal water assessment program, aim at raising awareness at local operational level, identifying key issues and risks, and devising action plans toensure sustainable water use. The Water Resources Review program of internal audits focuses on water quantity/quality, regulatory compliance, site protection, and relationships withstakeholders.
Water quality atabasin/catchmentlevel
Relevant,alwaysincluded
The long-term supply of good quality water is vital for all manufacturing processes within our factories. Poor-quality water would negatively impact our activities through potentialtreatment cost increase, production slow-down or even total production disruption. That is because water is an essential ingredient in all our manufactured products and also essentialfor the operation of our factories in industrial processes, for cleaning purposes and employees' facilities. It is also essential for our suppliers, neighbours and customers - anystakeholder somehow linked to our factories and activities. We assess the water quality and related risks, at local catchment level, through continuous quality measurement and/orregular sampling and detailed analysis of local water resources and input at our factory gates.. Furthermore, we conduct regular, on-site, audit/assessment of the local waterresources and water use inside and outside our factories, including stakeholder engagement activities. Water Resources Reviews, our internal water assessment program, aim atraising awareness at local operational level, identifying key issues and risks, and devising action plans to ensure sustainable water use. The Water Resources Review program ofinternal audits focuses on water quantity/quality, regulatory compliance, site protection, and relationships with stakeholders.
Stakeholderconflictsconcerningwater resourcesat abasin/catchmentlevel
Relevant,alwaysincluded
Long-term good relationships with local stakeholders are essential for our factories and the continuity of our industrial activities. We consider our "social license to operate" to be animportant and critical element of our activities. To ensure good and productive relationships with all stakeholder linked to our activities where we operate, we engage with them on aregular basis. We use different processes, methods and tools to engage with stakeholders. The main tool we use is called Community Relation Process "CRP", and was developedspecifically for Nestlé, in different versions, depending on the specific activities our objectives of the stakeholder engagement activities. All CRP tools provide a complete assessmentand mapping of key stakeholder and the elaboration of specific engagement plans. All bottled water facilities are already using an advanced CRP tool, whereas non-bottled waterfactories just started using a lighter version of the CRP tool, nevertheless aiming at the same objective of ensuring smooth and trusting relationships with our stakeholders.
Implications ofwater on yourkeycommodities/rawmaterials
Relevant,alwaysincluded
Water is essential to grow the raw material we purchase annually. Insufficient water quantity or poor quality water may cause supply chain slow-down or even disruption for some of themain commodities that are essential to our business (Coffee, Dairy, Sugar, Cereals and Meat). Water-related risk in our supply chains are assessed through annual assessment ofwater risk at the sourcing location of key agricultural commodities, using our internal Combined Water Stress Index method which combines results from four publicly available tools;namely WRI Aqueduct, WWF Water Risk Filter, Pfister Water Stress Index and the Water Depletion dataset by EarthStat, applied here to entire "sourcing areas". This is also done forfuture trends using WRI Aqueduct 2040 global water risk. We also use the Water Footrpint Network methodology to assess the water footprint of key agricultural commodities.Benchmarking the results of the water footprint assessment and the water risk brings accurate identification of risk and prioritization of actions in our supply chains. We work directlywith around 550'000 farmers, through our Farmer Connect network. In 2019, we trained 400'000 farmers and have implemented water projects in a wide variety of locations, across allcontinents. In 2019, we had 10 projects ongoing in water-stressed supply chains. All Nestlé suppliers must comply with our internal Responsible Sourcing Standard. This standard ismandatory for all Nestlé suppliers, and requires them to comply with a set of legal and environmental requirements (including for water) and to demonstrate continuous improvement.Nestlé committed to have more than 80% of the total spend and volume sourced from audited and compliant tier 1 suppliers by 2020. Results end-2019 were 76%. Nestlé alsocommitted to have 80% of the spend and volume of our priority categories to be traceable and 70% to be responsibly sourced, by 2020. Results end-2019 were 70%.
Water-relatedregulatoryframeworks
Relevant,alwaysincluded
Our business is based on compliance. Compliance with all regulatory framework ensure our license to operate. Without full compliance, our business may face production slow-downor even production stoppage. Therefore, it is critical for our business that we ensure full compliance with all regulatory framework. The Nestlé Regulatory Affairs team works with anetwork of regulatory contacts in all countries where we operate. They track regulatory changes and estimate future potential regulatory changes on local level. Any changes/potentialimpacts are shared with Regulatory Affairs at Zone or Central level. A regulatory database is managed where all relevant regulatory documents are gathered. It is updated as the localsituation changes. This is included in all facilities with potential risk. We track/monitor water-related regulatory compliance at local level through our Nestlé Water Resources Reviewprograms. Non-compliance with local water regulations would result in water supply disruption to our factories and therefore production disruption. Therefore, to ensure long-term andsustainable water supply to our factories, it is critical to comply with all regulations. The Water Resources Review program of internal audits focuses on water quantity/quality;regulatory compliance; site protection; relationships with stakeholders.
Status ofecosystems andhabitats
Relevant,alwaysincluded
We have developed our understanding of the relationship between factories and biodiversity, and identified factories where we have a dependency/potential impact on importantwater areas. To know which factories were in high biodiversity/protected areas, we partnered with the UNEP World Conservation Monitoring Centre. Important Water Areas (IWA)located 25km upstream or downstream from Nestlé’s manufacturing facilities are assessed. By looking at upstream and downstream biodiversity and water risk, we identified 13factories where we will focus our future actions. We monitor the water withdrawals and discharges for all our factories including the 13 factories identified as located in important waterareas.
Access to fully-functioning,safely managedWASH servicesfor all employees
Relevant,alwaysincluded
Safe drinking water and sanitation is a basic human right. Businesses have a clear role to play in helping to ensure that more people have access to safe water. Providing safe water,sanitation and hygiene (WASH) contributes to broad societal goals such as reducing mortality and morbidity, strengthening community resilience and preserving personal dignity. Wesupport the World Business Council for Sustainable Development’s (WBCSD) pledge to ensure safe access to water, sanitation and hygiene (WASH) in the workplace. Internally, weare committed to achieving and maintaining WASH for all our employees. In 2018, over 90% of employees have confirmed access to WASH in our factories and we estimate reachingnow almost 100%. We are committed to achieving and maintaining WASH for all our employees and remain in the process of continuing self-assessments across our facilities,identifying and correcting gaps through action plans.
Other contextualissues, pleasespecify
Relevant,alwaysincluded
At Nestlé Waters, we have introduced the Alliance for Water Stewardship (AWS) standard as the guiding framework to ensure sustainable water management in our direct operations.The AWS standard requires gathering information related to local catchment management plans and to engage with relevant local water authorities to support existing governancemechanisms. By end 2019, 27 Nestlé factories were certified by AWS.
CDP Page of 4314

W3.3c
(W3.3c) Which of the following stakeholders are considered in your organization’s water-related risk assessments?
Relevance&inclusion
Please explain
Customers Relevant,alwaysincluded
We assess the environmental performance of our products from farm to consumer and beyond, including the water footprint. The water used by consumers to prepare or consume ourproducts is factored in when assessing the hotspots of our products. Using product packaging and digital communication, we are reaching out to consumers, providing them withmeaningful and accurate environmental information about how simple changes in behaviour can reduce water use when preparing our products. For example, while consumingNescafé, we provide consumers with top tips for: * Use only the right quantity of water to prepare the coffee; * Completely fill the dishwasher before using it; * Use refill packs tominimize the need for glass jars. The method used to assess this issue includes Life Cycle assessment and Nestlé LCA communication tool.
Employees Relevant,alwaysincluded
We strive to continually improve our water performance through training of employees and raising awareness. Enhancing our employees' knowledge on how water is a critical factorfor human prosperity and how water availability can affect our value chain. An internal training on environmental sustainability (including water) is available to all Nestlé employeesthrough our intranet. Water Sustainability is part of all environmental training sessions within the company as well as welcome sessions to new employees.
Investors Relevant,alwaysincluded
As a publicly listed company, investors are important stakeholders to Nestlé. We believe it is important they are well-informed on all aspects of our business, including ourenvironmental practices. That is why we report water risks and responses in our Nestlé integrated annual pack that is sent to shareholders. We also have meeting/conference callswith investors that might have some specific questions on water issues. The method used to assess this issue includes the Nestlé integrated annual pack.
Localcommunities
Relevant,alwaysincluded
We want to create shared value for our business and for society. The wellbeing of rural communities, farmers, small entrepreneurs, suppliers is intrinsic to our success. Our activitiessupport rural development, and at the same time strengthen our supply chain. We seek to raise awareness of water access and conservation in communities. By the end of 2019,close to 900'000 beneficiaries in rural communities were provided access to safe water and sanitation through our partnership with IFRC. With Farmer Connect, through capacitybuilding programs, we can engage with more than 550'000 farmers to develop a supply chain that meets our social, environmental and ethical requirements. Our CommunityRelations Process tools (CRP's) is another framework used to engage with communities around factories and encourage factories to engage in regular dialogue with communities toidentify potential impacts, but also the positive role that factories can play for the development of communities. The CRP tools have been rolled out in all Nestlé Waters Factoriesworldwide and will be rolled out for non-Nestlé Waters factories in 2020.
NGOs Relevant,alwaysincluded
NGO's are key stakeholders to interact with and ensure our practices and messages are well understood. NOG's are key in guiding us and helping us promote our values andachievements. At the global level, Nestlé organizes stakeholder events to receive feedback on Nestlé’s engagement in society. Water is typically the topic of one of the breakoutsessions of the Stakeholder Convening. In addition to the global convening, several Nestlé markets organize local events that come with a similar format. We conduct yearly materialityanalysis based on level of stakeholder concern and level of potential impact on Nestlé along with the stakeholder convenings. We develop sustainable, technologically adapted,community water management schemes, jointly with expert partners from NGOs. We deliver water, sanitation and hygiene projects in schools and villages near our operations aroundthe world. We provide access to water and sanitation for close to 900’000 people. The method used to engage with NGOs includes Nestlé stakeholder convenings. In addition, wehave added a water expert to our CSV Council. This Council meets annually with our CEO and Executive Board members to discuss sustainability issues including those related towater. More information can be found https://www.nestle.com/csv/what-is-csv/governance .
Other waterusers at abasin/catchmentlevel
Relevant,alwaysincluded
The Water Resource Reviews help our people to gain a greater understanding/sense of ownership about water challenges in their locality. They also enabled us to identify high priorityareas within operations where water stewardship initiatives are needed, to reduce water related risks and strengthen stakeholder perception of our local contribution. Our WaterResource Reviews assess potential impacts on the right to water and sanitation of local communities and propose corrective action. We use the Alliance for Water Stewardshipstandard as a guiding framework for sustainable water resources management. As part of that framework, good water governance and stakeholder engagement are critical elementsfor the success of any local initiative. As an example, in 2014, Nestlé became a founding member of the California Water Action Collaborative (CWAC), a spin-off local platform fromthe CEO Water Mandate, which consists of companies and environmental organisations. The coalition was set up as platform for food and beverage companies and non-profits, toidentify areas of shared interest. The result has been collective action projects that aim to advance a sustainable water future in California for people, business, agriculture and nature.With our engagement and commitment to certify many of our factories by AWS (including all Waters category factories certified by 2025), we are engaging with other water users inmany catchments where we operate.
Regulators Relevant,alwaysincluded
As a major player in the food and beverage business, we believe it is important we work closely with regulators towards a more sustainable future. We continue to maintain a strongpresence at multi-stakeholder initiatives on water policy and challenges, seeking new shared solutions and promoting collective action on water efficiency. Many of our seniormanagers, including our Chairman, play a leading role in the 2030 Water Resources Group. It is a public-private-civil society collaboration that aims to address supply and demandissues in water-stressed locations by 2030 and it helps to strengthen expert capabilities across the world and raises the priority of water on national political agendas. The methodsused to engage with regulators includes the Nestlé Regulatory Affairs network.
River basinmanagementauthorities
Relevant,alwaysincluded
Engaging with River Basin authorities is essential in any water stewardship project. Since we intent to implement water stewardship in several places where we operate (including AWScertification), engaging with local water authorities is extremely important. For example, the “Manos al Agua” initiative was a 5 year program (2013-2018) which aims to address climaterelated risks, as well as the impacts and dependencies on water of coffee production. The initiative has raised EUR 20.5 million from a large range of stakeholders, including the publicsector (Colombian and Dutch governments) and the private sector (Nestlé, Nespresso, The Colombian Coffee Growers Federation (FNC)) with the aim of creating a framework for anintegrated approach to managing Natural Capital. A group of 85 experts – from Cenicafé, the Wageningen University and Research Centre, as well the extensionist service of theFNC – are operating the program. The program directly benefits 11,000 Colombian coffee-growing families in 25 watersheds and around 500,000 people (water users). Also, at theKabini River Basin, India, we are launching a local policy dialogue, with the Government of Karnataka and experts such as the Alliance for Water Stewardship, Water ResourcesGroup, and local NGOs to find ways of up-scaling initiatives to catchment scale. As part of our Intelligent water management project in Colombia, we are partnering with the DutchMinistry of Foreign Affairs, the Colombian Federation of Coffee Growers, the Wageningen University and the Ministry of Rural Development to implement water stewardship actions,with an overall budget of EUR 20.5 million (CHF 24.6) over five years (2014–2018).
Statutoryspecial interestgroups at alocal level
Relevant,alwaysincluded
Within our Water Stewardship, we regularly engage with local groups sharing interest in shared water challenges. In the context of AWS certification, part of the process is to engagewith all local stakeholder, and this often involves local (citizen) groups with an interest in taking part in the protection of local water resources. The engagement is usually done throughmeeting (group or individual) where all can share and exchange views and concerns on local water resources. This is especially the case in bottle water activities where suchcommunity gathering is common.
Suppliers Relevant,alwaysincluded
Engaging with our suppliers is mandatory through our Responsible Sourcing Standard. On top of that, initiatives such as Farmer Connect (550'000 farmers), the Cocoa Plan and theNescafé plan are ways of engaging with our suppliers of agricultural commodities. Our partnership with IFRC in western Africa, promoting access to water, is also covering part of ourCocoa supply chain. When it comes to engaging with suppliers in our agricultural supply chain, we engage mainly through awareness raising training sessions on best practices inagriculture and/or improving livelihood of rural communities. In both, water is part of the engagement: 1) In promoting best water use in agriculture, supporting and implementingtechniques that will favour better water use and/or protection from pollution.; 2) Facilitating access to water and/or improve water quality for farmers, communities and/or livestock.
Water utilities ata local level
Relevant,alwaysincluded
Both within the context of our daily operations and our long-term water stewardship initiatives, we regularly engage with local water utilities. For our operations, we engage with waterutilities and their experts in the technical management, through our Water Resources Review internal audits/assessments, in order to evaluate their knowledge on the state of waterresources, availability versus demand. In general, our local management in the factories do have regular exchange with them for administration procedures but we know cases wherewe work with them to support their work, for example in South Africa where we are supporting local municipalities with external staff and extraordinary maintenance of theirinfrastructures and also planning to invest in their utilities infrastructures instead of investing within our own wastewater treatment plant. For our Water Stewardship activities (andcertification by AWS), water utilities and authorities are key stakeholders to engage with.
Otherstakeholder,please specify
Relevant,alwaysincluded
Depending on a case, we engage with any relevant stakeholders related to water i.e. scientists, water experts: e.g World Resource Institute. The methods used to assess this issueinclude Nestlé engagement programs.
W3.3d
CDP Page of 4315

(W3.3d) Describe your organization’s process for identifying, assessing, and responding to water-related risks within your direct operations and other stages ofyour value chain.
We assess water stress at all (100%) of the locations where we operate, using the Nestlé Combined Water Stress Index (CWSI). The index takes an average of results fromfour leading water-stress indicators (WRI Aqueduct, WWF Water Risk Filter, Earth Stat Water Depletion method and ETH Pfister et al, 2009). This gives us a risk score,helping to determine the risk associated with reduced water quantity or quality. These methods were selected as they are internationally recognized methodologies to use inour risk assessment.
Since 2017, we started to work on the notion of "Context-Based Approach" (CBA). The CBA aims at driving our operations towards a new “modus operandi”, focusing onwater-related actions “Where it Matters” (WIM). A joint selection process (Markets and Corporate) will result in a list of WIM sites where particular focus and investmentshould be put in concerning water. WIM factories will have priority access to CAPEX for implementing water-saving initiatives.
Additionally, we are working to provide threshold benchmarks of water use efficiency (m3/t) for key categories (Coffee, Dairy, Nutrition, Bottled Water and Pet Care) to all oursites (regardless of their water scarcity level or withdrawal volumes). This offers a chance to spotlight factories in need for improvements and set priorities beyond the WIMlist.
Other methods (LCA, FAO/AQUASTAT and internal knowledge) are used to assess risks and identify opportunities along in our value chain, including agriculture andconsumption. In particular, we use WFN and FAO/AQUASTAT to estimate average water use for crops and LCA to estimate the environmental performance of our productsalong the value chain, including their water use.
The operational scope of the risk assessment covers the entire value chain of our product including agriculture, manufacturing and consumption.
The outcome of these risk assessments is used in the following way:
- Priority access to CAPEX for factories identified as WIM;
- Selection of sites for Alliance for Water Stewardship certification -> de facto generating Water Stewardship actions at catchment level.
- Selection for implementing water-related projects in our agricultural supply chains.
- Selection of location for the implementation of WASH initiatives in the communities neighboring our factories.
W4. Risks and opportunities
W4.1
(W4.1) Have you identified any inherent water-related risks with the potential to have a substantive financial or strategic impact on your business?Yes, both in direct operations and the rest of our value chain
W4.1a
CDP Page of 4316
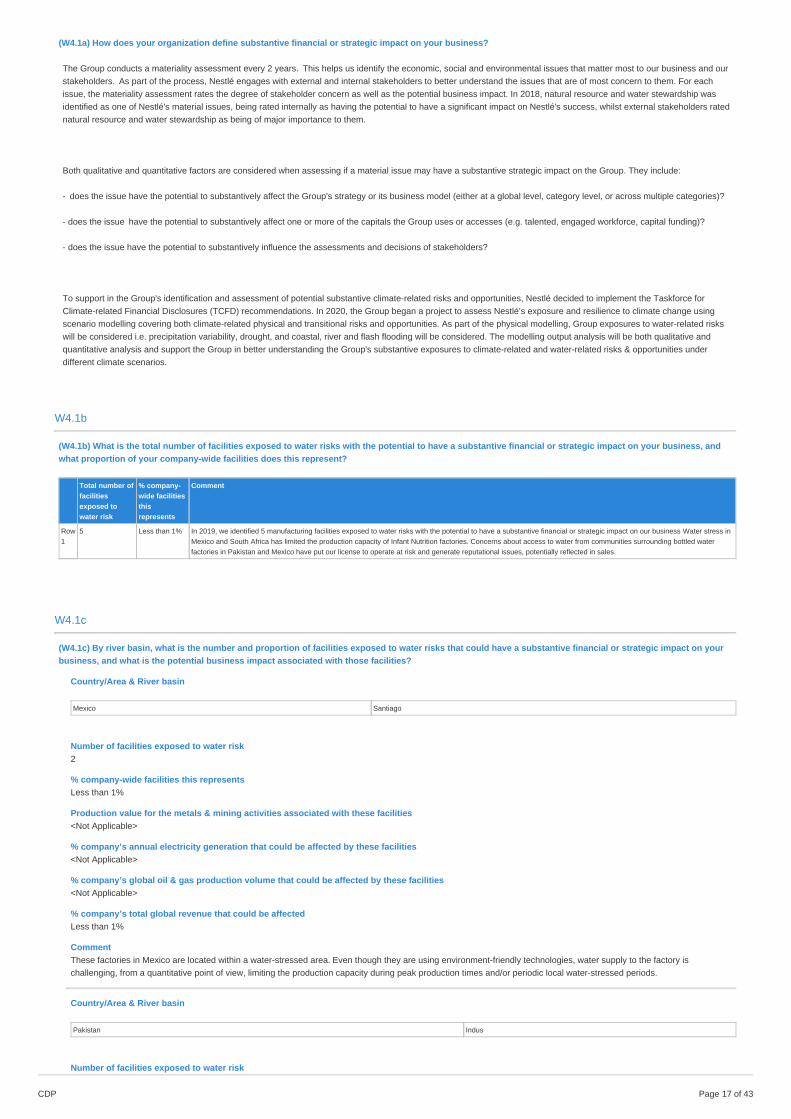
(W4.1a) How does your organization define substantive financial or strategic impact on your business?
The Group conducts a materiality assessment every 2 years. This helps us identify the economic, social and environmental issues that matter most to our business and ourstakeholders. As part of the process, Nestlé engages with external and internal stakeholders to better understand the issues that are of most concern to them. For eachissue, the materiality assessment rates the degree of stakeholder concern as well as the potential business impact. In 2018, natural resource and water stewardship wasidentified as one of Nestlé's material issues, being rated internally as having the potential to have a significant impact on Nestlé's success, whilst external stakeholders ratednatural resource and water stewardship as being of major importance to them.
Both qualitative and quantitative factors are considered when assessing if a material issue may have a substantive strategic impact on the Group. They include:
- does the issue have the potential to substantively affect the Group's strategy or its business model (either at a global level, category level, or across multiple categories)?
- does the issue have the potential to substantively affect one or more of the capitals the Group uses or accesses (e.g. talented, engaged workforce, capital funding)?
- does the issue have the potential to substantively influence the assessments and decisions of stakeholders?
To support in the Group's identification and assessment of potential substantive climate-related risks and opportunities, Nestlé decided to implement the Taskforce forClimate-related Financial Disclosures (TCFD) recommendations. In 2020, the Group began a project to assess Nestlé’s exposure and resilience to climate change usingscenario modelling covering both climate-related physical and transitional risks and opportunities. As part of the physical modelling, Group exposures to water-related riskswill be considered i.e. precipitation variability, drought, and coastal, river and flash flooding will be considered. The modelling output analysis will be both qualitative andquantitative analysis and support the Group in better understanding the Group's substantive exposures to climate-related and water-related risks & opportunities underdifferent climate scenarios.
W4.1b
(W4.1b) What is the total number of facilities exposed to water risks with the potential to have a substantive financial or strategic impact on your business, andwhat proportion of your company-wide facilities does this represent?
Total number offacilitiesexposed towater risk
% company-wide facilitiesthisrepresents
Comment
Row1
5 Less than 1% In 2019, we identified 5 manufacturing facilities exposed to water risks with the potential to have a substantive financial or strategic impact on our business Water stress inMexico and South Africa has limited the production capacity of Infant Nutrition factories. Concerns about access to water from communities surrounding bottled waterfactories in Pakistan and Mexico have put our license to operate at risk and generate reputational issues, potentially reflected in sales.
W4.1c
(W4.1c) By river basin, what is the number and proportion of facilities exposed to water risks that could have a substantive financial or strategic impact on yourbusiness, and what is the potential business impact associated with those facilities?
Country/Area & River basin
Mexico Santiago
Number of facilities exposed to water risk2
% company-wide facilities this representsLess than 1%
Production value for the metals & mining activities associated with these facilities<Not Applicable>
% company’s annual electricity generation that could be affected by these facilities<Not Applicable>
% company’s global oil & gas production volume that could be affected by these facilities<Not Applicable>
% company’s total global revenue that could be affectedLess than 1%
CommentThese factories in Mexico are located within a water-stressed area. Even though they are using environment-friendly technologies, water supply to the factory ischallenging, from a quantitative point of view, limiting the production capacity during peak production times and/or periodic local water-stressed periods.
Country/Area & River basin
Pakistan Indus
Number of facilities exposed to water risk
CDP Page of 4317
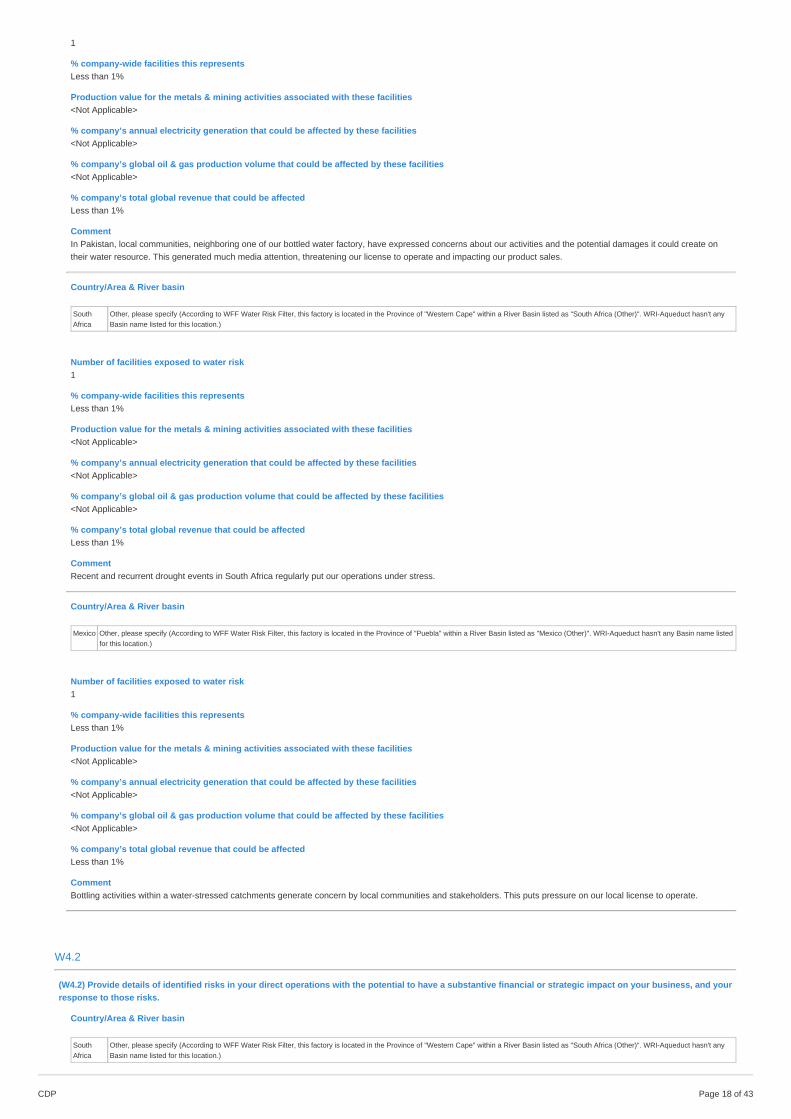
1
% company-wide facilities this representsLess than 1%
Production value for the metals & mining activities associated with these facilities<Not Applicable>
% company’s annual electricity generation that could be affected by these facilities<Not Applicable>
% company’s global oil & gas production volume that could be affected by these facilities<Not Applicable>
% company’s total global revenue that could be affectedLess than 1%
CommentIn Pakistan, local communities, neighboring one of our bottled water factory, have expressed concerns about our activities and the potential damages it could create ontheir water resource. This generated much media attention, threatening our license to operate and impacting our product sales.
Country/Area & River basin
SouthAfrica
Other, please specify (According to WFF Water Risk Filter, this factory is located in the Province of "Western Cape" within a River Basin listed as "South Africa (Other)". WRI-Aqueduct hasn't anyBasin name listed for this location.)
Number of facilities exposed to water risk1
% company-wide facilities this representsLess than 1%
Production value for the metals & mining activities associated with these facilities<Not Applicable>
% company’s annual electricity generation that could be affected by these facilities<Not Applicable>
% company’s global oil & gas production volume that could be affected by these facilities<Not Applicable>
% company’s total global revenue that could be affectedLess than 1%
CommentRecent and recurrent drought events in South Africa regularly put our operations under stress.
Country/Area & River basin
Mexico Other, please specify (According to WFF Water Risk Filter, this factory is located in the Province of "Puebla" within a River Basin listed as "Mexico (Other)". WRI-Aqueduct hasn't any Basin name listedfor this location.)
Number of facilities exposed to water risk1
% company-wide facilities this representsLess than 1%
Production value for the metals & mining activities associated with these facilities<Not Applicable>
% company’s annual electricity generation that could be affected by these facilities<Not Applicable>
% company’s global oil & gas production volume that could be affected by these facilities<Not Applicable>
% company’s total global revenue that could be affectedLess than 1%
CommentBottling activities within a water-stressed catchments generate concern by local communities and stakeholders. This puts pressure on our local license to operate.
W4.2
(W4.2) Provide details of identified risks in your direct operations with the potential to have a substantive financial or strategic impact on your business, and yourresponse to those risks.
Country/Area & River basin
SouthAfrica
Other, please specify (According to WFF Water Risk Filter, this factory is located in the Province of "Western Cape" within a River Basin listed as "South Africa (Other)". WRI-Aqueduct hasn't anyBasin name listed for this location.)
CDP Page of 4318

Type of risk & Primary risk driver
Physical Drought
Primary potential impactIncreased operating costs
Company-specific descriptionOur operations in South Africa have to cope with the regional climatic variation and evolution, increasingly leading to reduced annual rainfalls and increasing local waterdemand. This increasingly water-stressed situations can potentially lead to local regulations restricting water use and/or increase in cost of water (CHF/m3). Given therecent drought periods encountered in South Africa, our Mossel Bay factory decided to drastically reduce its water consumption in order to prevent future supply disruptionand associated impact on business, potentially limiting the production capacity of the factory.
Timeframe1-3 years
Magnitude of potential impactMedium
LikelihoodLikely
Are you able to provide a potential financial impact figure?Yes, a single figure estimate
Potential financial impact figure (currency)54000000
Potential financial impact figure - minimum (currency)<Not Applicable>
Potential financial impact figure - maximum (currency)<Not Applicable>
Explanation of financial impactThe estimated financial impact disclosed here expresses the annual loss in revenue in case of business interruption. This corresponds to Net Net Sales (NNS) excludingthe variable costs (=Marginal Contribution) on a 12 months period in case of total Loss.
Primary response to riskAdopt water efficiency, water reuse, recycling and conservation practices
Description of responseWe have implemented our zero water technology at our Mossel Bay dairy factory, through which we significantly reduced our use of municipal/local direct water use forproduction processes. A ZerEau dairy factory uses water extracted from fresh milk (usually made up to ~ 88% of water). This "Milk Water" is used for industrial and cleaningprocesses thus avoiding withdrawing local water.
Cost of response7000000
Explanation of cost of responseThe implementation of ZerEau Technology at Mossel Bay required an estimated 7 mio CHF CAPEX investment, with additional OPEX of 420'000 CHF/year.
Country/Area & River basin
Mexico Santiago
Type of risk & Primary risk driver
Physical Drought
Primary potential impactIncreased operating costs
Company-specific descriptionThis Mexican factory is located in an area with increasing water-stress. Through the successful implementation of ZerEau Water Technology, it was able to achieveabsolute zero water withdrawal from local resources, using only the water supplied through milk water extraction. This took the pressure off of stressed local waterresources; which, while no longer used by the factory, continue to be used by the local population, agriculture and other industries.
Timeframe1-3 years
Magnitude of potential impactHigh
LikelihoodLikely
Are you able to provide a potential financial impact figure?Yes, a single figure estimate
Potential financial impact figure (currency)148000000
Potential financial impact figure - minimum (currency)<Not Applicable>
CDP Page of 4319

Potential financial impact figure - maximum (currency)<Not Applicable>
Explanation of financial impactThe estimated financial impact disclosed here expresses the annual loss in revenue in case of business interruption. This corresponds to Net Net Sales (NNS) excludingthe variable costs (=Marginal Contribution) on a 12 months period in case of total Loss.
Primary response to riskAdopt water efficiency, water reuse, recycling and conservation practices
Description of responseA ZerEau dairy factory uses water extracted from fresh milk (usually made up to ~ 88% of water). This "Milk Water" is used for industrial and cleaning processes thusavoiding withdrawing local water. A ZerEau project has 3 distinct phases and all three were installed in this Mexican factory, thus avoiding completely the use of local waterresources.
Cost of response10000000
Explanation of cost of response10 mio CHF is the CAPEX amount that was required to implement ZerEau Water Technology in this factory.
Country/Area & River basin
Mexico Santiago
Type of risk & Primary risk driver
Physical Drought
Primary potential impactConstraint to growth
Company-specific descriptionIncreasing water-stress limits the local water availability, limiting the water supply to the factory, limiting the production capacity of the factory.
Timeframe1-3 years
Magnitude of potential impactHigh
LikelihoodVery likely
Are you able to provide a potential financial impact figure?Yes, a single figure estimate
Potential financial impact figure (currency)70000000
Potential financial impact figure - minimum (currency)<Not Applicable>
Potential financial impact figure - maximum (currency)<Not Applicable>
Explanation of financial impactThe estimated financial impact disclosed here expresses the annual loss in revenue in case of business interruption. This corresponds to Net Net Sales (NNS) excludingthe variable costs (=Marginal Contribution) on a 12 months period in case of total Loss.
Primary response to riskAdopt water efficiency, water reuse, recycling and conservation practices
Description of responseA ZerEau dairy factory uses water extracted from fresh milk (usually made up to ~ 88% of water). This "Milk Water" is used for industrial and cleaning processes thusavoiding withdrawing local water. Through the successful implementation of Zereau Water Technology, this factory will significantly limit its water withdrawal from localresources.
Cost of response5000000
Explanation of cost of response5 mio CHF is the estimated CAPEX amount invested to implement ZerEau Water Technology in this factory.
Country/Area & River basin
Pakistan Indus
Type of risk & Primary risk driver
Reputation & markets Inadequate access to water, sanitation, and hygiene services
Primary potential impact
CDP Page of 4320

Brand damage
Company-specific descriptionOur bottling facility of Sheikhupura was facing reputational issues related to access to safe water and sanitation by local communities.
TimeframeMore than 6 years
Magnitude of potential impactMedium-high
LikelihoodVery likely
Are you able to provide a potential financial impact figure?Yes, a single figure estimate
Potential financial impact figure (currency)12500000
Potential financial impact figure - minimum (currency)<Not Applicable>
Potential financial impact figure - maximum (currency)<Not Applicable>
Explanation of financial impactEstimation of financial loss due to business disruption and lost profits.
Primary response to riskEngage with local communities
Description of responseOver time, the factory installed 3 water filtration units located outside the factory and in the proximity of public places. Beneficiaries are estimated to be >60'000.
Cost of response120000
Explanation of cost of responseThis is an annual cost for CAPEX and OPEX.
Country/Area & River basin
Mexico Other, please specify (According to WFF Water Risk Filter, this factory is located in the Province of "Puebla" within a River Basin listed as "Mexico (Other)". WRI-Aqueduct hasn't any Basin name listedfor this location.)
Type of risk & Primary risk driver
Reputation & markets Community opposition
Primary potential impactBrand damage
Company-specific descriptionBottling activity raised concerns among local stakeholders regarding its impact on water availability in the Puebla river basin, putting at stake our local reputation andlicense to operate.
Timeframe1-3 years
Magnitude of potential impactMedium-high
LikelihoodLikely
Are you able to provide a potential financial impact figure?No, we do not have this figure
Potential financial impact figure (currency)<Not Applicable>
Potential financial impact figure - minimum (currency)<Not Applicable>
Potential financial impact figure - maximum (currency)<Not Applicable>
Explanation of financial impactWe estimated that this project could avoid or mitigate major reputational crisis in the future, at a frequency of one every ten years (assumption). We assumed that suchcrisis would result in a decrease of sales of 10%, leading as well to a reduced profit of 10%. Based on the average profit of the last 3 years, and accounting for the frequencyof the event, we calculated that the yearly business benefit would be 1.15 million CHF/year.
Primary response to riskImplement nature-based solutions
Description of responseReforestation activities in the catchment around this water-bottling facility, allows for better regulation and replenishment of local water resources, to the benefit of local
CDP Page of 4321

users. It was estimated that reforestation activities generated 9’286’144 m3 of water replenished every year.
Cost of response80000
Explanation of cost of responseThis is an annual figure of our investment in the reforestation project in the catchment supplying water to our factory and local communities.
W4.2a
(W4.2a) Provide details of risks identified within your value chain (beyond direct operations) with the potential to have a substantive financial or strategic impacton your business, and your response to those risks.
Country/Area & River basin
Pakistan Indus
Stage of value chainSupply chain
Type of risk & Primary risk driver
Physical Drought
Primary potential impactOther, please specify (Water stress and reputational risk)
Company-specific descriptionPakistan is one of the most water-stressed countries in the world, access to clean drinking water is a key development challenge. More than 95% of the country’s usablewater is used for agriculture in rural areas, while 2% is used by urban municipalities and 2% by industry. This high pressure on limited water resources not only generatesstrong risks of shortages for users but can also trigger reputational conflicts. Both put Nestlé at risk of increased operating cost (higher prices on water), productionshortages (water supply disruption), and brand damages through reputational battles.
TimeframeMore than 6 years
Magnitude of potential impactMedium-high
LikelihoodLikely
Are you able to provide a potential financial impact figure?No, we do not have this figure
Potential financial impact figure (currency)<Not Applicable>
Potential financial impact figure - minimum (currency)<Not Applicable>
Potential financial impact figure - maximum (currency)<Not Applicable>
Explanation of financial impactBrand damage through reputational issues is complex to define and assess.
Primary response to risk
Supplier engagement Work with supplier to engage with local communities
Description of responseTo help manage water stewardship in our operations and throughout our supply chain, Nestlé Pakistan signed a partnership with World Wide Fund for Nature Pakistan(WWF-Pakistan). We have also implemented the Alliance for Water Stewardship (AWS) Standard at our Sheikhupura and Islamabad manufacturing facilities. NestléPakistan has also entered into partnerships with Lahore University of Management Sciences (LUMS) Centre for Water Informatics and Technology to co-develop smart soilsensors that send information to the farmer’s phone about which areas of land he should irrigate and how much water should they use. Nestlé Pakistan supported farmersin our milk supply chain through the implementation of improved irrigation practices on >5'000 ha.
Cost of response300000
Explanation of cost of responseThis is a cumulated figure of our investment in water stewardship projects in Pakistan over the last three years.
Country/Area & River basin
Viet Nam Other, please specify (The project spans over several regions /river basins of Vietnam.)
Stage of value chain
CDP Page of 4322
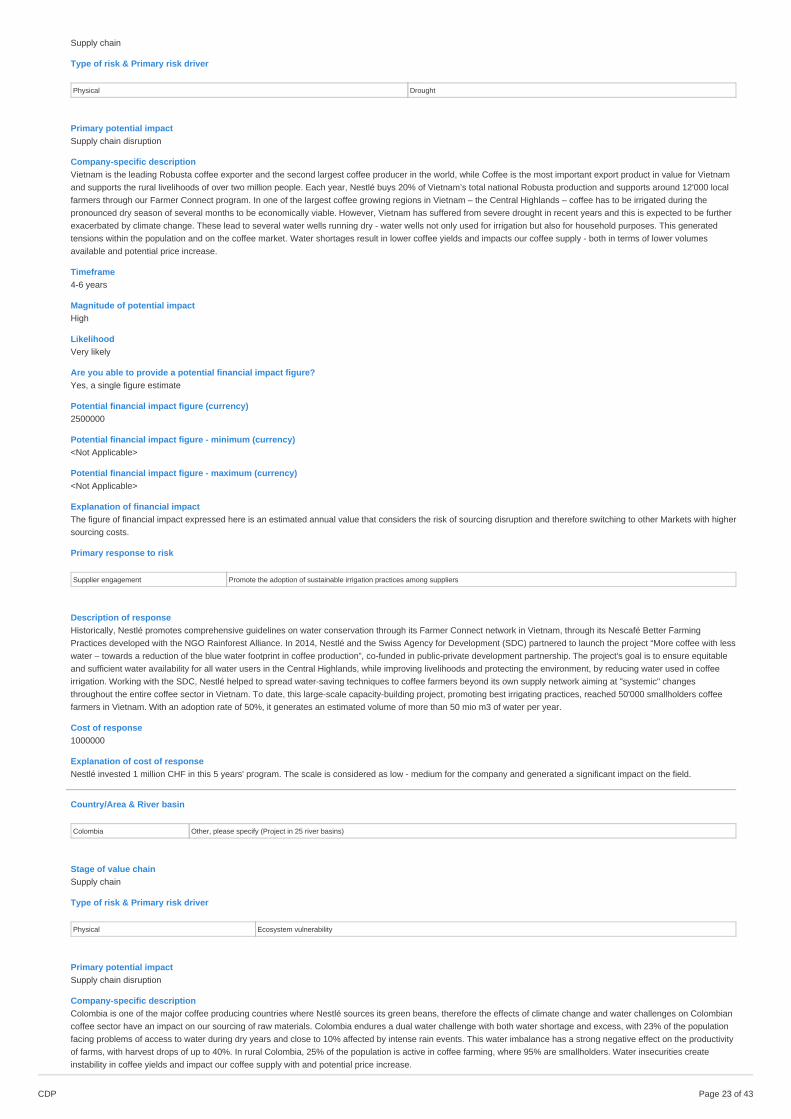
Supply chain
Type of risk & Primary risk driver
Physical Drought
Primary potential impactSupply chain disruption
Company-specific descriptionVietnam is the leading Robusta coffee exporter and the second largest coffee producer in the world, while Coffee is the most important export product in value for Vietnamand supports the rural livelihoods of over two million people. Each year, Nestlé buys 20% of Vietnam’s total national Robusta production and supports around 12'000 localfarmers through our Farmer Connect program. In one of the largest coffee growing regions in Vietnam – the Central Highlands – coffee has to be irrigated during thepronounced dry season of several months to be economically viable. However, Vietnam has suffered from severe drought in recent years and this is expected to be furtherexacerbated by climate change. These lead to several water wells running dry - water wells not only used for irrigation but also for household purposes. This generatedtensions within the population and on the coffee market. Water shortages result in lower coffee yields and impacts our coffee supply - both in terms of lower volumesavailable and potential price increase.
Timeframe4-6 years
Magnitude of potential impactHigh
LikelihoodVery likely
Are you able to provide a potential financial impact figure?Yes, a single figure estimate
Potential financial impact figure (currency)2500000
Potential financial impact figure - minimum (currency)<Not Applicable>
Potential financial impact figure - maximum (currency)<Not Applicable>
Explanation of financial impactThe figure of financial impact expressed here is an estimated annual value that considers the risk of sourcing disruption and therefore switching to other Markets with highersourcing costs.
Primary response to risk
Supplier engagement Promote the adoption of sustainable irrigation practices among suppliers
Description of responseHistorically, Nestlé promotes comprehensive guidelines on water conservation through its Farmer Connect network in Vietnam, through its Nescafé Better FarmingPractices developed with the NGO Rainforest Alliance. In 2014, Nestlé and the Swiss Agency for Development (SDC) partnered to launch the project “More coffee with lesswater – towards a reduction of the blue water footprint in coffee production”, co-funded in public-private development partnership. The project's goal is to ensure equitableand sufficient water availability for all water users in the Central Highlands, while improving livelihoods and protecting the environment, by reducing water used in coffeeirrigation. Working with the SDC, Nestlé helped to spread water-saving techniques to coffee farmers beyond its own supply network aiming at "systemic" changesthroughout the entire coffee sector in Vietnam. To date, this large-scale capacity-building project, promoting best irrigating practices, reached 50'000 smallholders coffeefarmers in Vietnam. With an adoption rate of 50%, it generates an estimated volume of more than 50 mio m3 of water per year.
Cost of response1000000
Explanation of cost of responseNestlé invested 1 million CHF in this 5 years' program. The scale is considered as low - medium for the company and generated a significant impact on the field.
Country/Area & River basin
Colombia Other, please specify (Project in 25 river basins)
Stage of value chainSupply chain
Type of risk & Primary risk driver
Physical Ecosystem vulnerability
Primary potential impactSupply chain disruption
Company-specific descriptionColombia is one of the major coffee producing countries where Nestlé sources its green beans, therefore the effects of climate change and water challenges on Colombiancoffee sector have an impact on our sourcing of raw materials. Colombia endures a dual water challenge with both water shortage and excess, with 23% of the populationfacing problems of access to water during dry years and close to 10% affected by intense rain events. This water imbalance has a strong negative effect on the productivityof farms, with harvest drops of up to 40%. In rural Colombia, 25% of the population is active in coffee farming, where 95% are smallholders. Water insecurities createinstability in coffee yields and impact our coffee supply with and potential price increase.
CDP Page of 4323

Timeframe4-6 years
Magnitude of potential impactMedium
LikelihoodLikely
Are you able to provide a potential financial impact figure?No, we do not have this figure
Potential financial impact figure (currency)<Not Applicable>
Potential financial impact figure - minimum (currency)<Not Applicable>
Potential financial impact figure - maximum (currency)<Not Applicable>
Explanation of financial impactThe potential financial impact would result from coffee supply disruption, resulting in lower production and sales and/or switching to alternative, potentially more expensive,supply chain(s).
Primary response to risk
Supplier engagement Introduce/strengthen water management incentives for suppliers
Description of responseThe Intelligent Water Management project (IWM) (also named Manos al Agua), contributes to enhance the resilience of the Colombian coffee sector in general, and ofvulnerable farmer communities in particular, against the effects of climate change and water challenges, through the improvement of environmental performance at farmand river basin level, by implementing water management plans suited to local needs and conditions. Manos al Agua focuses on 4 key complementary and scalable actionareas: •Clean technology transfer, •Healthy ecosystems, •Knowledge generation, •Cooperation and participation. The IWM program now concentrates on training farmersand implementing specific actions in each of the 25 river basins of the projects.
Cost of response5000000
Explanation of cost of responseThe overall cost of response is estimated at CHF 25 mio CHF over five years (2014-2018). The cost has been financed by a private public partnership betweenNescafé/Nespresso, the Dutch Ministry of Foreign Affairs, the Colombian Federation of Coffee Growers, Wageningen University and the Colombian Ministry of RuralDevelopment. Nestlé contributed more or less 1 mio CHF/y, over 5 years.
Country/Area & River basin
Côte d'Ivoire Other, please specify (Lak de Buyo)
Stage of value chainSupply chain
Type of risk & Primary risk driver
Reputation & markets Inadequate access to water, sanitation, and hygiene services
Primary potential impactSupply chain disruption
Company-specific descriptionCôte d’Ivoire’s cocoa production accounts for approximately 40 per cent of the world’s supply. Most cocoa is produced in the south-west of the country. The Earth SecurityGroup published their finding that, supply shortages of cocoa are expected as early as 2020. Ghana and Co ̂te d’Ivoire are Switzerland’s top cocoa suppliers; both faceproduction bottlenecks that threaten cocoa exports in the coming years. Nestlé is a major buyer of world's cocoa production. Therefore its activities are at risk if cocoasupply were to be limited/challenged. Supply disruption to Nestlé's confectionery factories would generate production slow-down and/or disruption, impacting businessresults. Ensuring coca supply, means caring about the well-being of its entire value chain. Swiss-based multinationals, including Nestlé, are going beyond traditionaldevelopment and CSR approaches to think more creatively about business model innovations that will help smallholder farmers capture more value from the globalchocolate market.
TimeframeMore than 6 years
Magnitude of potential impactMedium
LikelihoodLikely
Are you able to provide a potential financial impact figure?No, we do not have this figure
Potential financial impact figure (currency)<Not Applicable>
Potential financial impact figure - minimum (currency)<Not Applicable>
CDP Page of 4324
Potential financial impact figure - maximum (currency)<Not Applicable>
Explanation of financial impactFinancial impact may result from cocoa supply chain disruption because of increased water scarcity and/or reputational risk linked to inadequate access to water, sanitationand hygiene in cocoa agricultural supply chains.
Primary response to risk
Upstream Other, please specify (Engagement with local communities)
Description of responseNestlé, together with the IFRC, delivers developmental projects to increase the access to water, sanitation and hygiene for all under the framework of its Global Water andSanitation Initiative (GWSI). It focuses on improving access to clean water, sanitation and hygiene in rural communities, such as the cocoa-growing regions of Côte d’Ivoireand Ghana. A program of activities was introduced to improve health and hygiene awareness among vulnerable groups, including schoolchildren, teachers and localcommunity members. More than 600'000 people now benefit from this initiative, which includes the improvement of water infrastructure, the provision or renovation ofsanitation facilities, and the raising of awareness through hygiene awareness programs in villages and schools.
Cost of response700000
Explanation of cost of responseThis figure is our annual contribution to our collaboration with IFRC. Nestlé became the IFRC’s first corporate partner in Africa in 2002 and, in 2014, we renewed ourpartnership, committing CHF 5 million over five years to the IFRC.
Country/Area & River basin
Switzerland Rhine
Stage of value chainOther, please specify (Water Catchment)
Type of risk & Primary risk driver
Physical Declining water quality
Primary potential impactConstraint to growth
Company-specific descriptionThe recharge area of our Henniez springs is located in a previously intensive-agriculture area. Strong measures, at catchment level, had to be taken in order to preventnitrate concentration to rise in the natural spring water and maintain the quality of our product.
TimeframeMore than 6 years
Magnitude of potential impactHigh
LikelihoodVery likely
Are you able to provide a potential financial impact figure?Yes, a single figure estimate
Potential financial impact figure (currency)6000000
Potential financial impact figure - minimum (currency)<Not Applicable>
Potential financial impact figure - maximum (currency)<Not Applicable>
Explanation of financial impactWe estimated this as the avoided cost of drilling new wells to reach water sources at lower concentration of nitrate. The cost was estimated at 6 million CHF. Accounting forthe potential limitation/disruption of our activities would have far greater financial impact.
Primary response to risk
Upstream Other, please specify (Implement holistic water stewardship management at catchment level)
Description of responseThe project of Broye saw the investments across a range of activities to maintain the nitrite level in the water to an acceptable level. We valued the societal benefit throughthe various activities carried out and the business benefit through the avoided cost of drilling new wells. •120 ha of agricultural land and 5ha forest improved for betterecosystem services; •2500ha of biodiversity corridors; •1700 tons of CO2 avoided thanks to a biogas project (manure management ); •Avoided cost of new water well forcommunities.
Cost of response250000
Explanation of cost of responseThe cost of response is an annual figure, accounting for 100'000 annual direct investments and 150'000 in FTE's to manage the project.
CDP Page of 4325

W4.3
(W4.3) Have you identified any water-related opportunities with the potential to have a substantive financial or strategic impact on your business?No
W4.3b
(W4.3b) Why does your organization not consider itself to have water-related opportunities?
Primaryreason
Please explain
Row1
Evaluationinprogress
Building upon the excellence in water management reached in our factories over the past decades, in May of 2018, we launched a new internal initiative - Caring for Water (C4W). It is the flagshipinitiative for the “Planet” pillar of Nestlé’s Purpose and Value Framework and is mandatory in every Market where Nestlé operates . Despite all the efforts taken at the level of production sites, andto the frustration of many internally, Nestlé continued to be exposed to water stress and reputational challenges. It became clear that to ensure sustainable water resources management – andtherefore a sustainable business – the company would need to take a wider approach and consider how water is managed at the level of the watershed by all users. Caring for Water aims atimplementing Water Stewardship within our whole value chain, where it matters. To operationalize the Caring for Water initiative, the company currently uses the principles and approach set in theAlliance for Water Stewardship (AWS) Standard. Our bottled water business - Nestlé Waters - committed to have all its factories AWS-certified by 2025. On top of that, we developed various toolsto assess risks and opportunities related to water within the catchments where we operate. That is for quantitative, qualitative and reputational/community risks and opportunities. We are currentlystill in the assessment phase. Based on the result of these assessments, factories are requested to develop a Caring for Water Action plan, at catchment level. We plan on launching theimplementation phase within the next two years.
W5. Facility-level water accounting
W5.1
(W5.1) For each facility referenced in W4.1c, provide coordinates, water accounting data, and a comparison with the previous reporting year.
Facility reference numberFacility 1
Facility name (optional)MX PL Zula
Country/Area & River basin
Mexico Santiago
Latitude20.429959
Longitude-102.76658
Located in area with water stressYes
Primary power generation source for your electricity generation at this facility<Not Applicable>
Oil & gas sector business division<Not Applicable>
Total water withdrawals at this facility (megaliters/year)415
Comparison of total withdrawals with previous reporting yearHigher
Withdrawals from fresh surface water, including rainwater, water from wetlands, rivers and lakes0
Withdrawals from brackish surface water/seawater0
Withdrawals from groundwater - renewable415
Withdrawals from groundwater - non-renewable0
Withdrawals from produced/entrained water0
Withdrawals from third party sources0
CDP Page of 4326

Total water discharges at this facility (megaliters/year)341
Comparison of total discharges with previous reporting yearHigher
Discharges to fresh surface water341
Discharges to brackish surface water/seawater0
Discharges to groundwater0
Discharges to third party destinations0
Total water consumption at this facility (megaliters/year)74
Comparison of total consumption with previous reporting yearLower
Please explainThis is factory is still in its initial production phase. Water consumption increases over the years, but efficiency increases as well, resulting in higher withdrawal but lowerconsumption.
Facility reference numberFacility 2
Facility name (optional)MX PL Lagos de Moreno-Lacteos
Country/Area & River basin
Mexico Santiago
Latitude21.358774
Longitude-101.926002
Located in area with water stressYes
Primary power generation source for your electricity generation at this facility<Not Applicable>
Oil & gas sector business division<Not Applicable>
Total water withdrawals at this facility (megaliters/year)307
Comparison of total withdrawals with previous reporting yearHigher
Withdrawals from fresh surface water, including rainwater, water from wetlands, rivers and lakes0
Withdrawals from brackish surface water/seawater0
Withdrawals from groundwater - renewable11
Withdrawals from groundwater - non-renewable0
Withdrawals from produced/entrained water296
Withdrawals from third party sources0
Total water discharges at this facility (megaliters/year)41
Comparison of total discharges with previous reporting yearHigher
Discharges to fresh surface water41
Discharges to brackish surface water/seawater0
CDP Page of 4327

Discharges to groundwater0
Discharges to third party destinations0
Total water consumption at this facility (megaliters/year)266
Comparison of total consumption with previous reporting yearHigher
Please explainIncreased production results in increased water consumption. Please note however, that only 11 mega liters, out of 307, are taken from local water resources. 296 megaliters are "Milk Water" - water extracted from fresh milk received at the factory and used for industrial processes. The local water balance is actually positive.
Facility reference numberFacility 3
Facility name (optional)PK PL Sheikhupura Factory PK PL NW Sheikhupura
Country/Area & River basin
Pakistan Indus
Latitude31.68628
Longitude74.071347
Located in area with water stressYes
Primary power generation source for your electricity generation at this facility<Not Applicable>
Oil & gas sector business division<Not Applicable>
Total water withdrawals at this facility (megaliters/year)1655
Comparison of total withdrawals with previous reporting yearLower
Withdrawals from fresh surface water, including rainwater, water from wetlands, rivers and lakes0
Withdrawals from brackish surface water/seawater0
Withdrawals from groundwater - renewable1655
Withdrawals from groundwater - non-renewable0
Withdrawals from produced/entrained water0
Withdrawals from third party sources0
Total water discharges at this facility (megaliters/year)699
Comparison of total discharges with previous reporting yearAbout the same
Discharges to fresh surface water699
Discharges to brackish surface water/seawater0
Discharges to groundwater0
Discharges to third party destinations0
Total water consumption at this facility (megaliters/year)956
Comparison of total consumption with previous reporting yearLower
CDP Page of 4328

Please explainConstant improvement in water use efficiency leads to constant decrease in absolute water consumption.
Facility reference numberFacility 4
Facility name (optional)ZA PL Mossel Bay
Country/Area & River basin
SouthAfrica
Other, please specify (According to WFF Water Risk Filter, this factory is located in the Province of "Western Cape" within a River Basin listed as "South Africa (Other)". WRI-Aqueduct hasn't anyBasin name listed for this location.)
Latitude-34.145319
Longitude22.10495
Located in area with water stressYes
Primary power generation source for your electricity generation at this facility<Not Applicable>
Oil & gas sector business division<Not Applicable>
Total water withdrawals at this facility (megaliters/year)137
Comparison of total withdrawals with previous reporting yearLower
Withdrawals from fresh surface water, including rainwater, water from wetlands, rivers and lakes0
Withdrawals from brackish surface water/seawater0
Withdrawals from groundwater - renewable0
Withdrawals from groundwater - non-renewable0
Withdrawals from produced/entrained water28
Withdrawals from third party sources109
Total water discharges at this facility (megaliters/year)177
Comparison of total discharges with previous reporting yearLower
Discharges to fresh surface water0
Discharges to brackish surface water/seawater0
Discharges to groundwater0
Discharges to third party destinations177
Total water consumption at this facility (megaliters/year)-40
Comparison of total consumption with previous reporting yearHigher
Please explainThis factory is also equipped with ZerEau water technology, therefore using very little of the local water resources and discharging more as effluents than it actuallywithdraws locally.
Facility reference numberFacility 5
Facility name (optional)MX PL NW Manantiales
Country/Area & River basin
CDP Page of 4329

Mexico Other, please specify (According to WFF Water Risk Filter, this factory is located in the Province of "Puebla" within a River Basin listed as "Mexico (Other)". WRI-Aqueduct hasn't any Basin name listedfor this location.)
Latitude19.3611
Longitude-98.5995
Located in area with water stressYes
Primary power generation source for your electricity generation at this facility<Not Applicable>
Oil & gas sector business division<Not Applicable>
Total water withdrawals at this facility (megaliters/year)474
Comparison of total withdrawals with previous reporting yearLower
Withdrawals from fresh surface water, including rainwater, water from wetlands, rivers and lakes0
Withdrawals from brackish surface water/seawater0
Withdrawals from groundwater - renewable474
Withdrawals from groundwater - non-renewable0
Withdrawals from produced/entrained water0
Withdrawals from third party sources0
Total water discharges at this facility (megaliters/year)57
Comparison of total discharges with previous reporting yearAbout the same
Discharges to fresh surface water57
Discharges to brackish surface water/seawater0
Discharges to groundwater0
Discharges to third party destinations0
Total water consumption at this facility (megaliters/year)417
Comparison of total consumption with previous reporting yearLower
Please explainThis is a bottled-water factory consuming large volumes of water, while discharging little as effluents, due to a high degree of water use efficiency within the factory.
W5.1a
CDP Page of 4330

(W5.1a) For the facilities referenced in W5.1, what proportion of water accounting data has been externally verified?
Water withdrawals – total volumes
% verified76-100
What standard and methodology was used?Bureau Veritas verifies all our reported data annually (as explained in section W10.Verification).
Water withdrawals – volume by source
% verified76-100
What standard and methodology was used?Bureau Veritas verifies all our reported data annually (as explained in section W10.Verification).
Water withdrawals – quality
% verified76-100
What standard and methodology was used?Bureau Veritas verifies all our reported data annually (as explained in section W10.Verification).
Water discharges – total volumes
% verified76-100
What standard and methodology was used?Bureau Veritas verifies all our reported data annually (as explained in section W10.Verification).
Water discharges – volume by destination
% verified76-100
What standard and methodology was used?Bureau Veritas verifies all our reported data annually (as explained in section W10.Verification).
Water discharges – volume by treatment method
% verified76-100
What standard and methodology was used?Bureau Veritas verifies all our reported data annually (as explained in section W10.Verification).
Water discharge quality – quality by standard effluent parameters
% verified76-100
What standard and methodology was used?Bureau Veritas verifies all our reported data annually (as explained in section W10.Verification).
Water discharge quality – temperature
% verified76-100
What standard and methodology was used?Bureau Veritas verifies all our reported data annually (as explained in section W10.Verification).
Water consumption – total volume
% verified76-100
What standard and methodology was used?Bureau Veritas verifies all our reported data annually (as explained in section W10.Verification).
Water recycled/reused
% verified76-100
What standard and methodology was used?Bureau Veritas verifies all our reported data annually (as explained in section W10.Verification).
W6. Governance
W6.1
CDP Page of 4331

(W6.1) Does your organization have a water policy?Yes, we have a documented water policy that is publicly available
W6.1a
(W6.1a) Select the options that best describe the scope and content of your water policy.
Scope Content Please explain
Row1
Selectfacilities,businesses,orgeographiesonly
Description ofbusinessdependency onwaterDescription ofbusiness impacton waterDescription ofwater-relatedperformancestandards fordirect operationsDescription ofwater-relatedstandards forprocurementReference tointernationalstandards andwidely-recognizedwater initiativesCompany watertargets and goalsCommitment toalign with publicpolicy initiatives,such as the SDGsCommitmentsbeyond regulatorycomplianceCommitment tostakeholderawareness andeducationCommitment towater stewardshipand/or collectiveactionCommitment tosafely managedWater, Sanitationand Hygiene(WASH) in theworkplaceAcknowledgementof the human rightto water andsanitationRecognition ofenvironmentallinkages, forexample, due toclimate change
The Nestlé Policy on Environmental Sustainability identifies water preservation as a key focus area. It is complemented with the Nestlé Commitment to Water Stewardshipand the Nestlé Guidelines on Respecting the Human Rights to Water and Sanitation. The latter document has been based upon the guidance on respecting the human rightto water provided by the UN CEO Water Mandate. The Nestlé Commitment to Water Stewardship sets a framework for commitments on water that go beyond regulatorycompliance. This includes a commitment on collective action, tackling water challenges through platforms like the Alliance for Water Stewardship. All documents are publiclyavailable and apply to all geographies and sites. Water is critical to the future success of our business and our value chain. Water is a business opportunity, an operationalchallenge and a societal issue that is of deep concern to us all. Water is essential to grow the agricultural raw materials we source, to run our operations and for consumersto prepare and enjoy our products. We respect the human right to water and sanitation and are helping to facilitate the sustainable management of water catchments wherewe source our goods, where our factories are located, and where our suppliers and consumers live.
W6.2
(W6.2) Is there board level oversight of water-related issues within your organization?Yes
W6.2a
(W6.2a) Identify the position(s) (do not include any names) of the individual(s) on the board with responsibility for water-related issues.
Positionofindividual
Please explain
Board-levelcommittee
The Nomination and Sustainability Committee oversees all aspects of our environmental, social and governance performance including water-related topics. It reviews reports and gives advice onmeasures which ensures the long-term sustainability of the Company in its economic, social and environmental dimension (including its response to climate change and related reporting) and monitorsthe Group's performance against selected external sustainability indexes. It reviews the Company's commitments on environmental, social and governance aspects as well as the annual Nestlé inSociety report and discusses periodically how other material non-financial issues affect the Company's financial performance and how its long-term strategy relates to its ability to create shared value.
CDP Page of 4332

W6.2b
(W6.2b) Provide further details on the board’s oversight of water-related issues.
Frequencythat water-relatedissues are ascheduledagenda item
Governancemechanismsinto whichwater-relatedissues areintegrated
Please explain
Row1
Scheduled -somemeetings
MonitoringimplementationandperformanceOverseeingacquisitionsand divestitureOverseeingmajor capitalexpendituresProvidingemployeeincentivesReviewing andguiding annualbudgetsReviewing andguidingbusiness plansReviewing andguiding majorplans of actionReviewing andguiding riskmanagementpoliciesReviewing andguidingstrategyReviewing andguidingcorporateresponsibilitystrategyReviewinginnovation/R&DprioritiesSettingperformanceobjectives
The setting of targets and public commitments on water issues forms part of our Creating Shared Value (CSV) approach to business. Previously limited to the Nestlé in SocietyBoard (consisting of select Executive Board members) the topic of CSV is now part of the agenda of the Executive Board meetings (chaired by our CEO) twice yearly.Together, the Executive Board leads the strategic development and implementation of Creating Shared Value across our business, including for all commitments on water,objectives and strategies. The Caring for Water Steering Committee, co-chaired by our Head of Operations, oversees Nestlé’s implementation of its water strategy, and thesetting and review of water-related targets. It meets at least four times a year and as frequently as necessary to fulfill its task.
W6.3
(W6.3) Provide the highest management-level position(s) or committee(s) with responsibility for water-related issues (do not include the names of individuals).
Name of the position(s) and/or committee(s)Other C-Suite Officer, please specify (Executive Vice President Head of Operations)
ResponsibilityBoth assessing and managing water-related risks and opportunities
Frequency of reporting to the board on water-related issuesQuarterly
Please explainThe Head of Operations is an Executive Board member and reports directly to the Nestlé CEO. The Head of Operations is in charge of ensuring the operationalization of thepolicies set by the Executive Board and for reporting back on progress. The Head of Operations is responsible for water in our operations, water in agriculture, andinvestments in water catchments. The Caring for Water Steering Committee oversees Nestlé’s strategy on water, including the setting and review of water-related targets.The Committee is co-chaired by the Head of Operations, the Head of Waters Strategic Business Unit and the Head of Corporate Communications and meets quarterly. TheSteerco drives and develops flagship initiatives on water, assesses and manages major water-related risks and opportunities. The Head of Operations validates all watertargets and ambitions to be implemented including the technical assessment and development of water action plans.
W6.4
(W6.4) Do you provide incentives to C-suite employees or board members for the management of water-related issues?
Provide incentives for management of water-related issues Comment
Row1
No, not currently but we plan to introduce them in the next twoyears
We are currently exploring ways of including water-related KPI's linked to annual performance and financial incentives for C-suiteemployees.
CDP Page of 4333

W6.5
(W6.5) Do you engage in activities that could either directly or indirectly influence public policy on water through any of the following?Yes, direct engagement with policy makersYes, trade associationsYes, funding research organizations
W6.5a
(W6.5a) What processes do you have in place to ensure that all of your direct and indirect activities seeking to influence policy are consistent with your waterpolicy/water commitments?
Nestlé's engagement is guided by its commitment on water stewardship. It includes a specific commitment to advocate for effective water policies and stewardship. As such,we have defined clear objectives covering our engagement at various levels.
At, the global level, we are founding member of the 2030 Water Resources Group, currently chaired by our Chairman. The 2030 Water Resources Group is a multi-stakeholder platform that works on the issue of water scarcity in countries with the support of senior public authorities. We are also a key contributor to the CEO WaterMandate and the World Business Council on Sustainable Development.
At the local level, we support the AWS standard. The AWS standard provides us with a framework to engage with key stakeholders, including policy makers, around ourproduction sites. This engagement is championed by Nestlé Waters who have set a specific commitment to certify all its bottled water factories by 2025.
To ensure the consistency of the global advocacy objectives, Nestlé has put in place a global advocacy framework and global advocacy committee that meets on a monthlybasis. The committee oversees the advocacy priorities, including for water, and mandates corrective actions if inconsistency is discovered.
Progress is reported on an annual basis in the Nestlé in Society report.
W6.6
(W6.6) Did your organization include information about its response to water-related risks in its most recent mainstream financial report?Yes (you may attach the report - this is optional)2019-annual-review-en.pdf
W7. Business strategy
W7.1
CDP Page of 4334

(W7.1) Are water-related issues integrated into any aspects of your long-term strategic business plan, and if so how?
Are water-relatedissuesintegrated?
Long-termtimehorizon(years)
Please explain
Long-termbusinessobjectives
Yes, water-relatedissues areintegrated
5-10 Long-term business objectives setting is defined through an internal process of Nestlé governance bodies that cover water. The setting of targets and public commitments onwater issues forms part of our Creating Shared Value approach to business. The Caring for Water Steering committee is part of the Nestlé in Society Board Governance. CSV isnow part of the agenda of the Executive Board meetings (chaired by our CEO) annually. Together, the Executive Board leads the strategic development and implementation ofCreating Shared Value across our business, including for all commitments on water, objectives and strategies. The Caring for Water Steering Committee, co-chaired by our COO,oversees setting and review of water-related targets - from internal water efficiency to WASH and water use in agriculture. It meets at least four times a year. Long-term businessobjectives adjustments are discussed during these meetings. Our business strategy incorporates water risks and opportunities driven by regulation, physical and reputationaspects. It covers aspects of water quantity and quality both in our direct operations and entire value chain as well as access to water and sanitation for our employees andcommunities in our value chain. It is expected that post-2020 commitments on water will set targets for 2025 and 2030.
Strategyforachievinglong-termobjectives
Yes, water-relatedissues areintegrated
5-10 We have published a number of robust commitments, including five on water, to support our long-term goal of Creating Shared Value. They cover nutrition, health and wellness,rural development and responsible sourcing, water, environmental sustainability, our people, human rights and compliance. For water, it covers aspects of water quantity andquality both in our direct operations and entire value chain as well as access to water and sanitation for our employees and communities in our value chain. The commitmentsmake it possible for stakeholders to hold us accountable, encouraging us to seek and achieve continuous improvement in our nutrition, water, rural development, sustainability andcompliance performance. Each commitment is owned by a member of the Executive Board meaning that they are responsible for both commercial and societal commitments. Wealso systematically assess and optimize the environmental performance, including water, across the entire value chain at the earliest stage in the development of new andrenovated products. We implemented a mandatory environmental rating system for all new product and process developments three years ago. This uses a five-point scale toevaluate potential impacts, both adverse and beneficial. It is designed to inform decisions at the earliest stage, before a project goes into development.
Financialplanning
Yes, water-relatedissues areintegrated
5-10 To inform water-related financial investments in our factories, we place a theoretical price on water, ranging from CHF 1 to CHF 5 per m3 depending on a factory’s physical riskscore, as generated by the Nestlé Combined Water Stress Index. We have extended our acceptable Return on Investment period for equipment funding that will deliver watersavings. We are also stimulating innovation through the introduction of a Lighthouse Projects. This approach enables us to convert environmental and social benefits into anotional payback, helping us to prioritize resource allocation. We are continuing to extend our acceptable Return On Investment period for equipment funding that delivers watersavings, recognizing that such activities often require longer-term investment. Combined, these cover aspects of water quantity and quality both in our direct operations and entirevalue chain as well as access to water and sanitation for our employees and communities in our value chain as well.
W7.2
(W7.2) What is the trend in your organization’s water-related capital expenditure (CAPEX) and operating expenditure (OPEX) for the reporting year, and theanticipated trend for the next reporting year?
Row 1
Water-related CAPEX (+/- % change)
Anticipated forward trend for CAPEX (+/- % change)0
Water-related OPEX (+/- % change)3
Anticipated forward trend for OPEX (+/- % change)0
Please explainWe allocate significant CAPEX amounts to water savings and effluents treatment in our factories, on a yearly basis. This constant investment is reflected in the continuousimprovement of our internal water use efficiency (m3 of water used per ton of finished product) and compliance with local and internal water quality standards (withdrawaland discharge). We estimate that this figure is within the same order of magnitude as previous years, reflected in the improvement in water efficiency in 2019. For watersaving CAPEX, we increasingly focus on a selected number of sites (context-based approach), in order to invest in water savings where it delivers a real benefit on locally-stressed resources. Unfortunately, due to a recent technical change in our internal Investment Management Tool, we are not able to provide a consolidated figure specificfor "Water-Related CAPEX" for 2019. We expect to be able to provide accurate figures for 2020 in next year's reporting cycle.
W7.3
(W7.3) Does your organization use climate-related scenario analysis to inform its business strategy?
Use ofclimate-relatedscenarioanalysis
Comment
Row1
Yes In 2019 Nestlé announced its ambition to achieve zero net greenhouse gas emissions by 2050. In 2020 we began to build our low-carbon transition time-bound plan including interim targetsconsistent with the 1.5°C path. In 2020 we began a project to assess Nestlé’s exposure and resilience to climate change using scenario modelling covering both climate-related physical andtransitional risks and opportunities. The modelling output analysis will be both qualitative and quantitative analysis with has the objectives: - assess the Group's exposures to climate-related risks &opportunities under different climate scenarios - help identify mitigation & adaptation actions to increase resilience to climate change - support the development of the Group's 2050 climate ambitionand climate roadmap The results of the scenario analysis will be available in the H2 2020 and will be used to inform our climate adaptation and mitigation interventions, targets and metrics tomeasure progress.
W7.3a
(W7.3a) Has your organization identified any water-related outcomes from your climate-related scenario analysis?Yes
CDP Page of 4335

W7.3b
(W7.3b) What water-related outcomes were identified from the use of climate-related scenario analysis, and what was your organization’s response?
Climate-relatedscenariosandmodelsapplied
Description of possible water-related outcomes Company response to possible water-related outcomes
Row1
RCP 2.6Other,pleasespecify(RCP8.5)
Acute physical impacts such as an increase in frequency andseverity of extreme weather events have an impact today. Chronicphysical risks are more likely to manifest themselves over thelonger term, weighted to the second half of the century. Coffee, forinstance, is one of the main commodity purchased annually byNestlé, and among biggest sales of the company. Physical riskshave a high probability to impact with higher temperatures andwater shortages compromising quality and reducing availability ofcoffee in future. This may lead to an increase in raw material costsfor the industry, and have economic and social impacts on coffee-growing communities. as well as our business.
We are accelerating our climate change efforts to transition to a low-carbon economy and have made a commitment toachieve zero net emissions by 2050. Over the past four years, Nestlé has aligned its objectives with science-based targets tokeep the temperature increase below 2°C. The company is determined to play a leading role in tackling climate change. Overthe next two years, it will lay out a time-bound plan including interim targets consistent with the 1.5°C path. Nestlé will reviewits progress annually to ensure it is on track. We have initiatives in place to support farmers in our supply chains in mitigatingand adapting to climate-related physical impacts. These include providing technical assistance to farmers through our NescaféPlan and Nespresso AAA Program, enhancing resilience to climate change in our plant breeding programs and improvingmanagement of the dairy supply chain. We are scaling up initiatives in agriculture to build farm-level resilience by storingcarbon through soil, increasing soil-water content capacity and reducing needs for irrigation, land management andrestoration, helping farmers reduce greenhouse gas emissions and halting deforestation, also resulting in positiveconsequences on the quantity and quality of local water resources.
W7.4
(W7.4) Does your company use an internal price on water?
Row 1
Does your company use an internal price on water?No, but we are currently exploring water valuation practices
Please explainFor internal water saving projects, factories can already use the concept of notional cost of water to analyze water projects based on estimated water prices ranging from 1to 5 CHF/m3 depending on the level of water stress index of the factory’ location. To inform decision-making, we place a theoretical price on water, ranging from CHF 1 toCHF 5 per m3 depending on a factory’s physical risk score, as generated by the Nestlé Combined Water Stress Index. We have extended our acceptable Return onInvestment period for equipment funding that will deliver water savings. This approach enables us to convert environmental and social benefits into a notional payback,helping us to prioritize resource allocation. We are continuing to extend our acceptable Return on Investment period for equipment funding that delivers water savings,recognizing that such activities often require longer-term investment.
W8. Targets
W8.1
(W8.1) Describe your approach to setting and monitoring water-related targets and/or goals.
Levels fortargetsand/orgoals
Monitoringatcorporatelevel
Approach to setting and monitoring targets and/or goals
Row1
Company-widetargetsand goalsBusinesslevelspecifictargetsand/orgoalsSite/facilityspecifictargetsand/orgoalsCountryleveltargetsand/orgoals
Targets aremonitoredat thecorporatelevelGoals aremonitoredat thecorporatelevel
The setting of goals and targets on water, enforced through public commitments, is an integral part of our Creating Shared Value approach to business. Previously limited to theNestlé in Society Board (consisting of select Executive Board members) the topic of CSV is now part of the agenda of the Executive Board meetings (chaired by our CEO) once ayear. Together, the Executive Board leads the strategic development and implementation of Creating Shared Value across our business, including for all commitments on water. Atcorporate level, our goal for the planet is to Strive for Zero Environmental Impact, by 2030 (https://www.nestle.com/csv/global-initiatives/zero-environmental-impact). We believe thatour business must contribute to ensuring that society lives within planetary boundaries. To ensure we deliver on this goal, we have set various public commitments to use responsiblysourced ingredients and renewable resources, operate more efficiently, eliminate waste and manage water responsibly. The goal of our flagship initiative Caring for Water is to ensurethat "Together, we steward water resources for future generations." The Caring for Water Steering Committee, co-chaired by our COO, oversees Nestlé’s implementation of its waterstrategy, and the setting and review of water-related targets. It meets at least four times a year and as frequently as necessary to fulfill its task. The Caring for Water Steeringcommittee is part of the Nestlé in Society Board Governance. In order to operationalise our goals on water, we have four commitments/goals: 1. Work to achieve water efficiency andsustainability across our operations 2. Advocate for effective water policies and stewardship 3. Engage with suppliers, especially those in agriculture 4. Raise awareness on waterconservation and improve access to water and sanitation across our value chain Each of these commitments has a set of targets to ensure we deliver on them. Our target settingprocess relies on: - Assessment of local water stress at the location of our manufacturing sites (quantitative and qualitative) using various sets of data (i.e. WRI Aqueduct, WWF WRF,EarthStat Water Depletion and Pfister 2014). - Assessment of local water stress in our agricultural supply chain and within key watersheds where we operate (quantitative andqualitative) using various sets of data (i.e. WRI Aqueduct, WWF WRF, EarthStat Water Depletion and Pfister 2014). - Detailed field assessments of water-related risks andopportunities (quantitative and qualitative) - Assessment and mapping of key stakeholders to engage with, in our entire value chain and beyond (authorities, NGO's). The result ofthese assessments offers a general picture of the risks and opportunities related to water for Nestlé and helps us define targets for: - Water use in our factories, - Water use in ouragricultural supply chain, - Water use in key catchments where we operate, - Key stakeholders to engage with,
W8.1a
(W8.1a) Provide details of your water targets that are monitored at the corporate level, and the progress made.
Target reference number
CDP Page of 4336

Target 1
Category of targetWater use efficiency
LevelCompany-wide
Primary motivationReduced environmental impact
Description of targetBy 2020 – Reduce direct water withdrawals per tonne of product in every product category to achieve an overall reduction of 35% in our manufacturing operations versus2010. At global scale, reduce the m3 of water used to produce one ton of product in every product category, to use 35% less water in 2020 compared to 2010.
Quantitative metricOther, please specify (%reduction in m3 of water used per ton of product.)
Baseline year2010
Start year2017
Target year2020
% of target achieved89
Please explainBy end-year 2019, we had achieved a reduction of -31% versus the rate of m3 of water used per tonne of product of 2010. This represents an 89% achievement rate of ourtarget.
Target reference numberTarget 2
Category of targetWater withdrawals
LevelCompany-wide
Primary motivationReduced environmental impact
Description of targetBy 2020 – Carry out 40 new "Water Resources Reviews" in selected manufacturing facilities, and all greenfield sites. This company-wide program of Water ResourceReviews (WRR) for factory sites, helps us to assess the risks, impacts and opportunities of a manufacturing facility within a local water catchment. A WRR consists in adetailed audit of a factory and its direct surrounding for all aspects related to water. It assesses regulatory compliance, water use in the factory, local water availability andquality, site protection, relationships with local and regional stakeholders (including key aspects related to the human right to water and sanitation). After the review,corrective actions are undertaken, as needed.
Quantitative metricOther, please specify (Number of WRR performed)
Baseline year2017
Start year2017
Target year2020
% of target achieved80
Please explainBy end-year 2019, we had performed 32 WRR's. This represents an 80% achievement rate of our target.
Target reference numberTarget 3
Category of targetOther, please specify (Water Stewardship Initiatives)
LevelCompany-wide
Primary motivationReduced environmental impact
Description of targetBy 2020 – Implement 10 new water stewardship initiatives in selected locations, with specific focus on “High-Priority Manufacturing Facilities” (HPMF). Through WaterStewardship initiatives, we ensure local water management is approached within a holistic framework. Not only does it consider water management at catchment level, butit also includes all stakeholders. Together, this approach ensures the sustainability and availability of water for all users within a given catchment.
Quantitative metricOther, please specify (Number of projects)
CDP Page of 4337

Baseline year2017
Start year2017
Target year2020
% of target achieved100
Please explainBy end-year 2019, we had 27 factories certified by AWS, over-exceeding our target of 10.
Target reference numberTarget 4
Category of targetOther, please specify (Advocacy)
LevelCompany-wide
Primary motivationOther, please specify (Advocacy)
Description of targetAdvocate for effective water policies and stewardship. Working with others for positive impact
Quantitative metricOther, please specify (Tracking of activities)
Baseline year2017
Start year2017
Target year2020
% of target achieved100
Please explainOur key water partnerships and initiatives are outlined below. We work closely with the World Resources Institute (WRI) to develop 2 methodologies that helps companiesquantify the sustainable cost of water and a water stewardship benefit accounting methodology (https://www.wri.org/publication/volumetric-water-benefit-accounting) We co-chair the 2030 Water Resources Group (2030 WRG). We are a founding signatory of the UN Global Compact (UNGC) CEO Water Mandate We are involved in TheAlliance for Water Stewardship (AWS) Standard that provides a framework for companies to evaluate their water stewardship practices against a range of environmental,social and economic criteria. We are part of the Joint Water Risk Assessment and Mitigation project, run by the Sustainable Agriculture Initiative Platform (SAI Platform) andthe Sustainable Food Lab (SFL).
Target reference numberTarget 5
Category of targetSupplier engagement
LevelCompany-wide
Primary motivationRecommended sector best practice
Description of targetBy 2020 – Implement all action plans defined for improved water management in our upstream supply chain for coffee, sugar, dairy and cereals in high-priority locations.Our greatest challenge in responsible water stewardship, as well as our biggest opportunity, lies in addressing impacts within our supply chains.
Quantitative metricOther, please specify (Number of projects tracking various KPI (m3 of water, ha of land covered, beneficiaries, CAPEX). This varies very much from one project to theother.)
Baseline year2017
Start year2017
Target year2020
% of target achieved100
Please explainNestlé works directly with 550'000 farmers around the world through Farmer Connect, which enables us to develop supply chains that meet our social, environmental andethical requirements. We directly trained 440'000 of them in 2019. We currently have 10 projects in 9 water-stressed areas. Through the Sustainable Agriculture Initiative at
CDP Page of 4338

Nestlé (SAIN), we address water issues and promote remediation measures. We are currently implementing water management action plans for coffee, sugar, dairy, riceand cereals in water-stressed areas. The farms, plantations and mills in these supply chains need to comply with the terms of our Responsible Sourcing Standard (RSG),and take action to mitigate their impact on local water sources.
Target reference numberTarget 6
Category of targetWater, Sanitation and Hygiene (WASH) services in the community
LevelBusiness
Primary motivationCorporate social responsibility
Description of targetBy 2020 – Implement detailed Guidelines on human rights to water and sanitation due diligence in all Nestlé Markets and key agricultural supply chains. By 2020 – 600'000beneficiaries in local communities have access to water, sanitation or hygiene projects around our manufacturing facilities and key agricultural supply chains.
Quantitative metricOther, please specify (Number of locations and number of beneficiaries)
Baseline year2010
Start year2010
Target year2020
% of target achieved90
Please explainWe developed our own Nestlé Guidelines on Respecting the Human Rights to Water and Sanitation by the end of the same year, helping our markets and factories torespect and support these fundamental rights. In 2019, we continued to roll out our Nestlé Guidelines on Respecting the Human Rights to Water and Sanitation, to ensureour operations and upstream supply chain do not have any negative impact on the human right to water. We have partnered with the International Federation of Red Crossand Red Crescent Societies (IFRC) in western Africa. Our target was met in 2017 and at the end of 2019, 896'168 people around the world were benefiting from our WASHprograms.
Target reference numberTarget 7
Category of targetOther, please specify (Certification of factories)
LevelBrand/product
Primary motivationRecommended sector best practice
Description of targetNestlé Waters to certify all its bottling water facilities with the Alliance for Water Stewardship (AWS) standard by 2025. This commitment is part of how Nestlé cares forwater across four key areas: in factories, in watershed, across its agricultural supply chains and in communities where it operates to provide access to clean water andsanitation. By pledging to certify all our Nestlé Waters sites against this publicly recognized, credible water stewardship standard, we demonstrate how we positivelycontribute to water resources where we operate for the shared benefit of all. AWS provides a common language for those willing to be pro-active in Water Stewardshipactivities through an eye-opening implementation approach and a credible external auditing/certification process. AWS guides companies in assessing risks and needs, andin focusing efforts where it matters most and for the benefit of all.
Quantitative metricOther, please specify (Number of sites certified)
Baseline year2017
Start year2017
Target year2025
% of target achieved32
Please explainBy end-year 2019, 32% of our bottled-water factories were certified by AWS, over-exceeding. We are on track with our commitment for 2025.
W8.1b
CDP Page of 4339
(W8.1b) Provide details of your water goal(s) that are monitored at the corporate level and the progress made.
GoalOther, please specify (Our 2030 ambition is to strive for zero environmental impact in our operations)
LevelCompany-wide
MotivationReduced environmental impact
Description of goalWe believe that our business must contribute to ensuring that society lives within planetary boundaries. This means protecting biodiversity and natural resources whileencouraging others to act responsibly. To ensure we deliver on this goal, we have various initiatives, each with specific ambitions, commitments and targets, that willcontribute to our global "planet" goal of striving for zero environmental impact. Although not always directly mentioned, all initiatives listed below have strong links with waterand all contribute to sustainable water management somehow. 1. Caring for water By engaging in proactive, long-term partnerships to define, implement and evaluatesolutions, we aim to steward water resources for future generations. 2. Tackling plastic waste Using our research capabilities to develop new solutions, we aim to be aleader in developing the most sustainable packaging for our food and beverage products. 3. Acting on climate change In September 2019, we committed to achieving zeroGHG emissions across our value chain by 2050. 4. Protecting natural capital Preserving natural capital is crucial for safeguarding our supply of raw materials and the futureof our business. 5. Managing waste We are working to eliminate waste from our own activities and going beyond that to educate, raise awareness and identify actions toreduce food waste across the globe.
Baseline year
Start year
End year2030
ProgressAll initiatives listed above have specific sets of public commitments to use responsibly sourced ingredients and renewable resources, operate more efficiently, eliminatewaste and manage water responsibly. Each also have specific baseline, start year and end year. These commitments have targets with goals, baseline and deadline forachievement which allow us to track progress - as detailed in question W8.1a.
GoalOther, please specify (Together, we steward water resources for future generations)
LevelCompany-wide
MotivationWater stewardship
Description of goalAccess to clean water and adequate sanitation is a fundamental human right. However, a staggering 1.2 billion people live in areas of water scarcity, and a further 1.6 billionpeople face economic water shortage. Protecting and preserving the water resources we share with others is a top priority for us. By engaging in proactive, long-termpartnerships to define, implement and evaluate solutions, we aim to steward water resources for future generations.
Baseline year
Start year
End year
Progress
W9. Verification
W9.1
(W9.1) Do you verify any other water information reported in your CDP disclosure (not already covered by W5.1a)?Yes
W9.1a
CDP Page of 4340

(W9.1a) Which data points within your CDP disclosure have been verified, and which standards were used?
Disclosuremodule
Dataverified
Verificationstandard
Please explain
W0Introduction
Yes AA1000AS Bureau Veritas UK Ltd. (Bureau Veritas) has provided independent assurance to Nestlé SA (Nestlé) over the Nestlé in society: Full report 2019 (‘the CSV Report’) published onthe Nestlé website (https://www.nestle. com/csv). The assurance process was conducted in line with the requirements of the AA1000 Assurance Standard (2008) Type 2 atmoderate level of assurance. The scope of Bureau Veritas’ work was limited to Nestlé’s head-office based activities where Nestlé consolidates and reconciles data provided bylocal markets/countries. The assurance was provided over all data and text included in the CSV Report and included a review of the CSV report’s alignment to GRI standards. Italso included a review of Nestlé’s UNGP (United Nations Guiding Principles) Index on human rights against the ‘Tier 1’ Assurance Indicators of the UNGP ReportingFramework. Bureau Veritas’ full assurance statement includes certain exclusions, observations of good practices, recommendations for improvement, as well as detailedassurance methodology and scope of work.
W1 Currentstate
Yes AA1000AS Bureau Veritas UK Ltd. (Bureau Veritas) has provided independent assurance to Nestlé SA (Nestlé) over the Nestlé in society: Full report 2019 (‘the CSV Report’) published onthe Nestlé website (https://www.nestle. com/csv). The assurance process was conducted in line with the requirements of the AA1000 Assurance Standard (2008) Type 2 atmoderate level of assurance. The scope of Bureau Veritas’ work was limited to Nestlé’s head-office based activities where Nestlé consolidates and reconciles data provided bylocal markets/countries. The assurance was provided over all data and text included in the CSV Report and included a review of the CSV report’s alignment to GRI standards. Italso included a review of Nestlé’s UNGP (United Nations Guiding Principles) Index on human rights against the ‘Tier 1’ Assurance Indicators of the UNGP ReportingFramework. Bureau Veritas’ full assurance statement includes certain exclusions, observations of good practices, recommendations for improvement, as well as detailedassurance methodology and scope of work.
W2Businessimpacts
Yes AA1000AS Bureau Veritas UK Ltd. (Bureau Veritas) has provided independent assurance to Nestlé SA (Nestlé) over the Nestlé in society: Full report 2019 (‘the CSV Report’) published onthe Nestlé website (https://www.nestle. com/csv). The assurance process was conducted in line with the requirements of the AA1000 Assurance Standard (2008) Type 2 atmoderate level of assurance. The scope of Bureau Veritas’ work was limited to Nestlé’s head-office based activities where Nestlé consolidates and reconciles data provided bylocal markets/countries. The assurance was provided over all data and text included in the CSV Report and included a review of the CSV report’s alignment to GRI standards. Italso included a review of Nestlé’s UNGP (United Nations Guiding Principles) Index on human rights against the ‘Tier 1’ Assurance Indicators of the UNGP ReportingFramework. Bureau Veritas’ full assurance statement includes certain exclusions, observations of good practices, recommendations for improvement, as well as detailedassurance methodology and scope of work.
W3Procedures
Yes AA1000AS Bureau Veritas UK Ltd. (Bureau Veritas) has provided independent assurance to Nestlé SA (Nestlé) over the Nestlé in society: Full report 2019 (‘the CSV Report’) published onthe Nestlé website (https://www.nestle. com/csv). The assurance process was conducted in line with the requirements of the AA1000 Assurance Standard (2008) Type 2 atmoderate level of assurance. The scope of Bureau Veritas’ work was limited to Nestlé’s head-office based activities where Nestlé consolidates and reconciles data provided bylocal markets/countries. The assurance was provided over all data and text included in the CSV Report and included a review of the CSV report’s alignment to GRI standards. Italso included a review of Nestlé’s UNGP (United Nations Guiding Principles) Index on human rights against the ‘Tier 1’ Assurance Indicators of the UNGP ReportingFramework. Bureau Veritas’ full assurance statement includes certain exclusions, observations of good practices, recommendations for improvement, as well as detailedassurance methodology and scope of work.
W4 Risksandopportunities
Yes AA1000AS Bureau Veritas UK Ltd. (Bureau Veritas) has provided independent assurance to Nestlé SA (Nestlé) over the Nestlé in society: Full report 2019 (‘the CSV Report’) published onthe Nestlé website (https://www.nestle. com/csv). The assurance process was conducted in line with the requirements of the AA1000 Assurance Standard (2008) Type 2 atmoderate level of assurance. The scope of Bureau Veritas’ work was limited to Nestlé’s head-office based activities where Nestlé consolidates and reconciles data provided bylocal markets/countries. The assurance was provided over all data and text included in the CSV Report and included a review of the CSV report’s alignment to GRI standards. Italso included a review of Nestlé’s UNGP (United Nations Guiding Principles) Index on human rights against the ‘Tier 1’ Assurance Indicators of the UNGP ReportingFramework. Bureau Veritas’ full assurance statement includes certain exclusions, observations of good practices, recommendations for improvement, as well as detailedassurance methodology and scope of work.
Pleaseselect
Yes AA1000AS Bureau Veritas UK Ltd. (Bureau Veritas) has provided independent assurance to Nestlé SA (Nestlé) over the Nestlé in society: Full report 2019 (‘the CSV Report’) published onthe Nestlé website (https://www.nestle. com/csv). The assurance process was conducted in line with the requirements of the AA1000 Assurance Standard (2008) Type 2 atmoderate level of assurance. The scope of Bureau Veritas’ work was limited to Nestlé’s head-office based activities where Nestlé consolidates and reconciles data provided bylocal markets/countries. The assurance was provided over all data and text included in the CSV Report and included a review of the CSV report’s alignment to GRI standards. Italso included a review of Nestlé’s UNGP (United Nations Guiding Principles) Index on human rights against the ‘Tier 1’ Assurance Indicators of the UNGP ReportingFramework. Bureau Veritas’ full assurance statement includes certain exclusions, observations of good practices, recommendations for improvement, as well as detailedassurance methodology and scope of work.
W6Governance
Yes AA1000AS Bureau Veritas UK Ltd. (Bureau Veritas) has provided independent assurance to Nestlé SA (Nestlé) over the Nestlé in society: Full report 2019 (‘the CSV Report’) published onthe Nestlé website (https://www.nestle. com/csv). The assurance process was conducted in line with the requirements of the AA1000 Assurance Standard (2008) Type 2 atmoderate level of assurance. The scope of Bureau Veritas’ work was limited to Nestlé’s head-office based activities where Nestlé consolidates and reconciles data provided bylocal markets/countries. The assurance was provided over all data and text included in the CSV Report and included a review of the CSV report’s alignment to GRI standards. Italso included a review of Nestlé’s UNGP (United Nations Guiding Principles) Index on human rights against the ‘Tier 1’ Assurance Indicators of the UNGP ReportingFramework. Bureau Veritas’ full assurance statement includes certain exclusions, observations of good practices, recommendations for improvement, as well as detailedassurance methodology and scope of work.
W7 Strategy Yes AA1000AS Bureau Veritas UK Ltd. (Bureau Veritas) has provided independent assurance to Nestlé SA (Nestlé) over the Nestlé in society: Full report 2019 (‘the CSV Report’) published onthe Nestlé website (https://www.nestle. com/csv). The assurance process was conducted in line with the requirements of the AA1000 Assurance Standard (2008) Type 2 atmoderate level of assurance. The scope of Bureau Veritas’ work was limited to Nestlé’s head-office based activities where Nestlé consolidates and reconciles data provided bylocal markets/countries. The assurance was provided over all data and text included in the CSV Report and included a review of the CSV report’s alignment to GRI standards. Italso included a review of Nestlé’s UNGP (United Nations Guiding Principles) Index on human rights against the ‘Tier 1’ Assurance Indicators of the UNGP ReportingFramework. Bureau Veritas’ full assurance statement includes certain exclusions, observations of good practices, recommendations for improvement, as well as detailedassurance methodology and scope of work.
W8 Targets Yes AA1000AS Bureau Veritas UK Ltd. (Bureau Veritas) has provided independent assurance to Nestlé SA (Nestlé) over the Nestlé in society: Full report 2019 (‘the CSV Report’) published onthe Nestlé website (https://www.nestle. com/csv). The assurance process was conducted in line with the requirements of the AA1000 Assurance Standard (2008) Type 2 atmoderate level of assurance. The scope of Bureau Veritas’ work was limited to Nestlé’s head-office based activities where Nestlé consolidates and reconciles data provided bylocal markets/countries. The assurance was provided over all data and text included in the CSV Report and included a review of the CSV report’s alignment to GRI standards. Italso included a review of Nestlé’s UNGP (United Nations Guiding Principles) Index on human rights against the ‘Tier 1’ Assurance Indicators of the UNGP ReportingFramework. Bureau Veritas’ full assurance statement includes certain exclusions, observations of good practices, recommendations for improvement, as well as detailedassurance methodology and scope of work.
W10. Sign off
W-FI
(W-FI) Use this field to provide any additional information or context that you feel is relevant to your organization's response. Please note that this field is optionaland is not scored.
Nothing to add, in particular.
W10.1
CDP Page of 4341

(W10.1) Provide details for the person that has signed off (approved) your CDP water response.
Job title Corresponding job category
Row 1 Global Head of Public Affairs Public affairs manager
W10.2
(W10.2) Please indicate whether your organization agrees for CDP to transfer your publicly disclosed data on your impact and risk response strategies to the CEOWater Mandate’s Water Action Hub [applies only to W2.1a (response to impacts), W4.2 and W4.2a (response to risks)].Yes
SW. Supply chain module
SW0.1
(SW0.1) What is your organization’s annual revenue for the reporting period?
Annual revenue
Row 1 92568000000
SW0.2
(SW0.2) Do you have an ISIN for your organization that you are willing to share with CDP?Yes
SW0.2a
(SW0.2a) Please share your ISIN in the table below.
ISIN country code ISIN numeric identifier (including single check digit)
Row 1 CH 0038863350
SW1.1
(SW1.1) Could any of your facilities reported in W5.1 have an impact on a requesting CDP supply chain member?This is confidential
SW1.2
(SW1.2) Are you able to provide geolocation data for your facilities?
Are you able to provide geolocation data for your facilities? Comment
Row 1 No, this is confidential data
SW2.1
(SW2.1) Please propose any mutually beneficial water-related projects you could collaborate on with specific CDP supply chain members.
SW2.2
(SW2.2) Have any water projects been implemented due to CDP supply chain member engagement?No
CDP Page of 4342

SW3.1
(SW3.1) Provide any available water intensity values for your organization’s products or services.
Product nameNescafé
Water intensity value0.7
Numerator: Water aspectOther, please specify (Water use along the value chain)
DenominatorSeveral river basins including for sourcing, manufacturing and consumption.
CommentWe conduct LCA for products from farm to end of life. Note, please that the water intensity is in liters of water equivalent per cup of coffee.
Submit your response
In which language are you submitting your response?English
Please confirm how your response should be handled by CDP
I am submitting to Public or Non-Public Submission Are you ready to submit the additional Supply Chain Questions?
I am submitting my response InvestorsCustomers
Public Yes, submit Supply Chain Questions now
Please confirm belowI have read and accept the applicable Terms
CDP Page of 4343