
Water Resources Management Plan 2019 Annex 11: Strategy ...
67
Water Resources Management Plan 2019 Annex 11: Strategy for the Eastern area December 2019 Version 1
Transcript of Water Resources Management Plan 2019 Annex 11: Strategy ...
Water Resources Management Plan 2019 Annex 11: Strategy for the Eastern area December 2019 Version 1

ii Water Resources Management Plan 2019
Annex 11: Strategy for the Eastern area
Contents
1. Executive summary ............................................................................ 4
1.1 Eastern supply area at a glance ................................................... 4
1.2 What has changed since the draft plan was submitted in November 2017? .................................................................................... 5
1.3 What is driving the changes and how do all these schemes fit together to solve it? ................................................................................ 6
1.4 Development of the strategy for the Eastern area ........................ 7
2. Real Options modelling ....................................................................... 9
2.1 ‘States of the world’ .....................................................................10
2.2 Plausible ‘futures’ modelled by branches .....................................11
2.2.1 Sustainability reductions .......................................................12
3. Development of the preferred plan ....................................................14
3.1 Policy decisions to reflect a ‘constrained’ least cost strategy .......17
3.1.1 Application of ‘Target 100’ water efficiency policy .................17
3.1.2 Application of leakage reduction policy .................................17
3.1.3 Application of drought interventions ......................................18
3.2 Influence of testing criteria on the constrained least cost strategy19
3.2.1 Environmental assessment ...................................................19
3.2.2 Regional planning .................................................................19
3.2.3 Customer preferences ...........................................................20
3.3 Other decisions to conclude development of the preferred plan ..20
4. Strategy for the WRMP (preferred plan) ............................................21
4.1 Portfolio of options selected in the strategy .................................21
4.1.1 What is driving the need for investment? ..............................21
4.1.2 Summary of strategy .............................................................22
4.1.3 Drought Permits and Orders .................................................24
4.1.4 Demand management ...........................................................25
4.1.5 Leakage reduction .................................................................27
4.1.6 Resource developments .......................................................27
4.1.7 Bulk supplies .........................................................................28
4.1.8 Enabling transfers (inter-zonal transfers) ..............................29
4.1.9 Asset enhancements .............................................................29
4.1.10 Catchment management options .......................................30
4.2 Changes from the draft strategy ..................................................32
4.3 Climate change assessment of the preferred plan.......................33

iii Water Resources Management Plan 2019
Annex 11: Strategy for the Eastern area
4.4 Greenhouse gas emissions .........................................................38
5. Sensitivity testing of the strategy .......................................................40
5.1 Results of sensitivity testing .........................................................40
5.2 Commentary on key findings from sensitivity testing ...................45
5.2.1 Alternatives if Medway WwTW water reuse scheme cannot be delivered ............................................................................................45
5.2.2 Allow deficits until 2029 .........................................................45
5.2.3 No sustainability reduction scenario ......................................45
5.2.4 Regional outcomes ...............................................................46
5.2.5 ‘Sustainable Economic Level of Leakage’ (SELL) run ...........46
5.2.6 Removing the extreme drought states of the world ...............47
5.2.7 What if there were future environmental effects? ..................47
5.3 Comparison of strategies with conventional EBSD approach ......48
5.4 Comparison of strategies with WRMP14 .....................................48
6. Summary WFD, HRA and SEA assessment .....................................50
6.1 Environmental assessment of the Eastern area strategy .............51
7. Summary of strategy and strategic alternatives .................................55
7.1 Strategic options and investigations in next 10-15 years .............55
7.2 Deliverability of the plan ...............................................................57
7.3 Regional strategy .........................................................................61
8. Resilience ..........................................................................................63
8.1 Resilience benefits our preferred plan .........................................63
8.2 Non-drought resilience .................................................................64
8.2.1 Freeze-thaw analysis ............................................................64
9. References ........................................................................................67

4 Water Resources Management Plan 2019
Annex 11: Strategy for the Eastern area
1. Executive summary
1.1 Eastern supply area at a glance
5 Water Resources Management Plan 2019
Annex 11: Strategy for the Eastern area
1.2 What has changed since the draft plan was submitted in November 2017?
The following have been taken into account in the derivation of our revised draft plan that have occurred since submitting our draft Water Resources Management Plan (WRMP):
1) HM Government published their 25 year Environmental Plan (2018);
2) The National Infrastructure Commission published a report entitled: Preparing for a drier
future (April 2018);
3) Updated WRMP guidelines were issued (July 2018);
4) Water Resources in the South East (WRSE) group publication entitled: From source to tap:
the south east strategy for water (2018);
5) Environment Agency (EA) publications entitled: The State of the Environment (2018);
6) The Global Risks Report 2018: highlighting that extreme weather reports are the highest risk
to occur;
7) Consultation on our Drought Plan (2018), and publication of the final Drought Plan (July
2019).
8) Defra letter (dated 19 March 2019) requesting further information in support of the statement
of response
9) Accompanying Defra’s letter of 19 March 2019 was the EA’s Statement of Response Review
Annex: setting out issues that the EA do not consider material to the plan, but which they feel
could improve it.
10) We responded to the 19 March 2019 Defra Letter on 14 June 2019 and published an
Addendum to our Statement of Response providing further information and addressing some
issues in the Annex to the Defra letter
11) We received permission to publish our WRMP in a letter from Defra dated 4 November 2019.
We have also been consulting with the public and our customers (over 3000) to understand what they liked and didn’t like about our plan. The consultation responses and the publications have all been reflected in our final WRMP; consequently, we have made some changes to our preferred plan from the draft WRMP. These key changes are:
1) Stronger leakage reduction targets: We have adopted a targeted reduction in leakage of
15% by 2025; 40% by 2040 and 50% by 2050. These targets reflect the challenge set by
Ofwat, which was also reflected in the 25 year Environmental Plan, and the NIC report;
2) Raising Bewl Water by 400mm has been removed from the preferred plan, but remains a
strategic alternative if one of the other schemes cannot be delivered.
But we kept:
1) Target 100: our water efficiency programme of work to help customers save water and
money has been improved but the overall goal remains the same;
2) The interim use of Drought Permits and Orders in the Eastern area, as set out in our
Drought Plan, to meet our supply duties during drought conditions;
3) Catchment management in Kent to improve the quality of the water in the rivers and aquifers
we abstract water from. We are also looking to improve the habitats along some of the rivers
in Kent as part of our Catchment First approach to help improve their resilience to drought;
6 Water Resources Management Plan 2019
Annex 11: Strategy for the Eastern area
4) The 18Ml/d Medway WwTW water reuse scheme in AMP8, although South East Water no
longer need a share of this;
5) Develop the infrastructure to allow the full capacity of the existing transfer main from
Faversham4 to be available for transfers from Medway to Thanet in AMP8;
6) The small bulk supply from South East Water to Kent Thanet (KT) water resource zone
(WRZ) near Canterbury to provide additional supplies to our customers;
7) The abstraction licence variation for our West Sandwich and Sandwich sources.
8) Development of additional nitrate treatment at some of our sources in Thanet to safeguard
water quality.
1.3 What is driving the changes and how do all these schemes fit together to solve it?
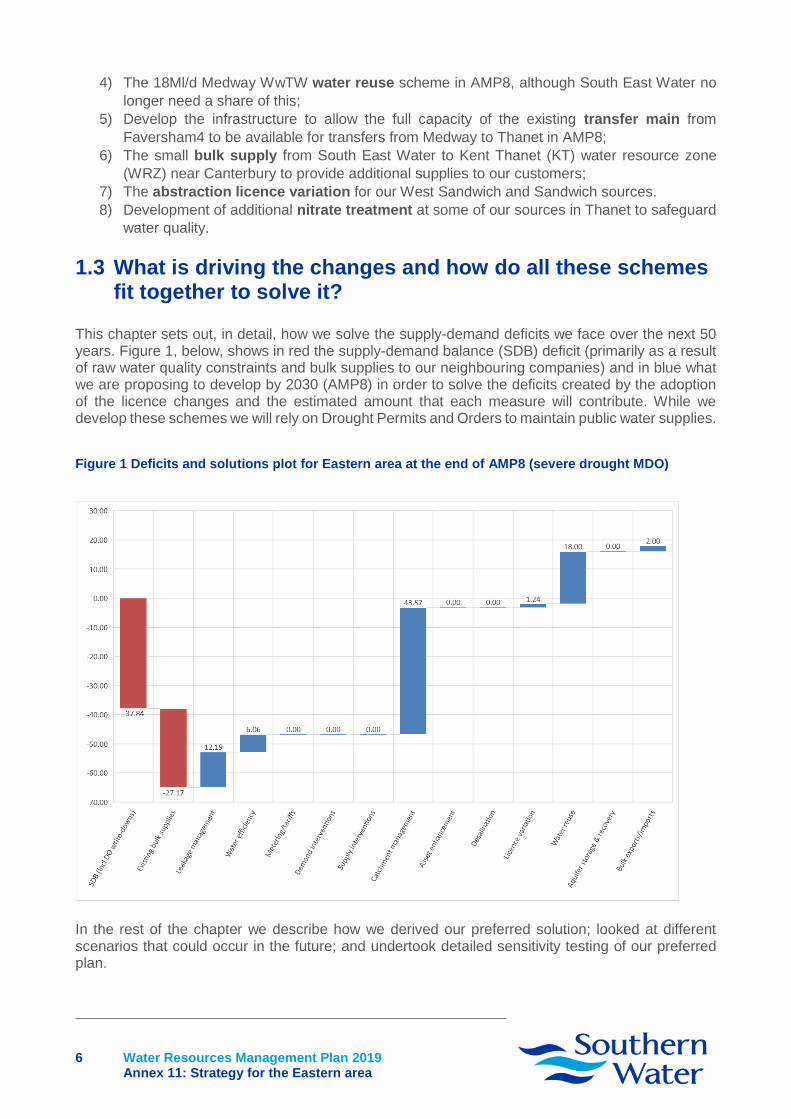
This chapter sets out, in detail, how we solve the supply-demand deficits we face over the next 50 years. Figure 1, below, shows in red the supply-demand balance (SDB) deficit (primarily as a result of raw water quality constraints and bulk supplies to our neighbouring companies) and in blue what we are proposing to develop by 2030 (AMP8) in order to solve the deficits created by the adoption of the licence changes and the estimated amount that each measure will contribute. While we develop these schemes we will rely on Drought Permits and Orders to maintain public water supplies.
In the rest of the chapter we describe how we derived our preferred solution; looked at different scenarios that could occur in the future; and undertook detailed sensitivity testing of our preferred plan.
Figure 1 Deficits and solutions plot for Eastern area at the end of AMP8 (severe drought MDO)

7 Water Resources Management Plan 2019
Annex 11: Strategy for the Eastern area
1.4 Development of the strategy for the Eastern area To understand the impact of future uncertainties we have derived the future strategy using a Real
Options approach to inform the decision making for our strategy. This approach solves the supply-
demand deficits simultaneously for seven different ‘states of the world’ (which represent a snapshot
of different climatic conditions and intra-annual pressures on water resources) across five different
‘futures’ or ‘branches’ (which represent a plausible set of future SDBs for a range of possible future
scenarios for which different solutions may be appropriate or necessary).
The use of different futures in the Real Options approach effectively recognises that the future is not
certain, and so the method tries to identify how solutions may change through time in the face of
different possible future water resource pressures, and also identifies a common set of ‘no regrets’
options in the short term which should be developed regardless of which future may materialise.
These uncertain futures are a key reason why we have adopted the Real Options approach – so that
key schemes and alternatives which address these uncertainties can be investigated and progressed
in parallel to the preferred plan. Should the magnitude of the future uncertainties be less severe,
then some of the schemes would not need to proceed past feasible investigation and planning /
promotion stages. However, the company has little choice but to conduct these investigations of
alternative and preferred schemes through AMP7 (and AMP8), given the scale of uncertainties the
company faces in the next 10 years.
An initial ‘least cost’ run was undertaken to develop a ‘basic solution’, without further consideration
of potential constraints. This was then tested by modifying assumptions about the availability of
certain options to progress our understanding of the impacts these assumptions might have on the
strategy. From examination of the various model run outputs, and taking into account the pre-
consultation discussions with regulators and stakeholders, consultation representations, and policy
decisions, refinements were introduced to reflect a ‘constrained’ least cost strategy.
The constrained least cost strategy was then examined and tested against environmental criteria,
outcomes from regional planning exercises (WRSE), and the preferences arising from customer
engagement activity. Following this review, any refined decisions on the feasible options were fed
into the Real Options model to derive the strategy for this plan.
The strategy was then subjected to scenario and sensitivity testing to understand what alternative
strategic schemes may be needed, should it not be possible to implement the schemes in the
preferred plan. This is particularly important for those schemes in the strategy that are required early
in the planning period, in AMP7 or AMP8.
The strategy included the selection of the Medway WwTW water reuse option (with Southern Water
receiving all of the benefits of this scheme), and the position that there would not be any additional
bulk supplies to South East Water. This has been confirmed in discussions between the companies;
that the Medway WwTW water reuse scheme was not needed by South East Water as a shared
scheme.
The key strategic schemes selected for the next 10-15 years are:
◼ The 18Ml/d Medway WwTW water reuse scheme in AMP8
◼ Develop the infrastructure to allow the full capacity of the existing Faversham4 transfer
main to be available for transfers from Medway to Thanet in AMP8
◼ The small bulk supply from South East Water to KT WRZ near Canterbury in AMP8
◼ Commence discussions with the EA about a licence variation for the West Sandwich and
Sandwich sources
8 Water Resources Management Plan 2019
Annex 11: Strategy for the Eastern area
◼ Develop additional nitrate treatment at identified sources and implement as early as possible
catchment management activity at these sources over AMP7 and AMP8
◼ Develop treatment for pesticides for the River Medway scheme, which is potentially at risk
and implement catchment management activity at this source in time for AMP8
◼ ‘Target 100’ water efficiency activity that aims to reduce per capita consumption (PCC) to
100litres per day by 2040, commencing at the start of AMP7
◼ Leakage reduction activity to achieve 15% reduction by the end of AMP7 and 50%
reduction by 2050
For new resource developments, it will be necessary for detailed engineering and environmental
assessments to be undertaken, for planning and other consents to be secured and for the schemes
to be constructed and commissioned. For transfers from other water companies there may be a need
for asset enhancements, and/or for the development of new water resources within those companies
in order to free up water to make the transfer available. The timings within this plan are our best
estimates for delivery at this point in time.
If the future turns out to have limited demand growth, limited climate change impacts and/or limited
sustainability reductions – reflecting a future SDB like those modelled in the 70th or 90th percentile
branches – then a number of the preferred plan options may not be required.
As we prepare for our next plan, it may be possible to confirm that the implementation of some of
the AMP8 options will not actually be required. However, the timescales are such that we will need
to have done much of the feasibility and environmental investigations and the preparation of planning
documentation in AMP7 (before it can be confirmed whether the schemes are necessary) even if the
scheme is not ultimately needed in AMP8.
9 Water Resources Management Plan 2019
Annex 11: Strategy for the Eastern area
2. Real Options modelling We have developed an economic least cost model (the ‘investment model’) to help select the
combination of options – the portfolio of options – to ensure that there are always enough supplies
available to meet anticipated demands in all water resource zones (WRZs) under every planning
scenario or design condition, throughout the planning period.
Separate investment models have been developed for each of the three supply areas (Western,
Central and Eastern), which are geographically separate (with each supply area consisting of
between three and seven WRZs). Although the building blocks for the strategy are the individual
WRZs, there are inter-connections (either current or potential) between them, and thus interventions
in one WRZ can have an impact on other inter-connected WRZs within that supply area. The model
must take account of the supply-demand balances (SDBs) each planning scenario, including
transfers and bulk supplies, in all the WRZs in each supply area at the same time in order to develop
a consistent solution for the supply area.
Annex 8 describes the rationale and approach for selecting and using a Real Options modelling
approach to support the decision making for this plan. It is important to review this Annex, which
explains the development of the strategy for the Eastern area, alongside Annex 8 (which provides
more detail about the Real Options modelling process).
There are two key aspects of the Real Options investment model:
◼ ‘States of the world’: which represent a snapshot of different climatic conditions and intra-
annual pressures on water resources, from normal year through to severe and extreme
droughts, and looking at periods when water supplies are at their minimum, and at periods
of peak demand for water during summer months
◼ Different possible ‘futures’ modelled by different ‘branches’: these represent a plausible
set of future SDBs for a range of possible future scenarios, for which different solutions may
be needed
This approach solves the supply-demand deficits simultaneously for seven different ‘states of
the world’ across five different ‘branches’. The investment decisions are optimised to ensure we
can meet our target level of service across a range of drought severities at different times of the
year, whilst still considering the operation of schemes during normal climatic conditions.
The objective of our approach is to ensure that the plans cover a wide, yet appropriate, range of
futures to ensure that all the key strategic options are identified, which is particularly important where
the scale of the uncertainties is large (for example from potential ‘sustainability reductions’ of
licensed abstractions). This approach is critical because there may not otherwise be sufficient time
from when the sustainability reductions are confirmed for implementation to develop appropriate
schemes. These uncertain futures are a key reason why we have adopted the Real Options
approach – so that key schemes and alternatives which address these uncertainties can be
investigated and progressed in parallel to the preferred plan. Should the magnitude of the future
uncertainties be less severe, then some of the schemes would not need to proceed past feasible
investigation and planning / promotion stages. However, the company has little choice but to conduct
these investigations of alternative and preferred schemes through AMP7 (and AMP8), given the
scale of uncertainties the company faces in the next 10 years.
This plan is focused on solving SDBs for the period from 2020 to 2070. We have not considered
solutions needed at the end of AMP6 (2018-2019).
10 Water Resources Management Plan 2019
Annex 11: Strategy for the Eastern area
2.1 ‘States of the world’ The various states of the world, or planning scenario, allow differing drought conditions to be
considered in combination with inter-annual variability in supplies available to meet demand for
water. Each state of the world will therefore have its own SDB – i.e. its own profile of surpluses or
deficits over the planning period. The model must solve each of the states of the world
simultaneously (i.e. so that any deficit in any state of the world is solved).
Inclusion of the states of the world is useful for a number of reasons:
◼ It ensures that the plan is robust against a range of supply and demand conditions that could
be experienced in any given year across the planning horizon
◼ It allows consideration of how the water available from different options may vary in different
drought events
◼ It allows additional drought intervention options to be considered alongside the water
resources options in more extreme droughts
◼ It ensures that the costs are appropriately weighted in relation to how options are likely to be
used under each state of the world (known as utilisation – see Annex 8). Hence an option
that is only required to meet an extreme event is likely, on average, not to have significant
total variable operational costs, as it would only be required to supply water very infrequently
(note that the capital costs of the option and any fixed operational costs would still need to
be paid for regardless of how frequently the scheme may actually be used in practice – i.e.
the capex and fixed opex are independent of the utilisation)
The states of the world are related to the following climatic conditions, or design drought events
(these are described more fully in Annex 3):
◼ Normal year – 50% annual probability – relating to typical non-drought climatic conditions,
with average customer demand
◼ Drought condition – a 1 in 20 year drought, or 5% annual probability
◼ Severe drought condition – a 1 in 200 year drought, or 0.5% annual probability
◼ Extreme drought condition – a 1 in 500 year drought, or 0.2% annual probability
For each of these climatic conditions (except the normal year) there is a state of the world for each
of the annual average period and peak demand period. These are described as follows:
◼ The critical period – corresponds to the period of peak water demand, which normally
occurs during the summer months of June, July and August. The peak period of demand is
generally defined in terms of the average day peak week (ADPW) demand. The peak demand
is compared to the supplies available during that same summer period. This may also be
known as the peak-period deployable output (PDO) planning scenario
◼ The annual average period – which may also be referred to as the average deployable
output (ADO) planning scenario, particularly when talking about available supplies. This
scenario compares the average daily demand over the year against the average daily
supplies that are available over that same year
The exception to this is for the normal year, for which there is not generally a deficit. Under this
condition only the annual average period is used (not the critical period). The inclusion of the normal
year annual average state of the world is to ensure the appropriate calculation of variable costs
based on expected utilisation. We therefore have seven states of the world in total.
11 Water Resources Management Plan 2019
Annex 11: Strategy for the Eastern area
2.2 Plausible ‘futures’ modelled by branches This is a key component of a Real Options model; it effectively recognises that the future is not
certain and so it tries to identify how solutions may change through time in the face of different
possible future water resource pressures.
The futures (also referred to throughout this Annex as branches) are built up from a combination of
possible demand growth scenarios, climate change impacts on water supplies, and sustainability
reductions (changes to the licenced amount of water that a water company can abstract, with the
aim of ensuring that the abstraction does not pose an unacceptable risk to the water environment).
Annexes 2, 3, and 5 describe how the demand and supply elements have been combined to derive
the different futures.
The baseline SDB forecast is generated as a series of probability distributions from which we can
select different percentiles to represent a range of possible futures (as described in Annexes 5 and
8). These SDBs are used as the input to the Real Options decision-making model with selected
percentiles making the ‘branches’ of the Real Options model. Each of the branches is assumed to
be equally likely in the Real Options model.
The SDBs used as the ‘futures’ or ‘branches’ in the Real Options model reflect the following
percentiles:
◼ 10th percentile (larger deficits)
◼ 30th percentile
◼ 50th percentile (the middle branch – representing the more traditional SDB that would have
been investigated through a traditional investment modelling approach)
◼ 70th percentile
◼ 90th percentile (smaller deficits, or in surplus)
As the ‘futures are derived from a combination of the probability functions of the three key
uncertainties, it is not possible to identify exactly what is contributing to a given future, as
represented by one of the five percentiles. The key point is that the branches represent plausible
potential future deficits in the face of uncertainty, and we try to solve these, without needing
to know exactly what is driving the future deficit. We have purposefully not chosen the most
extreme combination of futures (which would represent the worst case for all of the drivers
combined); instead we have curtailed the selection to ‘plausible’ futures within the 10th and 90th
percentile ranges.
An example SDB plot (described more fully in Annex 5) is shown in Figure 2, which demonstrates
the range of possible supply-demand futures from which the above five branches are selected.

12 Water Resources Management Plan 2019
Annex 11: Strategy for the Eastern area
Figure 2 Example plume plot showing range of possible future SDBs
A probability is assigned to each of the potential futures or branches to represent the perceived
likelihood of that future. This probability is applied as an expected cost weighting to the total cost
calculation. For the purposes of this plan, we have assumed that each branch will have an equal
probability, because there was little information on which to base an alternative weighting scheme.
The development of the branches and their underlying assumptions and generation of the
subsequent range of SDBs (surpluses or deficits over the planning period) for each of the futures is
described in Annex 5.
2.2.1 Sustainability reductions
Table 1 below shows the potential impact of uncertain sustainability reductions within the Eastern
area. These potential sustainability reductions are incorporated with other components of uncertainty
relating to climate change impacts and demand growth to develop the SDB distribution from which
the different ‘futures’ are selected.
The key thing to note is the large scale of potential sustainability reductions that are, at present,
uncertain. These possible sustainability reductions have yet to be investigated and confirmed; this
must be undertaken in discussion with the Environment Agency (EA) and agreed as soon as possible
to allow sufficient time to design and implement the potential solutions to resolve the deficits caused
by the sustainability reductions.
Stepped increase in AMP7 due to reducing outage; reduction in 2027 due to potential sustainability reductions. Baseline net bulk exports of 27Ml/d from 2020-21 onwards.

13 Water Resources Management Plan 2019
Annex 11: Strategy for the Eastern area
Table 1 Summary of possible sustainability reductions by WRZ (in severe drought conditions)
WRZ Lower scenario Middle scenario Upper scenario
Kent Medway East None None Varies by return period
Severe MDO: 8.4Ml/d
Severe PDO: 9.7Ml/d
Kent Medway West None None Varies by return period
Severe MDO: 5.0Ml/d
Severe PDO: 5.8Ml/d
Kent Thanet None None Varies by return period
Severe MDO: 8.4Ml/d
Severe PDO: 11.4Ml/d
Sussex Hastings None None None
Eastern area total None None Varies by return period
Severe MDO: 21.8Ml/d
Severe PDO: 26.9Ml/d

14 Water Resources Management Plan 2019
Annex 11: Strategy for the Eastern area
3. Development of the preferred plan As described in Annex 8, an initial phase of scenario testing was conducted to help understand the
sensitivity of the strategy to various possible constraints. The purpose of this testing was ultimately
to inform the selection of our preferred plan.
As shown in Figure 3, an initial ‘least cost’ run was undertaken to develop a ‘basic solution’, without
further consideration of potential constraints. This was then tested by, for example, modifying
assumptions about the availability of certain options to progress our understanding of the impacts
these assumptions might have on the strategy.
From examination of the various model outputs, and taking into account our policies, business
planning decisions and pre- and post-consultation discussions with regulators and stakeholders,
policy decisions and refinements were introduced to reflect a ‘constrained’ least cost strategy.
The policy decisions were in regard to the inclusion of water efficiency assumptions, the policy of
leakage reduction (aiming to achieve a 15% reduction by 2025 and 50% reduction by 2050) and the
availability of Drought Permits / Orders in severe and extreme drought events.
Figure 3 Development of final WRMP strategy
As discussed in detail in Annex 8, the constrained least cost strategy was then examined and
tested against:
◼ Strategic Environmental Assessment (SEA) criteria
◼ Outcomes from regional planning exercises (Water Resources in the South East - WRSE)
◼ The preferences for different option types arising from customer engagement activity
Overlaying the environmental, regional planning and customer preference considerations on the
constrained least cost strategy does not necessarily mean it will need to be changed – i.e. it may
already adequately address key considerations from these criteria. Additionally, although some
schemes may score less favourably against the SEA, regional plans or customers’ preference
considerations, the non-availability of suitable, better alternatives or the size and timing of the deficit
faced may mean that some options nevertheless need to be retained in the feasible list. It is also

15 Water Resources Management Plan 2019
Annex 11: Strategy for the Eastern area
possible that these criteria could sometimes contradict each other – e.g. a scheme identified from
WRSE may not align with, say, customer preferences; in which case, the company must exercise its
judgement to weigh the pros and cons of a given scheme and the alternatives that would otherwise
be needed. This represents a process of qualitative multi-criteria assessment.
The process of testing the constrained least cost plan against the environmental, regional and
customer preferences criteria was therefore iterative. The other key element considered was the
relative impact of the changes influenced by testing against criteria in terms of the overall strategy
cost, compared to the least cost model and to the constrained least cost strategy. For example,
where there is little cost difference and the change of option provides a more positive outcome to
one or more of the testing criteria, then there is a stronger case for including the option change as
part of the strategy.
Following this review, any refined decisions on the feasibility or applicability of options was fed back
into the Real Options Appraisal model to solve the SDBs for each future to derive the strategy for
this plan.
The strategy for this was then subjected to scenario and sensitivity testing to understand what
alternative strategic schemes may be needed, should it not be possible to implement the schemes
in the preferred plan. This is particularly important for those schemes in the strategy that are required
in AMP7 or AMP8, where there may be some uncertainty around the delivery of these schemes, we
may need to conduct feasibility investigations of alternative schemes (and potentially environmental
surveys and planning activities) in parallel to developing the portfolio of schemes selected in the
preferred strategy.
The draft WRMP strategy is published for consultation with customers, stakeholders and
regulators. The responses received during consultation may result in changes to the assumptions or
inputs used to derive the SDBs, as well as to the set of options that are available to meet forecast
deficits. The development of the plan as finally presented is thus an iterative process, in which the
above decision making approach is repeated and refined in production of a revised draft WRMP and
final WRMP following consultation on the draft WRMP.
The process that we followed for the production of our WRMP is summarised below.
16 Water Resources Management Plan 2019
Annex 11: Strategy for the Eastern area
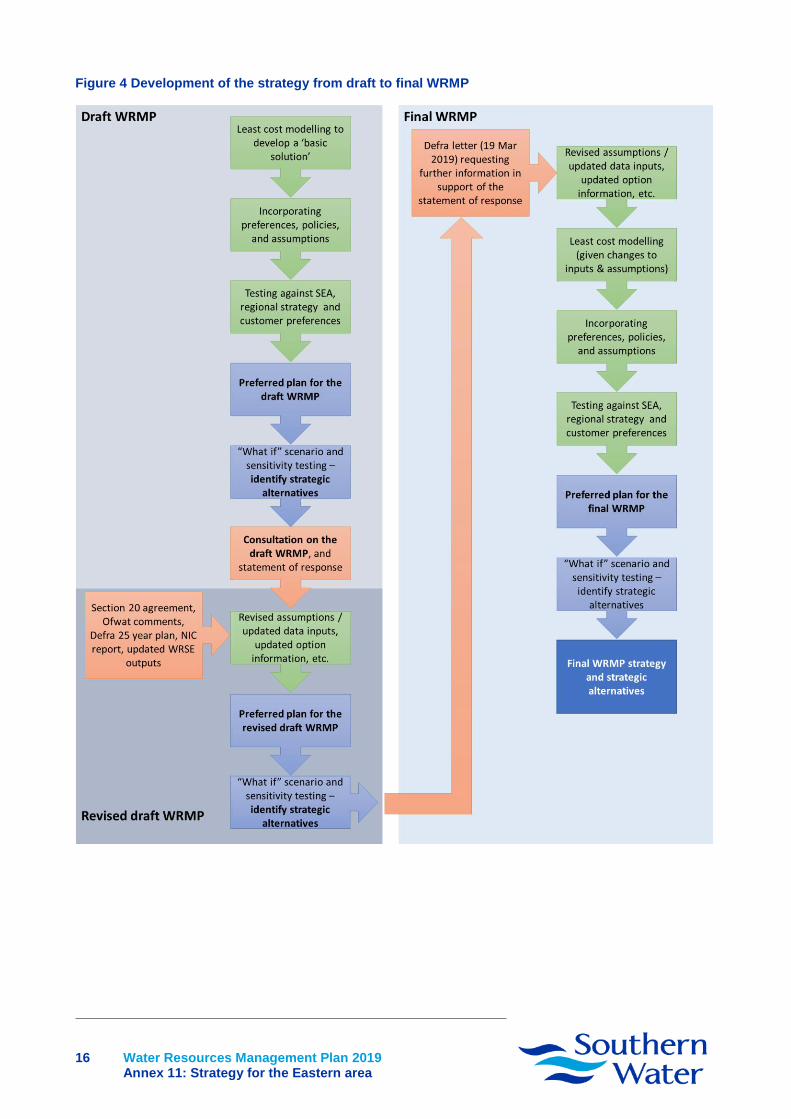
Figure 4 Development of the strategy from draft to final WRMP

17 Water Resources Management Plan 2019
Annex 11: Strategy for the Eastern area
3.1 Policy decisions to reflect a ‘constrained’ least cost strategy
3.1.1 Application of ‘Target 100’ water efficiency policy
In our draft WRMP we outlined our commitment to delivering our ‘Target 100’ water efficiency policy,
which aims to achieve a per capita consumption (PCC) of 100l/h/d by 2040 (for clarity, this relates
to average household PCC under normal year annual average conditions). This is well-aligned with
Defra’s 25 Year Environment Plan (Defra, 2018) which states that “We will work with the industry to
set an ambitious personal consumption target and agree cost effective measures to meet it”.
This policy formed a key component of the draft strategy, yet has been made more explicit in
subsequent revisions to the plan, by drawing it out from the baseline demand forecast as a costed
option. The Target 100 option developed for this WRMP supersedes many of the discrete demand
management options that were included in the draft WRMP. It now comprises a basket of measures
that Southern Water will need to adopt in order to deliver the highly ambitious reduction in PCC it is
aiming for. The details of the option are described in Annex 6.
The least cost plan did not select the ‘Target 100’ options, and so a policy decision was made that it
should form part of the preferred strategy. It was therefore ‘forced’ into the least cost model.
3.1.2 Application of leakage reduction policy
Managing leakage is an important part of our water resources strategy. A low level of leakage is
desirable, both for the environment, and because it defers the need to invest in new resources which
would otherwise be required to meet increases in demand over time. However, it is not necessarily
economic to reduce leakage to very low levels, because to do so could involve very large additional
costs for relatively small savings of water. Our approach, and that of our regulators, is to set leakage
at a level that meets the expectations of our customers and society as a whole, but is not necessarily
optimal in terms of least cost. Our draft WRMP set out a combined strategy of further active leakage
control in the short term followed by mains replacement programmes in the medium to longer term
to ensure that we continue our drive down on leakage by 15% by 2025. We have maintained this
commitment to meet Ofwat’s leakage reduction target of 15% (from current levels) by the end of the
next AMP in this revised plan. We have also now increased this commitment in the final WRMP,
following recommendations in the recently published National Infrastructure Commission (NIC)
report that companies should aim to be much more ambitious in terms of potential leakage reduction;
as a result, we have committed to meeting the aspirations of that report to achieve a 50% reduction
in leakage from current levels by 2050.
We also had developed, prior to the NIC report being issued, our own target of achieving 40%
reduction from current levels by 2040, and so we have adopted this as an interim target as part of
our leakage reduction policy.
The leakage reduction activity proposed to achieve these profiles of reductions are described more
fully in Appendix C of Annex 6.
In order to meet our new leakage targets we will require investment in new activities such as using
artificial intelligence to control pressure reduction valves to reduce leakage and bursts, and
installation of new smart meter devices to help customers both reduce demand and reduce supply
side leakage. In common with other companies we have been set very stretching efficiency
challenges by Ofwat to deliver all AMP7 targets, but we are committed to making a material reduction
in leakage
The least cost plan was allowed to select from the wide range of leakage options without any
constraint (e.g. around how much leakage activity could be delivered in any one year). Under the
18 Water Resources Management Plan 2019
Annex 11: Strategy for the Eastern area
least cost model runs, relatively large amounts of leakage were being selected in the first year of
AMP7 to address a deficit in that year, but further reductions were then not required until 2027.
We have adopted a policy decision that the leakage profile described above should form part of the
preferred strategy. It was therefore ‘forced’ into the least cost model to ensure that 15% reduction is
achieved by 2025, and 50% by 2050.
3.1.3 Application of drought interventions
Section 39B(2) of the Water Industry Act, requires the company when planning for drought, to plan
to supply adequate quantities of wholesome water, with as little recourse as reasonably possible to
drought orders or drought permits. In ensuring compliance with this, previous Water Resource
Planning Guidance (WRPG) only required planning to be based on the worst historic event and water
resource planning was not required to take into account wider severe drought conditions. The WRPG
for WRMP19 has changed to now recognise the need for resilience in a severe drought condition (a
1 in 200 year drought event). Our previous WRMP14 already planned to a severe drought (1 in 200
year drought event) without any recourse to drought permits and orders. Planning in line with the
WRPG therefore already reflects a continuation of our level of service. We have therefore
chosen our States of the World to carefully reflect the levels of service.
However, in this WRMP, we have also sought to understand the impacts of more extreme drought
events (1 in 500 year drought event), as this aligns with the latest thinking around drought resilience
(e.g. as reported in the recent National Infrastructure Commission report which highlighted the need
for increased drought resilience to reduce or minimise the significant economic impacts of ‘level 4’
drought restrictions (stand pipes and rota cuts)).
In line with our continued practice of moving water resource planning forward, we have only allowed
drought permits and orders to be selected in the investment model in an extreme drought
event (1 in 500 year drought event) so as to ensure that the WRMP can be resilient to a level in line
with guidance, in line with our levels of service and in line with the requirement to plan with as little
recourse as reasonably possible to drought orders and drought permits. It also means that the
selection does not drive excessive infrastructure; but it still allows a progressive and pragmatic
approach to exploring extreme drought events.
However, adopting this approach where we do not allow drought permits/orders in the severe
drought (1:200) condition could result in small unsolvable deficits in the short term, if there are
insufficient resources available to be developed in the short term to solve any initial deficits in the
severe drought condition without recourse to drought permits/orders. It could also result in a non-
optimal plan, where an option is only selected because of its availability early in AMP7, rather than
it being an optimal long-term option. Under the EA’s Water Resource Planning Guidelines, allowing
drought permits / orders in a 1:200 level of drought is allowed. The only constraint specified is that
companies’ plans must set out a reference level of service that would ensure resilience to a 1:200
year drought event, where resilience means only avoiding emergency drought orders that allow
restrictions such as standpipes and rota cuts. Our approach of allowing drought permits / orders in
the severe drought condition is therefore compliant with the WRP Guidelines.
A policy decision was therefore made to allow an interim period where drought permits/orders
would be used in both severe and extreme drought conditions. For the Eastern area this interim
period was until the end of AMP7. After the interim period, drought permits/orders would only
be available for selection under the extreme droughts. This compromise ensures that the target
Level of Service is met and that we continue to work to improve our resilience to drought. The model
was therefore allowed to select drought permits and orders on this basis.

19 Water Resources Management Plan 2019
Annex 11: Strategy for the Eastern area
In regard to the demand-side drought interventions, we have added a dependency to the selection
of a drought permit or order in the model, such that it must have also selected the TUBS and Non-
essential use restrictions.
It is important to recall that all the states of the world must be solved simultaneously in the Real
Options model. What we are examining when we look at both the severe and extreme states of the
world is thus the balance in the solutions between the portfolio of options needed in severe droughts
without drought interventions (except in the short term), with that same portfolio of options in
combination with drought interventions in extreme droughts. We are effectively examining whether
we have sufficient options to meet differing levels of drought when considering that drought
interventions would also be available to be used in extreme droughts. But we are also recognising
that these drought interventions may not be available in all WRZs in a supply area, and that the
connectivity between WRZs may be limited. Our analysis therefore considers the resilience of
transfers between the WRZs, and the potential need for increased connectivity.
3.2 Influence of testing criteria on the constrained least cost strategy
3.2.1 Environmental assessment
This assessment is used to address whether the combination of options and timing of the need for
them present particular risks or have planning and promotional issues that might affect the
deliverability of the scheme or schemes. It represents a second stage of the environmental screening
that is a key part of the options appraisal process, to develop a feasible set of options; however,
timing of option implementation and cumulative impacts are clearly important additional
considerations, as well as feedback from consultation responses on certain options.
For the Eastern area, the constrained least cost strategy (as previously described in the start of
section 3 and in Annex 8) was reviewed and broadly felt to align with environmental criteria. One
decision was made in relation to the development of the preferred plan due to applying environmental
assessment criteria:
◼ Nitrate catchment management schemes for sources with DO write-downs in AMP7:
Primarily for resilience purposes, but that also includes environmental resilience, the
catchment management schemes were chosen to be implemented to recover the lost DO
from sources at risk of exceeding nitrate thresholds in AMP7.
3.2.2 Regional planning
A cross-check was conducted against the outputs from the WRSE modelling scenarios along with a
review against bi-lateral discussions we have held, and continue to have, with neighbouring water
companies covering bulk supply needs and timing / need for any schemes that could be jointly
developed.
For the Eastern area, the constrained least cost strategy was reviewed and the following points were
noted in relation to the development of the preferred plan from a regional planning perspective:
◼ Net exporter in the Eastern region: we are already a net exporter in the Eastern region,
and we have committed to continuation of all bulk supplies through the planning period
◼ Additional bulk supply and / or joint scheme with South East Water: We held regular
meetings with South East Water during the pre-consultation and consultation phases of

20 Water Resources Management Plan 2019
Annex 11: Strategy for the Eastern area
developing this plan to discuss existing and potential new bulk supply and shared resource
options
South East Water confirmed that additional bulk supplies were not required by them, so they
were excluded from the strategy for this plan. South East Water also confirmed that the
Medway WwTW water reuse scheme, which could be developed as a shared scheme (hence
the benefit of the scheme accruing to Southern Water would be 50%), which was the case
for the draft plan, was not required by them. During consultation they had originally estimated
that they may need a joint scheme in the period 2045-49, but subsequently confirmed this
was not required
Note that sensitivity testing was conducted assuming that a bulk supply equivalent to 50% of
the share of the Medway WwTW water reuse scheme (and also for the same volume in PDO).
The purpose was to understand what else may be triggered if South East Water were to
change their minds for their next plan
3.2.3 Customer preferences
As discussed in Annexes 1 and 8, the company has undertaken quantitative and qualitative research
into customer preferences relevant to the WRMP. Representations were also received from
customers, stakeholders and regulators in response to the consultation on the draft WRMP.
The customer preference studies and representations, and those from the previous WRMP
(published in 2014), have informed the development of the company’s stance on appropriate levels
of service and, together with feedback from stakeholders, has helped us to understand views and
preferences on the supply and demand management options that make up our options set. It has
been applied to the development and formulation of our preferred strategy by excluding options that
were not likely to meet customer or regulator expectations in the options appraisal. Where there are
some differences in the outcomes from different customer research we have set out our proposed
way forward which either involves aligning with Government ambition, regional strategies or the
informed customer position with a provision to gain further insight to help deliver some of these
options.
For the Eastern area, the constrained least cost strategy was reviewed but no changes were
identified as being required, as the plan aligned well with customer preferences, particularly
around demand management.
3.3 Other decisions to conclude development of the preferred plan
A number of other decisions were also made to derive the preferred plan as part of the iterative and
qualitative process of reviewing and updating the constrained least cost plans.
◼ Import from South East Water to our Kent Thanet (KT) WRZ, near Canterbury: Chosen
to be implemented to provide greater resilience benefits, and the potential that this could be
scaled up where water was available from South East Water, to address local risks around,
for example, outage or freeze-thaw events
◼ Nitrate catchment management schemes for sources with DO write-downs in AMP7:
Primarily for resilience purposes, but that also includes environmental resilience, the
catchment management schemes were chosen to be implemented to recover the lost DO
from sources at risk of exceeding nitrate thresholds in AMP7
21 Water Resources Management Plan 2019
Annex 11: Strategy for the Eastern area
4. Strategy for the WRMP (preferred plan)
4.1 Portfolio of options selected in the strategy This section is structured to provide an overview on each of the key option categories from the
feasible list of options.
Our strategy is based upon an assumption that there would not be any additional supplies to
South East Water, which has been confirmed in discussions between the companies following
publication of the draft WRMP.
For new resource developments, it will be necessary for detailed engineering and environmental
assessments to be undertaken and for planning and other consents to be secured and for the
schemes to be constructed and commissioned. For transfers from other water companies there may
be a need for asset enhancements, and/or for the development of new water resources within those
companies in order to free up water to make the transfer available. The timings within this plan are
our best estimates for delivery at this point in time.
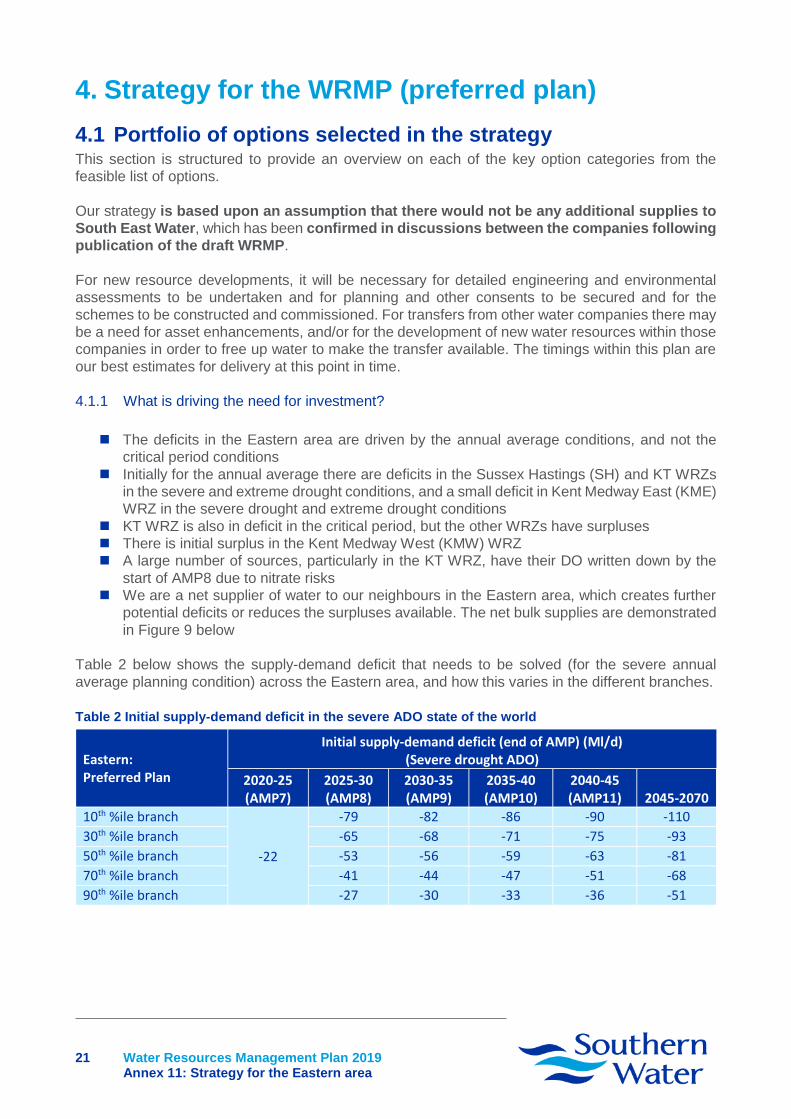
4.1.1 What is driving the need for investment?
◼ The deficits in the Eastern area are driven by the annual average conditions, and not the
critical period conditions
◼ Initially for the annual average there are deficits in the Sussex Hastings (SH) and KT WRZs
in the severe and extreme drought conditions, and a small deficit in Kent Medway East (KME)
WRZ in the severe drought and extreme drought conditions
◼ KT WRZ is also in deficit in the critical period, but the other WRZs have surpluses
◼ There is initial surplus in the Kent Medway West (KMW) WRZ
◼ A large number of sources, particularly in the KT WRZ, have their DO written down by the
start of AMP8 due to nitrate risks
◼ We are a net supplier of water to our neighbours in the Eastern area, which creates further
potential deficits or reduces the surpluses available. The net bulk supplies are demonstrated
in Figure 9 below
Table 2 below shows the supply-demand deficit that needs to be solved (for the severe annual
average planning condition) across the Eastern area, and how this varies in the different branches.
Table 2 Initial supply-demand deficit in the severe ADO state of the world
Eastern: Preferred Plan
Initial supply-demand deficit (end of AMP) (Ml/d) (Severe drought ADO)
2020-25 (AMP7)
2025-30 (AMP8)
2030-35 (AMP9)
2035-40 (AMP10)
2040-45 (AMP11) 2045-2070
10th %ile branch
-22
-79 -82 -86 -90 -110
30th %ile branch -65 -68 -71 -75 -93
50th %ile branch -53 -56 -59 -63 -81
70th %ile branch -41 -44 -47 -51 -68
90th %ile branch -27 -30 -33 -36 -51

22 Water Resources Management Plan 2019
Annex 11: Strategy for the Eastern area
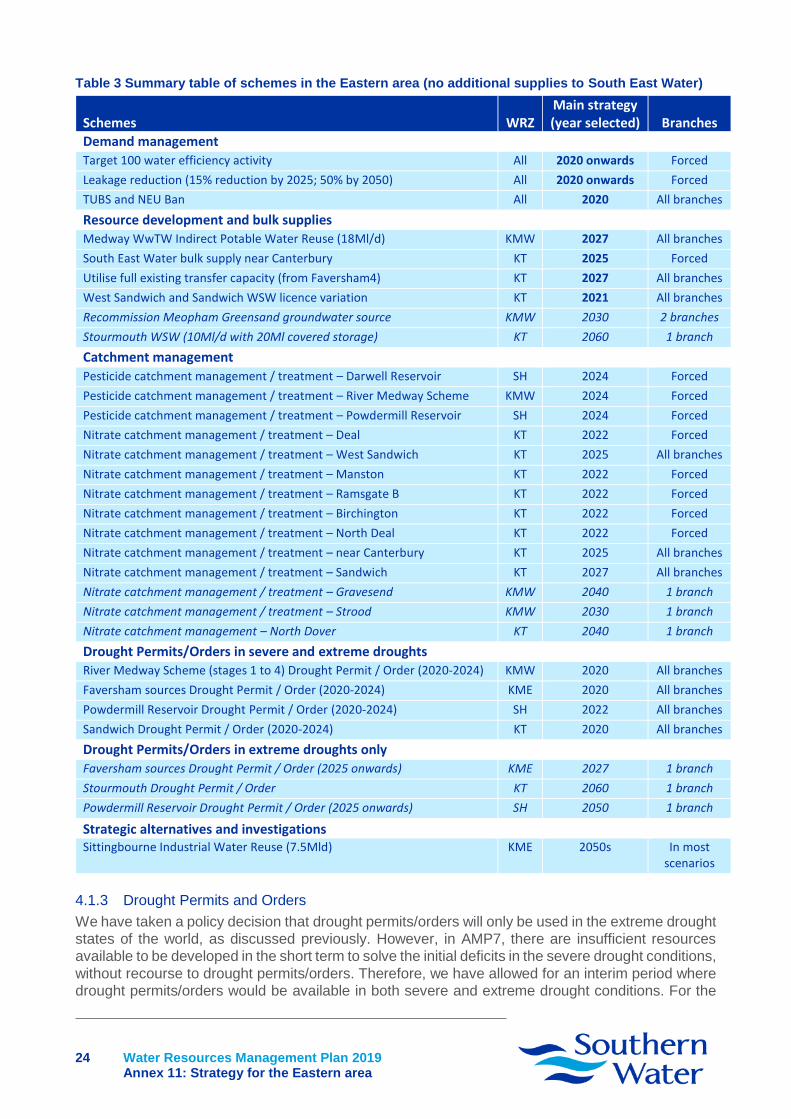
4.1.2 Summary of strategy
The cost of this strategy over the planning period, expressed in net present value terms, is around
£285m. The key elements of the strategy are:
◼ In the early part of the plan, there is a balance between implementing catchment
management (and treatment) schemes for nitrates, making use of drought permits/orders in
severe and extreme drought conditions, and savings from the Target 100 and leakage
reduction policies. (This is presented in Figure 5 below)
◼ Drought permits / orders will continue to be available as an option in extreme drought
conditions only from 2025 but these tend to be needed in the higher deficit (10th percentile)
branch only. There are permits/orders needed in AMP8 in this branch, but no further need
for their use until the 2050s
◼ We have adopted a very strong focus on demand management activity through
implementation of the Target 100 water efficiency policy, and the adoption of a leakage
reduction profile to achieve reductions from current levels of 15% by the end of AMP7, and
50% by 2050
◼ The water reuse scheme from the Medway WwTW (18Ml/d during annual average periods)
is selected and used in the higher deficit futures in the severe and extreme drought
conditions, and also in the 50th percentile in the extreme only
◼ The option to maximise the existing transfer between KME and KT WRZs through the existing
main (from Faversham4 source) is selected from 2027, although its use varies across the
branches – it is primarily used in the critical period in the 10th and 30th percentile branches to
use surplus from the Medway WRZs to support the Thanet WRZ
◼ A small bulk import from South East Water to support local demands near Canterbury is
implemented from 2025 onwards
◼ A small-scale licence variation scheme at the West Sandwich and Sandwich sources is used
in the larger deficit branches (10th and 30th percentiles) from 2021 (and in the 50th percentile
in the extreme annual average state)
The strategy is summarised below in Table 3.
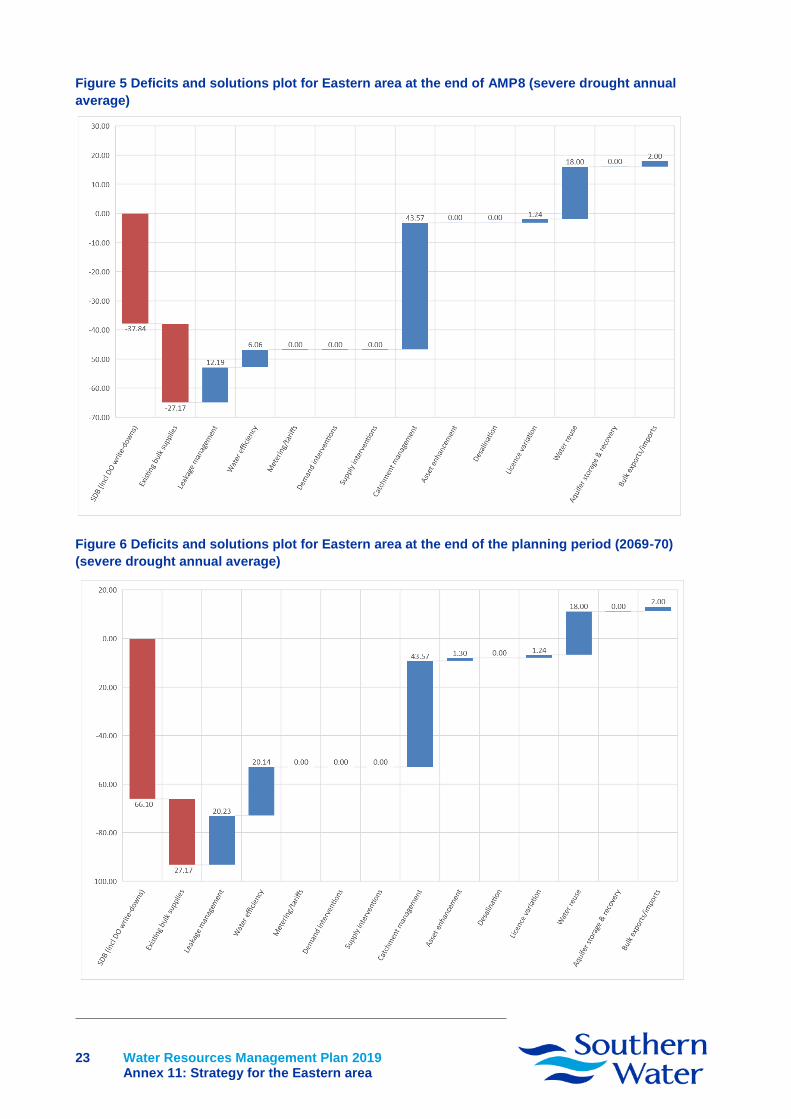
The figures below set out ‘snapshots’ of the initial SDB situation and the types of options that are
selected to address the deficits. These are presented at area level, at two time periods – the end of
AMP8 (2029-30) and at the end of the planning period (2069-70). Additionally, each branch and state
of the world will have its own solution, so for the purposes of presentation we have focused on the
severe drought condition, and also on the 30th percentile as the higher deficit branches do tend to
drive the investments needed particularly in the next 5-10 years, and so presenting this branch
seems to be most pragmatic lying between the highest deficit future and the 50th percentile future.
Note also that because these plots are presented at area level, they do not necessarily reflect the
detail for selection of all the options – for example, it may be that an option is needed to meet a
deficit in a given WRZ, for which there is otherwise limited connectivity to the rest of the supply area,
yet there may be surpluses in other WRZs. That is, the surplus/deficit at area level is not always
reflective of the driver behind the need for some options being selected.
Nevertheless, these ‘waterfall’ plots provide a useful way of presenting the deficits at key points in
time and the composition of the solution to address those deficits.
23 Water Resources Management Plan 2019
Annex 11: Strategy for the Eastern area
Figure 5 Deficits and solutions plot for Eastern area at the end of AMP8 (severe drought annual
average)
Figure 6 Deficits and solutions plot for Eastern area at the end of the planning period (2069-70)
(severe drought annual average)
24 Water Resources Management Plan 2019
Annex 11: Strategy for the Eastern area
Table 3 Summary table of schemes in the Eastern area (no additional supplies to South East Water)
Schemes WRZ Main strategy (year selected) Branches
Demand management
Target 100 water efficiency activity All 2020 onwards Forced
Leakage reduction (15% reduction by 2025; 50% by 2050) All 2020 onwards Forced
TUBS and NEU Ban All 2020 All branches
Resource development and bulk supplies Medway WwTW Indirect Potable Water Reuse (18Ml/d) KMW 2027 All branches
South East Water bulk supply near Canterbury KT 2025 Forced
Utilise full existing transfer capacity (from Faversham4) KT 2027 All branches
West Sandwich and Sandwich WSW licence variation KT 2021 All branches
Recommission Meopham Greensand groundwater source KMW 2030 2 branches
Stourmouth WSW (10Ml/d with 20Ml covered storage) KT 2060 1 branch
Catchment management
Pesticide catchment management / treatment – Darwell Reservoir SH 2024 Forced
Pesticide catchment management / treatment – River Medway Scheme KMW 2024 Forced
Pesticide catchment management / treatment – Powdermill Reservoir SH 2024 Forced
Nitrate catchment management / treatment – Deal KT 2022 Forced
Nitrate catchment management / treatment – West Sandwich KT 2025 All branches
Nitrate catchment management / treatment – Manston KT 2022 Forced
Nitrate catchment management / treatment – Ramsgate B KT 2022 Forced
Nitrate catchment management / treatment – Birchington KT 2022 Forced
Nitrate catchment management / treatment – North Deal KT 2022 Forced
Nitrate catchment management / treatment – near Canterbury KT 2025 All branches
Nitrate catchment management / treatment – Sandwich KT 2027 All branches
Nitrate catchment management / treatment – Gravesend KMW 2040 1 branch
Nitrate catchment management / treatment – Strood KMW 2030 1 branch
Nitrate catchment management – North Dover KT 2040 1 branch
Drought Permits/Orders in severe and extreme droughts River Medway Scheme (stages 1 to 4) Drought Permit / Order (2020-2024) KMW 2020 All branches
Faversham sources Drought Permit / Order (2020-2024) KME 2020 All branches
Powdermill Reservoir Drought Permit / Order (2020-2024) SH 2022 All branches
Sandwich Drought Permit / Order (2020-2024) KT 2020 All branches
Drought Permits/Orders in extreme droughts only
Faversham sources Drought Permit / Order (2025 onwards) KME 2027 1 branch
Stourmouth Drought Permit / Order KT 2060 1 branch
Powdermill Reservoir Drought Permit / Order (2025 onwards) SH 2050 1 branch
Strategic alternatives and investigations
Sittingbourne Industrial Water Reuse (7.5Mld) KME 2050s In most scenarios
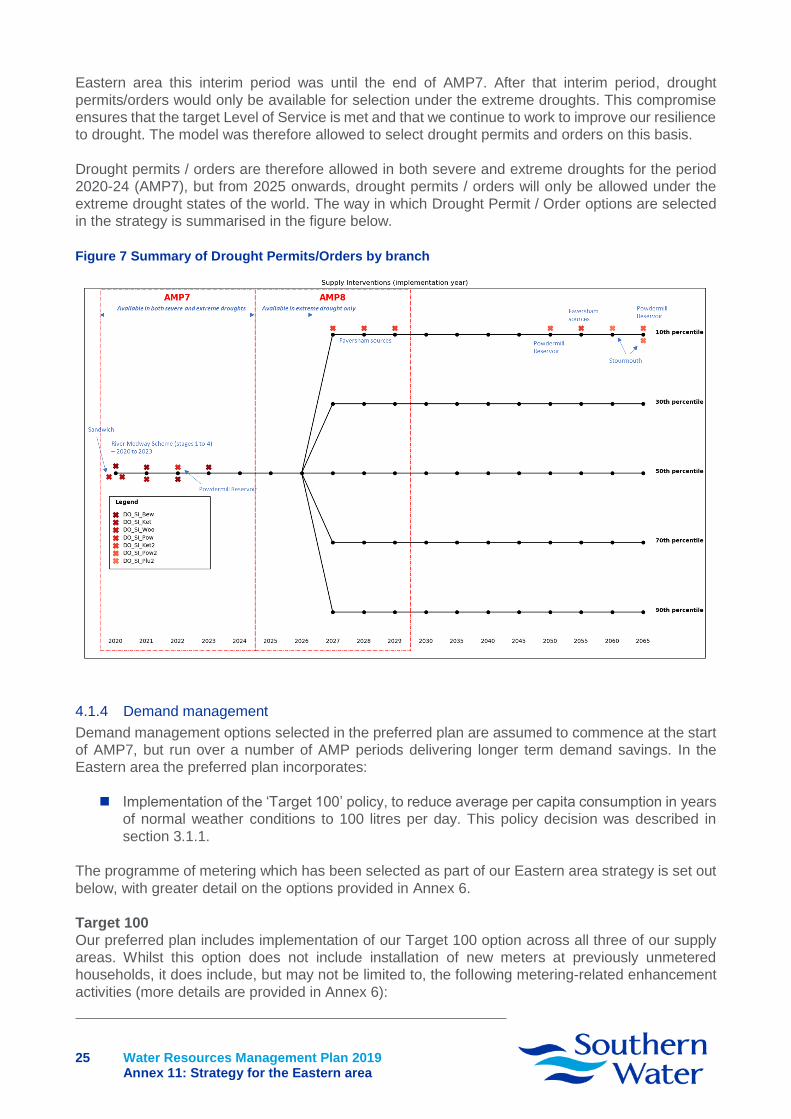
4.1.3 Drought Permits and Orders
We have taken a policy decision that drought permits/orders will only be used in the extreme drought
states of the world, as discussed previously. However, in AMP7, there are insufficient resources
available to be developed in the short term to solve the initial deficits in the severe drought conditions,
without recourse to drought permits/orders. Therefore, we have allowed for an interim period where
drought permits/orders would be available in both severe and extreme drought conditions. For the
25 Water Resources Management Plan 2019
Annex 11: Strategy for the Eastern area
Eastern area this interim period was until the end of AMP7. After that interim period, drought
permits/orders would only be available for selection under the extreme droughts. This compromise
ensures that the target Level of Service is met and that we continue to work to improve our resilience
to drought. The model was therefore allowed to select drought permits and orders on this basis.
Drought permits / orders are therefore allowed in both severe and extreme droughts for the period
2020-24 (AMP7), but from 2025 onwards, drought permits / orders will only be allowed under the
extreme drought states of the world. The way in which Drought Permit / Order options are selected
in the strategy is summarised in the figure below.
Figure 7 Summary of Drought Permits/Orders by branch
4.1.4 Demand management
Demand management options selected in the preferred plan are assumed to commence at the start
of AMP7, but run over a number of AMP periods delivering longer term demand savings. In the
Eastern area the preferred plan incorporates:
◼ Implementation of the ‘Target 100’ policy, to reduce average per capita consumption in years
of normal weather conditions to 100 litres per day. This policy decision was described in
section 3.1.1.
The programme of metering which has been selected as part of our Eastern area strategy is set out
below, with greater detail on the options provided in Annex 6.
Target 100
Our preferred plan includes implementation of our Target 100 option across all three of our supply
areas. Whilst this option does not include installation of new meters at previously unmetered
households, it does include, but may not be limited to, the following metering-related enhancement
activities (more details are provided in Annex 6):

26 Water Resources Management Plan 2019
Annex 11: Strategy for the Eastern area
◼ During AMP7: Increasing the meter reading frequency from six-monthly to monthly in all
supply areas (including replacing the 45,500 visual meter reading (VMR) meters that are
expected to remain after the end of AMP6 across the company) (detailed in Table 4)
◼ During AMP8: Company-wide smart metering roll-out, involving replacing 780,000 existing
meters (those already in place at the start of AMP7) with smart meters and installation of the
associated technology (detailed in Table 5)
◼ During AMP9: Completion of company-wide smart metering roll-out, installing 320,000 smart
meters company-wide at existing metered households by 2032 (detailed in Table 5)
These activities, and the numbers of households that will be included in each activity, are
summarised in the tables below.
Table 4 Number and cost of VMR meters that will be replaced with AMR meters during AMP7, and
cost of increasing meter reading frequency, both part of Target 100
Area WRZ VMR meter replacements
during AMP7*
Total installation
cost of VMR
meters (£k)
Total operational cost of increasing meter reading frequency from 6-monthly to monthly over 25-year
planning period (£k)
Eastern area
Kent Medway East 4,746 351 741
Kent Medway West 2,203 163 394
Kent Thanet 4,283 317 413
Sussex Hastings 2,126 157 157
Eastern area total 13,358 989 1,705
Company total 45,333 3,357 4,746
* An equal number of replacements has been assumed in each year of AMP7 within each WRZ.
Table 5 Number of smart meters that will be installed over AMP8 and AMP9 as part of Target 100
Area WRZ Number of smart meters installed
each year of AMP8 (2025-26-
2029-30)
Number of smart meters installed each
year for the first 3 years of AMP9 (2030-
31-2032-33)
Total installation
cost of smart meters (£k)
Eastern area
Kent Medway East 19,274 13,179 22,093
Kent Medway West 10,131 6,927 11,613
Kent Thanet 13,638 9,325 15,634
Sussex Hastings 7,361 5,033 8,438
Eastern area total 50,405 34,465 57,778
Company total 156,000 106,667 178,821
Meters installed at new properties
It is important to recognise that new household properties will also contribute to the levels of
household meter penetration achieved as part of our WRMP strategy, because all new properties
are metered. Table 6 below summarises the forecast number of new properties in each WRZ across
each 5-year period (AMP) over the planning period, estimated as part of our WRMP demand forecast
(details of which are provided in Annex 2).
27 Water Resources Management Plan 2019
Annex 11: Strategy for the Eastern area
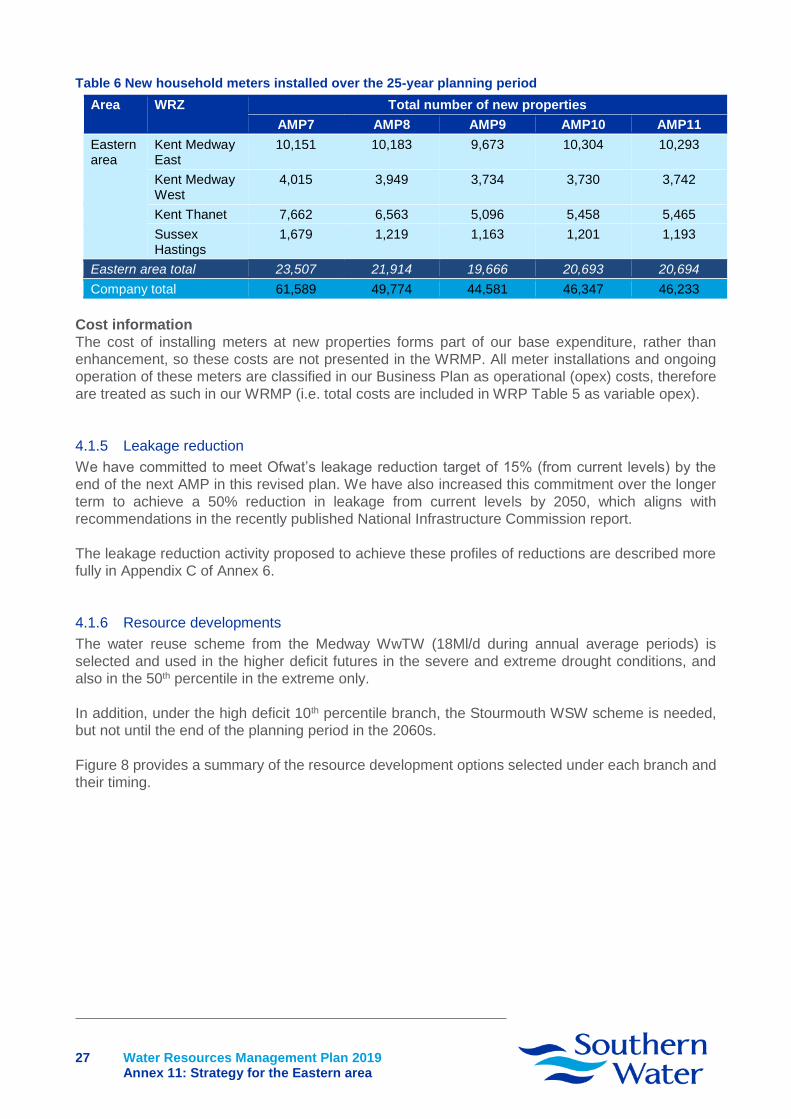
Table 6 New household meters installed over the 25-year planning period
Area WRZ Total number of new properties
AMP7 AMP8 AMP9 AMP10 AMP11
Eastern area
Kent Medway East
10,151 10,183 9,673 10,304 10,293
Kent Medway West
4,015 3,949 3,734 3,730 3,742
Kent Thanet 7,662 6,563 5,096 5,458 5,465
Sussex Hastings
1,679 1,219 1,163 1,201 1,193
Eastern area total 23,507 21,914 19,666 20,693 20,694
Company total 61,589 49,774 44,581 46,347 46,233
Cost information
The cost of installing meters at new properties forms part of our base expenditure, rather than
enhancement, so these costs are not presented in the WRMP. All meter installations and ongoing
operation of these meters are classified in our Business Plan as operational (opex) costs, therefore
are treated as such in our WRMP (i.e. total costs are included in WRP Table 5 as variable opex).
4.1.5 Leakage reduction
We have committed to meet Ofwat’s leakage reduction target of 15% (from current levels) by the
end of the next AMP in this revised plan. We have also increased this commitment over the longer
term to achieve a 50% reduction in leakage from current levels by 2050, which aligns with
recommendations in the recently published National Infrastructure Commission report.
The leakage reduction activity proposed to achieve these profiles of reductions are described more
fully in Appendix C of Annex 6.
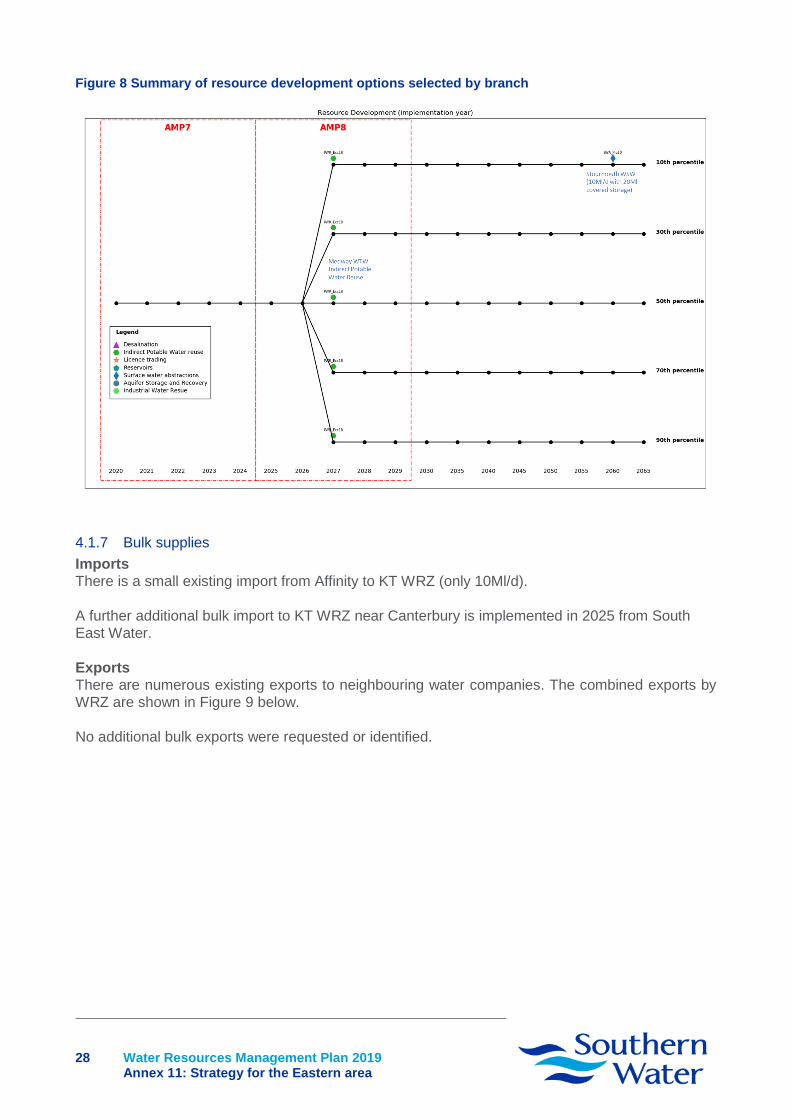
4.1.6 Resource developments
The water reuse scheme from the Medway WwTW (18Ml/d during annual average periods) is
selected and used in the higher deficit futures in the severe and extreme drought conditions, and
also in the 50th percentile in the extreme only.
In addition, under the high deficit 10th percentile branch, the Stourmouth WSW scheme is needed,
but not until the end of the planning period in the 2060s.
Figure 8 provides a summary of the resource development options selected under each branch and
their timing.
28 Water Resources Management Plan 2019
Annex 11: Strategy for the Eastern area
Figure 8 Summary of resource development options selected by branch
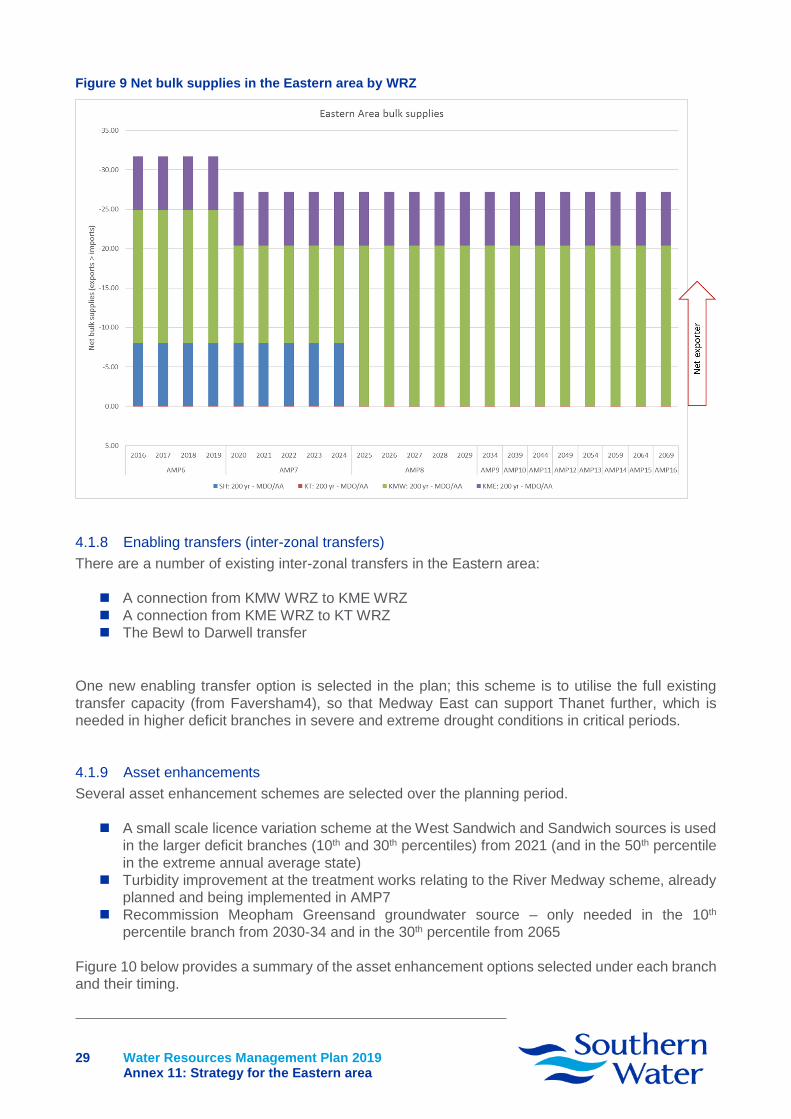
4.1.7 Bulk supplies
Imports
There is a small existing import from Affinity to KT WRZ (only 10Ml/d).
A further additional bulk import to KT WRZ near Canterbury is implemented in 2025 from South
East Water.
Exports
There are numerous existing exports to neighbouring water companies. The combined exports by
WRZ are shown in Figure 9 below.
No additional bulk exports were requested or identified.
29 Water Resources Management Plan 2019
Annex 11: Strategy for the Eastern area
Figure 9 Net bulk supplies in the Eastern area by WRZ
4.1.8 Enabling transfers (inter-zonal transfers)
There are a number of existing inter-zonal transfers in the Eastern area:
◼ A connection from KMW WRZ to KME WRZ
◼ A connection from KME WRZ to KT WRZ
◼ The Bewl to Darwell transfer
One new enabling transfer option is selected in the plan; this scheme is to utilise the full existing
transfer capacity (from Faversham4), so that Medway East can support Thanet further, which is
needed in higher deficit branches in severe and extreme drought conditions in critical periods.
4.1.9 Asset enhancements
Several asset enhancement schemes are selected over the planning period.
◼ A small scale licence variation scheme at the West Sandwich and Sandwich sources is used
in the larger deficit branches (10th and 30th percentiles) from 2021 (and in the 50th percentile
in the extreme annual average state)
◼ Turbidity improvement at the treatment works relating to the River Medway scheme, already
planned and being implemented in AMP7
◼ Recommission Meopham Greensand groundwater source – only needed in the 10th
percentile branch from 2030-34 and in the 30th percentile from 2065
Figure 10 below provides a summary of the asset enhancement options selected under each branch
and their timing.

30 Water Resources Management Plan 2019
Annex 11: Strategy for the Eastern area
Figure 10 Summary of asset enhancements selected by branch
4.1.10 Catchment management options
There are two sets of water quality-driven catchment management options in the Eastern area. The
first are options to address water quality issues associated with nitrates; while the second set
address water quality issues associated with pesticides.
The nitrate water quality issues are assumed to effect sources resulting in a deployable output (DO)
write-down, with a catchment management and treatment option that can recover that lost DO
(where it is economic to do so). The table below provides a summary of the sources at which there
has been a DO write-down to account for water quality risks from nitrates, and the year in which a
scheme is implemented to recover that lost DO by installing treatment alongside catchment
management activity.

31 Water Resources Management Plan 2019
Annex 11: Strategy for the Eastern area
Table 7 Summary of nitrate catchment management options
Source WRZ DO write-down
(year) Scheme to recover DO
(year selected)
Nitrate catchment management / treatment – Deal
KT 2022 2022
Nitrate catchment management / treatment – West Sandwich
KT 2025 2025
Nitrate catchment management / treatment – Manston
KT 2022 2022
Nitrate catchment management / treatment – Ramsgate B
KT 2022 2022
Nitrate catchment management / treatment – Birchington
KT 2022 2022
Nitrate catchment management / treatment – North Deal
KT 2022 2022
Nitrate catchment management / treatment – near Canterbury
KT 2025 2025
Nitrate catchment management / treatment – Sandwich
KT 2025 2027
Nitrate catchment management / treatment – Gravesend
KMW Base year 2040
Nitrate catchment management / treatment – Strood
KMW 2027 2030
Nitrate catchment management – North Dover
KT 2030 2040
Figure 11 provides a summary of all the catchment management options selected under each branch
and their timing.

32 Water Resources Management Plan 2019
Annex 11: Strategy for the Eastern area
Figure 11 Summary of catchment management options selected by branch
4.2 Changes from the draft strategy The draft strategy was published on 5 March 2018 and consulted on over the period 5 March to 28
May 2018.
Our final plan differs from the draft strategy in the following ways:
◼ The approach to leakage has changed significantly with a new profile being applied for this
final WRMP
◼ The incorporation of the Target 100 policy has been applied explicitly rather than as part of
the baseline demand forecast
◼ A higher export from Bewl to South East Water has been built in until 2022-23, as requested.
This was not allowed for in the draft plan
◼ West Sandwich and Sandwich WSW licence variation is utilised from 2021, in the draft plan
it was not needed until 2028, and then in 3 branches only
◼ Raising Bewl by 0.4m was selected in the draft plan in 2029, but is no longer required
◼ Medway desalination was selected in one branch in the draft strategy but is no longer
required
◼ Sandwich WTW water reuse scheme had been needed in some branches in the draft plan,
but is no longer required
◼ Sittingbourne Industrial Water Reuse was selected in a number of branches from 2045-49,
but is not in our final preferred plan. It does, however, remain an alternative scheme in
scenario and sensitivity testing
◼ The scheme to recommission Meopham Greensand groundwater source is not needed until
later than for the draft plan, and only in the high deficit branches
◼ The pesticide catchment management schemes are all implemented in 2024 in this plan

33 Water Resources Management Plan 2019
Annex 11: Strategy for the Eastern area
◼ The nitrate schemes have been revised for this plan and so the sources and timings differ
from the draft plan
What is driving the changes from the draft WRMP?
The changes to the SDB inputs from the draft plan to this final plan are presented and discussed in
detail in Annex 5. The key changes to note are:
◼ At ADO the total Eastern area SDB is lower for the final plan than the draft plan until 2026,
from which point the SDB for the final plan is higher. The lower SDB for the final plan until
2026 is predominantly driven by the higher outage forecast for KT WRZ, KMW WRZ and
KME WRZ, lower DO, higher demand forecast and lower baseline climate change gain for
KME WRZ
◼ After 2026 the higher relative SDB is driven by a lower outage forecast for KT WRZ, SH WRZ
and the net impact of a higher demand forecast, slightly lower DO, lower outage and slightly
lower sustainability reduction (in the upper scenario) impact for KMW WRZ
◼ At PDO the SDB for the final plan is lower throughout the planning horizon than for the draft
plan. This is predominantly driven by the higher outage forecast for KME WRZ, KT WRZ and
KMW WRZ (prior to 2025), lower DO in all zones and higher demand forecast in KME WRZ,
KMW WRZ and KT WRZ.
Note that a higher relative SDB means that the SDB is greater in the final plan when compared to
the draft plan, not that the revised plan is itself in surplus. Or expressed another way, a higher
relative SDB means that the deficit faced is lower compared to the draft plan.
4.3 Climate change assessment of the preferred plan A quantitative assessment of the impacts of climate change on the DOs or demand savings expected
to be obtained from each of our identified supply and demand measures has been undertaken in
accordance with section 37A(3)(b) of the Water Industry Act, 1991. The results of this assessment
are presented in the table below.
This table sets out the specific assumptions we have made when assessing the climate change
impact of each of the schemes in our preferred plan. We have also applied the following general
assumptions to all estimated climate change impacts:
◼ We have excluded our “Strategic Alternative” options from this assessment after receiving
clarification from the EA that only the preferred schemes needed to be included
◼ We have assumed and stated the full impacts of climate change to 2085 consistent with our
modelling assumptions in Annex 3
◼ We have applied the same dry, medium and wet possible future climate change scenarios
used in our Annex 3 modelling of climate change impacts for our baseline supply forecast
◼ The climate change impacts on schemes are stated in a consistent manner with our baseline
supply forecast for a severe drought (1:200) unless the option specifically states benefits
under extreme droughts (1:500) or drought conditions (1:20)
◼ Unless otherwise stated, the climate change impacts are the same for both our critical period
(PDO) and minimum or average period (MDO/ADO) states of the world. Generally, this
means that where there are no forecast impacts, a single figure of 0Ml/d is reported and
applies to all states of the world

34 Water Resources Management Plan 2019
Annex 11: Strategy for the Eastern area
Table 8 Assessment of the impacts of climate change on the strategy
Strategic Schemes Climate Change Impact (Ml/d)
Dry Scenario Mid Scenario Wet Scenario Climate change impact assessment assumptions
Demand management
Target 100 water efficiency activity
0Ml/d 0Ml/d 0Ml/d We have assumed that the benefits of demand management are not sensitive to impacts from climate change as they are dominantly controlled by behavioural or infrastructure change. The impacts of our water efficiency activities within our demand forecasts already reflect the impacts of hot, dry weather, so any additional effects of climate change are expected to be small. Therefore, in our WRMP we assume that climate change has no impact on water efficiency measures
Leakage reduction (15% reduction by 2025; 50% by 2050)
0Ml/d 0Ml/d 0Ml/d
TUBS and NEU Ban -0.7Ml/d at MDO -2.5Ml/d at PDO
0Ml/d 0Ml/d We have quantified the DO benefits of TUBs and NEU bans as a percentage of baseline DO. To determine the impacts of climate change on these DO benefits for the Dry scenario we have assumed the same percentage factors and applied those to the total area DO. For the Mid and Wet scenarios the impacts of climate change have minor water resource benefits and so we have assumed there would be no change in the DO benefit of demand restrictions.
Resource development and bulk supplies
Medway WwTW Indirect Potable Water Reuse (18Ml/d)
0Ml/d 0Ml/d 0Ml/d We have assumed that the DO benefits of water reuse are not sensitive to climate change as dependency is on wastewater availability. We have assumed there will be no change in water quality or environmental standards due to climate change that may affect our water reuse options. Abstraction from Eccles lake currently has no environmental designations or licence constraints and we have assumed that treated effluent discharge and indirect reuse at this source will not be sensitive to climate change.

35 Water Resources Management Plan 2019
Annex 11: Strategy for the Eastern area
Strategic Schemes Climate Change Impact (Ml/d)
Dry Scenario Mid Scenario Wet Scenario Climate change impact assessment assumptions
Recommission Meopham Greensand groundwater source
0Ml/d 0Ml/d 0Ml/d The scheme draws upon a deep confined aquifer and yield will be constrained by our infrastructure and abstraction licence. We consider that abstraction will not be sensitive to drought or climate change.
South East Water bulk supply near Canterbury
0Ml/d 0Ml/d 0Ml/d Impacts of climate change on the benefits of bulk supplies should be accounted for as part of the donor company’s supply assessment. We have assumed the bulk transfer will be resilient to climate change.
Utilise full existing transfer capacity (from Faversham4)
0Ml/d 0Ml/d 0Ml/d This is an infrastructure scheme and the capacity of the transfer is insensitive to climate change. We have reviewed climate change impacts based on our assessment of impacts on DO from the donor sources (Faversham3 and Faversham4). Both sources are considered insensitive to climate change as their DO presently is, and will remain, licence/infrastructure constrained under all climate scenarios.
West Sandwich and Sandwich WSW Licence Variation
-0.1Ml/d at ADO -0.2Ml/d at PDO
0Ml/d at ADO 0Ml/d at PDO
+0.2Ml/d at ADO -0Ml/d at PDO
Yield at West Sandwich and Sandwich exhibits some minor sensitivity to groundwater levels and drought. A climate change assessment for the baseline DO at both sources has already been carried out and used to inform the impact on both sources.
Stourmouth WSW (10Ml/d with 20Ml covered storage)
0Ml/d 0Ml/d 0Ml/d Yield of the scheme is dependent on discharges from a STW upstream of the abstraction point and is therefore independent of hydrology. We have assumed the scheme yield is therefore independent of climate change impacts.
Catchment management
Pesticide catchment management / treatment – River Medway Scheme
0Ml/d 0Ml/d 0Ml/d Our Catchment Management and Nitrate schemes provide an equal DO benefit to that lost due to Water Quality impacts. The impacts of climate change on the DO from individual schemes has therefore been assessed as the same as the climate change impacts on baseline DO of each source. Some measures (e.g. Pesticide options for the River Medway Scheme) do not have DO benefits and are for resilience purposes only. We have assumed there will be no climate
Nitrate catchment management / treatment – Gravesend
0Ml/d at ADO -0.04Ml/d at PDO
0Ml/d at ADO -0.04Ml/d at PDO
0Ml/d at ADO 0.1Ml/d at PDO
Nitrate catchment management / treatment – Strood
0Ml/d 0Ml/d 0Ml/d

36 Water Resources Management Plan 2019
Annex 11: Strategy for the Eastern area
Strategic Schemes Climate Change Impact (Ml/d)
Dry Scenario Mid Scenario Wet Scenario Climate change impact assessment assumptions
Nitrate catchment management / treatment – Deal
-0.7Ml/d at ADO -1Ml/d at PDO
0Ml/d at ADO 0Ml/d at PDO
+0.2Ml/d at ADO +0.2Ml/d at PDO
change impacts on these measures. Agricultural practices may change in response to climate change and there could be shifts in the patterns of nitrate / pesticide usage. Catchment management schemes would still be required, and the schemes would need to dynamically respond to such changes in practices.
Nitrate catchment management / treatment – West Sandwich
-0.1Ml/d at ADO -0.2Ml/d at PDO
0Ml/d at ADO 0Ml/d at PDO
+0.2Ml/d at ADO 0Ml/d at PDO
Nitrate catchment management / treatment – Manston
-0.8Ml/d at ADO -1.7Ml/d at PDO
-0.1Ml/d at ADO -0.3Ml/d at PDO
+0.4Ml/d at ADO 0Ml/d at PDO
Nitrate catchment management / treatment – Ramsgate B
-0.3Ml/d at ADO -0.3Ml/d at PDO
-0.03Ml/d at ADO -0.03Ml/d at PDO
+0.03Ml/d at ADO -0.Ml/d at PDO
Nitrate catchment management / treatment – Birchington
-0.4Ml/d at ADO -0.4Ml/d at PDO
-0.1Ml/d at ADO -0.1Ml/d at PDO
+0.5Ml/d at ADO +0.5Ml/d at PDO
Nitrate catchment management / treatment – North Deal
0Ml/d 0Ml/d 0Ml/d
Nitrate catchment management / treatment – near Canterbury
-4.3Ml/d at ADO -6.3Ml/d at PDO
0Ml/d at ADO +0.2Ml/d at PDO
+2.3Ml/d at ADO +0.7Ml/d at PDO
Nitrate catchment management / treatment – Sandwich
0Ml/d 0Ml/d 0Ml/d
Nitrate catchment management – North Dover
-0.1Ml/d at ADO -0.1Ml/d at PDO
0Ml/d at ADO +0Ml/d at PDO
+0.1Ml/d at ADO +0.1Ml/d at PDO
Pesticide catchment management / treatment – Darwell Reservoir
0Ml/d 0Ml/d 0Ml/d
Pesticide catchment management / treatment – Powdermill Reservoir
0Ml/d 0Ml/d 0Ml/d
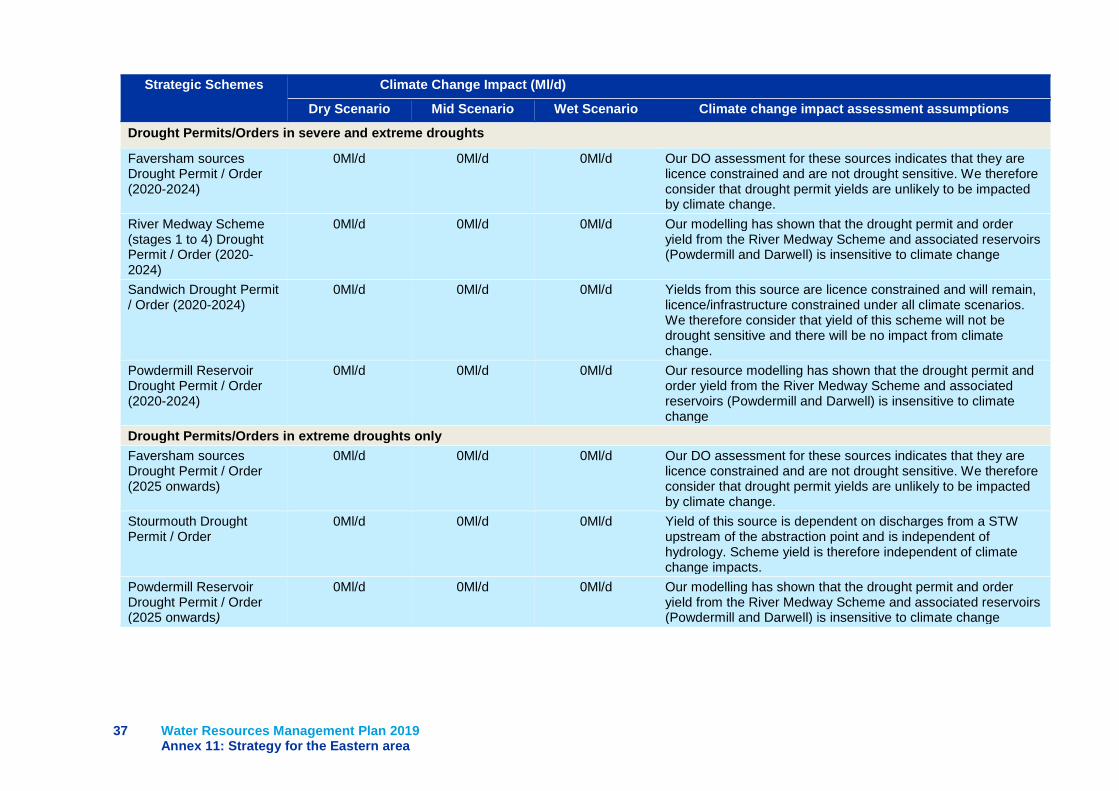
37 Water Resources Management Plan 2019
Annex 11: Strategy for the Eastern area
Strategic Schemes Climate Change Impact (Ml/d)
Dry Scenario Mid Scenario Wet Scenario Climate change impact assessment assumptions
Drought Permits/Orders in severe and extreme droughts
Faversham sources Drought Permit / Order (2020-2024)
0Ml/d 0Ml/d 0Ml/d Our DO assessment for these sources indicates that they are licence constrained and are not drought sensitive. We therefore consider that drought permit yields are unlikely to be impacted by climate change.
River Medway Scheme (stages 1 to 4) Drought Permit / Order (2020-2024)
0Ml/d 0Ml/d 0Ml/d Our modelling has shown that the drought permit and order yield from the River Medway Scheme and associated reservoirs (Powdermill and Darwell) is insensitive to climate change
Sandwich Drought Permit / Order (2020-2024)
0Ml/d 0Ml/d 0Ml/d Yields from this source are licence constrained and will remain, licence/infrastructure constrained under all climate scenarios. We therefore consider that yield of this scheme will not be drought sensitive and there will be no impact from climate change.
Powdermill Reservoir Drought Permit / Order (2020-2024)
0Ml/d 0Ml/d 0Ml/d Our resource modelling has shown that the drought permit and order yield from the River Medway Scheme and associated reservoirs (Powdermill and Darwell) is insensitive to climate change
Drought Permits/Orders in extreme droughts only
Faversham sources Drought Permit / Order (2025 onwards)
0Ml/d 0Ml/d 0Ml/d Our DO assessment for these sources indicates that they are licence constrained and are not drought sensitive. We therefore consider that drought permit yields are unlikely to be impacted by climate change.
Stourmouth Drought Permit / Order
0Ml/d 0Ml/d 0Ml/d Yield of this source is dependent on discharges from a STW upstream of the abstraction point and is independent of hydrology. Scheme yield is therefore independent of climate change impacts.
Powdermill Reservoir Drought Permit / Order (2025 onwards)
0Ml/d 0Ml/d 0Ml/d Our modelling has shown that the drought permit and order yield from the River Medway Scheme and associated reservoirs (Powdermill and Darwell) is insensitive to climate change

38 Water Resources Management Plan 2019
Annex 11: Strategy for the Eastern area
4.4 Greenhouse gas emissions The impact of the strategy on potential greenhouse gas emissions has been assessed for this plan.
The SEA (Annex 14) considers this specifically as one of the SEA objectives, as part of the overall
environmental assessment of the feasible options.
The table below presents a summary of the carbon equivalent emissions expected from the strategy.
The emission of greenhouse gases from usage of our existing sources is presented in our business
plan return to Ofwat (table WS18). For the base year (2017-18) this was 65 ktCO2e.
Table 9 Summary of carbon emissions associated with strategy for this plan
Schemes
Embodied carbon
(KgCO2e)
Operational Carbon
(KgCO2e/a)
Demand management
Target 100 water efficiency activity Negligible Negligible
Leakage reduction (15% reduction by 2025; 50% by 2050) Negligible Negligible
TUBS and NEU Ban Negligible Negligible
Resource development and bulk supplies
Medway WwTW Indirect Potable Water Reuse (18Ml/d) 3,549,000 2,818,000
South East Water bulk supply near Canterbury 427,000 165,000
Utilise full existing transfer capacity (from Faversham4) 2,095,000 2,032,000
West Sandwich and Sandwich WSW licence variation - 53,000
Recommission Meopham Greensand groundwater source 178,000 134,000
Stourmouth WSW (10Ml/d with 20Ml covered storage) 4,361,000 1,330,000
Catchment management
Pesticide catchment management / treatment – Darwell Reservoir 1,158,000 540,000
Pesticide catchment management / treatment – River Medway Scheme 999,000 1,127,000
Pesticide catchment management / treatment – Powdermill Reservoir 999,000 340,000
Nitrate catchment management / treatment – Deal 554,000 103,000
Nitrate catchment management / treatment – West Sandwich 511,000 206,000
Nitrate catchment management / treatment – Manston 825,000 72,000
Nitrate catchment management / treatment – Ramsgate B 528,000 136,000
Nitrate catchment management / treatment – Birchington 368,000 54,000
Nitrate catchment management / treatment – North Deal 415,000 114,000
Nitrate catchment management / treatment – near Canterbury 900,000 345,000
Nitrate catchment management / treatment – Sandwich 354,000 57,000
Nitrate catchment management / treatment – Gravesend 408,000 26,000
Nitrate catchment management / treatment – Strood 705,000 60,000
Nitrate catchment management – North Dover - 23,000
Drought Permits / Orders in severe and extreme droughts
River Medway Scheme (stages 1 to 4) Drought Permit / Order (2020-2024) - -
Faversham sources Drought Permit / Order (2020-2024) - -
Powdermill Reservoir Drought Permit / Order (2020-2024) - -
Sandwich Drought Permit / Order (2020-2024) - -
Drought Permits / Orders in extreme droughts only
Faversham sources Drought Permit / Order (2025 onwards) - -
39 Water Resources Management Plan 2019
Annex 11: Strategy for the Eastern area
Schemes
Embodied carbon
(KgCO2e)
Operational Carbon
(KgCO2e/a) Stourmouth Drought Permit / Order - -
Powdermill Reservoir Drought Permit / Order (2025 onwards) - -

40 Water Resources Management Plan 2019
Annex 11: Strategy for the Eastern area
5. Sensitivity testing of the strategy Having developed the strategy for this WRMP, as described above, we then carried out sensitivity
testing of the strategy.
A Real Options modelling approach already incorporates uncertainty around how different futures
may evolve and thus trigger the selection of different options. Our approach therefore already
provides some evaluation of alternatives in the strategy and therefore reduces the requirement of
sensitivity analysis to some degree (UKWIR 2016).
Nevertheless, sensitivity testing was performed on the plan. The purpose of sensitivity testing is
twofold:
◼ To ensure the plan is robust as possible in the face of uncertainties. This provides confidence
in the portfolio of schemes selected, and may also help to highlight key queries raised in the
consultation exercise on this plan
◼ To understand the range of potential alternative options if the preferred options cannot be
delivered/implemented for whatever reason. These alternative options may require feasibility
studies, investigations or planning activity to be carried out in parallel to the main portfolio of
options in the strategy, particularly where they may be needed in the next 5-10 years
We developed a range of sensitivity testing model runs to compare against the strategy. The
rationale for the sensitivity tests, and the key outputs from the modelling runs, are described below
in section 5.1. We provide additional commentary on the key findings from sensitivity testing in
section 5.2. We also provide a comparison of the preferred strategy with a conventional EBSD
approach (section 5.3) and with our previous WRMP (published in 2014) (section 5.4).
5.1 Results of sensitivity testing We have run a wide range of scenario and sensitivity tests in order to help formulate the preferred
plan for the WRMP, to test the robustness of that plan, and to identify key strategic alternatives. The
table below provides a description of the scenario and sensitivity tests undertaken and the rationale
for these.
Table 10 Summary of scenario and sensitivity tests performed
Phase Scenario Scenario description
Formulation of the
strategy for the WRMP
Least cost run An initial run to establish, with no constraints, what the least cost plan would be. This assumes that drought permits / orders are only available in extreme drought conditions (not severe ones), to test whether an interim position is needed.
Target 100 included Incorporates the policy decision to implement the Target 100 water efficiency measures throughout the supply area commencing in 2020. Maintains the assumption that drought permits / orders are only available in extreme drought conditions (not severe ones), to test whether an interim position is needed.
Target 100 and leakage profile included
As above, but in addition, it also incorporates the policy decision to implement a leakage profile which achieves 15% reduction from current leakage levels by the end of AMP7, and a reduction of 50% from current levels by 2050.
Constrained least cost plan
Initial constrained plan with the Target 100 and leakage reduction policies applied. Also includes the interim Drought Permit / Order position, whereby permits/orders are allowed in both the severe and extreme drought conditions through AMP7, but from 2025 onwards, only in the extreme drought conditions

41 Water Resources Management Plan 2019
Annex 11: Strategy for the Eastern area
Phase Scenario Scenario description
Resilience in KT An iteration of the constrained least cost plan, where a small bulk import is implemented to support KT to provide greater resilience in that part of the supply system.
Preferred plan
A further iteration of the above constrained least cost plan, in which the catchment management options were implemented for those sources at risk of exceeding nitrate limits in AMP7. This constrained plan, when reviewed against all the testing criteria, was considered to represent the Preferred Plan.
Without South East Water bulk supply near Canterbury
A test of the preferred plan to understand what would be selected if South East Water were unable to provide the small bulk supply to KT.
Additional bulk supply to South East Water from KM WRZ
A test of the preferred plan to understand how the plan may change if South East Water needed an additional bulk supply in 2045-49, which was initially part of discussions during the consultation on the WRMP, but which was then subsequently confirmed as not being required by South East Water.
No licence variation A test of the preferred plan to understand what would be selected if there was no licence variation scheme available / deliverable in the supply area
No Medway WwTW water reuse
A test of the preferred plan to understand what would be selected if the Medway WwTW water reuse scheme could not be delivered
1:500 without drought orders (NIC run)
A test of what would happen if there were no drought permits/orders available in extreme drought conditions after 2025, which represents an attempt to understand the additional investments this extra drought resilience would drive, building on the recent NIC report.
Sensitivity testing of
the preferred
plan: Testing
plan robustness
and strategic
alternatives
Accepted deficits - through to 2029
Hypothetical sensitivity test where we accept deficits for the initial part of the plan to confirm that the options selected in the strategy are not driven purely by them being available for delivery before other options - i.e. it is a test of whether the plan remains optimal. This scenario will be cheaper than the preferred plan, as the model does not need to introduce any solutions until 2029. It would also present a risk in terms of supply failures to customers, which are, in reality, unacceptable.
Outage scenario 1 A test of the preferred plan to understand what would be selected if the profile of outage was maintained at constant levels (rather than assuming activity to reduce outage over AMP7). The values are based on the draft WRMP outage assessment, rather than the revised assessment for the current plan.
Cost uncertainty of options
A test of the preferred plan to understand whether alternative schemes would be selected if the costs of schemes for which we have less confidence (i.e. those for which the company has little previous experience of implementing) are scaled proportionally higher than those schemes that we have greater cost confidence in (e.g. which the company has successfully delivered in the past).
1:1000 extreme drought
A hypothetical test of whether planning to a more extreme drought (of the order of 1:1000) with drought permits / orders available would require significant additional investments. This is a run to help us begin to understand the implications of more extreme droughts.
100% metering run A test of the preferred plan to understand what would be selected if the further metering was implemented to aim to reach 100% of household customers (noting that the technical feasibility and the costs associated with this are uncertain).
SELL run A test of the preferred plan to understand what would be selected if the model were allowed to select the combination of leakage reduction options at least cost (i.e. representing an economic level of leakage), rather than a forced profile. Note that few constraints are placed on the leakage options in terms of the amount that can be delivered in any one year.
No SR impacts The purpose of this sensitivity run is to understand how the large uncertainty on timing and particularly scale associated with the possible sustainability reductions may affect the strategy
EBSD 50th percentile
This run is to allow a comparison of our preferred plan against a conventional EBSD approach (assuming it is solving a SDB based on our 50th percentile)

42 Water Resources Management Plan 2019
Annex 11: Strategy for the Eastern area
Phase Scenario Scenario description
EBSD 10th percentile
This run is to allow a comparison of our preferred plan against a conventional EBSD approach (assuming it is solving a SDB based on our 10th percentile - i.e. higher deficit)
EBSD 90th percentile
This run is to allow a comparison of our preferred plan against a conventional EBSD approach (assuming it is solving a SDB based on our 90th percentile – i.e. lower deficit)
Branch weighting - weighted to central estimate
A test of the impact of the assumption in the real options process that all branches are equally probable, which affects the costing of plan. This one places greater emphasis on the central forecasts
Branch weighting - weighted to lower impacts
A test of the impact of the assumption in the real options process that all branches are equally probable, which affects the costing of plan. This one places greater emphasis on the lower deficit forecasts
Branch weighting - weighted to higher impacts
A test of the impact of the assumption in the real options process that all branches are equally probable, which affects the costing of plan. This one places greater emphasis on the higher deficit forecasts
Remove 1:500 states of the world
A test of the impact of solving the severe and extreme drought states of the world. The run removes the 1:500 states of the world to allow us to examine the influence that the extreme drought condition has on the preferred plan
Environmental forecasting output
A sensitivity run which assumes that there could there be additional sustainability reductions in future (over and above those assumed in the baseline SDBs in the late 2020’s), due to future environmental changes or policies
The results of the sensitivity testing are presented in the comparative table below. The cost increase
or decrease of the sensitivity test is presented in comparison to the strategy for this plan (which was
outlined in the previous section). Costs are expressed in net present value (NPV) terms (described
more fully in Annex 8). The year is the earliest year the scheme is implemented by, and a year in
brackets denotes the implementation year but that the scheme is not needed in all branches. N/a
means that a scheme is not available for selection because it has been removed from selection for
that scenario.
One key thing to note is that the options that get selected are reasonably stable in the face of
the sensitivity tests. The main changes relate to how the selected schemes are utilised, although
there are some alternative schemes that are selected.
Section 7 provides the overarching summary of the strategy, key alternatives and investigations that
we will need to focus on over the next two AMP periods.

43 Water Resources Management Plan 2019
Annex 11: Strategy for the Eastern area
Table 11 Summary of outputs from scenario and sensitivity testing
Scenario Pla
n c
ost
(N
PV
, £
M)
Co
mp
are
to
co
nst
rain
ed
leas
t
cost
(£
M)
Co
mp
are
to
pre
ferr
ed
(£
M)
De
fici
t re
mai
nin
g?
T10
0 a
nd
leak
age
re
du
ctio
n
po
licie
s
Inst
alla
tio
n o
f A
MR
me
ters
to
take
HH
me
ter
pe
ne
trat
ion
fro
m 8
8%
to
92
%
Dro
ugh
t p
erm
its/
ord
ers
avai
lab
le in
se
vere
dro
ugh
t to
20
25
Me
dw
ay W
TW I
nd
ire
ct
Po
tab
le W
ate
r R
eu
se (
18
Ml/
d)
We
st S
and
wic
h &
San
dw
ich
WSW
lice
nce
var
iati
on
SEW
bu
lk s
up
ply
ne
ar
Can
teb
ury
Uti
lise
fu
ll e
xist
ing
tran
sfe
r
cap
acit
y (f
rom
Fav
ers
ham
4)
Re
com
mis
sio
n M
eo
ph
am
Gre
en
san
d g
rou
nd
wat
er
sou
rce
Sto
urm
ou
th W
SW (
10
Ml/
d
wit
h 2
0M
l co
vere
d s
tora
ge)
Sitt
ing
bo
urn
e In
du
stri
al W
ate
r
Reu
se (
7.5
Mld
)
Riv
er T
ha
mes
des
alin
ati
on
(Th
am
es E
stu
ary
) 1
0M
l/d
Med
wa
y es
tua
ry W
TW
Ind
irec
t P
ota
ble
Wa
ter
Reu
se
(20
Ml/
d)
Ra
isin
g B
ewl b
y 0
.4m
Notes
Least cost run 213 - - Yes (In 2
WRZs)2020 (to
100%)
No 2027 2021 (2035) 2027 2027 (2030) (2055) (2045) - - Unsolvable deficit in 2020 in KMW
(23Ml/d). cost not comparable. Lots of
AMP7 leakage. Emergency desal in
2021
Target 100 included 219 - - Yes T100
only
2020 (to
100%)
No (2035) 2021 2027 (2035) 2027 - - - - - Unsolvable deficit in 2020 in KMW
(23Ml/d). Lots of leakage in AMP7.
Emergency desal in 2021
Target 100 and leakage
profile included
295 - - Yes Yes -
2020
2020 (to
100%)
No 2027 2021 2027 2027 2023 - - - - - Unsolvable deficit 2020-2023 of up to
20Ml/d in KMW
Constrained least cost plan 277 - - -Yes -
2020- Yes 2027 2021 (2035) 2027 2023 - - - - -
Drought permits/orders with interim
LoS reduction
Resilience in KT 279 2 - - Yes -
2020
- Yes 2027 2021 2025 (forced)
2027 2023 - - - - -
PREFERRED PLAN 283 6 - -Yes -
2020- Yes 2027 2021
2025 (forced)
2027 (2030) (2060) - - - - Includes all AMP7 CM schemes needed
Without SEW bulk supply near
Canterbury
281 4 -2 - Yes -
2020
- Yes 2027 2021 n/a 2027 (2030) - (2060) - - -
Additional bulk supply to SEW
from KM WRZ
284 7 1 - Yes -
2020
- Yes 2027 2021 2025 (forced)
2027 (2030) - (2050) (2060) - - Additional 9Ml/d supply to SEW in
2045-49
No licence variation 287 10 4 - Yes -
2020
- Yes 2027 n/a 2025 (forced)
2027 2023 - (2065) - - -
No Medway WTW water
reuse
315 38 32 - Yes -
2020
- Yes n/a 2021 2025 (forced)
2027 2027 - (2060) - 2027 (20Ml/d)
(2035)
1:500 without drought orders
(NIC run)
306 29 23 - Yes -
2020
- Yes 2027 2021 2025 (forced)
(2060) 2027 2027 (2055) - - - No drought permits/orders in extreme
after 2025
Accepted deficits - through to
2029
222 -55 -61 - Yes -
2020
- Yes 2029 (2030) 2025 (forced)
2029 (2030) (2060) - - - - Costs not directly comparable
Outage scenario 1 259 -18 -24 - Yes -
2020
- Yes 2027 2021 2025 (forced)
2027 (2030) (2055) (2060) - - - Scenario 1 outage is lower than
scenario 3 during AMP7
Cost uncertainty of options 326 49 43 - Yes -
2020
- Yes 2027 2021 2025 (forced)
2027 (2030) (2060) - - - -
1:1000 extreme drought 340 63 57 - Yes -
2020
- Yes 2027 2021 2025 (forced)
2025 2023 2027 - - - - Key difference is need for Stourmouth
WSW surface water scheme in AMP8
100% metering run 315 38 32 - Yes -
2020
2020 (forced to
100%)
Yes 2027 - 2025 (forced)
2027 (2030) (2065) - - - -
SELL run 151 -126 -132 - Yes -
2020
- Yes 2027 (2028) 2025 (forced)
2027 2027 - (2050) - - - Very limited leakage until end of
planning period
No SR impacts 231 -46 -52 - Yes -
2020
- Yes (2035) 2021 2025 (forced)
- (2030) - - - - -

44 Water Resources Management Plan 2019
Annex 11: Strategy for the Eastern area
Scenario Pla
n c
ost
(N
PV
, £
M)
Co
mp
are
to
co
nst
rain
ed
leas
t
cost
(£
M)
Co
mp
are
to
pre
ferr
ed
(£
M)
De
fici
t re
mai
nin
g?
T10
0 a
nd
leak
age
re
du
ctio
n
po
licie
s
Inst
alla
tio
n o
f A
MR
me
ters
to
take
HH
me
ter
pe
ne
trat
ion
fro
m 8
8%
to
92
%
Dro
ugh
t p
erm
its/
ord
ers
avai
lab
le in
se
vere
dro
ugh
t to
20
25
Me
dw
ay W
TW I
nd
ire
ct
Po
tab
le W
ate
r R
eu
se (
18
Ml/
d)
We
st S
and
wic
h &
San
dw
ich
WSW
lice
nce
var
iati
on
SEW
bu
lk s
up
ply
ne
ar
Can
teb
ury
Uti
lise
fu
ll e
xist
ing
tran
sfe
r
cap
acit
y (f
rom
Fav
ers
ham
4)
Re
com
mis
sio
n M
eo
ph
am
Gre
en
san
d g
rou
nd
wat
er
sou
rce
Sto
urm
ou
th W
SW (
10
Ml/
d
wit
h 2
0M
l co
vere
d s
tora
ge)
Sitt
ing
bo
urn
e In
du
stri
al W
ate
r
Reu
se (
7.5
Mld
)
Riv
er T
ha
mes
des
alin
ati
on
(Th
am
es E
stu
ary
) 1
0M
l/d
Med
wa
y es
tua
ry W
TW
Ind
irec
t P
ota
ble
Wa
ter
Reu
se
(20
Ml/
d)
Ra
isin
g B
ewl b
y 0
.4m
Notes
EBSD 50th percentile 228 -49 -55 - Yes -
2020
- Yes - 2021 2025 (forced)
- 2027 - - - - -
EBSD 10th percentile 311 34 28 - Yes -
2020
- Yes 2027 2021 2025 (forced)
2027 2029 (2065) - - - -
EBSD 90th percentile 217 -60 -66 - Yes -
2020
- Yes - 2021 2025 (forced)
- - - - - - -
Branch weighting - weighted
to central estimate
280 3 -3 - Yes -
2020
- Yes 2027 2021 2025 (forced)
2027 (2030) (2060) - - - - No change from preferred plan
Branch weighting - weighted
to lower impacts
279 2 -4 - Yes -
2020
- Yes 2027 2021 2025 (forced)
2027 (2030) (2060) - - - - No change from preferred plan
Branch weighting - weighted
to higher impacts
286 9 3 - Yes -
2020
- Yes 2027 2021 2025 (forced)
2027 (2030) (2060) - - - - Minor changes to CM options only
Remove 1:500 states of the
world
249 -28 -34 - Yes -
2020
- Yes 2027 (2055) 2025 (forced)
2027 (2060) - (2065) - - - Drought permit /order use is limited
compared to other model runs
Environmental forecasting
output
313 36 30 - Yes -
2020
- Yes 2027 2021 2025 (forced)
2027 2040 (2060) water
reuse
(2050) (2060)
10Ml/d
(2035) 20Ml/d
- - Water reuse scheme allowing
Stourmouth WSW 10Ml/d abstraction.
Thames desalination size varies - 1
branch requires 10Ml/d variant,
another requires the 20Ml/d variant
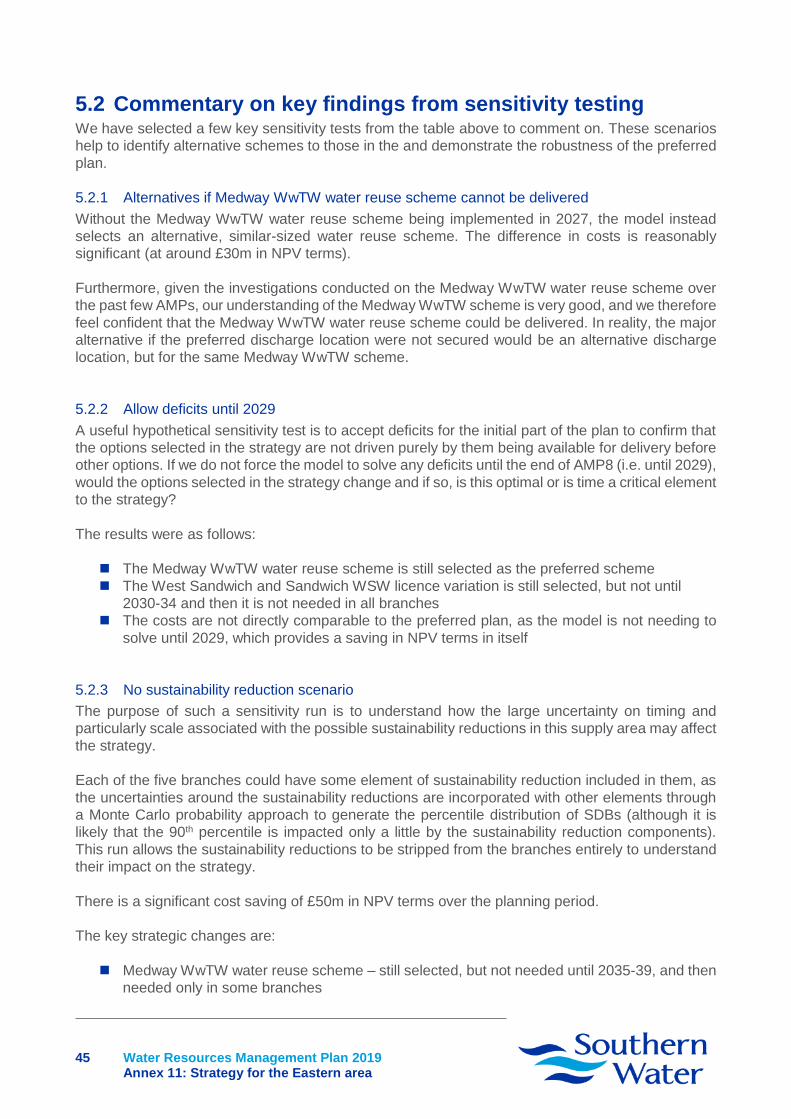
45 Water Resources Management Plan 2019
Annex 11: Strategy for the Eastern area
5.2 Commentary on key findings from sensitivity testing We have selected a few key sensitivity tests from the table above to comment on. These scenarios
help to identify alternative schemes to those in the and demonstrate the robustness of the preferred
plan.
5.2.1 Alternatives if Medway WwTW water reuse scheme cannot be delivered
Without the Medway WwTW water reuse scheme being implemented in 2027, the model instead
selects an alternative, similar-sized water reuse scheme. The difference in costs is reasonably
significant (at around £30m in NPV terms).
Furthermore, given the investigations conducted on the Medway WwTW water reuse scheme over
the past few AMPs, our understanding of the Medway WwTW scheme is very good, and we therefore
feel confident that the Medway WwTW water reuse scheme could be delivered. In reality, the major
alternative if the preferred discharge location were not secured would be an alternative discharge
location, but for the same Medway WwTW scheme.
5.2.2 Allow deficits until 2029
A useful hypothetical sensitivity test is to accept deficits for the initial part of the plan to confirm that
the options selected in the strategy are not driven purely by them being available for delivery before
other options. If we do not force the model to solve any deficits until the end of AMP8 (i.e. until 2029),
would the options selected in the strategy change and if so, is this optimal or is time a critical element
to the strategy?
The results were as follows:
◼ The Medway WwTW water reuse scheme is still selected as the preferred scheme
◼ The West Sandwich and Sandwich WSW licence variation is still selected, but not until
2030-34 and then it is not needed in all branches
◼ The costs are not directly comparable to the preferred plan, as the model is not needing to
solve until 2029, which provides a saving in NPV terms in itself
5.2.3 No sustainability reduction scenario
The purpose of such a sensitivity run is to understand how the large uncertainty on timing and
particularly scale associated with the possible sustainability reductions in this supply area may affect
the strategy.
Each of the five branches could have some element of sustainability reduction included in them, as
the uncertainties around the sustainability reductions are incorporated with other elements through
a Monte Carlo probability approach to generate the percentile distribution of SDBs (although it is
likely that the 90th percentile is impacted only a little by the sustainability reduction components).
This run allows the sustainability reductions to be stripped from the branches entirely to understand
their impact on the strategy.
There is a significant cost saving of £50m in NPV terms over the planning period.
The key strategic changes are:
◼ Medway WwTW water reuse scheme – still selected, but not needed until 2035-39, and then
needed only in some branches

46 Water Resources Management Plan 2019
Annex 11: Strategy for the Eastern area
◼ The scheme to utilise the full existing transfer capacity (from Faversham4) is no longer
required
5.2.4 Regional outcomes
We have undertaken a sensitivity run where we have assumed that an additional bulk supply (of
9Ml/d) would be provided to South East Water. We have assumed that it would be implemented in
the second half of the 2040’s, which was a timeframe that came up during initial discussions with
South East Water during consultation on the draft WRMP, but which was subsequently confirmed
as not being required.
The key change is the need for the Sittingbourne industrial water reuse scheme in 2050. But the rest
of the plan is largely unchanged.
5.2.5 ‘Sustainable Economic Level of Leakage’ (SELL) run
We have undertaken a sensitivity run in which we allowed the model to select the optimum amount
and timing of leakage reduction activity – i.e. effectively the SELL run.
However, there are a few caveats to this:
◼ The costs are significantly cheaper than the preferred plan, suggesting that the costs of the
leakage reduction policy are quite significant
◼ Very little leakage reduction was selected at all, with the exception of a small amount in 2027
to address the supply-demand changes occurring in that year
The comparison of our preferred plan leakage reduction profile to an unconstrained leakage profile
is shown in the figure below.
Figure 12 Comparison of leakage profile against range of SELL reductions

47 Water Resources Management Plan 2019
Annex 11: Strategy for the Eastern area
5.2.6 Removing the extreme drought states of the world
The purpose of this sensitivity test is to help understand the influence that the extreme drought states
of the world have on the investment needed. This will depend on the balance between deficits faced
in extreme droughts, the drought intervention options that are available, and the ability to transfer
water between WRZs to minimise deficits.
This scenario is cheaper than the preferred plan, which needs to solve the extreme drought states
of the world too. The main difference is that the West Sandwich and Sandwich WSW licence variation
scheme, would not be required until the late 2050, and the recommissioning of the Meopham
greensand groundwater source would be delayed until 2060.
5.2.7 What if there were future environmental effects?
This sensitivity run assumes that there could be additional sustainability reductions in future. These
could be over and above those assumed in our baseline SDBs in the late 2020’s – i.e. what if there
were further reductions to water available for abstraction due to future environmental changes or
policies?
We have developed a possible future environmental forecast (see Annex 4) which has been used to
estimate a future where there are further DO reductions. This to identify how this would change the
strategy and whether it would trigger significantly different options or highlight that there would not
be sufficient options available at present to solve additional possible sustainability reductions later
in the planning period?
The results suggest the need for a number of additional schemes, including desalination in 2035 in
the higher deficit 10th percentile branch, or a smaller, delayed desalination scheme in 2060 in the
30th percentile. The industrial reuse scheme is also likely to be needed in the middle and higher
deficit branches in the 2050s. A further scheme for water reuse allowing a 10Ml/d abstraction at the
Stourmouth WSW in 2060.
48 Water Resources Management Plan 2019
Annex 11: Strategy for the Eastern area
5.3 Comparison of strategies with conventional EBSD approach
Following best practice as outlined in the UKWIR decision making process guidance (2016), we have
undertaken traditional ‘Economics of Balancing Supply and Demand’ (EBSD) runs to compare
against the strategy resulting from a Real Options approach. This provides a useful benchmark
against the more advanced Real Options decision making approach. By EBSD we mean the
traditional way of solving a single SDB through the planning period, as described originally in the
Economics of balancing supply and demand guidance from UKWIR.
The ‘EBSD’ run involves using the Real Options model but with only one branch. The 50th percentile
branch has been run as this is the SDB that is used up to the ‘pre-branching point’ in 2027. We have
also run the 10th and 90th percentile branches to show how the EBSD approach of scenario testing
of high and low forecasts might also be applied and compared to the Real Options approach.
Table 11 (in section 5.1 above) presents the comparison of the Real Options model to the EBSD
approach for the 50th and for the upper 10th and lower 90th percentile branches.
In order to meet the uncertainties with different plausible futures, our plan has had to select a wider
range of options that need to be investigated and promoted, in order to meet the 22 December 2027
deadline relating particularly to the Water Framework Directive requirements, specified by the EA.
With a smaller range of more certain futures, the array of options could be reduced. This is shown
by the EBSD 50th percentile sensitivity test, and also the 90th percentile (lowest deficit branch).
However, if the uncertain sustainability reductions were to materialise, and we were to have planned
only on the basis of the conventional EBSD approach, we would not have a plausible plan to meet
and deliver those sustainability reductions in the timescale required, given that confirmation of the
sustainability reductions with the EA is unlikely until the middle of AMP7 at the earliest.
5.4 Comparison of strategies with WRMP14 It can be instructive to compare the results with the last plan that was developed in AMP5 and
published in 2014 (referred to as WRMP14).
For the current plan, we have developed a Real Options approach – so rather than considering one
future only, with some testing around uncertainties of some forecast components, this time we solve
a wide range of futures simultaneously through the use of the branches.
We are also solving for a wider range of states of the world. Previously we solved for the normal year
and a level of around 1 in 200 drought return period. This time, we are also solving for drought,
severe drought and extreme drought conditions, which equate approximately to 1 in 20, 1 in 200 and
1 in 500 year drought events, although we do allow drought permits/orders for the extreme droughts,
which were not available to the WRMP14 plan for use in the severe drought.
The strategy for WRMP14 incorporated the following elements, with commentary of similarities with
the current strategy based on the Real Options approach of solving 5 possible futures simultaneously
is presented in the table below.

49 Water Resources Management Plan 2019
Annex 11: Strategy for the Eastern area
Table 12 Comparison of final WRMP14 strategy with the current strategy
Scheme WRMP14 WRMP 19
Licence amendment for River Medway scheme
In AMP6 Is already being implemented
Licence variation at Sittingbourne In AMP6 Has already been implemented
Release locked in DO from Kent Medway
In AMP6 Has already been implemented
Medway WwTW 20Ml/d water reuse scheme
In AMP7 Selected in 2027
Licence trading scheme In AMP9 Scheme removed from revised plan due to uncertainty around deliverability
Demand management – focused on leakage activity (active leakage control) Enhanced water efficiency activity
Various Much greater water efficiency through implementation of the ‘Target 100’. Significantly greater leakage reduction applied through policy of achieving 50% reduction from current levels by 2050
Conventional and catchment management schemes to address nitrate issues
AMP6 and AMP7 Similar approach, although variation in list of sources suitable for catchment management and treatment – AMP7-AMP8. Addition of catchment management for pesticide issues
Not selected in WRMP14 n/a Utilise full existing capacity of main from Faversham4 source to K7 in 2027 South East Water small bulk import near Canterbury in early AMP8 West Sandwich and Sandwich licence variation in AMP7 Recommission Meopham greensand groundwater source in AMP9
50 Water Resources Management Plan 2019
Annex 11: Strategy for the Eastern area
6. Summary WFD, HRA and SEA assessment A detailed environmental assessment covering SEA, Habitats Regulations Assessment (HRA) and
Water Framework Directive (WFD) assessment, was carried out on a wide range of feasible options
considered for inclusion in the Eastern area strategy to help inform decision making on the final
strategy and inform development of the WRMP19. In particular, the findings of the feasible option
assessments were used to evaluate the environmental and social performance of a range of
alternative strategies for maintaining a SDB in the Eastern area, with each alternative strategy
comprising a different mix of options and option types.
For each alternative strategy, the likely scale of adverse and beneficial environmental and social
effects for each option was considered, both on its own but also in combination with the other options
included in that strategy. The potential effects in combination with any other relevant projects, plans
or programmes (for example, any planned major infrastructure schemes that may be constructed
and/or operated at the same time and affecting the same environment and/or communities) was also
assessed. This appraisal of each alternative strategy also included consideration of the potential for
any regulatory compliance risks associated with the HRA and WFD.
The environmental and social performance of each alternative strategy was used to help make
decisions on which strategies to explore further through the programme appraisal modelling process
and to finally determine the appropriate strategy for inclusion in this plan. Due to the scale of the
forecast supply deficit in the Eastern area, it was not considered feasible to remove any option from
consideration for the final strategy. All options were therefore considered and the SEA findings (along
with the HRA and WFD assessments) were actively used in reaching a decision on the WRMP
strategy. A number of alternative options and option combinations were explored in developing the
preferred strategy as well as a wide range of scenario testing model runs - the SEA, HRA and WFD
assessments were used to compare the environmental performance of these alternative combination
of options to inform and contribute to the decision-making process which also took into account other
factors including cost, resilience and customer preference information. We also took account of the
consultation responses on the draft WRMP19. This assessment and decision-making process led to
the development of our preferred strategy for the Eastern area.
There are six supply side options in our strategy including development of a strategic Medway
WwTW indirect potable water reuse scheme, an increased import of water from South East Water
and improvements to a key water transfer pipeline within the operational area. Other water supply
augmentation schemes will also be required to bring some existing licensed water sources back into
supply. Fourteen catchment management schemes have also been included in our strategy.
The ability to achieve our aim of restricting Drought Orders/Permits to extreme drought conditions
only to reduce the risk of adverse environmental effects was examined as part of developing the
strategy taking account of the costs, risks, feasibility and environmental effects of the measures
required to deliver this objective.
Drought permits/orders in the Eastern area may still be required in severe as well as extreme drought
conditions in the period up to 2024 as some of the catchment management schemes, and other
schemes, including the South East Water import are required to be delivered first alongside the
demand management options. After that, the number and frequency of drought permits/orders will
be significantly reduced even in extreme drought, with consequent reductions in the environmental
impact (in particular by removing the requirement for a River Medway Scheme Drought Permit /
Order).

51 Water Resources Management Plan 2019
Annex 11: Strategy for the Eastern area
Our strategy therefore is to make the maximum use of existing water resources alongside demand
management measures to deliver a robust and resilient water supply for customers in the Eastern
area without the need for major new water source development.
As well as the adverse effects of options, we looked at the beneficial effects to decide whether any
options should be prioritised in view of the environmental or social benefits they may bring. This led
to our decision to preferentially include in our strategy the early implementation of further measures
to reduce demand for water in the Eastern area.
◼ Reduce leakage by a further 15% by 2025 and by 50% by 2050
◼ Water efficiency activities to help our customers reduce their consumption to an average of
100 litres per head per day by 2040 (‘Target 100’ programme). This involves an intensive
media and engagement campaign as part of an initial phase of the ‘Target 100’ programme,
concentrated throughout the period 2020-2025, but helping to influence customers’ water use
behaviour over the longer term
◼ Metering of more household properties to increase meter penetration from 88% to 92% which
will support the achievement of the ‘Target 100’ programme
Once the final strategy had been determined, environmental assessment (SEA, HRA and WFD
assessment) was carried out to examine any cumulative effects from construction and/or operation.
6.1 Environmental assessment of the Eastern area strategy The SEA summary of our strategy for the Eastern area is presented in the assessment table below
(Table 13). The table shows for each scheme the adverse and beneficial effects assessment in two
separate rows. Each coloured box in the table indicates the significance of effect assessed against
the relevant SEA objective linked to the SEA topic area shown in the top row (e.g. biodiversity, flora
and fauna). The key below the table indicates the significance of effect scale. Some SEA topics have
more than one underlying SEA objective (e.g. there are four objectives linked to the SEA ‘water’
topic. The table provides an overview of the scale of adverse and beneficial effects associated with
each scheme and the strategy as a whole. Further details are provided in Annex 14 (Strategic
Environmental Assessment).
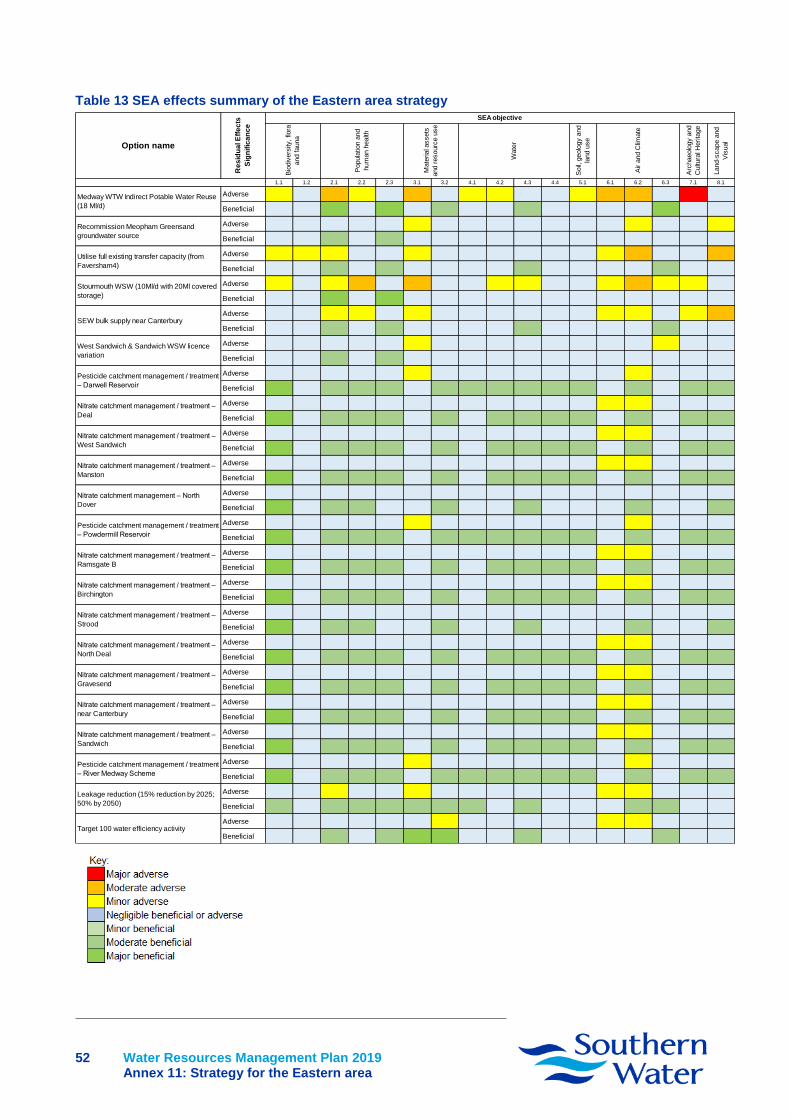
52 Water Resources Management Plan 2019
Annex 11: Strategy for the Eastern area
Table 13 SEA effects summary of the Eastern area strategy
Soil,
geolo
gy a
nd
land u
se
Arc
haeolo
gy a
nd
Cultu
ral H
erita
ge
Land-s
cape a
nd
Vis
ual
1.1 1.2 2.1 2.2 2.3 3.1 3.2 4.1 4.2 4.3 4.4 5.1 6.1 6.2 6.3 7.1 8.1
AdverseMinor
adverse
Negligible
adverse
Moderate
adverse
Minor
adverse
Negligible
adverse
Moderate
adverse
Negligible
adverse
Minor
adverse
Minor
adverse
Negligible
adverse
Negligible
adverse
Minor
adverse
Moderate
adverse
Moderate
adverse
Negligible
adverse
Major
adverse
Negligible
adverse
BeneficialNegligible
beneficial
Negligible
beneficial
Moderate
beneficial
Negligible
beneficial
Moderate
beneficial
Negligible
beneficial
Minor
beneficial
Negligible
beneficial
Negligible
beneficial
Minor
beneficial
Negligible
beneficial
Negligible
beneficial
Negligible
beneficial
Negligible
beneficial
Moderate
beneficial
Negligible
beneficial
Negligible
beneficial
AdverseNegligible
adverse
Negligible
adverse
Negligible
adverse
Negligible
adverse
Negligible
adverse
Minor
adverse
Negligible
adverse
Negligible
adverse
Negligible
adverse
Negligible
adverse
Negligible
adverse
Negligible
adverse
Negligible
adverse
Minor
adverse
Negligible
adverse
Negligible
adverse
Minor
adverse
BeneficialNegligible
beneficial
Negligible
beneficial
Minor
beneficial
Negligible
beneficial
Minor
beneficial
Negligible
beneficial
Negligible
beneficial
Negligible
beneficial
Negligible
beneficial
Negligible
beneficial
Negligible
beneficial
Negligible
beneficial
Negligible
beneficial
Negligible
beneficial
Negligible
beneficial
Negligible
beneficial
Negligible
beneficial
AdverseMinor
adverse
Minor
adverse
Minor
adverse
Negligible
adverse
Negligible
adverse
Minor
adverse
Negligible
adverse
Negligible
adverse
Negligible
adverse
Negligible
adverse
Negligible
adverse
Negligible
adverse
Minor
adverse
Moderate
adverse
Negligible
adverse
Negligible
adverse
Moderate
adverse
BeneficialNegligible
beneficial
Negligible
beneficial
Minor
beneficial
Negligible
beneficial
Minor
beneficial
Negligible
beneficial
Negligible
beneficial
Negligible
beneficial
Negligible
beneficial
Minor
beneficial
Negligible
beneficial
Negligible
beneficial
Negligible
beneficial
Negligible
beneficial
Minor
beneficial
Negligible
beneficial
Negligible
beneficial
AdverseMinor
adverse
Negligible
adverse
Minor
adverse
Moderate
adverse
Negligible
adverse
Moderate
adverse
Negligible
adverse
Negligible
adverse
Minor
adverse
Minor
adverse
Negligible
adverse
Negligible
adverse
Minor
adverse
Moderate
adverse
Minor
adverse
Minor
adverse
Negligible
adverse
BeneficialNegligible
beneficial
Negligible
beneficial
Moderate
beneficial
Negligible
beneficial
Moderate
beneficial
Negligible
beneficial
Negligible
beneficial
Negligible
beneficial
Negligible
beneficial
Negligible
beneficial
Negligible
beneficial
Negligible
beneficial
Negligible
beneficial
Negligible
beneficial
Negligible
beneficial
Negligible
beneficial
Negligible
beneficial
AdverseNegligible
adverse
Negligible
adverse
Minor
adverse
Minor
adverse
Negligible
adverse
Minor
adverse
Negligible
adverse
Negligible
adverse
Negligible
adverse
Negligible
adverse
Negligible
adverse
Negligible
adverse
Minor
adverse
Minor
adverse
Negligible
adverse
Minor
adverse
Moderate
adverse
BeneficialNegligible
beneficial
Negligible
beneficial
Minor
beneficial
Negligible
beneficial
Minor
beneficial
Negligible
beneficial
Negligible
beneficial
Negligible
beneficial
Negligible
beneficial
Minor
beneficial
Negligible
beneficial
Negligible
beneficial
Negligible
beneficial
Negligible
beneficial
Minor
beneficial
Negligible
beneficial
Negligible
beneficial
AdverseNegligible
adverse
Negligible
adverse
Negligible
adverse
Negligible
adverse
Negligible
adverse
Minor
adverse
Negligible
adverse
Negligible
adverse
Negligible
adverse
Negligible
adverse
Negligible
adverse
Negligible
adverse
Negligible
adverse
Negligible
adverse
Minor
adverse
Negligible
adverse
Negligible
adverse
BeneficialNegligible
beneficial
Negligible
beneficial
Minor
beneficial
Negligible
beneficial
Minor
beneficial
Negligible
beneficial
Negligible
beneficial
Negligible
beneficial
Negligible
beneficial
Negligible
beneficial
Negligible
beneficial
Negligible
beneficial
Negligible
beneficial
Negligible
beneficial
Negligible
beneficial
Negligible
beneficial
Negligible
beneficial
AdverseNegligible
adverse
Negligible
adverse
Negligible
adverse
Negligible
adverse
Negligible
adverse
Minor
adverse
Negligible
adverse
Negligible
adverse
Negligible
adverse
Negligible
adverse
Negligible
adverse
Negligible
adverse
Negligible
adverse
Minor
adverse
Negligible
adverse
Negligible
adverse
Negligible
adverse
BeneficialModerate
beneficial
Negligible
beneficial
Minor
beneficial
Minor
beneficial
Minor
beneficial
Negligible
beneficial
Minor
beneficial
Minor
beneficial
Minor
beneficial
Minor
beneficial
Minor
beneficial
Minor
beneficial
Negligible
beneficial
Minor
beneficial
Negligible
beneficial
Minor
beneficial
Minor
beneficial
AdverseNegligible
adverse
Negligible
adverse
Negligible
adverse
Negligible
adverse
Negligible
adverse
Negligible
adverse
Negligible
adverse
Negligible
adverse
Negligible
adverse
Negligible
adverse
Negligible
adverse
Negligible
adverse
Minor
adverse
Minor
adverse
Negligible
adverse
Negligible
adverse
Negligible
adverse
BeneficialModerate
beneficial
Negligible
beneficial
Minor
beneficial
Minor
beneficial
Minor
beneficial
Negligible
beneficial
Minor
beneficial
Negligible
beneficial
Minor
beneficial
Minor
beneficial
Minor
beneficial
Minor
beneficial
Negligible
beneficial
Minor
beneficial
Negligible
beneficial
Minor
beneficial
Minor
beneficial
AdverseNegligible
adverse
Negligible
adverse
Negligible
adverse
Negligible
adverse
Negligible
adverse
Negligible
adverse
Negligible
adverse
Negligible
adverse
Negligible
adverse
Negligible
adverse
Negligible
adverse
Negligible
adverse
Negligible
adverse
Negligible
adverse
Negligible
adverse
Negligible
adverse
Negligible
adverse
BeneficialModerate
beneficial
Negligible
beneficial
Minor
beneficial
Minor
beneficial
Negligible
beneficial
Negligible
beneficial
Minor
beneficial
Negligible
beneficial
Negligible
beneficial
Minor
beneficial
Negligible
beneficial
Negligible
beneficial
Negligible
beneficial
Minor
beneficial
Negligible
beneficial
Negligible
beneficial
Minor
beneficial
AdverseNegligible
adverse
Negligible
adverse
Negligible
adverse
Negligible
adverse
Negligible
adverse
Minor
adverse
Negligible
adverse
Negligible
adverse
Negligible
adverse
Negligible
adverse
Negligible
adverse
Negligible
adverse
Negligible
adverse
Minor
adverse
Negligible
adverse
Negligible
adverse
Negligible
adverse
BeneficialModerate
beneficial
Negligible
beneficial
Minor
beneficial
Minor
beneficial
Minor
beneficial
Negligible
beneficial
Minor
beneficial
Minor
beneficial
Minor
beneficial
Minor
beneficial
Minor
beneficial
Minor
beneficial
Negligible
beneficial
Minor
beneficial
Negligible
beneficial
Minor
beneficial
Minor
beneficial
AdverseNegligible
adverse
Negligible
adverse
Negligible
adverse
Negligible
adverse
Negligible
adverse
Negligible
adverse
Negligible
adverse
Negligible
adverse
Negligible
adverse
Negligible
adverse
Negligible
adverse
Negligible
adverse
Minor
adverse
Minor
adverse
Negligible
adverse
Negligible
adverse
Negligible
adverse
BeneficialModerate
beneficial
Negligible
beneficial
Minor
beneficial
Minor
beneficial
Minor
beneficial
Negligible
beneficial
Minor
beneficial
Negligible
beneficial
Minor
beneficial
Minor
beneficial
Minor
beneficial
Minor
beneficial
Negligible
beneficial
Minor
beneficial
Negligible
beneficial
Minor
beneficial
Minor
beneficial
AdverseNegligible
adverse
Negligible
adverse
Negligible
adverse
Negligible
adverse
Negligible
adverse
Negligible
adverse
Negligible
adverse
Negligible
adverse
Negligible
adverse
Negligible
adverse
Negligible
adverse
Negligible
adverse
Negligible
adverse
Negligible
adverse
Negligible
adverse
Negligible
adverse
Negligible
adverse
BeneficialModerate
beneficial
Negligible
beneficial
Minor
beneficial
Minor
beneficial
Negligible
beneficial
Negligible
beneficial
Minor
beneficial
Negligible
beneficial
Negligible
beneficial
Minor
beneficial
Negligible
beneficial
Negligible
beneficial
Negligible
beneficial
Minor
beneficial
Negligible
beneficial
Negligible
beneficial
Minor
beneficial
AdverseNegligible
adverse
Negligible
adverse
Negligible
adverse
Negligible
adverse
Negligible
adverse
Negligible
adverse
Negligible
adverse
Negligible
adverse
Negligible
adverse
Negligible
adverse
Negligible
adverse
Negligible
adverse
Minor
adverse
Minor
adverse
Negligible
adverse
Negligible
adverse
Negligible
adverse
BeneficialModerate
beneficial
Negligible
beneficial
Minor
beneficial
Minor
beneficial
Minor
beneficial
Negligible
beneficial
Minor
beneficial
Negligible
beneficial
Minor
beneficial
Minor
beneficial
Minor
beneficial
Minor
beneficial
Negligible
beneficial
Minor
beneficial
Negligible
beneficial
Minor
beneficial
Minor
beneficial
AdverseNegligible
adverse
Negligible
adverse
Negligible
adverse
Negligible
adverse
Negligible
adverse
Minor
adverse
Negligible
adverse
Negligible
adverse
Negligible
adverse
Negligible
adverse
Negligible
adverse
Negligible
adverse
Negligible
adverse
Minor
adverse
Negligible
adverse
Negligible
adverse
Negligible
adverse
BeneficialModerate
beneficial
Negligible
beneficial
Minor
beneficial
Minor
beneficial
Minor
beneficial
Negligible
beneficial
Minor
beneficial
Minor
beneficial
Minor
beneficial
Minor
beneficial
Minor
beneficial
Minor
beneficial
Negligible
beneficial
Minor
beneficial
Negligible
beneficial
Minor
beneficial
Minor
beneficial
AdverseNegligible
adverse
Negligible
adverse
Minor
adverse
Negligible
adverse
Negligible
adverse
Minor
adverse
Negligible
adverse
Negligible
adverse
Negligible
adverse
Negligible
adverse
Negligible
adverse
Negligible
adverse
Minor
adverse
Minor
adverse
Negligible
adverse
Negligible
adverse
Negligible
adverse
BeneficialMinor
beneficial
Negligible
beneficial
Minor
beneficial
Minor
beneficial
Minor
beneficial
Minor
beneficial
Minor
beneficial
Minor
beneficial
Negligible
beneficial
Minor
beneficial
Negligible
beneficial
Negligible
beneficial
Negligible
beneficial
Minor
beneficial
Minor
beneficial
Negligible
beneficial
Negligible
beneficial
AdverseNegligible
adverse
Negligible
adverse
Negligible
adverse
Negligible
adverse
Negligible
adverse
Negligible
adverse
Minor
adverse
Negligible
adverse
Negligible
adverse
Negligible
adverse
Negligible
adverse
Negligible
adverse
Minor
adverse
Minor
adverse
Negligible
adverse
Negligible
adverse
Negligible
adverse
BeneficialNegligible
beneficial
Negligible
beneficial
Minor
beneficial
Negligible
beneficial
Minor
beneficial
Moderate
beneficial
Moderate
beneficial
Negligible
beneficial
Negligible
beneficial
Minor
beneficial
Negligible
beneficial
Negligible
beneficial
Negligible
beneficial
Negligible
beneficial
Minor
beneficial
Negligible
beneficial
Negligible
beneficial
Leakage reduction (15% reduction by 2025;
50% by 2050)
Target 100 water efficiency activity
Nitrate catchment management / treatment –
Deal
Nitrate catchment management / treatment –
West Sandwich
Nitrate catchment management / treatment –
Manston
Nitrate catchment management – North
Dover
Nitrate catchment management / treatment –
Sandwich
Pesticide catchment management / treatment
– River Medway Scheme
Medway WTW Indirect Potable Water Reuse
(18 Ml/d)
Nitrate catchment management / treatment –
North Deal
Nitrate catchment management / treatment –
Gravesend
Nitrate catchment management / treatment –
near Canterbury
Nitrate catchment management / treatment –
Ramsgate B
Nitrate catchment management / treatment –
Birchington
Nitrate catchment management / treatment –
Strood
Stourmouth WSW (10Ml/d with 20Ml covered
storage)
Utilise full existing transfer capacity (from
Faversham4)
Popula
tion a
nd
hum
an h
ealth
SEA objective
Recommission Meopham Greensand
groundwater source
Air a
nd C
limate
Bio
div
ers
ity, flo
ra
and fauna
Option name
Re
sid
ua
l E
ffe
cts
Sig
nif
ica
nc
e
Wate
r
Mate
rial a
ssets
and r
esourc
e u
se
SEW bulk supply near Canterbury
West Sandwich & Sandwich WSW licence
variation
Pesticide catchment management / treatment
– Powdermill Reservoir
Pesticide catchment management / treatment
– Darwell Reservoir
53 Water Resources Management Plan 2019
Annex 11: Strategy for the Eastern area
The strategy includes fourteen catchment management options to improve nutrient management
and land-use practices as well as one catchment management option designed to reduce drinking
water quality issues relating to pesticides entering surface waters. The SEA assessment findings for
these options are very similar: the effects are beneficial in relation to many of the SEA objectives
with mainly negligible adverse effects; except for minor adverse effects associated with carbon
emissions for the extra water treatment necessary for the additional water made available by these
schemes. These schemes also provide a beneficial effect in respect of WFD objectives to achieve
good ecological status and wider environmental objectives for terrestrial ecosystems. These
schemes also provide a beneficial effect in respect of WFD objectives to achieve good ecological
status.
Demand management measures are a key component of the strategy reflecting their environmental
benefits and in the Eastern area include: further leakage reduction (15% by 2025 and 50% by 2050);
and the ‘Target’ 100 water efficiency activities to reduce average per capita consumption to 100 litres
per head per day by 2040. The SEA identified that the effects are mainly beneficial but with some
minor temporary adverse effects in respect of materials required for water leak repairs and metering,
as well as the risk of temporary traffic disruption and associated carbon and air quality effects of
street works for leak repair activities.
The strategy involves development of six water supply augmentation options.
The Medway WwTW indirect potable water reuse scheme provides beneficial effects relating to the
provision of additional reliable water supplies by reusing treated effluent, thereby increasing
resilience to the future effects of climate change. However, the scheme has the potential for major
adverse effects relating to archaeology and cultural heritage due to the pipeline construction work
which will be addressed further in consultation with Historic England and local heritage asset owners
and stakeholders through detailed planning, site surveys and design/routing of the pipeline route.
These activities will inform the development of any necessary mitigation measures to protect the
heritage features and reduce the effects to acceptable levels. Arboriculture implication assessments
will need to be carried out at the detailed planning stage to ensure any use of verges does not
impinge the root protection zone. Mitigation will be required during construction to avoid impacts to
Holborough and Burham Marshes SSSI however permanent disruption to surface water drainage
will be avoided by constructing in the existing road network and disturbed arable land.
The strategy includes an inter-zonal water transfer (to maximise the full existing transfer capacity
from the Faversham area) and a bulk water import from South East Water, both of which were
assessed as having potential moderate adverse effects to biodiversity, fauna and flora due to
construction effects on sites of nature conservation interest, as well as to landscape and visual
amenity within the Kent Downs Area of Outstanding Natural Beauty (AONB). These options will need
to be further assessed during detailed design to develop appropriate mitigation measures to reduce
the magnitude of effects to an acceptable level. A short length of pipeline (of approximately 5K) is
required for the inter-zonal transfer within the Kent Downs AONB. This has been routed to avoid
ancient woodland and areas of woodland and parkland but will require further optimisation at the
detailed planning stage to minimise landscape impacts.
The West Sandwich and Sandwich licence variation scheme and the recommission the Meopham
greensand groundwater source are assessed as having predominantly negligible adverse effects.
Minor adverse effects relate to energy and materials use and associated carbon emissions for water
pumping and treatment. Minor beneficial effects arise from making optimal use of existing water
sources. Recommissioning of the West Sandwich and Sandwich groundwater source may have
some minor adverse effects on surface water streams and aquatic ecology which will be investigated
further as part of the WINEP3 investigations agreed with the EA over the next few years. This may
54 Water Resources Management Plan 2019
Annex 11: Strategy for the Eastern area
require some additional abstraction licence control measures to be applied to protect the
environment
In the longer term, there may be a requirement to recommission our Stourmouth water supply source
and treatment works for delivery by 2060 depending on the actual SDB position by this time. This
would have negligible to minor adverse effects whilst minor beneficial effects arise from making
optimal use of existing water sources.
Cumulative effects of the Eastern area strategy have been identified in relation to:
◼ Pipeline and related construction works some distance apart within the Kent Downs AONB
relating to the South East Water import in the Canterbury area and the Faversham Main
options. Careful planning, design and mitigation will be needed in relation to the pipeline
construction to minimise impacts to habitats, heritage features and landscape features that
provide the basis for the AONB designation but overall the cumulative effects are
considered minor
A potential for cumulative effects between the West Sandwich and Sandwich groundwater source,
and the Affinity Water groundwater sources at Lye Oak and Tappington South (licence variations)
was highlighted in the revised draft WRMP19. This was also identified through the WRSE group.
Further work since the revised draft WRMPs for both water companies has identified that the Lye
Oak variation would not post a significant risk to the deterioration of the groundwater body, and any
impacts would be localised or temporary. Affinity Water scoped the Tappington South licence
variation out of a WFD assessment as there would be no overall increase in abstracted volumes. As
such, it is considered that there is a low risk of cumulative effects between Southern Water and
Affinity Water’s options. This will continue to be reviewed as the options are progressed.
Overall, the environmental assessment has concluded that the strategy has predominately
negligible to minor adverse effects and negligible to minor beneficial effects.
One strategic alternative option is being considered for the Eastern area: the Sittingbourne industrial water reuse scheme and this have been assessed. The SEA (alongside HRA and WFD assessments) concluded that there may be moderate adverse effects during construction after application of mitigation measures due to the proximity to important international wildlife sites, but mitigation would prevent any adverse effects on any European site. As with the Medway reuse scheme, this scheme would, if required to be implemented, lead to some beneficial effects in providing additional reliable water supplies by reusing treated effluent, thereby increasing resilience to the future effects of climate change.

55 Water Resources Management Plan 2019
Annex 11: Strategy for the Eastern area
7. Summary of strategy and strategic alternatives This section summarises the strategic options that need to be developed in the next 10-15 years,
along with alternative options identified through the Real Options modelling and sensitivity testing. It
summarises the feasibility investigations that are needed in the next few AMPs.
We are setting a bold and UK leading demand reduction target to reduce per capita consumption to
100 litres per person per day across our region by 2040. The South East of England is officially
declared as ‘water stressed’ and with population growth and future climate scenarios suggesting
lower water availability then balancing supply and demand will have an even greater focus. Having
been a leader in water efficiency and successfully delivered an ambitious Universal Metering
Programme we are in a unique position to carry on setting the standard in demand reduction.
However, our Target 100 programme is not just about reducing water consumption; it is about shifting
society to value water. Southern Water is aiming to be at the forefront of taking action to effectively
manage water resources, keep bills affordable drive innovation and support our customers. Southern
Water has therefore outlined four key areas of focus in its ‘Let’s Talk Water’ strategy, with Target
100 being fundamental to delivering against each of these themes.
7.1 Strategic options and investigations in next 10-15 years Our strategy has been examined and tested against environmental assessments, the outcomes of
regional planning exercises and customer preferences for different option types, as outlined in
section 3.
◼ We have implemented the ‘Target 100’ water efficiency policy, which aligns with customers’
preferences for helping them to use water more wisely.
◼ We have selected a substantial amount of leakage reduction over the planning period, which
again aligns with customer preferences, and aims not only to meet Ofwat’s ambition of
reducing leakage by 15% (from current levels) by the end of AMP7, but also to reduce
leakage by 50% by 2050. This and the water efficiency programme are also well supported
by the environmental assessments.
◼ We aim to use drought permits/orders only in more extreme droughts (after an interim period
to allow sufficient time to develop relevant options to avoid the risk of a shortfall in the severe
drought conditions).
◼ We continue to support neighbouring water companies through our Eastern area, aligning
with regional planning outputs.
◼ Given the scale of potential sustainability reductions, and given that confirmation of the
sustainability reductions with the EA is unlikely until the middle of AMP7 at the earliest, we
must conduct feasibility investigations and planning and promotional activity through AMP7
so we have a plan which can adapt to the wide possible range of SDB possibilities.
We have identified the key schemes that need to be implemented in AMP7/AMP8 and the main
steps that the company will need to undertake to deliver them. We have also identified through
scenario and sensitivity testing, the alternative schemes that may be required if the main ones cannot
be delivered in the timescales required. These alternative options will therefore need to be
investigated in parallel with the development of the main options in AMP6, AMP7 (and AMP8).
The key strategic options and investigations in the next 10-15 years for the Eastern area are:
◼ Plan for implementation of the 18Ml/d Medway WwTW water reuse scheme in AMP8. Need
to undertake more detailed feasibility investigations, undertake environmental surveys and
monitoring, identify and implement suitable environmental mitigation measures, prepare

56 Water Resources Management Plan 2019
Annex 11: Strategy for the Eastern area
planning application documentation, secure land purchases, undertake public perception
studies, etc.
- This scheme is critical to ensuring continuation of supplies under a wide range of drought
conditions. It provides greater resilience to the supply system of the eastern area, as it
allows existing groundwater sources to be rested, and provides resilience to other outage-
type events
- If the scale of sustainability reductions is low, then this option may not be needed until
the 2030s. As the sustainability reductions still have to be investigated and confirmed with
the EA then both the investigations and the feasibility/design of this potential solution to
resolve deficits caused by the sustainability reductions needs to be undertaken at the
same time
- This could be a shared resource with South East Water, however they have indicated
that the scheme does not form part of their preferred plan
◼ Develop the infrastructure to allow the full capacity of the existing main to be available
for transfer from Medway (Faversham4 source) to Thanet in AMP8
◼ Plan for implementation of the small bulk supply from South East Water to KT WRZ near
Canterbury in early AMP8. Work with South East Water to ensure the scheme can be
delivered and that benefits will be available in a range of drought events, potentially including
conjunctive use modelling for both companies in the Thanet area
- Also consider the potential that this could be upscaled where water was available from
South East Water, to address local risks around, for example, outage or freeze-thaw
events
◼ Commence discussions with the EA about a licence variation for the West Sandwich and
Sandwich sources, including developing and undertaking a monitoring programme.
Progression of scheme should commence in AMP6 to allow scheme to be implemented in
early AMP7
◼ Implement planned infrastructure development at treatment works near Rochester –
already planned to be delivered in through AMP7 programme of works
◼ Commence planning and feasibility investigations to allow the recommissioning of the
Meopham greensand groundwater source in 2030, or potentially earlier in AMP8 if other
key schemes cannot be delivered
◼ Further investigation of the Sittingbourne industrial water reuse scheme in AMP8, as a
possible alternative scheme. This will require securing commercial agreement of the trade,
alongside more detailed feasibility investigations, design of pipeline and treatment works,
undertake environmental surveys and monitoring, identify and implement suitable
environmental mitigation measures, prepare planning application documentation, secure
land purchases, etc.
◼ Develop additional nitrate treatment at identified sources and implement as early as possible
catchment management activity at these sources over AMP7 and AMP8
- Consider applicability of starting catchment management activity and monitoring in AMP6
and early AMP7
◼ Develop treatment for pesticides for the River Medway scheme, which is potentially at risk
and implement catchment management activity at this source in time for AMP8
- Consider applicability of starting catchment management activity and monitoring in AMP6
and early AMP7
◼ Implement the ‘Target 100’ water efficiency campaign. It should help to minimise the risk
that the demand forecast could be higher than the central estimate
- Significant engagement of customers and monitoring of success of the targeted PCC
reduction profile will be critical through AMP7 (and AMP8) to minimise the risk that the
target is not achieved and there is a subsequent potential supply shortfall
- Associated with this is the need to develop appropriate trials of customer offerings or
propositions to encourage efficient use of water during AMP7 to better understand how

57 Water Resources Management Plan 2019
Annex 11: Strategy for the Eastern area
these could work and give greater confidence in the savings that could be achieved. This
will include both incentives, and potentially alternative tariff structures
◼ Progress leakage reduction activity throughout AMP7 (to achieve 15% reduction from
current levels) and AMP8 and beyond (to achieve reductions from current levels of 40% by
2040 and 50% by 2050), across all leakage options identified
◼ Undertake investigations of key strategic alternative schemes, including:
- Work with the EA to agree as early as possible in AMP7 the sources that are actually
likely to require licence changes to meet sustainability reductions. The scale of uncertain
sustainability reductions is driving the selection of a number of schemes in AMP8. If
the sources that are actually likely to require sustainability reductions can be formally
agreed with the EA, we may be able to cease or limit the cost of feasibility investigations
and planning preparation needed in AMP7
7.2 Deliverability of the plan As explained above, these strategic options were selected through a model which solves multiple
states of the world, including a range of drought conditions, and five separate ‘futures’ representing
a range of different potential SDBs. This model is sufficiently and appropriately robust for planning
water resource management on this scale.
If the future turns out to have limited demand growth, limited climate change impacts and limited or
no further sustainability reductions reflecting a future SDB more like those modelled in the 70th or
90th percentile branches – then a number of these options may not be required. For example, the
company’s drive towards ‘Target 100’ could reasonably limit the future uncertainty around demand
growth and should (if customer water use savings are sustained) increase the likelihood that the
company SDBs head more towards the lower 50th-90th percentile branches, rather than the 10th or
30th percentile branches (assuming that other drivers of uncertainty relating to climate change
impacts and sustainability reductions do not push the company back towards the higher deficit
branches).
As we prepare for our next plan, it may be possible to confirm that the implementation of some of
the AMP8 options will not actually be required. However, the timescales are such that we will need
to have done much of the feasibility and environmental investigations and the preparation of planning
documentation in AMP7 (before it can be confirmed whether the schemes are not necessary) even
if the scheme is not ultimately needed in AMP8.
For new resource developments, it will be necessary for detailed engineering and environmental
assessments to be undertaken, for planning and other consents to be secured and for the schemes
to be constructed and commissioned. For transfers from other water companies there may be a need
for asset enhancements, and/or for the development of new water resources within those companies
in order to free up water to make the transfer available. The timings within the WRMP are our best
estimates for delivery at this point in time.
Figure 13, Figure 14, and Figure 15 present some of these key decision points and uncertainties in
general terms, and the impact that this can have on the plan.

58 Water Resources Management Plan 2019
Annex 11: Strategy for the Eastern area
Figure 13 Indicative timeline showing key decision points and external influences
Figure 14 Indicative timeline showing the impact of the uncertainty of future sustainability reductions
on the plan in the 2020s

59 Water Resources Management Plan 2019
Annex 11: Strategy for the Eastern area
Figure 15 Indicative timeline showing the impact of the uncertainty of demand growth and climate
change on the plan
The deliverability of the plan in the next two AMPs is shown below in Figure 16. This describes the
main strategic schemes and key alternative schemes, and aims to present, at a simplified level, the
potential impact that sustainability reduction uncertainty, planning inquiries, etc could have on the
plan.
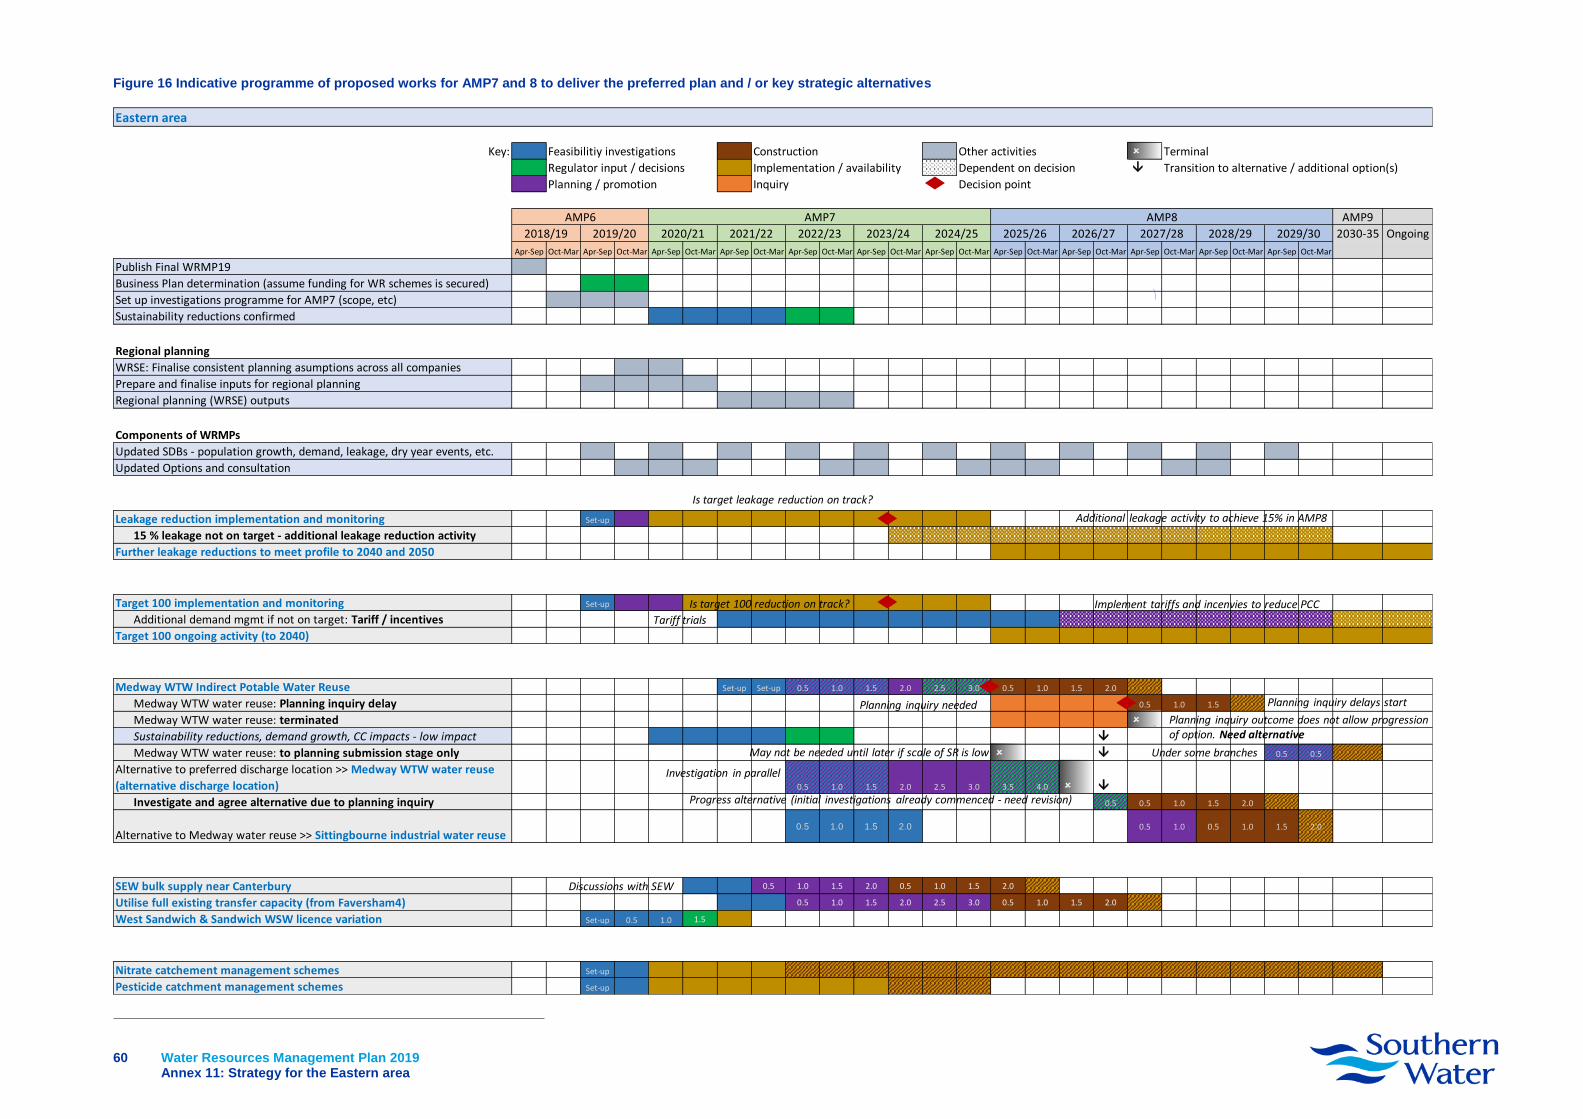
60 Water Resources Management Plan 2019
Annex 11: Strategy for the Eastern area
Figure 16 Indicative programme of proposed works for AMP7 and 8 to deliver the preferred plan and / or key strategic alternatives
Key: Feasibilitiy investigations Construction Other activities Terminal
Regulator input / decisions Implementation / availability Dependent on decision Transition to alternative / additional option(s)
Planning / promotion Inquiry Decision point
AMP9
2030-35 Ongoing
Apr-Sep Oct-Mar Apr-Sep Oct-Mar Apr-Sep Oct-Mar Apr-Sep Oct-Mar Apr-Sep Oct-Mar Apr-Sep Oct-Mar Apr-Sep Oct-Mar Apr-Sep Oct-Mar Apr-Sep Oct-Mar Apr-Sep Oct-Mar Apr-Sep Oct-Mar Apr-Sep Oct-Mar
Publish Final WRMP19
Business Plan determination (assume funding for WR schemes is secured)
Set up investigations programme for AMP7 (scope, etc)
Sustainability reductions confirmed
Regional planning
WRSE: Finalise consistent planning asumptions across all companies
Prepare and finalise inputs for regional planning
Regional planning (WRSE) outputs
Components of WRMPs
Updated SDBs - population growth, demand, leakage, dry year events, etc.
Updated Options and consultation
Leakage reduction implementation and monitoring Set-up
15 % leakage not on target - additional leakage reduction activity
Further leakage reductions to meet profile to 2040 and 2050
Target 100 implementation and monitoring Set-up
Additional demand mgmt if not on target: Tariff / incentives
Target 100 ongoing activity (to 2040)
Medway WTW Indirect Potable Water Reuse Set-up Set-up 0.5 1.0 1.5 2.0 2.5 3.0 0.5 1.0 1.5 2.0
Medway WTW water reuse: Planning inquiry delay 0.5 1.0 1.5
Medway WTW water reuse: terminated
Sustainability reductions, demand growth, CC impacts - low impact
Medway WTW water reuse: to planning submission stage only 0.5 0.5
Alternative to preferred discharge location >> Medway WTW water reuse
(alternative discharge location) 0.5 1.0 1.5 2.0 2.5 3.0 3.5 4.0
Investigate and agree alternative due to planning inquiry 0.5 0.5 1.0 1.5 2.0
Alternative to Medway water reuse >> Sittingbourne industrial water reuse0.5 1.0 1.5 2.0 0.5 1.0 0.5 1.0 1.5 2.0
SEW bulk supply near Canterbury 0.5 1.0 1.5 2.0 0.5 1.0 1.5 2.0
Utilise full existing transfer capacity (from Faversham4) 0.5 1.0 1.5 2.0 2.5 3.0 0.5 1.0 1.5 2.0
West Sandwich & Sandwich WSW licence variation Set-up 0.5 1.0 1.5
Nitrate catchement management schemes Set-up
Pesticide catchment management schemes Set-up
2025/26 2026/27 2027/28 2028/29 2029/30
AMP6 AMP7 AMP8
2018/19 2024/25
Eastern area
2019/20 2020/21 2021/22 2022/23 2023/24
Is target leakage reduction on track?
Additional leakage activity to achieve 15% in AMP8
Is target 100 reduction on track?
Tariff trials
Implement tariffs and incenvies to reduce PCC
Planning inquiry delays start
Planning inquiry outcome does not allow progression of option. Need alternative
Investigation in parallel
Progress alternative (initial investigations already commenced - need revision)
Planning inquiry needed
Discussions with SEW
May not be needed until later if scale of SR is low Under some branches
61 Water Resources Management Plan 2019
Annex 11: Strategy for the Eastern area
7.3 Regional strategy Figure 17 presents a summary of the intra-zonal connections and the regional water trading options
that comprise our strategy. There are a number of existing bulk supplies – we are a net exporter to
the Eastern region (as shown previously in Figure 9). No additional water export schemes were
identified in our plan. We have one small additional local import from South East Water in our KT
WRZ.
We did also include as an option in our feasible list and in our preferred plan, the Medway WwTW
water reuse scheme, which was originally intended to be a jointly developed scheme with South East
Water, or to enable further bulk supplies to South East Water. However, South East Water have
advised that they do not require the scheme. As such we intend to develop the scheme as a Southern
Water only scheme for AMP8.
Southern Water was the first company to chair the WRSE regional planning group in the mid-1990’s.
Since then it has played an active role in developing regional solutions for all customers in the south
east. We have promoted and constructed a number of strategic transfers between companies, and
this current plan continues to improve the connectivity in the south east. It is proposing new inter-
regional transfers through AMP7 and 8.
Figure 18 shows an indicative grid system that could be developed for the south east region:
◼ Taking existing connections between the water companies
◼ Developing joint schemes or schemes that provide benefits to multiple companies
◼ Adding to the current network to provide an increased number of connections and to make
these and existing connections bi-directional to allow water to flow in either direction
◼ Providing greater system resilience and redundancy which will help to reduce risks from
outage and events such as extreme droughts, heatwaves, freeze-thaw, pollution or even
terrorism, across the region as a whole
The company is committed to continuing to play a leading role in the development of a regional plan.
In the future the remit of the WRSE is likely to be extended such that they would derive a regional
plan that would then be provided to the Water Companies to incorporate into their business plan.

62 Water Resources Management Plan 2019
Annex 11: Strategy for the Eastern area
Figure 17 Water trading in the plan
Figure 18 Indicative grid system for south east region by 2050s

63 Water Resources Management Plan 2019
Annex 11: Strategy for the Eastern area
8. Resilience
8.1 Resilience benefits our preferred plan The EA’s Water Resource Planning Guidelines instruct companies to consider options to increase
resilience as part of the options appraisal, even when some options that provide resilience benefits
may not necessarily provide readily identifiable water volumes. Ofwat also has a duty to further the
long-term resilience of the water sector.
As a result, this section summarises the consideration we have given to aspects of resilience in this
WRMP. The options detailed in Table 14 are likely to provide resilience benefits on top of any WRMP-
driver, so may provide the company with greater flexibility to respond to a range of unforeseen
events.
Table 14 Options providing resilience benefits
Source or scheme Description Resilience benefits
Medway WwTW water reuse New water reuse scheme
May allow flexibility in operation of Bewl reservoir and the Medway groundwater sources. Also provides resilience to other outage-type events
South East Water bulk supply near Canterbury
Small bulk supply from South East Water
Chosen to be implemented to provide greater resilience benefits, and the potential that this could be upscaled where water was available from South East Water, to address local risks around, for example, outage or freeze-thaw events
Utilise full existing transfer capacity (from Faversham4 to KT)
Increase ability of Kent Medway to support the Kent Thanet WRA
Provides greater system resilience benefits, and reduces risks from outage and events such as extreme droughts, heatwaves, freeze-thaw, pollution or even terrorism
Stourmouth WSW
This source requires work to relocate and rehabilitate the treatment works, etc. It is not part of the main plan required in the next 10-15 years
Provide greater resilience to the KT WRZ – more flexibility to have a surface water source in a groundwater dominated WRZ. Possible linkages with conjunctive use with South East Water schemes
Nitrate schemes
Catchment management schemes to reduce susceptibility to nitrate pollution
Increase resilience of source to nitrate pollution
Pesticide schemes
Catchment management schemes to reduce susceptibility to pesticide pollution
Not expected to provide DO benefit, but implemented in the WRMP plan to ensure resilience of surface water sources to these WQ events

64 Water Resources Management Plan 2019
Annex 11: Strategy for the Eastern area
Source or scheme Description Resilience benefits
Drought permits / orders Mitigation measures included with drought permits/orders
Aims to provide measures that will improve environmental resilience during periods of dry weather related stresses in the environment, and optimise recovery from drought events
In addition, as discussed in Annex 8, our approach to planning whereby we solve for multiple drought
events and inter-annual variability simultaneously, includes assessment of extreme drought
conditions to ensure we have a plan that is resilient to drought events and minimises the potential
for ‘level 4’ type restrictions such as standpipes and rota cuts. These have significant impacts on
society and the economy.
Our demand management activity, both in the last AMP and proposed as part of this current plan,
will also contribute to our resilience to drought events, particularly periods of peak summer demand
for water in hot, dry weather events. Our plan includes policy decisions to drive demand for water
down through the Target 100 water efficiency programme and to reduce the water lost from our pipes
through a policy of leakage reduction that is targeting a 50% reduction in leakage (from current
levels) by 2050.
We have adopted a profile of outage for this WRMP which aims to minimise outage through activity
identified in the business plan. This will increase system resilience to outages and water quality risks.
8.2 Non-drought resilience
8.2.1 Freeze-thaw analysis
Recent freeze-thaw events resulted in higher than usual demands between October and March in
some of our supply areas. The aim of this section is to explore the prevalence and geographical
distribution of freeze-thaw impacts across our supply area, and to understand the potential impact
of freeze-thaw events on the resilience of our supply system, by examining a number of
representative SDBs.
For the supply side of the SDB, we have used the data for the MDO scenario in the Western and
Central areas, and the ADO scenario for the Eastern area (because it doesn’t have an MDO
scenario). Whilst ADO represents potential available supplies over the whole year, rather than
providing a view of the winter, we have analysed this because it constitutes a conservative or worst-
case approach (in general, one might expect that the company could run their sources at a higher
rate for a short period in the event of a freeze-thaw event).
Different freeze-thaw events are characterised by different demands, depending on the severity of
the event. A particularly severe freeze-thaw event is likely to result in a higher demand for a short
duration, and so we have considered the average day peak week (rolling 7-day peak week) during
the winter period for each WRZ from 1997/98 to 2017-18. With a supply area the size of Southern
Water’s, and with the discrete geographic nature of our three supply areas, there will likely be
variation in the timing and severity of freeze-thaw events.
Our analysis showed that the peak week demands do not occur simultaneously in all WRZs: in many
years, the peak week demand occurred in winter for some WRZs while occurring in summer for other
WRZs in that year. This needs to be acknowledged when designing potential freeze-thaw SDBs – a
situation where all WRZs experience their peak week demand simultaneously is likely to be a worst-
case scenario, one that has not yet been experienced in our company area.

65 Water Resources Management Plan 2019
Annex 11: Strategy for the Eastern area
The plots below present our SDB analysis for two freeze-thaw years: 2010-11 and 2017-18
aggregated to the area-level.
Figure 19 Eastern area 2010-11 Oct-Mar peak demand plotted against ADO WAFU for Drought
scenario
Figure 20 Eastern area 2017-18 Oct-Mar peak demand plotted against ADO WAFU for Drought
scenario
From a SDB perspective, the company can be considered largely resilient to the range of freeze-
thaw events examined, in that there is sufficient water available at area level to meet potential winter
demands in all areas.

66 Water Resources Management Plan 2019
Annex 11: Strategy for the Eastern area
Our preferred plan also provides solutions that deliver additional water available in the winter period,
demonstrating that our preferred plan increases our resilience to freeze-thaw events from a water
resources perspective.
Risks to supply from freeze-thaw events are not, however, limited to the overall availability of water,
but also to the ability of the water supply system to convey water to where it is required. For example,
if a demand centre is supplied by a single water main, which bursts during a freeze-thaw event, then
water availability in the rest of the WRZ is unlikely to be relevant – the issue becomes one of network
connectivity. Analysis of this nature is beyond the scope of what we have undertaken in this WRMP,
which is primarily focused on drought events. However, we are keen to explore this aspect of
resilience further ahead of the next plan for the 2020-25 period (WRMP24).
67 Water Resources Management Plan 2019
Annex 11: Strategy for the Eastern area
9. References
◼ UKWIR, “WRMP 2019 Methods – decision making process: guidance”, 16/WR/02/10.