Water Resources Data, Oregon, Water Year 2004--John Day ... · 1 4 0 3 8 5 3 0 1 4 0 3 6 8 6 0 ......
24
Pine Cr 0 10 20 30 0 10 20 30 40 MILES 40 KILOMETERS OREGON Stream-gaging station Stream-gaging station and water-quality data collection site 1 1 4 4 0 0 4 4 8 8 0 0 0 0 0 0 EXPLANATIO N 1 4 0 4 6 5 0 0 1 4 0 4 6 0 0 0 1 4 0 4 4 0 0 0 1 4 0 3 8 5 3 0 1 4 0 3 6 8 6 0 1 4 0 4 8 0 0 0 John Day Middle North Fork River Fork John South Fork Day River 120 o 15' 120 o 45' 45 o 45' 44 o 00' Condon Fossil John Day Monument Ritter Service Creek CROOK HARNEY GRANT WHEELER JEFFERSON WASCO SHERMAN GILLIAM MORROW UMATILLA 14046890 14046890 14046500 170 Figure 13. Location of surface-water and water-quality stations in the John Day River Basin.
Transcript of Water Resources Data, Oregon, Water Year 2004--John Day ... · 1 4 0 3 8 5 3 0 1 4 0 3 6 8 6 0 ......

PineCr
0 10 20 30
0 10 20 30
40 MILES
40 KILOMETERS
OREGON
Stream-gaging station
Stream-gaging station and water-quality data collection site
1 1 4 4 0 0 4 4 8 8 0 0 0 0 0 0
EXPLA NATIO N
1 4 0 4 6 5 0 0 1 4 0 4 6 0 0 0
1 4 0 4 4 0 0 0
1 4 0 3 8 5 3 0
1 4 0 3 6 8 6 0
1 4 0 4 8 0 0 0
John
Day Middle
North
Fork
River
Fork
John
South
Fork
Day River
120o 15' 120o 45'
45o 45'
44o 00'
Condon
Fossil
John Day
Monument
Ritter
Service Creek
CROOK
HARNEY
GRANT
WHEELER
JEFFERSON
WASCO
SHERMAN
GILLIAM
MORROW UMATILLA
14046890
14046890
14046500
170
Figure 13. Location of surface-water and water-quality stations in the John Day River Basin.

C O L U M B I A R I V E R
J O H N D A Y R I V E R
RI
VE
R
JO
HN
DA
Y
RM 218.0
RM 19.5
Grass Valley
Canyon
RM 21.6
Rock Creek
Lo
ne
Ro
ck
Cre
ek
RM 29.6
Hay Creek
RM 83.9
Thirtymile Creek
RM97.3
Butte Creek
Pine CreekRM 116.5
Currant Creek
RM 135.3
Bridge Creek
14046500
RM 0.414046890
14048000 RM 20.9
RM 184.7
North Fork John Day River 14046000
RM 15.3 RM
16.0
Co
tto
nw
oo
d C
reek
Ca
ma
s C
reek
RM 32.3
Mid
dle
Fo
rk
Joh
n D
ay
Riv
er
14044000 RM 14.9
RM 5.7
Long Creek RM
56.9
RM 60.4
Des
ola
tio
n
Cre
ek
RM 204.4
Ro
ck
Cre
ek
5.0 Mountain Creek
RM 211.8
So
uth
Fo
rk
Joh
n D
ay
Riv
er
RM 239.1
Bee
ch C
reek
RM 247.8
Ca
nyo
n C
reek
14038530 RM 251.0
14036860 RM 275.3
RM 263.0
Str
aw
ber
ry C
reek
EXPLANATION
11507500 Stream-gaging station 11492200
Stream-gaging station and water-quality data collection site
RM 5.4 River mile
Stream— Arrow shows direction of flow
171
Figure 14. Schematic diagram showing gaging stations in the John Day River Basin.
172
U.S. Geo
JOHN DAY RIVER BASIN
14036860 JOHN DAY RIVER AT BLUE MOUNTAIN HOT SPRINGS, NEAR PRAIRIE CITY, OR
LOCATION.--Lat 44°21'29", long 118°34'30", in SE 1⁄4 NW 1⁄4, sec. 13, T.14 S., R.34 E., Grant County, Hydrologic Unit 17070201, on right bank at private road crossing, 0.25 mi downstream from Blue Mountain Hot Springs, 0.6 mi downstream from Rail Creek, 8 mi southeast of Prairie City, and at mile 275.3.
DRAINAGE AREA.--40.14 mi2.
PERIOD OF RECORD.--October 1996 to September 2000, October 2002 to current year.
GAGE.--Water-stage recorder. Elevation of gage is 4,200 ft above sea level, from topographic map.
REMARKS.--Records good except for estimated daily discharges, which are poor. No regulation. Some diversions for irrigation.
AVERAGE DISCHARGE.--6 years (water year s1997-2000, 2003-04), 53.4 ft3/s, 38,700 acre-ft/yr.
EXTREMES FOR PERIOD OF RECORD.--Maximum discharge, 950 ft3/s May 25, 1998, gage height, 3.90 ft, from crest-stage gage, from rating curve extended above 300 ft3/s; minimum daily discharge, 24 ft3/s Jan. 5, 2004.
EXTREMES FOR CURRENT YEAR.--Maximum discharge, 151 ft3/s May 28, gage height, 2.55 ft; minimum daily discharge, 24 ft3/s Jan. 5.
DISCHARGE, CUBIC FEET PER SECOND WATER YEAR OCTOBER 2003 TO SEPTEMBER 2004
DAILY MEAN VALUES
DAY OCT NOV DEC JAN FEB MAR APR MAY JUN JUL AUG SEP
1 26 31 33 28 28 28 48 76 101 47 29 282 27 30 33 28 28 28 45 92 97 42 28 283 27 30 33 e27 27 28 46 118 93 40 28 284 27 30 31 e26 27 28 50 131 93 37 27 285 27 30 32 e24 26 27 57 140 91 36 27 28
6 27 30 35 e28 26 27 68 136 85 36 27 287 27 30 33 33 26 28 71 121 78 34 27 288 27 30 31 28 26 31 73 109 74 34 27 289 27 31 30 28 25 37 73 100 69 34 27 28
10 27 31 30 27 26 40 71 99 71 34 26 28
11 28 31 30 27 26 40 71 91 64 33 26 2812 28 30 29 27 27 41 75 82 61 33 26 2913 28 30 32 27 26 43 80 73 58 32 26 3114 28 30 33 27 26 44 78 67 54 31 26 3115 29 31 31 27 26 46 70 69 53 31 26 30
16 29 31 30 27 27 44 62 79 51 31 27 2917 29 32 29 27 35 45 57 80 50 30 29 2918 28 31 29 27 44 49 53 83 48 31 27 2919 28 31 29 27 38 51 49 96 47 31 26 2920 28 30 29 27 35 47 48 103 47 31 26 30
21 28 30 29 26 33 50 49 109 45 30 26 3022 28 30 28 26 32 59 48 113 43 30 34 3023 28 30 28 28 32 66 48 125 41 29 33 3024 28 30 30 28 31 67 49 131 40 29 30 2925 28 30 29 28 31 61 49 127 40 30 32 29
26 28 30 29 26 30 56 53 131 39 30 33 2927 28 30 29 26 30 51 62 141 38 30 31 2928 28 30 28 26 29 45 78 146 39 29 30 2929 30 40 28 27 28 45 76 137 44 29 29 2930 30 34 e26 29 --- 49 72 122 43 29 29 2931 30 --- e28 28 --- 51 --- 107 --- 29 28 ---
TOTAL 866 924 934 845 851 1,352 1,829 3,334 1,797 1,012 873 868MEAN 27.9 30.8 30.1 27.3 29.3 43.6 61.0 108 59.9 32.6 28.2 28.9MAX 30 40 35 33 44 67 80 146 101 47 34 31MIN 26 30 26 24 25 27 45 67 38 29 26 28AC-FT 1,720 1,830 1,850 1,680 1,690 2,680 3,630 6,610 3,560 2,010 1,730 1,720
STATISTICS OF MONTHLY MEAN DATA FOR WATER YEARS 1997 - 2004, BY WATER YEAR (WY)
MEAN 35.0 37.0 38.9 43.1 37.7 52.5 80.0 130 81.0 40.0 33.0 31.9MAX 40.3 49.8 64.6 84.7 47.8 62.6 101 174 119 53.0 39.4 36.8(WY) (2000) (1997) (1997) (1997) (1997) (1999) (1997) (1998) (1999) (1998) (1997) (1997)MIN 26.7 27.5 28.6 27.3 29.3 43.6 61.0 88.1 46.7 31.6 27.4 25.9(WY) (2003) (2003) (2003) (2004) (2004) (2004) (2004) (2000) (2000) (2000) (2003) (2003)
SUMMARY STATISTICS FOR 2003 CALENDAR YEAR FOR 2004 WATER YEAR WATER YEARS 1997 - 2004
ANNUAL TOTAL 16,908 15,485ANNUAL MEAN 46.3 42.3 53.4HIGHEST ANNUAL MEAN 65.8 1997LOWEST ANNUAL MEAN 42.3 2004HIGHEST DAILY MEAN 219 May 25 146 May 28 303 Jan 1, 1997LOWEST DAILY MEAN 25 Aug 30 24 Jan 5 24 Jan 5, 2004ANNUAL SEVEN-DAY MINIMUM 25 Sep 24 26 Feb 5 25 Sep 24, 2003ANNUAL RUNOFF (AC-FT) 33,540 30,710 38,70010 PERCENT EXCEEDS 83 78 10050 PERCENT EXCEEDS 31 30 3990 PERCENT EXCEEDS 27 27 28
e Estimated
logical Survey Water Resources Data—Oregon, Water year 2004, Volume 1: Surface Water, p. 172–174.

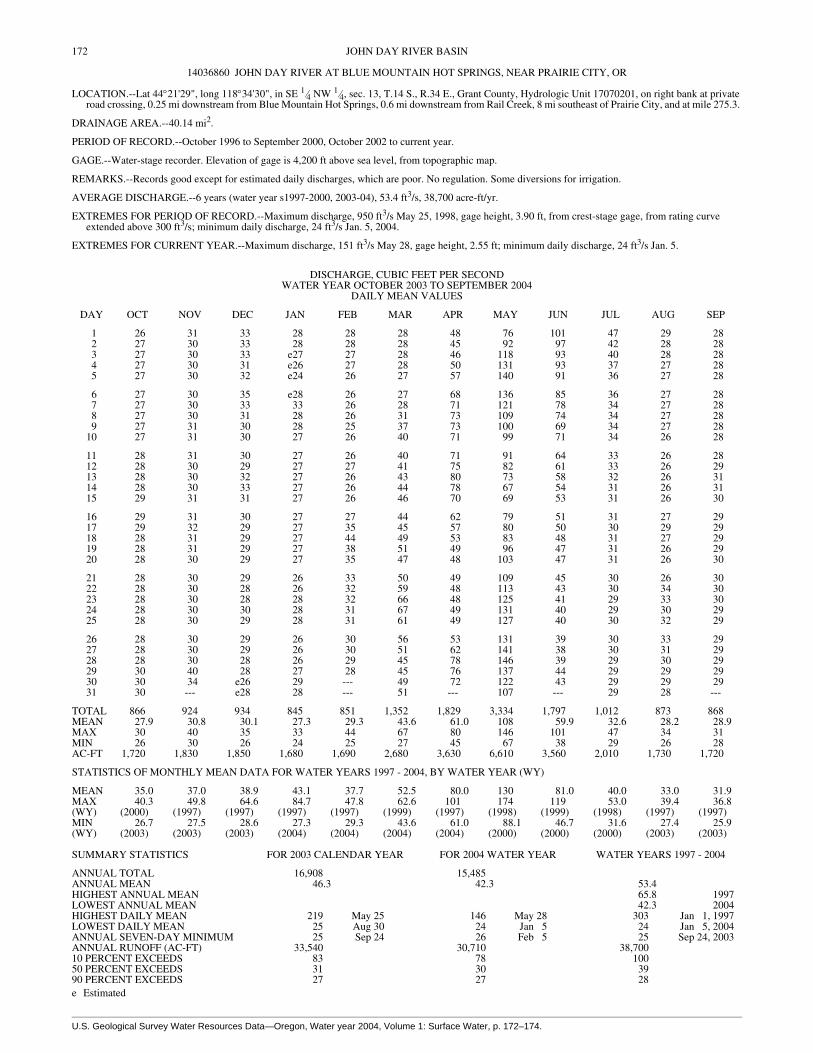
""TThhiiss ppaaggee ccoonnttaaiinnss cchhaarrttss ggrraapphhiiccaallllyy ppoorrttrraayyiinngg tthhee ttaabbuullaarrddaattaa ccoonnttaaiinneedd oonntthhee 2004 Water Year
Annual Minimum 7-Day Average Streamflow
0
10
20
30
40
7991
8991
9991
0002
1002
2002
3002
4002
SSttrree
aammffll oo
ww ((cc
ffss))
Daily Mean Discharge
10
100
1,000
SSttrree
aammfflloo
ww ((cc
ffss))
0
50
100
150
200
Oct Nov Dec Jan Feb Mar Apr May Jun Jul Aug Sep
SSttrree
aammff lloo
ww ((cc
ffss))
nneesstt ppaaggee.. SSkkiipp ttoo tthhee nneexxtt ppaaggee ttoo ggoo ddiirreeccttllyy ttoo tthhee ttaabbuullaarr ddaattaa.. .. ..""
Annual Peak Streamflow
0200400600800
1,000
7991
8991
9991
0002
1002
2002
3002
4002
SSttrree
aammffll oo
ww ((cc
ffss))
14036860 JOHN DAY R AT BLUE MTN HOT SPGS, NR PRAIRIE CITY, OR21Latitude: 44
oLongitude: 118 34
o' '29" 30"
Drainage Area: 40.1 square milesDatum: 4,200 feetHydrologic Unit Code: 17070201
Grant County
Monthly StatisticsMonthly Mean of Current Water Year
JOHN DAY RIVER BASIN
Annual Mean Streamflow
0
20
40
60
80
7991
8991
9991
0002
1002
2002
3002
4002
SS ttrr ee
aammffll oo
ww (( cc
ff ss))
Max, Mean, and Min Monthly Mean for 1997 2004 _
Oct Nov Dec Jan Feb Mar Apr May Jun Jul Aug Sep

174
THIS PAGE IS INTENTIONALLY BLANK
175
U.S. Geo
JOHN DAY RIVER BASIN
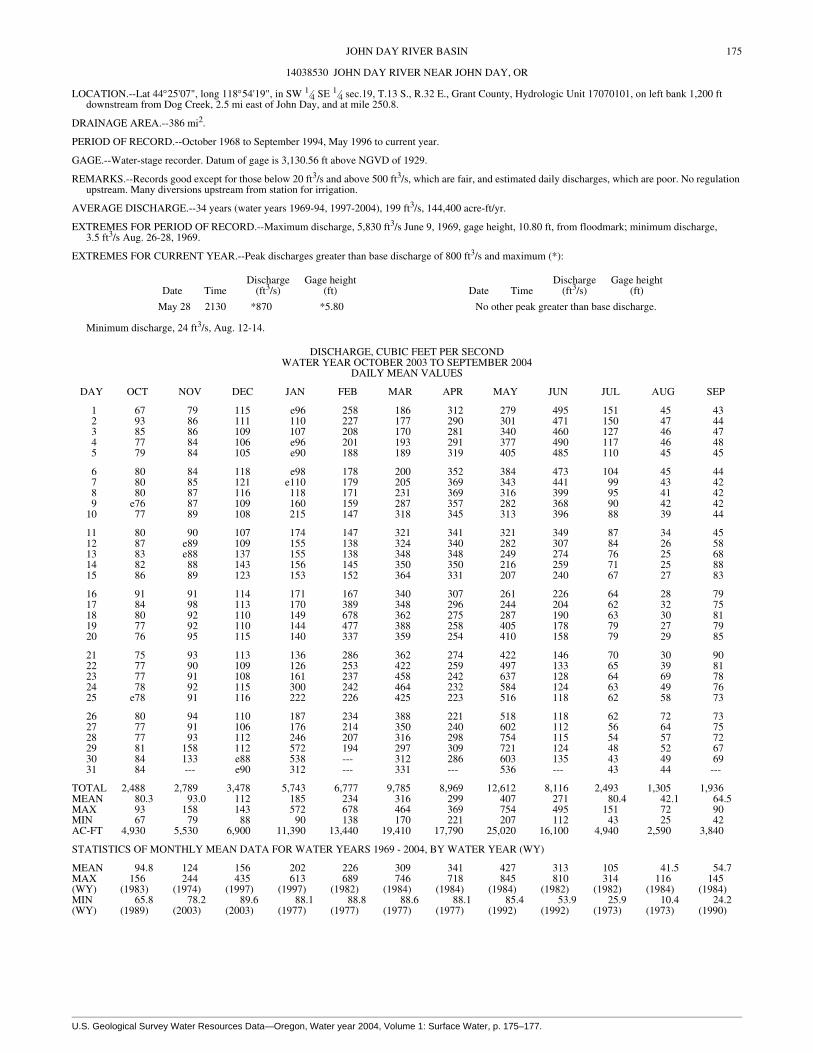
14038530 JOHN DAY RIVER NEAR JOHN DAY, OR
LOCATION.--Lat 44°25'07", long 118°54'19", in SW 1⁄4 SE 1⁄4 sec.19, T.13 S., R.32 E., Grant County, Hydrologic Unit 17070101, on left bank 1,200 ft downstream from Dog Creek, 2.5 mi east of John Day, and at mile 250.8.
DRAINAGE AREA.--386 mi2.
PERIOD OF RECORD.--October 1968 to September 1994, May 1996 to current year.
GAGE.--Water-stage recorder. Datum of gage is 3,130.56 ft above NGVD of 1929.
REMARKS.--Records good except for those below 20 ft3/s and above 500 ft3/s, which are fair, and estimated daily discharges, which are poor. No regulation upstream. Many diversions upstream from station for irrigation.
AVERAGE DISCHARGE.--34 years (water years 1969-94, 1997-2004), 199 ft3/s, 144,400 acre-ft/yr.
EXTREMES FOR PERIOD OF RECORD.--Maximum discharge, 5,830 ft3/s June 9, 1969, gage height, 10.80 ft, from floodmark; minimum discharge, 3.5 ft3/s Aug. 26-28, 1969.
EXTREMES FOR CURRENT YEAR.--Peak discharges greater than base discharge of 800 ft3/s and maximum (*):
Date TimeDischarge
(ft3/s)Gage height
(ft) Date TimeDischarge
(ft3/s)Gage height
(ft)
May 28 2130 *870 *5.80 No other peak greater than base discharge.
Minimum discharge, 24 ft3/s, Aug. 12-14.
DISCHARGE, CUBIC FEET PER SECOND WATER YEAR OCTOBER 2003 TO SEPTEMBER 2004
DAILY MEAN VALUES
DAY OCT NOV DEC JAN FEB MAR APR MAY JUN JUL AUG SEP
1 67 79 115 e96 258 186 312 279 495 151 45 432 93 86 111 110 227 177 290 301 471 150 47 443 85 86 109 107 208 170 281 340 460 127 46 474 77 84 106 e96 201 193 291 377 490 117 46 485 79 84 105 e90 188 189 319 405 485 110 45 45
6 80 84 118 e98 178 200 352 384 473 104 45 447 80 85 121 e110 179 205 369 343 441 99 43 428 80 87 116 118 171 231 369 316 399 95 41 429 e76 87 109 160 159 287 357 282 368 90 42 42
10 77 89 108 215 147 318 345 313 396 88 39 44
11 80 90 107 174 147 321 341 321 349 87 34 4512 87 e89 109 155 138 324 340 282 307 84 26 5813 83 e88 137 155 138 348 348 249 274 76 25 6814 82 88 143 156 145 350 350 216 259 71 25 8815 86 89 123 153 152 364 331 207 240 67 27 83
16 91 91 114 171 167 340 307 261 226 64 28 7917 84 98 113 170 389 348 296 244 204 62 32 7518 80 92 110 149 678 362 275 287 190 63 30 8119 77 92 110 144 477 388 258 405 178 79 27 7920 76 95 115 140 337 359 254 410 158 79 29 85
21 75 93 113 136 286 362 274 422 146 70 30 9022 77 90 109 126 253 422 259 497 133 65 39 8123 77 91 108 161 237 458 242 637 128 64 69 7824 78 92 115 300 242 464 232 584 124 63 49 7625 e78 91 116 222 226 425 223 516 118 62 58 73
26 80 94 110 187 234 388 221 518 118 62 72 7327 77 91 106 176 214 350 240 602 112 56 64 7528 77 93 112 246 207 316 298 754 115 54 57 7229 81 158 112 572 194 297 309 721 124 48 52 6730 84 133 e88 538 --- 312 286 603 135 43 49 6931 84 --- e90 312 --- 331 --- 536 --- 43 44 ---
TOTAL 2,488 2,789 3,478 5,743 6,777 9,785 8,969 12,612 8,116 2,493 1,305 1,936MEAN 80.3 93.0 112 185 234 316 299 407 271 80.4 42.1 64.5MAX 93 158 143 572 678 464 369 754 495 151 72 90MIN 67 79 88 90 138 170 221 207 112 43 25 42AC-FT 4,930 5,530 6,900 11,390 13,440 19,410 17,790 25,020 16,100 4,940 2,590 3,840
STATISTICS OF MONTHLY MEAN DATA FOR WATER YEARS 1969 - 2004, BY WATER YEAR (WY)
MEAN 94.8 124 156 202 226 309 341 427 313 105 41.5 54.7MAX 156 244 435 613 689 746 718 845 810 314 116 145(WY) (1983) (1974) (1997) (1997) (1982) (1984) (1984) (1984) (1982) (1982) (1984) (1984)MIN 65.8 78.2 89.6 88.1 88.8 88.6 88.1 85.4 53.9 25.9 10.4 24.2(WY) (1989) (2003) (2003) (1977) (1977) (1977) (1977) (1992) (1992) (1973) (1973) (1990)
logical Survey Water Resources Data—Oregon, Water year 2004, Volume 1: Surface Water, p. 175–177.

176 JOHN DAY RIVER BASIN
14038530 JOHN DAY RIVER NEAR JOHN DAY, OR—Continued
SUMMARY STATISTICS FOR 2003 CALENDAR YEAR FOR 2004 WATER YEAR WATER YEARS 1969 - 2004
ANNUAL TOTAL 63,231 66,491ANNUAL MEAN 173 182 199HIGHEST ANNUAL MEAN 393 1984LOWEST ANNUAL MEAN 73.5 1977HIGHEST DAILY MEAN 1,190 May 30 754 May 28 2,640 May 19, 1991LOWEST DAILY MEAN 14 Aug 28 25 Aug 13 3.5 Aug 27, 1969ANNUAL SEVEN-DAY MINIMUM 15 Aug 28 28 Aug 12 4.3 Aug 24, 1969ANNUAL RUNOFF (AC-FT) 125,400 131,900 144,40010 PERCENT EXCEEDS 393 371 44550 PERCENT EXCEEDS 110 118 12890 PERCENT EXCEEDS 30 48 39
e Estimated

""TThhiiss ppaaggee ccoonnttaaiinnss cchhaarrttss ggrraapphhiiccaallllyy ppoorrttrraayyiinngg tthhee ttaabbuullaarrddaattaa ccoonnttaaiinneedd oonntthhee 2004 Water Year
Annual Minimum 7-Day Average Streamflow
0
20
40
60
80
9691
1791
3791
5791
7791
9791
1891
3891
5891
7891
9891
1991
3991
5991
7991
9991
1002
3002
SSttrree
aammffll oo
ww ((cc
ffss))
Daily Mean Discharge
10
100
1,000
SSttrree
aammfflloo
ww ((cc
ffss))
0
200400600800
1,000
Oct Nov Dec Jan Feb Mar Apr May Jun Jul Aug Sep
SSttrree
aammff lloo
ww ((cc
ffss))
nneesstt ppaaggee.. SSkkiipp ttoo tthhee nneexxtt ppaaggee ttoo ggoo ddiirreeccttllyy ttoo tthhee ttaabbuullaarr ddaattaa.. .. ..""
Annual Peak Streamflow
0
2,000
4,000
6,000
8,000
9691
1791
3791
5791
7791
9791
1891
3891
5891
7891
9891
1991
3991
5991
7991
9991
1002
3002
SSttrree
aammffll oo
ww ((cc
ffss))
14038530 JOHN DAY RIVER NEAR JOHN DAY, OR25Latitude: 44
oLongitude: 118 54
o' '07" 19"
Drainage Area: 386 square milesDatum: 3,130.56 feetHydrologic Unit Code: 17070201
Grant County
Monthly StatisticsMonthly Mean of Current Water Year
JOHN DAY RIVER BASIN
Annual Mean Streamflow
0100200300400500
9691
1791
3791
5791
7791
9791
1891
3891
5891
7891
9891
1991
3991
5991
7991
9991
1002
3002
SS ttrr ee
aammffll oo
ww (( cc
ff ss))
Max, Mean, and Min Monthly Mean for 1969 2004 _
Oct Nov Dec Jan Feb Mar Apr May Jun Jul Aug Sep

178
U.S. Geo
JOHN DAY RIVER BASIN
14044000 MIDDLE FORK JOHN DAY RIVER AT RITTER, OR
LOCATION.--Lat 44°53'20", long 119°08'25", in SW 1⁄4 NW 1⁄4 sec.8, T.8 S., R.30 E., Grant County, Hydrologic Unit 17070203, on left bank 0.2 mi south of Ritter, 0.8 mi downstream from Twelvemile Creek, and at mile 14.9.
DRAINAGE AREA.--515 mi2.
PERIOD OF RECORD.--October 1929 to current year.
REVISED RECORDS.--WSP 739: 1931. WSP 1218: 1950. WSP 1448: 1930-32, 1937, drainage area.
GAGE.--Water-stage recorder. Datum of gage is 2,544.56 ft above NGVD of 1929.
REMARKS.--Records good except those for the period Oct. 31 to Feb. 17, which are fair, and estimated daily discharges, which are poor. No regulation. Diversions for irrigation upstream from station. Continuous water-quality records for the period July 1966 to September 1968 have been collected at this location.
AVERAGE DISCHARGE.--75 years (water years 1930-2004), 256 ft3/s, 185,400 acre-ft/yr.
EXTREMES FOR PERIOD OF RECORD.--Maximum discharge, 4,730 ft3/s Jan. 30, 1965, gage height, 8.39 ft, from rating curve extended above 2,200 ft3/s; maximum gage height, 9.13 ft Feb. 1, 1963, ice jam; minimum discharge, 0.90 ft3/s Aug. 19, 20, 1966.
EXTREMES FOR CURRENT YEAR.--Peak discharges greater than base discharge of 1,000 ft3/s and maximum (*):
Date TimeDischarge
(ft3/s)Gage height
(ft) Date TimeDischarge
(ft3/s)Gage height
(ft)
Mar 24 0430 1,920 5.87 May 23 2000 2,340 6.14Apr 7 0730 1,100 5.22 May 28 1800 *2,390 *6.19May 20 0230 1,150 5.27
Minimum discharge, 20 ft3/s Nov. 1, result of freezeup.
DISCHARGE, CUBIC FEET PER SECOND WATER YEAR OCTOBER 2003 TO SEPTEMBER 2004
DAILY MEAN VALUES
DAY OCT NOV DEC JAN FEB MAR APR MAY JUN JUL AUG SEP
1 32 28 81 e48 296 247 780 602 849 139 44 482 31 34 72 e46 234 236 668 656 767 147 45 473 30 41 65 e66 205 218 643 744 723 131 49 484 30 38 60 e70 188 222 695 799 754 120 50 485 32 e24 57 e66 172 208 834 819 713 111 47 47
6 33 e26 64 e58 156 213 963 771 661 105 46 457 32 e30 83 e52 148 232 1,040 681 591 99 45 448 31 42 76 e60 143 361 998 629 543 94 43 429 31 39 63 e100 128 636 966 572 506 92 41 41
10 31 41 59 e150 116 722 903 553 585 88 38 41
11 33 45 62 e120 113 749 859 564 559 86 36 4112 39 48 58 e100 104 754 857 507 476 83 34 4413 41 43 83 e88 93 953 879 465 437 79 33 5114 38 e32 125 e86 111 903 839 439 408 75 34 6115 40 40 100 e84 116 1,070 783 433 376 71 36 65
16 43 43 73 96 116 878 683 442 348 68 36 5717 44 48 68 116 119 1,060 619 429 325 66 46 5318 41 48 65 105 285 1,180 568 453 303 66 52 5219 38 44 58 98 464 1,410 522 584 280 75 43 5220 37 47 70 94 391 1,120 499 926 259 80 40 51
21 36 45 73 90 329 1,110 527 865 240 73 37 5122 34 39 62 72 292 1,500 554 787 220 65 45 5023 33 36 63 83 289 1,730 529 1,460 206 61 102 4824 33 37 64 127 301 1,750 504 1,540 195 58 74 4625 33 e38 68 114 271 1,370 491 990 181 55 63 45
26 33 e40 64 110 295 1,160 514 864 184 52 84 4427 34 e42 57 107 271 935 596 960 164 50 101 4428 34 44 60 120 269 803 705 1,770 150 49 73 4329 36 62 62 652 256 762 646 1,720 147 48 61 4230 39 110 e60 712 --- 848 590 1,220 147 47 55 4131 36 --- e58 385 --- 889 --- 988 --- 45 51 ---
TOTAL 1,088 1,274 2,133 4,275 6,271 26,229 21,254 25,232 12,297 2,478 1,584 1,432MEAN 35.1 42.5 68.8 138 216 846 708 814 410 79.9 51.1 47.7MAX 44 110 125 712 464 1,750 1,040 1,770 849 147 102 65MIN 30 24 57 46 93 208 491 429 147 45 33 41AC-FT 2,160 2,530 4,230 8,480 12,440 52,030 42,160 50,050 24,390 4,920 3,140 2,840
STATISTICS OF MONTHLY MEAN DATA FOR WATER YEARS 1930 - 2004, BY WATER YEAR (WY)
MEAN 44.1 72.6 127 163 247 477 749 706 346 79.8 32.7 32.5MAX 99.5 231 482 727 1,073 1,214 1,426 1,457 1,127 285 98.4 108(WY) (1983) (1974) (1956) (1997) (1996) (1972) (1984) (1984) (1984) (1984) (1984) (1984)MIN 17.4 20.2 29.0 23.4 31.3 69.8 175 79.2 56.6 17.4 3.75 10.0(WY) (1937) (1937) (1933) (1937) (1937) (1977) (1968) (1934) (1992) (1973) (1966) (1935)
logical Survey Water Resources Data—Oregon, Water year 2004, Volume 1: Surface Water, p. 178–180.

179JOHN DAY RIVER BASIN
14044000 MIDDLE FORK JOHN DAY RIVER AT RITTER, OR—Continued
SUMMARY STATISTICS FOR 2003 CALENDAR YEAR FOR 2004 WATER YEAR WATER YEARS 1930 - 2004
ANNUAL TOTAL 85,661 105,547ANNUAL MEAN 235 288 256HIGHEST ANNUAL MEAN 538 1984LOWEST ANNUAL MEAN 85.1 1977HIGHEST DAILY MEAN 1,360 Jan 31 1,770 May 28 4,360 Jan 30, 1965LOWEST DAILY MEAN 24 Nov 5 24 Nov 5 0.90 Aug 20, 1966ANNUAL SEVEN-DAY MINIMUM 28 Sep 1 31 Oct 2 1.1 Aug 19, 1966ANNUAL RUNOFF (AC-FT) 169,900 209,400 185,40010 PERCENT EXCEEDS 664 848 72550 PERCENT EXCEEDS 70 89 9090 PERCENT EXCEEDS 31 37 26
e Estimated

""TThhiiss ppaaggee ccoonnttaaiinnss cchhaarrttss ggrraapphhiiccaallllyy ppoorrttrraayyiinngg tthhee ttaabbuullaarrddaattaa ccoonnttaaiinneedd oonntthhee 2004 Water Year
Annual Minimum 7-Day Average Streamflow
0102030405060
0391
7391
4491
1591
8591
5691
2791
9791
6891
3991
0002
SSttrree
aammffll oo
ww ((cc
ffss))
Daily Mean Discharge
10
100
1,000
10,000
SSttrree
aammfflloo
ww ((cc
ffss))
0
500
1,000
1,500
2,000
Oct Nov Dec Jan Feb Mar Apr May Jun Jul Aug Sep
SSttrree
aammff lloo
ww ((cc
ffss))
nneesstt ppaaggee.. SSkkiipp ttoo tthhee nneexxtt ppaaggee ttoo ggoo ddiirreeccttllyy ttoo tthhee ttaabbuullaarr ddaattaa.. .. ..""
Annual Peak Streamflow
01,0002,0003,0004,0005,000
0391
7391
4491
1591
8591
5691
2791
9791
6891
3991
0002
SSttrree
aammffll oo
ww ((cc
ffss))
14044000 MIDDLE FORK JOHN DAY RIVER AT RITTER, OR53Latitude: 44
oLongitude: 119 08
o' '20" 25"
Drainage Area: 515 square milesDatum: 2,544.56 feetHydrologic Unit Code: 17070203
Grant County
Monthly StatisticsMonthly Mean of Current Water Year
JOHN DAY RIVER BASIN
Annual Mean Streamflow
0100200300400500600
0391
7391
4491
1591
8591
5691
2791
9791
6891
3991
0002
SS ttrr ee
aammffll oo
ww (( cc
ff ss))
Max, Mean, and Min Monthly Mean for 1930 2004 _
Oct Nov Dec Jan Feb Mar Apr May Jun Jul Aug Sep

181
U.S. Geo
JOHN DAY RIVER BASIN
14046000 NORTH FORK JOHN DAY RIVER AT MONUMENT, OR
LOCATION.--Lat 44°48'50", long 119°25'50", in SE 1⁄4 sec.2, T.9 S., R.27 E., Grant County, Hydrologic Unit 17070202, on right bank just downstream from entrance to canyon, 0.7 mi downstream from Cottonwood Creek, 0.8 mi west of Monument, and at mile 15.3.
DRAINAGE AREA.--2,520 mi2, approximately.
PERIOD OF RECORD.--March 1925 to current year. Monthly discharge only for some periods 1925-28, published in WSP 1318.
REVISED RECORDS.--WSP 754: 1932(M). WSP 1448: 1927, 1931(M), 1949.
GAGE.--Water-stage recorder. Datum of gage is 1,959.64 ft above NGVD of 1929. Prior to Nov. 24, 1925, nonrecording gage and Nov. 24, 1925, to Oct. 16, 1928, water-stage recorder at datum 1.10 ft higher. Oct. 17, 1928, to Sept. 30, 1930, water-stage recorder at datum 1.00 ft higher.
REMARKS.--Records good except those for the period November to February, which are fair and estimated daily discharges, which are poor. Very slight regulation by small reservoirs upstream. Many small diversions for irrigation upstream from station. Continuous water-quality records for the period July 1966 to September 1968 have been collected at this location. National Weather Service gage-height telemeter at station.
AVERAGE DISCHARGE.--76 years (water years 1929-2004), 1,293 ft3/s, 936,900 acre-ft/yr.
EXTREMES FOR PERIOD OF RECORD.--Maximum discharge, 33,400 ft3/s Jan. 30, 1965, gage height, 18.45 ft, from rating curve extended above 17,000 ft3/s; minimum discharge, 6 ft3/s sometime during period Nov. 2-13, 1936 (result of freezeup); minimum daily, 17 ft3/s Dec. 12, 1932.
EXTREMES FOR CURRENT YEAR.--Peak discharges greater than base discharge of 5,300 ft3/s and maximum (*):
Date TimeDischarge
(ft3/s)Gage height
(ft) Date TimeDischarge
(ft3/s)Gage height
(ft)
Jan 30 0545 6,200 8.15 May 24 0130 9,010 9.52Mar 24 0745 6,610 8.35 May 29 0045 *9,970 *9.99
Minimum discharge, 54 ft3/s, Nov. 6.
DISCHARGE, CUBIC FEET PER SECOND WATER YEAR OCTOBER 2003 TO SEPTEMBER 2004
DAILY MEAN VALUES
DAY OCT NOV DEC JAN FEB MAR APR MAY JUN JUL AUG SEP
1 79 115 352 215 2,380 1,680 3,720 2,700 4,650 703 146 1682 80 107 307 311 1,910 1,580 3,120 2,830 4,010 753 145 1593 78 116 283 328 1,660 1,470 2,910 3,130 3,570 678 155 1614 79 141 256 e300 1,480 1,370 3,060 3,340 3,430 600 170 1625 80 120 219 e240 1,330 1,360 3,630 3,370 3,230 548 171 159
6 82 76 230 e200 1,210 1,370 4,060 3,170 3,030 506 161 1537 84 83 281 e240 1,150 1,370 4,400 2,820 2,730 475 159 1438 83 130 336 384 1,080 2,060 4,370 2,580 2,610 444 154 1379 82 150 289 560 973 3,270 4,210 2,370 2,390 420 144 131
10 82 155 225 1,150 896 3,790 3,960 2,240 2,610 400 133 127
11 84 152 232 967 797 3,780 3,750 2,410 2,790 384 125 12812 94 160 257 843 736 3,750 3,730 2,280 2,340 373 117 12913 106 164 256 782 642 4,390 3,840 2,210 2,110 346 110 14214 121 137 499 767 756 4,040 3,800 1,980 1,950 321 110 17015 120 111 506 747 818 4,370 3,600 1,890 1,800 298 110 221
16 131 159 396 778 823 3,970 3,200 2,090 1,660 281 110 23017 148 175 320 866 1,120 4,450 2,830 2,110 1,530 262 115 20218 147 179 307 812 2,730 4,900 2,590 2,200 1,440 254 130 18619 132 163 242 773 3,760 5,690 2,380 2,980 1,360 292 132 17820 121 162 289 734 2,780 4,730 2,290 4,450 1,250 375 123 179
21 114 170 351 702 2,270 4,450 2,490 4,750 1,160 331 117 17322 110 155 332 627 1,940 5,270 2,760 4,890 1,100 280 131 17523 107 133 271 608 1,810 6,090 2,740 6,390 1,030 249 202 17124 113 122 307 1,240 1,800 6,240 2,660 7,950 981 228 353 16225 113 130 383 1,390 1,750 5,270 2,570 5,830 940 211 256 156
26 115 134 350 1,210 1,880 5,010 2,600 4,940 916 195 240 15027 116 138 302 1,100 1,940 4,260 2,900 5,490 853 185 344 14428 119 157 297 1,110 1,850 3,650 3,390 7,360 777 173 352 14029 121 179 306 3,100 1,760 3,420 3,330 8,870 752 165 259 13730 124 274 e200 5,600 --- 3,830 2,840 6,850 781 160 213 13431 139 --- e210 3,390 --- 4,210 --- 5,540 --- 151 184 ---
TOTAL 3,304 4,347 9,391 32,074 46,031 115,090 97,730 122,010 59,780 11,041 5,371 4,807MEAN 107 145 303 1,035 1,587 3,713 3,258 3,936 1,993 356 173 160MAX 148 274 506 5,600 3,760 6,240 4,400 8,870 4,650 753 353 230MIN 78 76 200 200 642 1,360 2,290 1,890 752 151 110 127AC-FT 6,550 8,620 18,630 63,620 91,300 228,300 193,800 242,000 118,600 21,900 10,650 9,530
STATISTICS OF MONTHLY MEAN DATA FOR WATER YEARS 1929 - 2004, BY WATER YEAR (WY)
MEAN 159 311 709 946 1,457 2,478 3,629 3,577 1,655 376 133 121MAX 420 1,621 3,374 4,126 6,103 6,456 6,695 8,794 5,227 1,211 345 423(WY) (1983) (1974) (1965) (1965) (1996) (1983) (1943) (1948) (1948) (1982) (1984) (1984)MIN 58.5 64.5 96.6 75.8 134 345 822 378 259 97.4 36.6 45.2(WY) (1937) (1937) (1937) (1937) (1929) (1977) (1968) (1934) (1992) (1973) (1931) (1934)
logical Survey Water Resources Data—Oregon, Water year 2004, Volume 1: Surface Water, p. 181–183.

182 JOHN DAY RIVER BASIN
14046000 NORTH FORK JOHN DAY RIVER AT MONUMENT, OR—Continued
SUMMARY STATISTICS FOR 2003 CALENDAR YEAR FOR 2004 WATER YEAR WATER YEARS 1929 - 2004
ANNUAL TOTAL 391,320 510,976ANNUAL MEAN 1,072 1,396 1,293HIGHEST ANNUAL MEAN 2,608 1984LOWEST ANNUAL MEAN 441 1977HIGHEST DAILY MEAN 6,410 Jan 31 8,870 May 29 31,900 Jan 30, 1965LOWEST DAILY MEAN 52 Sep 6 76 Nov 6 17 Dec 12, 1932ANNUAL SEVEN-DAY MINIMUM 56 Sep 1 80 Oct 1 29 Aug 28, 1931ANNUAL RUNOFF (AC-FT) 776,200 1,014,000 936,90010 PERCENT EXCEEDS 3,240 3,880 3,72050 PERCENT EXCEEDS 306 460 42090 PERCENT EXCEEDS 80 121 98
e Estimated

""TThhiiss ppaaggee ccoonnttaaiinnss cchhaarrttss ggrraapphhiiccaallllyy ppoorrttrraayyiinngg tthhee ttaabbuullaarrddaattaa ccoonnttaaiinneedd oonntthhee 2004 Water Year
Annual Minimum 7-Day Average Streamflow
0
50
100
150
200
9291
6391
3491
0591
7591
4691
1791
8791
5891
2991
9991
SSttrree
aammffll oo
ww ((cc
ffss))
Daily Mean Discharge
10
100
1,000
10,000
SSttrree
aammfflloo
ww ((cc
ffss))
0
2,0004,0006,0008,000
10,000
Oct Nov Dec Jan Feb Mar Apr May Jun Jul Aug Sep
SSttrree
aammff lloo
ww ((cc
ffss))
nneesstt ppaaggee.. SSkkiipp ttoo tthhee nneexxtt ppaaggee ttoo ggoo ddiirreeccttllyy ttoo tthhee ttaabbuullaarr ddaattaa.. .. ..""
Annual Peak Streamflow
0
10,000
20,000
30,000
40,000
5291
2391
9391
6491
3591
0691
7691
4791
1891
8891
5991
2002
SSttrree
aammffll oo
ww ((cc
ffss))
14046000 NORTH FORK JOHN DAY RIVER AT MONUMENT, OR48Latitude: 44
oLongitude: 119 25
o' '50" 50"
Drainage Area: 2,520 square milesDatum: 1,959.64 feetHydrologic Unit Code: 17070202
Grant County
Monthly StatisticsMonthly Mean of Current Water Year
JOHN DAY RIVER BASIN
Annual Mean Streamflow
0500
1,0001,5002,0002,5003,000
9291
6391
3491
0591
7591
4691
1791
8791
5891
2991
9991
SS ttrr ee
aammffll oo
ww (( cc
ff ss))
Max, Mean, and Min Monthly Mean for 1929 2004 _
Oct Nov Dec Jan Feb Mar Apr May Jun Jul Aug Sep

184
U.S. Geo
JOHN DAY RIVER BASIN
14046500 JOHN DAY RIVER AT SERVICE CREEK, OR
LOCATION.--Lat 44°47'38", long 120°00'20", in NW 1⁄4 NE 1⁄4 sec.18, T.9 S., R.23 E., Wheeler County, Hydrologic Unit 17070204, on left bank 0.2 mi downstream from bridge on State Highway 207, 0.8 mi downstream from Service Creek, 0.5 mi southwest of town of Service Creek, and at mile 156.7.
DRAINAGE AREA.--5,090 mi2, approximately.
PERIOD OF RECORD.--March 1925 to September 1926, October 1929 to current year. Monthly discharge only March 1925 to September 1926, published in WSP 1318.
GAGE.--Water-stage recorder. Datum of gage is 1,632.42 ft above NGVD of 1929. See WSP 1738 for history of changes prior to Feb. 24, 1957.
REMARKS.--No estimated daily discharges. Records fair. Slight regulation by several small reservoirs upstream from station. Many small diversions for irrigation upstream from station. U.S. Geological Survey satellite telemeter at station.
AVERAGE DISCHARGE.--75 years (water years 1930-2004), 1,929 ft3/s, 1,398,000 acre-ft/yr.
EXTREMES FOR PERIOD OF RECORD.--Maximum discharge, 40,200 ft3/s Dec. 23, 1964, gage height, 17.85 ft, from rating curve extended above 14,000 ft3/s on basis of slope-area measurement of peak flow; minimum discharge, 6.0 ft3/s Aug. 23, 24, 1973.
EXTREMES FOR CURRENT YEAR.--Peak discharges greater than base discharge of 7,300 ft3/s and maximum (*):
Date TimeDischarge
(ft3/s)Gage height
(ft) Date TimeDischarge
(ft3/s)Gage height
(ft)
Jan 30 1430 7,580 7.89 May 24 0900 11,700 9.56Mar 24 1530 8,780 8.43 May 29 0800 *12,300 *9.81
Minimum discharge, 102 ft3/s, Aug. 14, 16-19.
DISCHARGE, CUBIC FEET PER SECOND WATER YEAR OCTOBER 2003 TO SEPTEMBER 2004
DAILY MEAN VALUES
DAY OCT NOV DEC JAN FEB MAR APR MAY JUN JUL AUG SEP
1 106 280 559 468 3,720 2,530 5,390 3,560 6,380 1,060 154 2542 120 272 581 484 2,920 2,440 4,660 3,580 5,550 1,060 143 2293 146 267 536 562 2,530 2,320 4,200 3,830 4,960 1,050 143 2164 192 276 507 574 2,260 2,150 4,190 4,130 4,650 954 143 2255 211 293 481 509 2,070 2,160 4,650 4,260 4,500 876 159 229
6 209 284 448 466 1,890 2,090 5,280 4,160 4,210 805 171 2247 210 246 470 412 1,780 2,110 5,700 3,810 3,950 729 157 2208 212 238 546 479 1,690 2,520 5,800 3,420 3,710 673 157 2139 212 280 565 704 1,590 4,100 5,610 3,160 3,440 628 145 204
10 210 306 520 1,030 1,450 5,300 5,320 2,940 3,360 583 138 197
11 211 319 453 1,380 1,320 5,440 5,030 3,150 3,860 556 126 19312 214 319 476 1,220 1,260 5,360 4,890 3,100 3,320 536 119 18513 228 325 513 1,150 1,150 5,970 4,920 3,010 2,960 509 113 18514 244 329 561 1,100 1,140 5,970 4,990 2,720 2,700 471 105 18815 267 312 872 1,140 1,280 6,240 4,890 2,530 2,510 426 107 224
16 272 284 768 1,170 1,360 6,070 4,530 2,570 2,320 389 102 29217 278 328 653 1,270 1,880 6,140 4,040 2,820 2,130 370 102 32418 297 349 581 1,330 3,790 6,680 3,740 3,230 1,980 350 103 30919 296 356 556 1,240 6,210 7,510 3,430 4,570 1,850 445 109 28920 278 342 500 1,190 4,810 7,050 3,240 5,690 1,740 520 124 284
21 264 342 557 1,150 3,810 6,300 3,400 6,320 1,610 495 120 29222 259 347 608 1,110 3,210 6,830 3,770 6,460 1,510 426 124 28923 248 337 580 1,030 2,850 7,960 3,740 7,630 1,410 351 157 28924 241 316 526 1,410 2,740 8,450 3,660 10,900 1,320 304 246 27325 247 304 590 2,250 2,770 7,630 3,510 8,380 1,250 271 401 258
26 251 314 645 1,900 2,750 6,980 3,420 6,850 1,200 238 337 24527 255 315 599 1,720 2,910 6,300 3,570 7,020 1,160 216 334 23228 260 322 569 1,610 2,750 5,440 4,050 8,090 1,070 200 439 21929 261 360 587 2,450 2,660 4,910 4,420 11,600 1,030 183 428 23130 263 405 542 6,700 --- 5,020 3,900 9,200 1,090 172 344 22831 266 --- 453 5,550 --- 5,630 --- 7,500 --- 168 287 ---
TOTAL 7,228 9,367 17,402 44,758 72,550 161,600 131,940 160,190 82,730 16,014 5,837 7,240MEAN 233 312 561 1,444 2,502 5,213 4,398 5,167 2,758 517 188 241MAX 297 405 872 6,700 6,210 8,450 5,800 11,600 6,380 1,060 439 324MIN 106 238 448 412 1,140 2,090 3,240 2,530 1,030 168 102 185AC-FT 14,340 18,580 34,520 88,780 143,900 320,500 261,700 317,700 164,100 31,760 11,580 14,360
STATISTICS OF MONTHLY MEAN DATA FOR WATER YEARS 1930 - 2004, BY WATER YEAR (WY)
MEAN 328 586 1,182 1,580 2,358 3,765 5,211 4,894 2,386 559 179 182MAX 811 2,284 5,540 6,553 8,239 9,773 10,280 12,050 8,327 1,850 594 862(WY) (1985) (1974) (1965) (1997) (1996) (1983) (1984) (1948) (1948) (1982) (1984) (1984)MIN 70.5 152 216 195 358 597 1,010 491 302 90.6 15.2 31.4(WY) (1937) (1937) (1936) (1937) (1937) (1977) (1968) (1934) (1992) (1973) (1973) (1935)
logical Survey Water Resources Data—Oregon, Water year 2004, Volume 1: Surface Water, p. 184–186.

185JOHN DAY RIVER BASIN
14046500 JOHN DAY RIVER AT SERVICE CREEK, OR—Continued
SUMMARY STATISTICS FOR 2003 CALENDAR YEAR FOR 2004 WATER YEAR WATER YEARS 1930 - 2004
ANNUAL TOTAL 556,948 716,856ANNUAL MEAN 1,526 1,959 1,929HIGHEST ANNUAL MEAN 4,116 1984LOWEST ANNUAL MEAN 619 1977HIGHEST DAILY MEAN 6,670 Jan 31 11,600 May 29 36,400 Jan 30, 1965LOWEST DAILY MEAN 42 Aug 21 102 Aug 16 6.2 Aug 23, 1973ANNUAL SEVEN-DAY MINIMUM 44 Aug 16 106 Aug 13 7.7 Aug 19, 1973ANNUAL RUNOFF (AC-FT) 1,105,000 1,422,000 1,398,00010 PERCENT EXCEEDS 4,680 5,470 5,36050 PERCENT EXCEEDS 576 688 74190 PERCENT EXCEEDS 90 203 134

""TThhiiss ppaaggee ccoonnttaaiinnss cchhaarrttss ggrraapphhiiccaallllyy ppoorrttrraayyiinngg tthhee ttaabbuullaarrddaattaa ccoonnttaaiinneedd oonntthhee 2004 Water Year
Annual Minimum 7-Day Average Streamflow
0
100
200
300
400
0391
7391
4491
1591
8591
5691
2791
9791
6891
3991
0002
SSttrree
aammffll oo
ww ((cc
ffss))
Daily Mean Discharge
100
1,000
10,000
100,000
SSttrree
aammfflloo
ww ((cc
ffss))
0
5,000
10,000
15,000
Oct Nov Dec Jan Feb Mar Apr May Jun Jul Aug Sep
SSttrree
aammff lloo
ww ((cc
ffss))
nneesstt ppaaggee.. SSkkiipp ttoo tthhee nneexxtt ppaaggee ttoo ggoo ddiirreeccttllyy ttoo tthhee ttaabbuullaarr ddaattaa.. .. ..""
Annual Peak Streamflow
010,00020,00030,00040,00050,000
6291
3391
0491
7491
4591
1691
8691
5791
2891
9891
6991
3002
SSttrree
aammffll oo
ww ((cc
ffss))
14046500 JOHN DAY RIVER AT SERVICE CREEK, OR47Latitude: 44
oLongitude: 120 00
o' '38" 20"
Drainage Area: 5,090 square milesDatum: 1,632.42 feetHydrologic Unit Code: 17070204
Wheeler County
Monthly StatisticsMonthly Mean of Current Water Year
JOHN DAY RIVER BASIN
Annual Mean Streamflow
01,0002,0003,0004,0005,000
0391
7391
4491
1591
8591
5691
2791
9791
6891
3991
0002
SS ttrr ee
aammffll oo
ww (( cc
ff ss))
Max, Mean, and Min Monthly Mean for 1930 2004 _
Oct Nov Dec Jan Feb Mar Apr May Jun Jul Aug Sep

187
U.S. Geo
JOHN DAY RIVER BASIN
14046890 PINE CREEK NEAR CLARNO, OR
LOCATION.--Lat 44°54'38", long 120°26'23", in SW 1⁄4 SW 1⁄4 sec.34, T.7 N., R.19 E., Wheeler County, Hydrologic Unit 17070204, on left bank 1.5 mi east of Clarno, and at mile 0.4.
DRAINAGE AREA.--65.0 mi2.
WATER-DISCHARGE RECORDS
PERIOD OF RECORD.--October 2003 to September 2004.
GAGE.--Water-stage recorder and crest-stage gage. Elevation of gage is 1,350 ft above NGVD of 1929.
REMARKS.--Records good except for estimated daily discharges, which are poor. No known diversions or regulation
EXTREMES FOR CURRENT YEAR.--Maximum discharge, 28 ft3/s Feb. 19, gage height, 6.18 ft; minimum discharge, 0.26 ft3/s Jan. 9-11.
DISCHARGE, CUBIC FEET PER SECOND WATER YEAR OCTOBER 2003 TO SEPTEMBER 2004
DAILY MEAN VALUES
DAY OCT NOV DEC JAN FEB MAR APR MAY JUN JUL AUG SEP
1 e1.1 e0.76 0.50 0.40 11 15 8.2 7.2 5.1 4.0 1.2 0.942 e1.1 e0.76 0.48 0.36 11 14 8.2 7.1 4.9 3.9 1.2 0.923 e1.1 e0.76 0.46 0.35 11 15 7.8 7.1 4.7 3.7 1.1 0.934 e1.1 e0.76 0.46 0.35 11 14 7.8 7.1 4.5 3.5 1.3 0.925 e1.1 e0.76 0.42 0.35 11 14 7.7 7.1 4.5 3.1 1.3 0.95
6 e1.1 e0.74 0.38 e0.34 11 14 7.7 e7.1 4.7 3.0 1.3 0.957 1.0 e0.74 0.37 e0.32 10 14 7.7 e7.1 4.6 2.6 1.1 0.938 0.99 e0.74 0.38 e0.30 10 13 7.7 e7.0 4.5 2.8 1.2 0.909 1.0 e0.74 0.39 e0.28 10 13 7.6 e7.0 5.3 2.6 1.2 0.78
10 0.98 e0.72 0.39 0.29 10 13 7.5 e6.6 5.7 2.7 1.1 0.81
11 1.1 e0.72 0.40 0.33 10 12 7.4 e6.0 5.8 2.5 1.2 0.8212 1.1 e0.72 0.39 0.32 10 12 7.2 e6.2 5.8 2.4 1.2 0.8413 1.0 e0.72 0.41 0.30 9.9 11 7.3 e6.0 5.7 2.3 1.3 0.8414 1.0 e0.72 0.40 0.30 9.7 11 7.5 e5.8 5.9 2.3 1.5 0.8315 1.0 e0.70 0.41 0.33 9.6 11 7.7 e5.6 5.9 2.4 1.3 0.82
16 0.96 e0.70 0.42 0.35 10 11 7.6 e5.4 5.6 2.4 1.3 0.8017 0.99 e0.70 0.42 0.42 15 10 7.6 e5.3 5.4 2.3 1.3 0.7918 0.98 e0.70 0.41 0.57 25 10 7.6 e5.2 5.3 2.2 1.3 0.7619 0.91 e0.70 0.41 0.86 26 10 7.5 e5.2 5.0 2.2 1.2 0.7820 0.95 e0.70 0.41 1.5 26 9.7 7.5 e5.2 4.8 2.2 1.3 0.79
21 0.99 0.68 0.41 2.4 25 8.9 7.7 5.2 4.7 2.0 1.3 0.7922 1.0 0.67 0.40 3.6 25 8.7 7.5 5.6 4.6 2.0 1.3 0.7823 1.0 0.66 0.43 5.4 25 8.6 7.6 6.0 4.4 1.9 1.2 0.7424 1.0 0.65 0.43 10 25 8.0 7.6 5.8 4.6 1.8 1.1 0.7425 0.94 0.61 0.43 12 25 8.1 7.5 5.8 4.5 1.6 1.0 0.71
26 0.87 0.58 0.42 12 22 8.2 7.4 6.0 4.1 1.6 0.87 0.6927 0.88 0.58 0.42 11 18 7.9 7.4 5.8 4.0 e1.7 0.82 0.7828 0.83 0.58 0.44 11 16 7.9 7.5 5.8 4.1 e1.4 0.99 0.7829 e0.81 0.54 0.42 12 16 8.2 7.4 5.8 4.3 1.3 0.95 0.7730 e0.78 0.53 0.40 12 --- 8.6 7.3 5.5 4.2 1.3 0.90 0.7631 e0.78 --- 0.39 12 --- 8.4 --- 5.4 --- 1.2 0.86 ---
TOTAL 30.44 20.64 12.90 112.02 454.2 338.2 227.7 189.0 147.2 72.9 36.19 24.64MEAN 0.98 0.69 0.42 3.61 15.7 10.9 7.59 6.10 4.91 2.35 1.17 0.82MAX 1.1 0.76 0.50 12 26 15 8.2 7.2 5.9 4.0 1.5 0.95MIN 0.78 0.53 0.37 0.28 9.6 7.9 7.2 5.2 4.0 1.2 0.82 0.69AC-FT 60 41 26 222 901 671 452 375 292 145 72 49CFSM 0.02 0.01 0.01 0.06 0.24 0.17 0.12 0.09 0.08 0.04 0.02 0.01IN. 0.02 0.01 0.01 0.06 0.26 0.19 0.13 0.11 0.08 0.04 0.02 0.01
WTR YR2004 TOTAL 1,666.03 MEAN 4.55 MAX 26 MIN 0.28 AC-FT 3300 CFSM 0.07 IN. 0.95
e Estimated
logical Survey Water Resources Data—Oregon, Water year 2004, Volume 1: Surface Water, p. 187–187.

188
U.S. Geo
JOHN DAY RIVER BASIN
14046890 PINE CREEK NEAR CLARNO, OR—Continued
WATER-QUALITY RECORDS
PERIOD OF DAILY RECORD.-- WATER TEMPERATURE: January to September 2004. PRECIPITATION: June to September 2004.
INSTRUMENTATION.--Water-temperature recorder and precipitation gage.
REMARKS.-- WATER TEMPERATURE: Records excellent except for the period Mar. 10 to Apr. 4, which are good, and those for the period Jan. 16 to Mar. 9, which
are fair. PRECIPITATION: Records fair.
EXTREMES FOR CURRENT YEAR.-- WATER TEMPERATURE FOR PERIOD JANUARY TO SEPTEMBER: Maximum 21.7°C June 4; minimum, 4.8°C Feb. 20. PRECIPITATION FOR PERIOD JUNE TO SEPTEMBER: Maximum daily precipitation, 0.32 inches Aug. 22.
TEMPERATURE, WATER, DEGREES CELSIUS WATER YEAR OCTOBER 2003 TO SEPTEMBER 2004
DAY MAX MIN MEAN MAX MIN MEAN MAX MIN MEAN MAX MIN MEAN
OCTOBER NOVEMBER DECEMBER JANUARY
1 --- --- --- --- --- --- --- --- --- --- --- ---2 --- --- --- --- --- --- --- --- --- --- --- ---3 --- --- --- --- --- --- --- --- --- --- --- ---4 --- --- --- --- --- --- --- --- --- --- --- ---5 --- --- --- --- --- --- --- --- --- --- --- ---
6 --- --- --- --- --- --- --- --- --- --- --- ---7 --- --- --- --- --- --- --- --- --- --- --- ---8 --- --- --- --- --- --- --- --- --- --- --- ---9 --- --- --- --- --- --- --- --- --- --- --- ---
10 --- --- --- --- --- --- --- --- --- --- --- ---
11 --- --- --- --- --- --- --- --- --- --- --- ---12 --- --- --- --- --- --- --- --- --- --- --- ---13 --- --- --- --- --- --- --- --- --- --- --- ---14 --- --- --- --- --- --- --- --- --- --- --- ---15 --- --- --- --- --- --- --- --- --- --- --- ---
16 --- --- --- --- --- --- --- --- --- 10.1 --- ---17 --- --- --- --- --- --- --- --- --- 10.2 8.6 9.218 --- --- --- --- --- --- --- --- --- 11.2 8.4 9.419 --- --- --- --- --- --- --- --- --- 10.6 8.5 9.320 --- --- --- --- --- --- --- --- --- 10.1 8.7 9.3
21 --- --- --- --- --- --- --- --- --- 9.0 7.7 8.222 --- --- --- --- --- --- --- --- --- 8.6 7.2 7.823 --- --- --- --- --- --- --- --- --- 8.2 7.3 7.824 --- --- --- --- --- --- --- --- --- 7.8 5.5 7.025 --- --- --- --- --- --- --- --- --- 7.2 5.3 6.2
26 --- --- --- --- --- --- --- --- --- 7.7 5.9 6.627 --- --- --- --- --- --- --- --- --- 8.5 6.1 7.328 --- --- --- --- --- --- --- --- --- 9.0 7.5 8.229 --- --- --- --- --- --- --- --- --- 10.4 8.4 9.230 --- --- --- --- --- --- --- --- --- 8.7 6.0 7.531 --- --- --- --- --- --- --- --- --- 7.3 5.3 6.4
MONTH --- --- --- --- --- --- --- --- --- --- --- ---
logical Survey Water Resources Data—Oregon, Water Year 2004, Volume 1: Surface Water, p. 188–190.

189JOHN DAY RIVER BASIN
14046890 PINE CREEK NEAR CLARNO, OR—Continued
FEBRUARY MARCH APRIL MAY
1 7.6 5.8 6.7 8.7 7.1 8.1 12.3 7.1 9.4 18.5 10.6 14.52 7.3 6.6 6.8 10.5 5.6 7.7 13.5 6.5 9.9 19.8 11.7 15.43 7.9 6.1 6.9 7.7 5.8 6.7 15.5 8.9 11.7 19.9 11.9 15.54 8.8 6.2 7.3 9.4 6.5 7.8 16.5 9.3 12.5 18.5 11.6 14.65 7.9 4.9 6.4 10.1 5.8 7.6 13.9 10.4 11.9 17.7 10.3 13.5
6 8.0 6.7 7.2 8.8 6.0 7.6 16.3 9.7 12.6 14.1 10.1 12.37 8.6 6.7 7.4 13.2 7.0 9.9 15.0 9.4 12.1 16.1 10.0 13.08 8.3 5.8 6.9 13.4 8.2 10.6 16.0 9.2 12.2 17.4 11.5 13.89 8.0 4.9 6.4 11.5 8.3 9.6 16.0 8.6 11.9 16.1 10.7 13.1
10 8.2 5.2 6.5 12.0 6.6 9.0 16.4 8.9 12.3 14.1 11.3 12.4
11 7.6 5.3 6.6 12.0 6.8 9.2 16.9 9.1 12.7 13.7 10.3 12.012 8.7 6.2 7.4 13.0 7.4 9.9 16.4 10.0 12.8 15.7 10.8 12.713 8.1 6.1 7.1 11.6 6.9 9.2 13.5 10.2 11.6 18.1 9.5 13.514 9.3 6.8 8.0 13.1 8.3 10.3 13.0 8.9 10.9 18.9 10.5 14.315 9.9 7.1 8.3 11.6 7.5 9.6 12.7 8.6 10.7 14.5 11.6 13.0
16 8.3 7.4 7.8 13.6 8.0 10.4 13.7 8.4 10.7 16.6 11.3 13.517 8.8 7.5 8.1 13.3 8.0 10.3 14.1 9.2 11.3 16.4 11.2 13.418 9.1 7.0 7.9 13.9 8.7 10.8 13.6 9.4 11.4 15.3 12.3 13.419 8.5 6.2 7.2 12.5 7.3 9.5 13.9 8.6 11.3 17.2 11.2 13.920 8.5 4.8 6.6 12.2 6.8 9.2 12.5 9.4 11.0 19.4 12.0 15.0
21 8.7 6.2 7.1 13.5 8.0 10.7 12.8 9.3 11.0 19.3 11.9 15.122 9.0 6.2 7.4 15.2 8.8 11.8 16.7 8.2 12.2 15.7 11.6 13.323 9.3 6.2 7.6 14.3 9.5 11.5 13.5 9.6 11.4 15.9 11.5 13.124 9.5 6.3 7.7 11.9 8.4 9.9 16.1 8.3 11.9 17.3 10.1 13.225 8.9 5.7 7.1 10.6 8.4 9.6 17.6 9.1 13.0 19.3 10.6 14.7
26 9.4 6.7 8.0 10.6 7.4 9.2 19.0 10.3 14.4 15.3 13.5 14.327 9.4 6.1 7.8 13.4 8.5 10.4 16.6 11.1 13.7 14.7 12.0 13.328 9.5 7.3 8.3 14.3 7.0 10.4 13.6 9.6 11.4 14.8 11.6 12.929 10.2 6.4 8.2 15.0 7.9 11.3 17.3 8.5 12.6 14.6 9.9 12.130 --- --- --- 10.8 8.4 9.9 18.7 9.8 13.9 16.4 10.8 13.431 --- --- --- 12.0 7.3 9.3 --- --- --- 18.3 11.1 14.2
MONTH 10.2 4.8 7.3 15.2 5.6 9.6 19.0 6.5 11.9 19.9 9.5 13.6
JUNE JULY AUGUST SEPTEMBER
1 19.4 10.8 14.8 20.1 13.9 17.1 19.1 14.4 16.7 17.1 14.0 15.52 20.4 11.8 15.8 19.7 13.7 16.7 18.2 14.8 16.3 15.1 12.7 13.93 20.7 13.3 16.7 19.6 14.7 17.0 19.0 14.7 16.7 16.5 12.1 14.24 21.7 13.4 17.3 19.8 13.4 16.6 18.7 14.5 16.3 17.2 12.6 14.65 17.9 13.8 15.7 19.9 12.9 16.4 17.9 14.9 16.2 17.1 12.6 14.6
6 16.1 12.0 13.9 19.1 13.8 16.6 17.0 14.6 15.5 16.7 11.8 14.17 17.1 11.9 14.0 18.7 14.0 16.2 18.1 13.3 15.5 16.5 12.1 14.28 15.5 12.0 13.5 18.6 12.2 15.4 18.4 13.5 15.9 17.2 12.4 14.69 15.8 12.3 13.9 18.8 13.0 15.9 18.9 14.2 16.4 15.5 13.2 14.4
10 18.0 12.4 14.7 18.6 12.9 15.7 19.3 14.7 16.8 16.9 12.3 14.5
11 16.7 11.2 13.9 18.8 12.5 15.7 19.3 14.8 16.9 15.6 13.8 14.712 17.8 11.0 14.2 19.4 13.0 16.3 19.2 14.5 16.6 15.4 13.4 14.313 18.7 12.9 15.6 20.0 14.0 17.0 19.4 14.7 16.9 15.4 12.8 13.814 18.9 12.0 15.3 20.0 14.3 17.2 17.0 15.5 16.3 15.9 12.3 13.915 18.8 11.7 15.0 20.0 14.6 17.3 18.7 14.5 16.4 15.9 13.1 14.4
16 19.4 10.9 15.0 19.8 14.2 17.0 18.1 16.1 16.9 15.8 12.5 14.117 20.0 11.8 15.8 19.6 15.2 17.3 19.5 15.3 17.1 14.4 12.8 13.518 19.8 12.6 16.0 17.9 15.5 16.8 19.2 14.9 16.9 15.1 12.2 13.319 20.0 12.2 15.9 18.1 14.8 16.4 19.6 14.9 17.0 14.9 10.7 12.620 20.1 12.1 16.0 19.3 13.8 16.5 19.8 15.7 17.4 14.2 12.0 13.0
21 20.8 12.3 16.5 19.2 14.0 16.5 17.8 15.0 16.3 15.2 10.7 12.722 21.4 13.7 17.4 19.1 13.4 16.2 15.8 14.1 15.2 15.6 10.9 13.123 21.6 14.5 17.9 19.5 13.8 16.7 16.4 13.2 14.8 16.2 11.9 13.824 20.4 14.1 17.4 20.1 14.7 17.4 15.4 14.2 14.7 16.2 11.7 13.825 20.9 13.8 17.3 20.2 15.6 17.7 16.6 13.8 14.9 16.4 11.9 14.0
26 20.5 13.8 17.1 19.1 13.8 16.4 15.5 13.9 14.6 16.5 12.3 14.127 20.0 13.3 16.6 19.0 14.2 16.6 18.0 13.4 15.5 16.5 12.1 14.028 20.4 13.4 16.9 19.3 14.4 16.8 18.1 13.5 15.6 15.9 12.0 13.829 20.5 14.2 17.1 19.5 15.1 17.2 18.5 13.7 15.8 16.1 12.0 13.730 21.0 15.1 17.7 19.6 15.1 17.2 18.6 13.7 15.9 15.4 11.1 13.131 --- --- --- 19.4 14.6 16.9 18.4 13.9 16.0 --- --- ---
MONTH 21.7 10.8 15.8 20.2 12.2 16.7 19.8 13.2 16.1 17.2 10.7 13.9
TEMPERATURE, WATER, DEGREES CELSIUS—CONTINUEDWATER YEAR OCTOBER 2003 TO SEPTEMBER 2004
DAY MAX MIN MEAN MAX MIN MEAN MAX MIN MEAN MAX MIN MEAN

190 JOHN DAY RIVER BASIN
14046890 PINE CREEK NEAR CLARNO, OR—Continued
PRECIPITATION, TOTAL, INCHES WATER YEAR OCTOBER 2003 TO SEPTEMBER 2004
DAILY SUM VALUES
DAY OCT NOV DEC JAN FEB MAR APR MAY JUN JUL AUG SEP
1 --- --- --- --- --- --- --- --- 0.00 0.00 0.00 0.002 --- --- --- --- --- --- --- --- 0.00 0.00 0.00 0.003 --- --- --- --- --- --- --- --- 0.00 0.00 0.00 0.004 --- --- --- --- --- --- --- --- 0.00 0.00 0.13 0.005 --- --- --- --- --- --- --- --- 0.00 0.00 0.00 0.00
6 --- --- --- --- --- --- --- --- 0.04 0.00 0.00 0.007 --- --- --- --- --- --- --- --- --- 0.00 0.00 0.008 --- --- --- --- --- --- --- --- --- 0.00 0.00 0.009 --- --- --- --- --- --- --- --- 0.27 0.00 0.00 0.00
10 --- --- --- --- --- --- --- --- 0.00 0.00 0.00 0.00
11 --- --- --- --- --- --- --- --- 0.00 0.00 0.00 0.0012 --- --- --- --- --- --- --- --- 0.00 0.00 0.00 0.0013 --- --- --- --- --- --- --- --- 0.00 0.00 0.00 0.0014 --- --- --- --- --- --- --- --- 0.00 0.00 0.00 0.0015 --- --- --- --- --- --- --- --- 0.00 0.00 0.00 0.03
16 --- --- --- --- --- --- --- --- 0.00 0.00 0.00 0.0017 --- --- --- --- --- --- --- --- 0.00 0.00 0.00 0.0318 --- --- --- --- --- --- --- --- 0.00 0.00 0.00 0.0019 --- --- --- --- --- --- --- --- 0.00 0.03 0.00 0.0020 --- --- --- --- --- --- --- --- 0.00 0.00 0.00 0.00
21 --- --- --- --- --- --- --- --- 0.00 0.00 0.05 0.0022 --- --- --- --- --- --- --- --- 0.00 0.00 0.32 0.0023 --- --- --- --- --- --- --- --- 0.00 0.00 0.00 0.0024 --- --- --- --- --- --- --- --- 0.00 0.00 0.00 0.0025 --- --- --- --- --- --- --- --- 0.00 0.00 0.00 0.00
26 --- --- --- --- --- --- --- --- 0.00 0.00 0.00 0.0027 --- --- --- --- --- --- --- --- 0.00 --- 0.00 0.0028 --- --- --- --- --- --- --- --- 0.00 --- 0.00 0.0029 --- --- --- --- --- --- --- --- 0.17 0.00 0.00 0.0030 --- --- --- --- --- --- --- --- 0.00 0.00 0.00 0.0031 --- --- --- --- --- --- --- --- --- 0.00 0.00 ---
TOTAL --- --- --- --- --- --- --- --- --- --- 0.50 0.06
191
U.S. Geo
JOHN DAY RIVER BASIN
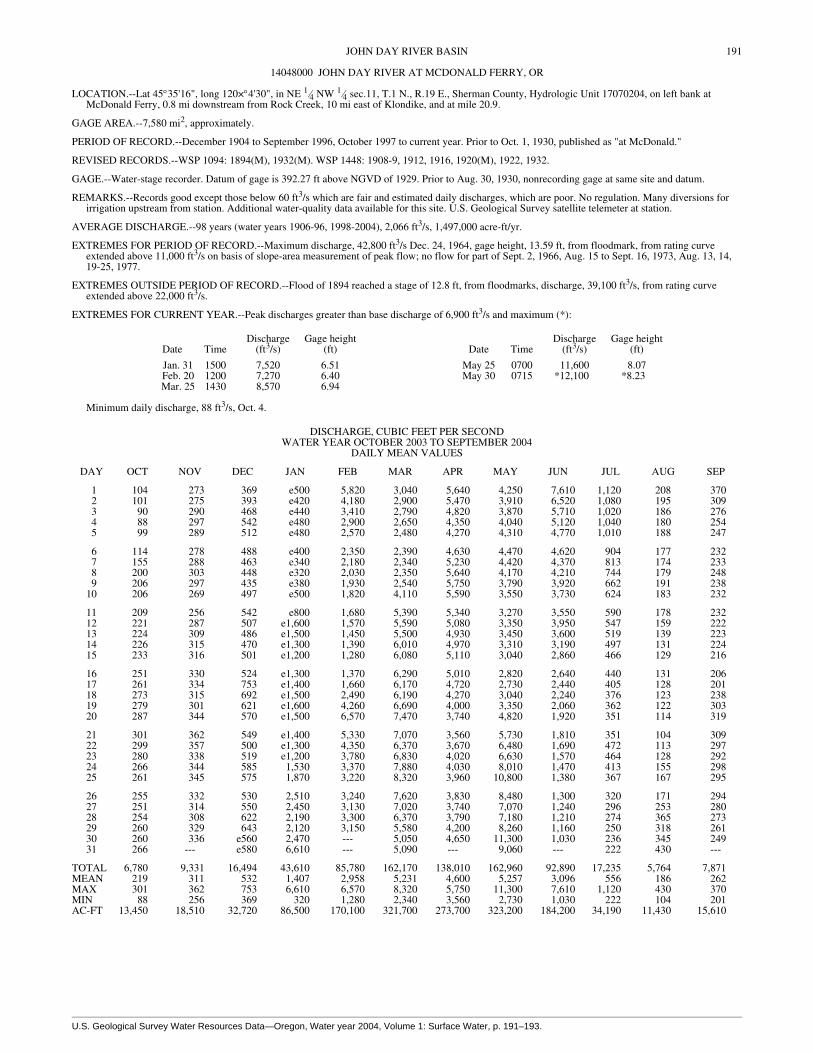
14048000 JOHN DAY RIVER AT MCDONALD FERRY, OR
LOCATION.--Lat 45°35'16", long 120×°4'30", in NE 1⁄4 NW 1⁄4 sec.11, T.1 N., R.19 E., Sherman County, Hydrologic Unit 17070204, on left bank at McDonald Ferry, 0.8 mi downstream from Rock Creek, 10 mi east of Klondike, and at mile 20.9.
GAGE AREA.--7,580 mi2, approximately.
PERIOD OF RECORD.--December 1904 to September 1996, October 1997 to current year. Prior to Oct. 1, 1930, published as "at McDonald."
REVISED RECORDS.--WSP 1094: 1894(M), 1932(M). WSP 1448: 1908-9, 1912, 1916, 1920(M), 1922, 1932.
GAGE.--Water-stage recorder. Datum of gage is 392.27 ft above NGVD of 1929. Prior to Aug. 30, 1930, nonrecording gage at same site and datum.
REMARKS.--Records good except those below 60 ft3/s which are fair and estimated daily discharges, which are poor. No regulation. Many diversions for irrigation upstream from station. Additional water-quality data available for this site. U.S. Geological Survey satellite telemeter at station.
AVERAGE DISCHARGE.--98 years (water years 1906-96, 1998-2004), 2,066 ft3/s, 1,497,000 acre-ft/yr.
EXTREMES FOR PERIOD OF RECORD.--Maximum discharge, 42,800 ft3/s Dec. 24, 1964, gage height, 13.59 ft, from floodmark, from rating curve extended above 11,000 ft3/s on basis of slope-area measurement of peak flow; no flow for part of Sept. 2, 1966, Aug. 15 to Sept. 16, 1973, Aug. 13, 14, 19-25, 1977.
EXTREMES OUTSIDE PERIOD OF RECORD.--Flood of 1894 reached a stage of 12.8 ft, from floodmarks, discharge, 39,100 ft3/s, from rating curve extended above 22,000 ft3/s.
EXTREMES FOR CURRENT YEAR.--Peak discharges greater than base discharge of 6,900 ft3/s and maximum (*):
Date TimeDischarge
(ft3/s)Gage height
(ft) Date TimeDischarge
(ft3/s)Gage height
(ft)
Jan. 31 1500 7,520 6.51 May 25 0700 11,600 8.07Feb. 20 1200 7,270 6.40 May 30 0715 *12,100 *8.23Mar. 25 1430 8,570 6.94
Minimum daily discharge, 88 ft3/s, Oct. 4.
DISCHARGE, CUBIC FEET PER SECOND WATER YEAR OCTOBER 2003 TO SEPTEMBER 2004
DAILY MEAN VALUES
DAY OCT NOV DEC JAN FEB MAR APR MAY JUN JUL AUG SEP
1 104 273 369 e500 5,820 3,040 5,640 4,250 7,610 1,120 208 3702 101 275 393 e420 4,180 2,900 5,470 3,910 6,520 1,080 195 3093 90 290 468 e440 3,410 2,790 4,820 3,870 5,710 1,020 186 2764 88 297 542 e480 2,900 2,650 4,350 4,040 5,120 1,040 180 2545 99 289 512 e480 2,570 2,480 4,270 4,310 4,770 1,010 188 247
6 114 278 488 e400 2,350 2,390 4,630 4,470 4,620 904 177 2327 155 288 463 e340 2,180 2,340 5,230 4,420 4,370 813 174 2338 200 303 448 e320 2,030 2,350 5,640 4,170 4,210 744 179 2489 206 297 435 e380 1,930 2,540 5,750 3,790 3,920 662 191 238
10 206 269 497 e500 1,820 4,110 5,590 3,550 3,730 624 183 232
11 209 256 542 e800 1,680 5,390 5,340 3,270 3,550 590 178 23212 221 287 507 e1,600 1,570 5,590 5,080 3,350 3,950 547 159 22213 224 309 486 e1,500 1,450 5,500 4,930 3,450 3,600 519 139 22314 226 315 470 e1,300 1,390 6,010 4,970 3,310 3,190 497 131 22415 233 316 501 e1,200 1,280 6,080 5,110 3,040 2,860 466 129 216
16 251 330 524 e1,300 1,370 6,290 5,010 2,820 2,640 440 131 20617 261 334 753 e1,400 1,660 6,170 4,720 2,730 2,440 405 128 20118 273 315 692 e1,500 2,490 6,190 4,270 3,040 2,240 376 123 23819 279 301 621 e1,600 4,260 6,690 4,000 3,350 2,060 362 122 30320 287 344 570 e1,500 6,570 7,470 3,740 4,820 1,920 351 114 319
21 301 362 549 e1,400 5,330 7,070 3,560 5,730 1,810 351 104 30922 299 357 500 e1,300 4,350 6,370 3,670 6,480 1,690 472 113 29723 280 338 519 e1,200 3,780 6,830 4,020 6,630 1,570 464 128 29224 266 344 585 1,530 3,370 7,880 4,030 8,010 1,470 413 155 29825 261 345 575 1,870 3,220 8,320 3,960 10,800 1,380 367 167 295
26 255 332 530 2,510 3,240 7,620 3,830 8,480 1,300 320 171 29427 251 314 550 2,450 3,130 7,020 3,740 7,070 1,240 296 253 28028 254 308 622 2,190 3,300 6,370 3,790 7,180 1,210 274 365 27329 260 329 643 2,120 3,150 5,580 4,200 8,260 1,160 250 318 26130 260 336 e560 2,470 --- 5,050 4,650 11,300 1,030 236 345 24931 266 --- e580 6,610 --- 5,090 --- 9,060 --- 222 430 ---
TOTAL 6,780 9,331 16,494 43,610 85,780 162,170 138,010 162,960 92,890 17,235 5,764 7,871MEAN 219 311 532 1,407 2,958 5,231 4,600 5,257 3,096 556 186 262MAX 301 362 753 6,610 6,570 8,320 5,750 11,300 7,610 1,120 430 370MIN 88 256 369 320 1,280 2,340 3,560 2,730 1,030 222 104 201AC-FT 13,450 18,510 32,720 86,500 170,100 321,700 273,700 323,200 184,200 34,190 11,430 15,610
logical Survey Water Resources Data—Oregon, Water year 2004, Volume 1: Surface Water, p. 191–193.
192 JOHN DAY RIVER BASIN
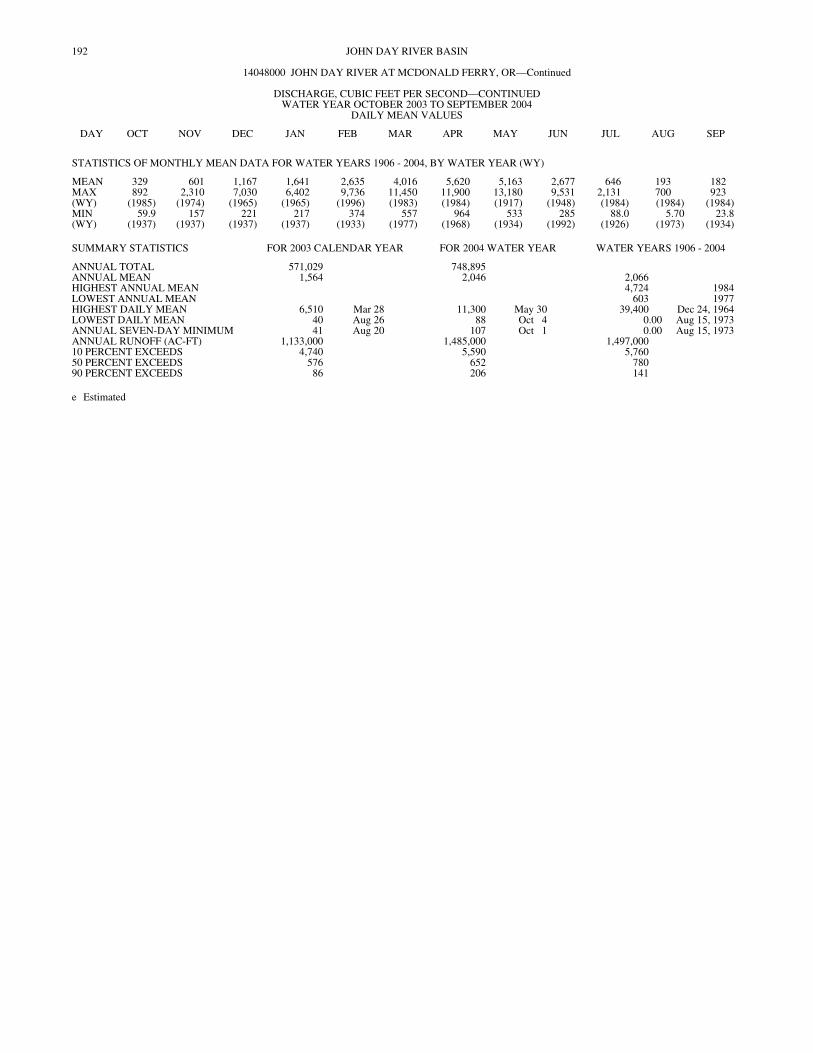
14048000 JOHN DAY RIVER AT MCDONALD FERRY, OR—Continued
e Estimated
STATISTICS OF MONTHLY MEAN DATA FOR WATER YEARS 1906 - 2004, BY WATER YEAR (WY)
MEAN 329 601 1,167 1,641 2,635 4,016 5,620 5,163 2,677 646 193 182MAX 892 2,310 7,030 6,402 9,736 11,450 11,900 13,180 9,531 2,131 700 923(WY) (1985) (1974) (1965) (1965) (1996) (1983) (1984) (1917) (1948) (1984) (1984) (1984)MIN 59.9 157 221 217 374 557 964 533 285 88.0 5.70 23.8(WY) (1937) (1937) (1937) (1937) (1933) (1977) (1968) (1934) (1992) (1926) (1973) (1934)
SUMMARY STATISTICS FOR 2003 CALENDAR YEAR FOR 2004 WATER YEAR WATER YEARS 1906 - 2004
ANNUAL TOTAL 571,029 748,895ANNUAL MEAN 1,564 2,046 2,066HIGHEST ANNUAL MEAN 4,724 1984LOWEST ANNUAL MEAN 603 1977HIGHEST DAILY MEAN 6,510 Mar 28 11,300 May 30 39,400 Dec 24, 1964LOWEST DAILY MEAN 40 Aug 26 88 Oct 4 0.00 Aug 15, 1973ANNUAL SEVEN-DAY MINIMUM 41 Aug 20 107 Oct 1 0.00 Aug 15, 1973ANNUAL RUNOFF (AC-FT) 1,133,000 1,485,000 1,497,00010 PERCENT EXCEEDS 4,740 5,590 5,76050 PERCENT EXCEEDS 576 652 78090 PERCENT EXCEEDS 86 206 141
DISCHARGE, CUBIC FEET PER SECOND—CONTINUEDWATER YEAR OCTOBER 2003 TO SEPTEMBER 2004
DAILY MEAN VALUES
DAY OCT NOV DEC JAN FEB MAR APR MAY JUN JUL AUG SEP

"This page contains charts graphically portraying the tabulardata contained onthe2004 Water Year
Daily Mean Discharge
10
100
1,000
10,000
100,000
Stre
amflo
w(c
fs)
0
5,000
10,000
15,000
Oct Nov Dec Jan Feb Mar Apr May Jun Jul Aug Sep
Stre
amflo
w(c
fs)
Annual Minimum 7-Day Average Streamflow
0100200300400500
6091
3191
0291
7291
4391
1491
8491
5591
2691
9691
6791
3891
0991
7991
4002
Stre
amflo
w(c
fs)
nest page. Skip to the next page to go directly to the tabular data. . ."
Annual Peak Streamflow
010,00020,00030,00040,00050,000
5091
2191
9191
6291
3391
0491
7491
4591
1691
8691
5791
2891
9891
6991
3002
S tre
amfl o
w( c
fs)
14048000 JOHN DAY RIVER AT MCDONALD FERRY, OR35Latitude: 45
oLongitude: 120 24
o' '16" 30"
Drainage Area: 7,580 square milesDatum: 392.27 feetHydrologic Unit Code: 17070204
Sherman County
Monthly StatisticsMonthly Mean of Current Water Year
JOHN DAY RIVER BASIN
Annual Mean Streamflow
01,0002,0003,0004,0005,000
6091
3191
0291
7291
4391
1491
8491
5591
2691
9691
6791
3891
0991
7991
4002
S tr e
amflo
w( c
fs)
Max, Mean, and Min Monthly Mean for 1906 2004 _
Oct Nov Dec Jan Feb Mar Apr May Jun Jul Aug Sep