A tentAtive dynAmic site index model for scots pine (Pinus sylvestris ...

HAL Id: tel-01746231https://hal.univ-lorraine.fr/tel-01746231
Submitted on 29 Mar 2018
HAL is a multi-disciplinary open accessarchive for the deposit and dissemination of sci-entific research documents, whether they are pub-lished or not. The documents may come fromteaching and research institutions in France orabroad, or from public or private research centers.
L’archive ouverte pluridisciplinaire HAL, estdestinée au dépôt et à la diffusion de documentsscientifiques de niveau recherche, publiés ou non,émanant des établissements d’enseignement et derecherche français ou étrangers, des laboratoirespublics ou privés.
Water Resistance of Scots Pine Joints Produced byLinear Friction Welding
Mojgan Vaziri
To cite this version:Mojgan Vaziri. Water Resistance of Scots Pine Joints Produced by Linear Friction Welding. Other.Université Henri Poincaré - Nancy 1, 2011. English. �NNT : 2011NAN10059�. �tel-01746231�
AVERTISSEMENT
Ce document est le fruit d'un long travail approuvé par le jury de soutenance et mis à disposition de l'ensemble de la communauté universitaire élargie. Il est soumis à la propriété intellectuelle de l'auteur. Ceci implique une obligation de citation et de référencement lors de l’utilisation de ce document. D'autre part, toute contrefaçon, plagiat, reproduction illicite encourt une poursuite pénale. Contact : [email protected]
LIENS Code de la Propriété Intellectuelle. articles L 122. 4 Code de la Propriété Intellectuelle. articles L 335.2- L 335.10 http://www.cfcopies.com/V2/leg/leg_droi.php http://www.culture.gouv.fr/culture/infos-pratiques/droits/protection.htm

Water Resistance of Scots Pine Joints Produced by Linear Friction Welding
Mojgan Vaziri

Luleå University of Technology
Discipline : Wood science THESIS in cosupervision Sweden - France
To obtain the degree of
DOCTOR of the UNIVERSITY HENRI POINCARE – NANCY 1
Presented and defended publicly by
UNIVERSITÉ HENRI POINCARÉ – NANCY 1
Ecole Nationale Supérieure des Technologies et Industries du Bois
Laboratoire d'Études et de Recherche sur le Matériau Bois – UMR INRA/UHP 1093
École Doctorale RP2E Discipline : Sciences du bois
THÈSE en co-tutelle France - Sweden
pour obtenir le grade de
DOCTEUR de l'UNIVERSITÉ HENRI POINCARÉ – NANCY 1
et soutenue publiquement par
Mojgan Vaziri
Title / Titre Water Resistance of Scots Pine Joints Produced by Linear Friction Welding
Rapporteurs : Pr Bernard De JESO : professeur, Université Bordeaux 1, France Pr Lars-Olof NILSSON: Professor, building materials, Lund University, Sweden Examinateurs / Examiners : Pr Frédéric PICHELIN: Professor, Wood and Civil Engineering, Bern University, Sweden Jean-Michel LEBAN : Professeur, Université Henri Poincaré – Nancy 1, France Pr Owe LINDGREN: Professor, Luleå University of Technology, LTU Skellefteå, Sweden Pr Antonio PIZZI : Professeur, Université Henri Poincaré – Nancy 1, France
30 septembre 2011

م د تاد ی ا ود ند ب م ی د ود شاد تادی ند ا یید و ما را ر ن م پایان د م و باد د از خاک ا
With them the Seed of Wisdom did I sow, And with my own hand labour’d it to grow:
And this was all the Harvest that I reap’d- ”I came like Water, and like Wind I go.”
Omar Khayyam


Abstract
Wood welding is a mechanical friction process allowing the assembly of timber without any adhesives. The process consists of applying mechanical friction, under pressure, alternately to the two wood surfaces to be welded. This process can be applied to weld two flat pieces of timber, originating from the same or different tree species, and can be used in the manufacture of furniture and wood joinery. The only limitation is that the joint is not exterior-grade, but only suitable for interior joints. Exterior use, or use in an environment with varying humidity demands water resistance of the welded joints. The main objective of this thesis is to study the water resistance of the welded wood. This is complemented with special attention to non-destructive test methods such as X-ray Computed Tomography (CT-) scanning and Magnetic Resolution Imaging (MRI). The influence of welding parameters and wood properties on crack formation and crack propagation in the weldline was investigated. The influence of these parameters on weldline density and water absorption in the weldline were also studied. Investigations in this thesis are based on welded samples of Scots pine (Pinus sylvestris) of the dimensions 200 mm × 20 mm × 40 mm which were cut in the longitudinal direction of the wood grain. The tensile-shear strength of the welded Scots pine samples were determined using European standard EN 205. Different non-destructive methods such as X-ray Computed Tomography (CT-) scanning to study crack formation and propagation, and magnetic Resolution Imaging (MRI) to characterize water penetration and the distribution mechanism in welded wood were used. Solid state CPMAS 13C NMR spectrometry and X-ray microdensitometry investigations were carried out to study the mechanism of adhesion in Scots pine. These various non-destructive methods offer the advantage of non-invasive analysis and the elimination of any artifacts present due to preparation and sectioning. The most important results are summarized as follows:
• X-ray Computed Tomography (CT-) scanning and Magnetic Resolution Imaging (MRI) are versatile research methods applicable to investigations of welded woods.
• Water resistance of welded Scots pine can be increased using heartwood, a welding pressure of 1.3 MPa, and a welding time of 1.5 s.

• Optimization tests showed that the tensile-shear strength of Scots pine was more sensitive to welding time changes than holding time and could be optimized to more than 9.7 MPa using 1.3 MPa welding pressure, > 3.5 s welding time, and < 60 s holding time.
• Changing welding parameters and wood properties can increase water resistance of welded wood to some extent, but treating the weldline with certain natural and environmentally-friendly water repellents is still necessary.
• Welded Scots pine shows unusually high water resistance and tensile-shear strength. This may be explained by there being more extractives compounds in Scots pine.
• MRI experiments showed that the origin of the joint failure in welded beech is poor water resistance of the weldline, while swelling and shrinkage of wood are the main reasons for joint failure of welded Scots pine.
• Extractives in Scots pine dramatically improve water resistance of the welded joint, but not to a level to classify the joint as an unprotected exterior grade. However, it can qualify as a joint for protected semi-exterior application.
Key words: wood, wood welding, crack, CT scanning, image processing, MRI, microdensitometry, CPMAS 13 C NMR, density, water absorption, tensile-shear strength.

Sammanfattning Wood Welding (träsvetsning) är en mekaniskt inducerad friktionsprocess som medför att provkroppar av trä sammanfogas utan lim. Processen består att av att pålägga mekanisk friktion under tryck på de provkroppar som ska sammanfogas. Denna process kan åstadkommas mellan två träytor av samma träslag eller mellan träytor från två olika träslag. Slutprodukten kan exempelvis användas vid möbeltillverkning eller s.k. limfog. Den enda begränsningen är att fogen inte belastas av uthomhusklimat utan enbart inomhusklimat. Huvudsyftet med denna avhandling är att bygga kunskap angående vattenbeständighet hos limfogar skapade på detta sätt och att förbättra den med hjälp av oförstörande mätmetoder som datortomografi (CT-scanning) och NMR/MRI (Magnetic Resonance Imaging). Undersökningen omfattar inställningen av svetsmaskinparametrararna och träegenskapers inverkan på sprickbildning och sprickutbredning i den bildade svetsfogen. Dessutom studerades inverkan av dessa parametrar på svetsfogens densitet och vattenabsorption. Resultaten baseras på provkroppar av furu (Pinus sylvestris) med dimensionerna 200 mm × 20 mm × 40 mm där fiberriktningen är longitudinell. Skjuvprovningen av dessa provkroppar bestämdes användande European standard EN 205. Datortomografi och MRI användes för att karakterisera vattenabsorptions- och vattenfördelningsmekanismer hos svetsat trä. Mätmetoderna erbjuder ej påverkande mätningar och eliminering av felkällor vid preparering och sönderdelning under provningsförfarandet. De viktigaste resultaten kan sammanfattas sålunda:
• Datortomografi och MRI är kraftfulla forskningsverktyg för applikationen träsvetsning.
• Vattenbeständigheten för furu kan ökas genom att använda kärnved, ett pålagt svetstryck av 1.3 MPa och svetstid 1.5 s.
• Optimeringsprovningar visade att drag- och skjuvhållfasthet hos furu är mer känslig för svetstid än trycktid efter svetsning och kunde optimeras till mer än 9.7 MPa vid 1.3 MPa svetstryck, > 3.5 s svetstid, och < 60 s trycktid efter svetsning.
• Skjuvhållfastheten hos svetsfogen ökar inte linjärt med svetstiden utan är en funktion av värmeproduktionen i svetsfogen.

• Vattenbeständigheten hos svetsat trä kan förbättras genom att ändra svetsparametrar och träegenskaper, men användning av visa naturliga och miljövänliga vattenavstötande medel rekommenderas fortfarande.
• Svetsad furu uppvisar ovanligt hög vattenbeständighet och drag-/skjuvhållfasthet. Detta kan förklaras med större extraktivämneshalt i furu.
• MRI försöken visade att orsaken för fogbrott i bok är dålig vattenbeständighet i fogen. För furu är huvudorsaken svällning och krympning av provkropparna medan fogen i sig själv är vattenbeständig.
• Extraktivämnen i furu förbättrar kraftigt svetsfogens vattenbeständighet, dock inte tillräckligt för att klassificeras som direkt lämpligt för produkter för utomhusanvänding.
Nyckelord: trä, träsvetsning, datortomografi, digital bildbehandling, MRI, mikrodensitometri, densitet, vattenabsorption, vattenbeständighet, draghållfasthet, skjuvhållfasthet

Résumé Le soudage du bois est une technique d'assemblage sans adhésif de deux pièces de bois, leur soudure étant produite par friction mécanique sous pression des deux pièces. Ce procédé, applicable à des pièces de bois plates, d'essences identiques ou différentes, se prête à la fabrication de meubles et à la menuiserie. Cependant, le joint obtenu n'est pas de classe "extérieur", ce qui le réserve à un usage "intérieur". En effet, un joint destiné à une utilisation extérieure ou en milieu à humidité variable doit présenter une résistance élevée à l'eau. L'objectif principal de cette thèse est d'étudier la résistance à l'eau du bois soudé. A cet effet, des méthodes d'essais complémentaires et non-destructrices ont été utilisées, comme le scanner ou l'imagerie par résonance magnétique (IRM). L'influence des paramètres de soudage et des propriétés du bois sur, d'une part, la formation et la propagation des fissures dans la ligne de soudure, et sur, d'autre part, la densité et l'absorption d'eau de la soudure a été ainsi étudiée. Les expériences de cette thèse seront menées sur des échantillons de pin (Pinus sylvestris) de dimensions 200 mm x20 mm x 40 mm, coupés dans la direction longitudinale du fil du bois. La Norme Européenne EN 205 a servi de cadre pour déterminer la résistance des échantillons de pin en traction-cisaillement. Les méthodes d'essais (non-destructrices) ont été utilisées selon leur pertinence: le scanner a servi à étudier la formation et la propagation des fissures; l'imagerie par résonance magnétique (IRM) a permis quant à elle de caractériser la pénétration et l'infiltration d'eau dans le bois soudé. Le mécanisme d'adhérence du pin a été étudié grâce à la RMN MAS (spectrométrie à résonance magnétique nucléaire avec polarisation croisée et rotation à l’angle magique) du carbone13 et à la micro-densitométrie par rayons X. Ces différentes méthodes, non destructrices, offrent l'avantage d'une analyse non invasive et l'élimination de facteurs parasites liés à la préparation et à la coupe du bois. Voici en résumé les résultats obtenus les plus marquants:
• Le scanner et l'imagerie par résonance magnétique (IRM) sont des méthodes de recherche particulièrement polyvalentes et adaptées à l'étude des bois soudés.
• L'utilisation de bois de coeur, une pression de soudage de 1.3 Mpa et un temps de soudage de 1.5 s permettent d'augmenter la résistance à l'eau du pin soudé.
• Des tests d'optimisation ont montré que la résistance du pin en traction-cisaillement est plus sensible aux variations de temps de soudage qu'au temps de refroidissement et qu'elle peut être optimisée à plus de 9.7 MPa en respectant une pression de 1.3 Mpa, un temps de soudage > 3.5 s et un temps de refroidissement < 60 s.

• La résistance à l'eau du bois soudé peut être améliorée dans une certaine mesure en faisant varier paramètres de soudage et propriétés des essences, mais dans tous les cas, le recours à un imperméabilisant naturel et écologique reste nécessaire.
• Le pin soudé possède une résistance à l'eau et en traction-cisaillement inhabituellement élevée, cela pouvant s'expliquer par une teneur en composés extractifs augmentée.
• Des essais sous IRM ont montré que les causes de rupture du joint varient suivant l'essence: faible résistance à l'eau de la ligne de soudure dans le cas du hêtre soudé, retrait et expansion du bois dans le cas du pin soudé.
• Les extractifs du pin améliorent nettement la résistance à l'eau du joint soudé, mais à un niveau qui ne lui permet cependant pas la certification “extérieur” sans protection. En revanche, il peut être certifié “semi-extérieur” avec protection.
Mots-clés: bois, soudure du bois, fissure, scanner, imagerie, IRM, micro-densitométrie, IRM MAS carbone13, densité, absorption d'eau, résistance en traction-cisaillement.

Acknowledgments
The work presented in this doctoral thesis was carried out at the Division of Wood Science and Technology, Luleå University of Technology, Skellefteå Campus, and was supervised by Professor Owe Lindgren, Professor Antonio Pizzi, and Professor Anders Grönlund. This work was financially supported by PhD Polis Project at LTU in collaboration with ENSTIB-LERMAB, Nancy University, France. I wish to express my sincere gratitude to professor Owe Lindgren for his invaluable support and guidance in the preparation of this thesis and for introducing me to research work. Professor Owe Lindgren has been a major source of inspiration for making this work so very interesting and enjoyable, and I thank him for his humor, sincerity and insight and am grateful for his care and help, not only on my work, but also during the period of my PhD studies. I am grateful to Professor Antonio Pizzi for his excellent scientific guidance, intellectual support and stimulating cooperative research. I am indebted to Professor Anders Grönlund for his support and supervision during the study, and I have learnt much from his serious work attitude and diligent work style. I thank Professor Greger Orädd for conducting analysis by Magnetic Resonance Imaging (MRI) scanning, and for his interesting comments. I thank Birger Marklund (LTU) for preparing the samples and for his assistance with CT-scanning. I specially thank to Eva-Stina Nordlund and Margit Sandström for their administrative help and kindness I would also like to express my gratitude to my colleagues at LTU Skellefteå and ENSTIB-LERMAB University for creating a very enjoyable and constructive scientific environment to work in. I extend my warm and sincere thanks to all my friends at the Forskarskola för Kvinnor (Research School for Women) for their support. I also thank Mr. Jean-Louis Janin, the head of the company MECASONIC who helped us produce all our samples for linear welding. I give my very best and greatest thanks to my family. It is thanks to their encouragement and support that I have overcome any difficulties encountered and that I have rapidly accommodated to the working environment abroad. Skellefteå, February 2011 Mojgan Vaziri
I II

List of publications This thesis is based on work reported in the following papers: I M. Vaziri, O. Lindgren, A. Pizzi and H. R. Mansouri, Moisture sensitivity of Scots pine joints produced by linear frictional welding. J. Adhesion Sci. Technol. 24, 1515 -1527 (2010). II M. Vaziri, O. Lindgren and A. Pizzi, Influence of machine setting and wood parameters on crack formation in Scots pine joints produced by linear friction welding, accepted for publication in. J. Adhesion Sci. Technol (2011). III M. Vaziri, O. Lindgren and A. Pizzi, Influence of welding parameters on weldline density and its relation to crack formation in welded Scots pine. J. Adhesion Sci. Technol. 25, 1819–1828 (2011). IV M. Vaziri, O. Lindgren and A. Pizzi, Influence of wood welding parameters and wood properties on water absorption in Scots pine joints induced by linear friction welding . J. Adhesion Sci. Technol. 25, 1839–1847 (2011). V M. Vaziri, G. Orädd, O. Lindgren and A. Pizzi, Magnetic resonance imaging of water distribution in welded woods. J. Adhesion Sci. Technol. 25, 1997–2003 (2011). VI M. Vaziri, O. Lindgren and A. Pizzi, Optimization of tensile-shear strength for linear welded Scots pine, accepted for publication in Journal of Adhesion Science and Technology (2011). VII H. R. Mansouri, A. Pizzi, J-M. Leban, L. Delmotte, O. Lindgren, M. Vaziri and P. Omrani, Causes of the characteristic improved water resistance in pine wood linear welded joints. J. Adhesion Sci. Technol. 25, 1987–1847 (2011). External contribution to the included papers In general: O. Lindgren and A. Pizzi contributed with discussion and criticism. Paper I: H. R. Mansouri contributed with discussions and experimental work. Paper V: G. Orädd contributed with MRI measurement, discussion, and comments on the text in the article. Paper VII: The author contributed with experimental work and discussions.

1-CT-scanning
Crack length and location
Crack time
Density of the weldline
Water absorption in the weldline
Paper I
Paper II
Paper III
Paper IV
2-MRI Paper V
3-Tensile-shear strength test Paper VI
4- Water immersion test
5- Weathering test
6- X-ray densitometry
7- Solid state NMR
Paper VII
Publications

Table of contents 1. INTRODUCTION ................................................................................................ 1
1.1 OBJECTIVES ................................................................................................... 2 1.2 BACKGROUND ............................................................................................... 4 1.3 INVESTIGATIONS ON MOISTURE RESISTANCE OF WELDED WOOD .................... 6 1.4 LATEST DEVELOPMENTS IN WOOD WELDING .................................................. 8 1.5 PRINCIPLE OF WELDING ............................................................................... 11 1.6 EVOLUTION OF THE WELDING PROCESS ........................................................ 14 1.7 CHEMICAL CHARACTERISTICS OF THE WELDED REGION ............................... 17 1.8 MICROSTRUCTURE OF WELDLINE ................................................................. 21 1.9 LIMITATIONS ............................................................................................... 22 1.10 ERROR SOURCES .......................................................................................... 23
2. MATERIALS AND METHODS ....................................................................... 24 2.1 WATER RESISTANCE EXPERIMENTS [PAPER I] .............................................. 24
2.1.1 Wood Welding ........................................................................................ 24 2.1.2 Water absorption .................................................................................... 25 2.1.3 CT-scanning and Image processing ....................................................... 26
2.2 MAGNETIC RESONANCE IMAGING (MRI) [PAPER V] ................................... 29 2.2.1 Sample preparation method ................................................................... 29 2.2.2 MRI scanning ......................................................................................... 30
2.3 WATER IMMERSION AND WEATHERING TEST [PAPER VII] ............................ 31 2.4 SOLID STATE NMR [PAPER VII] .................................................................. 33 2.5 X-RAY MICRODENSITOMETRY [PAPER VII] .................................................. 33 2.6 TENSILE-SHEAR STRENGTH TEST [PAPER VI] ............................................... 33
3. RESULTS ............................................................................................................ 36 3.1 CT-SCANNING EXPERIMENTS ....................................................................... 36
3.1.1 Crack length, crack location, and crack time ......................................... 36 3.1.2 Density and water absorption in the weldline ........................................ 40
3.2 MRI MEASUREMENT .................................................................................... 45 3.3 WATER IMMERSION AND WEATHERING ........................................................ 46 3.4 SOLID STATE NMR ...................................................................................... 47 3.5 X-RAY MICRODENSITOMETRY ...................................................................... 49 3.6 TENSILE-SHEAR STRENGTH OPTIMIZATION .................................................. 50
4. DISCUSSION ...................................................................................................... 52 4.1 WELDING PRESSURE .................................................................................... 52 4.2 WELDING TIME ............................................................................................ 53 4.3 HEARTWOOD/SAPWOOD AND WATER ABSORPTION IN THE WELDLINE .......... 54 4.4 WELDLINE DENSITY ..................................................................................... 55 4.5 ORIGIN OF CRACK FORMATION IN SCOTS PINE AND BEECH .......................... 56
5. CONCLUSIONS ................................................................................................. 56 6. FUTURE WORK ................................................................................................ 57 7. REFERENCES ................................................................................................... 59

I n t r o d u c t i o n
1
1. Introduction It is in the best interest of industry and society to maintain healthy ecosystems. Industry initiatives and public awareness have resulted in homebuilders and industries including environmental considerations in the choice of materials. Environmentally-friendliness and renewability of structural materials are important criteria today. Wood is a natural composite and the only renewable building material. Wood has more to offer in today’s environmentally conscious world. Wood materials have advantages over similar materials used in furnishing and construction. Wood makes a major contribution to improving the overall environmental performance of any commercial or residential building by reducing energy use, resource use, environmental impact, and minimizing pollution. Wood is therefore chosen by today’s designers and builders. Designers and builders are increasingly aware that the selection of materials and equipment can reduce the effects of construction, manufacture, and usage. There is intense public interest and debate regarding the environmental impact and sustainability of construction and furnishing products. In wood working wood assembly is carried out by traditional mechanical connectors such as nails, bolts, and screws or by using laminar connectors such as adhesives. Gluing yields connections with more effective stiffness and a more natural and attractive finish than mechanical connectors. Therefore, assembling with adhesives is common in joining solid wood in the furniture, civil engineering, and joinery industries; thousands tonnes of petrochemical glue are used each year in the world. One disadvantage of glued connections is that most glues contain solvents that release toxic vapor during the solidification of the joint and its service life. Furthermore, using these glues causes higher cost because of relatively long processing times which are necessary to solidify the joints. Long curing time of adhesives has led to large investment in industrially established methods such as high-frequency or microwave systems to speed up the hardening phase in the manufacturing process. The term ''wood welding'' which can be defined as the ''welding of the wood'', is a term that describes a novel joining procedure that offers a joining of wood pieces without the use of adhesives or any other material than wood. This new process offers advantages over gluing and mechanical fasteners, such as short curing times of less than one minute and low cost. The process results in totally environmentally friendly wood joints. Wood welding is an eco-efficient technology which means it is efficient from both ecological and economical perspectives. Two systems of welding wood without adhesives have been

I n t r o d u c t i o n
2
developed: linear vibration welding and high speed rotation welding, see Figure 1. Vibration welding is used to weld two flat wood surfaces to each other. High speed rotational welding is used to assemble wooden parts using wooden dowels. If the dowel is rotated in the wood using a simple drill it can be fixed twenty times more firmly than can traditional carpenters` dowels. This method, is used to join several wood specimens, is within reach of any handyman and many small and medium-sized businesses. This thesis focuses on linear vibration welding. The process consists of applying mechanical friction, under pressure, alternately to the two wood surfaces to be welded. Linear friction welding induced by mechanical vibration yields welded joints in flat wood surfaces. The use of this method provides connections that satisfy the requirements of the relevant international norms. Both systems of wood-to-wood welding are based on the degradation and flowing of the amorphous, cell-interconnecting material in the structure of wood, mainly lignin, but also hemicelluloses. The wood welding process looks simple; only one connection material is required, the complete process takes only a few seconds, and the resulting bond is strong. Despite its simple appearance, the wood welding process involves the advanced application of physics and materials science.
Figure 1.Linear vibration welding (left) and high speed rotation, dowel welding
(right).
1.1 Objectives
The mechanical resistance of the joints formed by welding in 2–4 seconds is comparable to that obtained 24 hours after gluing [1]. This process can be applied to weld two flat pieces of timber, originating from the same or different tree species and can be used to make furniture or interior wood sections such as flooring. Since 1997 the good results obtained in tension and shear resistance of welded wood joints has led to application of wood welding technology to timber assembly. The only limitation of welded wood is that the strong joints obtained are not capable of satisfying the specifications for exterior joints as their resistance to water is poor. Dowel welding yields joints that possess a certain degree of long-term resistance to water [2-6]. Moisture leads to splitting of the

I n t r o d u c t i o n
3
bond line of linear welded woods and makes them unsuitable for structural use in spite of their high dry strength [7]. The immediate consequence of water sorption into wood is surface swelling which is followed by drying and shrinkage in outdoor conditions. There has been interest in overcoming this limitation without the use of synthetic waterproofing chemicals which don’t have totally environment-friendly characteristics. Since the vibration welding process is governed by the heat generation of frictional movement, the parameters influencing the generation of this heat are important. These parameters are the welding machine factors such as welding pressure, welding frequency, welding time, and the material properties such as Moisture Content (MC), annual ring orientation, and density. This research focuses on the influences of these key parameters. The main objective of this study is to determine the influence of welding parameters such as welding pressure, welding time, and wood properties (heartwood/sapwood) on crack formation and propagation in the weldline. A crack in the weldline is the first sign of damage because water can penetrate into the joints via this opening in the connection. Investigations into the water resistance of welded woods have mainly been carried out using the water immersion method. However, traditional water immersion is not practical for investigation of changes that occur within the welded joint during absorption and desorption in outdoor conditions. One aspect of moisture behavior of welded wood that has not been investigated yet is the influence of welding parameters on crack formation in the weldline. The objective of this thesis is thus to study the water resistance of welded wood. The state of the art in the field of wood welding technology using X- ray Computed Tomography (CT-) scanning and Magnetic Resolution Imaging (MRI) is presented. The CT-scan can be used to assess the water resistance of welded woods by the anticipation of the formation of a crack in the weldline. The joint opening of the connections was ascertained with an X-ray CT-scan and image processing software (Image J). CT-scanning and MRI are non-destructive and non-contact imaging methods. These methods have been used in other fields including the wood industry to visualize differences in moisture content in objects [8-20]. CT-scanning preserves the integrity of the sample which means that it can successfully be used for the investigation of density and inner structure of wood.

I n t r o d u c t i o n
4
Failure of wood joints under moisture conditions depends, on the one hand, on the material properties in the welded interphase and, on the other hand, on swelling and shrinkage in wood pieces. In this study this hypothesis was verified by MRI tests to assess the source of water damage. Measurement of the consolidation or hardening of the heat-affected zone and thus the evolution of the interphasial tensile-shear strength is of major importance in the determination of its field of application and also in the manufacture of wood components. Optimization of tensile-shear strength of welded wood is also studied to determine the welding condition that optimizes the tensile-shear strength of welded wood. The tests in these studies were carried out on test pieces of Scots pine (Pinus sylvestris) from Sweden as this species is one of the most used wood species for which the welding process has not been investigated. This thesis comprises the investigations to determine and improve both water resistance and tensile-shear strength of linear welded Scots pine. Up to now softwoods have been found to be welded well, but to yield joints of lower strength than those of welded hardwoods. The results of this study showed that welded Scots pine is capable of producing welded joints with unusually high water resistance-and tensile-shear strength. Therefore, solid state CPMAS 13C NMR spectra and X-ray microdensitometry investigations were carried out to determine the reason of this phenomenon.
1.2 Background
Welding technology has been applied to thermoplastics and metals for several decades. The term “wood welding” is already used to define the use of a melted thermoplastic resin as the binder of two wood surfaces. Thermoplastic welding techniques which are widely used in the plastic and car industries have recently also been applied to joining wood by melting a thermoplastic polymer between the two wood surfaces to be joined. A variety of techniques such as ultrasound and mechanical friction have been used to melt the thermoplastic polymer in situ. In 1993, the Research and Development (R + D) department of the Swiss School of Engineering for the Wood Industry, Biel, Switzerland (SWOOD) started to investigate wood welding technology. A project of fundamental research in the field of wood welding was launched. The researchers were using linear friction equipment to melt plastics between pieces of wood.

I n t r o d u c t i o n
5
The first investigation on wood welding without any bonding agent was carried out by Sutthoff et al. in Germany (1996) [21]. They showed that two pieces of wood can be welded by means of a linear frictional movement in the absence of any thermoplastic material or any other binder. In addition, they joined two wooden pieces by a rotating wooden dowel which was inserted into predrilled holes by pressure and rotational movement, and they took out two patents in wood welding [22]. The application of wood welding technology to timber construction was actively investigated by SWOOD between 1997 and 1999. In the middle of 1999 SWOOD launched a new project to study the functionality and adequacy of alternative thermoplastic welding technologies such as vibration and spin processes. Indeed, research had been exclusively focused on ultrasonic (US) technology, but for some applications this method was not appropriate, or was too expensive. Since 2000 the laboratory for timber construction (IBOIS) of the Swiss Federal Institute of Technology of. Lausanne (EPFL), ENSTIB-LERMAB University, University Henri Poincaré in Nancy/France, National Institute for Agronomic Research (INRA), Champenoux, France, and SWOOD have been studying and developing this method for wood connection in collaboration with the Technical University of Munich. The first attempt at wood welding by linear friction welding was carried out at the Berne University of Applied Sciences (HSB), Biel, Switzerland in 2002 [23]. Pizzi et al. 2004 [2] examined a rotation-induced method for friction welding of wood dowels of beech and of spruce in predrilled holes as had previously been studied by Sutthoff and Kutzer [22]. Since 2003, a joint Swiss-French team led by Antonio Pizzi from France and Balz Gfeller from Switzerland have studied and analyzed this technology with different types of welding machine and have improved the technology significantly. Tondi et al. 2007 [24] evaluated the two alternative thermoplastic welding systems, ultrasonic and microfriction stir welding1, for application to wood welding. Ultrasonic wood welding produces joints of good strength, but this method only appears to be applicable to thin wood pieces. Microfriction stir welding does show a potential for continuously welding wooden plates without any limitation on the length of wood pieces. The strength of the weld obtained was low due to the limited depth of the weldline.
1 In microfriction stir welding, there is a welded line of molten material. This molten material comes from the wood in contact with the rotating steel cylinder, which has flowed down in the micro gap between the two pieces of timber where it has bonded by solidifying.

I n t r o d u c t i o n
6
1.3 Investigations on moisture resistance of welded wood
Since 2003 some investigations have been carried out on the moisture resistance of welded wood which are presented below. • B. Gfeller et al. (2003) [25] used linear movement to join Norway spruce
and beech by friction welding. Good bonding was noted with tensile strengths between 8-10 MPa for beech and 2-5 MPa for spruce. Results of water immersion tests indicated that the joints had very poor resistance to water and thus were only appropriate for indoor use.
• D. Harms (2004) [26] carried out tests according to the Austrian standard B
3013 [27]. This standard which is usually applied to glued wooden window frames was used for welded wood connections. It included three periods of storage for three hours in water at 20°C, 60°C and, again, at 20°C. After another 72 hours of conditioning at a standard climate condition in a climate chamber of RH 65% and 20°C the joints were examined. The welded connections which were exposed to this treatment showed no water resistance; the joints were broken due to swelling and shrinkage.
• B. Stamm (2005) [1] carried out a series of physical, mechanical and
chemical investigations on the thermal behavior of wood during friction welding. Water resistance tests were carried out in accordance with standard VDI 3958-12 [28]. Test samples were exposed to weathering cycles in a climate chamber, and the shear strength of them were compared to reference samples. The residual bearing capacity was about 20% of the value obtained for reference samples. The results indicated that exterior use of welded wood laminates without further treatment was not recommended. Therefore, application would be limited to interior use without exposure to highly varying air humidity.
• S. Wieland et al. (2005) [29] added a certain number of naturally derived
additives to the bondline for different reasons such as:
Sunflower oil to test if a more water-resistant bondline was generated. A water solution of polyflavonoid tannin (pine tannin extract, Pinus
radiata) to see if by tannin auto-condensation some improvement in wet strength of the bondline could be obtained.
A compound of polybutylene adipate to decrease the glass transition temperature of lignin which facilitates its flow.

I n t r o d u c t i o n
7
Furfural, a compound obtained from agricultural waste and capable of both resinilying by auto-condensation to thermosetting as well as reacting with lignin.
The addition of sunflower oil rather than improving the situation made it much worse. The polybutylene water solution did not work at all. The use of some naturally derived additives such as tannins and furfural, by auto-condensation and polymerization, afforded some improvements in cold water resistance of the welded bondline. • M. Boonstra et al. (2006) [30] tested welding of heat-treated wood to
increase dimensional stability and durability of wood. The results indicated that hydrothermolyzed wood, the use of water in the form of steam at high temperature and pressure, yields welded wood joints of lower strength, while the fully-treated wood after the dry-heat phase yields welded wood joints of higher strength. The heat-treated wood can give good strength results, but in general, the values are lower than that obtained with untreated wood.
• P. Omrani et al. (2007) [6] studied weather exposure durability of welded
dowel joints with a zigzag pattern. They carried out a cold water immersion and two hours in boiling water tests. The results of these experiments confirm that the application of a zigzag pattern of rotationally welded dowels across the interphase of a butt joint between two wood planks yields strong joints. Samples showed a progressive decrease in the tensile strength of the joint when passing from dry to 4, 8, and 12 months weather exposure. The joints finally failed totally after 12 months unprotected weather exposure. It was remarkable that still after 4 and 8 months exposure to harsh weather conditions the joints was capable of holding together. An increase in the number of welded dowels across the interphase would further improve the dry strength of the joint, but it was unlikely to improve its durability.
• H.R. Mansouri et al. (2008) [7] explored a moisture resistance test on linear
welded samples of beech (Fagus sylvatica) by immersion in cold water at 15◦C. Results showed that short displacement of 2 mm, high vibration frequency of 150 Hz, and short welding time of 1.5 s increased the resistance of the linear welded joints by more than 25 h. The results obtained were poorer than those required by exterior-grade standards for structural application. Nonetheless, they were interesting for non-structural applications for short periods of outdoor environment.

I n t r o d u c t i o n
8
• C. Ganne-chedéville (2008) [31] carried out an immersion experiment on linear welded samples of beech and rubber tree (Hevea brasiliensis). The samples were immersed in reverse osmosis water at 20 ° C for one or three hours and then their tensile-shear strength were measured in according to the European Norm EN 205 [32]. The loss of tendile-shear strength caused by immersion in water for three hours was 62% for rubber tree and 98 % for beech. The dimensional stability of the rubber tree visibly contributed to better water resistance. However, a loss of 62% of the shear strength was too great for many applications.
• D. Jones et al. (2009) [33] investigated water resistance of chemically
modified Sitka spruce (Picea sitchensis). Water resistance of three groups of acetylated, furfuralated, and hot-oil treated samples were compared to unmodified material. Samples were bonded via the frictional bonding of dowels, linear welding and conventional glue bonding. Results showed considerable improvement in moisture behavior of impregnated wood compared to the untreated samples except the acetylated samples that did not show good strength. Hot-oil treatment improves dimensional stability and durability of the product.
1.4 Latest developments in wood welding
• B. Stamm et al. (2005) [34] fabricated a multi-layered wood compound by linear welding of Norway spruce (Picea abies) and beech (Fagus sylvatica) boards with dimensions of 110 ×50 ×10 mm. They showed that multi-layered wood compounds can be welded in a very short time. The initial shear strength obtained immediately after termination of the welding process was about 70 percent of the strength reached after 15 minutes (Figure 2).
Figure 2. Multilayered wood laminate, built of eight alternating layers of
spruce and beech boards; beech shows a darker color. B. Stamm et al. (2005) [34].

I n t r o d u c t i o n
9
• M. Properzi et al. (2005) [35] showed that high-speed dowel rotation welding is capable of holding together structures such as a wood floor of 4 m ×4 m. They showed that considerable improvement in performance may be obtained by improving dowel insertion conditions and technique and using better quality wood (Figure 3).
Figure 3. The suspended floor, 4 x 4 m and 216 mm thickness, built of welded spruce slat. M. Properzi et al. (2005) [35].
2
• C. Ganne-Chedeville, (2006) [31] showed that edge-to-edge welding of
particleboard, Oriented Strand Board (OSB), Medium Density Fiberboard (MDF), and plywood gave better strength than face-to-face panel welding. In general, the edge-to-edge weldline was slightly weaker than the panels itself.
• C. Ganne-Chedeville, (2006) [31] tested finger joint welding of Maple
(Acer campestral) and Norway spruce (Picea abies) and found that this was difficult because of the fragility of the thin fingers which were angled at 20 o (Figure 4). The tensile-shear strengths of Norway spruce samples were very low and they reflect a very poor adhesion between the wood pieces. The angle of the finger seemed too steep. Therefore, the fingers should have a different geometry with a wider angle splice to achieve good tensile strength. C. Ganne-Chedeville developed a profile of finger joint that had smaller and shorter fingers which were angled at 90 °. Large contact area of fingers leads to lower pressure on the fingers in this profile

I n t r o d u c t i o n
10
Figure 4. A section of a welded finger joint of two samples of Norway spruce (left) and Maple (right). C. Ganne-Chedeville, (2006) [31].
• C. Ganne-Chedeville tried also to develop the idea of a new type of
product, a block of laminated welded boards of aspen (Populus sp) comprised of 15 large laminates of dimensions 45 mm ×300 mm× 1650 mm to make the core of snowboard. She found it difficult to manufacture laminated welded blocks of wood. On the one hand mechanical stress during the welding process led to breaks in the wood strips and, on the other hand, welding process problems led to low adhesion and finally delamination of the board. However, they succeeded in producing a sample of snowboard whose final grades met the standard of snow board. (Figure 5)
Figure 5. Welded blocks of Populus spusedused used in the manufacture of
snowboard’s cores. C. Ganne-Chedeville, (2006) [31]. • T. A. Renaud, (2008) [36] built a minimalist chair (Z chair) designed by the
Dutch architect Gerrit T. Rietveld (1888–1964) using dowel welding without metallic or wooden angular supports. He showed that it was

I n t r o d u c t i o n
11
possible to build this type of chair without metallic or angle supports just by using rotationally welded wooden dowels (Figure 6).
Figure 6. Minimalist Z chair built by rotational dowel welding. a) Total view.
b). View of the more delicate seat/foot pillar assembly showing the two angles at which the dowels were inserted. T. A. Renaud, (2008) [36].
1.5 Principle of welding
Welding technology is new: it was invented at the end of 20 century first for thermoplastic and then for metal. The application of welding technology to wood materials is still very young and the process is to a large extent unexplored. The phenomenon of the welding occurs in less than one minute when the temperature in the welded interphase leads to softening and flowing of the lignin and hemicelluloses. The process results in the detachment of wood cells and in a formation of a fibers entanglement network immersed in a matrix of molten material which then solidifies and yields a significant adhesion in the interphase of the welding. Linear friction welding is one of many techniques in which heat is generated by the mechanical movement of parts to be welded As is shown in
th
Figure 7 the two pieces to be joined are brought into contact under pressure. One part is held rigid while the other part is moved along a line in an oscillating action. The main physical degradations in wood cell structure happen in this phase of wood flowing and the main amorphous compounds of wood such as lignin and hemicelluloses soften and flow. When frictional movement ceases the second phase of welding starts; solidification of the joint. Clamping pressure is exerted on the surface of the specimen which is called the Holding

I n t r o d u c t i o n
12
Pressure (HP) for a certain time that the sample is held motionless and this is called the Holding Time (HT). The first hypothesis is that the quality of a linear friction welded joint correlates with certain welding parameters. Therefore, strength and water resistance of the welded joints are measured and examined as a function of these parameters. These parameters are divided into the machine setting and the material properties. The welding parameters are shown bellow. Welding Pressure, WP (kN): The Pressure is exerted on the specimen during frictional movement. Welding Frequency, WF (Hz) Holding pressure, HP (kN): The clamping pressure exerted on the welded specimen after termination of the frictional movement. Holding Time, HT (s): Duration of holding the specimen under clamping pressure after termination of the frictional movement. Welding Time, WT (s): Duration of the welding process until the frictional movement is stopped. Length of displacement (mm): Amplitude of frictional movement Wood species: hardwood, softwood, heartwood, or sapwood. Equilibrium moisture content of wood, EMC (%) Dimensions of the specimen (mm)

I n t r o d u c t i o n
13
HP
Figure 7. Welding parameters involved in the welding process The design of wood welding machines is based on the welding machines for thermoplastic which generally have different working frequencies of 100-300 Hz and 0.25-2.5 mm displacement. Wood welding has its origins in fusion bonding which is a long-e tablished technology in the thermoplastics industry. Fusion bonding techniques
have often been classified according to the technology used for introducing heat as shown in
Figure 8 [37].
FR FR a
Phase (1): Wood flow Phase (2): solidification of the joint
H2OH2O
a
HPWP
HT WP WT

I n t r o d u c t i o n
14
Figure 8. Fusion bonding techniques, C. Ageorges et al.2001 [37]. Hot plate welding for large areas is four times slower than linear frictional welding and this technology is usually used for small joints. Linear frictional welding is a very fast and cost saving technology which is widely used in the automotive industry for the manufacture of various plastic components including dashboards or the interior walls of doors.
1.6 Evolution of the welding process
It is essential to measure temperature during wood welding to understand the physical deformation in wood cell structure and chemical change in wood compounds. Accurate measurement of temperature and cooling rate during the welding process is difficult because the heat generated is rapidly conducted into deeper layers. Welding temperature in other studies was measured using a thermograph [23, 38, and 2] or thermocouples [34]. The temperatures measured using thermocouples (440 C°) differ clearly from those measured using a thermograph (170-250 C°). Infra Red [IR] thermography is a two-dimensional non-contact technique for surface temperature mapping [39] which is not accurate for determination of the temperature in the contact zone. This equipment must be placed at a distance from the wood surface and the temperature is measured at the edges of the contact zone which is much lower

I n t r o d u c t i o n
15
than in the contact zone. Experiments showed that nor are measurements using thermocouples accurate because some thermocouples become loose by vibration and this leads to a falsification of the measured values. Stamm et.al [34] measured the temperature of each test specimen by four thermocouples. The bare wires of thermocouples were twisted and inserted through holes located underneath the specimen and were bent and placed at the heat-affected zone to more accurately evaluate the mean temperature. The studies revealed that the frictional force passes through different characteristic phases as are shown in the temperature profile for a welding process of 22 s, see Figure 9.
Figure 9. Classification of the process in different phases (I-VI) by progression
of the coefficient of friction as a function of the interphasial temperature (exemplified for a Norway spruce sample), B. Stamm et al. 2005 [34]
Phase I. During the initial phase of the welding process, the two pieces are brought in contact under a certain pressure (point S). The surfaces are smoothed because of boundary friction. The relatively rough surface leads to a rapid increase of temperature in the beginning. At about 120 C° the graph shows a break which on the one hand is caused by the evaporation of the moisture in the sample (12.8%), and on the other hand is caused by the polishing of the surfaces which in turn is caused by the frictional movement: this leads to a decrease in the coefficient of friction. Phase II. This phase (between E1 and I) shows a constant coefficient of friction. Therefore, the increase of temperature is nearly linear.

I n t r o d u c t i o n
16
Phase III. Phase III starts with a rapid increase of the friction force (point I) accompanied by a smoke generation. During this phase, the surfaces start to decompose due to the frictional heat at a temperature of approximately 320 C°. The friction force rises continuously and reaches a peak at point P. The increase is due to the thermal decomposition of the surfaces. It is assumed that the sliding friction is changing to lubrication during phase III. Phase IV. The achievement of the maximal temperature of 320 oC to 440 oC in phase IV leads to an equilibrium of temperature as well as of the friction force (E2). Phase V. The characteristic of phase V is equilibrium of the friction force which is maintained until termination of the frictional movement between E2 and F. This equilibrium is based on the generation of heat by frictional energy balanced by the “molten”, decomposed wood cells and the hot smoke expelled from the interphase. Possibly the wood reaches a certain state of phase transition which leads to an energy balance and, therefore, an equilibrium of heat. According to Shafizadeh [40] the evaporation of levoglucosan and the volatile pyrolysis products taking place in a temperature range between 300 oC and 500 oC is highly endothermic. Thus, the heat of evaporation leads to a cooling effect. Phase VI. This phase corresponds to the cooling of the specimen and the solidification of the “molten” material at the interphase. This process leads to the completion of the connection. Coulomb [41] stated that frictional force is independent of the velocity of the frictional movement. The frictional resistance is almost constant over a wide range of low speeds. The Greek letter μ is used to represent the coefficient of friction. It describes the ratio of frictional force (F ) and normal force (F ) of two bodies (Eq. 1). Thus the coefficient of friction can be described as the ratio of the interphasial shear stress due to friction, the frictional stress (
Fr N
Frτ ) and the joining pressure (P ) applied (Eq. 2). N
N
Fr
FF
=μ Eq. [1]
I n t r o d u c t i o n
17
N
Fr
Pτ
μ = Eq. [2]
Therefore, frictional shear stress can be defined by producing a normal pressure on a surface area (P ) and coefficient of friction (N μ ) (Eq. 3).
Frτ = P . N μ [MPa] Eq. [3] Friction results from forces occurring in the joint area. They arise from interlocking effects between the structures of adjacent surfaces and intermolecular forces. The classical laws of friction can only be applied to simple friction systems. Thus, the findings of examinations on a complex system like a friction welding process are not necessarily applicable to other systems.
1.7 Chemical characteristics of the welded region
B. Gfeller et al. [42] showed that the mechanism of mechanically induced wood welding is due mostly to the melting and flowing of amorphous cell–interconnecting polymer material in the structure of wood, mainly lignin, but also some hemicelluloses. This causes the partial detachment of long wood cells and the formation of an entanglement network drowned in a matrix of melted material which then solidifies. During the welding period some of the detached wood cells which are not being held anymore by the interconnecting material are pushed out of the joint as excess fiber. Chemical cross-linking reactions between lignin and carbohydrate-derived furfural also occur, but make less of a contribution during the very short welding period. Increasing their contribution after welding explains why relatively longer holding times under pressure after the end of welding lead to a good bond [42]. B. Gfeller et al. analyzed the connection zone of the welded beech by solid state CP MAS
13C-NMR. In short, the results of the NMR analysis indicate the
following:
A certain amount of lignin demethoxylation has occurred during welding (Figure 10).
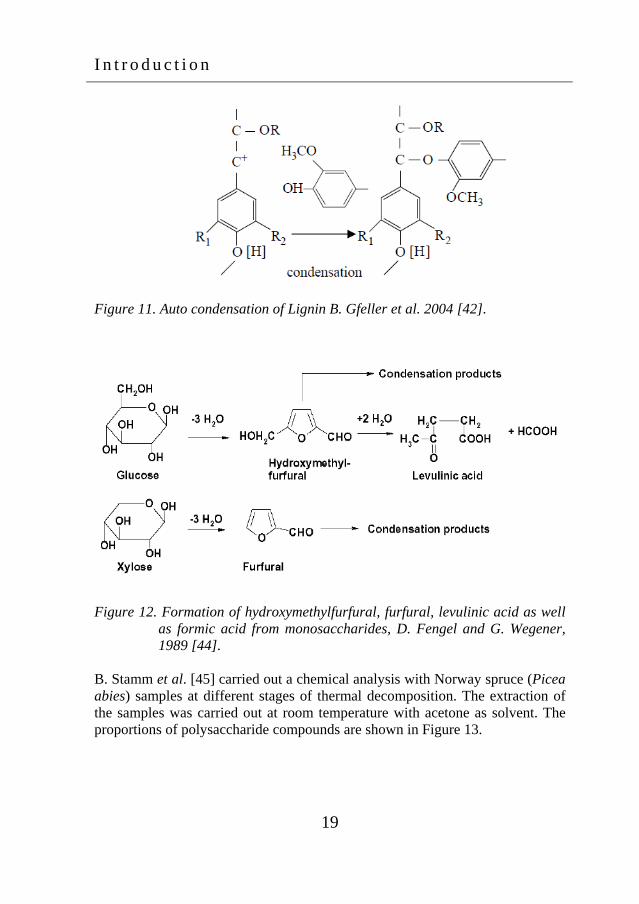
A reaction of auto-condensation of lignin on its aromatic ring appears to have occurred as shown in Figure 11.

I n t r o d u c t i o n
18
The proportion of amorphous carbohydrates appears to slightly increase during welding.
Furfural has been produced during welding and has self-polymerized or reacted with lignin aromatic nuclei or both.
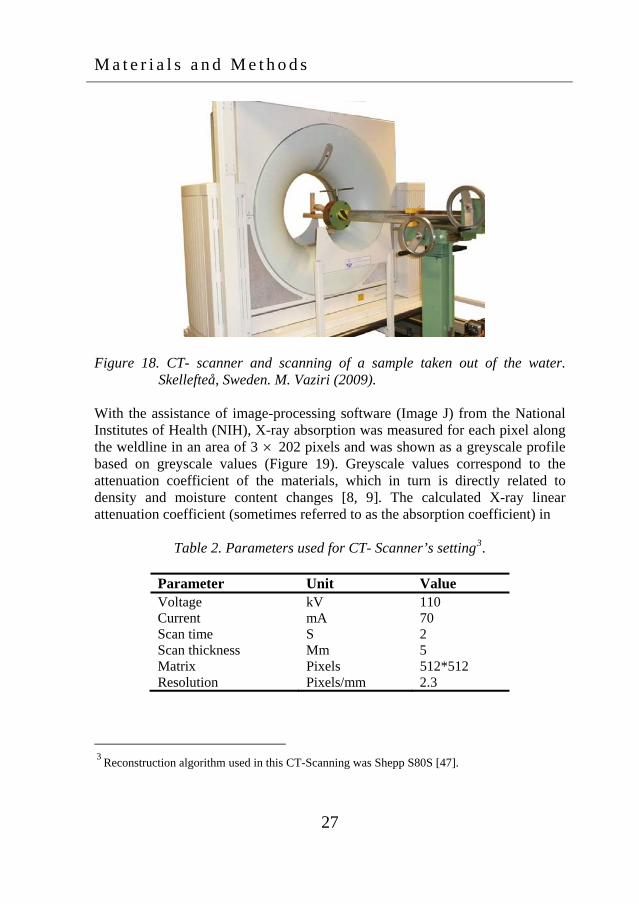
D. Fengel and G. Wegener [44] showed the thermal treatment of xylans and polyoses at temperatures higher than 150°C generally proceeds by a radical route and produces furfural and hydroxyl methyl furfural. The same route yields levulinic acid from both these compounds. Equally, lignin is subject to radical degradation reactions, see Figure 12.
Figure 10. Lignin demethoxylation was studied using enzyme extracts from
Gloeophilum trabeum by M. Lopretti et al. 1998 [43] which yields (a) veratric alcohol (b) veratric aldehyde (c) anisoin (d) vanillin (e) syringic acid,
I n t r o d u c t i o n
19
Figure 11. Auto condensation of Lignin B. Gfeller et al. 2004 [42].
Figure 12. Formation of hydroxymethylfurfural, furfural, levulinic acid as well as formic acid from monosaccharides, D. Fengel and G. Wegener, 1989 [44].
B. Stamm et al. [45] carried out a chemical analysis with Norway spruce (Picea abies) samples at different stages of thermal decomposition. The extraction of the samples was carried out at room temperature with acetone as solvent. The proportions of polysaccharide compounds are shown in Figure 13.

I n t r o d u c t i o n
20
Figure 13. Decomposition of polysaccharides during friction welding, B. Stamm
et al. [45].
• Start of thermal decomposition at about 320–350 °C , DS1 (Decomposition
Stage 1) • Transient phase at about 350–380 °C (DS2) • Steady-state phase at about 420–450 °C (DS3) The amounts of acetone extract increases with an increase of temperature. The highest increase occurs between DS2 at about 350–380 °C and DS3 at about 420–450 °C. The percentage of polyoses decreases steadily with increasing temperature. The decomposed wood, which is serving as an interconnecting medium, contains 4.5% of polyoses compared to 25.9% in the reference sample. Thereby, the thermally less stable Xylan is more affected than Mannan. The strongest decomposition of polyoses takes place in the temperature range between 320 °C and 380 °C. Due to their structural characteristics cellulose and lignin behave thermally in a more stable manner than polyoses. The amount of cellulose stays nearly the same and rises somewhat due to the thermal decomposition of the other compounds. Previous investigations [25] showed that the main cause of adhesion is observed to be fusion of wood lignin and interlocking of wood fibers that are blocked in a cured matrix of melted materials between the cells. Chemical reactions such as polymerization and cross-linking of furfural with lignin occur probably after friction. This explains why relatively long holding times give better mechanical strength of joint. These reactions appear to have a minor effect relative to the other mechanically entangled fibers at the interphase.

I n t r o d u c t i o n
21
1.8 Microstructure of weldline
Scanning electron microscopy of weldline by Gfeller et.al. [25] shows one of the characteristic bands on the surface of fusion welded wood (Figure 14-a). One can see fibers, long wood cells, or tracheids immersed in a mass of molten polymer. Since the cells are not greatly damaged, this means that melting has mainly occurred in the intercellular connecting tissue or middle lamella. Wood middle lamella is particularly rich in lignin, more than any other of the anatomical features of woods and possibly includes some hemicelluloses. Figure 14-b shows a detail of the excess fibers expelled from the bondline during welding. In this figure the fiber is clearly an entire, undamaged, long wood cell and the material that is seen on its surface in patches is definitely part of damaged, melted cell–interconnecting material, hence mainly lignin from the wood middle lamella. These photos demonstrate a network of interlocking wood fibers that are blocked in a cured matrix of melted material between the cells.
Figure 14. a) Scanning electron microscopy images of filaments of wood cells
(tracheids) detached from the excess fibers issued during welding of the bondline. b) A single wood cell detail. Note the residual fused amorphous material clinging to the tracheid’s surface which is the residue of the intercellular bonding material holding wood cells together, Gfeller et al. 2003[25].
Microscopic examination of a heat-affected zone by Stamm [1] showed the cell cavities and cell walls had collapsed as a result of pressure, heat generation, and shearing. (Figure 15). These effects of cell destruction at the interphase and the adjoining regions are much less apparent on annual rings of latewood. Thicker latewood cell walls with smaller voids are nearly intact, as it is shown in picture b.

I n t r o d u c t i o n
22
Figure 15. a) Microscopic pictures of the heat-affected zone and the adjacent regions (Picea abies, transverse plane). b) SEM micrographs of a spruce weld, B. Stamm, 2006 [1].
Cracks visible between the contact layer and the adjoining cell structure are due to the samples` preparation for microscopy. (Figure 15-b). It appears to be the same failure mechanism as is observed during tensile-shear strength test which indicates that the weldline materials have a cement-like structure.
1.9 Limitations
Materials and methods used in this study are limited only to one species and to equipments with a spatial resolution as bellow: • The mechanical welding machine used was a Mecasonic linear vibration
welding machine (LVW2061) with a vibration frequency up to 260 Hz, normally used to vibrationally weld thermoplastics.
• A SIEMENS Emotion Duo medical X-ray CT-scanner with a resolution of 2.3 Pixels/mm was used.
• The MRI equipment was 9.4 T vertical Bruker BioSpec USR 94/20, a small animal scanner
• Solid state CPMAS 13 C NMR spectra were recorded on a Bruker AVANCE 300 spectrometer at a frequency of 75.47 MHz.
• Tensile-shear strength test equipment was Instron Universal 30 kN. • X-ray microdensitometry equipment consisted of an electric generator
(INEL XRG3000), an X-ray tube (SIEMENS FK60-04 Mo, 60 kV-2.0 kW) and a KODAK film negative Industrex type M100.
• All experiments were carried out at ambient conditions, relative humidity (RH) 64% and temperature 20°C

I n t r o d u c t i o n
23
• Dimensions of the specimens used in this study were adapted to the welding machine’s limitations. The specimens were of dimensions 20 mm × 40 mm × 200 mm composed of two pieces of Scots pine which were cut in a longitudinal direction.
• Water absorption in the welded woods was achieved by placing the sample with the butt ends in a basin on bars of stainless steel in tap water 5 mm deep.
• Weldline density, measured using CT-scanning, was not accurate due to the limited detector width of 1 mm.
1.10 Error sources
Crack length, crack location, water absorption, and weldline density were measured by CT-scanning and by image processing. To ensure that the measurements were made every time at the same position some marks were made on the surface and cross-section of the samples as targets for the positioning laser on the tomograph. These marks could guide the reposition of the samples for each CT-scanning at the same place as before. The accuracy of the tomograph and image processing was tested on samples with an known MC of 10% and oven dried samples as references. Subtraction of the test images from the reference images showed an average MC of 9.9 % (s. d. 0.4), which indicated a measurement satisfactory on small volumes and when density variation was small.
±
The appearance of the first crack in the weldline was determined to be a short black streak in the weldline on the CT image. The definition of crack was based on the differences in density (grayscale) in images. The first CT images (references) were taken after 20 days conditioning of the samples at the ambient climate in the laboratory. Their average MC was 5% (s.d. ± 0.2).

M a t e r i a l s a n d M e t h o d s
24
2. Materials and Methods
2.1 Water resistance experiments [paper I]
2.1.1 Wood Welding 80 specimens of dimensions 200 mm × 20 mm × 20 mm were cut from heartwood and sapwood of Scots pine in longitudinal direction of wood grain (40 specimens from heartwood and 40 specimens from sapwood). The specimens were conditioned for one week at standard conditions (RH 65%, 20°C) before testing to obtain 12% moisture content. They were welded together two at a time to form a bonded joint of 200 mm × 20 mm × 40 mm by a linear vibration welding machine (LVW 2061 Mecasonic, Annemasse, France) as shown in Figure 16.
Figure 16 : linear vibration welding machine (LVW 2061 Mecasonic made in Annemasse, France), M.Vaziri et al. 2010 [46, paper II].
Certain ranges of welding machine parameters were used and some parameters such as welding pressure, welding time, and heartwood or sapwood were selected as design factors for evaluation in this study (Table 1).
Table 1. Parameters used for welding machine setting.
Parameter Unit Value Welding pressure (WP) Welding time (WT) Welding displacement (WD) Frequency Holding pressure (HP) Holding time (HT) Equilibrium moisture content( EMC)
[MPa] [s] [mm] [Hz] [MPa] [s] [%]
1.3 0.75 1.5 2.5 2 150 2.75 50 12

M a t e r i a l s a n d M e t h o d s
25
The specimens were welded by various factor combinations as shown in Table 2. Test objects were conditioned in the laboratory at ambient conditions for 20 days before water absorption. Wood samples are inhomogeneous and to minimize their variability samples were chosen randomly and sample to sample variability was ignored. Based on a theoretical understanding and practical experience two pressure levels of 0.75 MPa and 1.3 MPa and two welding times of 1.5 s and 2.5 s were chosen for evaluation. Table 2 2 . Combinations of welding parameters and type of wood used in this
study. Parameters combination P T H/S P1T1H 0.75 1.5 heartwood P1T1S 0.75 1.5 sapwood P2T2H 1.3 2.5 heartwood P2T2S 1.3 2.5 sapwood P1T2H 0.75 2.5 heartwood P1T2S 0.75 2.5 sapwood P2T1H 1.3 1.5 heartwood P2T1S 1.3 1.5 sapwood
2.1.2 Water absorption Test objects were conditioned in the laboratory at ambient conditions for 30 days before scanning. Moisture content of the specimens was determined using 10 additional samples. The average moisture content of the samples was 5 %. Conditioned samples were scanned by a CT- scanner and one CT image was taken for each sample as shown in figure 17. Then the welded specimens were placed in a shallow aluminum basin of small bars, which were filled with 5 mm of tap water. The specimens stood with the butt end in the water.
2 P is representative of welding pressure at low (P1) and high (P2) levels. T is representative of welding time at low (T1) and high (T2) levels. H is representative of heartwood. S is representative of sapwood.

M a t e r i a l s a n d M e t h o d s
26
Crack Weldline
a b
Figure 17. A specimen of sapwood welded using 0.75 MPa welding pressure and 1.5 s welding time. a) CT image before water absorption and b) CT image after water absorption. The crack appeared as a black streak in the weldline after water absorption for 5 h.
2.1.3 CT-scanning and Image processing A SIEMENS Emotion Duo medical X-ray CT- scanner (Figure 18) was used and scanning was carried out at ambient conditions, relative humidity (RH) 65% and temperature 22°C, according to the scanner settings in Table 2. To create an environment with varying humidity like that in exterior use the test objects were transferred from the water basin to the CT-scanner for each scanning. Therefore, samples lost some water during scanning and transport. Each sample was scanned for equal intervals of 10 minutes according to a time schedule until the first crack appeared in the weldline as shown in Figure 17-b. This crack appearance time varied from 1 to 752 hours.
M a t e r i a l s a n d M e t h o d s
27
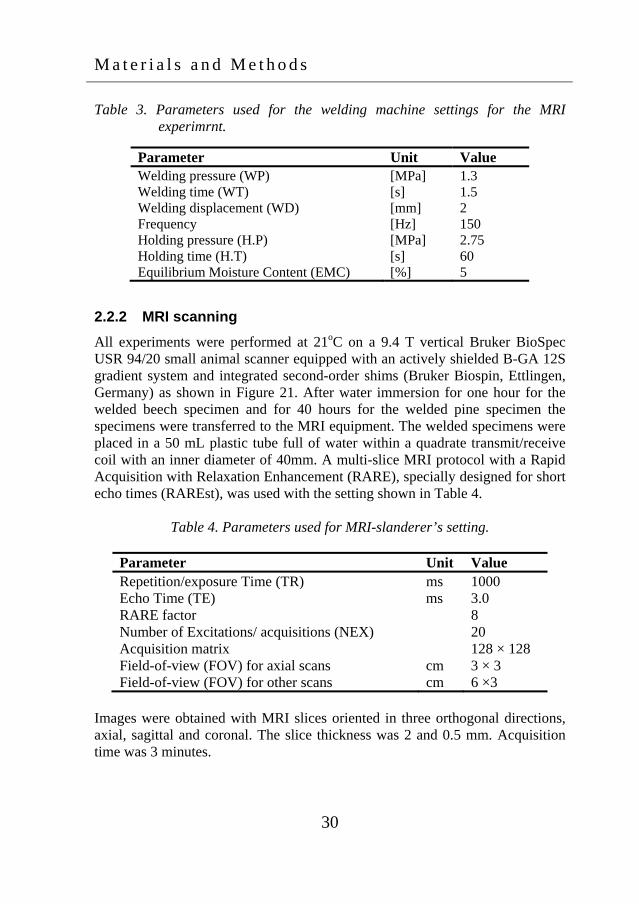
Figure 18. CT- scanner and scanning of a sample taken out of the water.
Skellefteå, Sweden. M. Vaziri (2009). With the assistance of image-processing software (Image J) from the National Institutes of Health (NIH), X-ray absorption was measured for each pixel along the weldline in an area of 3 × 202 pixels and was shown as a greyscale profile based on greyscale values (Figure 19). Greyscale values correspond to the attenuation coefficient of the materials, which in turn is directly related to density and moisture content changes [8, 9]. The calculated X-ray linear attenuation coefficient (sometimes referred to as the absorption coefficient) in
Table 2. Parameters used for CT- Scanner’s setting3.
Parameter Unit Value Voltage kV 110 Current mA 70 Scan time S 2 Scan thickness Mm 5 Matrix Pixels 512*512 Resolution Pixels/mm 2.3
3 Reconstruction algorithm used in this CT-Scanning was Shepp S80S [47].

M a t e r i a l s a n d M e t h o d s
28
each small volume element (voxel) was normalized by the corresponding linear attenuation coefficient for water according to Eq. 4.
Figure 19. Gray value versus length of the specimen. X-ray absorption for each
pixel was measured in the longitudinal cross section of the weldline [paper II].
This normalized value was referred by the CT-number [48]. CT-number = 1000×[ μ -μ ] ÷ μ Eq. [4] x water water
where
μ = attenuation coefficient for the tested material at an average photon energy of 73 keV.
x
Thus a CT-number of -1000 indicates an object, or a voxel within the object that has the density of air. A CT-number of zero indicates a region in the slice of the object with the density of water. The reference CT- number profile of one sample before water absorption is shown in Figure 19. After CT-scanning the specimens were placed with the butt ends in a basin on bars of stainless steel in tap water 5 mm deep for water absorption. The test objects were transferred from the water basin to the CT-scanner for each scanning. Therefore, samples lost some water during scanning and transport, and varying humidity like outdoor conditions arose. Even if the first crack in the sample was too small to be visible to naked eye it could be measured in the CT-images. For each greyscale profile after water absorption

M a t e r i a l s a n d M e t h o d s
29
the corresponding CT-number profile was calculated by image processing software image J. In figure 20, the CT-number profile after water absorption is compared to the respective original CT-number profile. CT-numbers in the dotted circle zone fall below the original CT-number that indicates a crack is forming in this area.
700
750
800
850
900
950
1000
1050
1100
1150
0 50 100 150 200
length of specimen (mm)
CT-
num
ber
Before water absorption
After water absorption for 15 h
Figure 20. CT-numbers in dotted circle are falling below the original CT-
number that indicates a crack is forming in this area [paper II].
2.2 Magnetic Resonance Imaging (MRI) [paper V]
2.2.1 Sample preparation method Four specimens of dimensions 200 mm × 20 mm × 20 mm were cut from beech and sapwood of Scots pine in the longitudinal direction of the wood grain (2 specimens from beech and 2 specimens from Scots pine). Two wood pieces of each species were welded together to form a bonded sample of dimensions 200 mm × 20 mm × 40 mm using a linear vibration welding machine LVW 2061Mecasonic, Annemasse, France as shown in Figure 16. The welding machine parameter ranges are shown in Table 3. The welded wood specimens were divided into smaller pieces (30 mm × 20 mm ×100 mm) for MRI scanning. Sample preparation for MRI was done by immersing the welded wood specimens into tap water up to the time of the scanning and then they were mounted into MRI equipment.
M a t e r i a l s a n d M e t h o d s
30
Table 3. Parameters used for the welding machine settings for the MRI experimrnt.
Parameter Unit Value Welding pressure (WP) Welding time (WT) Welding displacement (WD) Frequency Holding pressure (H.P) Holding time (H.T) Equilibrium Moisture Content (EMC)
[MPa] [s] [mm] [Hz] [MPa] [s] [%]
1.3 1.5 2 150 2.75 60 5
2.2.2 MRI scanning All experiments were performed at 21oC on a 9.4 T vertical Bruker BioSpec USR 94/20 small animal scanner equipped with an actively shielded B-GA 12S gradient system and integrated second-order shims (Bruker Biospin, Ettlingen, Germany) as shown in Figure 21. After water immersion for one hour for the welded beech specimen and for 40 hours for the welded pine specimen the specimens were transferred to the MRI equipment. The welded specimens were placed in a 50 mL plastic tube full of water within a quadrate transmit/receive coil with an inner diameter of 40mm. A multi-slice MRI protocol with a Rapid Acquisition with Relaxation Enhancement (RARE), specially designed for short echo times (RAREst), was used with the setting shown in Table 4.
Table 4. Parameters used for MRI-slanderer’s setting.
Parameter Unit Value Repetition/exposure Time (TR) ms 1000 Echo Time (TE) ms 3.0 RARE factor 8 Number of Excitations/ acquisitions (NEX) 20 Acquisition matrix 128 × 128 Field-of-view (FOV) for axial scans cm 3 × 3 Field-of-view (FOV) for other scans cm 6 ×3
Images were obtained with MRI slices oriented in three orthogonal directions, axial, sagittal and coronal. The slice thickness was 2 and 0.5 mm. Acquisition time was 3 minutes.

M a t e r i a l s a n d M e t h o d s
31
Figure 21. BioSpec, Multi Purpose High Field MRI/MRS Research System at
Umeå university,Umeå, Sweden.
2.3 Water immersion and weathering test [paper VII]
Specimens composed of two pieces of Scots pine, each of dimensions 200 mm × 20 mm × 20 mm were welded together to form a bonded specimen of dimensions 200 mm × 20 mm × 40 mm by a vibration movement of one wood surface against another The parameters which varied in the experiments are shown in Table 5. Table 5. Parameters used for welding machine setting in water immersion and
weathering test.
Parameter Unit Value Welding pressure (WP) Welding time (WT) Welding displacement (WD) Frequency Holding pressure (H.P) Holding time (H.T) Equilibrium moisture content (EMC)
[MPa] [s] [mm] [Hz] [MPa] [s] [%]
1.3 3 3.5 2 150 2.75 50 12
The samples were welded in the longitudinal wood grain direction. The specimens were cut according to the method described in European standard EN 302-1 [49] for bonded wood joints with a welded overlap of 1 cm along the length of the joint and 2 cm width. The strengths of the joints were measured using an Instron universal testing machine at a rate of 2 mm/minute as was

M a t e r i a l s a n d M e t h o d s
32
described in standard EN 302-1 (Figure 22). A series of 10 samples so prepared for each welding time were tested dry and a series of other samples immersed in cold water (15°C) and the average time the samples took to fall apart while immersed was measured. As water immersion in a laboratory is indicative but not really proof of the ability of a joint to withstand wet/dry outdoor climatic variations, the welded pine wood joints were exposed to the winter/spring weather and samples taken and tested at regular intervals of one month for one year.
150 m
m
10 mm
20 mm
Figure 22.Tensile-shear strength of the welded connections was determined
using Instron Universal 30 kN along the longitudinal direction of the samples. Two cuts at a distance of 10 mm from each other were made perpendicular to the weldline according to European standard EN 205. Mojgan Vaziri (2010) [paperVI].

M a t e r i a l s a n d M e t h o d s
33
2.4 Solid state NMR [paper VII]
Some welded Samples of water immersion and strength test were used for solid state NMR. Solid state CPMAS (cross-polarization/magic angle spinning) C NMR spectra were recorded on a Bruker AVANCE 300 spectrometer at a frequency of 75.47 MHz. Chemical shifts were calculated relative to Tetra Methyl Silane (TMS). The rotor was spun at 4 kHz on a double-bearing 7 mm Bruker probe. The spectra were acquired with a 5 s recycle delay, a 90° pulse of 5 s and a contact time of 1 ms. The number of transients was 3000.
13
The C CPMAS spectra with dipolar dephasing were recorded with a delay of 50 s. The number of transients was 16000.
13
2.5 X-ray microdensitometry [paper VII]
Some welded samples of water immersion -and strength test were used for X-ray microdensitometry. The used X-ray microdensitometry equipment consisted of an X-ray tube producing “soft rays” (low energy level) with long wave characteristics emitted through a beryllium window. These were used to produce an X-ray negative photograph of approx. 2 mm thick samples, conditioned at 12 % moisture content, at a distance of 2.5m from the tube. This distance is important to minimize blurring of the image on the film frame (18 × 24 cm) which was used. The usual exposure conditions were: 4 hours, 7.5 kW and 12 mA. Two calibration samples were placed on each negative photograph in order to calculate wood density values. The specimens were tested in this manner by equipment which consisted of an electric generator (INEL XRG3000), an X-ray tube (SIEMENS FK60-04 Mo, 60 kV-2.0 kW) and a KODAK film negative Industrex type M100 in
2.6 Tensile-shear strength test [paper VI]
76 specimens of dimensions 20 mm × 20 mm × 200 mm were cut from Scots pine sapwood and welded together to form 32 welded samples of dimensions 20 mm × 40 mm × 200 mm. All samples were cut along the longitudinal wood grain direction and were welded according to welding parameters in Table 6.

M a t e r i a l s a n d M e t h o d s
34
Table 6. Parameters used for welding machine setting in tensile-shear strength test.
Parameter Unit Value Welding pressure (WP) Welding time (WT) Welding displacement (WD) Frequency Holding pressure (H.P) Holding time (H.T) Equilibrium moisture content (EMC)
[MPa] [s] [mm] [Hz] [MPa] [s] [%]
0.75 1.3 1.8 2 2.8 3.5 2 150 2 60 70 80 12
Central Composite Design (CCD) was chosen as an experimental design. CCD design is a general and flexible design for an optimization studies which consists of a 2 factorial with some central points [50]. The region of interest was cuboidal rather than spherical. A face-centered cubic design was therefore chosen. This design requires only three levels of each factor, and since in practice it was difficult to vary welding factor levels, this design was appropriate. Three controllable variables such as welding pressure, welding time, and holding time were chosen as design factors at three levels (
3
Table 7). Table 7. Welding parameter and their actual and coded levels used in the
experiment.
Parameters Low level (-1)
Central point (0)
High level (1)
Welding pressure (MPa) 0.75 1.3 1.85 Welding time (s) 2 2.8 3.5 Holding time (s) 60 70 80
Samples were denoted according to coded variables, for example the notation [-1, 1, 0] signified welding pressure at 0.75 MPa, welding time at 3.5 s, and holding time at 70 s. A computer generated design using statistical software Minitab [51] was used for this purpose. The model had 14 runs with two replicates and a centre point (0, 0, 0) signifying 1.3 MPa welding pressure, 2.8 s welding time, and 70 s holding time. The specimens were cut according to the method described in European standard EN 205 [33]. In the middle of the specimens two cuts perpendicular to the weldline were made. The distance between the two cuts was 10 mm. The samples were formed so that they were appropriate for the test equipment. Detailed information about the form and dimensions of the test specimens suitable for the test equipment is given in
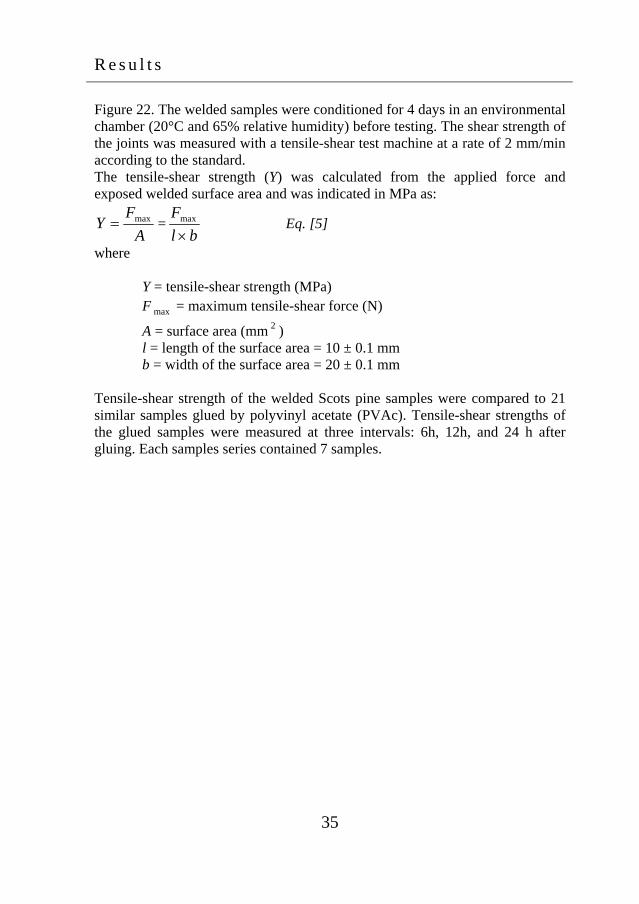
R e s u l t s
35
Figure 22. The welded samples were conditioned for 4 days in an environmental chamber (20°C and 65% relative humidity) before testing. The shear strength of the joints was measured with a tensile-shear test machine at a rate of 2 mm/min according to the standard. The tensile-shear strength (Y) was calculated from the applied force and exposed welded surface area and was indicated in MPa as:
AF
Y max= =bl
F×max Eq. [5]
where Y = tensile-shear strength (MPa) F max = maximum tensile-shear force (N)
A = surface area (mm ) 2
l = length of the surface area = 10 ± 0.1 mm b = width of the surface area = 20 ± 0.1 mm Tensile-shear strength of the welded Scots pine samples were compared to 21 similar samples glued by polyvinyl acetate (PVAc). Tensile-shear strengths of the glued samples were measured at three intervals: 6h, 12h, and 24 h after gluing. Each samples series contained 7 samples.

R e s u l t s
36
3. Results All data were analyzed by means of the statistical software Minitab. Minitab is a widely available statistical software package with high capability for data analysis of experiments with both fixed and random factors [50].
3.1 CT-scanning experiments
3.1.1 Crack length, crack location, and crack time This investigation involved several parameters and it was necessary to study the joint effect of parameters on response, so a factorial design was considered. An experiment based on a 2
3 full factorial design and 5 replicates was performed
with three parameters (welding pressure, welding time, and sapwood/ heartwood), each at only two levels of high and low. In a 2 factorial design, it is easy and intuitive to express the results of the experiments in terms of a mathematical model called a regression model. All three evaluated factors had significant effect on the length and location of the crack with a 95% confidence interval. Graphs of the average responses for each factor combination are shown in Figures 23, 24, and 25. The prediction abilities (R ) were calculated to 96% for crack length, 94% for crack location and 98% for crack time. The model based on this data set could be regarded as satisfactory at predicting new responses.
k
2
9080706050403020100
100
80
60
40
20
0
Predicted crack length ( mm)
Obs
erve
d cr
ack
len
gth
(m
m)
2R = 0.96
Figure 23 : Scatter plot for observed values versus predicted values for crack
length

R e s u l t s
37
R= 0.94
50403020100
60
50
40
30
20
10
0
Predicted crack location (mm)
Obs
erve
d cr
ack
loca
tion
(m
m)
2R = 0.94
Figure 24. Scatter plot for observed values versus predicted values for crack
location (height position of the crack).
Figure 25. Scatter plot for observed values versus predicted values for crack
time.
5004003002001000
500
400
300
200
100
0
Predicted crack time (h)
Obs
erve
d cr
ack
tim
e (h
)
R = 0.982
In these figures multiple data points are observed crack time including 5 replicates for each observation. Replication means an independent repeat of each observation to obtain an estimate of the experimental error and a more
precise estimate of ( ). _y
There were three dependent variables or responses y: (crack length, crack location, and crack time) that depended on three independent variables (welding pressure, welding time, and sapwood/heartwood). The relationship between these variables was characterized by three linear regression models fitted to the data. The analysis gave with a 95% confidence interval three significant factors and linear regression models were found to be:
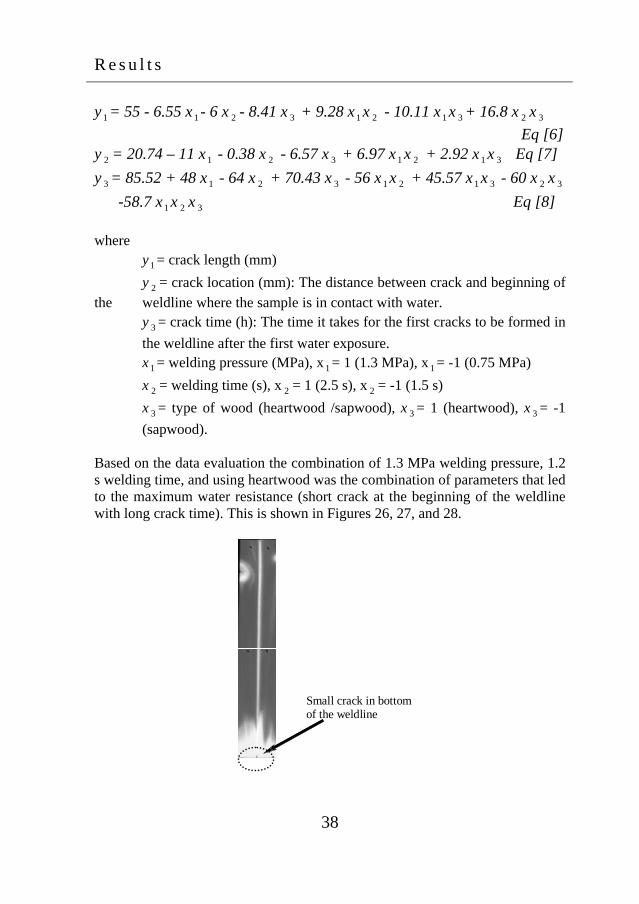
R e s u l t s
38
y 1 = 55 - 6.55 x 1 - 6 x - 8.41 x 3 + 9.28 x 1 x - 10.11 x 1 x + 16.8 x x Eq [6]
2 2 3 2 3
y = 20.74 – 11 x 1 - 0.38 x 2 - 6.57 x 3 + 6.97 x 1 x 2 + 2.92 x 1 x 3 Eq [7] 2
y 3 = 85.52 + 48 x 1 - 64 x + 70.43 x - 56 x 1 x + 45.57 x 1 x - 60 x x -58.7 x 1 x x 3 Eq [8]
2 3 2 3 2 3
2
where y 1 = crack length (mm) y 2 = crack location (mm): The distance between crack and beginning of the weldline where the sample is in contact with water. y 3 = crack time (h): The time it takes for the first cracks to be formed in the weldline after the first water exposure. x 1 = welding pressure (MPa), x1 = 1 (1.3 MPa), x = -1 (0.75 MPa) 1
x = welding time (s), x 2 = 1 (2.5 s), x = -1 (1.5 s) 2 2
x 3 = type of wood (heartwood /sapwood), x 3 = 1 (heartwood), x 3 = -1 (sapwood). Based on the data evaluation the combination of 1.3 MPa welding pressure, 1.2 s welding time, and using heartwood was the combination of parameters that led to the maximum water resistance (short crack at the beginning of the weldline with long crack time). This is shown in Figures 26, 27, and 28.
Small crack in bottom of the weldline

R e s u l t s
39
Figure 26. CT- image of a heartwood sample welded using 1.3 MPa welding pressure and 1.5 s welding time as an example for length and location of crack. This combination of parameters produces only a short crack at the beginning of the weldline as shown in the dotted circle
-350
-300
-250
-200
-150
-100
-50
00 50 100 150 200
Weldline length (mm)
CT-
num
ber
Before water absorption
After water absorption for 752 h
Crack
Figure 27. CT- number versus weldline length (mm) in a sample of heartwood
welded using 1.3 MPa welding pressure and 1.5 s welding time. This combination of factors produces only a very short crack at the beginning of the weldline after the longest crack time (752 h) which is shown in the dotted circle.

R e s u l t s
40
0
50
100
150
200
250
300
350
400
450
500
Mea
n cr
ack
time
( h)
P2T1S P1T1S P2T2S P2T2H P2T1H P1T1H P1T2H P1T2S
Welding factors combinations
P1 = 0.75 MPa P2 = 1.3 MPa T1 = 1.5 s T2 = 2.5 s H = Heartwood S = Sapwood
Figure 28. Influence of welding pressure, welding time, and heartwood/ sapwood on crack time (h). 1.3 MPa welding pressure, 1.5 s welding time and using heartwood (P2T1H) give the longest crack time (489 h). However, 0.75 MPa welding pressure, 2.5 s welding time, and using sapwood (P1T2S) give the shortest crack time (4.7 h).
3.1.2 Density and water absorption in the weldline All three evaluated parameters showed a significant effect on weldline density and water absorption in the weldline with 95% confidence interval and linear regression models were found to be: y = 829.43 + 16.9 x 1 - 11.61 x - 7.68 x 3 + 10.88 x 1 x + 16.x 2 x 3 Eq.[9] 4 2 2
y 5 = 11- 3.75 x 1 + 3 x - 1.15 x - x 1 x Eq[10] 2 3 2
where y 4 = weldline density (kg/m
3)
y 5 = water absorption of weldline (%) x 1 = welding pressure (MPa) x = welding time (s) 2
x 3 = type of wood (sapwood/heartwood)

R e s u l t s
41
Correlation between observed and predicted values (R ) for both weldline density and water absorption was 0.95 so the model based on this data set had great ability to predict a new weldline density and water absorption in the weldline (
2
Figure 29 and 30). Water absorptions and weldline densities of 40 specimens were measured by an image processing program (Image J). Multiple data points show the measured weldline densities for five samples welded with the same factor combination (replicates).
Figure 29. Scatter plot for observed weldline density versus predicted weldline
density (kg/m)
Figure 30. Scatter plot for observed water absorption versus predicted water
absorption (%).
870860850840830820810800790780
870
860
850
840
830
820
810
800
790
780
Predicted density ( kg/m3)
Obs
erve
d de
nsi
ty (
kg/m
3)
R = 0.952
1615141312111098
17
16
15
14
13
12
11
10
9
8
Predicted water absorption (%)
Obs
erve
d w
ater
abs
orpt
ion
(%
)
R = 0.952

R e s u l t s
42
Combination of 1.3 MPa welding pressure, 1.5 s welding time, and sapwood (P2T1S) led to the highest density (Figure 31). Factor combination of 1.3 MPa welding pressure, 1.5 s welding time, and heartwood (P2T1H) led to minimum water absorption in the weldline as shown in Figure 32.
790
779
80981582082
8
85086
9
700
720
740
760
780
800
820
840
860
880
900
P2T1S
P1T1S
P2T2S
P2T2H
P2T1H
P1T1H
P1T2H
P1T2S
Parameters combinations
Mea
n w
eldl
ine
dens
ity (
kg/m
3 )
P1 = 0.75 MPa P2 = 1.3 MPa T1 = 1.5 s T2 = 2.5 s H = Heartwood S = Sapwood
Figure 31. Influence of welding parameters and wood type on weldline density (kg/m ). P is weldline pressure at low and high levels. (P1: 0.75 MPa, P2: 1.3 MPa) and T is welding time at short and long levels (T1: 1.5 s, T2: 2.5 s). S and H represent sapwood and heartwood respectively.
3
In Figure 32 Samples welded by a factor combination of 1.3 MPa welding pressure, 1.5 s welding time, and heartwood (P2T1H) show the least water absorption. The most water absorption was shown for a factor combination of 0.75 MPa welding pressure, 2.5 s welding time and sapwood (P1T2S) which also had the lowest weldline density (Figure 31). Figure 33 indicates that there is no definite relationship between density and crack time.

R e s u l t s
43
0
5
10
15
20
25
0 0.5 1 1.5 2 2.5 3
Weldin g Figure 32. Influence of welding parameters and wood properties on water
absorption in the weldline. The factors combinations giving highest and lowest water absorption are shown in two dotted circles. P is weldline pressure at low and high levels. P1: 0.75 MPa, P2: 1.3 MPa. S and H represent sapwood and heartwood respectively.
Figure 33. Comparison of weldline density and crack time upon exposure to moisture.
720
740
760
780
800
820
840
860
880
P2T1S
P1T1S
P2T2S
P2T2H
P2T1H
P1T1H
P1T2H
P1T2S
Parameters combinations
Wel
dlin
e de
nsity
(kg/
m3 )
0
100
200
300
400
500
600
Cra
ck ti
me
(h)
Mean weldline densityMean crack time
P1 = 0.75 MPa P2 = 1.3 MPa T1 = 1.5 s T2 = 2.5 s H = Heartwood S = Sapwood
time (s)
Wat
er a
bsor
ptio
n in
the
wel
dlin
e (%
)
P2H
P1S
P2S
P1H
0
5
10
15
20
25
0 0.5 1 1.5 2 2.5 3
Welding time (s)
Wat
er a
bsor
ptio
n in
the
wel
dlin
e (%
)
P2H
P1S
P2S
P1H

R e s u l t s
44
The factor combination of P2T1H that gave the longest crack time did not give the highest weldline density. Figure 34 shows the specimens with the least water absorption (P2T1H) also showed the shortest crack in the beginning of the weldline. Factors combination of 1.3 MPa welding pressure, 1.5 s welding time, and heartwood (P2T1H) led to the highest water resistance in terms of the least water absorption and shortest crack in the beginning of the weldline. Crack formation for this factor combination (P2T1H) took much more time than for the other factor combinations (Figure 35).
e, and heartwood (P2T1H) led to the highest water resistance in terms of the least water absorption and shortest crack in the beginning of the weldline. Crack formation for this factor combination (P2T1H) took much more time than for the other factor combinations (A factor combination of 0.75 MPa welding pressure, 1.5 s welding time, and sapwood (P1T1S) led to poor water resistance (gave the largest cracks in the middle of the weldline), but the most water absorption occurred in sapwood samples welded by 0.75 MPa welding pressure and 2.5 s welding time (P1T2S).
A factor combination of 0.75 MPa welding pressure, 1.5 s welding time, and sapwood (P1T1S) led to poor water resistance (gave the largest cracks in the middle of the weldline), but the most water absorption occurred in sapwood samples welded by 0.75 MPa welding pressure and 2.5 s welding time (P1T2S).
Figure 35).
The densification degree of the weldline varied between 164-190 % of the untreated wood density and degrees of densification of sapwoods were higher than those of heartwoods.
The densification degree of the weldline varied between 164-190 % of the untreated wood density and degrees of densification of sapwoods were higher than those of heartwoods.
Crack length (mm)Crack location- height from bottom of the weldline (mm)Water absorption (%)
7
25.7
12.8
14.6
4.59.
319.3
16.3
0102030405060708090
P1T1S P1T1H P2T2S P2T1S P1T2H P2T2H P1T2S P2T1H
Parameter combination
P1 = 0.75 MPa P2 = 1.3 MPa T1 = 1.5 s T2 = 2.5 s H = Heartwood S = Sapwood
Figure 34. Comparison between water resistance of the weldline in terms of
crack length, crack location, and water absorption for different welding factor combinations.
Figure 34. Comparison between water resistance of the weldline in terms of crack length, crack location, and water absorption for different welding factor combinations.

R e s u l t s
45
4.5 7 19
.3
14.6
12.8
16.3
9.3 19
0
50
100
150
200
250
300
350
400
450
500
P2T1H P1T1H P1T2H P1T1S P2T1S P2T2S P2T2H P1T2S
Parameters combination
Water absorption (%)Crack time (h )
P1 = 0.75 MPa P2 = 1.3 MPa T1 = 1.5 s T2 = 2.5 s H = Heartwood S = Sapwood
Figure 35. Relation between water absorption in the weldline and crack time
3.2 MRI measurement
Figure 36 shows MRI images from axial (left) and coronal (right) views of welded beech (top) and welded pine (bottom). The weldline is clearly visible as a line of brighter intensity for the beech sample, implying that water quickly penetrates into the weldling and the origin of joint failure in the beech sample is at that site. The weldline is not visible in the pine sample as the high water resistance of the weldline of pine does not allow water penetration even after 40h water immersion. The main reason for crack formation in the pine samples may be swelling and shrinkage of the wood pieces.

R e s u l t s
46
A B
C D
Figure 36. MRI images in the axial (left) and coronal (right) directions of
welded beech (A, B) and welded pine (C, D) specimens. Beech and pine welded specimens were scanned after water absorption for 1h and 40 h, respectively
3.3 Water immersion and weathering
The times that these joints were capable to withstand immersion in water without falling apart and still having measurable strength were remarkable. In Table 8 the heartwood sample withstood more than 165 days in cold water. The sapwood samples had somewhat poorer performance, but they still held for 60 days immersed in cold water. All these results for Scots pine compare very favorably to conventional linear welded joints studied for beech that first were not able to stand in water for more than 30 minutes [25]. When the welding conditions were changed the welded beech samples were able to reach only 25 hours of cold water immersion [4, 52]. Table 9 shows that welded heartwood samples yield much improved field durability, the samples still showing residual strength of about half of the original dry sample after four months exterior exposure. The percentage of wood failure decreases by only one third during the same field exposure period. The results for sapwood are less improved, performance being maintained for only 2 months weather exposure.

R e s u l t s
47
Table 8. Results of strength, percentage wood failure and durability in cold water for welded Scots pine.
Specimen Welding
Time (s) Average joint strength (MPa)
Wood failure (%)
Resistance to cold water soak at strength test (day)
Resistance in cold water (day)
Heartwood 2+1.5 = 3.5 4.1 ± 0.5 86∗ >210∗ >455 Sapwood 2+1.5 = 3.5 3.5 ± 0.7 100∗∗ 60∗∗ >455 Sapwood 2+1 = 3 1.8 ± 1 42∗∗ 60∗∗ >455
* Strength and wood failure after 210 days immersion in cold water
** Strength and wood failure after 60 days immersion in cold water
Table 9. Results of strength and percentage of wood failure for Scots pine
welded wood joints after weather exposure
Exterior exposure (month)
Average joint strength (MPa)
Average wood failure (%)
Heartwood Start 6.2 ± 2.0 86 ± 24 2 months 3.9 ± 1.4 73 ± 25 4 months 3 ± 0.8 63 ± 29 6 months 0.1 ± 0.0 0.0 Sapwood Start 5.6 ± 1 33 ± 9 2 month 4.1 ± 0.8 58 ± 8 4 months 0.0 0.0 6 months 0.0 0.0
3.4 Solid state NMR
The comparative CP-MAS 13C NMR spectra of the heartwood welded interphase and of an un-welded wood control is shown in Figure 37. This figure shows the differences from which the welded substance might be indicated. The welded heartwood interphase is richer in lignin as would be expected [45]. This can be seen from the higher peaks at 56, 132 and 153 ppm which peaks agree well with previous investigations [25, 53, and 54]. However, the small peak variations in the 10-50 ppm range correspond to those generated by the new
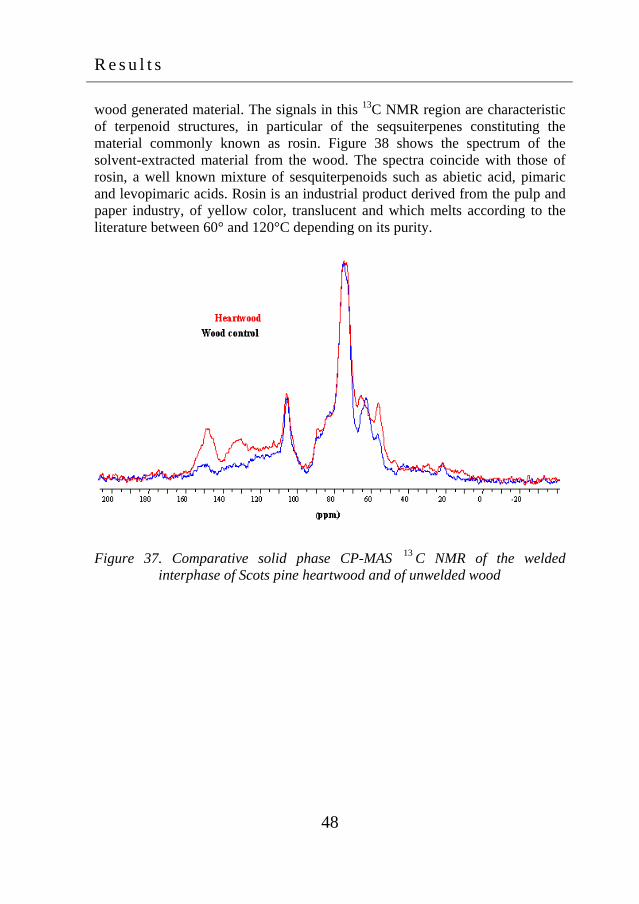
R e s u l t s
48
wood generated material. The signals in this 13C NMR region are characteristic of terpenoid structures, in particular of the seqsuiterpenes constituting the material commonly known as rosin. Figure 38 shows the spectrum of the solvent-extracted material from the wood. The spectra coincide with those of rosin, a well known mixture of sesquiterpenoids such as abietic acid, pimaric and levopimaric acids. Rosin is an industrial product derived from the pulp and paper industry, of yellow color, translucent and which melts according to the literature between 60° and 120°C depending on its purity.
Figure 37. Comparative solid phase CP-MAS 13 C NMR of the welded
interphase of Scots pine heartwood and of unwelded wood

R e s u l t s
49
Figure 38. CP-MAS 13 C NMR of the rosin extracted from the welded interphase
of Scots pine heartwood
3.5 X-ray microdensitometry
X-ray microdensitometry maps showed that a pale yellow substance originating from the timber itself melted during friction welding. This substance moved from up to a couple of millimeters from the weldline and surrounded it. This phenomena is more apparent with sapwood perhaps as the greater permeability of sapwood allows greater movement of this molten material giving a weldline peak which is very wide (Figure 39). According to CP-MAS 13 C NMR results this substance contains a small proportion of a native mixture of terpenoic acids known under the collective name of rosin which yields joints of a high grade of water resistance. This has been shown to be due to the protective influence the molten rosin from the wood itself exerts on the welded interphase as rosin repels water. Joints exhibiting unusually high percentage wood failure were

R e s u l t s
50
obtained; rosin apparently reinforcing the welded interphase to yield weldline strengths which are always much higher than that of the surrounding wood.
Figure 39. Example of X-ray microdensitometry density map of a welded Scots
pine joint.
3.6 Tensile-shear strength optimization
The tensile-shear strength of welded sample in the best welding conditions (1.3 MPa welding pressure, 2.8 s welding time, and 70 s holding time) was about twice that of PVAc-glued samples and showed 100% wood failure in all cases (Table 10 and Figure 40). Table 10. Comparison of average tensile-shear strength of welded specimens
(average of ten measurements) with average tensile-shear strength of PVAc-glued joints (average of seven measurements).
Glued joint Welded joints After 6 h After 12 h After 24 h
Tensile-shear strength (MPa) 9.3 5.30 5.30 5.45 Standard deviation (%) 5 3 3 3

R e s u l t s
51
0
0,5
1
1,5
2
2,5
0 1 2 3 4 5 6 7 8
Displacement (mm)
Load
(kN
)
Glued- After 6 h Glued- After 12 h
Glued- After 24 h 0.75 MPa 3.5 s 60 s
1.8 MPa 3.5 s 60 s 0.75 MPa 2 s 80 s
1.3 MPa 3.5 s 70 s 1.3 MPa 2.8 s 70s
Figure 40. Load versus displacement in tensile-shear strength test on welded and PVAc-glued samples. Varying parameters were welding pressure, welding time, and holding time each at three levels. Welding pressures were 0.75, 1.3, and 1.8 MPa, welding times were 2, 28, and 3.5 s, and holding times were 60, 70, and 80 s. Tensile-shear strength of glued samples are shown in dotted circle. According to data evaluation tensile-shear strength could be optimized to 9.7 MPa by increasing the welding time to 3.5 s and decreasing holding time to 60 s. These results indicate that welding of Scots pine can produce joints of excellent tensile-shear strength which is of major importance with regard to welding of multi-layered wood laminates.

D i s c u s s i o n
52
4. Discussion The results showed that welding machine setting and wood properties have a significant influence on water resistance and mechanical performance of these welded Scots pine samples. Changing these parameters can improve the water and mechanical resistance of the welded Scots pine samples to some extent. The best parameter combination which led to the highest water resistance was using heartwood, high welding pressure, and short welding time (1.3 welding pressure, 1.5 welding time). Samples welded using these parameters after almost 2 months water exposure showed only a small crack in the beginning of the weldline and the least water absorption in the weldline.
4.1 Welding pressure
The welding process is governed by heat generated from frictional movement in the welded area. Stamm [35] showed that heat generation by frictional energy is required for the alteration of the solid wood in the interphase into a “molten” state to make a bond. A certain temperature is necessary to reach the “melting” state. The welding pressure has a great influence on the welding time. An increase in welding pressure leads to an increase in the shear stress and frictional power: therefore, it may be deduced that the welding time is reduced as welding pressure is increased. The combination of factors which leads to the most water resistance yields the heat necessary to make a completed joint. Welding pressure has more influence on heat generation in the interphase than welding time. Hence, for similar welding times one sample, welded with higher pressure, reaches a satisfactory weld while another sample, welded with lower pressure, barely reaches the decomposition stage. The higher the pressure is, the more regular and homogeneous the welding process is and, therefore, chemical and mechanical connections created during the different phases of welding time are stronger. When welding pressure is increased, the frictional force and the amount of energy supplied to the interphase are increased. If welding pressure is not high enough a good quality welded joint will not result and a welding pressure deficit is not compensated by an extension of welding time.

D i s c u s s i o n
53
4.2 Welding time
The tensile-shear strength test showed that a welding time of 2.8 s can yields joints with remarkable tensile-shear strength. This contradicts the assumption in paper (I) where we assumed that the welding process reaches its steady state phase or maximum temperature at 1.5 s, but this study showed that this happens after 2.5 s. These examinations reveal that adhesion in a welded joint of Scots pine is a function of time and passes through various characteristic phases as shown in Figure 41.
Figure 41. Tensile-shear strength as a function of welding time. Since the whole welding process is governed by heat generation in the interphase this graph may be a function of heat progression in the weldline (Figure 9). Microdensitometry of welded Scots pine showed that a pale yellow substance originating from the timber itself surrounds the weldline. Solid state MRI tests showed that this pale substance is the material commonly known as rosin, a mixture of sesquiterpenoids such as abietic acid, pimaric and levopimaric acids that might well be involved in the effect. Rosin apparently reinforces the welded

D i s c u s s i o n
54
interphase to yield weldline strengths always much higher than the strength of the surrounding wood. It seems that the main cause of adhesion in welded Scots pine is fusion of wood lignin and rosin and interlocking of wood fibers that are locked in a cured matrix of molten rosin and cell-interconnecting materials. Relatively short holding time and long welding time gives the best mechanical strength of welded Scots pine joint. The high strength and exceptionally high wood failure of welded Scots pine thus indicate that the measured strength at failure is that of the timber: The strength of the welded joint is higher than the shear-strength of the solid wood.
4.3 Heartwood/sapwood and water absorption in the weldline
The combination of factors 1.3 MPa welding pressure, 1.5 s welding time, and heartwood led to minimum water absorption in the weldline. Heartwood is nearly always much less permeable to water than sapwood due to obstruction by extractives [55]. Heartwood in Scots pine has two to three times more extractives than sapwood and, these extractives are more evenly distributed in the wood tissue in heartwood [56]. Heartwood has long been known to contain a greater percentage of extractives than sapwood, especially terpenoid acids and tannins, which explains its superior water resistance. As tannins have been shown in early wood welding research not to contribute much to strength [29] this is the first indication that terpenes or terpenoids might well be involved in this effect. Heartwood generally contained less cellulose and more lignin than sapwood [57]. Lignin contributes to the strength of the bondline, on one hand, by fusion and interlocking of wood fibers and, on the other hand, by cross-linking with carbohydrates-derived furfural. In addition to the above mentioned factors, one other reason for reduced water absorption in this factor combination may be chemical changes which happen in wood cell structure. Wood cell wall is a composite material made of cellulose micro-fibrils embedded in a water reactive matrix of hemicelluloses and lignin [58]. Ability of the matrix to adsorb water is thus of critical importance in the swelling of wood. It is known that heat treatments reduce wood hygroscopicity

D i s c u s s i o n
55
by modifying this water reactive matrix in various ways [59, 60]. The reduction of wood hygroscopicity follows an Arrhenius relation as a function of the time-temperature combination [61]. The effect of long time exposure at low temperatures seems to be equivalent to short times exposure at high temperatures. Therefore, the chemical changes taking place in wood welding are to some extent comparable to heat treatment at short time exposure to the high temperature. It seems that this parameter combination (1.3 MPa welding pressure, 1.5 s welding time, and heartwood) is the only one that can produce sufficient temperature to obtain a strong welded joint. Hemicelluloses are the constituents of wood that are most thermally sensitive: destruction of hemicelluloses is accompanied by the disappearance of water adsorption sites (mainly hydroxyl groups) which induces a reduction of wood swelling. [62]. In addition, it has been shown that some cross-linking and condensation phenomena also take place in lignin during wood welding [63, 42, 44]. As a consequence, the ability of lignin to adsorb water is decreased. Reduction of lignin hygroscopicity thus takes part in the reduction of water absorption. Compared to welded beech that can not withstand cold water immersion for more than 30 min, welded Scots pine could withstand cold water immersion for more than 455 days without falling apart. Heartwood of Scots pine showed higher water resistance than did sapwood. Welded heartwood samples of Scots pine after 210 days of cold water immersion still showed a 4.1± 0.5 MPa tensile shear strength and after 4 months of exterior exposure still retained half of their initial tensile-shear strength.
4.4 Weldline density
The results showed no definite relation between weldline density and water resistance. The densification degree of the weldline varied between 164-190 % of the untreated wood density and degrees of densification for sapwood specimens were higher than for heartwood specimens. This is in accordance with the findings of many other researchers such as Trenard [64], Blomberg and Persson [65] found that heartwood of Scots pine becomes less compressed than sapwood, presumably as the effect of the higher resin content in heartwood. Extractives are incompressible, as are most liquids, and this will decrease the degree of compression because extractives are located inside the cell wall cavities and cannot move. Extractives also act as bulking agents within the cell wall [66]. Dinwoodie and Desch [67] concluded that there is no difference in wood density or strength properties between sapwood and heartwood when these woods are compared at the same moisture content.

C o n c l u s i o n s
56
4.5 Origin of crack formation in Scots pine and beech
MRI experiments showed that the weldline of the beech sample had poor water resistance and after a short time water penetrated the weldline. However, in the welded pine specimen, very little water was absorbed by the welded area, but swelling of the wood pieces was the main reason for crack formation and propagation in the weldline. Scots pine is one of the species with high extractives content of up to 15% of its dry weight [45]. Extractive compounds such as resin, aromatic and organic compounds (fats, waxes, fatty acids, and alcohols) may exhibit lower affinity to water and a strongly decreased water absorption in welded pine. X-ray microdensitometry and CP-MAS
13C NMR results showed that in
welded Scots pine a pale of terpenoic acids, known under the collective name of rosin, melt and surround the weldline which yields joints of greatly increased water resistance.
5. Conclusions The results of this study can contribute to the technological developments of applications of linear wood welding.
CT- scanning can accurately determine the length and location of the crack and can also be successfully used for wood welding studies.
MRI images can be used for the study and visualization of water
distribution in welded woods.
Welding parameters and wood properties have a significant influence on water resistance and the tensile-shear strength of welded Scots pine.
Welded pine shows higher water resistance than welded beech; this may
be explained by there being more extractives compounds in Scots pine.
The tensile-shear strength of the Scots pine joints formed by welding in 2.8 seconds is twice that obtained 24 hours after gluing. This result is of major importance with regard to welding of multi-layered wood laminates. Such a rapid achievement of high tensile-shear strength allows continuous welding of several layers of wood with very short welding cycles, and without affecting the joints already completed.

F u t u r e w o r k
57
The optimization test showed that the tensile-shear strength of Scots pine was more sensitive to welding time changes than to holding time. This tensile-shear strength could be optimized at more than 9.7 MPa with a welding pressure of 1.3 MPa, a welding time of > 3.5 s, and a holding time of < 60 s. Since heartwoods contain a greater percentage of extractives than sapwood, greater tensile-shear strength is expected from Scots pine heartwood.
Extractives in Scots pine dramatically improve the water resistance of
the welded joint, but not to a level so that the joint may be classified as an unprotected exterior grade. However, it may qualify as a joint for protected semi-exterior application.
This investigation was only carried out for Scots pine. Other species of
wood might well show other behaviours.
6. Future work
The water resistance and mechanical strength of welded Scots pine, compared to the other studied species, is high. However, it can not definitely be concluded that welded Scots pine is suitable for outdoor use. Further test on this timber need to be carried out before this type of application can be found to be suitable.
Data evaluation showed that tensile-shear strength could be optimized
at more than 9.7 MPa with a welding pressure of 1.3 MPa, a welding time of > 3.5 s, and a holding time of < 60 s. Further experiments need to be carried out with a welding pressure of 1.3 MPa, a welding time of 3.5 s, and a holding time of 60s as center point of a CCD design.
The use of some natural additives to improve the water resistance of
this product is also recommended as a subject for future research.
Welded joints show higher stiffness and elasticity modulus than the glued joints. Overall they are less elastic than the glued joints; that is a drawback in their application. There still remains study to understand what phenomena are responsible.
For relative large dimension samples, welded joints behave very far
from the glued bonds and they easily fail. Further studies are required so that their performance fulfills the various environmental constraints.

R e f e r e n c e s
58
Investigations that aim to define the technical and financial capabilities of this type of assembly in the context of industrial implementation are needed. Welding of long lengths which are primarily subjected to technical problems, welding machine capacity; and integration of this technology in a production line need more investigation.

R e f e r e n c e s
59
7. References
1. B. Stamm, Development of Friction Welding of Wood – Physical, Mechanical and Chemical Studies. PhD thesis, Ecole Fédérale de Lausanne, Switzerland (2006).
2. A. Pizzi, J-M. Leban, F. Kanazawa, M. Properzi and F. Pichelin, Wood dowel bonding by high speed rotation welding. J. Adhesion Sci. Technol. 18, 1263-1278 (2004).
3. C. Ganne-Chedeville, A. Pizzi, A. Thomas, J-F. Leban, J-F. Bocquet, A. Despres and H. R. Mansouri, Parameter interactions in two-block welding and the wood nail concept in wood dowel welding. J. Adhesion Sci. Technol. 19, 1157-1174 (2005).
4. A. Pizzi, A. Despres, H. R. Mansouri, J-M. Leban and S. Rigolet, Wood joints
by through-dowel rotation welding Microstructure, 13
C NMR and water resistance, J. Adhesion Sci. Technol. 20, 427-436 (2006).
5. P. Omrani, J.-F. Bocquet, A. Pizzi, J-M. Leba and H. R. Mansouri, Zig-zag rotational dowel welding for exterior wood joints, J. Adhesion Sci. Technol. 21, 923-933 (2007).
6. P. Omrani, H. R. Mansouri and A. Pizzi, Water exposure durability of welded dowel joints, Holz. Roh. Werkstoff. 66, 161-162 (2008).
7. H. R. Mansouri, P. Omrani and A. Pizzi, J. Adhesion Sci. Technol. 17, 23-63 (2008).
8. O. Lindgren, The accuracy of medical CAT-scan images for non-destructive density measurements in small volume elements within solid woods, Wood Sci. Technol. 25, 425-432 (1991).
9. O. Lindgren, J. Davis, P. Wells and P. Shadbolt, Non-destructive wood density distribution measurements using computed tomography, Holz Roh Werkst. 50, 295-299 (1992).
10. R. Sharp, M. T. Rigging, R. Kaiser and M. H. Schneider, Determination of moisture content of wood by pulsed nuclear magnetic resonance, Wood Fiber Sci. 10, 74–81 (1978).
11. J. H. van. Houts, S. Wang, H. Shi, H. Pan and G. W. Kabalka, Moisture movement and thickness swelling in oriented strandboard, part 1. Analysis using nuclear magnetic resonance microimaging, Wood Sci Technol. 38, 617–628 (2004)
12. G. Almeida, S. Gagne and R. E. Hernandez, Study of water distribution in hardwoods at several equilibrium moisture contents Wood Sci. Technol. 41, 293–307 (2007).
13. P. C. Wang and S. J. Chang, Nuclear magnetic resonance imaging of wood, Wood Fiber Sci. 18, 308–314 (1986).
14. S. J. Chang, J. R. Olson and P. C. Wang, NMR imaging of internal features in wood, Forest Prod. J. 39, 43–49 (1989).
15. B. E. Dawson-Andoh, J. M. Halloin, T. G. Cooper, D. P. Kamdem and E. J. Potchen, Magnetic resonance imaging as a potential tool in the study of wood

R e f e r e n c e s
60
penetration by water-borne preservative systems. Wood Fiber Sci. 33, 84–89 (2001).
16. M. B. MacMillan, M. H. Schneider, A. R. Sharp and B. J. Balcom, Magnetic resonance imaging of water concentration in low moisture content wood. Wood Fiber Sci. 34, 276–286 (2002)
17. J. R. Olson, S. J. Chang and P. C. Wang, Nuclear magnetic resonance imaging: a non-invasive analysis of moisture distributions in white oak lumber, J. Forest Res. 20, 586–591 (1990)
18. U. Muller, R. Bammer and A. Teischinger, Detection of incipient fungal attack in wood using magnetic resonance parameter mapping, Holzforschung. 56, 529–534 (2002)
19. O. Lindgren and G. Orädd, First observations using magnetic resonance imaging (MRI) for non-destructive glue line water durability investigations, Proceedings Fifth International Conference on Image Processing and Scanning of Wood, Bad Walterdorf, Austria (2003).
20. M. H. Levitt, Spin Dynamics: Basics of Nuclear Magnetic Resonance, Wiley, Chichester, UK (2001).
21. B. Sutthoff, U. Franz, H. Hentschel, A. Schaaf, Verfahren zum reibschweissartigen Fügen und Verbinden von Holz. Patent DE 19620273 C2. Deutsches Patent- und Markenamt (1996).
22. B. Sutthoff; H-J. Kutzer, Offenlegungsschrift DE 197 46 782 A 1. Deutsches Patent und Markenamt (1997).
23. B. Gfeller, A. Pizzi, M. Zanetti, M. Properzi, F. Pichelin, M. Lehmann and L. Delmotte, Solid wood joints by in situ welding of structural wood constituents, Holzforschung. 58, 45–52 (2004).
24. G. Tondi, S. Andrews, A. Pizzi and J-M. Leban, Comparative potential of alternative wood welding systems, and microfriction stir welding, J. Adhesion Sci. Technol. 21, 1633–1643 (2007).
25. B. Gfeller, M. Properzi, M. Zanetti, A. Pizzi, F. Pichelin, M. Lehmann, L. Delmot, J Appl Polym Sci. 92, 243–251 (2004).
26. A. Harms, Studies of the Possibilities of Manufacturing of Wood-Wood Connections by means of Appropriate Welding Technology. Final Report SNSF Research Report EPFL-IBOIS (2004)
27. ÖNORM B 3013. N Fensterkantel aus Holz - Anforderungen und Prüfbestimmungen (1993).
28. VDI 3958: Environmental simulation - Effects of acidic precipitation on polymers - Test methods (2004).
29. S. Wieland, Bozhang Shi, A. Pizzi, M. Properzi, M. Stampanoni, R. Abela, Xiaoning Lu and F. Pichelin, Vibration welding of wood: X-ray tomography, additives, radical concentration, Forest Prod. J. 55, 84-87 (2005).
30. M. Boonstra, A. Pizzi, C. Ganne-Chedeville, M. Properzi, J. M. Leban and F. Pichelin, Vibration welding of heat-treated wood, J. Adhesion Sci. Technol. 20, 20359–369 (2006)
31. C. Ganne-Chedeville, PhD thesis. Soudage linéaire du bois étude et compréhension des modifications physico-chimiques et développement d’une

R e f e r e n c e s
61
technologie d’assemblage innovante, Université Henri Poincaré - Nancy (2008).
32. European Standard EN 205. Adhesive – wood adhesives for non-structural applications. Determination of tensile-shear strength of lap joints (2003).
33. D. Jones and A. Pizzi, Frictional Welding of Dowels into Modified Wood. Cost Action E34 Workshop in Slovenia on Bonding of Modified Wood. (2009).
34. B. Stamm, J. Natterer and P. Navi, Thermal behaviour of polysaccharides in wood during friction welding, Holzforschung. 63, 313-320 (2005)
35. M. Properzi, J-M. Leban, A. Pizzi, S. Wieland, F. Pichelin and M. Lehmann, Influence of grain direction in vibrational wood welding, Holzforschung. 59, 23–27 (2005).
36. D. Renaud, Minimalist Z chair assembly by rotational dowel welding, Holz Roh Werkst. 67, 111-112 (2008).
37. C. Ageorges., L. Ye and M. Hou, Advances in fusion bonding techniques for joining thermoplastic matrix composites: a review, Composites. 32, 839-857 (2001).
38. J-M. Leban, A. Pizzi, S. Wieland, M. Zanetti, M. Properzi and F. Pichelin. J Adhesion Sci. Technol. 18, 673–685 (2004)
39. H. C. Wikle, R. H. Kottilingam, R. H. Zee and B. A. Chin, Infrared sensing techniques for penetration depth control of the submerged arc welding process, J. Mater. Process. Technol. 113, 228–233 (2007).
40. A. Shafizadeh, Pyrolytic Reactions and Products of Biomass. In Fundamentals of Thermo-chemical Biomass Conversion, R.P, Overand, T.A. Milne, T.A. and L.K. Mudge (Eds.). Elsevier London (1985).
41. C. A. Coulomb, Théorie des Machines Simples, en Ayant égard au Frottement dé Leurs Parties, et à la Roideur des Cordages. Mémoires de Mathématique et de Physique de l'Académie des Sciences 161–342 (1785)
42. B. Gfeller, M. Lehmann, M. Properzi, F. Pichelin, M. Zanetti, A. Pizzi and L. Delmotte, Interior wood joints by mechanical fusion welding of wood surfaces, Forest Prod. J. 54, 72-79 (2004).
43. M. Lopretti, D. Cabella, J. Morais and A. Rodrigues, Demethoxylation of lignin-model compounds with enzyme extracts from Gloeophilum trabeum, Process Biochemistry. 33, 657-661(1998).
44. D. Fengel and G. Wegener, Wood: Chemistry, Ultrastructure. Reactions. Walther de Ciruyter, Berlin, Germany (1989).
45. B. Stamm, E.Windeisen, J. Natterer and G.Wegener, Thermal behaviour of polysaccharides in wood during friction welding, Holzforschung. 63, 388–389 (2005)
46. M. Vaziri, O. Lindgren and A. Pizzi, Influence of Machine Setting and Wood Parameters on Crack Formation in Scots pine Joints Produced by Linear Welding, Forest Product Journal, accepted (2010).
47. G. T. Herman, Image Reconstruction from Projection-The Fundamentals of Computerized tomography. Academic Press, NY 1980
R e f e r e n c e s
62
48. O. Lindgren, The accuracy of medical CAT-scan images for non-destructive density measurements in small volume elements within solid wood, Wood Sci. Technol. 25, 425-432 (1991)
49. European Standard EN 302-1. Adhesives for load-bearing timber structures (2004).
50. D. C. Montgomery, Design and Analysis of Experiments. John Wiley (2005). 51. www.minitab.com 52. H. R. Mansouri, P. Omrani and A. Pizzi, Improving the water resistance of
linear vibration-welded wood joints, J.Adhesion Sci. Technol. 23, 63-70 (2009) 53. L. Delmotte, C. Ganne-Chedeville, J-M. Leban, A. Pizzi and F. Pichelin, CP-
MAS 13
C NMR and FT-IR investigation of the degradation reactions of polymer constituents in wood welding, Polymer Degrad. & Stabil. 93, 406-412 (2008)
54. L. Delmotte, H. R. Mansouri, P. Omrani and A. Pizzi, Influence of wood welding frequency on wood constituents’ chemical modifications, J.Adhesion Sci. Technol. 23, 1271-1279 (2009).
55. J. F. Siau, Transport Processes in Wood, Berlin: Springer- Verlag (1984). 56. A. L. Back and L. H. Allen, Pitch Control, Wood Resin and Deresination,
Tappi, Atlanta (2000). 57. J. M. Dinwoodie, Timber: Its Nature and Behaviour, E & FN Spon, London
and New York (2000). 58. N. F. Barber, A theoretical model of shrinking wood, Holzforshung. 22:97-103.
(1968) 59. E. Obataya, F. Tanaka, M. Norimoto and B. Tomita, Hygroscopicity of heat-
treated wood I: effects of after treatments on the hygroscopicity of heat-treated wood, Mokuzai gakkaishi. 46, 77-87. (2000).
60. E. Obataya, T. Higashihara and B. Tomita, Hygroscopicity of heat-treated wood III: Effect of steaming on the hygroscopicity of wood, Mokuzai gakkaishi. 48, 348-355 (2002).
61. C. Skaar, Wood–Water Relations. Springer-verlag. Berlin (1988). 62. V. Repellin, R. Guyonnet, Evaluation of heat treated wood swelling by
differential scanning calorimetry in relation with chemical composition, Holzforschung. 59, 28-34(2005).
63. J. Weiland, Etude physico-chimique du traitement thermique du bois. Optimisation de paramètres du procédé de rétification. Ph-D Thesis, Ecole des Mines de Saint Etienne, Saint Etienne, France (2000).
64. Y. Trenard, Study of the isostatic compressibility of some timbers, Holzforschung. 31, 166–171(1977).
65. J. Blomberg and B. Persson, Plastic deformation in small clear pieces of Scots pine (Pinus sylvestris L.) during densification with the CaLignum process, J Wood Sci. 50, 307–314 (2004).
66. M-L. Kuo and D. G. Arganbright, Cellular distribution of extractives in redwood and incense cedar, Holzforschung. 34, 41–47(1980).
67. J. M. Dinwoodie and H. E. Desch, Timber: Structure, Properties, Conversion and Use, 7th edn. Macmillan, London (1996).

Paper I
M. Vaziri, O. Lindgren, A. Pizzi and H. R. Mansouri, Moisture sensitivity of Scots pine joints produced by linear frictional welding. J. Adhesion Sci. Technol. 24, 1515 -1527 (2010).


Journal of Adhesion Science and Technology 24 (2010) 1515–1527brill.nl/jast
Moisture Sensitivity of Scots Pine Joints Produced by LinearFrictional Welding
Mojgan Vaziri a,∗, Owe Lindgren a, Antonio Pizzi b and Hamid Reza Mansouri b
a Department of Wood Science and Technology, Luleå University of Technology, Forskargatan 1,931 87 Skellefteå, Sweden
b ENSTIB-LERMAB, Université Henri Poincaré — Nancy 1 27 Rue du Merle Blanc, BP 1041,88051 EPINAL Cedex 9, France
AbstractThe industrial application range of welded wood so far has been limited to interior use because of its poormoisture resistance. Influences of some welding and wood parameters such as welding pressure, weld-ing time, and heartwood/sapwood on water resistance of Scots pine (Pinus sylvestris) were investigated.An X-ray Computed Tomography scanner was used to monitor density change in weldlines during waterabsorption–desorption. Axial samples measuring 200 mm × 20 mm × 20 mm from Scots pine were weldedand placed standing in 5-mm-deep tap water. Then they were taken out of the water one at a time and scannedat 10-min intervals until the first crack appeared in the weldline where the two parts of each specimen madeconnection.Results showed that the X-ray Computed Tomography can be used as an effective tool to study weldedwood. Welding pressure, welding time, and heartwood/sapwood showed significant effect on length andlocation of the crack in the welded zone. Data evaluation showed that combination of 1.3 MPa weldingpressure, 1.5 s welding time and using heartwood led to highest moisture resistance, which produced only avery short crack in the beginning of the weldline.© Koninklijke Brill NV, Leiden, 2010
KeywordsLinear welding, tomography, water resistance, welding conditions
1. Introduction
One disadvantage of welded wood produced by linear welding is its sensitivity tomoisture. Therefore, its application is limited mainly for interior use. Moisture leadsto splitting of the bondline and makes it unsuitable for structural use in spite of itshigh dry strength [1].
The initial objective of this study was to demonstrate how X-ray Computed To-mography (CT-) scanning and image processing could also be successfully used for
* To whom correspondence should be addressed. Tel.: +46910 58 57 04; Fax: +46910 58 53 99; e-mail:[email protected]
© Koninklijke Brill NV, Leiden, 2010 DOI:10.1163/016942410X501098

1516 M. Vaziri et al. / Journal of Adhesion Science and Technology 24 (2010) 1515–1527
wood welding research. Secondly to weld and study a new species (Scots pine) andthirdly to investigate the machine settings and material parameters that led to lesswater damage (shorter cracks) in the welded zone. The final objective was to see ifwelding factors had any significant effect on the location of crack in the weldline.
According to shear tensile tests on Norway spruce (Picea abies) and beech (Fa-gus sylvatica), an increase of normal pressure and welding frequency led to areduction of the welding time and coefficient of friction [2]. Water resistance test onbeech (Fagus sylvatica) immersed in cold water (15◦C) showed that short displace-ment (2 mm), high vibration frequency (150 Hz), and short welding time (1.5 s)increased the resistance of the linear welded joints [1]. The investigation on weldingof wood components showed that edge-to-edge welding of particleboard, orientedstrand board (OSB), medium density fibreboard (MDF), and plywood gave betterstrength than face-to-face panel welding. In general, the edge-to-edge weldline wasslightly weaker than the panel itself [3].
To date, investigations on water resistance of welded woods have mainly car-ried out using water immersion method. However, classical water immersion is notpractical for investigation of changes that occur within the welded joint during ab-sorption and desorption in outdoor conditions. Recently, there has been an increas-ing interest in non-destructive methods like X-ray Computer Tomography (CT-)scanning which can overcome such limitations. CT-scanning offers a non-contact,non-destructive, and 3-D measurement method. The measured X-ray absorption isvery dependent on wood density and moisture changes with known time intervalsare accurately measured [4]. The results of this research are based on investigationson test pieces of Scots pine (Pinus sylvestris) as one of the most used wood speciesfor which welding process has not been investigated so far.
2. Materials and Methods
2.1. Wood Welding
The mechanical welding machine used was a Mecasonic linear vibration weldingmachine made in France, type LVW 2061, with vibration frequency up to 260 Hz,normally used to weld plastics. 40 samples of dimensions 200 mm × 20 mm ×20 mm were cut from heartwood and sapwood of Scots pine in longitudinal direc-tion of wood grain. They were welded together two at a time to form a bonded jointof 200 mm × 20 mm × 40 mm by linear vibration. A certain range of welding ma-chine’s settings was used and some parameters such as welding pressure, weldingtime, and heartwood/sapwood were selected as design factors for evaluation in thisstudy (Table 1).
Wood samples are inhomogeneous and to minimize the variability we randomlychose the samples and ignored sample to sample variability.
According to theoretical understanding and practical experience based on previ-ous experiments, two pressure levels of 0.75 and 1.3 MPa and two welding times of1.5 and 2.5 s were chosen for evaluation.

M. Vaziri et al. / Journal of Adhesion Science and Technology 24 (2010) 1515–1527 1517
Table 1.Parameters used for welding machine’s setting
Parameter Unit Value
Welding pressure (WP) (MPa) 1.3 0.75Welding time (WT) (s) 1.5 2.5Welding displacement (WD) (mm) 2Frequency (Hz) 150Holding pressure (HP)∗ (MPa) 2.75Holding time (HT)∗∗ (s) 50Equilibrium moisture content (EMC) (%) 12
* The clamping pressure exerted on the surface of the specimenafter the welding vibration had stopped.
** The pressure holding time maintained after the welding vibra-tion had stopped.
2.2. Water Absorption
Test objects were conditioned in the laboratory, at ambient conditions for 30 daysbefore scanning. Moisture content of the specimens was determined by 10 addi-tional samples. These samples were regarded as representative of the specimensas a whole. Therefore, not every specimen was tested individually with regard tomoisture content. The average moisture content of the samples was 5%. Condi-tioned samples were scanned by a CT-scanner and one CT image was taken foreach sample as shown in Fig. 1(a). Then the samples were placed with butt ends ina basin on bars of stainless steel in 5-mm-deep tap water for water absorption.
2.3. CT-Scanning and Image Processing
A SIEMENS Emotion Duo medical X-ray CT-scanner was used and scanning wascarried out at ambient conditions, relative humidity (RH) 65% and temperature22◦C, according to scanner settings in Table 2. To create an environment with vary-ing humidity like in exterior use, the test objects were transferred from water basinto CT-scanner for each scanning as shown in Fig. 2. Therefore, samples lost somewater during scanning and transport. Each sample was scanned for equal intervalsof 10-min according to a time schedule until the first crack appeared in the weldlineas shown in Fig. 1(b).
With the assistance of image-processing software (Image J) from the NationalInstitutes of Health (NIH) X-ray absorption was measured as a profile which isshown in Fig. 3 in an area along the weldline (Fig. 4).
3. Results
Data for length and location of first cracks in the welded zone, irrespective of whenthey appeared, were analyzed by means of the statistical software Minitab.

1518 M. Vaziri et al. / Journal of Adhesion Science and Technology 24 (2010) 1515–1527
Figure 1. One observation (sapwood welded by 0.75 MPa welding pressure and 1.5 s welding time)was chosen to show two examples of CT-images before and after water absorption. (a) CT-imagebefore water absorption. (b) CT-image after water absorption. A crack appeared as a black streak inthe weldline after water absorption for 7 h.
Table 2.Parameters used for CT-scanner’s setting
Parameter Unit Value
Voltage kV 110Current mA 70Scan time s 2Scan thickness mm 5Matrix Pixels 512∗512Resolution Pixels/mm 2.3
* Program and algorithm used in scanning were BodyPCT Sequence and Algorithm, respectively.
All the three evaluated factors had significant effect on the length and location ofthe crack with 95% confidence interval. Graphs of the average responses for eachfactors combination are shown in Figs 5 and 6. The best combination of factorswhich led to only a very short crack in the beginning of the weldline is shown asa CT-image in Fig. 7 and a CT-number profile in Fig. 8. Low welding pressure(0.75 MPa), short welding time (1.5 s), and using sapwood showed the longest

M. Vaziri et al. / Journal of Adhesion Science and Technology 24 (2010) 1515–1527 1519
Figure 2. CT-scanner and scanning of a sample taken out of the water.
Figure 3. Gray value profile. CT data for each pixel in the longitudinal cross section of the weldlinewere measured in a gray-scale value between 0–255. Negative gray value indicates that the X-rayabsorption is less than that of water.
crack in the middle of weldline as shown in Fig. 1(b). This can also be seen indotted circle in Fig. 9.
This investigation involved several parameters and it was necessary to study thejoint effect of parameters on response so a factorial design was considered. An ex-periment based on a 23 full factorial design and 5 replicates was performed with
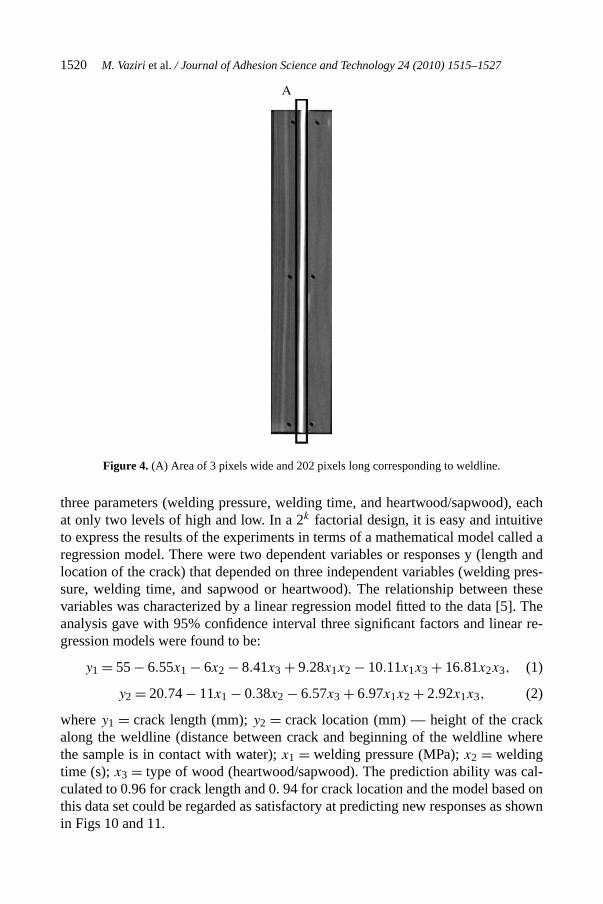
1520 M. Vaziri et al. / Journal of Adhesion Science and Technology 24 (2010) 1515–1527
Figure 4. (A) Area of 3 pixels wide and 202 pixels long corresponding to weldline.
three parameters (welding pressure, welding time, and heartwood/sapwood), eachat only two levels of high and low. In a 2k factorial design, it is easy and intuitiveto express the results of the experiments in terms of a mathematical model called aregression model. There were two dependent variables or responses y (length andlocation of the crack) that depended on three independent variables (welding pres-sure, welding time, and sapwood or heartwood). The relationship between thesevariables was characterized by a linear regression model fitted to the data [5]. Theanalysis gave with 95% confidence interval three significant factors and linear re-gression models were found to be:
y1 = 55 − 6.55x1 − 6x2 − 8.41x3 + 9.28x1x2 − 10.11x1x3 + 16.81x2x3, (1)
y2 = 20.74 − 11x1 − 0.38x2 − 6.57x3 + 6.97x1x2 + 2.92x1x3, (2)
where y1 = crack length (mm); y2 = crack location (mm) — height of the crackalong the weldline (distance between crack and beginning of the weldline wherethe sample is in contact with water); x1 = welding pressure (MPa); x2 = weldingtime (s); x3 = type of wood (heartwood/sapwood). The prediction ability was cal-culated to 0.96 for crack length and 0. 94 for crack location and the model based onthis data set could be regarded as satisfactory at predicting new responses as shownin Figs 10 and 11.

M. Vaziri et al. / Journal of Adhesion Science and Technology 24 (2010) 1515–1527 1521
Figure 5. Influence of welding pressure, welding time, and heartwood/sapwood on length of crackin the weldline. 1.3 MPa welding pressure, 1.5 s welding time and using heartwood lead to a shortcrack in the weldline. However, 0.75 MPa welding pressure, 1.5 s welding time, and using sapwoodproduce a long crack in the weldline. The combinations of parameters which cause the shortest andlongest cracks are shown in dotted circles.
4. Discussion
The linear regression equation and its coefficient of determination (R2) values of0.96 and 0.94 indicate that:
(a) CT-scan images can accurately estimate length and location of crack and canalso be successfully applied in wood welding research.
(b) Welding parameters and wood properties have marked influence on the finalproperties of the welded connections such as crack length and location.
According to regression models by changing welding parameters from 0.75 MPawelding pressure, 1.5 s welding time, and sapwood to 1.3 MPa welding pressure,1.5 s welding time, and heartwood the crack length can be decreased from 92 to10 mm. Location of the crack can also be changed along the weldline from 0.5 to48.58 mm from beginning of the welded zone.
Results showed that a combination of 1.3 MPa welding pressure, 1.5 s weldingtime, and using heartwood led to shortest crack in the beginning of weldline.
There are five reasons why high welding pressure and short welding time yieldstronger bondline.

1522 M. Vaziri et al. / Journal of Adhesion Science and Technology 24 (2010) 1515–1527
Figure 6. Influence of welding pressure, welding time, and heartwood/sapwood on location of crack atdifferent heights of the weldline. 1.3 MPa welding pressure, 1.5 s welding time, and using heartwoodlead to a crack in the beginning of weldline. However, 0.75 MPa welding pressure, 1.5 s welding time,and using sapwood produce a crack in the middle of weldline. The combinations of factors whichcause crack in the beginning or middle of the weldline are shown in dotted circles.
Figure 7. CT-image of a heartwood sample welded by 1.3 MPa welding pressure and 1.5 s weldingtime as an example for length and location of crack. This parameters combination produces only ashort crack in the beginning of the weldline as shown in a dotted circle.

M. Vaziri et al. / Journal of Adhesion Science and Technology 24 (2010) 1515–1527 1523
Figure 8. CT-number versus weldline length (mm) in a sample of heartwood, welded by 1.3 MPawelding pressure and 1.5 s welding time as an example. This factors combination produces only avery short crack in the beginning of the weldline which is shown in dotted circle. Minus sign indicatesthat the X-ray absorption is less than that of water.
Figure 9. CT-number versus weldline length (mm) in a sample of sapwood welded by 0.75 MPawelding pressure and 1.5 s welding time as an example. This factors combination produces a longcrack in the middle of the weldline which is shown in dotted circle. Minus sign indicates that theX-ray absorption is less than that of water.

1524 M. Vaziri et al. / Journal of Adhesion Science and Technology 24 (2010) 1515–1527
Figure 10. Scatter plot for observed crack length versus predicted crack length (mm). Crack lengths of40 specimens were measured by image processing program (Image J). Predicted values were based onthe regression model with R2 = 0.92. Each group of multiple data points shows the measured cracklengths of five samples, welded with the same factors combination (replicates). Replication meansan independent repeat of each factors combination which enables us to first obtain an estimate ofexperimental error, and second to obtain a more precise estimate of (y) [5].
Figure 11. Scatter plot for observed crack location versus predicted crack location (mm). Crack loca-tions of 40 specimens were measured by image processing program (Image J). Predicted values werebased on the regression model with R2 = 0.94. Each group of multiple data points shows the measuredcrack locations for five samples welded with the same factors combination (replicates). Replicationmeans an independent repeat of each factors combination which enables us to first obtain an estimateof experimental error, and second to obtain a more precise estimate of (y) [5].
Stamm et al. [2] showed in different investigations that:
1. Welding process is governed by the thermal energy generated at the interfaceand there is a relation between welding pressure and welding time. An in-

M. Vaziri et al. / Journal of Adhesion Science and Technology 24 (2010) 1515–1527 1525
crease in welding pressure leads to an increase of the heat generation and adecrease of welding time consequently. Therefore, rate of welding pressure ac-tive during friction welding has a significant influence on the frictional energygeneration [3].
2. The higher the pressure is, the more regular and homogeneous the weldingprocess is and therefore, chemical and mechanical connection created duringdifferent phases of welding time is stronger [6].
3. During frictional welding softening and thermal decomposition of wood com-pounds makes a viscous layer of thermally-altered wood decomposition prod-ucts (cellulose, hemicelluloses, and lignin) as a connector between two woodenpieces. Thermal degradation of the adjacent cell structure occurs only within athin layer close to the contact zone. Increasing pressure leads to a decreasingcoefficient of friction (viscosity) and decreasing thickness of the viscous layer.The thinner is this viscous layer the stronger is the connection between twopieces of wood [6].
Two other reasons are:
4. X-ray micro-densitometry tests on welded wood samples of beech (Fagus syl-vatica) and spruce (Picea abies) showed that bondline of beech which wasnarrower than spruce joints had better mechanical performance [7].
5. Shorter welding time creates stronger welded joints. Viscous layer in contactzone contains a network of long wood cells and wood fibres in a matrix ofmolten material which then solidifies. During welding some of detached cellsin the contact zone are pushed out of the joint as excess fibre. With shorterwelding time, on the one hand, only a few fibres can be expelled and, on theother hand, no charring occurs in the welded zone. Therefore, weldline is notblack. More remaining fibres and less charring in the contact zone ensure betterconnection [8].
Combination of low pressure (0.75 MPa), short welding time (1.5 s), and us-ing sapwood showed the poorest water resistance. For wood as composite materialno melting occurs during wood welding. Nevertheless, softening combined withthermal decomposition is observed during friction welding of wood, which occursat a certain temperature limit. Massive decomposition starts if surface temperaturereaches 350–380◦C during the welding process. It is characterised by an incipientsmoke generation, a significantly darker colour of the sample, and a rampant in-crease of the coefficient of friction. The chemical reactions taking place during thisvery short period are very important for forming the joint [6]. With regard to thechemical reactions and degradation behaviour taking place during wood welding,the heat generated is very important. Apparently, a certain pressure in combina-tion with a certain welding frequency and welding time is required to generate theheat necessary for decomposition of wood and forming a joint. Combination of

1526 M. Vaziri et al. / Journal of Adhesion Science and Technology 24 (2010) 1515–1527
0.75 MPa welding pressure and 1.5 s welding time cannot generate heat required tomake a strong connection. At short welding time (1.5 s), higher welding pressure isrequired to achieve a satisfactory connection [3]. Heartwood of Scots pine showedhigher water resistance than sapwood in this study. Two basic reasons for this are:
1. Heartwood of Scots pine is more durable than sapwood because it generallycontains more extractives and absorbs less water. Heartwood is nearly alwaysmuch less permeable to water than sapwood due to pit aspiration, obstructionby extractives, and vessel tyloses (outgrowth from an adjacent ray or axialparenchyma cell through a pit cavity in a vessel wall, partially or completelyblocking the vessel lumen) [9].
Durability test on Scots pine exposure to weather in Sweden showed that sap-wood had a higher moisture uptake and a higher mass loss compared with heart-wood [10].
2. As the welded interface is exposed to heat generated due to frictional move-ment one can anticipate that its shrinkage and swelling have decreased as aconsequence of the thermal treatment. In several heat treatment methods devel-oped to modify the wood substrate using elevated temperatures (180–220◦C),moisture resistance of wood had increased and its shrinkage and swelling haddecreased.
Water absorption test on thermally modified wood showed that the differencesbetween sapwood and heartwood of Scots pine were significantly larger than Spruce[11]. Heat treatment actually increased the water absorption of pine sapwood anddecreased the water absorption of pine heartwood.
5. Conclusions and Future Work
• CT-scanning can accurately determine the length and location of the crack andcan also be successfully used for wood welding studies.
• This study shows that the welding parameters and wood properties have sig-nificant influences on crack length and location. Water resistance of weldedScots pine can be increased by setting welding machine for welding pressureof 1.3 MPa, welding time of 1.5 s, and using heartwood. Cracks created inthis parameters combination are smaller and are located at the beginning of theweldline.
• As these examinations were not extensive enough to result in a definite conclu-sion that welded Scots pine is suitable for outdoor use, the subject needs furtherresearch.
• This investigation was carried out only for Scots pine. Other species might showdifferent behaviour.

M. Vaziri et al. / Journal of Adhesion Science and Technology 24 (2010) 1515–1527 1527
Acknowledgements
This research was supported by the Luleå University of Technology (LTU) in Swe-den and ENSTIB-LERMAB, Université Henri Poincare, Epinal, France.
References
1. H. R. Mansouri, P. Omrani and A. Pizzi, J. Adhesion Sci. Technol. 17, 23–63 (2008).2. B. Stamm, J. Natterer and P. Navy, Holz Roh Werkst. 63, 313–320 (2005).3. C. Ganne-Chedeville, M. Properzi, A. Pizzi, J.-M. Leban and F. Pichelin, Holz Roh Werkst. 65,
83–85 (2006).4. O. Lindgren, Wood Sci. Technol. 25, 425–432 (1991).5. D. C. Montgomery, Design and Analysis of Experiments. Wiley (2005).6. B. Stamm, E. Windeisen, J. Natterer and G. Wegener, Holz Roh Werkst. 63, 388–389 (2005).7. J.-M. Leban, A. Pizzi, S. Wieland, M. Zanetti, M. Properzi and F. Pichelin, J. Adhesion Sci. Tech-
nol. 18, 73–685 (2004).8. B. Gfeller, A. Pizzi, M. Zanetti, M. Properzi, F. Pichelin, M. Lehmann and L. Delmotte, Holz-
forschung 58, 45–52 (2004).9. J. F. Siau, Wood: influence of moisture on physical properties, PhD Thesis, Virginia Polytechnic
Institute and State University, Department of Wood Science and Forest Products, Blacksburg, VA,USA (1995).
10. Å. Rydell, M. Bergström and T. Elowson, Holzforschung 59, 183–189 (2005).11. S. Metsä-Kortelainen, in: Proceedings of the Second European Conference on Wood Modification,
Göttingen, Germany, pp. 70–73 (2005).

Paper II
M. Vaziri, O. Lindgren and A. Pizzi, Influence of machine setting and wood parameters on crack formation in Scots pine joints produced by linear welding accepted for publication in. J. Adhesion Sci. Technol (2011).


- 1 -
Influence of machine setting and wood parameters on crack formation in Scots pine joints produced by
linear friction welding Mojgan Vaziri1 ∗, Owe Lindgren1 and Antonio Pizzi2
Department of Wood Science and Technology, Luleå University of Technology, Forskargatan 1, 931 87 Skellefteå, Sweden 2 ENSTIB-LERMAB, Université Henri Poincaré- Nancy 1, 27 rue Philippe Séguin, BP 1041, 88051 Épinal Cedex 9, France Abstract Previous investigations on linear welded woods have shown that the connections are not sufficiently resistant to water for use in outdoor conditions. Therefore, they are utilized mainly for non-structural use, with only short time exposure to varying humidity. Influences of some welding and wood parameters such as welding pressure, welding time, and heartwood or sapwood on crack formation in the weldline of Scots pine (Pinus sylvestris) were investigated. Axial samples measuring 200 mm × 20 mm × 20 mm from Scots pine were welded, placed vertically in 5-mm-deep tap water and were taken out of the water one at a time after each 10 minutes of water absorption. Then they were scanned and put back into water until the first crack appeared in the weldline. An X-ray Computer Tomography (CT-) scanner was used to monitor water movement and density change in the weldlines during water absorption-desorption. CT-scanning enabled to detect the cracks as they formed in the weldline and could be used in wood welding studies. Data evaluation showed that all the three studied parameters had significant effects on crack formation and that crack occurrence could be postponed by using heartwood samples with 1.3 MPa welding pressure, and 1.5 s welding time
Key words: linear welding, tomography, water resistance, welding parameters, crack time.
∗ To whom correspondence should be addressed. Tel: +46910 58 57 04 Fax: +46910 58 53 99 Email: [email protected]
- 2 -
1. Introduction
Wood welding is one of the recent ideas in joining wood elements without using any additional material. As this technology has its origin in the welding of plastics and metals the term “welding” is also used for wood. Welding technology for plastics and metals was invented at the end of the ninetieth century but its application to wood was shown for the first time in Germany [1, 2]. This suggested that two wooden pieces could be connected by means of either an oscillating frictional action (linear welding) or by rotating wooden dowel (dowel welding). These techniques have demonstrated to date a high-quality and environmentally-friendly wooden joint.
Under the influence of an extent of thermal energy wood and its components such as cellulose, hemicelluloses, and lignin are decomposed [3]. Cellulose is less altered; hemicelluloses are less stable under the condition of friction welding and lignin is changed to a large extent. Chemical reactions among the thermally altered wood constituents lead to the formation of a new material at the wood pieces interphases, which is responsible for joint connection.
One disadvantage of linear welding of wood that limits its application mainly to interior use is its sensitivity to moisture. Moisture variation leads to splitting of the weldline and makes it unsuitable for structural use in spite of its high dry strength [4]. Failure of wood joints under moisture variation depends, on the one hand, on the deformations developed during the swelling and shrinkage and, on the other hand, on welding joint materials properties. Shape stability of welded pieces depends on the dimensions and as well as properties of wood pieces. Vaziri et al. [5] showed that welding machine setting and wood parameters had significant effects on properties of joint materials and, consequently, on crack length and location. Following up on these previous studies on welded Scots pine, an investigation was performed. The initial objective of this study was to determine how many hours it took for the first cracks to form in the weldline after the first exposure to water (crack time). Secondly to describe a method for damage detection in welded woods, based on X-ray Computer Tomography (CT-) scanning in combination with statistical analysis. Thirdly to see if machine settings such as welding pressure or welding time and wood parameters such as sapwood or heartwood could have some influence on crack formation in the weldline and which combinations of these parameters gave higher water resistance in terms of longer crack time. A water resistance test on beech (Fagus sylvatica) immersed in cold water of 15 °C showed that a short displacement of 2 mm, a high welding pressure of 1.33 MPa, and a short welding time of 1.5 s increased the resistance of the linear welded joints [4].
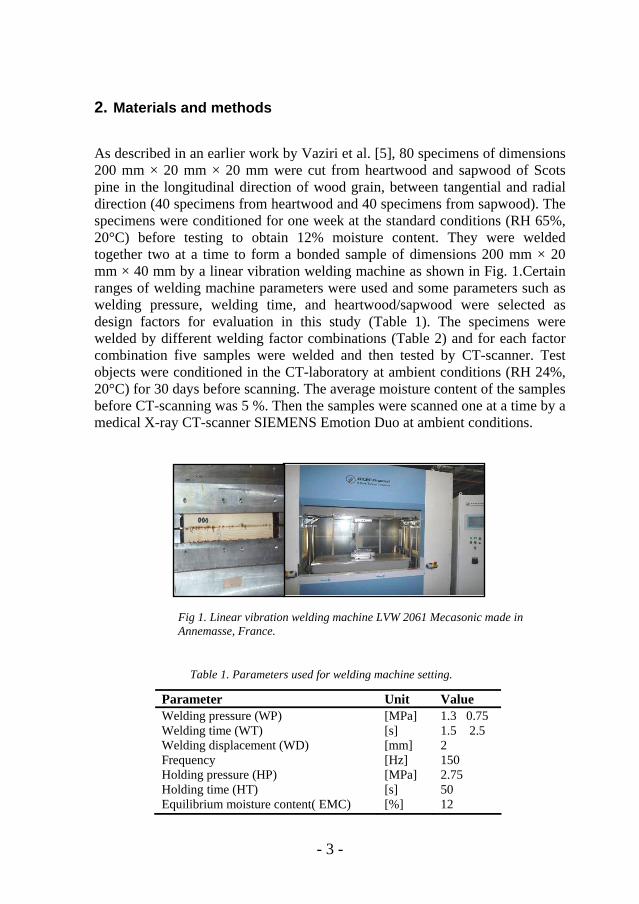
- 3 -
2. Materials and methods
As described in an earlier work by Vaziri et al. [5], 80 specimens of dimensions 200 mm × 20 mm × 20 mm were cut from heartwood and sapwood of Scots pine in the longitudinal direction of wood grain, between tangential and radial direction (40 specimens from heartwood and 40 specimens from sapwood). The specimens were conditioned for one week at the standard conditions (RH 65%, 20°C) before testing to obtain 12% moisture content. They were welded together two at a time to form a bonded sample of dimensions 200 mm × 20 mm × 40 mm by a linear vibration welding machine as shown in Fig. 1.Certain ranges of welding machine parameters were used and some parameters such as welding pressure, welding time, and heartwood/sapwood were selected as design factors for evaluation in this study (Table 1). The specimens were welded by different welding factor combinations (Table 2) and for each factor combination five samples were welded and then tested by CT-scanner. Test objects were conditioned in the CT-laboratory at ambient conditions (RH 24%, 20°C) for 30 days before scanning. The average moisture content of the samples before CT-scanning was 5 %. Then the samples were scanned one at a time by a medical X-ray CT-scanner SIEMENS Emotion Duo at ambient conditions.
Fig 1. Linear vibration welding machine LVW 2061 Mecasonic made in Annemasse, France.
Table 1. Parameters used for welding machine setting.
Parameter Unit Value Welding pressure (WP) Welding time (WT) Welding displacement (WD) Frequency Holding pressure (HP) Holding time (HT) Equilibrium moisture content( EMC)
[MPa] [s] [mm] [Hz] [MPa] [s] [%]
1.3 0.75 1.5 2.5 2 150 2.75 50 12

Table 2. Combinations of welding parameters and type of wood used in this study.
Parameters combination P T H/S P1T1H 0.75 1.5 heartwood P1T1S 0.75 1.5 sapwood P2T2H 1.3 2.5 heartwood P2T2S 1.3 2.5 sapwood P1T2H 0.75 2.5 heartwood P1T2S 0.75 2.5 sapwood P2T1H 1.3 1.5 heartwood P2T1S 1.3 1.5 sapwood
The CT images were obtained using scan settings of 110 kV, 70 mA, and scan thickness of 5 mm. For image reconstruction, a standard Shepp-Logan algorithm was used. The images were taken in 2 s scan time, 2.3 pixels/mm resolution, and were stored as 512 × 512 pixel images. The X-ray absorption was measured for each pixel along the weldline in an area of 3 × 202 mm and was shown as a gray-value profile. Fig. 2 shows the gray-value profile for one specimen. Gray-value corresponds to the attenuation coefficient of the material, which, in turn, is directly related to density and moisture content changes [6, 7]. The calculated X-ray linear attenuation coefficient (sometimes referred to as the absorption coefficient) in each small volume element (voxel) was normalized by the corresponding linear attenuation coefficient for water according to Eq. (1). This normalized value was referred to as the CT-number [6].
CT-number = 1000 ×[ μ -μ ] ÷ μ (1) x water water
where
μ = the attenuation coefficient for the tested material at an average photon energy of 73 keV.
x
- 4 -
Fig 2. Gray value versus distance (length of the specimen). X-ray absorption for each pixel in the longitudinal cross section of the weldline was measured in a gray-value.

- 5 -
Thus a CT-number of -1000 indicates an object or a voxel within the object that has the density of air. A CT-number of zero indicates a region in the slice of the object with the density of water. After CT-scanning the specimens were placed vertically in a basin on bars of stainless steel in 5-mm-deep tap water for water absorption. The samples were transferred from the water basin to the CT-scanner one at a time after each 10 minutes water exposure. Then they were returned again into the water after each scanning until the first crack appeared in the weldline. Therefore the wet parts of the samples were dried in ambient condition during scanning and transport and varying humidity like in outdoor conditions was created. Even if the first crack in sample was occurred in the interior part of the weldline and was not visible to the naked eye, it could be seen in CT-images as shown in Fig. 3. For each gray-value profile after water absorption the corresponding CT-number profile was calculated by Image J processing software. In Fig. 4 CT-number profile after water absorption is compared with the respective original CT-number profile.
The critical parameter for evaluation of the crack time was the visualization of first crack based on the CT data in diagrams like in Figure 4, which then was taken as crack.
Fig 3. Crack in the CT-image (right) was detected as a black streak in the weldline (dotted circle), whereas this was invisible in the specimen (left).

- 6 -
Fig 4. CT-numbers in dotted circle fall below the original CT-number which indicates a crack has formed in this area
3. Results
Data for crack times were analyzed by means of the statistical software Minitab. All three evaluated parameters had significant effects on crack time (p-value from ANOVA <1 at α = 0.05). Based on data evaluation a combination of welding pressure of 1.3 MPa, welding time of 1.2 s, and using heartwood gave the longest crack time (Fig. 5). Vaziri et al. [5] showed that this combination of parameters also led to the highest water resistance in the terms of short crack in the beginning of the weldline.
-300
-250
-200
-150
-100
-50
0
50
100
0 50 100 150 200 250
Length of specimen (mm)
CT-
num
ber
Before water absorption
After water absorption for 15 h

- 7 -
Fig 5. Influence of welding pressure, welding time, and heartwood or sapwood on crack time (h). Averages of 40 test results shows that 1.3 MPa welding pressure, 1.5 s welding time and using heartwood (P2T1H) give the longest crack time (489 h). However, 0.75 MPa welding pressure, 2.5 s welding time, and using sapwood (P1T2S) give the shortest crack time (4.7 h).
For estimating the factor effects, a full 23 factorial design was considered based
on coded levels of 1 and -1, with 5 replicates [8] and a linear regression equation was found as:
y = 85.5 + 48.0 x 1 - 64.0 x + 70.43 x - 56 .0 x x + 45.5 x 1 x 3 - 60.0 x x 3 - 58.7
x x x 3 (2) 2 3 1 2 2
1 2
Where
y = crack time (h)
x 1 = welding pressure, x = 1 corresponds welding pressure of 1.3 MPa, x 1 = -1 corresponds welding pressure of 0.75 MPa.
1
x = welding time, x = 1 corresponds welding time of 2.5 s, x = -1 corresponds welding time of 1.5 s.
2 2 2
x = type of wood (heartwood/sapwood), x = 1 corresponds heartwood, x = -1 corresponds sapwood.
3 3
3
The coefficient of determination (R ) was 0. 98 and the model based on this data set could be regarded as satisfactory at predicting new response (Fig.6).
2
0
50
100
150
200
250
300
350
400
450
500
Mea
n cr
ack
time
( h)
P2T1S P1T1S P2T2S P2T2H P2T1H P1T1H P1T2H P1T2S
Welding factors combinations
P1 = 0.75 MPa P2 = 1.3 MPa T1 = 1.5 s T2 = 2.5 s H = Heartwood S = Sapwood

- 8 -
500
400
300
200
100
0
Fig 6. Scatter plot for observed crack time versus predicted crack time (h). Crack times of 40 specimens were measured by CT-images and image processing program (Image J). Predicted values were based on the regression model. Each group of multiple data points shows the measured crack time for five samples welded with the same factors combination (replicates). Replication means an independent repeat of each observation
to obtain an estimate of the experimental error and a more precise estimate of ( y ) [8].
4. Discussion
The linear regression equation and its coefficient of determination (R ) value of 0.98 indicate that welding parameters and the kind of wood have marked influence on crack time. Our observations indicate that by changing welding parameters from 0.75 MPa welding pressure, 2.5 s welding time, and sapwood to 1.3 MPa welding pressure, 1.5 s welding time, and using heartwood, the crack time can be increased from 5 h to 488 h. There are several reasons why high welding pressure (1.3 MPa) and short welding time (1.5 s) yield stronger weldlines.
2
The welding process is governed by the thermal energy generated in the interphase. Thus, the progression of temperature in the contact zone is of major importance. There is a relation between welding pressure and welding time. As an increase in welding pressure leads to an increase of the shear stress and frictional power, welding pressure has a significant influence on the heat generation and weldline strength [9].
Welding pressure has more influence on heat generation in the interphase than welding time. Hence, for similar welding times one sample, welded with higher pressure, reaches a satisfactory weld while another sample, welded with lower pressure, barely reaches the decomposition stage. The higher the pressure is, the more regular and homogeneous the welding process is and, therefore, chemical
5004003002001000Predicted crack time (h)
Obs
erve
d cr
ack
tim
e (h
)
R 2 = 0.98

- 9 -
and mechanical connections created during the different phases of welding time are stronger.
This study showed that a welding time of 1.5 s increases water resistance of the welded joint. Previous studies [10] showed that a welding time of 2.8 s yields stronger weld joints than 2 s and by extending the welding time to 3.5 s could even produce optimal tensile-shear strength (9.7 MPa).
These examinations reveal that tensile-shear strength of welded Scots pine has
a non-linear correlation with welding time and passes through various characteristic phases. Since the whole welding process is governed by heat generation in the weldline.
Heartwood of Scots pine showed longer crack time than sapwood in this study. Heartwoods are less permeable to water due to pit aspiration and obstruction by extractives [11]. Heartwood of Scots pine has two to three times higher extractives than sapwood and the extractives are also more evenly distributed over the heartwood [12].
The durability of 566 Scots pine (Pinus sylvestris) samples was tested during a period of 9 years of exposure to weather in Sweden [13]. The weight was measured on 67 occasions during 9 years in order to assess the moisture content of the samples. The average MC for untreated heartwood was as low as 15.0%, compared to an average MC of 25.4% for untreated sapwood. Even if sapwood was painted with an impermeable paint and then end-sealed, it still had higher average moisture content than heartwood.
5. Conclusions
CT-scanning is a non-destructive method that enables to detect the first crack in the weldline even if it is occurred in the interior part of the weldline and is not visible from outside. This study showed that the welding parameters and wood properties have significant influences on crack time. Crack formation in Scots pine can be postponed by setting the conditions of the welding machine to a welding pressure of 1.3 MPa in contrast to 0.75 MPa, a welding time of 1.5 s instead of 2.5 s, and using heartwood.
This investigation was carried out only for Scots pine; other species might show different behaviour. However, we cannot definitely conclude that water resistance of this welded connection is sufficient for outdoor use. Hence, this subject needs further research.
Acknowledgments This research was supported by the Luleå University of Technology (LTU) in Sweden and ENSTIB-LERMAB, Université Henri Poincaré, Epinal, France.

- 10 -
References
1. B. Suthoff, A. Schaff, H. Hentschel and U. Franz, German Patent DE 196 20 273 (1996).
2. B. Suthoff and H-J. Kutzer, German Patent DE 19 746 782 A. (1997).
3. B. Stamm, E. Windeisen, J. Natterer and G. Wegener, Holz Roh Werkstoff. 63, 388-389 (2005).
4. H. R. Mansouri, P. Omrani and A. Pizzi, J. Adhesion Sci. Technol. 23, 63–70 (2009).
5. M. Vaziri, O, Lindgren, A. Pizzi and H. R. Mansouri, J. Adhesion Sci. Technol. 24, 1515-1527 (2010).
6. O. Lindgren, Wood Sci. Technol. 25, 425-432 (1991).
7. O. Lindgren, Doctoral Thesis. Medical CT-canners for Non- Destructive Wood Density and Moisture Content Measurements. Luleå University of Technology, Sweden (1992).
8. D. C. Montgomery, Design and Analysis of Experiments, Wiley (2005).
9. B. Stamm, J. Natterer and P. Navy, Holz Roh Werkst. 07763, 313–320 (2005).
10. Mojgan. Vaziri, Owe. Lindgren and A. Pizzi, J. Adhesion Sci. Technol. Accepted (2011).
11. B. Gfeller, A. Pizzi, M. Zanetti, M. Properzi, F. Pichelin, M. Lehmann and L. Delmotte. Holzforschung. 58, 45–52 (2004).
12. J.F. Siau, Transport Processes in Wood. Springer Verlag, Berlin, (1984)
13. E.L. Back and L.H. Allen, Pitch Control, Wood Resin and Deresination. Tappi, Atlanta (2000).
14. Å. Rydell, M. Bergström and T. Elowson, Holzforschung 59, 183–189 (2005).

Paper III
M. Vaziri, O. Lindgren and A. Pizzi, Influence of welding parameters on weldline density and its relation to crack formation in welded Scots pine. J. Adhesion Sci. Technol. 25, 1819–1828 (2011).


Journal of Adhesion Science and Technology 25 (2011) 1819–1828brill.nl/jast
Influence of Weldling Parameters on Weldline Density andIts Relation to Crack Formation in Welded Scots Pine Joints
Mojgan Vaziri a,∗, Owe Lindgren a and Antonio Pizzi b
a Department of Wood Science and Technology, Luleå University of Technology, Forskargatan 1,931 87 Skellefteå, Sweden
b Enstib-Lermab, Université Henri Poincaré – Nancy 1, 27 Rue du Merle Blanc, BP 1041,88051 Epinal Cedex 9, France
Received in final form 1 August 2010
AbstractExterior use of welded wood laminates without further treatment is not recommended. Frictional weldedjoints have poor resistance to moisture variation, especially to drying.
Therefore, application of welded woods is limited to interior use without exposure to highly variable airhumidity. Influences of some welding and wood parameters such as welding pressure, welding time andheartwood/sapwood on weldline density of Scots pine (Pinus sylvestris) joints were investigated. Interde-pendence between density and water resistance of weldline (in terms of crack time) was also studied bycomparing the results of this investigation with those of the earlier studies. Specimens composed of twowood pieces, each measuring 20 mm × 20 mm × 200 mm, were welded together to form a specimen mea-suring 40 mm × 20 mm × 200 mm by a vibration movement of one wood surface against another at afrequency of 150 Hz. An X-ray Computerized Tomography scanner was used to measure weldline density.Weldlines of sapwood produced by 1.3 MPa welding pressure and 1.5 s welding time showed the highestdensity. No correlation between weldline density and crack time was evident.© Koninklijke Brill NV, Leiden, 2011
KeywordsLinear welding, tomography, crack time, welding conditions, weldline density
1. Introduction
Linearly welded wood joints can be used mainly for non-structural use with onlyshort time exposure to exterior weather [1, 2]. Exterior use with variable humidityrequires high water resistance of the welded joints. Splitting of the welded joints inpresence of moisture makes them completely unsuitable for structural use [3]. The
* To whom correspondence should be addressed. Tel.: +46910 58 57 04; Fax: +46910 58 53 99; e-mail:[email protected]
© Koninklijke Brill NV, Leiden, 2011 DOI:10.1163/016942410X525713

1820 M. Vaziri et al. / J. Adhesion Sci. Technol. 25 (2011) 1819–1828
less the water absorption the more suitable is the material for outdoor use. One wayto overcome this moisture sensitivity without using any waterproofing chemicalsis to optimize welding machine settings and wood parameters to improve moistureresistance of weldline.
One purpose of this paper is to present the state of the art in the field of linearwood welding technology with special attention to X-ray Computerized Tomogra-phy (CT-) scanning.
Second, it shows the influence of welding machine settings and wood parame-ters on weldline density. Finally, this paper presents the relation between densityand water resistance of weldline in Scots pine joints. The measurements have beencarried out with a CT-scanner which provides a fast, accurate, and non-destructivedensity measurement method [4]. The results are based on investigations on testpieces of Scots pine (Pinus sylvestris) as one of the most used industrial woodspecies for which welding process has not been studied yet. However, weldlinedensity has been investigated in some studies.
Leban et al. [5] carried out X-ray micro-densitometry tests on welded woodsamples to estimate the physical and mechanical properties of the fabricated wood-to-wood connections. This method was used to examine the density distributionin solid wood samples. Several species of spruce, beech, and oak were used. Themeasured maximum density of a spruce–spruce joint was 190% of the sample’snatural density, while the degree of the interfacial density to the untreated woodwas lower for both oak and beech. Beech joints showed the narrowest weldline andthe best mechanical performance. Ganne-Chedeville et al. [6] performed a non-destructive evaluation of maple (Acer spp.) joints welded by linear welding, withan Infrared (IR)-thermography technique. This technique allowed measurements ofthe maximal and average peak temperature profiles/distributions. The density pro-file/distribution at the joint interface was measured by X-ray micro-densitometry.The results show that the width of the welded zone also varies as a function of themaximum temperature reached during welding and that the maximum temperaturereached at the ends of the specimens is lower than that obtained in the central partof the specimens.
2. Materials and Methods
As described in earlier work [7] 80 specimens of dimensions 200 mm × 20 mm ×20 mm were cut from heartwood and sapwood of Scots pine in longitudinal di-rection of wood grain (40 specimens from heartwood and 40 specimens fromsapwood). The specimens were conditioned for one week at standard conditions(RH 65%, 20◦C) before testing. They were welded together two at a time to formspecimens of dimensions 200 mm × 20 mm × 40 mm by a linear vibration weld-ing machine (LVW 2061Mecasonic made in Annemasse/France). A certain rangeof welding machine’s settings was used and some parameters such as welding pres-sure, welding time and heartwood/sapwood were selected as design factors for

M. Vaziri et al. / J. Adhesion Sci. Technol. 25 (2011) 1819–1828 1821
Table 1.Parameters used for welding machine’s setting
Parameter Unit Value
Welding pressure (WP) MPa 1.3 0.75Welding time (WT) s 1.5 2.5Welding displacement (WD) mm 2Frequency Hz 150Holding pressure (HP)∗ MPa 2.75Holding time (HT)† s 50Equilibrium moisture content (EMC) % 12
* The clamping pressure exerted on the surface of the specimenafter the welding vibration had stopped.
† The pressure holding time maintained after the welding vibra-tion had stopped.
Table 2.Combinations of welding parameters and type of wood used in this study
Parameters P T H/Scombination
P1T1H 0.75 1.5 HeartwoodP1T1S 0.75 1.5 SapwoodP2T2H 1.3 2.5 HeartwoodP2T2S 1.3 2.5 SapwoodP1T2H 0.75 2.5 HeartwoodP1T2S 0.75 2.5 SapwoodP2T1H 1.3 1.5 HeartwoodP2T1S 1.3 1.5 Sapwood
P is representative of welding pressure at low (P1) and high (P2) levels.T is representative of welding time at low (T1) and high (T2) levels. H isrepresentative of heartwood. S is representative of sapwood.
evaluation in this study (Table 1). The specimens were welded by different factorscombinations as shown in Table 2. Test objects were conditioned in the laboratoryat ambient conditions for 30 days before scanning. Then the samples were scannedone at a time by a medical X-ray CT-scanner (SIEMENS Emotion Duo) at ambientconditions according to scanner settings in Table 3. The X-ray absorption was mea-sured in an area of 3 × 202 pixels along the weldline and showed as a gray valueprofile. CT-scanning generates images with greyscale values that correspond to theattenuation coefficient of the materials, which, in turn, is directly related to densityand moisture content change in the object [4, 8]. The calculated X-ray linear attenu-ation coefficient (sometimes referred to as the absorption coefficient) in each smallvolume element (voxel) is normalized by the corresponding linear attenuation co-

1822 M. Vaziri et al. / J. Adhesion Sci. Technol. 25 (2011) 1819–1828
Table 3.Parameters used for CT-scanner’s setting
Parameter Unit Value
Voltage kV 110Current mA 70Scan time s 2Scan thickness mm 5Matrix Pixels 512 × 512Resolution Pixels/mm 2.3
For image reconstruction, a standard Shepp–Loganalgorithm was used.
efficient for water according to equation (1) [9]. This normalized value is referredto as the CT-number:
CT-number = 1000 × [μx − μwater] ÷ μwater (1)
where μx = the attenuation coefficient for the tested material at an average photonenergy of 73 keV.
Thus, a CT-number of −1000 indicates an object, or a voxel within the object,that has the density of air. A CT-number of zero indicates a region in the slice of theobject with the density of water.
Lindgren et al. [8] showed that density and moisture content could be measuredwith a CT-scanner. The relationships between CT-number and oven-dry and wetwood densities were presented by those authors as two linear regressions for Scotspine:
Density = (1.052 × CT-number) + 1053 (2)
Density = (0.993 × CT-number) + 1015 (3)
Equation (2) — linear regression between measured CT-number and oven-dry wooddensity. Equation (3) — linear regression between measured CT-number and wetwood density. Within a density range of 350–610 kg/m3 the accuracy of densitymeasurement is ±2 kg/m3 for oven-dry wood, and it is ±6 kg/m3 for wet woodwith a moisture content ranging from 6 to 117%. This accuracy was estimated at asignificant level of 0.05 for a sample measuring 2 × 2 × 1.5 mm3 [8]. The measuredvolume used here was larger (40 × 20 × 200 mm3) and, therefore, we expected thatthe accuracy would be slightly better than found previously.
Welded specimens were placed with butt ends in 5-mm-deep tap water for waterabsorption. Then the samples were scanned one at a time until a crack was detectedin the weldline by image processing software (Image J). The crack could be seen inCT-image much earlier than it was visible by naked eyes. Humidity variation andparticularly wet-dry condition leads to crack formation within the welded woodjoints. The length of time from the first water exposure of the specimens to crack

M. Vaziri et al. / J. Adhesion Sci. Technol. 25 (2011) 1819–1828 1823
formation within the weldline was measured as an indicator of water resistance ofwood joints (in terms of crack time) [10]. The longer the crack time the more waterresistant is the weldline.
3. Results
Data for density of weldlines were analyzed by means of the statistical softwareMinitab.
Minitab is a widely available statistical software package with high capabilityfor data analysis of experiments with both fixed and random factors [11]. All threeevaluated parameters showed significant effect on weldline density with 95% confi-dence interval. Combination of 1.3 MPa welding pressure, 1.5 s welding time, andsapwood (P2T1S) led to highest weldline density. The lowest weldline density wasobtained in combination of 0.75 MPa welding pressure, 2.5 s welding time and sap-wood (P1T2S) as shown in Fig. 1. Previous investigations [7, 10] showed that thisfactors combination (0.75 MPa welding pressure, 2.5 s welding time and sapwood)led to a long crack in the middle of weldline and short crack time. Figure 2 indicatesthat there is no definite relationship between density and crack time of the speci-
Figure 1. Influence of welding parameters and wood type on weldline density (kg/m3). Averageweldline densities for 8 groups of factors combinations, each of which contained 5 specimens, weremeasured. P is weldline pressure at low and high levels. (P1: 0.75 MPa, P2: 1.3 MPa) and T is weld-ing time at short and long levels (T1: 1.5 s, T2: 2.5 s). S and H represent sapwood and heartwood,respectively.

1824 M. Vaziri et al. / J. Adhesion Sci. Technol. 25 (2011) 1819–1828
Figure 2. Comparison of weldline density and crack time upon exposure to moisture. The time takenfor the first crack to be formed in the weldline after the first water exposure of the specimens is calledcrack time [10].
Figure 3. Density and densification of weldlines for different combinations of parameters. The weld-line density of the examined Scots pine specimens varied between 164–191% of the untreated wooddensity. The highest and lowest densification occurred for the highest and lowest weldline density,respectively.
mens. However, weldline with the lowest density has also the shortest crack timeas shown in factors combination of 0.75 MPa welding pressure, 2.5 s welding timeand sapwood (P1T2S). The degree of densification of weldlines was calculated bydividing the weldline density by the respective untreated wood density (Fig. 3).

M. Vaziri et al. / J. Adhesion Sci. Technol. 25 (2011) 1819–1828 1825
This investigation involved several parameters and it was necessary to study thecombined effects of parameters on response, so a factorial design was necessary.
For estimating the factor effects a full 23 factorial design with 5 replicateswas performed for three parameters (welding pressure, welding time, and heart-wood/sapwood), each at only two high and low levels. In a 2k factorial design, it iseasy and intuitive to express the results of the experiment in terms of a mathemati-cal model called a regression model. There was a dependent variable or response y
(weldline density) that depended on three independent variables (welding pressure,welding time, and heartwood/sapwood). The relationship between these variableswas studied by a linear regression model fitted to the data [11]. The analysis gavewith 95% confidence interval two significant main factor effects (welding time,heartwood/sapwood) and linear regression model was found to be:
y = 829.43 + 16.9x1 − 11.61x2 − 7.68x3 + 10.88x1x2 + 16.7x2x3 (4)
where y = weldline density (kg/m3), x1 = welding pressure (MPa), x1 = 1 (for1.3 MPa), x1 = −1 (for 0.75 MPa), x2 = welding time (s), x2 = 1 (for 2.5 s), x2 =−1 (for 1.5 s), x3 = type of wood, x3 = 1 (heartwood), x3 = −1 (sapwood).
Correlation between observed and predicted crack times (R2) was 96% so themodel based on this data set had high ability to predict a new crack time (Fig. 4).
Figure 4. Scatter plot for observed weldline density versus predicted weldline density (kg/m3). Weld-line densities of 40 specimens were measured by image processing program (ImageJ). Predicted valueswere based on the regression model with R2 = 0.96. Each group of multiple data points shows themeasured weldline densities for five samples welded with the same factors combination (replicates).Replication means an independent repeat of each observation to obtain an estimate of the experimentalerror and a more precise estimate of (y) [11].

1826 M. Vaziri et al. / J. Adhesion Sci. Technol. 25 (2011) 1819–1828
4. Discussion
The linear regression equation and its coefficient of determination (R2) value of0.96 indicate that some of the welding parameters and wood properties have amarked influence on the density of the weldline. According to regression model(4) by varying parameters from 0.75 MPa welding pressure, 2.5 s welding time,and sapwood to 1.3 MPa welding pressure,1.5 s welding time and sapwood, theweldline density can be increased from 781 ± 6 to 871 ± 6 (kg/m3).
The heat generated by the mechanical friction at the joint interface plays a keyrole in the density of weldline and width of the welded zone also varies as a functionof the maximum temperature reached during welding [12].
As found previously [7, 10], combination of 1.3 MPa welding pressure and 1.5 swelding time was the best factors combination which generated the most heat andimproved water resistance of the weldline. Figure 3 shows that the densificationdegree of the weldline varies between 164–190% of the untreated wood densityand degrees of densification for sapwood specimens are higher than for heartwoodspecimens.
This is in accordance with the findings of many other researchers such as Trenard[13] and Blomberg and Persson [14] who studied densification degree of Scots pinein a Quintus press at 25◦C and 140 MPa. They found that heartwood of Scots pinebecomes less compressed than sapwood, presumably as the effect of the higherresin content. Heartwood in Scots pine has two to three times higher resin contentthan sapwood and the resin is more evenly distributed over the heartwood [15].Extractives are incompressible, as most liquids, and this will decrease the degree ofcompression because extractives are located inside the cell wall cavities and cannotmove. Extractives also act as bulking agents within the cell wall [16]. Dinwoodieand Desch [17] concluded that there are no differences in wood density or strengthproperties between sapwood and heartwood when compared at the same moisturecontent. Here, heartwood had about the same original density as sapwood.
Sapwood cells are densified by the thermo-mechanical action and the cell wallscollapse as a result of the thermal influence and the welding pressure. The densifi-cation degree is a measure which indicates the deformation following treatment andis, therefore, a measure of the increase in the density of the wood. The densificationdegree is also related to the energy input during densification [18]. Furthermore, theshort welding time of 1.5 s does not allow the detached cells at the interface to bepushed out of the joint as excess fibre and higher amount of remained fibres leadsto higher weldline density.
Figure 1 shows that a combination of 0.75 MPa welding pressure, 2.5 s weldingtime, and sapwood (P1T2S) leads to decrease in weldline density. Increase of thewelding time plays the dominant role in decreasing weldline density. Thickness ofthe contact zone and its density vary as a function of temperature.
The maximum temperatures reached during welding do not exceed a certainthreshold. This seems to be independent of the welding time. Experimentation [19]showed that once the heat produced a viscous layer of decomposed wood compo-

M. Vaziri et al. / J. Adhesion Sci. Technol. 25 (2011) 1819–1828 1827
nents, temperature remained stable until the process was interrupted. The thermalanalysis [1] carried out with samples of Norway spruce (Picea abies) showedthat the progression of both temperature and coefficient of friction during weldingprocess occurred generally in different phases as a function of welding time. Max-imum temperature that wood substances reach at the last stage of welding (Steadystate phase) is about 430–440◦C which does not increase during further welding.Increasing the welding time not only does not increase temperature but also leadsto more fibres loss and thus less weldline density. With longer welding time, onthe one hand, more fibres can be expelled and, on the other hand, charring occursin the welded zone that causes weak connection and short crack time as shown inFig. 2. Except for the specimens with the lowest weldline density which showedthe shortest crack time, no correlation between weldline density and crack time wasgenerally evident.
5. Conclusions
• This study showed that some of the welding parameters and wood properties(welding pressure, welding time and heartwood/sapwood) had certain influ-ences on the weldline density. Weldline density of Scots pine can be increasedby setting welding machine for 1.3 MPa welding pressure, 1.5 s welding timeand using sapwood.
• The density of the weldline of the examined Scots pine specimens varied be-tween 164–190% of the untreated wood density, and degree of densification forsapwood specimens was higher than that for heartwood samples. These resultsusing CT-scanning show comparable values to earlier investigations [5, 13–17].
• There is no definite relationship between density and water resistance of weld-line in terms of crack time.
Acknowledgements
This research was supported by the Luleå University of Technology (LTU) in Swe-den and Enstib-Lermab, Université Henri Poincaré, France.
References
1. B. Gfeller, M. Zanetti, M. Properzi, A. Pizzi, F. Pichelin, M. Lehmann and L. Delmotte, J. Adhe-sion Sci. Technol. 17, 1425–1590 (2003).
2. B. Stamm, Development of friction welding of wood — physical, mechanical and chemical stud-ies, PhD Thesis No. 3396, Ecole Fédérale de Lausanne, Switzerland (2006).
3. H. R. Mansouri, P. Omrani and A. Pizzi, J. Adhesion Sci. Technol. 23, 63–70 (2009).4. O. Lindgren, Wood Sci. Technol. 25, 425–432 (1991).5. J. M. Leban, A. Pizzi, S. Wieland, M. Zanetti, M. Properzi and F. Pichelin, J. Adhesion Sci. Tech-
nol. 18, 673–685 (2004).

1828 M. Vaziri et al. / J. Adhesion Sci. Technol. 25 (2011) 1819–1828
6. C. Ganne-Chedeville, J. M. Leban, M. Properzi, F. Pichelin and A. Pizzi, Wood Sci. Technol. 40,72–76 (2006).
7. M. Vaziri, O. Lindgren, A. Pizzi and H. R. Mansouri, J. Adhesion Sci. Technol., in press.8. O. Lindgren, J. Davis, P. Wells and P. Shadbolt, Holz Roh Werkst. 50, 295–299 (1992).9. G. T. Herman, Image Reconstruction from Projections — The Fundamentals of Computerized
Tomography. Academic Press, New York, NY (1980).10. M. Vaziri, O. Lindgren and A. Pizzi, Forest Products J., accepted.11. D. C. Montgomery, Design and Analysis of Experiments. Wiley (2005).12. B. Stamm, J. Natterer and P. Navi, Holz. Roh Werkst. 63, 313–320 (2005).13. Y. Trenard, Holzforschung 31, 166–171 (1977).14. J. Blomberg and B. Persson, J. Wood Sci. 50, 307–314 (2004).15. E. L. Back and L. H. Allen, Pitch Control, Wood Resin and Deresination, p. 392. Tappi, Atlanta
(2000).16. M.-L. Kuo and D. G. Arganbright, Holzforschung 34, 41–47 (1980).17. J. M. Dinwoodie and H. E. Desch, Timber: Structure, Properties, Conversion and Use, 7th edn.
Macmillan, London (1996).18. S. Hirata, M. Ohta and Y. Honma, J. Wood Sci. 47, 1–7 (2001).19. B. Stamm, E. Windeisen, J. Natterer and G. Wegener, Holz. Roh Werkst. 63, 388–389 (2005).

Paper IV
M. Vaziri, O. Lindgren and A. Pizzi, Influence of wood welding parameters and wood properties on water absorption in Scots pine joints induced by linear friction welding . J. Adhesion Sci. Technol. 25, 1839–1847 (2011).


Journal of Adhesion Science and Technology 25 (2011) 1839–1847brill.nl/jast
Influence of Welding Parameters and Wood Properties onthe Water Absorption in Scots Pine Joints Induced by
Linear Welding
Mojgan Vaziri a,∗, Owe Lindgren a and Antonio Pizzi b
a Department of Wood Science and Technology, Luleå University of Technology, Forskargatan 1,931 87 Skellefteå, Sweden
b Enstib-Lermab, Université Henri Poincaré — Nancy 1, 27 Rue du Merle Blanc, BP 1041,88051 Epinal Cedex 9, France
Received in final form 1 August 2010
AbstractWood welding is an environmentally-friendly and very quick technique to yield wood joints in just a fewminutes and without using any adhesives. The only limitation of welded wood is that the joint is suitableonly for interior use. Exterior use, or use in an environment with varying humidity requires water resistanceof the welded joints. An investigation was performed to determine the effects of welding parameters andwood properties on water absorption in the weldline and how to reduce it through controlling the productionparameters. The influences of welding pressure, welding time, and heartwood/sapwood on water absorptionin the weldline of Scots pine (Pinus sylvestris) joints were investigated. Specimens composed of two piecesof heartwood or sapwood, each of dimensions 200 mm × 20 mm × 20 mm, were welded together to formspecimens of dimensions 200 mm × 20 mm × 40 mm. The specimens were allowed to stand in 5-mm-deeptap water and then they were taken out of the water one at a time and scanned in 10-min intervals until thefirst crack appeared in the weldline. An X-ray Computerized Tomography scanner was employed to monitorwater movement and density change in weldlines during water absorption–desorption. All three evaluatedparameters showed significant effect on water absorption. Samples of heartwood welded by 1.3 MPa weldingpressure and 1.5 s welding time showed the lowest water absorption.© Koninklijke Brill NV, Leiden, 2011
KeywordsLinear welding, tomography, water absorption, welding conditions, moisture resistance
* To whom correspondence should be addressed. Tel.: +46910 58 57 04; Fax: +46910 58 53 99; e-mail:[email protected]
© Koninklijke Brill NV, Leiden, 2011 DOI:10.1163/016942410X525731

1840 M. Vaziri et al. / J. Adhesion Sci. Technol. 25 (2011) 1839–1847
1. Introduction
Wood welding is a mechanical friction process allowing timber assembly withoutany adhesives. The mechanical resistance of the joints formed by welding in 2–4 sis comparable to that obtained 24 h after gluing [1]. Since 1997, the good resultsobtained in tension and shear resistance of welded wood joints have prompted toextend and apply wood welding technology to timber assembly. The only limitationof welded wood is its sensitivity to water which makes its application to be limitedmainly for interior use.
The construction application of these environmentally-friendly products dependson their moisture resistance. The less the water absorption, the more suitable is thematerial for outdoor use. However, as the welding process is very complex it isstill unknown and, to a large extent, unexplored. One aspect of moisture behav-iour of welded wood that has not been investigated yet is the influence of weldingparameters on water absorption in the weldline. The main objective of the presentresearch was to determine the influence of welding pressure, welding time, andwood properties (heartwood/sapwood) on water absorption in the weldline. Rela-tionship between water absorption, water resistance and density of the weldline wasalso part of this study’s objectives. Results of this investigation can provide moreinformation to find the best way for improving the water resistance of the weldedjoints through controlling the production parameters. The final objective of thisstudy was to present the state of the art in the field of wood welding technologywith special attention to X-ray Computerized Tomography (CT-) scanning. Since2002 some studies have been carried out on the welded wood with regard to itsbehaviour in internal and external uses.
Gfeller et al. [1] and Pizzi et al. [2] used linear friction to join Norway spruceand beech by friction welding. Good bonding was noted with tensile strengths be-tween 8–10 MPa for beech and 2–5 MPa for spruce. Results of water immersiontest indicated that joints had a very poor resistance to water and thus were only suit-able for indoor uses. Mansouri et al. [3] carried out the moisture resistance test onlinear welded samples of beech by immersion in cold water (15◦C). The samplesthat lasted longer (25 h) in water before falling apart were those welded by highvibration frequency (150 Hz), lower displacement (2 mm) and short welding time(1.5 s).
2. Material and Methods
As described in an earlier work by Vaziri et al. [4] 40 welded samples of Scotspine were prepared according to different parameters combinations (Table 1). Thenthey were placed with butt ends in 5-mm-deep tap water for water absorption. Thespecimens were scanned and the X-ray absorption was measured in an area of 3 ×202 pixels along the weldline. CT-scanning generates images with greyscale valuesthat correspond to the attenuation coefficient of the materials, which, in turn, isdirectly related to density and moisture content [5, 6].

M. Vaziri et al. / J. Adhesion Sci. Technol. 25 (2011) 1839–1847 1841
Table 1.Combinations of welding parameters and type of woodused in this study
Parameters P T H/Scombination
P1T1H 0.75 1.5 HeartwoodP1T1S 0.75 1.5 SapwoodP2T2H 1.3 2.5 HeartwoodP2T2S 1.3 2.5 SapwoodP1T2H 0.75 2.5 HeartwoodP1T2S 0.75 2.5 SapwoodP2T1H 1.3 1.5 HeartwoodP2T1S 1.3 1.5 Sapwood
P is representative of welding pressure at low (P1)and high (P2) levels. T is representative of welding timeat low (T1) and high (T2) levels. H is representative ofheartwood. S is representative of sapwood.
The calculated X-ray linear attenuation coefficient (sometimes referred to as theabsorption coefficient) in each small volume element (voxel) is normalized by thecorresponding linear attenuation coefficient for water according to equation (1).This normalized value is referred to as the CT-number [7]:
CT-number = 1000 · [μx − μwater] ÷ μwater (1)
where μx = the attenuation coefficient for the tested material at an average photonenergy of 73 keV.
Thus a CT-number of −1000 indicates an object, or a voxel within the object,that has the density of air. A CT-number of zero indicates a region in the slice of theobject with the density of water.
Moisture content (MC) measurement using a CT-scanner is an indirect mea-surement method. Relationship between green wood density, dry wood density,moisture content and swelling is given by equation (2) [5]:
ρu = ρ0 · (1 + u)
(1 + α), (2)
where ρu = green wood density given by CT-scanner, ρ0 = oven-dried wood den-sity, u = moisture content, α = degree of swelling.
The relationship between moisture content in wood and green wood density isshown in Fig. 1. This relationship is based on a dry wood density of 500 kg/m3 anda volume swelling of α = 0.12 to a Fibre Saturation Point (FSP)1 of 30%.
1 FSP is a term used in wood mechanics and especially in wood drying, to denote the point in the dryingprocess at which only bound water in the cell walls remains — all other water, called free water, havingbeen removed from the cell lumens.

1842 M. Vaziri et al. / J. Adhesion Sci. Technol. 25 (2011) 1839–1847
Figure 1. Relation between green wood density and moisture content. Dry wood density is 500 kg/m3
[5].
There is an increase in density of approximately 2.2 kg/m3 for each % moisturecontent increase below FSP. The corresponding increase above FSP is 4.4 kg/m3.A change of ±1 CT-number corresponds approximately to a change in density of±1 kg/m3 [6].
CT-number of weldline after water absorption was compared to CT-number ofweldline before water absorption with known MC (5%) as a reference MC.
3. Results and Discussion
Data for water absorption of samples were analyzed by means of the statistical soft-ware Minitab. Minitab is a widely available statistical software package with highcapability for data analysis of experiments with both fixed and random factors [10].All the three evaluated parameters and interactions among them showed significanteffects on water absorption in the weldline.
Samples of heartwood welded with 1.3 MPa welding pressure and 1.5 s weldingtime (P2T1H) showed the minimum water absorption. The most water absorptionwas shown in sapwood samples welded by 0.75 MPa in 2.5 s (P1T2S) as shown inFig. 2.
CT-number profiles for one representative sample from each group (with mini-mum and maximum water absorption) are shown in Figs 3 and 4.
As found previously [4, 9] combination of 1.3 MPa welding pressure, 1.5 swelding time, and using heartwood (P2T1H) improved the water resistance of theweldline (in terms of crack length and crack time). As shown in Fig. 5 this speci-men which had the lowest water absorption (P2T1H) also shows the shortest crackin the beginning of the weldline.
Crack formation in this factors combination (P2T1H) took much longer time thanthe other factors combinations (Fig. 6). Samples of sapwood welded by 0.75 MPa

M. Vaziri et al. / J. Adhesion Sci. Technol. 25 (2011) 1839–1847 1843
Figure 2. Influence of welding parameters and wood properties on water absorption in the weldline.Sample welded by factors combination of 1.3 MPa welding pressure, 1.5 s welding time, and heart-wood (P2T1H) shows the least water absorption. The highest water absorption is shown for factorscombination of 0.75 MPa welding pressure, 2.5 s welding time and sapwood (P1T2S). The factorscombinations giving highest and lowest water absorption are shown in two dotted circles.
Figure 3. Factors combination of 1.3 MPa welding pressure, 1.5 s welding time, and heartwood(P2T1H) led to the least water absorption in the weldline. CT-numbers of weldline after water absorp-tion are only slightly larger than the CT-numbers of weldline before water absorption which indicateslow water absorption.
welding pressure and 2.5 s welding time (P1T2S) showed the maximum water ab-sorption and cracks were produced in the shortest time (Fig. 6).
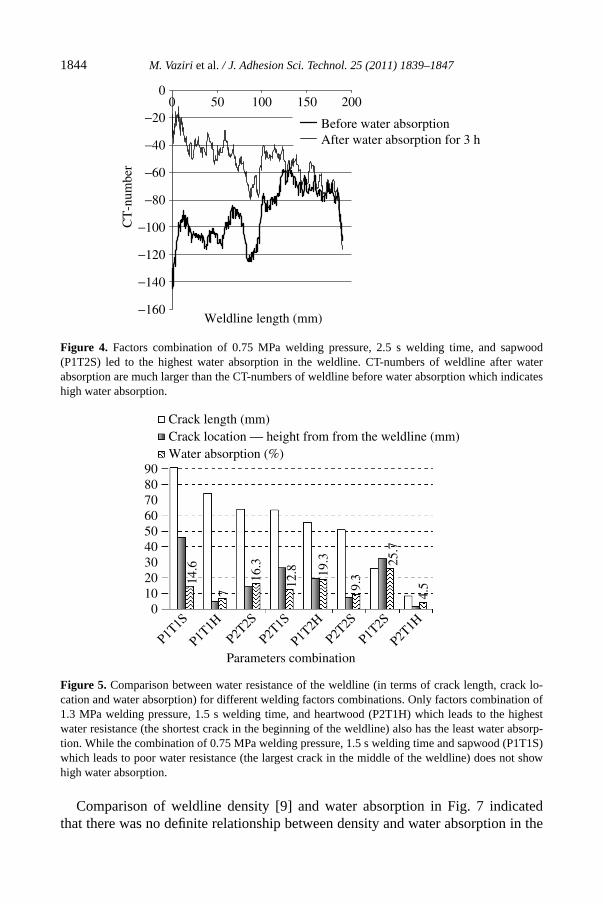
1844 M. Vaziri et al. / J. Adhesion Sci. Technol. 25 (2011) 1839–1847
Figure 4. Factors combination of 0.75 MPa welding pressure, 2.5 s welding time, and sapwood(P1T2S) led to the highest water absorption in the weldline. CT-numbers of weldline after waterabsorption are much larger than the CT-numbers of weldline before water absorption which indicateshigh water absorption.
Figure 5. Comparison between water resistance of the weldline (in terms of crack length, crack lo-cation and water absorption) for different welding factors combinations. Only factors combination of1.3 MPa welding pressure, 1.5 s welding time, and heartwood (P2T1H) which leads to the highestwater resistance (the shortest crack in the beginning of the weldline) also has the least water absorp-tion. While the combination of 0.75 MPa welding pressure, 1.5 s welding time and sapwood (P1T1S)which leads to poor water resistance (the largest crack in the middle of the weldline) does not showhigh water absorption.
Comparison of weldline density [9] and water absorption in Fig. 7 indicatedthat there was no definite relationship between density and water absorption in the

M. Vaziri et al. / J. Adhesion Sci. Technol. 25 (2011) 1839–1847 1845
Figure 6. Comparison between crack time and water absorption in different welding factors combina-tions. The Sample with the highest water absorption (P1T2S) shows the shortest crack time while thesample with the least water absorption (P2T1H) show the longest crack time. This shows that there isa good correlation between crack time and water absorption.
Figure 7. Comparison between weldline density and water absorption in the weldline. There is nodefinite relation between these two parameters but sample with the lowest weldline density showsalso the least water absorption (P1T2S).
weldline. However, sample of sapwood welded by 0.75 MPa welding pressure and2.5 s welding time (P1T2S) which had the lowest density had also the highest waterabsorption as shown in Fig. 7.
The relationship between the variables was studied by a linear regression modelfitted to the data [10]. The analysis of data gave with 95% confidence interval threesignificant main factors and linear regression model was found to be:
y = 11 − 3.75x1 + 3x2 − 1.15x3 − x1x2 (3)

1846 M. Vaziri et al. / J. Adhesion Sci. Technol. 25 (2011) 1839–1847
Figure 8. Scatter plot for observed water absorption versus predicted water absorption (%). Water ab-sorptions of 40 specimens were measured by means of image processing program (Image J). Predictedvalues were based on the regression model with R2 = 0.9. Each group of multiple data points showsthe measured water absorption for five samples welded with the same factors combination (replicates).Replication means an independent repeat observation to obtain an estimate of the experimental errorand a more precise estimate of (y) [10].
where y = water absorption in weldline (%), x1 = welding pressure (MPa), x1 = 1(for 1.3 MPa), x1 = −1 (for 0.75 MPa), x2 = welding time (s), x2 = 1 (for 2.5 s),x2 = −1 (for 1.5 s), x3 = type of wood, x3 = 1 (heartwood), x3 = −1 (sapwood).
Correlation between observed and predicted crack times (R2) was 90% so themodel based on this data set had high ability to predict a new crack time (Fig. 8).
According to the regression model by varying the welding parameters from0.75 MPa, 2.5 s and sapwood to 1.3 MPa, 1.5 s and heartwood the water absorptioncan be decreased from 25% to 4.5%.
4. Conclusions
• This study showed that the welding parameters and wood properties had cer-tain influences on water absorption in the weldline. Water absorption in weldedScots pine can be decreased by setting welding machine for 1.3 MPa weldingpressure, 1.5 s welding time and using heartwood.
• Comparing this result with those of the previous studies [4, 8, 9] indicatesthat combination of 1.3 MPa welding pressure, 1.5 s welding time, and usingheartwood is the best parameters combination which leads to increased waterresistance and much better performance of welded wood on exposure to highlyvarying air humidity.
Acknowledgements
This research was supported by the Luleå University of Technology (LTU) in Swe-den and Enstib-Lermab, Université Henri Poincaré, Epinal, France.

M. Vaziri et al. / J. Adhesion Sci. Technol. 25 (2011) 1839–1847 1847
References
1. B. Gfeller, M. Zanetti, M. Properzi, A. Pizzi, F. Pichelin, M. Lehmann and L. Delmotte, J. Adhe-sion Sci. Technol. 17, 1425–1590 (2003).
2. A. Pizzi, J.-M. Leban, F. Kanazawa, M. Properzi and F. Pichelin, J. Adhesion Sci. Technol. 18,1263–1278 (2004).
3. H. R. Mansouri, P. Omrani and A. Pizzi, J. Adhesion Sci. Technol. 23, 63–70 (2009).4. M. Vaziri, O. Lindgren, A. Pizzi and H. R. Mansouri, J. Adhesion Sci. Technol. 24, 1515–1527
(2010).5. O. Lindgren, Medical CT-scanners for non-destructive wood density and moisture content mea-
surements, Doctoral Thesis, Luleå University of Technology, Skellefteå, Sweden (1992).6. O. Lindgren, Holz Roh Werkst. 50, 295–299 (1992).7. G. T. Herman, Image Reconstruction from Projections — The Fundamentals of Computerized
Tomography. Academic Press, New York, NY (1980).8. M. Vaziri, O. Lindgren and A. Pizzi, Forest Products J., accepted.9. M. Vaziri, O. Lindgren and A. Pizzi, J. Adhesion Sci. Technol., in press.
10. D. C. Montgomery, Design and Analysis of Experiments. Wiley (2005).

Paper V
M. Vaziri, G. Orädd, O. Lindgren and A. Pizzi, Magnetic resonance imaging of water distribution in welded woods. J. Adhesion Sci. Technol. 25, 1997–2003 (2011).


Journal of Adhesion Science and Technology 25 (2011) 1997–2003brill.nl/jast
Magnetic Resonance Imaging of Water Distribution inWelded Woods
Mojgan Vaziri a,∗, Greger Orädd b, Owe Lindgren a and Antonio Pizzi c
a Department of Wood Science and Technology, Luleå University of Technology, Forskargatan 1,931 87 Skellefteå, Sweden
b Department of Radiation Sciences, Umeå University, SE-901 87 Umeå, Swedenc ENSTIB-LERMAB, Université Henri Poincaré — Nancy 1, 27 rue Philippe Séguin, BP 1041,
88051 Épinal Cedex 9, France
Received in final form 28 October 2010
AbstractThis study was performed for a better understanding of water effect on welded wood and improving itswater resistance. In this article, we have also attempted to demonstrate the feasibility of using MagneticResonance Imaging technology to study water movement in welded woods. Water distribution in weldedwoods of Scots pine (Pinus sylvestris) and beech (Fagus sylvatica) was investigated by Magnetic ResonanceImaging. Axial specimens were cut from beech and sapwood of Scots pine in longitudinal direction of woodgrain. Two pieces of each wood species were welded together by a linear vibration machine. Sub-samplesmeasuring 30 mm × 20 mm × 100 mm were cut from the welded specimens for Magnetic ResonanceImaging. The results showed that weldline of Scots pine was more resistant to water than weldline of beech.Pine joint was still holding after 40 h immersion in water, while a rapid wetting of the beech joint resultedin breakage of the joint in even less than an hour.
This preliminary study also showed that MRI is a powerful tool to measure water distribution in weldedwoods and highlighted the potential of this technique to enhance understanding of wood welding.© Koninklijke Brill NV, Leiden, 2011
KeywordsWood, linear welding, Magnetic Resonance Imaging (MRI), water resistance, water movement
1. Introduction
Linear vibration technology is a fast and environmentally-friendly technique forproducing wood joints without using any adhesives. Using this technique in fur-niture and building industries, in addition to cost saving, can enhance the wood
* To whom correspondence should be addressed. Tel.: +46910 58 57 04; Fax: +46910 58 53 99; e-mail:[email protected]
© Koninklijke Brill NV, Leiden, 2011 DOI:10.1163/016942410X544802

1998 M. Vaziri et al. / J. Adhesion Sci. Technol. 25 (2011) 1997–2003
industry’s competitiveness. One problem of linear welded wood is its rather poorresistance to water which limits its application for indoor use [1, 2]. Previous stud-ies [3, 4] showed that water in the welded woods, on exposure to moisture, led toformation and growth of cracks in the weldline.
Failure of wood joints under moisture condition depends, on the one hand, onthe material properties in the welded interface and, on the other hand, on swellingand shrinkage in wood pieces. To assess the source of water damage in weldedwoods this study was performed to characterize water penetration and the dis-tribution mechanism in welded woods. Nuclear Magnetic Resonance (NMR) is anon-destructive and non-contact imaging method which is well known for its med-ical applications as Magnetic Resonance Imaging (MRI) [5, 6]. This has been usedin other fields also including the wood industry [7–16]. The signal in an MRI imageis primarily dependent on the amount of water protons and is, therefore, suited tovisualize differences of moisture content in the object [17].
Computed Tomography (CT-scanning) and MRI preserve the integrity of thesample so they can be successfully used for the investigation of moisture contentin the wood and to provide information on its inner structure. MRI is an efficienttechnique for water flow investigation since this method can distinguish betweenbound water and free water and provides a profile of water distribution in the woodat a given moisture content [18]. One further advantage of MRI is its capability tomeasure moisture content of wood directly, while CT-scanning measures moisturecontent indirectly by measuring density changes. In wood imaging by MRI, onlywater protons are observable due to their relatively long relaxation times, as com-pared to the rapid relaxation of protons associated with the wood components. AnMRI image, therefore, is actually a profile of water content where the lighter areasare relatively wet and the darker areas are relatively dry [5, 6].
Some chemical investigations on polymer constituents in wood welding havebeen carried out by means of CP-MAS 13C-NMR [19–21]. This is the first timewelded wood has been investigated by MRI. In this work two wood species, onehardwood represented by beech (Fagus sylvatica) and one softwood represented byScots pine (Pinus sylvestris), were chosen for two reasons. First, both species arecommercially important, and secondly, the most wood welding investigations havebeen carried out on these two species which can provide us a basis for comparison.
2. Materials and Methods
2.1. Sample Preparation Method
Four specimens of dimensions 200 mm × 20 mm × 20 mm were cut from beechand sapwood of Scots pine in longitudinal direction of wood grain (2 specimensfrom beech and 2 specimens from Scots pine). Two wood pieces of each specieswere welded together to form a bonded joint of dimensions 200 mm × 20 mm ×40 mm by a linear vibration welding machine (LVW 2061Mecasonic, Annemasse,France). Certain ranges of welding machine parameters were used (Table 1). The

M. Vaziri et al. / J. Adhesion Sci. Technol. 25 (2011) 1997–2003 1999
Table 1.Parameters used for welding machine setting
Parameter Unit Value
Welding pressure (WP) MPa 1.3Welding time (WT) s 1.5Welding displacement (WD) mm 2Frequency Hz 150Holding pressure (HP)∗ MPa 2.75Holding time (HT)∗∗ s 60Equilibrium moisture content (EMC) % 5
∗ The clamping pressure exerted on the surface of the weldedwood specimen after the welding vibration had stopped.
∗∗ Duration of holding the specimen under clamping pressure af-ter termination of the frictional movement.
welded wood specimens were divided into smaller pieces (30 mm × 20 mm ×100 mm) for MRI scanning. Sample preparation for MRI was done by immersingthe welded wood specimens into tap water up to the time of the scanning and thenthey were transferred to MRI equipment.
2.2. MRI Scanning
All experiments were performed at 21◦C on a 9.4 T vertical Bruker BioSpec USR94/20 small animal scanner equipped with an actively shielded B-GA 12S gradientsystem and integrated second-order shims (Bruker Biospin, Ettlingen, Germany) asshown in Fig. 1. After some hours of water immersion (one hour for welded beechspecimen and 40 h for welded pine specimen) the specimens were transferred to
Figure 1. BioSpec, multi purpose high field MRI/MRS research system.

2000 M. Vaziri et al. / J. Adhesion Sci. Technol. 25 (2011) 1997–2003
the MRI equipment. The welded specimens were placed in a 50 ml plastic tube fullof water within a quadrate transmit/receive coil with an inner diameter of 40 mm.A multi-slice MRI protocol with a Rapid Acquisition with Relaxation Enhance-ment (RARE), specially designed for short echo times (RAREst), was used withthe following parameters:
Repetition/exposure Time (TR) = 1000 ms, Echo Time (TE) = 3.0 ms, RAREfactor = 8, Number of Excitations/acquisitions (NEX) = 20, Acquisition matrix =128 × 128 and Field-of-view (FOV) = 3 × 3 cm (axial scans) or 6 × 3 cm (otherscans).
Images were obtained with MRI slices oriented in three orthogonal directions,axial, sagittal and coronal. The slice thickness was 2 mm in Fig. 2 and 0.5 mm inFig. 3. Acquisition time was 3 min.
3. Results and Discussion
Figure 2 shows MRI images from axial (left) and coronal (right) views of weldedbeech (top) and welded pine (bottom). Wood with low moisture content (MC) hasrelatively low signal intensities and appears as dark regions in the image; zones withhigh MC have higher signal intensities and appear as white regions. The weldline isclearly visible as a line of brighter intensity for the beech sample, implying that wa-ter is quickly distributed into the region of the weldling. The fact that the weldlineis not visible in the pine sample is due to the high water resistance of the weldline ofpine which does not allow water penetration even after 40 h water immersion. Notethe appearance of the growth rings of the wood in the figures. This indicates that thewater uptake differs in the earlywood and the latewood. Water uptake mainly occursin the radial direction, resulting in an MC profile with most water close to the endof the sample and progressively less as the distance from the end is increased. Suchan uneven MC will cause uneven swelling and deformation of wood pieces whichcan result in joint failure of pine specimen.
Scots pine is one of the species with high extractives up to 15% of its dry weight[22]. Extractive compounds such as resin, aromatic and organic compounds (fats,waxes, fatty acids and alcohols) may exhibit lower affinity to water and a stronglydecreased water absorption in welded pine.
To further characterize the water penetration into the weldline in the beech sam-ple, a series of MRI images were taken from welded area in sagittal direction.Figure 3 shows sagittal views of the welded interface which were taken from fourMRI slices within and around the welded area. These images show that relativelywater-poor regions exist in the welded area. This could be due to air pockets orwater-resistant regions within the welded area.
The results were encouraging and this study has shown how high-resolution MRIcan be used for a non-destructive assessment of water distribution in welded wood.

M. Vaziri et al. / J. Adhesion Sci. Technol. 25 (2011) 1997–2003 2001
Figure 2. MRI images in axial (left) and coronal (right) directions of welded beech (a, b) and weldedpine (c, d) specimens. Beech and pine welded specimens were scanned after water immersion for 1 hand 40 h, respectively.
4. Conclusion
This preliminary MRI investigation made it possible to characterize water absorp-tion property of welded woods and failure of wood joints. MRI images can be usedfor the study and visualization of water distribution in welded woods.
Welded pine shows higher water resistance than welded beech; this may be ex-plained by the difference in the amount of extractives compounds in the two species.
In the welded beech specimen water rapidly penetrates the welded area and jointfailure is caused by water uptake in the weldline. However in the welded pine spec-imen, very little water is taken up by the welded area but swelling and shrinkageof the wood pieces might be the main reason for crack formation and propagationin the weldline. By changing welding parameters and wood properties one can in-crease water resistance of welded wood to some extent but treating the weldlinewith certain natural and environmentally-friendly water repellents is still recom-mended.

2002 M. Vaziri et al. / J. Adhesion Sci. Technol. 25 (2011) 1997–2003
Figure 3. Sagittal views of welded interface (b, c) and parallel (adjoining) region (a, d) on both sidesof the welded interface. The images show the welded beech specimen after water immersion for 1 h.
Acknowledgements
This research was supported by the Luleå University of Technology (LTU) andUmeå University in Sweden and ENSTIB-LERMAB, Université Henri Poincaré inEpinal/France.
References
1. H. R. Mansouri, P. Omrani and A. Pizzi, J. Adhesion Sci. Technol. 17, 23–63 (2008).2. B. Stamm, J. Natterer and P. Navy, Holz Roh Werkst. 63, 313–320 (2005).3. M. Vaziri, O. Lindgren, A. Pizzi and H. R. Mansouri, J. Adhesion Sci. Technol. 24, 1515–1527
(2010).4. M. Vaziri, O. Lindgren and A. Pizzi, Forest Prod. J., accepted (2010).5. T. Callaghan, Principles of Nuclear Magnetic Resonance Microscopy. Clarendon Press, Oxford,
UK (1991).6. V. Bucur, Nondestructive Characterization and Imaging of Wood. Springer, New York, NY (2003).7. A. R. Sharp, M. T. Rigging, R. Kaiser and M. H. Schneider, Wood Fiber Sci. 10, 74–81 (1978).8. J. H. van Houts, S. Wang, H. Shi, H. Pan and G. W. Kabalka, Wood Sci. Technol. 38, 617–628
(2004).

M. Vaziri et al. / J. Adhesion Sci. Technol. 25 (2011) 1997–2003 2003
9. G. Almeida, S. Gagne and R. E. Hernandez, Wood Sci. Technol. 41, 293–307 (2007).10. P. C. Wang and S. J. Chang, Wood Fiber Sci. 18, 308–314 (1986).11. S. J. Chang, J. R. Olson and P. C. Wang, Forest Prod. J. 39, 43–49 (1989).12. B. E. Dawson-Andoh, J. M. Halloin, T. G. Cooper, D. P. Kamdem and E. J. Potchen, Wood Fiber
Sci. 33, 84–89 (2001).13. M. B. MacMillan, M. H. Schneider, A. R. Sharp and B. J. Balcom, Wood Fiber Sci. 34, 276–286
(2002).14. J. R. Olson, S. J. Chang and P. C. Wang, J. Forest Res. 20, 586–591 (1990).15. U. Muller, R. Bammer and A. Teischinger, Holzforschung 56, 529–534 (2002).16. O. Lindgren and G. Orädd, in: Proceedings Fifth International Conference on Image Processing
and Scanning of Wood, Bad Walterdorf, Austria (2003).17. M. H. Levitt, Spin Dynamics: Basics of Nuclear Magnetic Resonance. Wiley, Chichester, UK
(2001).18. I. D. Hartley, F. A. Kamke and H. Peemoeller, Holzforschung 48, 474–479 (1994).19. L. Delmotte, C. Ganne-Chedeville, J. M. Leban, A. Pizzi and F. Pichelin, Polym. Degrad. Stability
93, 406–412 (2008).20. A. Pizzi, A. Despres, A. Mansouri, H. R. Leban and J. M. Rigolet, J. Adhesion Sci. Technol. 20,
427–436 (2006).21. B. Gfeller, M. Zanetti, M. Properzi, A. Pizzi, F. Pichelin, M. Lehmann and L. Delmotte, J. Adhe-
sion Sci. Technol. 17, 1573–1589 (2003).22. D. Fengel and G. Wegener, Wood Chemistry Ultrastructure Reactions. Springer, New York, NY
(1989).

Paper VI
M. Vaziri, O. Lindgren and A. Pizzi, Optimization of tensile-shear strength for linear welded Scots pine, accepted for publication in Journal of Adhesion Science and Technology (2011).


- 1 -
Optimization of tensile-shear strength for linear welded Scots pine
Mojgan Vaziri1 ∗. Owe Lindgrenand1 and Antonio Pizzi2 1 Department of Wood Science and Technology, Luleå University of Technology, Forskargatan 1, 931 87 Skellefteå, Sweden 2 ENSTIB-LERMAB, Université Henri Poincaré- Nancy 1, 27 rue Philippe Séguin, BP 1041, 88051 Épinal Cedex 9, France
Abstract The mechanical performance of welded wood has a decisive role in its applications. This study was performed to determine the welding conditions that optimized the tensile-shear strength of welded Scots pine (Pinus sylvestris). Tensile-shear strength as a function of welding pressure, welding time, and holding time† was measured according to European standard EN 205. Maximum tensile-shear strength of welded sample was 9.3 MPa that was obtained using 1.3 MPa welding pressure, 2.8 s welding time, and 70 s holding time. This tensile–shear strength was about two times that of PVAc-glued samples. According to data evaluation tensile-shear strength could be optimized to 9.7 MPa by increasing the welding time to 3.5 s and decreasing the holding time to 60 s.
Key words: wood, wood welding, linear welding, tensile-shear strength, holding time, welding pressure, welding time
∗ To whom correspondence should be addressed. Tel: +46910 58 57 04 Fax: +46910 58 53 99 Email: [email protected] †Holding time is duration of holding the specimen under clamping pressure after termination of the frictional movement.

- 2 -
1. Introduction
Wood welding is a novel technique for joining wooden pieces without any adhesives just by frictional movement. Compared to adhesive bonding, wood welding is an environmentally-friendly technology which offers many advantages including short welding duration and high energy and cost savings. According to the investigation of Gfeller et al. [1] the principle of wood welding is the melting and flowing of the amorphous polymers of wood, mainly lignin. Cross-linking between thermally decomposed wood compounds such as lignin and hemicelluloses has also been shown to contribute to the strength of the joint. Stamm et al. [2] showed that wood starts to soften after only a few seconds of frictional welding. The interphase temperature peaks at 420°-450 °C, when the wood surface is fully molten. At this stage the interphase is allowed to cool. The welded joint is apparently held together by solidified lignin and decomposed polysaccharides. The welding process is influenced by various factors such as welding pressure, the process duration or welding time, wood species, relative moisture content, etc. The consolidation or hardening of the heat-affected zone and thus the evolution of the interphasial tensile-shear strength is of major importance for the welding of wood components. The objective of this study was to optimize tensile-shear strength of welded Scots pine (Pinus sylvestris).
So far mechanical studies on linear welded woods have been limited to shear [1-10] and fracture mechanics tests [11]. Leban et al. [3] determined average shear strength of 8.7 MPa for beech-beech joints, while according to Stamm et al. [2] the maximum shear strength of beech was 2.6 MPa. Mean shear strength values for spruce-spruce and spruce-beech joints were measured to be 4.2 and 4.4 MPa, respectively [3]. Average tensile strength of Scots pine welded joint using 1 MPa welding pressure, 1.5 s welding time, 5 s holding time, and 150 Hz welding frequency was about 4.5 MPa [11].
Welded wooden joints are not covered by International Standards, but since the welded wood-to-wood connections are considered as a replacement for glued connections, two different test methods were possible. One of them was EN 205 [12] (Test method for wood adhesives for non-structural applications) and the other was EN 302-1 [13] (Test method for determination of bond strength in longitudinal tensile shear strength for timber structure). Since the poor water resistance of the welded woods generally limits their application to non–structural use, EN 205 seemed to be most suitable to evaluate the mechanical resistance of these connections.

2. Materials and methods
76 specimens of dimensions 20 mm × 20 mm × 200 mm were cut along the longitudinal wood grain from Scots pine sapwood. The samples were welded together to form 38 welded samples of 20 mm × 40 mm × 200 mm dimensions. The welded samples had 12 % moisture content before welding. The welding equipment used was a Mecasonic LVW 2361 linear vibration welding machine (Mecasonic, Annemasse, France). Based on theoretical understanding and practical experience certain ranges of welding parameters were used. The samples were welded by exerting a vibration movement of one wood surface against the other at a frequency of 150 Hz. The amplitude of frictional movement or displacement was 2 mm. When the vibration process was stopped a clamping pressure (holding pressure) of 2 MPa was maintained on the surface of the sample.
Central Composite Design (CCD) was chosen as experimental design. CCD design is a quite general and flexible design for optimization study which
consists of a 2 factorial with n runs at high and low and n runs at middle level of the parameters (center runs) [14]. Three controllable variables (K=3) such as welding pressure, welding time, and holding time were chosen as design factors The region of interest was cuboidal rather than spherical; therefore, a face-centered cubic design was chosen. This design requires only three levels of each factor, and since in practice it was difficult to vary welding factor levels, this design was appropriate. The design parameters and their three levels are shown in Table 1.
kF C
A computer generated design using statistical software Minitab [15] was used for this purpose. The model composed of 14 runs with two replicates (28 runs) at high and low levels of parameters and 10 center runs at middle level of the parameters (1.3 MPa welding pressure, 2.8 s welding time, and 70 s holding time). Samples were denoted according to coded variables, for example the notation [-1, 1, 0] signified welding pressure at 0.75 MPa, welding time at 3.5 s, and holding time at 70 s. Table 1. Welding parameters and their actual and coded levels used in experiment.
Parameters Low level (-1)
Central point (0)
- 3 -
High level (1)
Welding pressure (MPa) 0.75
1.3 1.85
Welding time (s) 2 2.8 3.5
Holding time (s) 60 70 80
The specimens were cut according to the method described in European standard EN 205. Two cuts were made in the middle of the specimens, perpendicular to the weldline. The distance between the two cuts was 10 mm. The samples were formed in a way that they were appropriate for the test equipment. Detailed information about the form and dimensions of the test specimens suitable for the test equipment are given in Fig. 1. The welded samples were conditioned for 4 days in an environmental chamber (20°C and 65% relative humidity) before testing. The resistance of the welded connections was tested by means of a tensile-shear test machine along the longitudinal direction of the samples, in the direction of the wood fibers and at a rate of 2 mm/min (Figure 1).
The tensile-shear strength Y was calculated from the applied force and exposed welded surface area and was indicated in MPa as:
Y = A
Fmax =bl
F×max (1)
where
Y = tensile-shear strength (MPa)
F max = maximum tensile-shear force (N)
A = surface area (mm ) 2
l = length of the surface area = 10 ± 0.1 mm b = width of the surface area = 20 ± 0.1 mm
Tensile-shear strength of the welded Scots pine samples were compared to 21 similar samples glued with polyvinyl acetate (PVAc). Tensile-shear strengths of the glued samples were measured at three intervals: 6h, 12h, and 24 h after gluing. Each samples series contained 7 samples.
- 4 -

150 mm
10 m
m
20 mm
Figure 1. The tensile-shear strength of the welded connections was determined using tensile-shear strength instrument (Instron Universal 30 kN) along the longitudinal direction of the samples. Two cuts with 10 mm distance from each other were made perpendicular to the weldline according to European standard EN 205[12].
3. Results and discussion
The results of the tensile-shear strength tests varied from a minimum of 0.7 MPa to a maximum of 11 MPa. The maximum tensile-shear strength was obtained at the central point of 1.3 MPa welding pressure, 2.8 s welding time, and 70 s holding time.
The statistical analysis revealed that welding pressure and interaction of welding time and holding time had significant effects on tensile-shear strength with 95% confidence interval. Based on the small p-value (0.01) for the quadratic term (welding pressure) the following second-order expression was found to be adequate.
Y = 7.1 – 0.34 x 1 + x - 0.34 x - 3.5 x 1 - 1.2 x x (2) 2 32
2 3
Y = tensile-shear strength (MPa)
x 1 = welding pressure (MPa)
x 2 = welding time (s)
x 3 = holding time (s)
- 5 -
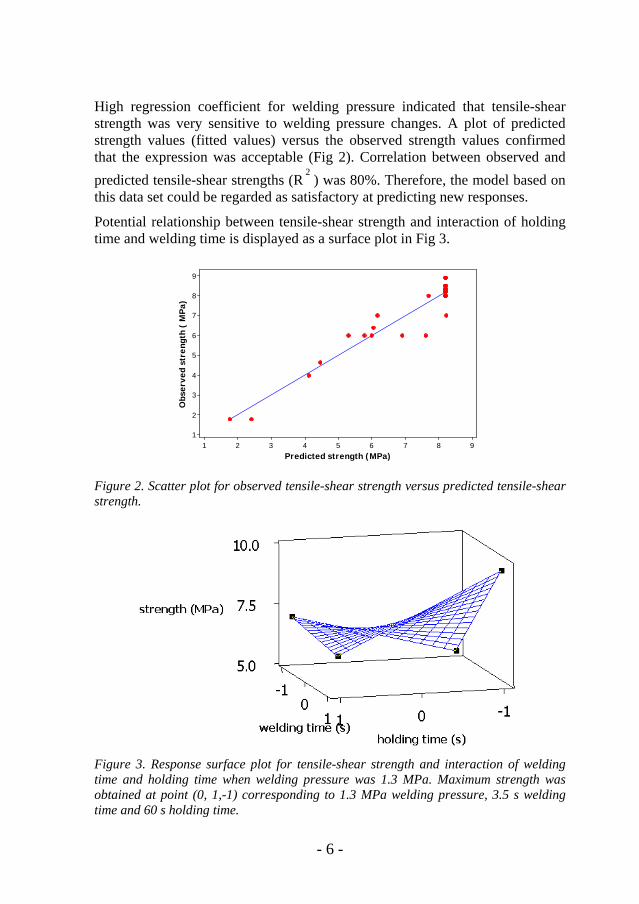
High regression coefficient for welding pressure indicated that tensile-shear strength was very sensitive to welding pressure changes. A plot of predicted strength values (fitted values) versus the observed strength values confirmed that the expression was acceptable (Fig 2). Correlation between observed and predicted tensile-shear strengths (R ) was 80%. Therefore, the model based on this data set could be regarded as satisfactory at predicting new responses.
2
Potential relationship between tensile-shear strength and interaction of holding time and welding time is displayed as a surface plot in Fig 3.
987654321
9
8
7
6
5
4
3
2
1
Predicted strength (MPa)
Obs
erve
d st
reng
th (
MP
a)
Figure 2. Scatter plot for observed tensile-shear strength versus predicted tensile-shear strength.
Figure 3. Response surface plot for tensile-shear strength and interaction of welding time and holding time when welding pressure was 1.3 MPa. Maximum strength was obtained at point (0, 1,-1) corresponding to 1.3 MPa welding pressure, 3.5 s welding time and 60 s holding time.
- 6 -

- 7 -
To characterize the shape of the surface, location of the maximum tensile-shear strength with reasonable precision, and levels of these two parameters, a contour plot based on the coded values was generated as shown in Fig. 4.
This contour plot was used to explore the potential relationship between tensile-shear strength, holding time, and welding time. A contour plot displays the three-dimensional relationship in two dimensions, with x and y factors (predictors).
The factor combination which was capable to produce the maximum tensile-shear strength is shown as red circle in Figure. 4. This point is located on the border of exploration region where we have fitted the model. The outside of this region or combination of factor must be explored. Maybe a tensile-shear strength of 9.7 MPa is not the optimum tensile-shear strength and decreasing the holding time to less than -1 or <60 s and increasing the welding time to more than 1 or >3.5 s can rise the tensile-shear strength even more than 9.7 MPa.
Figure 4. Contour plot illustrating a surface with maximum tensile-shear strength. Welding time at high level (1) and holding time at low level (-1) gave the optimum tensile-strength of 9.7 MPa which is shown as red circle.
The relative sensitivity of tensile-shear strength to welding time and holding time was studied by statistical software Minitab. This software shows how different experimental settings affect the predicted responses. If we wish to change input variable or adjust the factor levels, Minitab calculates an optimal solution and draws the plot. Fig. 5 shows that increasing welding time or decreasing holding time leads to increase in tensile-shear strength, but tensile-shear strength is more sensitive to welding time changes than holding time. At the same welding pressure and holding time, reducing welding time from 1 in graph (1) to -1 in graph (2) leads to a reduction in maximum tensile-shear
9
8
7
6
holding time (s)
wel
ding
tim
e (s
)
1.00.50.0-0.5-1.0
1.0
0.5
0.0
-0.5
-1.0
6789
(MPa)strength
Holding time (s) = -1Welding time (s) = 1Tensile-shear strength (MPa) = 9.70
9
8
7
6
holding time (s)
wel
ding
tim
e (s
)
1.00.50.0-0.5-1.0
1.0
0.5
0.0
-0.5
-1.0
6789
(MPa)strength
Holding time (s) = -1Welding time (s) = 1Tensile-shear strength (MPa) = 9.70

- 8 -
strength from 9.7 MPa to 5.2 MPa. However, at the same welding pressure and welding time, decreasing holding time from 1 in graph (3) to -1 in graph (1) leads to an increase in maximum tensile-shear strength from 6.5 MPa to 9.7 MPa. Therefore, a combination of longer welding time and shorter holding time can give optimum tensile-shear strength.
(1)
(2)
(3) Figure 5. Sensitivity of tensile-shear strength to changes in the levels of parameters. The vertical red lines in the graph represent the current factor settings. The numbers displayed at the top of a column (in red) show the current factor level settings. The horizontal dotted lines and numbers represent the tensile-shear strength for the current factor level. Tensile-shear strength is optimized when welding pressure = 1.3 MPa, welding time = 3.5 s, and holding time = 60 s (0, 1,-1).as shown in graph (1). Any variation in the level of the parameters leads to change in optimum tensile-shear strength.

- 9 -
Glued joint
The combination of 1.3 MPa welding pressure, 2.8 welding time, and 70 s holding time, representing central point (0,0,0), could yield joints whose tensile-shear strength was about twice that of the PVAc-glued joints as shown in Table. 2 and Fig. 6. Table 2. Comparison of average tensile-shear strength of welded specimens (average of ten measurements) with average tensile-shear strength of PVAc-glued joints (average of seven measurements).
Figure 6. Load versus displacement in tensile-shear strength test on welded and PVAc-glued samples. Varying parameters were welding pressure, welding time, and holding time each at three levels. Welding pressures were 0.75, 1.3, and 1.8 MPa, welding times were 2, 28, and 3.5 s, and holding times were 60, 70, and 80 s. Tensile-shear strength of glued samples are shown in dotted circle.
100% wood failure occurred in the samples welded in the center point combination (0, 0, 0,) as shown in Fig 7. This was an indication of high strength of the welded interphase which is important for its application in the field of multi-layered wood laminates. High tensile-shear strength indicates that this species can be used not only for indoor use such as furniture, but also for some outdoor use. However, specific timber tests should be carried out before claiming this type of application.
Welded joints After 6 h After 12 h After 24 h
Tensile-shear strength (MPa) 9.3 5.30 5.30 5.45 Standard deviation (%) 5 3 3 3
0
0.5
1
1.5
2
2.5
0 1 2 3 4 5 6 7 8
Displacement (mm)
Load
(kN
)
Glued- After 6 h Glued- After 12 h
Glued- After 24 h 0.75 Mpa, 3.5 s, 60 s
1.8 Mpa, 3.5 s, 60 s 0.75 Mpa, 2 s, 80 s
1.3 Mpa, 3.5 s, 70 s 1.3 Mpa, 2.8 s, 70s

- 10 -
Figure 7. 100% wood failure in samples welded using 1.3 MPa welding pressure, 2.8 s welding time, and 70 s holding time (left). 100% failure in welded interphase in a sample welded using 0.75 MPa welding pressure, 2.8 s welding time, and 70 s holding time
This is unusual as in linear wood welding generally joint strength is high but percentage of wood failure is relatively low. The high strength and exceptionally high wood failure of welded Scots pine indicate simply that the measured strength is that of the timber and strength of the welded joint is higher than the shear strength of the solid wood.
X-ray microdensitometry of welded Scots pine showed that a pale yellow substance originating from the timber itself seemed to melt during friction welding and to move as far as a couple of millimeters from the weldline and surround the weldline [16]. Solid state CPMAS 13C NMR spectrometry [16] showed that Scots pine contains a small proportion of a native mixture of terpenoic acids known under the collective name of rosin which yields joints of high water resistance. Rosin is a well known mixture of sesquiterpenoids such as abietic acid, pimaric and levopimaric acids that are water repellent and have protecting influence on the welded interphase. Rosin apparently reinforces the welded interphase to yield weldline strength always much higher than the strength of the surrounding wood [16].
1.3 MPa was found to be the welding pressure that could yield mechanically resistant joints. When welding pressure is increased, the frictional force or the amount of energy supplied to the interphase is increased. If welding pressure is not high enough a good quality welded joint will not be produced and welding pressure deficit is not compensated by extending welding time. It seems that at low pressure of 0.75 MPa the heat generated at the interphase is not high enough to cause thermal degradation which is necessary to melt the wood material and make a strong joint. Maybe, at the high pressure, more than 1.3 MPa, excessive distortion of the material occurs that decreases the tensile-shear strength.
Previous studies [17, 18] showed that a welding time of 1.5 s leads to increased water resistance than does 2.5 s. However, results of this study showed that a welding time of 2.8 s yields stronger weld joints than 2.s and by extending the

- 11 -
welding time to 3.5 s could even produce optimal tensile-shear strength (9.7 MPa)
These examinations reveal that tensile-shear strength of welded Scots pine has a non-linear correlation with welding time and passes through various characteristic phases. Since the whole welding process is governed by heat generation in the welded interphase, this correlation can be a function of heat progression in the weldline.
The main cause of adhesion in welded Scots pine is fusion of wood lignin and rosin and interlocking of wood fibers that are locked in a cured matrix of molten rosin and cell-interconnecting materials Relative short holding time and long welding time gives better mechanical strength of joint.
Welded joints showed higher stiffness and modulus of elasticity than the glued joints. Overall they were less elastic than the glued joints; that is a drawback in their applications. There still remains study to better understand what phenomenon is responsible.
4. Conclusions
Welding of Scots pine produces joints of excellent tensile-shear strength. The tensile-shear strength of the Scots pine joints formed by welding in 2–4 seconds is about two times that obtained 24 hours after gluing. This result is of major importance with regard to welding of multi-layered wood laminates. Such a rapid achievement of high shear strength allows continuous welding of several layers of wood with very short welding cycles, and without affecting the joints already completed.
High tensile-shear strength of welded Scots pine is certainly sufficient for interior grade application; it may even be adequate for some applications in timber construction. However, further timber tests should be carried out before claiming this type of application.
Data evaluation showed that tensile-shear strength was more sensitive to welding time changes than to holding time and could be optimized to 9.7 MPa using 1.3 MPa welding pressure, 3.5 s welding time, and 60 s holding time.
Acknowledgments
This research was supported by the Luleå University of Technology (LTU) in Sweden and ENSTIB- LERMAB, Université Henri Poincaré, Epinal, France.
References
1. B. Gfeller, M. Zanetti, M. Properzi, A. Pizzi, F. Pichelin, M. Lehman and L. Delmotte, J. Adhesion Sci. Technol. 17, 1573-1589 (2003).

- 12 -
2. B. Stamm, J. Natterer and P. Navi, Holz Roh Werkst. 63, 313–320 (2005).
3. J-M. Leban, A. Pizzi, S. Wieland, M. Zanetti, M. Properzi and F. Pichelin, J. Adhesion Sci. Technol. 18, 673–685 (2004).
4. M. Boonstra, A. Pizzi, C. Ganne- Chedeville, M. Properzi, J-M. Leban and F. Pichelin, J. Adhesion Sci. Technol. 20, 359-369 (2006).
5. A. Pizzi, J. Adhesion Sci. Technol. 20, 829-846 (2006). 6. J. F. Bocqet, A. Pizzi, A. Despres. H. R. Mansouri, L. Resch, D. Michel
and F. Letort, J. Adhesion Sci. Technol. 21, 301-317 (2007). 7. C. Ganne- Chedeville, M. Properzi, A. Pizzi, J-M. Leban and F.
Pichelin. Holz Roh Werkst. 65, 83-85 (2007). 8. H. R. Mansouri. P. Omrani and A. Pizzi, J. Adhesion Sci. Technol. 23,
63-70 (2009). 9. P. Omrani, A. Pizzi, H. R. Mansouri, J-M. Leban and L. Delmotte, J.
Adhesion Sci. Technol. 23, 827-837 (2009). 10. M. Properzi, J-M. Leban, A. Pizzi, S. Wieland. F. Pichelin and M.
Lehmann, Holzforschung. 59, 23-27 (2005). 11. P. Omrani, H. R. Mansouri, G. Duchanois and A. Pizzi, J. Adhesion Sci.
Technol. 23, 2057–2072 (2009). 12. European Standard EN 205. Adhesive–wood adhesives for non-
structural applications. Determination of tensile-shear strength of lap joints (2003).
13. European Standard EN 302-1, Adhesives for load- bearing timber structures, Test methods Part 1: Determination of bond strength in longitudinal tensile shear strength (2004).
14. D. C. Montgomery, Design and Analysis of Experiments. John Wiley (2005).
15. www.minitab.com 16. H. R. Mansouri, A. Pizzi, J-M. Leban, L. Delmotte, O. Lindgren, M.
Vaziri and P.Omrani, J. Adhesion Sci. Technol, accepted (2010). 17. M. Vaziri, O.Lindgren and A. Pizzi, Forest Products J. accepted. 18. M. Vaziri, O. Lindgren, A. Pizzi and H. R. Mansouri, J. Adhesion Sci.
Technol. 24, 1515 -1527 (2010).

Paper VII
H. R. Mansouri, A. Pizzi, J-M. Leban, L. Delmotte, O. Lindgren, M. Vaziri and P. Omrani, Causes of the characteristic improved water resistance in pine wood linear welded joints. J. Adhesion Sci. Technol. 25, 1987–1847 (2011).


Journal of Adhesion Science and Technology 25 (2011) 1987–1995brill.nl/jast
Causes for the Improved Water Resistance in Pine WoodLinear Welded Joints
H. R. Mansouri a,b, A. Pizzi a,∗, J. M. Leban c, L. Delmotte d, O. Lindgren e
and M. Vaziri e
a ENSTIB-LERMAB, Nancy Universités, 27 rue du Merle Blanc, B.P. 1041, 88051 Epinal, Franceb Department of Wood Science and Technology, University of Zabol, Zabol, Iran
c INRA-LERFOB, Centre de Recherche de Champenoux, 54280 Champenoux, Franced IS2M, CNRS LRC 7228, 15 rue Jean Starcky, B.P. 2488, 68057 Mulhouse, France
e Department of Wood Science, Lulea Technical University,Forskargatan 1, 931 87 Skelleftea, Sweden
Received in final form 28 October 2010
AbstractLinear vibration welding of good quality pine (Pinus sylvestris) wood from Sweden containing a smallproportion of a native mixture of terpenoic acids, known under the collective name of rosin, has been shownto yield joints of much upgraded water resistance. This has been shown to be due to the protecting influencethe molten rosin from the wood itself has on the welded interphase, because of the water repellency ofrosin. Joints of unusually high percentage wood failure but modest strength were obtained, rosin apparentlyreinforcing the welded interphase to yield weldline strengths always much higher than the strength of thesurrounding wood.© Koninklijke Brill NV, Leiden, 2011
KeywordsRosin, terpenoic acids, wood welding, water resistance, percentage wood failure, weather durability
1. Introduction
Mechanically-induced friction welding techniques have recently been applied tojoining wood, without the use of any adhesive [1–3]. While rotational wood dowelwelding [4–6] yields joints that possess a certain degree of long-term resistance towater [7–9] this is not the case for linear vibration welding of a flat wood surface toanother flat wood surface [1]. Thus, linear vibration-welded wood joints are rathersensitive to water attack, the joints being suitable exclusively for interior grade ap-
* To whom correspondence should be addressed. Tel.: (+33) 329296117; Fax: (+33) 329296138; e-mail:[email protected]
© Koninklijke Brill NV, Leiden, 2011 DOI:10.1163/016942410X544794

1988 H. R. Mansouri et al. / J. Adhesion Sci. Technol. 25 (2011) 1987–1995
plications such as furniture, in spite of their dry strength being at the structurallevel. There has been interest in overcoming this limitation without the use of syn-thetic waterproofing chemicals which would spoil the totally environment-friendlycharacteristics of such welded joints. A first improvement in water resistance wasobtained from the finding that a change in welding parameters, namely the use ofshorter welding times at a well-defined higher vibration frequency, yielded bothmuch improved dry strength and, particularly, much improved resistance to waterof the joint [10] and the causes for this were identified [11].
Recently, however, on welding good quality slow growing pine (Pinus sylvestris)from Sweden it was noted that a pale yellow substance originating from the timberitself flowed to and surrounded the weldline. These joints appeared to be unusuallystrong and resistant to water for a softwood. Softwoods have up to now been foundto weld well but to yield joints of lower strength than welded hardwoods. Thispaper deals with what had occurred and with testing the joints for strength andwater resistance.
2. Experimental
2.1. Preparation of Joints by Linear Vibration Welding and Their Test Results
Specimens composed of two pieces of slow growing pine (Pinus sylvestris) woodfrom Sweden, each of dimensions 200 mm × 20 mm × 20 mm, were welded to-gether to form a bonded joint of 200 mm × 20 mm × 40 mm dimensions by avibrational movement of one wood surface against another at a frequency of 150 Hz.When welding was achieved between 2.5 and 5 s (see tables) the vibration processwas stopped. The clamping pressure was then maintained for 60 s. The welded sam-ples were conditioned for one week in an environmental chamber (20◦C and 65%RH) before testing.
The parameter which was varied in the experiments was the welding time (WT =3 s and 3.5 s). The other parameters were: the pressure holding time maintainedafter the welding vibration had stopped (HT = 50 s); the welding pressure (WP)exerted on the surfaces (WP = 1.25 MPa); the holding pressure (HP) exerted on thesurfaces after the welding vibration had stopped (HP = 2.75 MPa); and the length ofdisplacement, or amplitude (A) imparted to one surface relative to the other duringvibrational welding (A = 2 mm). The frequency of welding was maintained at thehigh frequency of 150 Hz to ensure a much steeper rise of the weldline temperature[10, 11]. The equilibrium moisture content of the samples was 12% and remainedthe same before and after welding due to the sharp temperature gradient within thesample [10, 11]. The samples were welded in the longitudinal wood grain direction.
The specimens were cut according to the method described in European NormEN 302 [12] for bonded wood joints, i.e., with a welded overlap of 1 cm alongthe length of the joint and 2 cm width. Series of 10 samples so prepared for eachwelding time were tested dry and a series of other samples immersed in cold water(15◦C) and the average time the samples took to fall apart while immersed was mea-

H. R. Mansouri et al. / J. Adhesion Sci. Technol. 25 (2011) 1987–1995 1989
sured. The strength of the joints was measured in tension with an Instron universaltesting machine at a rate of 2 mm/min.
2.2. Solid State NMR
Solid state CPMAS (cross-polarisation/magic angle spinning) 13C-NMR spectra ofthe rosin extracted from the weldline by dissolving it in ethanol after separatingthe weldline by a microtome from the rest of the wood and mechanically pow-dering it were recorded on a Bruker AVANCE 300 spectrometer at a frequency of75.47 MHz. Chemical shifts were calculated relative to tetramethyl silane (TMS).The rotor was spun at 4 kHz on a double-bearing 7 mm Bruker probe. The spectrawere acquired with 5 s recycle delay, a 90◦ pulse of 5 µs and a contact time of 1 ms.The number of transients was 3000.
The 13C CP-MAS NMR spectra with dipolar dephasing [13] were recorded witha delay of 50 µs. The number of transients was 16 000.
2.3. X-Ray Microdensitometry
The X-ray microdensitometry equipment used consisted of an X-ray tube produc-ing ‘soft rays’ (low energy level) with long wave characteristics emitted through aberyllium window. These were used to produce an X-ray negative photograph ofapprox. 2 mm thick samples, conditioned to 12% moisture content by maintainingthem in a chamber at 65% relative humidity and 20◦C, at a distance of 2.5 m fromthe tube. This distance is important to minimise blurring of the image on the filmframe (18 × 24 cm) which was used. The usual exposure conditions were: 4 h,7.5 kW and 12 mA. Two calibration samples were placed on each negative pho-tograph in order to calculate wood density values. The specimens were tested inthis manner on an equipment consisting of an electric generator (INEL XRG3000),an X-ray tube (SIEMENS FK60-04 Mo, 60 kV-2.0 kW) and a KODAK negativefilm Industrex type M100.
3. Results and Discussion
The casual visual observation that a pale yellow substance originating from thetimber itself seemed to melt during friction welding and to move as far as a coupleof millimeters from the weldline and surround the weldline prompted a series ofanalyses. That such a material does indeed exist and flows around the weldlineduring welding, thus it melts and resolidifies, is shown in Figs 1 and 2. In thesetwo figures are shown the X-ray microdensitometry maps of welded pine sapwoodand heartwood. The weldline trace is wider in the two cases than that observedin normal welding indicating that an additional substance had melted and flowedslightly outwards away from the weldline but closely surrounding it. The case inFig. 1 for sapwood is more indicative as the greater permeability of sapwood allowsgreater movement of this molten material, giving a very wide weldline peak (Fig. 1).The peak associated with the heartwood is also wider than usual weldline traces but

1990 H. R. Mansouri et al. / J. Adhesion Sci. Technol. 25 (2011) 1987–1995
Figure 1. Example of an X-ray microdensitometry density map of a Pinus sylvestris sapwood weldedwood joint.
less than for sapwood. This is most likely due to both the lower permeability ofheartwood as well possibly to the higher molecular weight of meltable extractivespresent in it.
Tests were done first to determine if the effect of such a flowing material inher-ent to the pine wood used was beneficial or not to the welded joint performance,and second to determine the nature of this material. As the material seemed to beimpervious to water, water immersion tests of the welded joints were done. Theresults in Table 1 indicate that while the tensile strength of the joint is acceptablebut not high, but the percentage wood failure is really high. This is unusual asin linear wood welding generally joint strength is very high but percentage woodfailure is relatively low. The lower strength and exceptionally high wood failure(Table 1) indicate simply that the strength measured is that of the timber and that itis much weaker than the welded interphase. More notable, however, is the time thatthese joints are capable to withstand immersion in water without falling apart andstill having measurable strength. Thus, the heartwood sample in Table 1 survivedmore than 455 days in cold water without delaminating. The sapwood samples weresomewhat less performing, but they still kept together for 60 days immersion in coldwater. All these results (Table 1) compare very favorably with linear welded jointsin the past that first were not able to withstand water immersion for more than

H. R. Mansouri et al. / J. Adhesion Sci. Technol. 25 (2011) 1987–1995 1991
Figure 2. Example of an X-ray microdensitometry density map of a Pinus sylvestris heartwood weldedwood joint.
Table 1.Results on strength, percentage wood failure and durability in cold water for Pinus sylvestris weldedwood joints
Welding Average joint Wood Time in cold water withouttime (s) strength (MPa) failure (%) delamination (days)
Heartwood 2 + 1.5 = 3.5 4.1 ± 0.5∗ 86∗ >455Sapwood 2 + 1.5 = 3.5 3.5 ± 0.7∗∗ 100∗∗ >455Sapwood 2 + 1 = 3 1.8 ± 1.0∗∗ 42∗∗ >455
∗ Strength and wood failure after 210 days immersion in cold water.∗∗ Strength and wood failure after 60 days immersion in cold water.
30 min [1], and when the welding conditions were varied [7, 10, 11] they were ableto withstand 25 h cold water immersion. Figure 3 shows pine wood joint specimensthat were immersed in water for 18 days: the light colour indicating dryness of thewood surrounding the weldline.
As water immersion in the laboratory is indicative, but not really a proof, of theability of a joint to withstand wet/dry outdoor climatic variations, the welded pine

1992 H. R. Mansouri et al. / J. Adhesion Sci. Technol. 25 (2011) 1987–1995
Figure 3. Photographs of sections of Pinus sylvestris welded wood joints after immersion in waterfor 20 days showing the lighter wood colour zone surrounding the weldline indicating that no waterhad reached it. The differences between the three pieces are not due to any differences in weldingparameters but indicate the variability of flow of the molten rosin naturally contained in the samples.
Table 2.Results on strength and percentage wood failure for Pinus sylvestriswelded wood joints after exterior weather exposure
Average joint Average woodstrength (MPa) failure (%)
HeartwoodInitial 6.2 ± 2.0 86 ± 242 months 3.9 ± 1.4 73 ± 254 months 3.0 ± 0.8 63 ± 296 months 0.1 ± 0.0 0.0
SapwoodInitial 4.1 ± 1 33 ± 92 months 5.6 ± 0.8 58 ± 84 months 0.0 0.06 months 0.0 0.0
wood joints were exposed to the very wet central European winter/spring weather(min temperature −11◦C, max temperature +20◦C) for up to 6 months and sam-ples taken out and tested at regular intervals. The results obtained are shown inTable 2. The results in Table 2 show that welded heartwood samples yield a muchimproved field durability, the samples still showing residual strength of about halfof the original dry one after 4 months exterior exposure, while the percentage woodfailure decreases by only 30% during the same field exposure period. After this,

H. R. Mansouri et al. / J. Adhesion Sci. Technol. 25 (2011) 1987–1995 1993
Figure 4. Comparative solid phase CP-MAS 13C-NMR spectra of the Pinus sylvestris welded heart-wood interphase and of unwelded wood (control).
both strength and wood failure decrease markedly. The results for sapwood areworse, performance being maintained for only 2 months weather exposure. Thus,the new material, an extractive, involved improves dramatically water resistance ofthe joint but not to a level to classify the joint as unprotected exterior grade. How-ever, it can be qualified as a joint for protected semi-exterior application.
Heartwood is well known to contain a higher percentage of extractives thansapwood, especially terpenoid acids and tannins, explaining its superior water re-sistance. As tannins have been shown early on in wood welding research not tocontribute much to strength [14] this is the first indication that terpenes or ter-penoids might well be involved in the effect. The comparative CP-MAS 13C-NMRspectra of the heartwood welded interphase and of an unwelded wood control inFig. 4 show the differences that could indicate the nature of this substance. First,the heartwood welded interphase is richer in lignin, as expected [15], as can be seenfrom the higher peaks at 56, 132 and 153 ppm (the last peak is just a shoulder of the148 ppm peak of the furfural generated by welding) [1, 16, 17]. However, the smallpeaks in the 10–50 ppm range correspond to that of the new wood generated mater-ial. The signals in this 13C-NMR region are characteristic of terpenoid structures, inparticular of the sesquiterpenes constituting the material commonly known as rosin.Figure 5 shows the spectrum of the solvent-extracted material from the wood. Thespectrum coincides with that of rosin, a well known mixture of sesquiterpenoidssuch as abietic acid, pimaric and levopimaric acids and others. It is an item of com-

1994 H. R. Mansouri et al. / J. Adhesion Sci. Technol. 25 (2011) 1987–1995
Figure 5. CP-MAS 13C-NMR spectrum of the rosin extracted from the heartwood welded interphase.
merce derived from the pulp and paper industry, of yellow colour, translucent andmelting according to the literature between 60◦ and 120◦C depending on its purity.
4. Conclusions
Linear vibration welding of good quality pine (Pinus sylvestris) wood from Swedenshowed
1. Greatly improved water resistance of the welded joints.
2. That the upgraded water resistance of the welded joints was due to a smallproportion of a native mixture of terpenoic acids known under the collectivename of rosin.
3. That the upgraded water resistance of the welded joints is due to the protectinginfluence the molten rosin from the wood itself has on the welded interphase,this due to the water repellency of rosin.
4. That joints of unusually high percentage wood failure but modest strength wereobtained, the rosin apparently reinforcing the welded interphase to yield weld-line strengths always much higher than that of the surrounding wood.
H. R. Mansouri et al. / J. Adhesion Sci. Technol. 25 (2011) 1987–1995 1995
References
1. B. Gfeller, M. Zanetti, M. Properzi, A. Pizzi, F. Pichelin, M. Lehmann and L. Delmotte, J. Adhe-sion Sci. Technol. 17, 1573–1590 (2003).
2. J.-M. Leban, A. Pizzi, S. Wieland, M. Zanetti, M. Properzi and F. Pichelin, J. Adhesion Sci. Tech-nol. 18, 673–685 (2004).
3. C. Ganne-Chedeville, G. Duchanois, A. Pizzi, J. M. Leban and F. Pichelin, J. Adhesion Sci. Tech-nol. 22, 169–179 (2008).
4. A. Pizzi, J.-M. Leban, F. Kanazawa, M. Properzi and F. Pichelin, J. Adhesion Sci. Technol. 18,1263–1278 (2004).
5. F. Kanazawa, A. Pizzi, M. Properzi, L. Delmotte and F. Pichelin, J. Adhesion Sci. Technol. 19,1025–1038 (2005).
6. C. Ganne-Chedeville, A. Pizzi, A. Thomas, J.-F. Leban, J.-F. Bocquet, A. Despres and H. R. Man-souri, J. Adhesion Sci. Technol. 19, 1157–1174 (2005).
7. A. Pizzi, A. Despres, H. R. Mansouri, J.-M. Leban and S. Rigolet, J. Adhesion Sci. Technol. 20,427–436 (2006).
8. P. Omrani, J.-F. Bocquet, A. Pizzi, J.-M. Leba and H. R. Mansouri, J. Adhesion Sci. Technol. 21,923–933 (2007).
9. P. Omrani, H. R. Mansouri and A. Pizzi, Holz Roh Werkstoff 66, 161–162 (2008).10. H. R. Mansouri, P. Omrani and A. Pizzi, J. Adhesion Sci. Technol. 23, 63–70 (2009).11. P. Omrani, A. Pizzi, H. R. Mansouri, J.-M. Leban and L. Delmotte, J. Adhesion Sci. Technol. 23,
827–837 (2009).12. European Norm EN 302-1, Adhesives for load-bearing timber structures (2004).13. S. J. Opella and H. M. Frey, J. Am. Chem. Soc. 101, 5854 (1979).14. S. Wieland, B. Shi, A. Pizzi, M. Properzi, M. Stampanoni, R. Abela, X. Lu and F. Pichelin, Forest
Products J. 55, 84–87 (2005).15. D. Fengel and G. Wegener, Wood: Chemistry, Ultrastructure, Reactions. De Gruyter, Berlin
(1989).16. L. Delmotte, C. Ganne-Chedeville, J.-M. Leban, A. Pizzi and F. Pichelin, Polymer Degrad. Stabil.
93, 406–412 (2008).17. L. Delmotte, H. R. Mansouri, P. Omrani and A. Pizzi, J. Adhesion Sci. Technol. 23, 1271–1279
(2009).