Water Quality Monitoring and Analysis of the Bennett ... Quality Monitoring and Analysis of the...
31
Quality Assurance Project Plan for Water Quality Monitoring and Analysis of the Bennett Spring Watershed and Recharge Area The Ozarks Environmental and Water Resources Institute (OEWRI) Missouri State University In support of the Southwest Missouri Council of Governments’ Clean Water Act Section 604(b) grant entitled: Bennett Spring Branch Sub-Watershed: Planning for Wastewater Treatment and Water Quality Education G07-WQM-01 February 20, 2007 OEWRI QA07-001 Copy 1 of 1
Transcript of Water Quality Monitoring and Analysis of the Bennett ... Quality Monitoring and Analysis of the...

Quality Assurance Project Plan for
Water Quality Monitoring and Analysis of the Bennett Spring Watershed and Recharge Area
The Ozarks Environmental and Water Resources Institute (OEWRI)
Missouri State University
In support of the Southwest Missouri Council of Governments’ Clean Water Act Section 604(b) grant entitled: Bennett Spring Branch
Sub-Watershed: Planning for Wastewater Treatment and Water Quality Education
G07-WQM-01
February 20, 2007
OEWRI QA07-001
Copy 1 of 1

Bennett Springs QAPP (Final)
February 2007 Page 2 of 31
Prepared by: ________________________________ _____ ____________________ Marc R. Owen, OEWRI Project Supervisor Date ________________________________ _____ ____________________ Heather Hoggard, OEWRI QA/QC Manager Date Approvals Approved by: _____________________________________ ____________________ Dr. Robert T. Pavlowsky, OEWRI Director, MSU Date Faculty - GGP, Principal Investigator ______________________________________ ____________________ Ms. Stacia Bax, Project Manager Date Missouri Department of Natural Resources (DNR) ______________________________________ ____________________ Mr. John Madras, Division Quality Control Officer Date DNR ______________________________________ ____________________ Ms. Trish Rielly, QAPP Manager Date DNR ______________________________________ ____________________ Anita Davis, Project Administrator Date Southwest Missouri Council of Governments

Bennett Springs QAPP (Final)
February 2007 Page 3 of 31
TABLE OF CONTENTS Prepared by: .................................................................................................................. 2 Approvals....................................................................................................................... 2 List of Tables ................................................................................................................. 4 List of Figures ............................................................................................................... 4 Distribution List............................................................................................................. 5 PROJECT MANAGEMENT ............................................................................................ 6
Project and Task Organization ................................................................................. 6 Problem Definition and Background........................................................................ 6
PROJECT AND TASK DESCRIPTION .......................................................................... 7 Project Schedule and Time Line............................................................................... 7 Work Schedule for Sample Collection and Analysis .............................................. 7 Sampling Sites and Frequency................................................................................. 8 Target Water Quality Indicators................................................................................ 8
Field measured analytes: ...................................................................................... 8 Laboratory measured analytes: ............................................................................ 9
Quality Objectives and Criteria for Measurement Data .......................................... 9 Data Quality Indicators, Definitions ....................................................................... 10 Special Training and Certification.......................................................................... 10 Documents and Records ........................................................................................ 11
DATA GENERATION AND ACQUISITION .................................................................. 12 Sampling Process Design....................................................................................... 12 Sampling Methods................................................................................................... 12 Sample Handling and Custody............................................................................... 13 Analytical Methods .................................................................................................. 13 Quality Control......................................................................................................... 14 Instrument and Equipment Testing, Inspection, and Maintenance..................... 14 Instrument and Equipment Calibration and Frequency ....................................... 15 Inspection and Acceptance of Supplies and Consumables ................................ 15 Non-direct Measurements....................................................................................... 15 Data Management .................................................................................................... 15
ASSESSMENT AND OVERSIGHT............................................................................... 16 Assessments and Response Actions .................................................................... 16 Reports to Management.......................................................................................... 17
DATA VALIDATION AND USABILITY......................................................................... 17 Data Review, Verification and Validation............................................................... 17 Verification and Validation Methods ...................................................................... 18 Reconciliation with User Requirements ................................................................ 18
TABLES........................................................................................................................ 19 FIGURES ...................................................................................................................... 29 APPENDIX A. Standard Operating Procedures (SOPs) cited in this document.... 31

Bennett Springs QAPP (Final)
February 2007 Page 4 of 31
List of Tables Table 1. Personnel, Responsibilities and QAPP Receipt. ............................................ 19 Table 2. Project Schedule Time Line............................................................................ 20 Table 3. Sample Site Summary..................................................................................... 21 Table 4. Sampling Techniques...................................................................................... 22 Table 5. Measurement Performance Criteria. .............................................................. 23 Table 6. Sample Collection Conditions for Analytes..................................................... 25 Table 7. Quality Control Corrective Action Plan. (Standard Methods, 2005)................ 26 Table 8. Maintenance, Testing, and Inspection of Sampling Equipment and Analytical Instruments. .................................................................................................................. 27 Table 9. Instruments Requiring Calibration. ................................................................. 27 List of Figures Figure 1. Organizational chart showing lines of authority and reporting responsibilities....................................................................................................................................... 28 Figure 2. Niangua River Basin ...................................................................................... 29 Figure 3. Bennett Spring Recharge Area Sample Sites ................................................ 30
Bennett Springs QAPP (Final)
February 2007 Page 5 of 31
Distribution List Stacia Bax Missouri Department of Natural Resources (573-526-1386) Project Manager Trish Rielly Missouri Department of Natural Resources (573-526-5297) QAPP Manager John Madras Missouri Department of Natural Resources (573-522-9911) Division Quality Control Officer Dr. Robert T. Pavlowsky OEWRI Director, MSU (417-836-8473) Marc R. Owen OEWRI Project Supervisor (417-836-3197) Heather Hoggard OEWRI QA Manager (417-836-3198) Dr. John Steiert MSU Biology Faculty (417-836-6916) Dr. Richard N. Biagioni MSU Chemistry Faculty (417-836-4649) Anita Davis Project Administrator (417-836-6900) Dr. William A. Alter III Director, MSU Office of Sponsored Research and (417-836-5972) Programs
Bennett Springs QAPP (Final)
February 2007 Page 6 of 31
PROJECT MANAGEMENT
Project and Task Organization See Table 1 for personnel responsibilities, contact information and QAPP copy
receipt. The organizational chart showing lines of authority and reporting responsibilities is shown in Figure 1. Problem Definition and Background
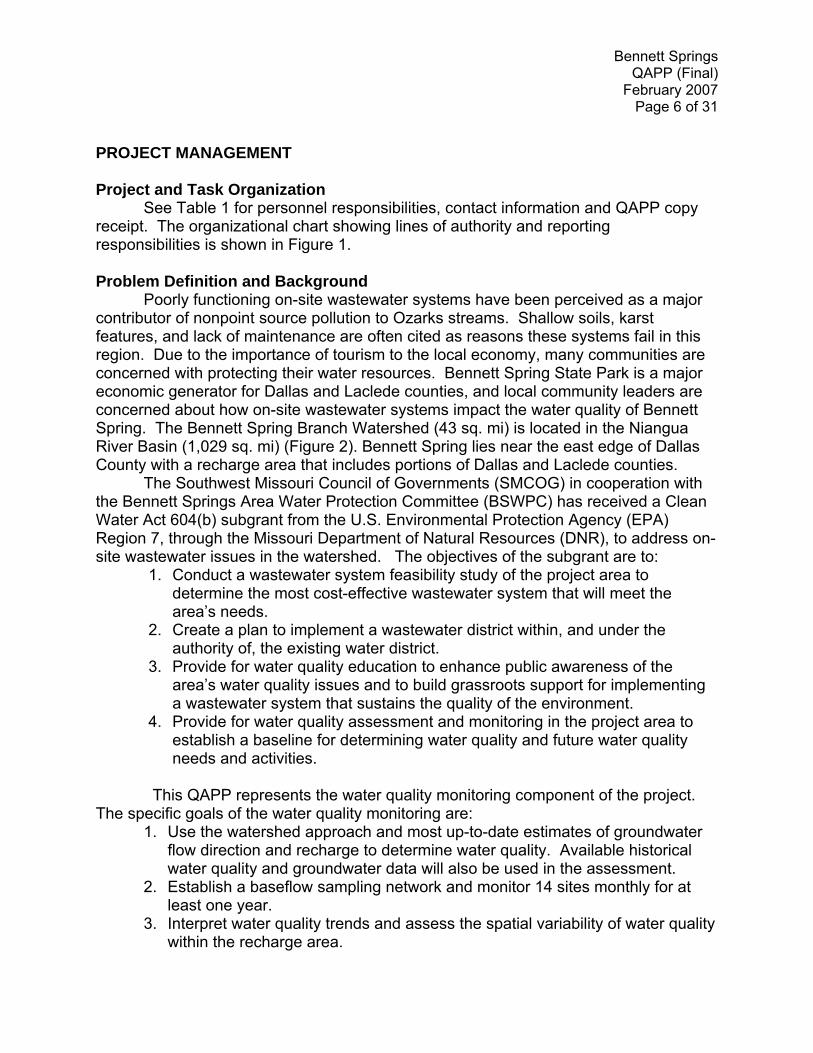
Poorly functioning on-site wastewater systems have been perceived as a major contributor of nonpoint source pollution to Ozarks streams. Shallow soils, karst features, and lack of maintenance are often cited as reasons these systems fail in this region. Due to the importance of tourism to the local economy, many communities are concerned with protecting their water resources. Bennett Spring State Park is a major economic generator for Dallas and Laclede counties, and local community leaders are concerned about how on-site wastewater systems impact the water quality of Bennett Spring. The Bennett Spring Branch Watershed (43 sq. mi) is located in the Niangua River Basin (1,029 sq. mi) (Figure 2). Bennett Spring lies near the east edge of Dallas County with a recharge area that includes portions of Dallas and Laclede counties.
The Southwest Missouri Council of Governments (SMCOG) in cooperation with the Bennett Springs Area Water Protection Committee (BSWPC) has received a Clean Water Act 604(b) subgrant from the U.S. Environmental Protection Agency (EPA) Region 7, through the Missouri Department of Natural Resources (DNR), to address on-site wastewater issues in the watershed. The objectives of the subgrant are to:
1. Conduct a wastewater system feasibility study of the project area to determine the most cost-effective wastewater system that will meet the area’s needs.
2. Create a plan to implement a wastewater district within, and under the authority of, the existing water district.
3. Provide for water quality education to enhance public awareness of the area’s water quality issues and to build grassroots support for implementing a wastewater system that sustains the quality of the environment.
4. Provide for water quality assessment and monitoring in the project area to establish a baseline for determining water quality and future water quality needs and activities.
This QAPP represents the water quality monitoring component of the project.
The specific goals of the water quality monitoring are: 1. Use the watershed approach and most up-to-date estimates of groundwater
flow direction and recharge to determine water quality. Available historical water quality and groundwater data will also be used in the assessment.
2. Establish a baseflow sampling network and monitor 14 sites monthly for at least one year.
3. Interpret water quality trends and assess the spatial variability of water quality within the recharge area.

Bennett Springs QAPP (Final)
February 2007 Page 7 of 31
During the 18 month period the water quality monitoring aspects will be addressed in this QAPP where the OEWRI will identify a baseline water quality trends and conduct an assessment of pollution sources (within the first six months). Monthly water monitoring will continue throughout the second year (month 7 through month 18). Once the monitoring is completed, the University, on behalf of the SMCOG, will submit a final water monitoring report. The yearlong water monitoring schedule will provide valuable data to analyze changes in water quality within the project area. In addition, the 14 newly identified water monitoring sites in and around Bennett Spring’s 3-mile project area could be used in the future by Missouri Stream Teams, or other groups, to provide valuable long-term data and analysis. The Bennett Spring community leaders and its collaborating partners envision this project as a first step toward facilitating water quality protection activities and data gathering throughout the Niangua River Watershed.
PROJECT AND TASK DESCRIPTION Project Schedule and Time Line
This project is organized into four phases. Phase 1 (November 2006 – February 2007) will include conducting a watershed assessment of establishment of sample sites and conducting a readiness assessment. Phase 2 (March 2007) will be establishing initial baseline water quality monitoring for nutrients, bacteria, temperature, dissolved oxygen, pH, conductivity, salinity, turbidity and velocity (to estimate discharge). Phase 3 (April 2007 – March 2008) will include the monthly monitoring of water chemistry and velocity along with a minimum of six nutrient sampling events and six bacteria sampling events occurring during baseflow conditions At 14 sites. Phase 4 will be preparing the final report. See Table 2 for project schedule and time line.
Work Schedule for Sample Collection and Analysis
Water chemistry parameters: temperature, dissolved oxygen, pH, conductivity, salinity, turbidity with velocity (to estimate discharge) will be monitored at the 14 sites described below once in phase 2 and monthly during phase 3 (for a total of 13 readings). Water chemistry parameters will be monitored using a Horiba U-22XD multi-parameter probe. These data will be stored in the data logger associated with the instrument and downloaded in the office. Velocity measurements will be gathered using a Global Water FP201 Flow Meter and staff gage to estimate discharge at each site. Site specific data will be hand entered onto flow data record sheets provided and entered into a spread sheet in the office.
Water quality samples for nutrients (total phosphorus, total nitrogen) and bacteria (E. coli) will be collected at the 14 sites described below once during phase 2 and six times during phase 3. Surface water grab samples will be collected during baseflow using 500 mL bottles and immediately acidified to a pH <2 using sulfuric acid and stored on ice during the remainder of the trip. A 100 ml grab sample for bacteria will also be collected with a Whirl-Pak® Coli-test bag.
At the laboratory, the collected samples will be stored in refrigerators until they are analyzed by MSU laboratory assistants. Holding times will be strictly adhered to, to
Bennett Springs QAPP (Final)
February 2007 Page 8 of 31
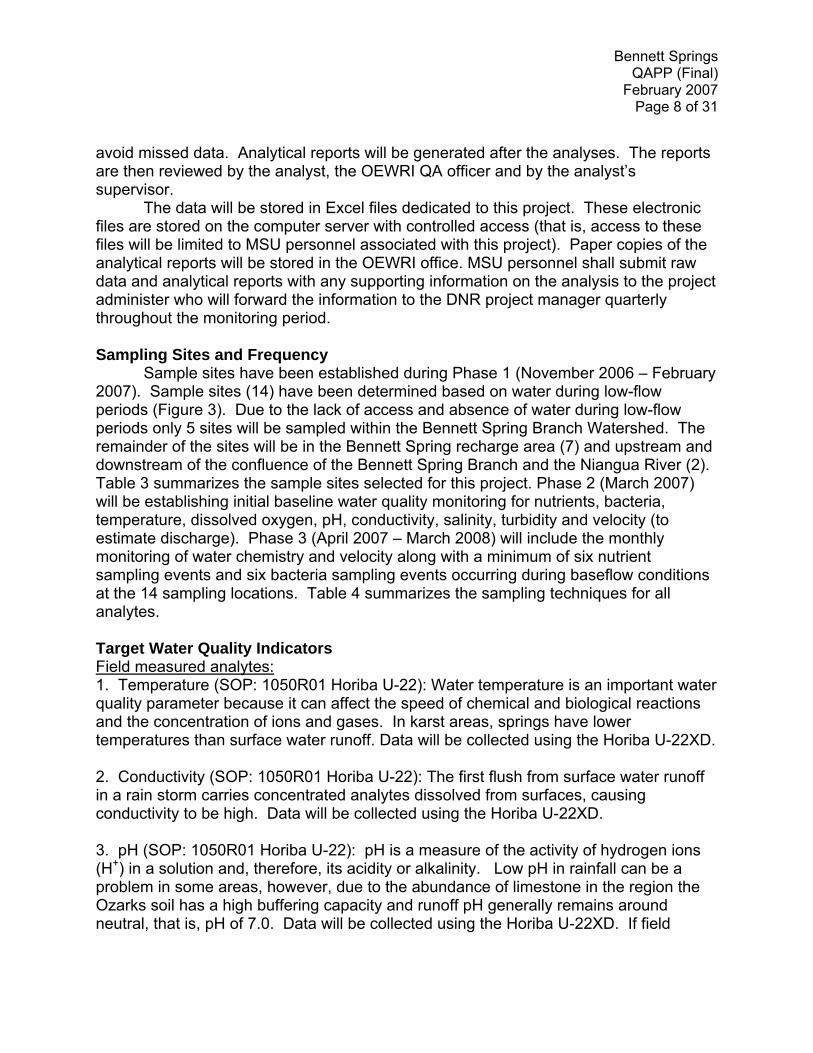
avoid missed data. Analytical reports will be generated after the analyses. The reports are then reviewed by the analyst, the OEWRI QA officer and by the analyst’s supervisor.
The data will be stored in Excel files dedicated to this project. These electronic files are stored on the computer server with controlled access (that is, access to these files will be limited to MSU personnel associated with this project). Paper copies of the analytical reports will be stored in the OEWRI office. MSU personnel shall submit raw data and analytical reports with any supporting information on the analysis to the project administer who will forward the information to the DNR project manager quarterly throughout the monitoring period.
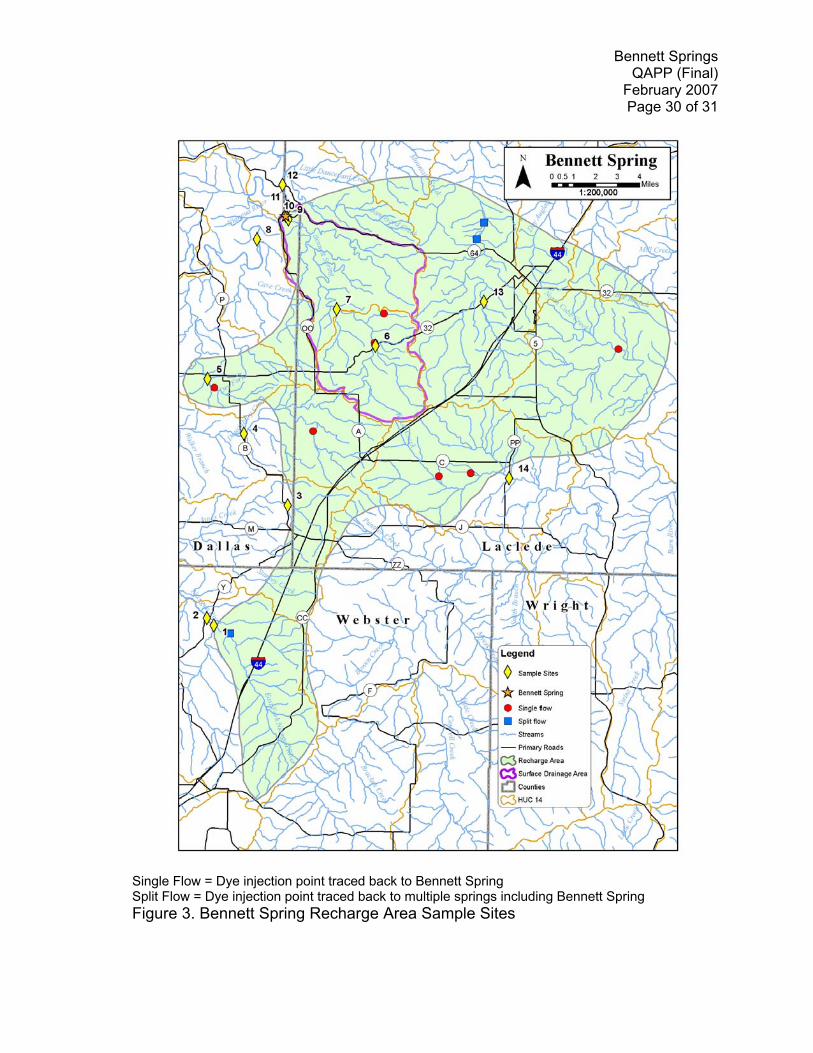
Sampling Sites and Frequency
Sample sites have been established during Phase 1 (November 2006 – February 2007). Sample sites (14) have been determined based on water during low-flow periods (Figure 3). Due to the lack of access and absence of water during low-flow periods only 5 sites will be sampled within the Bennett Spring Branch Watershed. The remainder of the sites will be in the Bennett Spring recharge area (7) and upstream and downstream of the confluence of the Bennett Spring Branch and the Niangua River (2). Table 3 summarizes the sample sites selected for this project. Phase 2 (March 2007) will be establishing initial baseline water quality monitoring for nutrients, bacteria, temperature, dissolved oxygen, pH, conductivity, salinity, turbidity and velocity (to estimate discharge). Phase 3 (April 2007 – March 2008) will include the monthly monitoring of water chemistry and velocity along with a minimum of six nutrient sampling events and six bacteria sampling events occurring during baseflow conditions at the 14 sampling locations. Table 4 summarizes the sampling techniques for all analytes. Target Water Quality Indicators Field measured analytes: 1. Temperature (SOP: 1050R01 Horiba U-22): Water temperature is an important water quality parameter because it can affect the speed of chemical and biological reactions and the concentration of ions and gases. In karst areas, springs have lower temperatures than surface water runoff. Data will be collected using the Horiba U-22XD.
2. Conductivity (SOP: 1050R01 Horiba U-22): The first flush from surface water runoff in a rain storm carries concentrated analytes dissolved from surfaces, causing conductivity to be high. Data will be collected using the Horiba U-22XD.
3. pH (SOP: 1050R01 Horiba U-22): pH is a measure of the activity of hydrogen ions (H+) in a solution and, therefore, its acidity or alkalinity. Low pH in rainfall can be a problem in some areas, however, due to the abundance of limestone in the region the Ozarks soil has a high buffering capacity and runoff pH generally remains around neutral, that is, pH of 7.0. Data will be collected using the Horiba U-22XD. If field

Bennett Springs QAPP (Final)
February 2007 Page 9 of 31
analysis of pH cannot occur, then the data will be listed as missing and a comment will be entered into the field notebook. 4. Turbidity (SOP: 1050R01 Horiba U-22): Turbidity is a measure of the clarity of water and can be caused by suspended materials, such as clay, silt, and organic matter. High turbidity may result from storm events. Data will be collected using the Horiba U-22XD 5. Dissolved Oxygen (SOP: 1050R01 Horiba U-22): The level of dissolved oxygen (D.O.) in water affects aquatic life, chemical activity, and pollutant behavior. Acceptable levels for Missouri streams are > 5 mg D.O. per L. for warm and cool water fisheries and >6 mg/L for Cold water fisheries. 6. Salinity (SOP: 1050R01 Horiba U-22): High salt concentrations are found in wastewater. 7. Global Water Flow Meter (SOP: 2060R01 Flow Meter): Velocity must be measured
to estimate discharge at sample location to understand loads/yields.
Laboratory measured analytes: 1. Total Phosphorus (SOP: 3010R01 Total P): A spectrophotometer will be used to
analyze for TP. 2. Total Nitrogen (SOP: 3020R01 Total N): Total nitrogen is a measure of organic nitrogen, ammonia, nitrite, and nitrate nitrogen. A spectrophotometer will be used to analyze for TN. 3. Escherichia coli (SOP: 4010R01 Ecoli IDEXX): The presence of E. coli in water samples is an indicator of fecal contamination. The IDEXX Quanti-Tray/2000 system is used to analyze samples for E. coli levels. 4. Total Coliform (SOP: 4010R01 Ecoli IDEXX): The presence of total coliform in water samples is an indicator of fecal contamination. The IDEXX Quanti-Tray/2000 system is used to analyze samples for total coliform levels. Quality Objectives and Criteria for Measurement Data The objective of this project is to establish a baseline data for the Bennett Springs Recharge Area during baseflow conditions that will indicate water quality of the shallow aquifer providing flow to the spring and stream. These data will be used to compare sites to assess the spatial variability of water quality within the recharge area. All field and laboratory analytical data are evaluated based on established measurement performance criteria as listed in Table 5.
Bennett Springs QAPP (Final)
February 2007 Page 10 of 31
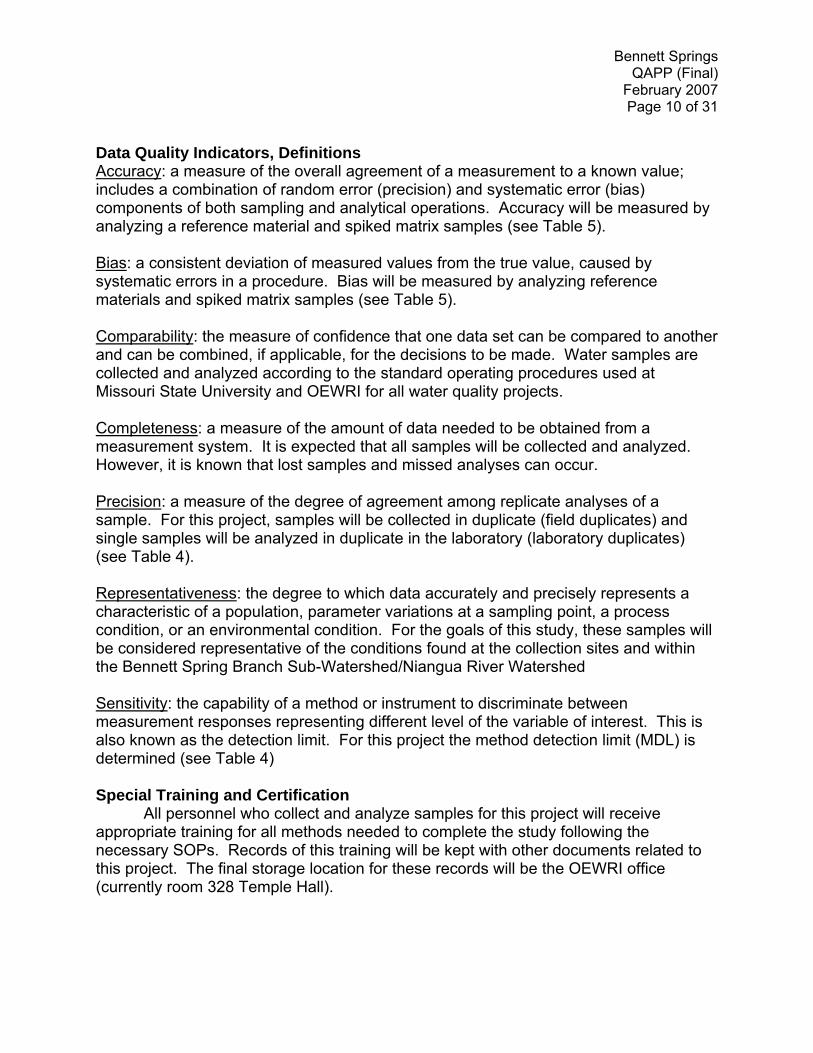
Data Quality Indicators, Definitions Accuracy: a measure of the overall agreement of a measurement to a known value; includes a combination of random error (precision) and systematic error (bias) components of both sampling and analytical operations. Accuracy will be measured by analyzing a reference material and spiked matrix samples (see Table 5). Bias: a consistent deviation of measured values from the true value, caused by systematic errors in a procedure. Bias will be measured by analyzing reference materials and spiked matrix samples (see Table 5). Comparability: the measure of confidence that one data set can be compared to another and can be combined, if applicable, for the decisions to be made. Water samples are collected and analyzed according to the standard operating procedures used at Missouri State University and OEWRI for all water quality projects. Completeness: a measure of the amount of data needed to be obtained from a measurement system. It is expected that all samples will be collected and analyzed. However, it is known that lost samples and missed analyses can occur. Precision: a measure of the degree of agreement among replicate analyses of a sample. For this project, samples will be collected in duplicate (field duplicates) and single samples will be analyzed in duplicate in the laboratory (laboratory duplicates) (see Table 4). Representativeness: the degree to which data accurately and precisely represents a characteristic of a population, parameter variations at a sampling point, a process condition, or an environmental condition. For the goals of this study, these samples will be considered representative of the conditions found at the collection sites and within the Bennett Spring Branch Sub-Watershed/Niangua River Watershed Sensitivity: the capability of a method or instrument to discriminate between measurement responses representing different level of the variable of interest. This is also known as the detection limit. For this project the method detection limit (MDL) is determined (see Table 4)
Special Training and Certification
All personnel who collect and analyze samples for this project will receive appropriate training for all methods needed to complete the study following the necessary SOPs. Records of this training will be kept with other documents related to this project. The final storage location for these records will be the OEWRI office (currently room 328 Temple Hall).
Bennett Springs QAPP (Final)
February 2007 Page 11 of 31
Documents and Records The documents and records produced for this project will be stored in the OEWRI
office in a file entitled: “Water Quality Monitoring and Analysis of the Bennett Spring Watershed and Recharge Area”. The documents listed below will be included in this file. Electronic copies of all reports, plans and procedures will be issued to all individuals on the distribution list, unless otherwise requested. A paper copy of each document will be kept on file in the OEWRI office. Documents and records will be retained for a minimum of five years. After that time the documents will be reviewed and a decision to retain the records for a longer period will be made. Electronic records are retained on the server at MSU. There is in place a system to automatically backup all data files. Quality Assurance Project Plan (QAPP): This document will be updated as needed by the QA manager. The DNR project manager, through the project administer, must then approve any updates prior to those changes being distributed. Updates may require that the document be reprinted and distributed to those listed in Table 1. If the changes do not alter the plan the QA manager may use e-mail to notify the personnel on the distribution list of the changes. Standard Operating Procedures (SOPs): Analytical, collection, and other procedures are documented in individual SOPs. These documents are prepared, edited, and updated by the QA manager. Project personnel are required to review all SOPs that pertain to their functions and responsibilities. Outdated SOPs are archived in the OEWRI office in both a paper and electronic versions. SOPs used for this project are attached in Appendix B. Chain of Custody forms: Chain of custody / sample collection forms are completed for each sample collection run. These forms are stored with the project data in the OEWRI office. Field Notebooks: Field notebooks will be completed for this project. Any data related to this project will be recorded within the book. The field personnel will keep appropriate records of field events and include such items as sites visited, time of arrival, samples collected, weather conditions, etc. The analyst should sign or initial for each date that the notebook is used. These notebooks will be archived with the project records in the OEWRI office. Laboratory Bench sheets: These forms are generated with each analysis. They may include forms, computer printouts, or other records of analytical procedures. Sample and quality control data will be included on these forms. These are stored with the project data. Quality Assurance documents: Any document that describes QA processes in the field or laboratory and related to this project will be stored in the OEWRI office with other

Bennett Springs QAPP (Final)
February 2007 Page 12 of 31
records for this project. Some records are continuous, for example, instrument maintenance data, and remain with the instrument in log books that are attached to that instrument. Final and Quarterly Progress reports: A copy of all progress, quarterly and final reports will be kept in the OEWRI office. These reports may also include presentations given at conferences; copies or the original will be stored in the OEWRI office. The DNR project manager must review all reports, presentations, media releases, etc. prior to publication or distribution. These items must be sent to the project administer who will forward the information to the DNR project manager. DATA GENERATION AND ACQUISITION Sampling Process Design
The objective of this project is to establish a baseline data for the Bennett Springs Recharge Area during base flow conditions that will indicate water quality of the shallow aquifer providing flow to the spring and stream. These data will be used to compare sites to assess the spatial variability of water quality within the recharge area. The 14 sample sites were chosen based on:
1. Road access 2. Proximity to known dye-trace locations 3. Distributed throughout the recharge area 4. Having permanent year round flow
Sampling Methods Surface water samples for bacteriology analyses are collected by the grab sampling technique (SOP: 4010R01 Ecoli IDEXX.doc) from flowing water. The 100 mL Coli-Test bags are either dipped into the stream by hand or at the end of a sampling pole. Duplicate samples will be taken every tenth sample. Care should be taken to not skim the surface while collecting samples. The bacteriology Coli-Test bags are purchased and will be discarded after use. These bags are sterilized by the manufacturer. Surface water samples for nutrient analysis are collected by the grab sampling technique (SOP: 1040R01 Water Sampling) using 500 mL plastic bottles from flowing water. Duplicate samples will be taken every tenth sample.
A Horiba U-22XD multi-parameter water quality testing system (SOP: 1050R01 Horiba U-22) will be used to collect temperature, pH, turbidity, D.O., salinity and conductivity data in the field. Duplicate readings will be taken every tenth sample.
Discharge will be estimated using the Global Water FP201 Flow Meter (SOP: 2060R01 Flow Meter) from mean velocity and a stage gage to measure water depth at the sample site.

Bennett Springs QAPP (Final)
February 2007 Page 13 of 31
Sample Handling and Custody See Table 6 for sample handling conditions for each analyte of interest for this project. Field measurements of velocity and stage will be recorded on the flow record sheet provided in the SOP to estimate discharge. Data collected and stored on the Horiba’s data-logger will remain in the custody of the field personnel until return to the laboratory or office. At the laboratory or office the data will be downloaded to computer program files. Water samples are collected in appropriate bottles or bags for each parameter. A label will be affixed to each container (see below for example) and will contain the following information: date and time of collection, site code, project, list of analytes, and sample collector’s initials (see SOP: 1040R01 Water Sampling for procedures for completing the bottle label). After collection, the proper preservative is added to the bottle, the bottles are placed into a cooler containing ice, and the samples are transported to the laboratory.
Date: ____________ Time: ____________ Site: ____________ Project: ___________
Analyze for: _________________________ Collected by:_________________________ Missouri State University Ozarks Environmental and Water Resources Institute
Example of bottle label.
A Sample Collection form (see SOP: “1030R01 Chain of Custody.doc”) will be completed for each set of samples. The chain of custody section of the sample collection form will be completed as the samples are transferred at the laboratory following the instructions outlined in the SOP (1030R01 Chain of Custody).
Sample bottles that are not used for immediate analysis will be stored in the laboratory refrigerator. Upon completion of the analyses, including review of data, the sample may be discarded. Re-analysis can occur if sample remains in the bottle and the holding time has not been exceeded. At no time will a re-analysis take place on samples when the holding time has expired. Analytical Methods See Table 4 for a list of analytes, SOPs, and method performance criteria. Analyses are completed as soon as possible after collection and within the allowable holding times. Samples are not disposed of until after the analyses are complete and data has been reviewed. If a sample is analyzed after the holding time has expired a comment will be recorded on the data analysis bench sheet. When problems arise with the analytical method, for example, blanks exceeding the detection limit, the procedures will be reviewed by the analyst and the laboratory supervisor and/or the Project QA Manager. Corrections will be made and samples re-analyzed if possible. The problem will be documented in the instrument log book.
Bennett Springs QAPP (Final)
February 2007 Page 14 of 31
Quality Control Quality control is the overall system of technical activities that measures the attributes and performance of a process, item, or service against defined standards to verify that they meet the stated requirements established by the customer. This system of activities and checks is used to ensure that the measurement systems are maintained within prescribed limits, provide protection against unforeseen conditions and ensure the results are of acceptable quality. The quality control checks used in this project are listed in Table 4. Duplicate samples, field and lab, will be used as a check for precision. Matrix spike samples and reference samples (LFM and LFB in Table 4, respectively) are used to measure bias and accuracy. Sensitivity is determined by analyzing equipment, method and reagent blanks. One spiked sample will be analyzed for every 20 samples analyzed. Reference samples and laboratory duplicates will be analyzed at a frequency of one per 10 samples analyzed. One field duplicate will be collected for every ten samples collected. Quality control data outside the acceptance limits or exhibiting a trend are evidence of unacceptable error in the analytical process. Corrective action will be taken as soon as possible to determine and eliminate the source of the error. Corrective actions begin with the analyst, who is responsible for knowing when the analytical process is out of control (Standard Methods, 2005). See Table 6 for error types and corrective action measures. All corrective actions taken will be recorded in the instrument log book to be used as a reference to avoid repeating the same error. If a sample batch is reanalyzed because a QC sample was out of control, the second set of results will be reported (if all QC are within control limits) for the project. However, a comment will be written on the data sheet that the data is a reanalysis and the reason for the reanalysis will be recorded. The initial analysis data sheet will be retained for the QC file associated with the project. All QC data, in and out of control, will be recorded on the control charts. Instrument and Equipment Testing, Inspection, and Maintenance Field and laboratory equipment and instruments will be maintained to prevent down time and missed sample data. See Table 7 for a list of instrumentation and equipment and the approximate schedule for preventive maintenance. Preventive maintenance procedures are also listed in some SOPs. Preventive maintenance activities will be recorded in the log book associated with the instrument. After a corrective activity has been completed, the instrument will be tested to ensure that it functions appropriately for the analysis in question. For routine maintenance procedures an adequate supply of spare parts will be kept on hand. When parts are used up, new ones will be purchased before they are needed. If there is a major instrument break down the manufacturer may be contacted to perform a service call for repairs.

Bennett Springs QAPP (Final)
February 2007 Page 15 of 31
Instrument and Equipment Calibration and Frequency Laboratory and field analytical instrumentation require calibration to ensure quality data. Calibration procedures follow the instrument manufacturer’s recommendations.
Initial calibrations of field and laboratory instruments will be performed before each batch of samples. If linear regression is used to fit the calibration curve, then the minimum correlation coefficient value should be 0.995. To determine if calibration points are acceptable, compare each point to the curve and recalculate. An acceptable point will result in a calculated value of the expected value ± 10% (Standard Methods, 2005).
Calibration verification will be done by analyzing a calibration standard periodically to ensure that the instrument performance has not changed. Analysis of the verification standard will be after every 10 samples during the analytical run. A verification standard will be acceptable if its value is within ±10% of the expected value.
See Table 8 for a list of instruments that require calibration. The type of calibration is listed in the table and a detailed description of the calibration procedure is included in the respective SOPs for the analyte in question. Inspection and Acceptance of Supplies and Consumables Adequate quantities of supplies and consumables are inventoried for this project. When the number of items needed begins to run low, replacements are ordered from the vendor. Chemicals are ordered as needed for laboratory analyses. Reference standards for calibrating instruments are received with “certificates of analysis” documents from the supplier. The IDEXX system for the E. coli analysis requires the use of Quanti-Tray/2000. These are purchased from IDEXX Laboratories. New batches of the Quanti-Trays are tested with positive and negative control test organisms. The acceptable result for these tests is the correct identification and enumeration of the test organisms. Other supplies, for example, bottles, filter paper, and pH test strips, are not tested prior to use. Analysts will employ good laboratory practices and observe all processes for changes that may be caused by a new batch of supply items. If a process does appear to be affected by a supply item, a corrective action response will be initiated. This may require discontinuing the use of that item and ordering replacement items. Non-direct Measurements There are no non-direct measurements required for this project. However, the project assistant may want to obtain weather data from the National Weather Service to check rain totals. Data Management Data are generated in many steps from sample collection to laboratory analyses, calculations and observations. All data are recorded on laboratory bench sheets, field
Bennett Springs QAPP (Final)
February 2007 Page 16 of 31
notebooks, in instrument data loggers or on instrument software. Following are the procedures that will be followed for managing data for each type of data collection. Field notebooks: The field notebook will be similar to item number 8152-55 manufactured by Sokkia. This book has water resistant surfaced pages. Notes are written in indelible ink. Personnel will record all field observations in this book at the time of their visit. The date, time, sites visited, samples taken, other personnel present, weather conditions, and other information deemed necessary and appropriate will be recorded. The analyst should initial or sign each page. The notebook will be dedicated to this project. When the book is filled or the project completed, the notebook will be stored in the OEWRI office.
Laboratory bench sheets: Bench sheets will be completed for every analysis. Methods that require bench sheets have the sheets available as attachments within the SOP. The analyst should record all information on the forms using indelible ink. QC calculations, for example, spike percent recovery, will be recorded on the form in the “Comments” section of the bench sheet. Errors are crossed out with a single line, the correct entry is made and the analyst initials the correction. Completed data are transcribed into an Excel spreadsheet for further use. Completed bench sheets are stored with the project file in the OEWRI office.
Field Instrumentation: Data internally on the Horiba’s data-logger are brought back to the office or laboratory where the data will be downloaded to a computer file. A print out of the data will be generated which will be used for data review. Other than transferring the data to an Excel file, there is no way to save the raw instrument data for future use. When the data logger is full (from this and other projects) the data is purged from the instrument. The completed and reviewed data printouts will be stored in the project file in the OEWRI office. Data records will be stored for a minimum of five years after the completion of the project. After five years the data will be reviewed to determine if any part of the data may be discarded. The decision to retain archived data will be made by the OEWRI director and QA manager. ASSESSMENT AND OVERSIGHT Assessments and Response Actions The Project’s activities will be assessed to identify and correct any potential or existing problems before the data is affected. A readiness review will be conducted prior to starting the project. Proficiency test samples will be procured for assessing analytical skill. A surveillance assessment will be conducted throughout the project. Each of these assessments is discussed below. Handling of the results for these assessments is discussed in the next section.
Bennett Springs QAPP (Final)
February 2007 Page 17 of 31
Readiness Review: Prior to the initiation of sampling, the QA Manager will review with the project Graduate Assistant all aspects of sampling and analyses. Items that will be covered in this assessment are; location and preparation of sample bottles, use of chain of custody forms, analytical processes including necessary quality control analyses, sample site locations including site codes, the use of field instrumentation and sampling devices, and how to handle data after it is generated.
Proficiency Testing: A known-concentration sample will be purchased from an appropriate vendor, such as, the USGS (http://bqs.usgs.gov/srs/) or Environmental Resource Associates (http://www.eraqc.com). The sample will be assigned to the analyst without informing the analyst of the sample’s source. The sample will be treated the same as other samples. The results will be submitted to the supplier for evaluation, or if the QA manager knows the correct concentration, the analyst’s results can be “graded” upon completion.
Surveillance Assessment: Surveillance is the observation of ongoing work to document conformance with specified requirements and/or procedures, such as those given in the QAPP or in SOPs. These observations will be continuous throughout the project and will be conducted by the QA manager and the co-principal investigators. Any deficiencies or problems detected will be addressed as soon as possible. Surveillance and review will continue to ensure that corrections have been implemented for all future uses. Documentation may include hand written notes, copies of e-mail, or other forms that will be stored in the project file. These documents may be useful for future projects. Reports to Management A monitoring technical report containing statistical evaluations of all water quality and discharge data collected in the study will be prepared at the end of the second year. This report will include objectives, methodology, results, interpretations, tables, graphs, pictures and maps. A final report will be developed and submitted. Brief summary reports of the assessment findings, discussed above, will be prepared by the QA officer. These may be issued as e-mail messages or as a Word file in an e-mail attachment. Reports will be generated after each nutrient and bacteria sampling in Phase 3. Copies of all reports will be stored in the project file in the OEWRI office and sent to the project administer who will forward the information to the DNR project manager. DATA VALIDATION AND USABILITY Data Review, Verification and Validation
These procedures are summarized as follows: data are reviewed for completeness and correct calculations, data are verified against quality control parameters, and data are validated against project goals and objectives.
Bennett Springs QAPP (Final)
February 2007 Page 18 of 31
Data Review: Sample collection forms, field instrument data printouts, laboratory bench sheets, and other sources of project data will be reviewed for transcription, calculation, reduction, and transformation errors. Data review is also a completeness check to determine if there are any deficiencies such as missing or lost data. Errors will be corrected when found. Missing data will be noted in the project narrative of the final report. The project analysts, OEWRI Quality Assurance officer, and faculty advisors will review all data.
Data Verification: Data verification is the evaluation of the data collected for the project compared to the requirements outlined in this QAPP, the original project agreement, and SOPs. Analytical data are compared to required levels of precision and accuracy as outline in the analyte’s SOP. If the levels are not met, then a cause for the discrepancy will be determined. The result of this determination will be whether the data may be used with qualifications or not used. After the verification process it may be possible to recollect or reanalyze. The analyst, QA officer, faculty, and principal investigators are all responsible for data verification during the project. Data Validation: One goal of data validation is to evaluate whether the data quality goals established during the planning phase have been achieved. Using the reviewed and verified data, the validation process compares the results with the objectives of the project stated in the Problem Definition and Background section. Verification and Validation Methods The verification method includes checking all bench sheets, data forms, and records for complete and accurate transcription of data, correct calculations, and appropriate comparison of quality control data to established limits. The reviewer will indicate on any form verified that this process has occurred. Any deviations from expected values will be noted on the report forms. Corrections can be made by crossing out the incorrect value with a single line, writing in the correct value, and initialing the correction. The validation method involves reviewing the data and reports and comparing that information to what was expected as outlined in this document. Deviations from what is required will be noted and a comment will be added to the final report indicating whether, or how, the deficiency will affect the final interpretations. Reconciliation with User Requirements The goal of this project is to establish baseline data for baseflow conditions for the Bennett Springs Recharge Area. These goals will be met by the data generated following the procedures outlined in this and related documents, for example SOPs. The final report will include descriptions of water quality runoff results found at each site. Spatial and temporal trends will be identified where seen. Recommendations will be made for future studies based on pollutant concentrations and runoff amounts.

Bennett Springs QAPP (Final)
February 2007 Page 19 of 31
TABLES Table 1. Personnel, Responsibilities and QAPP Receipt.
Name and Title Organization Responsibilities Contact Information QAPP Receipt/ Control number
Dr. Robert T. Pavlowsky Director, Principal Investigator
Missouri State University, OEWRI
Overall supervision of entire project. Review data. Assign tasks. Procure funding
417-836-8473 [email protected]
1
Heather Hoggard Project Supervisor/ QA/QC Manager
OEWRI Project coordination and oversight. QA/QC regarding laboratory procedures.
417-836-3198 [email protected]
2
Dr. Jack Steiert, MSU Faculty
MSU Biology Supervise bacteria analyses 417-836-6916 [email protected]
3
Dr. Richard Biagioni, MSU Faculty
MSU Chemistry Supervise chemistry analyses 417-836-4649 [email protected]
4
Ms. Stacia Bax, Project Manager
Missouri DNR DNR Project Manager 573-526-1386 [email protected]
5
Mr. John Madras, Division Quality Control Officer
Missouri DNR DNR Quality Assurance 573-522-9911 [email protected]
6
Ms. Trish Rielly, QAPP Manager
Missouri DNR DNR QAPP Manager 573-526-5297 [email protected]
7
Dr. William A. Alter III MSU Office of Sponsored Research and Programs
417-836-5972 [email protected]
8
Bennett Springs QAPP (Final)
February 2007 Page 20 of 31
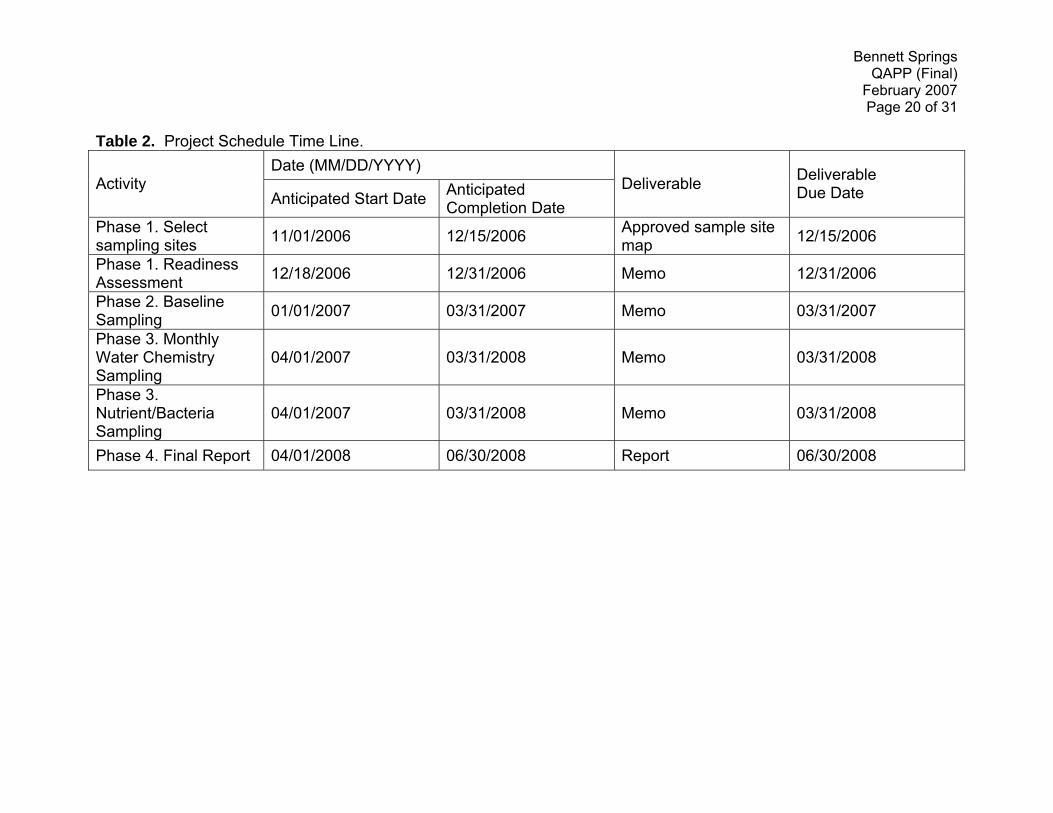
Table 2. Project Schedule Time Line. Date (MM/DD/YYYY)
Activity Anticipated Start Date Anticipated
Completion Date Deliverable Deliverable
Due Date
Phase 1. Select sampling sites 11/01/2006 12/15/2006 Approved sample site
map 12/15/2006
Phase 1. Readiness Assessment 12/18/2006 12/31/2006 Memo 12/31/2006
Phase 2. Baseline Sampling 01/01/2007 03/31/2007 Memo 03/31/2007
Phase 3. Monthly Water Chemistry Sampling
04/01/2007 03/31/2008 Memo 03/31/2008
Phase 3. Nutrient/Bacteria Sampling
04/01/2007 03/31/2008 Memo 03/31/2008
Phase 4. Final Report 04/01/2008 06/30/2008 Report 06/30/2008
Bennett Springs QAPP (Final)
February 2007 Page 21 of 31
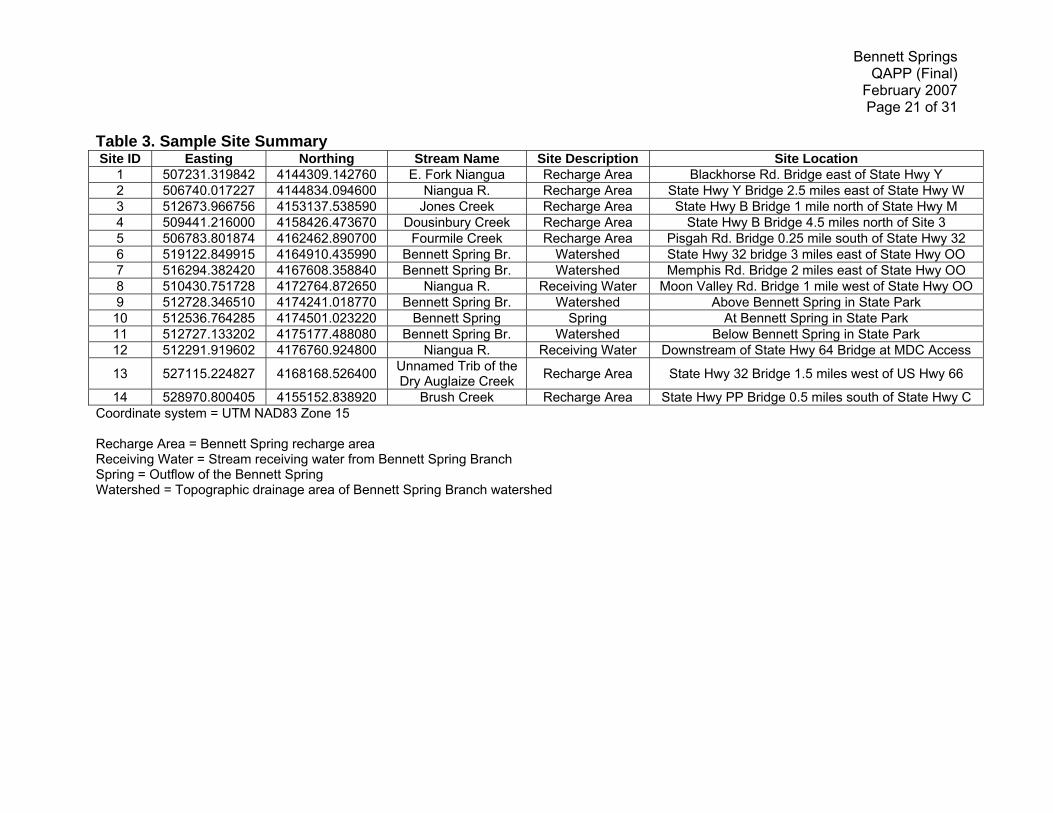
Table 3. Sample Site Summary Site ID Easting Northing Stream Name Site Description Site Location
1 507231.319842 4144309.142760 E. Fork Niangua Recharge Area Blackhorse Rd. Bridge east of State Hwy Y 2 506740.017227 4144834.094600 Niangua R. Recharge Area State Hwy Y Bridge 2.5 miles east of State Hwy W 3 512673.966756 4153137.538590 Jones Creek Recharge Area State Hwy B Bridge 1 mile north of State Hwy M 4 509441.216000 4158426.473670 Dousinbury Creek Recharge Area State Hwy B Bridge 4.5 miles north of Site 3 5 506783.801874 4162462.890700 Fourmile Creek Recharge Area Pisgah Rd. Bridge 0.25 mile south of State Hwy 32 6 519122.849915 4164910.435990 Bennett Spring Br. Watershed State Hwy 32 bridge 3 miles east of State Hwy OO 7 516294.382420 4167608.358840 Bennett Spring Br. Watershed Memphis Rd. Bridge 2 miles east of State Hwy OO 8 510430.751728 4172764.872650 Niangua R. Receiving Water Moon Valley Rd. Bridge 1 mile west of State Hwy OO 9 512728.346510 4174241.018770 Bennett Spring Br. Watershed Above Bennett Spring in State Park 10 512536.764285 4174501.023220 Bennett Spring Spring At Bennett Spring in State Park 11 512727.133202 4175177.488080 Bennett Spring Br. Watershed Below Bennett Spring in State Park 12 512291.919602 4176760.924800 Niangua R. Receiving Water Downstream of State Hwy 64 Bridge at MDC Access
13 527115.224827 4168168.526400 Unnamed Trib of the Dry Auglaize Creek Recharge Area State Hwy 32 Bridge 1.5 miles west of US Hwy 66
14 528970.800405 4155152.838920 Brush Creek Recharge Area State Hwy PP Bridge 0.5 miles south of State Hwy C Coordinate system = UTM NAD83 Zone 15 Recharge Area = Bennett Spring recharge area Receiving Water = Stream receiving water from Bennett Spring Branch Spring = Outflow of the Bennett Spring Watershed = Topographic drainage area of Bennett Spring Branch watershed
Bennett Springs QAPP (Final)
February 2007 Page 22 of 31
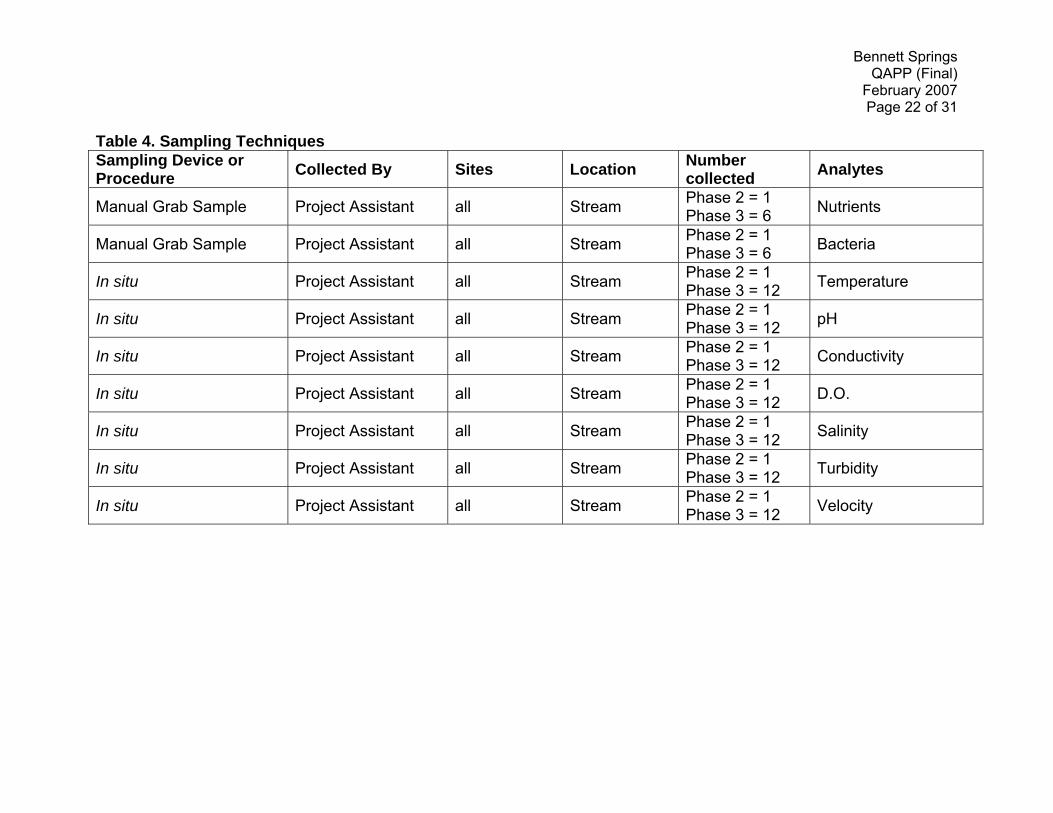
Table 4. Sampling Techniques Sampling Device or Procedure Collected By Sites Location Number
collected Analytes
Manual Grab Sample Project Assistant all Stream Phase 2 = 1 Phase 3 = 6 Nutrients
Manual Grab Sample Project Assistant all Stream Phase 2 = 1 Phase 3 = 6 Bacteria
In situ Project Assistant all Stream Phase 2 = 1 Phase 3 = 12 Temperature
In situ Project Assistant all Stream Phase 2 = 1 Phase 3 = 12 pH
In situ Project Assistant all Stream Phase 2 = 1 Phase 3 = 12 Conductivity
In situ Project Assistant all Stream Phase 2 = 1 Phase 3 = 12 D.O.
In situ Project Assistant all Stream Phase 2 = 1 Phase 3 = 12 Salinity
In situ Project Assistant all Stream Phase 2 = 1 Phase 3 = 12 Turbidity
In situ Project Assistant all Stream Phase 2 = 1 Phase 3 = 12 Velocity
Bennett Springs QAPP (Final)
February 2007 Page 23 of 31
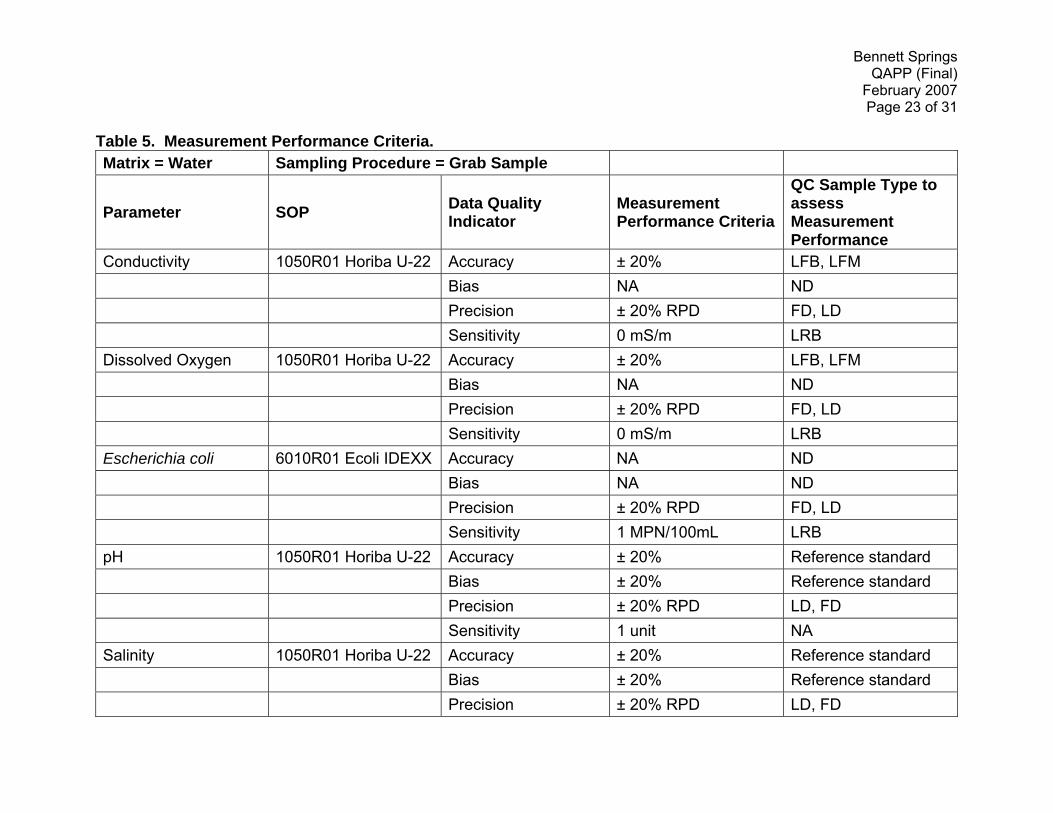
Table 5. Measurement Performance Criteria. Matrix = Water Sampling Procedure = Grab Sample
Parameter SOP Data Quality Indicator
Measurement Performance Criteria
QC Sample Type to assess Measurement Performance
Conductivity 1050R01 Horiba U-22 Accuracy ± 20% LFB, LFM Bias NA ND Precision ± 20% RPD FD, LD Sensitivity 0 mS/m LRBDissolved Oxygen 1050R01 Horiba U-22 Accuracy ± 20% LFB, LFM Bias NA ND Precision ± 20% RPD FD, LD Sensitivity 0 mS/m LRBEscherichia coli 6010R01 Ecoli IDEXX Accuracy NA ND Bias NA ND Precision ± 20% RPD FD, LD Sensitivity 1 MPN/100mL LRBpH 1050R01 Horiba U-22 Accuracy ± 20% Reference standard Bias ± 20% Reference standard Precision ± 20% RPD LD, FD Sensitivity 1 unit NASalinity 1050R01 Horiba U-22 Accuracy ± 20% Reference standard Bias ± 20% Reference standard Precision ± 20% RPD LD, FD
Bennett Springs QAPP (Final)
February 2007 Page 24 of 31
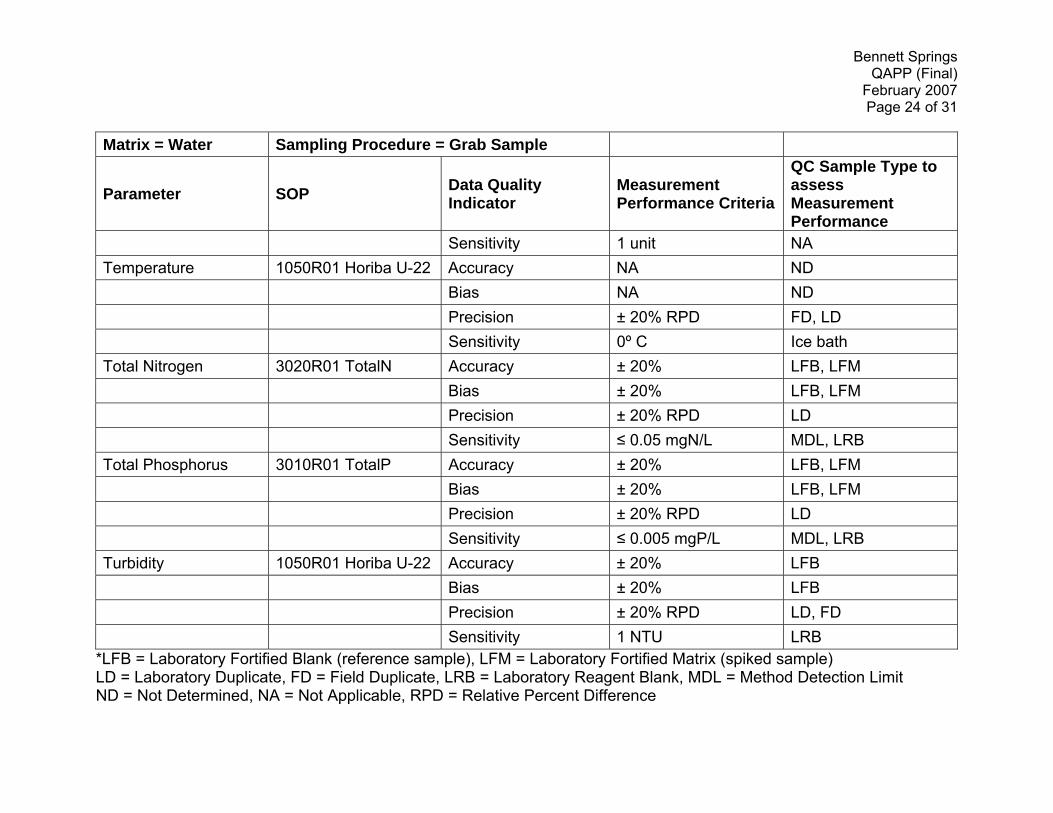
Matrix = Water Sampling Procedure = Grab Sample
Parameter SOP Data Quality Indicator
Measurement Performance Criteria
QC Sample Type to assess Measurement Performance
Sensitivity 1 unit NATemperature 1050R01 Horiba U-22 Accuracy NA ND Bias NA ND Precision ± 20% RPD FD, LD Sensitivity 0º C Ice bath Total Nitrogen 3020R01 TotalN Accuracy ± 20% LFB, LFM Bias ± 20% LFB, LFM Precision ± 20% RPD LD Sensitivity ≤ 0.05 mgN/L MDL, LRB Total Phosphorus 3010R01 TotalP Accuracy ± 20% LFB, LFM Bias ± 20% LFB, LFM Precision ± 20% RPD LD Sensitivity ≤ 0.005 mgP/L MDL, LRB Turbidity 1050R01 Horiba U-22 Accuracy ± 20% LFB Bias ± 20% LFB Precision ± 20% RPD LD, FD Sensitivity 1 NTU LRB
*LFB = Laboratory Fortified Blank (reference sample), LFM = Laboratory Fortified Matrix (spiked sample) LD = Laboratory Duplicate, FD = Field Duplicate, LRB = Laboratory Reagent Blank, MDL = Method Detection Limit ND = Not Determined, NA = Not Applicable, RPD = Relative Percent Difference
Bennett Springs QAPP (Final)
February 2007 Page 25 of 31
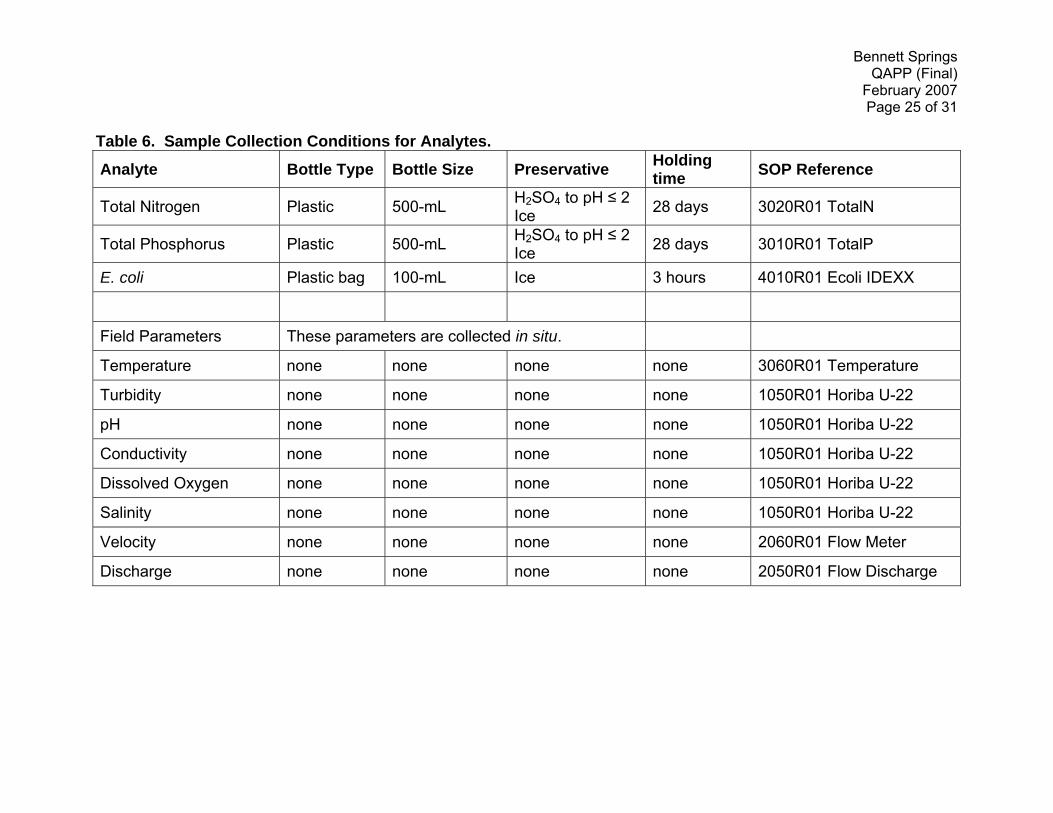
Table 6. Sample Collection Conditions for Analytes.
Analyte Bottle Type Bottle Size Preservative Holding time SOP Reference
Total Nitrogen Plastic 500-mL H2SO4 to pH ≤ 2 Ice 28 days 3020R01 TotalN
Total Phosphorus Plastic 500-mL H2SO4 to pH ≤ 2 Ice 28 days 3010R01 TotalP
E. coli Plastic bag 100-mL Ice 3 hours 4010R01 Ecoli IDEXX
Field Parameters These parameters are collected in situ.
Temperature none none none none 3060R01 Temperature
Turbidity none none none none 1050R01 Horiba U-22
pH none none none none 1050R01 Horiba U-22
Conductivity none none none none 1050R01 Horiba U-22
Dissolved Oxygen none none none none 1050R01 Horiba U-22
Salinity none none none none 1050R01 Horiba U-22
Velocity none none none none 2060R01 Flow Meter
Discharge none none none none 2050R01 Flow Discharge

Bennett Springs QAPP (Final)
February 2007 Page 26 of 31
Table 7. Quality Control Corrective Action Plan. (Standard Methods, 2005) QC Type and Error Corrective Action Comment*
Laboratory Reagent Blank > MDL
1. Analyze another blank; if 2nd LRB is acceptable, then data is acceptable.
2. If 2nd LRB fails, then re-prepare and re-analyze affected samples
These data are associated with an LRB result that is > the MDL for this analyte.
Spiked samples (LFM) fails
1. If Reference sample (LFB) is acceptable, then qualify the data
2. If LFM and LFB fail, then re-prepare and reanalyze the affected samples.
These data are associated with a LFM recovery result that is > UCL (or < LCL).
Reference sample (LFB) fails
1. Analyze another LFB. 2. If 2nd LFB fails then check another source
for the reference material. 3. If the 2nd source is acceptable, then re-
prepare and reanalyze affected samples.
These data are associated with a LFB recovery result that is > UCL (or < LCL).
Calculations 1. Check calculations for error, correct if
found
No comment needed for corrected calculations.
Calibration Standards fail
1. Check calibration standards against the reference sample.
2. If calibration standards fail then re-prepare and reanalyze the calibration standards and affected samples.
No comment needed for reanalyzed calibration standards.
*If the QC sample fails and the samples cannot be reanalyzed, then record the comment on the data sheet.
UCL = Upper Control Limit, LCL = Lower Control Limit
Bennett Springs QAPP (Final)
February 2007 Page 27 of 31
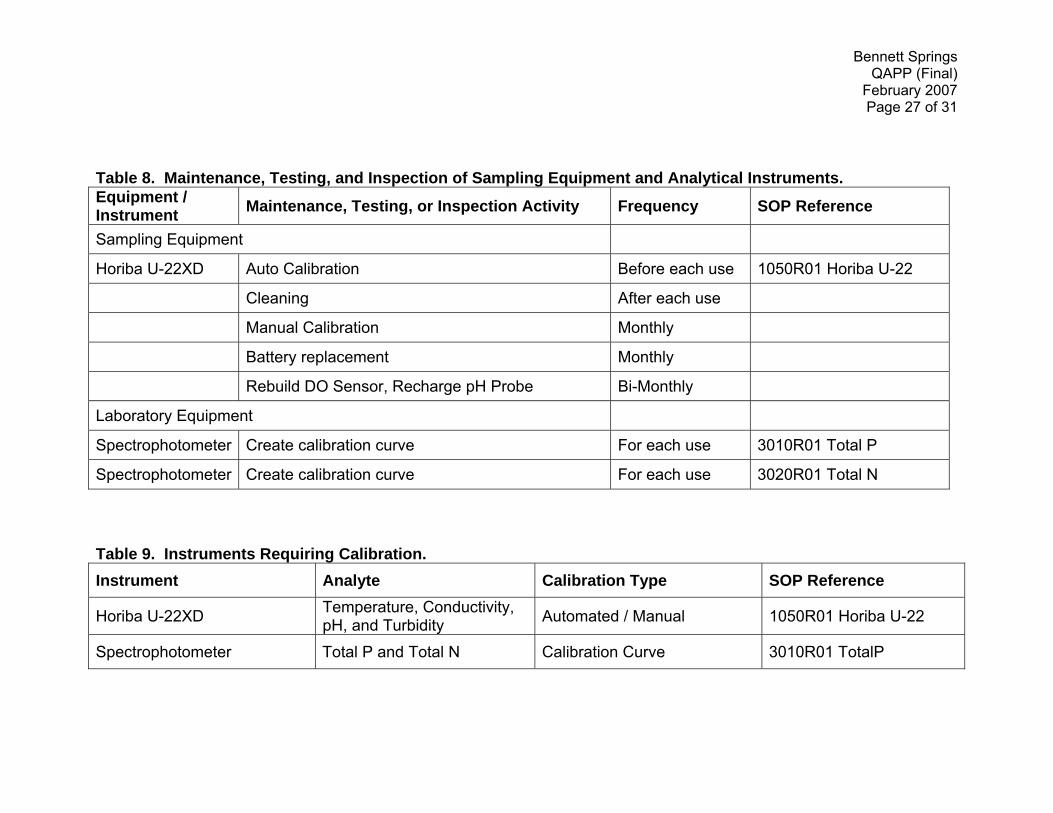
Table 8. Maintenance, Testing, and Inspection of Sampling Equipment and Analytical Instruments. Equipment / Instrument Maintenance, Testing, or Inspection Activity Frequency SOP Reference
Sampling Equipment
Horiba U-22XD Auto Calibration Before each use 1050R01 Horiba U-22
Cleaning After each use
Manual Calibration Monthly
Battery replacement Monthly
Rebuild DO Sensor, Recharge pH Probe Bi-Monthly
Laboratory Equipment
Spectrophotometer Create calibration curve For each use 3010R01 Total P
Spectrophotometer Create calibration curve For each use 3020R01 Total N Table 9. Instruments Requiring Calibration. Instrument Analyte Calibration Type SOP Reference
Horiba U-22XD Temperature, Conductivity, pH, and Turbidity Automated / Manual 1050R01 Horiba U-22
Spectrophotometer Total P and Total N Calibration Curve 3010R01 TotalP

Bennett Springs QAPP (Final)
February 2007 Page 28 of 31
Department of Natural Resources
Stacia Bax, Project Manager
Department of Natural Resources Department of Natural Resources Trish Rielly, John Madras
QAPP Manager Division Quality Control Officer
SMCOG Anita Davis
Project Administrator
OEWRI, Missouri State University Dr. Bob Pavlowsky,
Director
Missouri State University Missouri State University Dr. Richard Biagioni Dr. John Steiert Chemistry Faculty Biology Faculty
OEWRI OEWRI Heather Hoggard Marc R. Owen
Project Supervisor QA Manager
Figure 1. Organizational chart showing lines of authority and reporting responsibilities.

Bennett Springs QAPP (Final)
February 2007 Page 29 of 31
FIGURES
Figure 2. Niangua River Basin
Bennett Springs QAPP (Final)
February 2007 Page 30 of 31
Single Flow = Dye injection point traced back to Bennett Spring Split Flow = Dye injection point traced back to multiple springs including Bennett Spring Figure 3. Bennett Spring Recharge Area Sample Sites

Bennett Springs QAPP (Final)
February 2007 Page 31 of 31
APPENDIX A. Standard Operating Procedures (SOPs) cited in this document.
Document Number Title Status
1030R01 Chain of Custody Chain of Custody Final
1040R01 Water Sampling Water Sample Collection Final
1050R01 Horiba U-22
Horiba U-22XD Multi-Parameter Water Quality Monitoring System
Final
3010R01 Total P Total Phosphorus Final
3020R01 Total N Total Nitrogen Final
6010R01 Ecoli IDEXX Escherichia coli using the IDEXX Quanti-Tray/2000 System with Colilert reagent
Final
2060R01 Flow Meter Operation of the Global Water Flow Meter Model FP201 Final
2050R01 Flow Discharge Low Flow Velocity and Discharge Final