Water Quality Monitoring & Analysis …mpcb.gov.in/envtdata/QAQC- An Overview- VAM.pdfWater Quality...
69
Water Quality Monitoring & Analysis (NWMP/SWMP) – An Overview by Dr. V. A.Mhaisalkar Professor & Head Department of Civil Engineering Visvesvaraya National Institute of Technology (VNIT), Nagpur
Transcript of Water Quality Monitoring & Analysis …mpcb.gov.in/envtdata/QAQC- An Overview- VAM.pdfWater Quality...

Water Quality Monitoring & Analysis (NWMP/SWMP)– An Overview
byDr. V. A.MhaisalkarProfessor & Head
Department of Civil EngineeringVisvesvaraya National Institute of Technology (VNIT), Nagpur
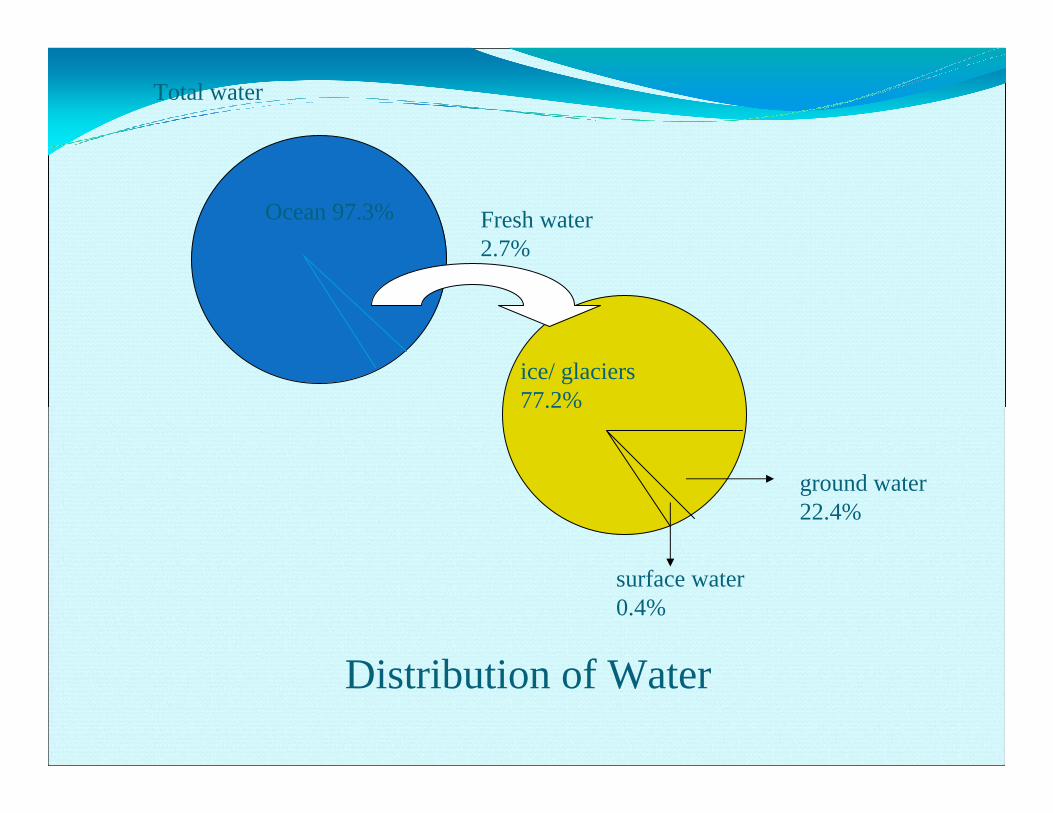
Total water
Ocean 97.3%
ice/ glaciers 77.2%
ground water22.4%
surface water0.4%
Fresh water 2.7%
Distribution of Water

Water in India :
How much do we get ?India, with an area of about 3290 billion square meters, receives about 1200 mm of rainfall annually, that is, almost 4000 billion cubic meters of volume of water.
Total precipitation (snow & rain) 4000 bcum 100%
Seasonal rainfall 3000 bcum 75%
Average annual flow in rivers 1869 bcum 46.7%
Total annual utilisable water 1122 bcum 28.1%
(Surface 690 bcum 17.3%)
(ground 432 bcum 10.8%)

Water is Precious and Scarce Resource
Only a small fraction is fresh water
India is wettest country in the world, but rainfall is highly uneven with time and space (with extremely low in Rajasthan and high in North‐East)
On an average there are only 40 rainy days
Water resources are over‐exploited resulting in major WQ problems

Major Factors Responsible for WQ DegradationDomestic: 423 class I cities and 499 class II towns harboring population of 20
Crore generate about 26254 mld of wastewater of which only 6955 mld is treated.
Industrial: About 57,000 polluting industries in India generate about 13,468 mld of wastewater out of which nearly 60% (generated from large & medium industries) is treated.
Non‐point sources also contribute significant pollution loads mainly in rainy season. Pesticides consumption is about 1,00,000 tonnes/year of which AP, Haryana, Punjab, TN, WB, Gujarat, UP and Maharashtra are principal consumers.
Domestic sewage is the major source of pollution in India in surface water which contribute pathogens, the main source of water borne diseases along with depletion of oxygen in water bodies.
Sewage alongwith agricultural run‐off and industrial effluents also contributes large amount of nutrients in surface water causing eutrophication.
A large part of the domestic sewage is not even collected. This results in stagnation of sewage within city, a good breeding ground for mosquitoes and contaminate the groundwater, the only source of drinking water in many

Major Water Quality Issues
Common issues of Surface and Ground water• Pathogenic (Bacteriological) Pollution• Salinity• Toxicity (micro-pollutants and other industrial pollutants)
Surface Water• Eutrophication• Oxygen depletion• Ecological health
Ground Water• Fluoride• Nitrate• Arsenic• Iron• Sea water intrusion
WATER QUALITY MONITORING PROGRAMME
• The water quality management in India is performed under the provision of Water (Prevention and Control of Pollution) Act, 1974. The basic objective of this Act is to maintain and restore the wholesomeness of national aquatic resources by prevention and control of pollution.
• The act prescribes various functions for the Central Pollution Control Board (CPCB) at the apex level and State Pollution Control Boards at the state level.
• The Act does not define the level of wholesomeness to be maintained or restored in different water bodies of the country. The Central Pollution Control Board (CPCB) has tried to define the wholesomeness in terms of protection of human uses, and thus, taken human uses of water as base for identification of water quality objectives for different water bodies in the country.

Designated-Best-Use Class of water Criteria
Drinking Water Source without conventional treatment but after disinfection
A • Total Coliforms Organism MPN/100ml shall be 50 or less • pH between 6.5 and 8.5 • Dissolved Oxygen 6mg/l or more • Biochemical Oxygen Demand 5 days 20°C 2mg/l or less
Outdoor bathing (Organised)
B • Total Coliforms Organism MPN/100ml shall be 500 or less
• pH between 6.5 and 8.5 • Dissolved Oxygen 5mg/l or more • Biochemical Oxygen Demand 5 days 20°C 3mg/l or less
Drinking water source after conventional treatment and disinfection
C • Total Coliforms Organism MPN/100ml shall be 5000 or less
• pH between 6 to 9 • Dissolved Oxygen 4mg/l or more • Biochemical Oxygen Demand 5 days 20°C 3mg/l or less
Propagation of Wild life and Fisheries
D • pH between 6.5 to 8.5 • Dissolved Oxygen 4mg/l or more • Free Ammonia (as N) 1.2 mg/l or less
Irrigation, Industrial Cooling, Controlled Waste disposal
E • pH betwwn 6.0 to 8.5 • Electrical Conductivity at 25°C micro mhos/cm Max.2250 • Sodium absorption Ratio Max. 26 • Boron Max. 2mg/l
Water Quality Criteria
Why Water Quality Monitoring ?
To Know
• How the quality and quantity of water in a water body relate to the requirements of users.
• How the quality and quantity of water in a water body relate to established water quality standards.
• The capacity of the water body to assimilate an increase in waste discharges without causing unacceptable levels of pollution.
• Whether or not existing waste discharges conform to existing standards and regulations.
• The appropriateness and effectiveness of control strategies and management actions for pollution control.
Contd …..

…. Contd
• The trends of changes in water quality with respect to time as a result of changing human activities in the catchment area. Quality could be declining as a result of waste discharges or improving as a result of pollution control measures.
• Control measures that should be implemented to improve or prevent further deterioration of water quality.
• The chemical or biological variables in the water that render it unsuitable for beneficial uses.
• The hazards to human health that result, or may result, from poor water quality in the water body.
• How developments in the catchment area have affected or will affect water quality.
• The effects that deteriorating water quality have on plant and animal life in, or near, the water body.
Deciding the Objectives of WQM is based on answer to the following questions:
• Why is monitoring going to be conducted?
• What information is required on water quality for various uses?
• What is practical in terms of the human and financial resources available for monitoring?
• Who is responsible for the different elements of monitoring?
• Who is going to use the monitoring data and what are they intending to do with the information?

Objectives of Water Quality Monitoring under NWMP
Rational planning of
• pollution control strategies and their prioritization;
To assess
• nature and extent of pollution control needed in different water bodies or their part;
• assimilative capacity of a water body thereby reducing cost on pollution control;
• the fitness of water for different uses.
To evaluate
• effectiveness of pollution control measures already is existence; • water quality trend over a period of time;
To understand• the environmental fate of different pollutants.
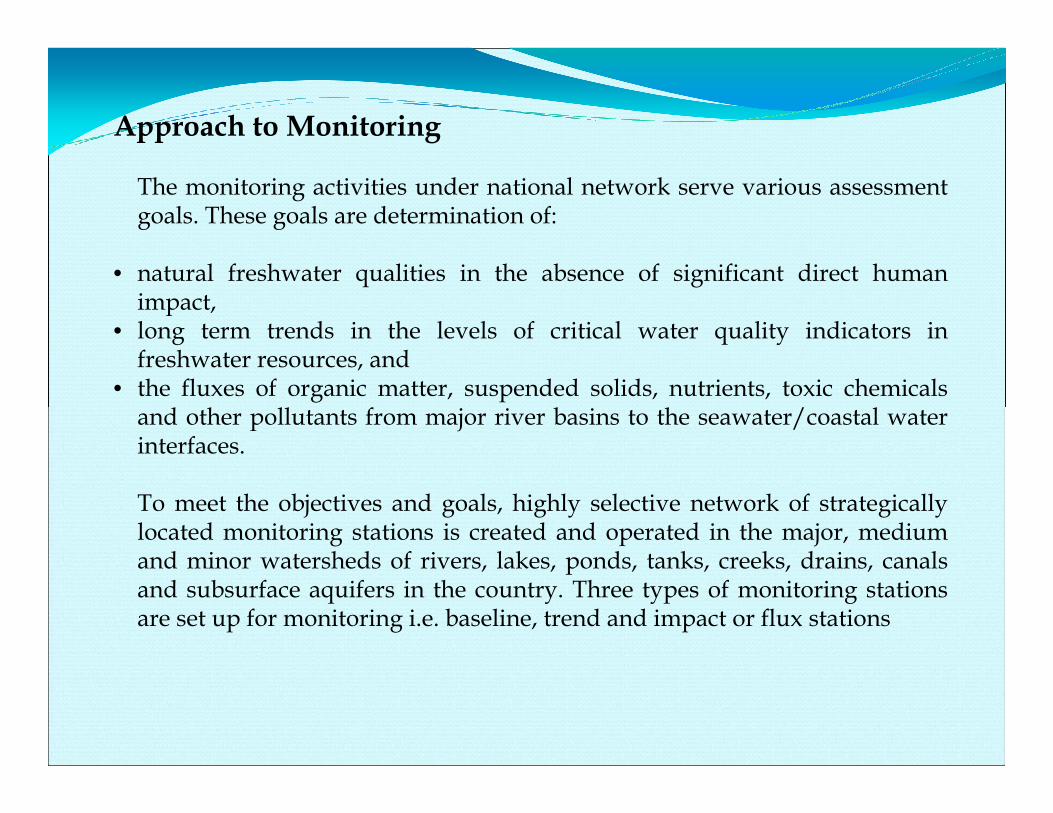
Approach to Monitoring
The monitoring activities under national network serve various assessment goals. These goals are determination of:
• natural freshwater qualities in the absence of significant direct human impact,
• long term trends in the levels of critical water quality indicators in freshwater resources, and
• the fluxes of organic matter, suspended solids, nutrients, toxic chemicals and other pollutants from major river basins to the seawater/coastal water interfaces.
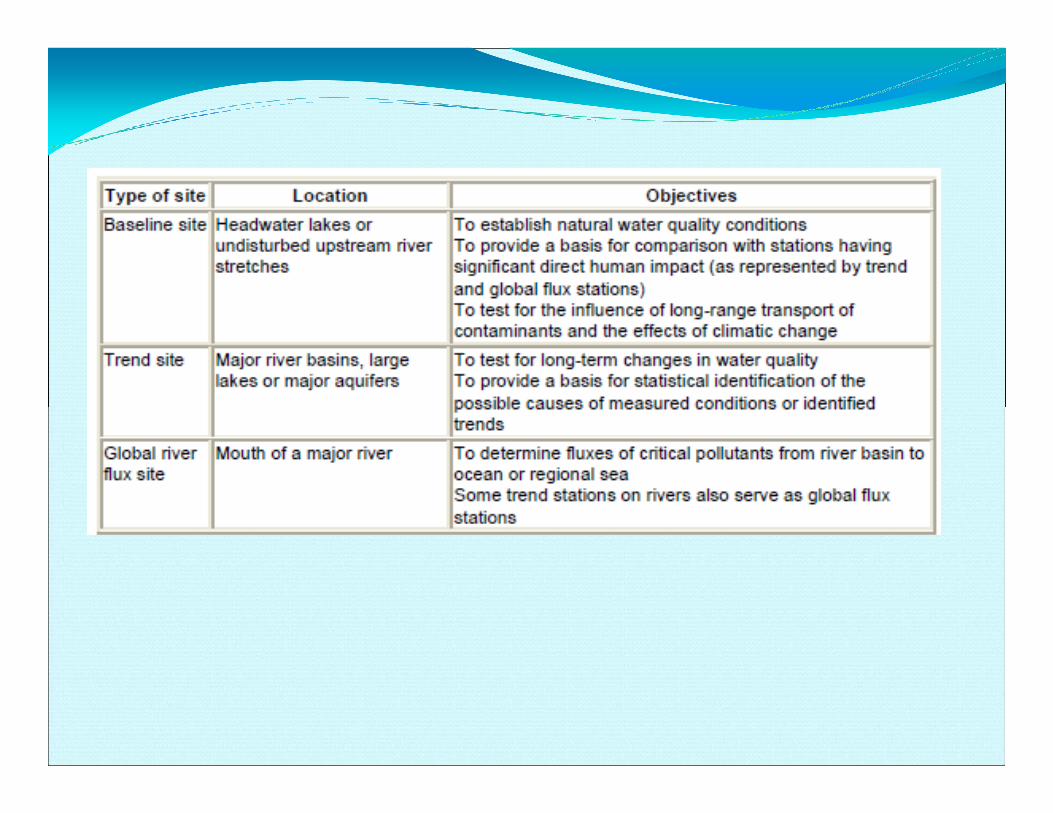
To meet the objectives and goals, highly selective network of strategically located monitoring stations is created and operated in the major, medium and minor watersheds of rivers, lakes, ponds, tanks, creeks, drains, canals and subsurface aquifers in the country. Three types of monitoring stations are set up for monitoring i.e. baseline, trend and impact or flux stations

NATIONAL WATER QUALITY MONITORING
Monitoring Network
• CPCB in collaboration with concerned SPCBs/PCCs established a nationwide network of water quality monitoring comprising 1245 stations in 27 States and 6 Union Territories.
• The monitoring is done on monthly or quarterly basis in surface waters and on half yearly basis in case of ground water.
• The monitoring network covers 250 Rivers, 79 Lakes, 6 Tanks, 26 Ponds, 8 Creeks, 19 Canals, 18 Drains and 382 Wells.
• Among the 1245 stations, 695 are on rivers, 87 on lakes, 18 on drains, 19 on canals, 6 on tank, 12 on creeks/seawater, 26 on pond and 382 are groundwater stations
NATIONAL WATER QUALITY MONITORING
• Presently the inland water quality-monitoring network is operated under a three-tier programme i.e. GEMS, Monitoring of Indian National Aquatic Resources System ( MINARS) and Yamuna Action Plan ( YAP).
• Water samples are being analyzed for 28 parameters consisting of physico-chemical and bacteriological parameters for ambient water samples apart from the field observations.
• Besides this, 9 trace metals and 15 pesticides are analyzed in selected samples.
• Biomonitoring is also carried out on specific locations.
• In view of limited resources, limited numbers of organic pollution related parameters are chosen for frequent monitoring i.e. monthly or quarterly and major cations, anions, other inorganic ions and micro pollutants (Toxic Metals & POP’s) are analyzed once in a year to keep a track of water quality over large period of time.
• The water quality data are reported in Water Quality Status Year Book.
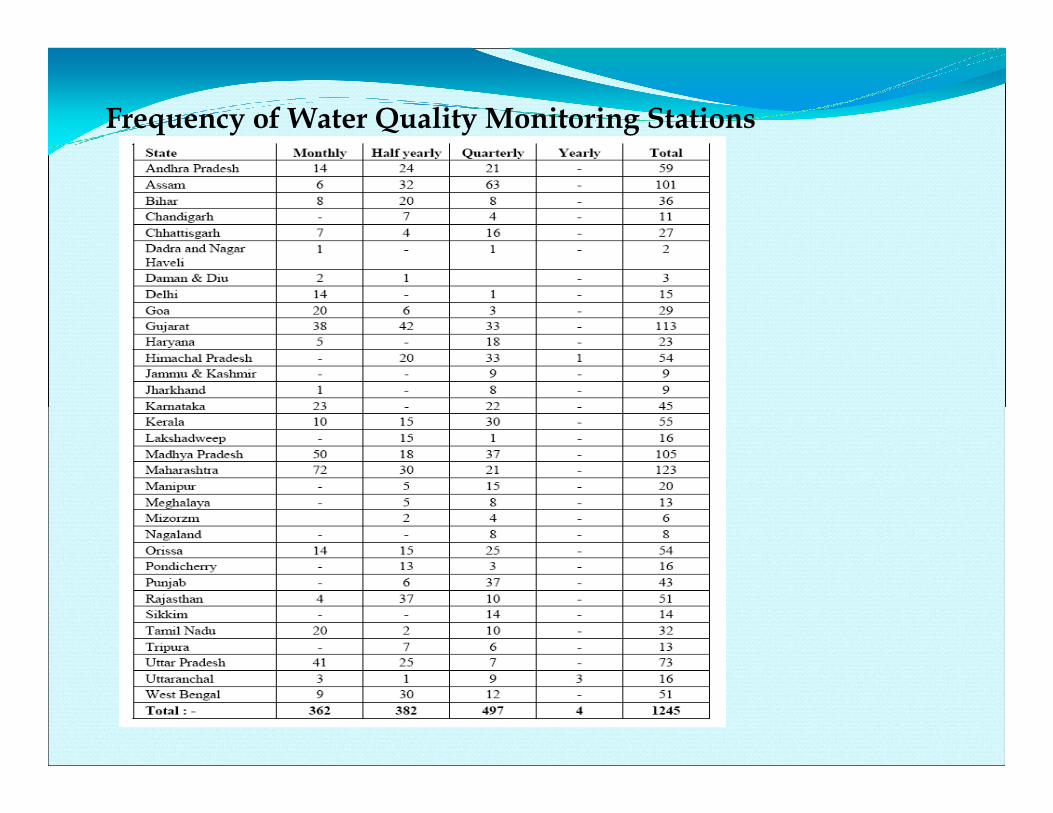
Frequency of Water Quality Monitoring Stations
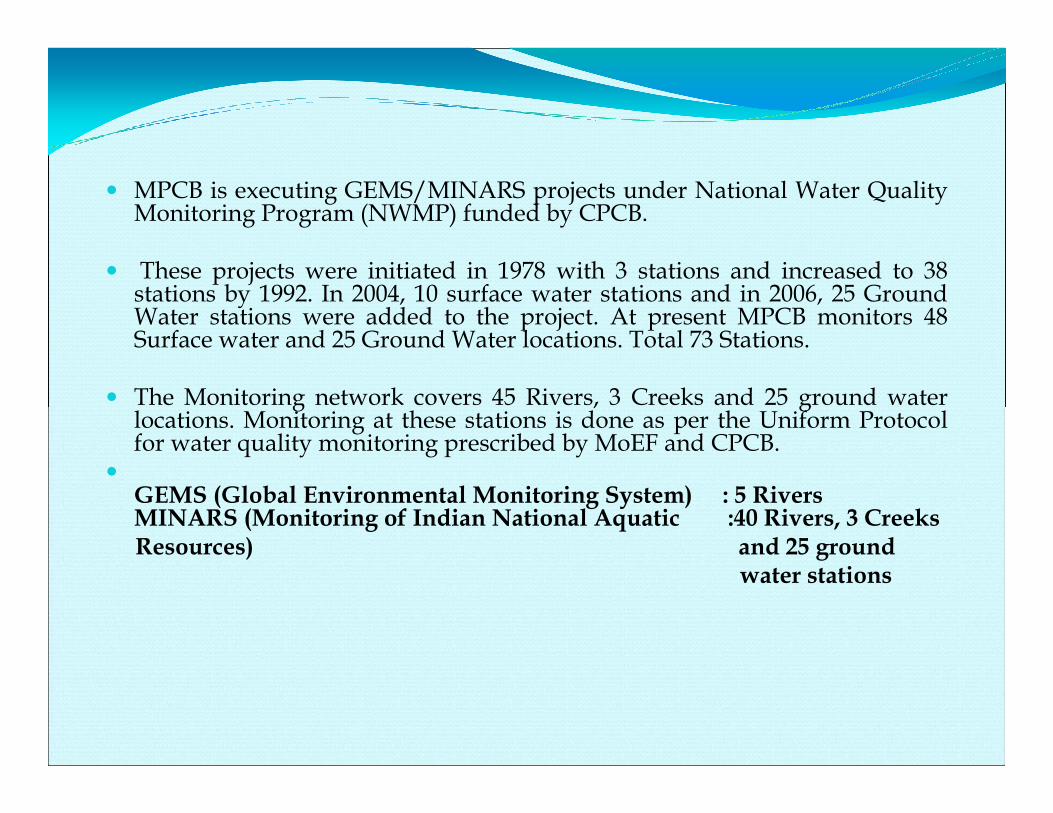
MPCB is executing GEMS/MINARS projects under National Water Quality Monitoring Program (NWMP) funded by CPCB.
These projects were initiated in 1978 with 3 stations and increased to 38 stations by 1992. In 2004, 10 surface water stations and in 2006, 25 Ground Water stations were added to the project. At present MPCB monitors 48 Surface water and 25 Ground Water locations. Total 73 Stations.
The Monitoring network covers 45 Rivers, 3 Creeks and 25 ground water locations. Monitoring at these stations is done as per the Uniform Protocol for water quality monitoring prescribed by MoEF and CPCB.
GEMS (Global Environmental Monitoring System) : 5 RiversMINARS (Monitoring of Indian National Aquatic :40 Rivers, 3 Creeks Resources) and 25 ground
water stations

pHTemperatureConductivityDissolved OxygenBiochemical Oxygen Nitrate-NNitrite-NFaecal ColiformTotal Coliform
COD ChlorideTKN SulphateAmmonia Total AlkalinityTotal Dissolved Solids P-AlkalinityTotal Fixed Solids PhosphateTotal Suspended Solids SodiumTurbidity PotassiumHardness CalciumFluoride MagnesiumBoron
WeatherApproximate depth of main stream/depth of water tableColour and instensity OdorVisible efluent dischargeHuman activities around stationStation detail
Saprobity IndexDiversity IndexP/R Ratio
Arsenic Nickel Copper Mercury Chromium TotalCadmium Zinc Lead Iron Total
BHC(Total) Dieldrin Carbamate 2.4 DDDT(Total) Aldrin Endosulphan
Parameters for National Water Quality Monitoring
Core Parameters (9)
General Parameters (19)
Field Observations (7)
Bio-Monitoring Parameters (3)
Trace Metals (9)
Pesticide (7)

MONITORING PROTOCOL – SURFACE WATER(River, Lakes, Ponds, Creeks, Drains)
Parameters to be measured Frequency LocationField ObservationsWeather, Approximate depth of main stream / depth of water table, Colour and intensity, Odor, Visible effluent discharge, Human activities around station. Station details
Monthly / Quarterly (Jan., April, July & Oct.)
All location
Core ParametersTemperature, pH, Conductivity DO, BOD, Nitrate –N, ammonia-N, Total Coliform, Faecal Coliform.
Monthly / Quarterly (Jan., April, July & Oct.)
All location
Bio Monitoring Saprobity Index, Diversity Index, P/R ratio
Three times in year (Oct., Jan., April)
Selected location
Contd..
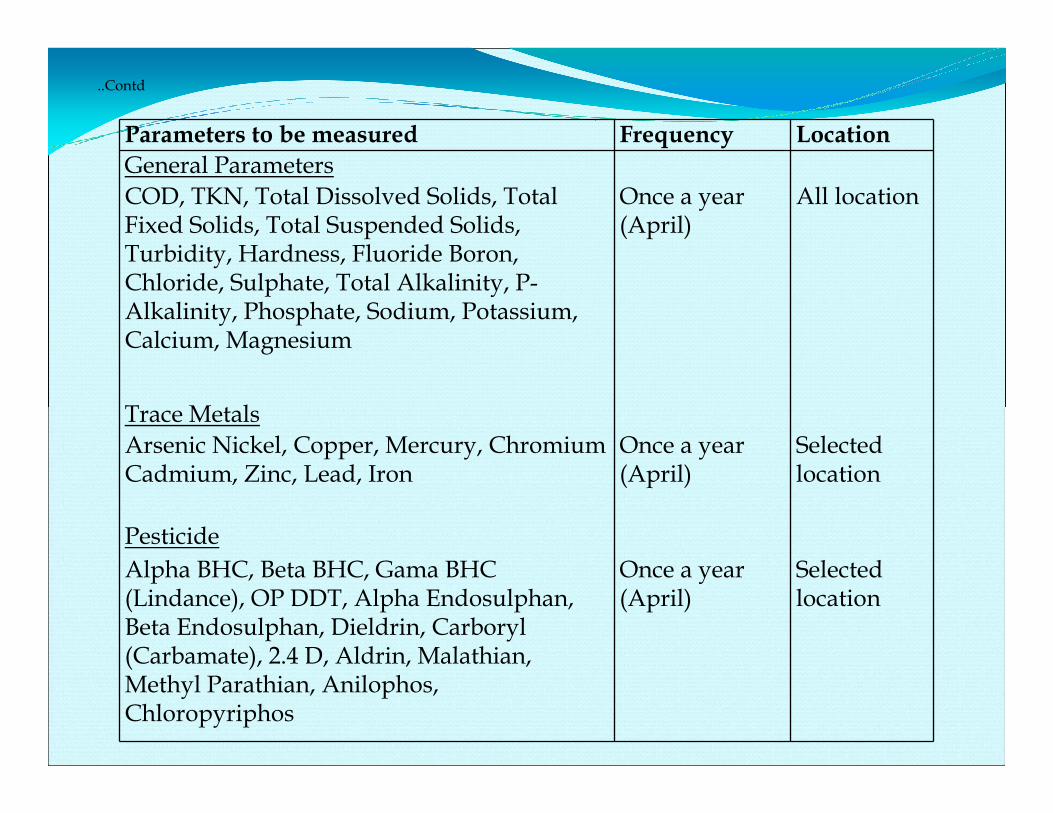
Parameters to be measured Frequency LocationGeneral ParametersCOD, TKN, Total Dissolved Solids, Total Fixed Solids, Total Suspended Solids, Turbidity, Hardness, Fluoride Boron, Chloride, Sulphate, Total Alkalinity, P-Alkalinity, Phosphate, Sodium, Potassium, Calcium, Magnesium
Once a year (April)
All location
Trace MetalsArsenic Nickel, Copper, Mercury, Chromium Cadmium, Zinc, Lead, Iron
Once a year(April)
Selected location
PesticideAlpha BHC, Beta BHC, Gama BHC (Lindance), OP DDT, Alpha Endosulphan, Beta Endosulphan, Dieldrin, Carboryl (Carbamate), 2.4 D, Aldrin, Malathian, Methyl Parathian, Anilophos, Chloropyriphos
Once a year(April)
Selected location
..Contd

Parameters to be measured Frequency Location
Field ObservationsWeather, Approximate depth of main stream / depth of water table, Colour and intensity, Odor, Visible effluent discharge, Human activities around station. Station details
Twice in a year(April & Oct.)
All location
Core ParametersTemperature, pH, Conductivity DO, BOD, Nitrate –N, Total Coliform, Faecal Coliform.
Twice in a year(April & Oct.)
All location
MONITORING PROTOCOL – GROUND WATER(Tube –Wells, Hand Pumps Dugwell)
Contd..

Parameters to be measured Frequency LocationGeneral ParametersCOD, TKN, Ammonia, Total Dissolved Solids, Total Fixed Solids, Total Suspended Solids, Turbidity, Hardness, Fluoride Boron, Chloride Sulphate, Total Alkalinity, P-Alkalinity, Phosphate, Sodium, Potassium, Calcium, Magnesium, SAR, % Na
Once a year (April)
All location
Trace MetalsArsenic Nickel, Copper, Mercury, Chromium Cadmium, Zin, Lead, Iron
Once a year(April)
Selected location
PesticideAlpha BHC, Beta BHC, Gama BHC (Lindance), OP DDT, PP DDT, Alpha Endosulphan, Beta Endosulphan, Dieldrin, Carboryl (Carbamate), 2.4 D, Aldrin, Malathian, Methyl Parathian, Anilophos, Chloropyriphos
Once a year(April)
Selected location
..Contd


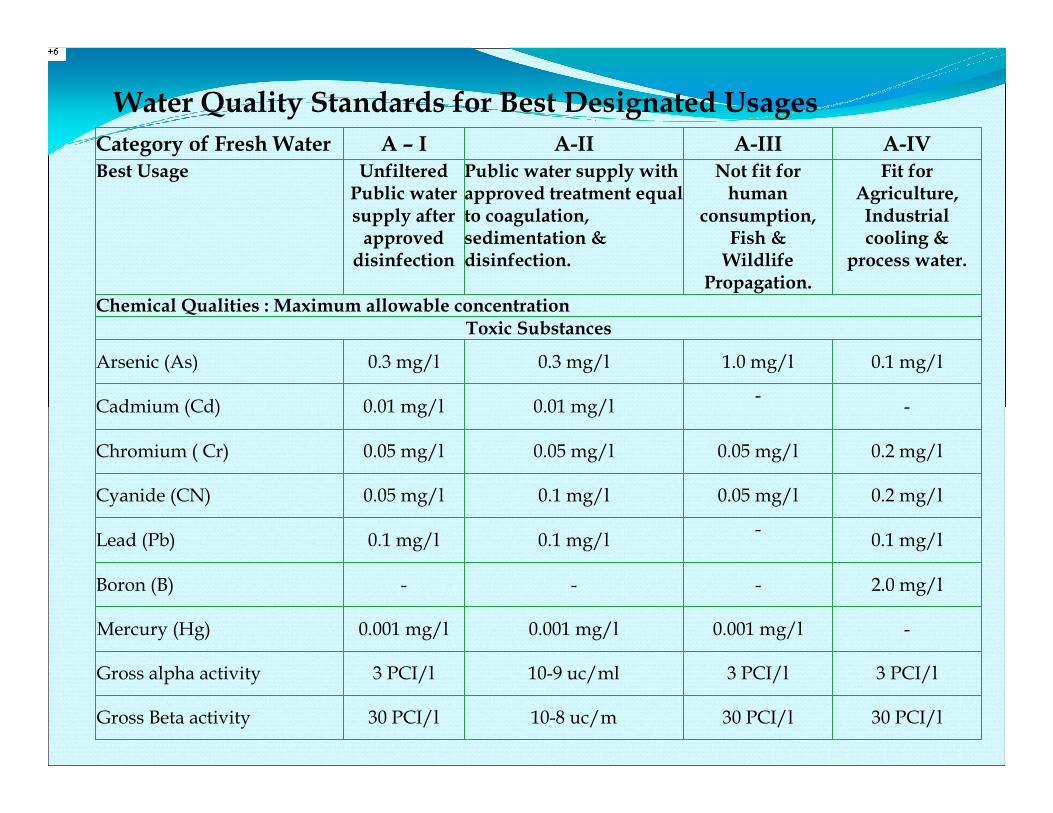
Water Quality Standards for Best Designated Usages Category of Fresh Water A – I A-II A-III A-IVBest Usage Unfiltered
Public watersupply after
approveddisinfection
Public water supply with approved treatment equal to coagulation, sedimentation & disinfection.
Not fit for human
consumption, Fish &
Wildlife Propagation.
Fit for Agriculture,Industrial cooling &
process water.
Chemical Qualities : Maximum allowable concentrationToxic Substances
Arsenic (As) 0.3 mg/l 0.3 mg/l 1.0 mg/l 0.1 mg/l
Cadmium (Cd) 0.01 mg/l 0.01 mg/l - -
Chromium ( Cr) 0.05 mg/l 0.05 mg/l 0.05 mg/l 0.2 mg/l
Cyanide (CN) 0.05 mg/l 0.1 mg/l 0.05 mg/l 0.2 mg/l
Lead (Pb) 0.1 mg/l 0.1 mg/l - 0.1 mg/l
Boron (B) - - - 2.0 mg/l
Mercury (Hg) 0.001 mg/l 0.001 mg/l 0.001 mg/l -
Gross alpha activity 3 PCI/l 10-9 uc/ml 3 PCI/l 3 PCI/l
Gross Beta activity 30 PCI/l 10-8 uc/m 30 PCI/l 30 PCI/l
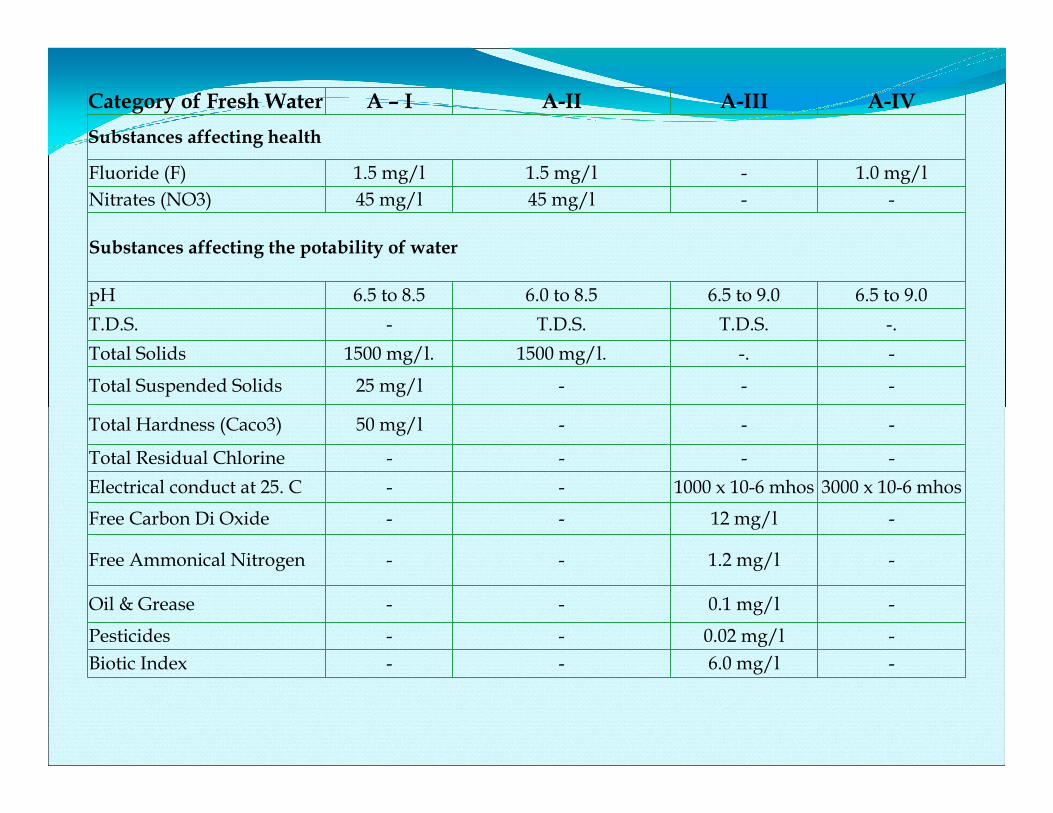
Category of Fresh Water A – I A-II A-III A-IVSubstances affecting health
Fluoride (F) 1.5 mg/l 1.5 mg/l - 1.0 mg/lNitrates (NO3) 45 mg/l 45 mg/l - -
Substances affecting the potability of water
pH 6.5 to 8.5 6.0 to 8.5 6.5 to 9.0 6.5 to 9.0T.D.S. - T.D.S. T.D.S. -.Total Solids 1500 mg/l. 1500 mg/l. -. -
Total Suspended Solids 25 mg/l - - -
Total Hardness (Caco3) 50 mg/l - - -
Total Residual Chlorine - - - -Electrical conduct at 25. C - - 1000 x 10-6 mhos 3000 x 10-6 mhos
Free Carbon Di Oxide - - 12 mg/l -
Free Ammonical Nitrogen - - 1.2 mg/l -
Oil & Grease - - 0.1 mg/l -
Pesticides - - 0.02 mg/l -Biotic Index - - 6.0 mg/l -

Category of Fresh Water A – I A-II A-III A-IV
Total Ammonical Nitrogen 1.5 mg/l 1.5 mg/l - 50 mg/l
Chlorides (Cl) 600 mg/l 600 mg/l - 600 mg/l
Sulphates 400 mg/l 400 mg/l - 1000 mg/l
Copper (Cu) 1.5 mg/l 1.5 mg/l - -
Manganese (Mn) 0.5 mg/l 3.0 mg/l - -
Iron (Fe) 1.0 mg/l 5.0 mg/l - -
Sodium - - - -
Zinc (Zn) 15.0 mg/l 1.5 mg/l 5.0 mg/l 5.0 mg/l
Phenolic Compounds 0.002 mg/l 0.002 mg/l 0.05 mg/l -
Alkyl Benzene sulphates 1.0 mg/l 1.0 mg/l - -
Mineral Oil 0.3 mg/l 0.3 mg/l - -
Ammonia 1.5 mg/l 1.5 mg/l - -
B.O.D. (5 days 20 . C)2.0 mg/l(Monthly
average of atleast 10 samples)
5.0 mg/l(Monthly average of atleast 10
samples)10 mg/l 30 mg/l
C.O.D. - - - 150 mg/l
D.O.Not less than 5 mg/l
(Monthly average of 100 samples)
4.0 mg/l Not less than 3 mg/l
Not less than 2 mg/l
Bacteriological Standards : Coliform Bact. 250 Not greater than 5000
(MPN/100)

• The entire water resources of the country have been classified according to their designated best uses and a “Water Use Map” has been prepared.
• For identification of the water bodies or their parts where water quality is at variance with water quality criteria, it was considered important to measure water quality of that water body or its part. It would help in preparation of “Water Quality Map” of India.
• The idea was to superimpose “Water Quality Map” on “Water Use Map” to identify the water bodies or their parts, which are in need of improvement (restoration).
• Subsequently through a wide network of water quality monitoring,water quality data are acquired. A large number of water bodies were identified as polluted stretches for taking appropriate measures to restore their water quality.
• Today almost all policies and programmes on water quality management are based on this concept including the Ganga Action Plan and National River Action Plans.

National Water Quality at a Glance
The water quality data on rivers, lakes, ponds, tanks and groundwater locations being monitored under the network is evaluated against the water quality criteria and the monitoring locations in exceedence with respect to one or more parameters are identified as polluted, which requires action for restoration of water quality.
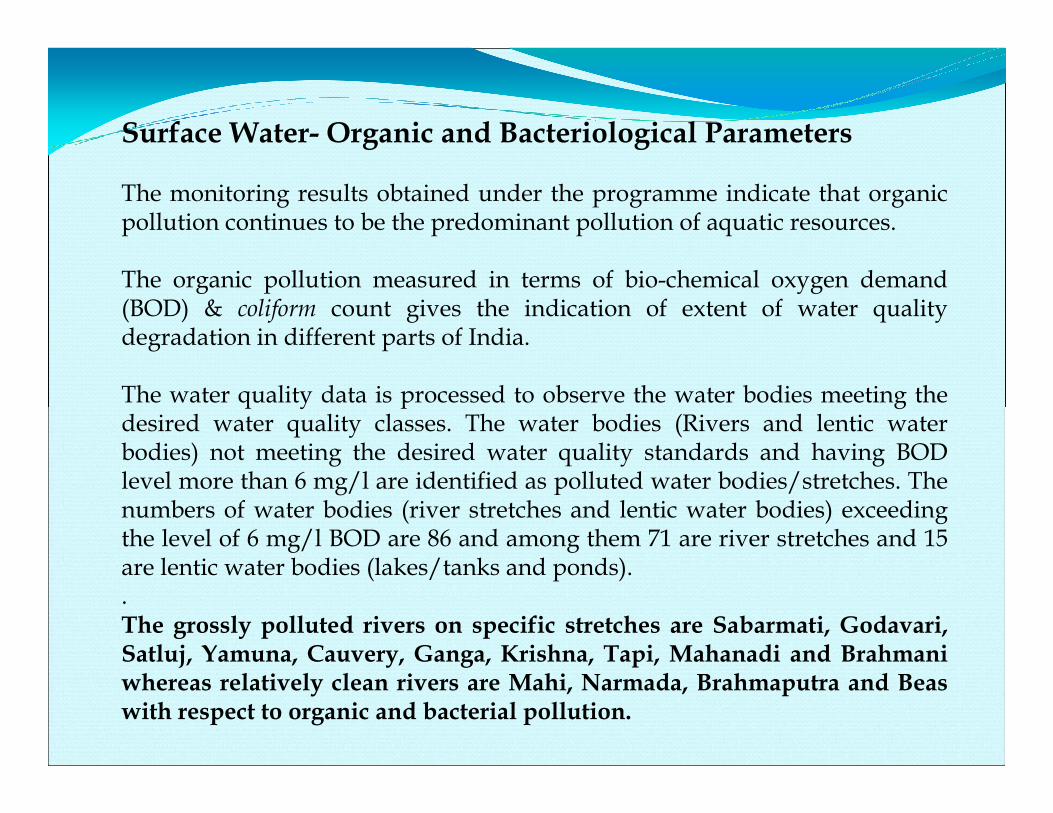
Surface Water- Organic and Bacteriological Parameters
The monitoring results obtained under the programme indicate that organic pollution continues to be the predominant pollution of aquatic resources.
The organic pollution measured in terms of bio-chemical oxygen demand (BOD) & coliform count gives the indication of extent of water quality degradation in different parts of India.
The water quality data is processed to observe the water bodies meeting the desired water quality classes. The water bodies (Rivers and lentic water bodies) not meeting the desired water quality standards and having BOD level more than 6 mg/l are identified as polluted water bodies/stretches. The numbers of water bodies (river stretches and lentic water bodies) exceeding the level of 6 mg/l BOD are 86 and among them 71 are river stretches and 15 are lentic water bodies (lakes/tanks and ponds). . The grossly polluted rivers on specific stretches are Sabarmati, Godavari, Satluj, Yamuna, Cauvery, Ganga, Krishna, Tapi, Mahanadi and Brahmani whereas relatively clean rivers are Mahi, Narmada, Brahmaputra and Beas with respect to organic and bacterial pollution.

S.No
Level of Pollution
Pollution Criteria
Riverine length, Km.
Riverine length percentage
01. Severely polluted
BOD more than 6 mg/l
6086 14
02. Moderately polluted
BOD 3-6 mg/l 8691 19
03. Relatively clean
BOD less than 3 mg/l
30242 67
WATER QUALITY STATUS
Analysis of 10 years data with respect to BOD values as indicator of organic pollution

Total riverine length under different water quality status
0
1000
2000
3000
4000
5000
6000
7000
JK HP PB HR UP RJ MP BH WB OR AP MH GU KA KE TN AS MG MN AR SK NG MZ GO DL
States
Riv
erin
e le
ngth
, Km
BOD < 3 mg/LBOD 3-6 mg/LBOD >6 mg/L

Subsurface Water
The subsurface Water Quality is degraded mainly due to natural reasons along with over withdrawal of water, unsanitary conditions in rural and urban areas and increased application of fertilizers and POP’s.
The parameters of concern in subsurface water are :
• Higher level of Fluoride in several pockets of the country (about 200 districts are being affected);
• Arsenic problem in parts of West Bengal, specially in 24 Paragna’s of West Bengal;
• Nitrate problems observed in many parts of the country especially in intensively irrigated and high productivity regions from agriculture point of view; and in urban areas due to improper and inadequate sewage collection;
• Salinity problems in intensive irrigated (command areas) and coastal areas of the country;
• Micro pollutants, especially pesticides due to their intensive applications in certain parts of the country; and
• Pathogenic pollution in urban areas, due to unsanitary conditions.
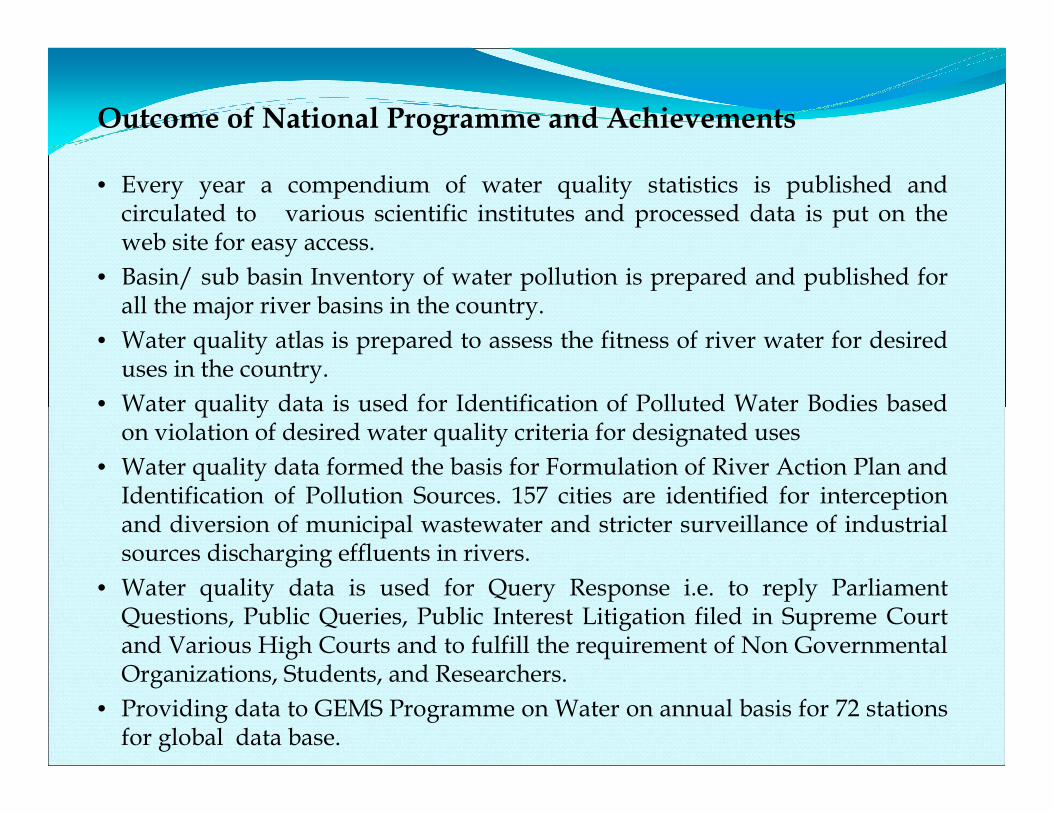
Outcome of National Programme and Achievements
• Every year a compendium of water quality statistics is published and circulated to various scientific institutes and processed data is put on the web site for easy access.
• Basin/ sub basin Inventory of water pollution is prepared and published for all the major river basins in the country.
• Water quality atlas is prepared to assess the fitness of river water for desired uses in the country.
• Water quality data is used for Identification of Polluted Water Bodies based on violation of desired water quality criteria for designated uses
• Water quality data formed the basis for Formulation of River Action Plan and Identification of Pollution Sources. 157 cities are identified for interception and diversion of municipal wastewater and stricter surveillance of industrial sources discharging effluents in rivers.
• Water quality data is used for Query Response i.e. to reply Parliament Questions, Public Queries, Public Interest Litigation filed in Supreme Court and Various High Courts and to fulfill the requirement of Non Governmental Organizations, Students, and Researchers.
• Providing data to GEMS Programme on Water on annual basis for 72 stations for global data base.
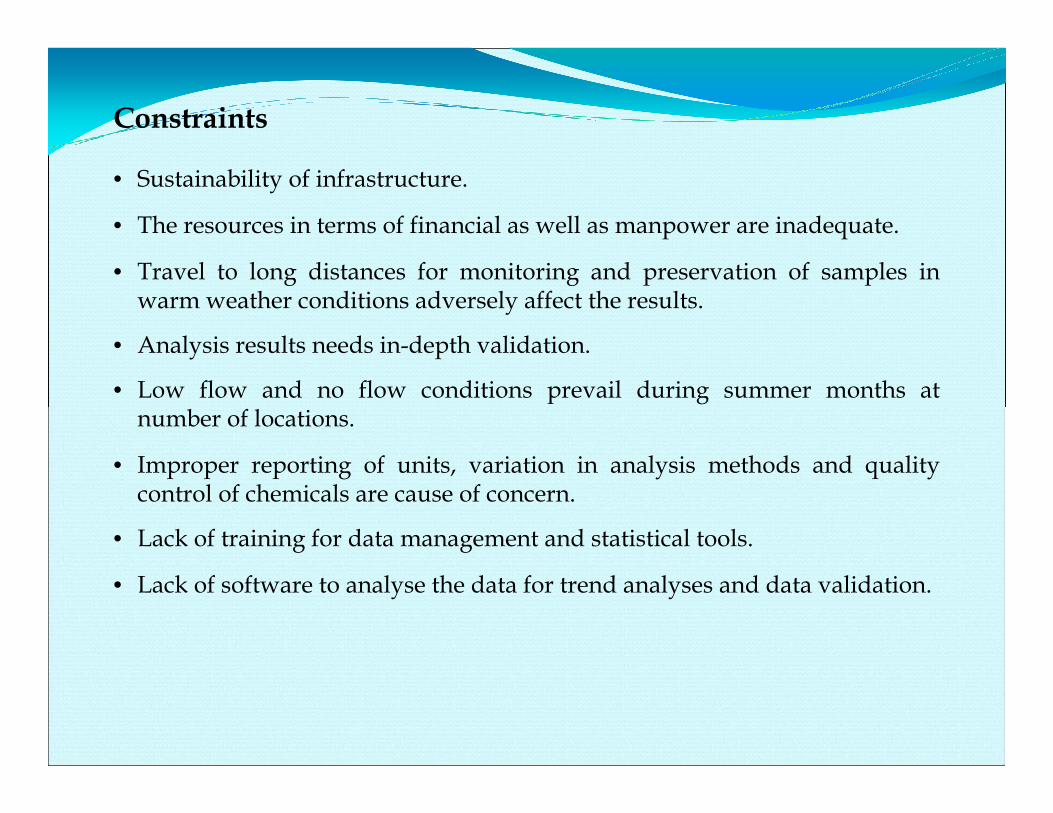
Constraints
• Sustainability of infrastructure.
• The resources in terms of financial as well as manpower are inadequate.
• Travel to long distances for monitoring and preservation of samples in warm weather conditions adversely affect the results.
• Analysis results needs in-depth validation.
• Low flow and no flow conditions prevail during summer months at number of locations.
• Improper reporting of units, variation in analysis methods and quality control of chemicals are cause of concern.
• Lack of training for data management and statistical tools.
• Lack of software to analyse the data for trend analyses and data validation.

Contd…..
QUALITY ASSURANCE AND QUALITY CONTROL

WHAT IS MEANT BY QUALITY ASSURANCE AND QUALITY CONTROL?
Quality Assurance and Quality Control (QAQC), when explained in terms of a sample of water from a lake, river or stream, means that the analysis of the sample is carefully controlled to guarantee that the results are assured to be accurate within acceptable limits and recognized standards.
Even the best water quality data may have errors, and it is the goal of the QA/QC program to measure and minimize these errors.

Quality Assurance Programme
The objective of a water quality monitoring programme is to produce data and information on the quality of water resources, so that appropriate decision could be taken by the management .
The goal of a laboratory Quality Assurance Programme is
To ensure meaningful water quality assessment
To have confidence in results, based on standardized procedures for all components of water quality monitoring

Data Quality
Data quality is described by its accuracy, precision, completeness, representativeness, and comparability.
Accuracy is the difference between measured value and the "true" value.
It is one of the most difficult QA/QC parameters to measure, since you usually don't know what the true value is. The most common way to estimate accuracy is to test your methods with a sample that has a known chemical concentration (this kind of sample is known as a reference sample). Accuracy is then the difference between the measured value and the true value, expressed as a percentage of the true value:
Accuracy = 100 x (Measured Value - True Value)/True Value
If a method's accuracy is 10%, you would expect your measurements to be within 10% of the true value.
Precision describes the repeatability of methods.
A method is precise if you get the same result every time you analyze similar samples, and imprecise if you get widely-differing results.
Precision is measured by analyzing two duplicate water samples that are taken at the same location and time. It is expressed as the Relative Percent Difference (RPD) between the chemical concentrations measured from the two duplicates:
RPD = 100 x (Duplicate 1 - Duplicate 2)/(Average of the two duplicates)
where Average = (Duplicate 1 + Duplicate 2)/2
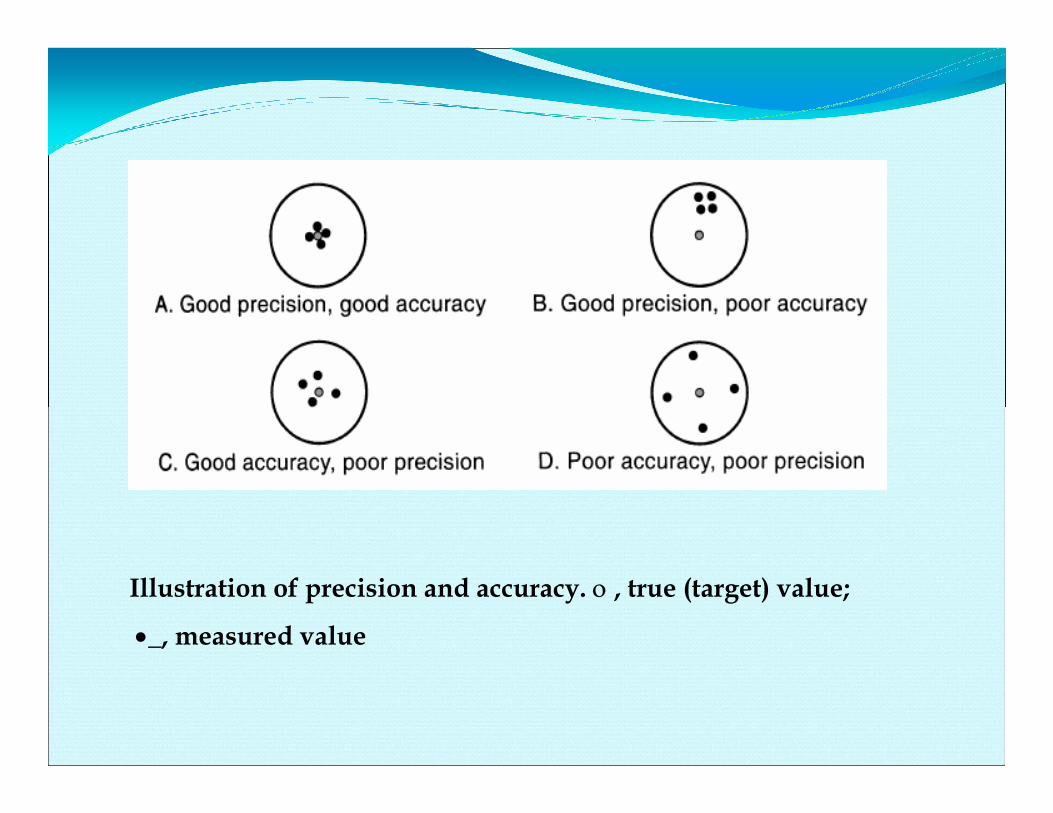
Illustration of precision and accuracy. ο , true (target) value;
•_, measured value

Completeness measures how well you finished all of the sampling that you originally planned to do.
Completeness is expressed as the percentage of samples you measured relative to the number that were planned.
For instance, if you were supposed to take 10 samples at a location and were only able to take 9, your data completeness would be 90 percent. Few monitoring programs can achieve 100% completeness; bad weather, equipment problems, and budget problems all result in some loss of data.
Representativeness describes how well your sample represents the environmental condition you are trying to measure. It is controlled primarily by how you choose your sampling locations and timing.
For instance, a sample collected just after an oil spill would not be representative of typical conditions in the river.
A sample collected downstream of a sewage treatment plant would not be representative of background (or natural) water quality.
Comparability describes how well your data can be compared with other data. To maintain comparability, the methods you use to collect and analyze samples should remain consistent - you should not switch methods in the middle of a study without good reason.
If you are trying to compare your results to data from an earlier study, you should sample at the same locations and at the same times of year.

SOURCES OF ERROR
A typical sample goes through a lot of steps before it becomes part of your water quality data set, and there is potential for error at each of these steps.
The major sources of error are measurement error, sample handling error, and natural variability.
Measurement errors result because none of the methods (field kits, calibrated instruments, or laboratory analysis) provide perfect water quality measurements. Measurement error can be reduced by instrument calibration, proper training, and equipment maintenance, but it never goes away entirely.
A special kind of measurement error comes from the method's detection limit.As chemical concentrations approach zero it becomes more and more difficult to get accurate measurements. The point where the method is no longer able to detect a chemical is called the method detection limit.
For instance, if a field kit cannot measure nitrate concentrations below 5 mg/l; this method's detection limit is therefore 5 mg/l. The important idea here is that you never report a value of zero concentration, since all you really know is that the concentration is less the detection limit. Instead of writing zero as the result, you write the detection limit with a less-than symbol (for example, nitrate concentration = <5 mg/l).

Sample handling errors come from the ways in which you collect and handle your samples.
Samples may be contaminated from your hands, or because air is trapped in the sample bottle when you close it.
Improper storage and transportation of the sample are other sources of handling error. This kind of error is minimized by closely following proper handling procedures.

Natural variability is often the biggest source of imprecision, and is unfortunately largely out of your control.
When you are measuring water quality in a river, you are really only sampling the small piece of the river that you are able to fit into your sample bottle. During the few seconds it takes you to fill your 1-liter sample bottle, literally thousands of cubic meters of water have flowed past you. Every parcel of this water will have different water quality characteristics than what you measure in your sample.
Natural variability is a basic feature of a river, and cannot be controlled. The best approach is therefore to quantify this variability by taking as many samples as you can afford.
Specific Data Validation Tests
A series of data checks, as listed below, should be carried out to identify any problems in the data.
• Absolute checking/Data entry
• Checking if data is within the detection limits of a particular method
• Checking if the data is within the expected ranges for a parameter
• Checking if there are too many (or too few) significant digits reported
• Checking if data are physically or scientifically possible (general checks)
• Checking correlation of parameters (Some conditional checks)
• Checking the correlation between EC and TDS
• Checking the cation-anion balance
Absolute checking/Data entry
Absolute checking implies that data or code values have a value range that has zero probability of being exceeded.
For Ex: geographical coordinates of a station must lie within the country boundary,the day number in a date must lie in the range 1-31
Detection Limits
The water quality results reported cannot be less than the detection limit of the analytical procedure being used to measure the concentration.
Checking WQ data against expected ranges
Water quality data can also be checked against expected ranges.
Significant Digits
The number of significant digits to be reported for a water quality result depends on:
• the precision of the analytical procedure used• the absolute value of the result compared to the range of expected results
General Checks
General checks are made to see if the water quality results are physically or scientifically possible.A simple general check is that the totals of any variable must be greater than the component parts as in the following examples:
• Total coliforms must be greater than faecal coliforms
• Total iron must be greater than dissolved iron
• Total phosphorus must be greater than dissolved (ortho-)phosphorus
• Total iron must be greater than dissolved iron
Total solids ≥ Total dissolved solidsTotal solids ≥ Total settleable solids
Some conditional checks: correlation of parameters
When there are known correlations between one or more water quality parameters these can be used to .Some of the more well known correlations between parameters are:• Total dissolved solids and specific conductance• pH and carbonate species• pH and free metal concentrations• Dissolved oxygen and nitrate
Conditional checks
If pH > 6 then Al+3 < detection limitIf pH > 6 then Mn+2 < detection limitIf pH < 8.3 then CO3-2 =0If DO (mg/l) = 0 then NO3- =0If DO (mg/l) > 0 then NO3- >0If DO (mg/l) > 7 then Fe+2 =0

Correlation between EC and TDS
The numerical value of Electrical Conductivity (EC) in µS/cm should be higher than that of Total Dissolved Solids (TDS) in mg/l..

Cation-Anion Balance
The principle of electroneutrality require that the sum of the positive ions (cations) must equal the sum of the negative ions (anions).
Note: An accurate ion balance does not necessarily mean that the analysis is correct. There may be more than one error and these may cancel each other out.

HOW DOES A LABORATORY ACHIEVE QAQC STATUS?
The first step is to adopt standard methods for each parameter to be tested.
Secondly, all workers in the laboratory must be carefully trained so that they understand the importance of each step in the analysis procedure.
Thirdly, all steps must be properly logged and continuously reviewedto be sure no hitch occurs.
Thanks

Thanks
QUALITY CONTROL CHECKS
Every sampling program should have a set of tests and checks that measure data quality.
Common checks include duplicate samples, blanks, reference samples, and performance audits.
Duplicate samples are simply two identical samples collected and handled in the same way. They measure the precision of your methods.
• Field duplicates are two samples collected in the field from the same location at the same time; these measure the precision of your entire procedure (sampling, storage and handling, and laboratory analysis).
• Laboratory duplicates are two samples split from a single sample once it has arrived at the laboratory. These test the precision of the laboratory methods only.

Blanks are samples containing pure, uncontaminated water. Blanks contain none of the chemical you are trying to measure, and are used to identify contamination that might occur in the field or laboratory. If your laboratory measures a positive chemical concentration in a blank, you then know that there is a source of contamination somewhere in your procedure.
A field blank is a blank sample that is placed in a sample bottle at the field site, and is handled the same as a normal sample. It identifies contamination that might occur in your entire procedure (from field sampling to laboratory analysis).
A laboratory blank is prepared at the laboratory, and tests for laboratory contamination only.

Reference samples are prepared by an independent laboratory, and contain a known concentration of the chemical you are measuring.
They are similar to the standards used in instrument calibration, except that the actual concentration is kept secret from your laboratory people.
Reference samples measure the accuracy of your laboratory procedures.
A performance audit is an independent review of your sampling and laboratory methods, conducted by someone who is familiar with your project but is not a part of your day-to-day project team.
The idea is to have your work reviewed by a qualified person who has no stake in the outcome of your project.
The performance auditor will check to see how well you are following your sampling and QA/QC plans.

Thanks