Water-Quality and Lake-Stage Data for Wisconsin Lakes, Water Year 1999 … · 2011-01-09 ·...
148
Water-Quality and Lake-Stage Data for Wisconsin Lakes, Water Year 1999 er 2 U.S. GEOLOGICAL SURVEY Open-File Report 00-89 Prepared in cooperation with the State of Wisconsin and local agencies ience for a changing world
Transcript of Water-Quality and Lake-Stage Data for Wisconsin Lakes, Water Year 1999 … · 2011-01-09 ·...
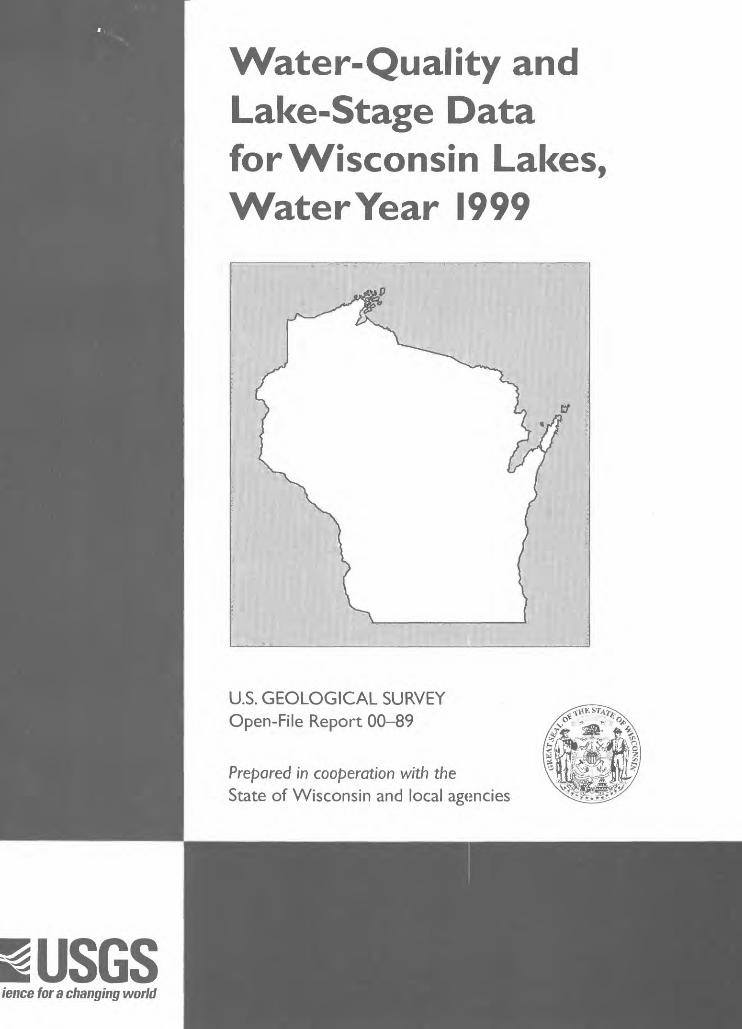
Water-Quality and Lake-Stage Data for Wisconsin Lakes, Water Year 1999
er 2
U.S. GEOLOGICAL SURVEY Open-File Report 00-89
Prepared in cooperation with theState of Wisconsin and local agencies
ience for a changing world


WATER-QUALITY AND LAKE-STAGE DATA FOR WISCONSIN LAKES, WATER YEAR 1999
By Wisconsin District Lake-Studies Team
U.S. GEOLOGICAL SURVEY Open-File Report 00-89
A report by the Wisconsin District Lake-Studies Team-D.L. Olson (team leader), J.F. Elder, H.S. Garn, G.L. Goddard,E.A. Mergener, D.M. Robertson, and W.J. Rose
Prepared in cooperation withTHE STATE OF WISCONSIN AND OTHER AGENCIES
Middleton, Wisconsin 2000

U.S. DEPARTMENT OF THE INTERIOR BRUCE BABBITT, Secretary
U.S. GEOLOGICAL SURVEY Charles G. Groat, Director
For additional information write to:
District Chief U.S. Geological Survey 8505 Research Way Middleton, Wl 53562
Copies of this report can be purchased from:
U.S. Geological SurveyEarth Science Information CenterOpen-File Reports SectionBox 25286, MS 517Denver Federal CenterDenver, CO 80225

CONTENTS
Introduction........................................................................ 1Methods of data collection ............................................................ 4Explanation of physical and chemical characteristics of lakes................................. 8
Water temperature and thermal stratification........................................ 8Specific conductance......................................................... 10Water clarity................................................................ 11pH ...................................................................... 11Dissolved oxygen ........................................................... 12Phosphorus................................................................ 13Nitrogen................................................................... 13Chlorophyll a............................................................... 14
Classification of lakes............................................................... 14References cited................................................................... 16Lake data ........................................................................ 19
Benedict near Powers Lake, 423201088180800.................................... 21
Big Hills (Hills) near Wild Rose (440912089092000 ................................. 23
Big St. Germain near Lake Tomahawk, 05390750 .................................. 25
Big Sissabagama
near Stone Lake, 454724091303600 ......................................... 26
North Site, near Stone Lake, 454800091312900 ................................ 29
Buffalo
Center Site, at Packwaukee, 434558089260600 ................................ 31
East End, at Montello, 434720089201600 ..................................... 33
West End, near Endeavor, 434414089282400.................................. 35
Delavan
near Delavan, 423706088363400............................................ 37
at Center near Delavan Lake, 423556088365001 ............................... 38
at North End near Lake Lawn, 423659088354401 ............................... 43
at SW End near Delavan Lake, 423526088380101 .............................. 43
Devils near Baraboo, 05404500 ................................................ 44
Eagle Spring at Eagleville, 425103088261500 ..................................... 45
Fish near Sauk City, 05406050 ................................................. 47
Geneva
at Lake Geneva, 423525088260400.......................................... 48
Geneva Bay, at Lake Geneva, 423455088263800............................... 50
Williams Bay, at Williams Bay, 423420088320500 ............................... 51
Center, near Lake Geneva, 423402088301400 ................................. 52
East End, near Lake Geneva, 423421088272300 ............................... 55
West End, near Williams Bay, 423329088323300 ............................... 61
Green at County Trunk Highway A near Green Lake, 434928088553601 ................ 67
Koshkonong near Newville, 05427235 ........................................... 68
Little Arbor Vitae near Woodruff, 455446089370300 ................................ 69
iii

CONTENTS-Continued
Little Cedar
North Site, near West Bend, 432255088134700 ................................ 70
South Site, near West Bend, 432249088134500 ................................ 72
Little Green, at Center, near Markesan, 43441208859070079 ......................... 74
Little Muskego at Muskego, 425425088083500 .................................... 76Little St. Germain
near Eagle River, 05390700 ................................................ 79Northeast Bay, near St. Germain, 455545089262500 ............................ 80South Bay, near St. Germain, 455437089270800 ............................... 82West Bay, at St. Germain, 455428089282400 .................................. 84
Little Sand near Mole Lake, 04074651 ........................................... 86Mendota at Madison, 05428000 ................................................ 87
Middle at Lauderdale, 424621088335500......................................... 88
Middle Genesee near Oconomowoc, 430309088284800............................. 90Monona at Madison, 05429000................................................. 92Muskego (Big Muskego)
Bass Bay, near Muskego, 425344088070100 .................................. 93Muskego, near Wind Lake, 425109088075000 ................................. 96Muskego, South Site, near Muskego, 425112088072800 ......................... 97
Namekagon LakesGarden, near Cable, 461224091030200....................................... 99
Jackson,near Cable, 461457091065900 ..................................... 101
NamekagonDeep Hole, near Cable, 461308091065100................................. 103East Basin, near Cable, 461228091044300 ................................ 105Northeast Basin, near Cable, 461410091050700 ............................ 107
OconomowocNo. 1 (Center) at Oconomowoc, 430551088273500 ............................ 109No. 2 (off Hewitt Point) at Oconomowoc, 430609088262200...................... 111
Okaucheeat Okauchee, 430723088252100 ........................................... 113No. 1, near Okauchee,430759088244200.................................... 115No. 2, at Okauchee, 430645088264500...................................... 115No. 3, at Okauchee, 430642088252400...................................... 116No. 4, at Okauchee, 430757088261700...................................... 116
Potter near Mukwonago, 424905088204000 ..................................... 117Powers at Powers Lake, 423246088175800...................................... 119Shell at Shell Lake, 05334000. ................................................ 121Tombeau near Powers Lake, 423153088184800 .................................. 123Whitefish
North Site, near Gordon, 461321091520900 .................................. 125South Basin, near Gordon, 461212091523200................................. 127
iv

CONTENTS-Continued
Whitewater near Whitewater, 424608088414800 .................................. 129Wind
at Wind Lake, 424915088083900........................................... 130Outlet at Wind Lake, 424848088083100...................................... 133
Winnebago
at Oshkosh, 04082500 ................................................... 134near Stockbridge, 04084255............................................... 135
Wisconsin District publications pertaining to lakes........................................ 136
FIGURE
Figure 1. Map showing location of lake water-quality and lake-stage stations in Wisconsin....................2
TABLES
Table 1. Discontinued lake stations..........................................................................................................5
2. WATSTORE parameter codes, minimum reporting limits, and laborator identifying codes for chemical parameters commonly measured in lakes, and analyzed at the National Water-Quality Laboratory or the Wisconsin State Laboratory of Hygiene.............9

CONVERSION FACTORS, VERTICAL DATUM, AND ABBREVIATED WATER-QUALITY UNITS
Multiply
mile (mi)
pound (Ib)
acre
foot (ft)
gallon (gal)
square mile (mi2)
By
1.609
453.6
0.4048
0.3048
3.785
2.590
To Obtain
kilometer
gram
hectare
meter
liter
square kilometer
Temperature, in degrees Celsius (°C) can be converted to degrees Fahrenheit (°F) by use of the following equation:
°F=1.8(°C) + 32.
Sea level: In this report "sea level" refers to the National Geodetic Vertical Datum of 1929 (NGVD of 1929)-a geodetic
datum derived from a general adjustment of the first-order level nets of both the United States and Canada, formerly
called Sea Level Datum of 1929.
Abbreviated water-quality units: Chemical concentrations and water temperature are given in metric units. Chemical
concentration is given in milligrams per liter (mg/L) or micrograms per liter (|0,g/L). Milligrams per liter is a unit
expressing the concentration of chemical constituents in solution as weight (milligrams) of solute per unit volume (liter)
of water. One thousand micrograms per liter is equivalent to one milligram per liter. For water with dissolved-solids
concentrations less than 7,000 mg/L, the numerical values for concentrations expressed as mg/L and |0,g/L are the same as
for concentrations in parts per million and parts per billion, respectively.
Specific conductance of water is expressed in microsiemens per centimeter at 25 degrees Celsius (|0,S/cm). This unit is
equivalent to micromhos per centimeter at 25 degrees Celsius (^mho/cm), formerly used by the U.S. Geological Survey.
VI

WATER-QUALITY AND LAKE-STAGE DATA
FOR WISCONSIN LAKES, WATER YEAR 1999By Wisconsin District Lake-Studies Team
INTRODUCTION
The U.S. Geological Survey (USGS), in cooperation with local and other agencies, collects data at selected lakes throughout Wisconsin. These data, accumulated over many years, provide a data base for developing an improved understanding of the water quality of lakes. To make these data available to interested parties outside the USGS, the data are published annually in this report series. The location of water-quality and lake-stage stations in Wisconsin for water year 1999 are shown in figure 1. A water year is the 12-month period from October 1 through September 30. It is designated by the calendar year in which it ends. Thus, the period October 1, 1998 through September 30, 1999 is called "water year 1999."
The purpose of this report is to provide information about the chemical and physical charac teristics of Wisconsin lakes. Data that have been collected at specific lakes, and information to aid in the interpretation of those data, are included in this report. Data collected include measure ments of in-lake water quality and lake stage. Time series of Secchi depths, surface total phosphorus and chlorophyll a concentrations collected during non-frozen periods are usually included for lakes with two or more years of data. Graphs of vertical profiles of temperature, dissolved oxygen, pH, and specific conductance are included for sites where these parameters were measured. Descriptive information for each lake includes: location of the lake, area of the lake's watershed, period for which data are available, revisions to previously published records, and pertinent remarks. Additional data, such as streamflow and water quality in tributary and outlet streams of some of the lakes, are published in another volume: "Water Resources Data- Wisconsin, 1999."
Water-resources data, including stage and discharge data at most streamflow-gaging stations, are available throught the World Wide Web on the Internet. The Wisconsin District's home page is at http://wi.water.usgs.gov/. Information on the Wisconsin District's Lakes Program is found at wi.water.usgs.gov/lake/index.html.

92|40 60 MILES
,_______ I I 1 I I
0 20 40 60 KILOMETERS
46
9 Whitefish ^Namekagoa
BigSt.Germam
Little Arbor Vitae J/ttfe st Qerma/^i
; O N E I D A
WASHBU^N ± BigSissabagan\a Shell , i
PQRTA3E WAUPACA | OUTAGAIVj| E ! BROWN
j VV'NNE- ICALUMETj MANITOWOCWAUShARA ! <« ' N N E ' B A G C
Hills I QWinnebago j_
i FOND DU LAC | SHE30YG
LittleGreen
DeVilS COLUMBIA ! DODGE ' :O i ' o ca ' c L^~ vl*amrii&c
s AuK :-'_ Fish_ _j LittleCed&rj^ }/ \^'Oconomowoc
i \ rt/ti^f 3 ^R E E N . 3 0 C K : WALWORTH ! ;~~!-
Delavan* \EXPLANATION
Green Lg^ name
o Lake-stage station
Lake water-quality and stage station
Note: at some lakes more than one site may be monitored.
Middle Genesee
Little Muskego BlgMuskego Eagle Spring
Benedict
Tombeau\
Lauderdale (Middle)
Figure 1. Location of lake water-quality and lake-stage stations in Wisconsin.

The USGS has done cooperative lake monitoring with local and other agencies since 1983. Cooperators in 1999 included:
Benedict/Tombeau Lake DistrictBig Muskego Lake DistrictBuffalo Lake DistrictCity of MuskegoDane County Department of Public WorksEagle Spring Lake Management DistrictGeneva Lake Environmental AgencyGreen Lake Sanitary DistrictLittle Cedar Lake Protection and Rehabilitation DistrictLittle Green Lake Protection and Rehabilitation DistrictLittle Muskego Lake Protection and Rehabilitation DistrictLittle St. Germain Lake Protection and Rehabilitation DistrictMiddle Genesee Lake DistrictOkauchee Lake Management DistrictPotters Lake Protection and Rehabilitation DistrictPowers Lake DistrictRock County Public Works DepartmentTown of AuburnTown of Delavan (Delavan Lake)Town of Namekagon (Namekagon Lakes Association)Town of Sand Lake (Big Sissabagama Lake Association)Town of Wascott (Whitefish Lake Association)U.S. Army Corps of EngineersVillage of Oconomowoc LakeWhitewater Lake Management DistrictWind Lake Management DistrictWisconsin Department of Natural Resources

Lake data-collection sites are identified by a unique identification number. Lake water-
quality sites are identified by a 15-digit number that is a concatenation of the site's latitude,
longitude, and a two-digit sequence number. The sequence number is used to distinguish
between sites located at the same latitude-longitude designation. The site identification number
is permanently assigned to the site; actual latitude and longitude of the site are subject to update
and are stored separately. For some lakes, which have historical records of lake stage, an eight-
to-ten digit number is assigned according to downstream order. Gaps are left in the numerical
series to allow for new stations; hence, the numbers are not consecutive. The first two digits of
the complete eight-to-ten digit number, such as 04087000 or 054310157, designate the major
river basin. For example, "04" designates the St. Lawrence River Basin and "05" designates the
Upper Mississippi River Basin.
The water-quality lake stations that were discontinued prior to water year 1999 are listed in
table 1. Discontinued lake-stage stations are not included in this table.
This report is the culmination of a concerted effort by a number of people who collected,
compiled, analyzed, verified, and organized the data, and who typed, edited, and assembled the
report. The authors had primary responsibility for assuring that the information contained herein
is accurate, complete, and adheres to USGS policy and established guidelines. Technicians in
charge of the field offices are: T.J. Popowski (Rice Lake), J.J. Hanig (Merrill), and J. Habale
(Middleton). The data were collected and processed by G.L. Goddard, B.M. Gray, J.J. Hanig,
D.E. Housner, J.A. Jasinski, S.B. Marsh, E.A. Mergener, D.L. Olson, and J.G. Schuler. P.A. Stark assembled, edited, and formatted the report. Additional assistance in preparation of the report
was provided by M.M. Greenwood.
METHODS OF DATA COLLECTION
Depth profiles of water temperature, dissolved oxygen, pH, and specific conductance were
collected using multi-parameter meters. Prior to measurements, the meters were calibrated using standards for pH and conductance, and dissolved oxygen was calibrated using the air calibration
method. Generally, field measurements in profiles were made at 0.5-m intervals if the maximum
depth of the lake was 5 m or less and at 1.0-m intervals if the maximum depth was greater than
5 m.
4

Table 1 . Discontinued lake stations
Station name Site identification number Period of record
Alma Lake near St. Germain
Balsam Lake, off Cedar Island, at Balsam Lake off Little Narrows, near Balsam Lake
off Rock Island, near Balsam Lake near Birchwood
Bass Lake near Shawano
Bear Lake at Deep Hole near Haugen
Beaver Dam Lake, South end, at Beaver Dam
North end, near Beaver Dam
Big Blacksmith Lake near Keshena
Big Muskego Lake, at North Site, near MuskegoResearch Base, near Muskego
Big St. Germain Lake near St. Germain Booth Lake near East Troy Denoon Lake at Wind Lake Druid Lake near Hartford
Eagle Lake near Kansasville
Eagle Lake, at Deep Hole, near Kansasville
Elizabeth Lake near Twin Lakes
Forest Lake near DundeeFowler Lake, Center, at Oconomowoc
Fox Lake Deep Hole at Fox Lake
Hemlock Lake near Mikana
Hooker Lake at Salem
Kirby Lake near Cumberland
Balsam Lake, (Site 1) near Cumberland
(Site 2) near Cumberland
(Site 3) near Cumberland
(Site 4) near Cumberland(Site 5) near Cumberland(Site 6) near Cumberland
Lac La Belle, Center, at Oconomowoc
NW, at Oconomowoc
SE at Oconomowoc
Lake Blass at Lake Delton
Lake Keesus, East Bay, near MertonNorth Bay, near Merton
Lake Morris at Mount Morris Lake Nebagamon, Northeast Bay, at Lake Nebagamon
455426089254700
452755092264600452858092265300
452754092234300
453907091345800
445215088300300453754091490900
432814088515000
433122088545700
445401088334500
425301088061300425235088075300
455557089311000424800088254800425044088100300431643088243300
05544500
424207088072400
423051088155300
433632088100200
430653088294601
433458088560600453421091333700
423335088060300
453554092042101
453608092035801
453601092035301
453612092034901
453603092035701453608092041201453555092040901
430733088305900
430809088313900
430707088301400
433545089482400
4309570088183400
431006088191000440654089120500463050091412300
Oct. 1984-Sept. 1990, May 1992-Sept. 1996 Feb. 1991-Aug. 1994 May 1991-Aug. 1994 May 1991-Aug. 1994 Mar. 1993-Aug. 1994, Mar. 1996-Aug. 1997 Feb. 1990-Aug. 1992 Mar. 1992-Aug. 1993 June-Oct. 1991 June-Oct. 1991 Feb. 1990-Aug. 1992 Feb.-Aug. 1988 May-^June 1994 Feb. 1992-Aug. 1996 Feb. 1992-Aug. 1994 Feb. 1991-Aug. 1996 Feb. 1991-Sept. 1996 1936-64, 1975-77, 1979, Feb. 1993-Sept. 1996 Feb. 1993-Aug. 1996 Feb. 1995-Sept. 1997 Mar. 1994-Aug. 1996 Jan-Dec. 1984, Oct. 1986-Sept. 1996 June 1991-Mar. 1993 Mar. 1993-Aug. 1994, Mar. 1996-Aug. 1997 Feb. 1992-Aug. 1993 Nov. 1995-Oct. 1996 Nov. 1995-Nov. 1996 Nov. 1995-Nov. 1996 Nov. 1995-Nov. 1996 Nov. 1995-Nov. 1996 Nov. 1995-Nov. 1996 Nov. 1995-Nov. 1996 Feb. 1984-Aug. 1985, Feb.-Sept. 1991 Feb. 1984-Aug. 1985 Feb. 1984-Aug. 1985 Mar. 1989-Aug. 1990 Apr. 1991-Aug. 1995 Apr. 1991-Aug. 1995 Jun. 1983-Sept. 1989 May 1992-Aug. 1995

Table 1 . Discontinued lake stations
Station name Site identification number Period of record
Southeast Bay, at Lake Nebagamon West Bay, at Lake Nebagamon
Lake Noquebay near Crivitz
East End, near Crivitz Lamotte Lake near Shawano
Lauderdale Lakes
at Lauderdale
Green near Lauderdale
Mill at Lauderdale
Legend Lake (site 1) near Shawano Little Rock Lake near Woodruff
Long (Kee Nong Go-Mong) Lake at Wind Lake
Loon Lake near Shawano
Lost Lake near Beaver Dam
McKenzie Lakes
McKenzie (Big McKenzie)
Deep Hole, near Spooner
Northern Site, near Spooner South Site, near Spooner
Lower McKenzie, near Webb LakeMiddle McKenzie, near Spooner
Mary (Marie) Lake at Twin Lakes Max Lake near Woodruff
Mead Lake, East Bay near Willard
West Bay near Willard Montello Lake at Montello
Moon Lake near St. Germain
Morgan Lake near Fence Moshawquit Lake near Shawano Park Lake (site 1) at Pardeeville
(site 2) at Pardeeville(site 3) at Pardeeville
(site 4) at Pardeeville
Pretty Lake, at Deep Hole, near Dousman
Red Cedar Lake, Deep Hole, near Mikana
South End, at Mikana
Rice Lake at Deep Hole near Whitewater Round Lake near Shawano
462928091413500
463034091425300
451511087550900
451540087525700
445305088361200
424554088332700
424652088341500
424555088335700
445342088312700
455946089415702
424937088103400
445009088303700
432640088580500
455507092013500
455540092022000
455437092022300
455902092011900
455635092021800
423128088151200
460128089423501
444720090445000
444733090460100
434748089195800
455504089260500
454622088324801
445352088295800
433239089175800
433226089175500
433245089173000
433257089165100
425722088295000
453725091345100
453519091352500
424629088415700
445328088335000
Mar. 1992-Sept. 1995 May 1992-Aug. 1995 Feb. 1987-Aug. 1988, Apr. 1991-Aug. 1994 Apr. 1991-Aug. 1994 Feb. 1990-Aug. 1992
Oct. 1993-Oct. 1994 Nov. 1993-Nov. 1994 Nov. 1993-Nov. 1994 Feb. 1990-Feb. 1992 Oct. 1983-Sept. 1996 Feb. 1988-Aug. 1989, Feb. 1991-Aug. 1996 Feb. 1991-Aug. 1993 June-Oct. 1991
Feb. 1987-Aug. 1998 June 1997-Aug. 1998 June 1997-Aug. 1998 June 1997-Aug. 1998 June 1997-Aug. 1998 Feb. 1995-Aug. 1997 Mar. 1988-Dec. 1996 Apr. 1991-Aug. 1995 Feb. 1991-Sept. 1995 Feb. 1995-Aug. 1998 Feb. 1992-Aug. 1996 Oct. 1987-Sept. 1998. Feb. 1990-Aug. 1992 Feb. 1986-Aug. 1987, May-Nov. 1993 May-Nov. 1993 May-Nov. 1993 May-Nov. 1993 Feb. 1993-Aug. 1997 Mar. 1993-Aug. 1994, Mar. 1996-Aug. 1997 Mar. 1993-Aug. 1994, Mar. 1996-Aug. 1997 Apr.-Nov. 1991 Feb. 1990-Aug. 1992

Table 1 . Discontinued lake stations
Station name Site identification number Period of record
Sand Lake (Deep Hole) near Keshena
Silver Lake near Oconomowoc
Silver Lake near West BendSinissippi Lake, off Anthony Is., at Hustisford
off Butternut Is., near Hustisfordoff Sam Point, near Hustisford
Spirit Lake near Keshena
Stewart Lake at Mt. Horeb
Tichigan Lake near Waterford
Upper Nemahbin Lake, Center, near Delafield
South Site, near Delafield
Outlet near Delafield
Vandercook Lake near Woodruff Watosah-skice Lake near Keshena
Waubeesee Lake at Wind Lake
Whitewater Lake, off Heart Prairie, near Whitewater
near Whitewater
North Bay, near Whitewater
South Bay, near Whitewater
Wind Lake, Northeast Basin, at Wind Lake
Wolf Lake near Mt. Calvary
445321088323101
430436088293300432322088125000432113088361100432240088363900
432300088374200
445400088320100
430117089442701
424854088123300
430400088254900
430339088254800
430334088255400
455909089405602445330088361400
424857088101500
424533088420100424608088414800
424625088405500
424501088422300
424938088080800
435152088123100
June-Aug. 1992
Apr. 1992-Aug. 1996 Feb. 1996-Aug. 1997
Feb. 1991-Aug. 1993 Apr. 1991-Aug. 1993
Apr. 1991-Aug. 1993
Apr.-Aug. 1992
May 1992-Sept. 1993
Mar. 1994-Aug. 1996
June 1993-Aug. 1995
June 1993-Aug. 1995
June 1993-Aug. 1995 Nov. 1980-Aug. 1998
Feb. 1990-Aug. 1992
Feb. 1988-Aug. 1989, Feb. 1991-Aug. 1996
Apr.-Nov. 1991
Apr.-Oct. 1991
Apr.-Nov. 1991
Apr.-Nov. 1991
Feb. 1997-Aug. 1998
Nov. 1983-Sept. 1986, Nov. 1992-Sept. 1997

In most lakes, water samples were collected at two depths - near the surface and near the bottom. Chemical analyses of water samples were performed using standard analytical methods by either the USGS National Water Quality Laboratory (Wershaw and others, 1987; Fishman and Friedman, 1989; Fishman, 1993) or the Wisconsin State Laboratory of Hygiene (Wisconsin State Laboratory of Hygiene, 1993). Analyses for dissolved constituents were performed on samples that were filtered in the field through a 0.45-|im (micrometer) pore-size filter. Total or total recov erable constituents were determined by analyzing unfiltered water samples. Preservation and shipment of samples followed standard protocols established by the laboratories. Water-quality data were archived in the Water Quality Data Base (QWDATA) of the National Water Information System (NWIS). Additional descriptive information about water-quality data is available in the data report: "Water Resources Data - Wisconsin, 1999". NWIS parameter codes and minimum laboratory reporting limits for chemical constituents are given in table 2.
Records of lake stage are considered complete when one or more manual or automatic measurements were obtained per day. Partial records of lake stage result when measurements were less frequent than daily. A complete description of manual or automatic measurements of
lake stage is described by Rantz and others (1982).
EXPLANATION OF PHYSICAL AND CHEMICAL CHARACTERISTICS
OF LAKES
Following are brief, generalized explanations of some of the common measurements of water quality and some of the physical processes occurring in lakes that influence these measures of water quality. More detailed explanations of water-quality data and lake processes are given by Wetzel (1983), Hem (1985), and Shaw and others (1993).
Water Temperature and Thermal Stratification
Water temperature in lakes is important because of its role in stratification and because of the temperature dependence of many chemical reactions and life processes of aquatic organisms. The extent of thermal stratification in lakes depends on the interaction between the lake's shape, water clarity, solar heating, and wind-driven mixing. Complete mixing of the lake is usually inhibited by thermal stratification in summer and by ice cover in winter. Thermal stratifi cation affects water quality and the distribution of organisms in the lake. Summer thermal stratifi cation can occur in any lake, but in Wisconsin it commonly occurs in lakes deeper than about 6 m (Shaw and others, 1993).

Table 2. Parameter identification numbers and laboratory reporting levels (LRL) for chemical parameters commonly measured in lakes, and analyzed at the National Water Quality Laboratory (NWQL) or the Wisconsin State Laboratory of Hygiene (WSLH)
fNWQL)
Parameter Name
Calcium, diss. (Ca)
Magnesium, diss. (Mg)
Sodium, diss. (Na)
Potassium, diss. (K)
Sulfate, diss. (SO4)
Chloride, diss. (Cl)
Fluoride, diss. (F)
Iron, diss. (Fe)
Manganese, diss. (Mn)
Silica, diss. (SiO2)
Nitrogen, NO2+NO3 , diss.
Nitrogen, ammonia, diss.
Nitrogen, organic, total (3)
Nitrogen, amm.+org., total (4)
Nitrogen, total (5)
Phosphorus, total
Phosphorus, ortho, diss.
Chlorophyll a, phytoplankton
Chlorophyll a, phytoplankton
Units
mg/L
mg/L
mg/L
mg/L
mg/L
mg/L
mg/L
H9/L
H9/L
mg/L
mg/L
mg/L
mg/L
mg/L
mg/L
mg/L
mg/L
H9/L
H9/L
GAS Number
(1)
7440-70-2
7439-95-4
7440-23-5
7440-09-7
14808-79-8
16887-00-6
16984-48-8
7439-89-6
7439-96-5
7631-86-9
7664-41-7
17778-88-0
7723-14-0
14265-44-2
479-61-8
479-61-8
Parameter Code
(2)
00915
00925
00930
00935
00945
00940
00950
01046
01056
00955
00631
00608
00623
00665
00671
70953
32210
Standard Analysis
Lab LRL Code
0.020
0.004
0.09
0.24
0.31
0.29
0.100
10
2.2
0.1
0.05
0.02
0.100
0.05
0.01
0.1
659
663
675
54
1572
1571
31
645
648
56
1975
1976
1985
1984
1262
586
Low-Level Analysis
Lab LRL Code
0.002
0.001
0.025
0.01
0.01
0.01
0.01
3
1
0.02
0.005
0.002
0.001
0.001
1895
1897
1898
833
1263
1259
1260
1896
1793
1899
1979
1980
837
1978
M/SLI-n
MRL
0.02
0.02
0.09
0.3
1.0
0.1
0.03
10
0.4
0.008
0.01
0.013
0.2
0.005
0.002
1
Test Code
I230IUD
I390IUD
I80IUD
I540IUD
I600DLD
I240ELD
I330FLD
I370IUD
I400IUD
I560LLD
I460MLD
I440NLD
I470BLT
I520PLT
I530CLD
I250UNF
Footnotes:1: CAS (Chemical Abstracting Services) number= unique identification for each constituent 2: Parameter Code - unique number for storage of data in database 3: Calculated as difference between total ammonia + organic nitrogen and ammonia nitrogen 4: Also known as Total Kjeldahl Nitrogen (TKN) 5: Calculated as sum of TKN + Nitrogen as (NO2+NO3)

The density of water increases with decreasing temperature down to a temperature of
4°C, then decreases with decreasing temperature between 4°C and the freezing point of water
(0°C). For a brief period in the spring after the ice is out, water temperature is usually uniform
through the entire water column and wind action causes the lake to mix completely. This process
is known as "spring turnover." As the lake absorbs the sun's energy, the surface water becomes
warmer and its density decreases, making it more resistant to complete mixing. The difference in
density caused by different water temperatures can prevent warm and cold water from mixing. In
most lakes, therefore, a density "barrier" forms between the warmer surface water (epilimnion)
and the underlying colder water (hypolimnion). This barrier is often marked by a sharp temper
ature gradient known as the "thermocline (metalimnion)." During the stratified summer period,
these three distinct layers of lake water are often present. As the temperature difference
between surface and deep water increases, this "stratified" condition stabilizes and can persist
until surface temperatures decrease in the fall, which decreases the stability of the stratification.
The mixing of the lake water in the fall is known as "fall turnover."
Thermal stratification may also occur under ice cover in the winter. In the winter, the coldest
water (near 0°C) under the ice at the surface of the lake is less dense than water deeper in the
lake with warmer temperatures.
Specific Conductance
Specific conductance is a measure of the ability of water to conduct an electrical current
and is an indicator of the concentration of dissolved solids in the water. Because conductance is temperature related, reported values are normalized at 25°C and are termed specific conduc
tance. As the concentration of dissolved minerals increases, specific conductance increases.
During winter and summer thermal stratification, concentrations of dissolved constituents near
the lake bottom increase due to the decomposition of materials settling from the epilimnion, or
release of dissolved materials (such as iron, manganese, and phosphorus) from the bottom
sediments during anoxic periods. Therefore, differences in specific conductance with depth
indicate differences in concentrations of dissolved solids.
10

Water Clarity
Water clarity, or transparency, is commonly measured using a Secchi disc. The range of depths within which photosynthetic activity occurs depends largely on depth of light penetration, which is influenced by water clarity. A Secchi disc, most commonly an 20-cm.-diameter disc with alternating black-and-white quadrants, is lowered to a depth at which it is no longer visible. This depth is referred to as the Secchi depth. Clarity can be reduced by algae, zooplankton, water color, and suspended sediment. Algae are often the most dominant influence on clarity in lakes and, therefore, Secchi depth is usually correlated with the algal abundance. Secchi depths are generally the least during summer when algal populations are largest.
BH
The pH is a measure of the acidity of the water. It is defined as the negative logarithm of hydrogen-ion concentration and varies over a 14-unit log scale, with a pH of 7 being neutral. Values less than 7 indicate acidic conditions; the lower the value, the stronger the acidity. Values greater than 7 indicate alkaline conditions. The pH of water is influenced in part by photosyn thesis and respiration of planktonic algae and aquatic plants. It is important because it affects the solubility of many chemical constituents, and because aquatic organisms have limited pH toler ances. Planktonic algae and aquatic plants produce oxygen and consume carbon dioxide as they photosynthesize during daytime; they consume oxygen and produce carbon dioxide when they respire at night. Carbon dioxide combines with the water molecule to form carbonic acid; therefore respiration causes a decrease in pH at night and photosynthesis during the day causes an increase in pH. The result is a daily cycle in pH. Because phytoplankton are usually concen trated in the near-surface water, changes in pH in the epilimnion are more extreme than in the hypolimnion, where less photosynthesis usually occurs.
Lakes having good fish populations and productivity generally have a pH between 6.7 and 8.2. Values of pH greater than 8.5 have been shown to cause the release of phosphorus from lake sediments (James and Barko, 1991).
11

Dissolved Oxygen
Dissolved oxygen is one of the most critical factors affecting a lake ecosystem because it is essential to most aquatic organisms, and it is involved in many chemical reactions. Very low dissolved oxygen concentrations can control some types of chemical reactions. The solubility of oxygen in water is inversely related to temperature-that is, oxygen solubility decreases as water temperature increases. This relation is important because at warmer temperatures the metabolic rate of organisms increases but less oxygen is available for respiration. The primary sources of dissolved oxygen are from the air and from photosynthesis. The minimum dissolved oxygen concen tration specified in national water-quality criteria for early life stages of warmwater aquatic life is 5.0 mg/L (U.S. Environmental Protection Agency, 1986).
In early summer, if thermal stratification develops, the metalimnion restricts the surface supply of dissolved oxygen to the hypolimnion. The hypolimnion can become isolated from the atmosphere. Thus, as summer progresses, the dissolved oxygen concentration can decrease in response to decomposition of dead algae that settle from the epilimnion and in response to the biological and chemical oxygen demand of the sediments. The oxygen demand from these processes may completely deplete the oxygen (anoxia) in the water near the lake bottom. The oxygen depletion then progresses upward but usually is confined to the hypolimnion.
Anoxia in the hypolimnion is common in stratified eutrophic (nutrient-rich) lakes in Wisconsin. Complete anoxia, however, is often not detected because of meter constraints. During anoxic condi tions, many aquatic organisms cannot survive, but many other species (primarily bacteria) actually function only in such conditions. Therefore, a shift from oxic to anoxic conditions produces a rapid and dramatic change in the biological community and chemical environment. Anoxia also can cause release of phosphorus from the bottom sediments. This phosphorus then mixes throughout the water column during spring and fall turnover.
12

Phosphorus
Phosphorus is one of the essential nutrients for plant growth. High phosphorus concentrations
can cause dense algal populations (blooms) and can therefore be a major cause of eutrophication in
lakes. When phosphorus concentrations exceed 0.025 mg/L at the time of spring overturn in lakes
and reservoirs, these water bodies may occasionally experience excess or nuisance growth of algae
or other aquatic plants (U.S. Environmental Protection Agency, 1986). In many regions of the
country, including the upper Midwest, other nutrients, particularly nitrogen, tend to be in abundant
supply. Phosphorus is often the nutrient in shortest supply, therefore limiting or controlling plant
growth. About 90 percent of the lakes in Wisconsin are limited by phosphorus (Shaw and others,
1993). In water, dissolved orthophosphate is that part of total phosphorus that is most readily
available for use by algae.
Internal phosphorus recycling occurs in many lakes. Phosphorus used by algae, aquatic plants,
fish, and zooplankton is stored within these organisms. As these organisms die and decompose, this
phosphorus is returned to the lake water and sediments. Anoxia in the hypolimnion makes
phosphorus more soluble, adding further to the release of phosphorus from the falling particles and
the lake sediments. During spring and fall turnover the phosphorus, which was released from the
bottom sediments into the hypolimnion during anoxia, is mixed throughout the lake. The phosphorus
is then available for algal growth. These phenomena are part of the internal-recycling processes of
lakes.
Nitrogen
Nitrogen, like phosphorus, is an essential nutrient for plant and algal growth. Usually in
Wisconsin lakes, nitrogen is in abundant supply from the atmosphere and other sources. If
phosphorus is abundant relative to algal needs, nitrogen can become the limiting nutrient. In that
case, algal blooms are more likely to be triggered by increases in nitrogen than by increases in
phosphorus. Some bluegreen algal species can fix nitrogen from the atmosphere (Wetzel, 1983).
Therefore, in situations where other types of algae are excluded because of a shortage of nitrogen,
the nitrogen-fixing bluegreen algae have a competitive advantage and may be present in
abundance.
Lakes with a nitrogen to phosphorus ratio larger than 15 to 1 near the surface may generally be
considered phosphorus limited; a ratio from 10 to 1 to 15 to 1 indicates a transition situation; and a
ratio smaller than 10 to 1 generally indicates nitrogen limitation. Total nitrogen is the sum of
ammonia, organic nitrogen, and nitrate-plus-nitrite nitrogen. The near-surface concentration is
commonly used to compute the total nitrogen to phosphorus ratio because most algal species grow
near the lake surface.
13

Chlorophyll a
Chlorophyll a is a photosynthetic pigment found in algae (Wetzel, 1983) and other green plants. Its concentration, therefore, is commonly used as a measure of the density of the algal population in a lake. Chlorophyll a concentrations are generally highest during summer when algal populations are highest. Moderate populations of desirable algae are important in the food chain; however, excessive populations or algal blooms are undesirable. Algal blooms can cause taste and odor problems, and limit light penetration needed to support growth of submerged aquatic plants. Certain species of bluegreen algae can produce toxins (Rapavich and others, 1987).
CLASSIFICATION OF LAKES
Two methods are commonly used to classify and evaluate Wisconsin lakes according to their water quality or trophic state: Lillie and Mason's (1983) water-quality index and a modifi cation of Carlson's (1977) Trophic State Index (TSI) by Lillie and others (1993). Three water- quality measures are used in these classification systems: near-surface concentrations of total phosphorus and chlorophyll a, and water clarity as indicated by the Secchi depth.
Lillie and Mason's (1983) water-quality indices for Wisconsin lakes were developed based on random summer measurements of total phosphorus and chlorophyll a concentrations, and Secchi depth to classify the lakes' water quality as shown below:
Water-quality index
"Excellent"
"Very good""Good"
"Fair"
"Poor"
"Very poor"
Total phosphorus range (mg/L)
<0.001
.001 -.009
.010-.029
.030-.049
.050-. 149
>.150
Chlorophyll a rangeOAQ/L)
<1.0
1 .0- 4.9
5.0- 9.9
10.0-14.9
15.0-30.0
>30.0
Water clarity range (Secchi depth, in meters)
>6.0
3.0-6.0
2.0-2.9
1 .5-1 .9
1 .0-1 .4
<1.0
14

The TSI approach to lake classification assigns numerical ranges to the three trophic condi
tions generally used to describe the wide range of lake water-quality conditions. Oligotrophic
lakes are typically clear, algal populations and phosphorus concentrations are low, and the
deepest water is likely to contain oxygen throughout the year. Mesotrophic lakes typically have a
moderate supply of nutrients, experience moderate algal blooms, and have occasional oxygen
depletions at depth. Eutrophic lakes are nutrient rich with relatively severe water-quality
problems, such as frequent seasonal algal blooms, oxygen depletion in lower parts of the lakes,
and poor clarity. When eutrophic conditions are very severe, the lake is considered hyper-
eutrophic.
The WDNR modified the lakes classification scheme developed by Carlson (1977) to apply
specifically to Wisconsin lakes. The WDNR system (Lillie and others, 1993) uses surface total
phosphorus and chlorophyll a concentrations, and Secchi depth for ice-free periods to calculate
values for TSI's. The WDNR has adopted the following TSI ranges to classify Wisconsin lakes:
indices of less than 40 define oligotrophic conditions, 40 to 50 define mesotrophic conditions,
greater than 50 to define eutrophic conditions, and greater than 70 define hypereutrophic condi
tions (Wisconsin Department of Natural Resources, 1992). These ranges are used to make
relative comparisons in Wisconsin lake trophic-state evaluations by the WDNR and others.
The TSI for a lake can be calculated using the following equations (Lillie and others, 1993):
TSISecchi = 60.0 - 33.2 x (Iog10 Secchi depth)
TSIch |0rophy|| a - 34.82 + (17.41 x (Iog10 chlorophyll a concentration))
TSItotai phosphorus = 28.24 + (17.81 x (Iog10 total phosphorus concentration x 1,000))
where: Secchi depth is in meters,
chlorophyll a is in micrograms per liter, and
total phosphorus is in milligrams per liter.
The three trophic conditions are defined with the following boundaries for total phosphorus,
Secchi disc, and chlorophyll a:
Trophic Level
Eutrophic
Mesotrophic
Oligotrophic
Trophic State Index
... __ 50 ___ .\J\J
.......... 40 .. ..-
Total phosphorus (mg/L)
- 0.017
.......... 0.005
Secchi d (m)
- 4.0
epth Chlorophyll a OA9/L)
.................7.4 ...........
.................2.0 -
15

REFERENCES CITED
Carlson, R.E., 1977, A trophic state index for lakes: Limnology and Oceanography, March, v. 22, no. 2, p. 361-369.
Fishman, M.J., ed., 1993, Methods of analysis by the U.S. Geological Survey National Water Quality Laboratory-Determination of inorganic and organic constituents in water and fluvial sediments: U.S. Geological Survey Open-File Report 93-125, 217 p.
Fishman, M.J., and Friedman, L.C., eds., 1989, Methods for determination of inorganic sub stances in water and fluvial sediments (3d ed.): U.S. Geological Survey Techniques of Water-Resources Investigations, book 5, chap. A1, 545 p.
Hem, J.D., 1985, Study and interpretation of the chemical characteristics of natural water (3rd ed.): U.S. Geological Survey Water-Supply Paper 2254, 263 p.
James, W.F., and Barko, J.W., 1991, Littoral-pelagic phosphorus dynamics during nighttime con- vective circulation: Limnology and Oceanography, v. 36, no. 5, p. 946-960.
Lillie, R.A., Graham, S., and Rasmussen, P., 1993, Trophic-State Index equations and regional predictive equations for Wisconsin lakes: Wisconsin Department of Natural Resources Research Management Findings No. 35, 4 p.
Lillie, R.A., and Mason, J.W., 1983, Limnological characteristics of Wisconsin lakes: Wisconsin Department of Natural Resources Technical Bulletin No. 138, 116 p.
Rantz, S.E., and others, 1982, Measurement and computation of streamflow: U.S. Geological Survey Water-Supply Paper 2175, 631 p.
Rapavich, W.M., Sonzogni, W.C., Standridge, J.H., Vennie J.G., and Wedepohl, R.E., 1987, Inci dence of algal toxins in Wisconsin water experiencing blue-green algae blooms: Wisconsin State Laboratory of Hygiene and Wisconsin Department of Natural Resources, Informa tional Paper, 8 p.
Shaw, B., Mechenich, C., and Klessig, L., 1993, Understanding Lake Data: G3582: University of Wisconsin Extension, Madison, Wis., 19 p.
U.S. Environmental Protection Agency, 1986, Quality Criteria for Water 1986: U.S. Environmen tal Protection Agency publication, EPA 440/5-86-001 [variously paged].
Wershaw, R.L., Fishman, M.J., Grabbe, R.R., and Lowe, L.E., eds., 1987, Methods for the deter mination of organic substances in water and fluvial sediments: U.S. Geological Survey Techniques of Water-Resources Investigations, book 5, chap. A3, 80 p.
Wetzel, R.G., 1983, Limnology (2d ed.): New York, 767 p.
Wisconsin Department of Natural Resources, 1992, Wisconsin water quality assessment-Report to Congress, 1992: Wisconsin Department of Natural Resources Publ-WR254-92-REV, 220 p.
16

Wisconsin State Laboratory of Hygiene, Environmental Sciences Section, 1993, Manual of ana lytical methods, inorganic chemistry unit: Wisconsin State Laboratory of Hygiene, revised November 1993 [variously paged].
17


LAKE DATA
19


423201088180800 BENEDICT LAKE NEAR POWERS LAKE, WI
LOCATION.-Lat 42°32'01", long 88°18'08", in NW 1/4 NW 1/4 sec.19, T.I N., R.19 E., Kenosha County, Hydrologic Unit 07120006, 1.4 misouthwest of Powers Lake.
PERIOD OF RECORD.--May 1998 to current year.REMARKS.--Lake sampled near center at deep hole. Lake ice-covered during February sampling. Water-quality analyses done by Wisconsin
State Laboratory of Hygiene.WATER-QUALITY DATA, FEBRUARY 19 TO AUGUST 04, 1999
(Milligrams per liter unless otherwise indicated)
Feb-19 Apr-15 Aug-4
Lake stage (ft)Secchi-depth (m)Chlorophyll a, phytoplankton (ng/L)Depth of sample (m)Water temperature (°C)Specific conductance (uS/cm)pH (units)Dissolved oxygen (mg/L)Phosphorus, total (as P)Phosphorus, ortho, dissolved (as P)Nitrogen, N02 + N03, diss. (as N)Nitrogen, ammonia, dissolved (as N)Nitrogen, amm. + org., total (as N)Nitrogen, total (as N)Color (Pt-Co. scale)Turbidity (NTU)Hardness, (as CaC0 3 )Calcium, dissolved (Ca)Magnesium, dissolved (Mg)Sodium, dissolved (Na)Potassium, dissolved (K)Alkalinity, (as CaC0 3 )Sulfate, dissolved (S0 4 )Chloride, dissolved (Cl)Silica, dissolved (Si0 2 )Solids, dissolved, at 180°CIron, dissolved (Fe) ug/LManganese, dissolved (Mn) ug/L
_--
0.54.55417 . 917 . 90.014____________^__________-_________
___
_________
__----
11. 03 .46797 .711. 50. 023___________.________._____________________
______
8251.7 .
0.511. 66548.212.00. 018<0. 0020. 5570. 3531.21.75
1. 52604636262. 222234595. 8356
. 09, 900
11. 09-26608.19.3
0. 021__.__________-_____________________________________
82621.
0.526.86128.29. 0
0. 007_______________^___________________________________
.26.370
11. 09.56917.60.7
0. 075______________________________________________-____
825 . 651 . 91. 64
0.5 11 . 027 . 5 9.5569 6958.2 7.58.6 0.4
0.010 0.1020 . 004 ---0.512 ---0.128 ---0.92 ---1.4 ---___ ______ __-___ ______ ______ ______ _________ ______ ______ ______ ______ ___
0. 527 .45618.19 . 5
0.020______.____________________-_______ _____________---
825.711. 93 . 008.014 . 06108. 09.0
0. 030---_______-________________________________________
11. 09.17337 .20. 0
0.077________-____-_______
____________------______---
05 2
U H 4
S 6
I.CQQ io
12
2-19-99
10 15 20
W.T.
10 20 30
4-15-99 6-10-99 7-07-99
DISSOLVED OXYGEN (D.O.), IN MILLIGRAMS PER LITER10 15 20
10 20 30
0
0
10 15 20
10 20 30
0
0
10 15 20
10 20 30
8-04-99
10 15 20
10 20 30
WATER TEMPERATURE (W.T.), IN DEGREES CELSIUS
PH, IN STANDARD UNITS
0
05 2
S 6
S 8Q io
12
6 7 10
PHs.c.
10 10 10 10
450 550 650 750 "450 550 650 750 "450 550 650 750 "450 550 650 750 450 550 650 750
SPECIFIC CONDUCTANCE (S.C.), IN MICROSIEMENS PER CENTIMETER AT 25 DEGREES CELSIUS
21

- 0.025
2< OS£ 3 0.020
0.015
Qi2 o.oio
IS 0.005
JFMAMJ JASOND 1998
JFMAMJ JASOND 1999
15
i- j §£ 10
£y 5 9S
JFMAMJ JASONDJFMAMJ JASOND 1998 1999
§3UJ C/3
JFMAMJ JASOND 1998
JFMAMJ JASOND 1999
uu
90
80
70
60
50
20
10
0
_
-
-
-
-
WxMesotrophic
EXPLANATION
§1 Total Phosphorus
Q - Chlorophyll a
*< Secchi
J F M A M
_
Eutrophic
-
-
x^^jiL^:7:::^!:^:^ ^^^j" *^& O ^j yr
Oligotrophic
J J ASONDJFMAMJ JASOND 1998 1999
YEAR
Surface total phosphorus, chlorophyll a concentrations, Secchi depths, and TSI data for Benedict Lake near Powers Lake, Wisconsin.
22

440912089092000 BIG HILLS (HILLS) LAKE NEAR WILD ROSE, WI
LOCATION.~Lat 44°09'12", long 89°09'20", in SW 1/4 NE 1/4 sec.2, T.19 N., R.ll E., Waushara County, Hydrologic Unit 04030202, 4.6 misoutheast of Wild Rose.
DRAINAGE AREA.-0.78 mi2 . PERIOD OF RECORD.-June 1983 to August 1984, February to August 1987, February to August 1990, February to August 1993, February to
August 1996, and February to August 1999. REMARKS. Lake sampled at east end at deep hole. Lake ice-covered during February sampling. Water-quality analyses done by Wisconsin State
Laboratory of Hygiene.
WATER-QUALITY DATA, FEBRUARY 23 TO AUGUST 18, 1999 (Milligrams per liter unless otherwise indicated)
Apr-28 Aug-18
Secchi-depth (m)Chlorophyll a., phytoplankton (ng/L)Depth of sample (m)Water temoerature (°C)Specific conductance (us/cm)pH (units)Dissolved oxygen (mg/L)Phosphorus, total (as P)Phosphorus, ortho, dissolved (as P)Nitrogen, N02 + N03, diss. (as N)Nitrogen, ammonia, dissolved (as N)Nitrogen, amm. + org., total (as N)Nitrogen, total (as N)Color (Pt-Co. scale)Turbidity (NTU)Hardness, (as CaC0 3 )Calcium, dissolved (Ca)Magnesium, dissolved (Mg)Sodium, dissolved (Na)Potassium, dissolved (K)Alkalinity, (as CaC0 3 )Sulfate, dissolved (S0 4 )Chloride, dissolved (Cl)Silica, dissolved (Si0 2 )Solids, dissolved, at 180°CIron, dissolved (Fe) ng/LManganese, dissolved (Mn) ng/L
_--__-
0.5 5.53.9 4.3250 2697.1 7.27.1 6.6
0.006 0.010--_ _ _ ___- _ _ ._._ _________ ______ ______ ______ ____-_ _____ _ ____ _ _ _ _ ____ ______ ____ _ _ __ ______ _ ______ ___
2 . 38.00
0.5 5.511.7 11.6233 2348.3 8.312.3 12.10 . 008 0 . 016<0.002 ---0.113 ---0.436 ---1 . 0 ---1 . 1 ---10 ---1 . 1 ---110 ---23 ---13 ---1.8 ---
<0 . 30 ---102 ---5.9 ---5.7 ---0.7 ---126 ---
2.9 34.50 1 .
0.5 5.5 0.521.5 21.0 27.4224 232 2208.2 7.9 7.38.7 6.8 6.5
0 . 010 0 . 015 0 . 007--- --- <0.002--- --- 0.012--- --- 0.045--- --- 0.49--- --- 0.5___ ___ -_____ ___ ______ ___ -_____ ___ ______ ___ ______ ___ ______ ___ ______ ___ ______ ___ ______ ___ ______ -__ --____ ___ __-
. 925
5 .525 . 32247 . 24 . 3
0.009
<0 . 0100 .0960 .58__________________
______
___
___
3 . 860 .500
0.5 5.524.0 24.0229 2287.4 7.36.2 5.2
0 . 013 0 . 012_ _ ____ ______ -_____ ______ _-____ ______ --____ ______ ______ ______ ______ -_____ ____ _ _ ______ _____ _ ______ -__
2-23-99 4-28-99 6-17-99 7-23-99 8-18-99
DISSOLVED OXYGEN (D.O.), IN MILLIGRAMS PER LITER10 15 20
u
en 1
UJ
1§ 3
ffi
UJ
f.
-
-
,
-
-
. . . i i . , . .10 20 30
10 15 20. 1 1 . 1 1 . . . 1 . 1
_ W.T.
-
-
_
-
, , , , 1 , , , ,
, , | , , i r
-
-
-
_
D.O. :-
i ....
10 15 20
-
-
-
- )I.I.I.
-
-
-
-
, , , 1 , , , Lj
10 15 20
10 20 30 0 10 20 30 0 10 20 WATER TEMPERATURE (W.T.), IN DEGREES CELSIUS
30
10 15 20. . . . 1
-
-
-
-
-
. . . . 1 . . . . 1 . . . .
-
-
-
-
-
10 20 30
a
Z 3
W
10
pH
S.C.
200 225 250 275 300
1 '
-
-
-
-
-
i i
1
-
-
-
-
-
i
10
200 225 250 275 300
PH, IN STANDARD UNITS 10
1 '
-
-
-
-
- . 11 1
1
-
-
-
-
-
1
200 225 250 275 300
\
1 1
10
200 225 250 275 300
10
200 225 250 275 300
SPECIFIC CONDUCTANCE (S.C.), IN MICROSIEMENS PER CENTIMETER AT 25 DEGREES CELSIUS
23

- 0.025O
< .,,g g 0.020
§3
0.015
0.010
a 0.005
1 I I I I I I I I I I T
1983 1984 1985 1986 1987 1988 1989 1990 1991 1992 1993 1994 1995 1996 1997 1998 1999
10
§ S3 sa u
1983 1984 1985 1986 1987 1988 1989 1990 1991 1992 1993 1994 1995 1996 1997 1998 1999
0
t/5
Ws3 2
g>SECCHI
n
:
- 0
1983 1984 1985 1986 1987 1988 1989 1990 1991 1992 1993 1994 1995 1996 1997 1998 1999
1UO
90
80Xg 70£K 60
£ 30
g 40
§ 30
20
10
0
i ' ' -EXPLANATION
- - Total Phosphorus
-6- Chlorophyll a
K- Secchi
* »
$ ^2^---
1983 1984 1985
1-
Eutrophic
-
_
-'V^ A Jt'" '~~^MSH--^' ll"ar=^r^rts^^^^ ..^^p : _
Mesotrophic
Oligotrophic
-
1986 1987 1988 1989 1990 1991 1992 1993 1994 1995 1996 1997 1998 1999
YEAR
Surface total phosphorus, chlorophyll a concentrations, Secchi depths, and TSI data for Big Hills Lake near Wild Rose, Wisconsin.
(Circles on the first three plots indicate laboratory detection limit for selected analyses. Actual concentrations for these particular analyses are less than the plotted circles.)
24

05390750 BIG ST. GERMAIN LAKE NEAR LAKE TOMAHAWK, WI
LOCATION.-Lat 45°55'00", long 89°31'55" in NE 1/4 SE1/4 sec.30, T.40 N., R.8 E., Vilas County, Hydrologic Unit 07070001, at dam outlet, 7.7 mi northeast of Lake Tomahawk.
DRAINAGE AREA.--73.1 mi2 .
PERIOD OF RECORD.-October 1991 to current year. Lake stages for previous years were recorded by Wisconsin Valley Improvement Company.
GAGE.-Nonrecording gage. Datum of gage is 1,580 ft, above sea level.
COOPERATION. Lake stages provided by Wisconsin Valley Improvement Company.
EXTREMES FOR PERIOD OF RECORD.-Maximum gage height observed, 10.98 ft. May 9, 1999; minimum observed, 8.16 ft, Jan. 26, 1996.
EXTREMES FOR CURRENT YEAR.-Maximum gage height observed, 10.98 ft, May 9; minimum observed, 8.84 ft, Jan. 25.
GAGE HEIGHT, FEET, WATER YEAR OCTOBER 1998 TO SEPTEMBER 1999
DAILY MEAN VALUES
NOV DEC
12345
6789
10
1112131415
1617181920
2122232425
262728293031
MEANMAXMIN
10.10.10.10.10.
10.10.10.10.10.
10.10.10.10.10.
10.10.10.10.10.
10.10.10.10.10.
10.10.10.10.10.10.
10.10.10.
5656585654
6262626464
6464646262
6264646666
68.70686668
.6662605854.48
62,7048
1010101010
1010
10
9
9
9
9
9
9
9
9
.46
.38
.34
.30
.26
.20
.12______.00
___.98___.86---
___.82___.74---
___.66___.62---
.56______.50___---
_________
9.46______
9.38---
______
9.34___---
9.28_________
9.24
______
9.16___ -
9.12______
9.08---
_________
9.04___
____.____
JAN
9.02
9.00
FEE
9.02
9.04
9.04
9.06
9.10
9.14
9.02
9.10
JUN JUL AUG
9.9.-_
9.
_--
9.-
_9.-_-
8.-_
8.-
_8.8.8.8.
8.8.8.8.8.8.
_--
1005-___04
__---_03--
__01---_--
98-___97--
__98969698
969694949494
__-_--
89999
99999
99999
9999
10
1010101010
1010101010
9108
.96
.00
.12
.26
.32
.40
.50
.58
.62
.66
.68
.72
.78
.82
.86
.90
.94
.98
.98
.10
.22
.28
.32
.34
.34
.40
.52
.50
.50
.50
.87
.52
.96
10.10.10.10.10.
10.10.10.10.10.
10.10.10.10.10.
10.10.10.10.10.
10.10.10.10.10.
10.10.10.10.10.10.
10.10.10.
5254545454
7088929894
9086807672
6866.767468
76.76807264
5652525050.50
699850
1010101010
1010101010
1010101010
1010101010
1010101010
1010101010
101010
.50
.50
.48
.50
.50
.62
.62
.60
.60
.60
.62
.62
.68
.56
.52
.50
.48
.44
.40
.42
.42
.44
.46
.50
.52
.52
.54
.54
.56
.56---
.53
.68
.40
10.10.10.10.10.
10.10.10.10.10.
10.10.10.10,10.
10.10.10.10.10,
10.10.10.10.10.
10.10.10.10.10.10,
10.1010.
,62,66.72.72,78
.80
.76
.72
.94
.82
.78
.70
.66
.58
.52
.54
.54
.52
.54,56
.56
.56
.56
.56
.56
.66
.62,58.56.54.54
.64
.94
.52
10.10.10.10.10.
10.10.10.10.10.
10.10.10.10.10.
10.10.10.10.10.
10.10.10.10.10.
10.10.10.10.10.10.
10.10.10.
4848485052
52,505050,48
,48.5070.6767
7068666664
6262.6058.56
.54
.5450,50,48,50
,56.70.48
1010101010
1010101010
1010101010
1010101010
1010101010
1010101010
101010
.48
.48
.48
.48
.50
.52
.52
.52
.52
.52
.54
.56
.56
.56
.58
.58
.56
.56
.55
.56
.56
.56
.56
.56
.56
.54
.56
.58
.58
.58---
.54
.58
.48
25

454724091303600 BIG SISSABAGAMA LAKE NEAR STONE LAKE, WI
LOCATION.~Lat 45°47'24", long 91°3036", in NW 1/4 SE 1/4 sec.6, T.38 N., R.9 W., Sawyer County, Hydrologic Unit 07050001, near Stone Lake.
DRAINAGE AREA.--9.47 mi2 .
LAKE-STAGE RECORDS
PERIOD OF RECORD.-1986 to 1996, and October 1997 to current year, during open-water periods.
GAGE.-Water surface measured from reference point near lake outlet. Measurements were made by Richard Roehrich and James Eary.
EXTREMES FOR PERIOD OF RECORD: Maximum gage height observed, 6.09 ft, May 7 and Sept. 15,1991; minimum observed, 4.78 ft, Sept. 15, 16, 1988.
EXTREMES FOR CURRENT YEAR.-Maximum gage height observed, 5.95 ft, June 11; minimum observed, less than 5.07 ft, Oct. 1-16 (stages below 5.07 ft cannot be measured from reference point).
GAGE HEIGHT, FEET, WATER YEAR OCTOBER 1998 TO SEPTEMBER 1999
DAILY MEAN VALUES
DAY OCT NOV DEC JAN FEE MAR APR MAY JUN JUL AUG SEP
1 <5.07 5.10 --- 5.78 5.75 5.88 2 <5.07 5.08 5.75 5.75 5.86 5.763 <5.07 5.08 5.74 5.79 5.91 5.754 <5.07 5.08 5.74 5.81 5.90 5.745 <5.07 5.08 --- 5.75 5.84 5.87 5.82
6 <5.07 5.08 5.84 5.83 5.87 5.927 <5.07 5.73 5.91 5.80 5.91 5.908 <5.07 5.89 5.84 5.88 5.969 <5.07 5.88 5.88 5.86 5.94
10 <5.07 5.91 5.88 5.84 5.85 5.91
11 <5.07 5.12 5.93 5.95 5.83 5.85 5.8912 <5.07 5.15 5.91 5.93 5.82 5.84 5.9513 <5.07 5.12 5.89 5.91 5.87 5.91 5.9214 <5.07 5.11 5.88 5.88 5.84 5.90 5.9115 <5.07 5.12 - 5.87 5.86 5.83 5.88 5.89
16 <5.07 5.13 --- 5.85 5.84 5.86 5.8817 5.10 5.13 5.88 5.82 5.85 5.8818 5.13 5.12 5.90 5.80 5.85 5.8719 5.12 5.12 --- --- 5.89 5.77 5.78 5.88 5.8720 5.11 5.13 5.91 5.75 5.75 5.87 5.86
21 5.11 5.13 5.91 5.74 5.75 5.87 5.8422 5.10 5.14 5.90 5.74 5.74 5.86 5.8323 5.10 5.14 5.91 5.80 5.72 5.86 5.8224 5.09 5.15 5.78 5.70 5.90 5.8025 5.11 5.15 5.77 5.70 5.93 5.78
26 5.11 5.16 5.88 5.72 5.95 5.90 5.7627 5.11 5.16 --- --- 5.84 5.70 5.94 5.88 5.7528 5.11 5.16 5.83 5.75 5.92 5.86 5.7229 5.11 5.17 5.83 5.74 5.90 5.83 5.6930 5.10 5.18 5.82 5.73 5.88 5.81 5.6631 5.10 5.80 5.93 5.79
MEAN 5.09 --- --- 5.80 5.87MAX 5.13 5.95 5.93MIN 5.07 - 5.70 5.79
< Actual value is known to be less than the value shown
26

454724091303600 BIG SISSABAGAMA LAKE NEAR STONE LAKE, WI--CONTINUED
WATER-QUALITY RECORDS
PERIOD OF RECORD.-1986 to 1996, and March 1998 to current year.REMARKS.-Lake sampled near center at the deep hole. Lake ice-covered during March sampling. Water-quality analyses done by Wisconsin State
Laboratory of Hygiene.
WATER-QUALITY DATA, MARCH 04 TO AUGUST 16, 1999 (Milligrams per liter unless otherwise indicated)
Mar-4 Apr-13 Jun-2 Jul-14 Aug-16
Lake stage (ft)Secchi-depth (m)Chlorophyll a, phytoplankton (ug/L)Depth of sample (m)Water tenroerature (°C)Specific conductance (nS/cm)pH (units)Dissolved oxygen (mg/L)Phosphorus, total (as P)Phosphorus, ortho, dissolved (as P)Nitrogen, NO2 + NO3, diss. (as N)Nitrogen, ammonia, dissolved (as N)Nitrogen, amm. + org., total (as N)Nitrogen, total (as N)Color (Pt-Co. scale)Turbidity (NTU)Hardness, (as CaCO3 )Calcium, dissolved (Ca)Magnesium, dissolved (Mg)Sodium, dissolved (Na)Potassium, dissolved (K)Alkalinity, (as CaCO3 )Sulfate, dissolved (SO4 )Chloride, dissolved (CDSilica, dissolved (SiO2 )Solids, dissolved, at 180°CIron, dissolved (Fe) ug/LManganese, dissolved (Mn)
5.922.4
0.5 13.0 0.5 14.00.1 4.1 6.6 5.072 104 69 697.4 6.8 7.0 7.011.8 0.3 11.4 10.20.008 0.071 0.019 0.020 0.003
0.056 0.063
0.470.53101.4
___ ___ 33 ___8.52.81.60.834
___ ___ 3 ___0.97.156220140
5.75 5.1.9 29.43 7.
0.5 14.0 0.516.5 9.3 22.768 113 688.0 6.8 8.09.1 0.1 8.0
0.023 0.159 0.0210.003
<0.0100.0040.51
______ _ ______ ______ ___ ______ ___ ___
___ ______ _ ______ ___ ______ ___ ______ ___ ______ ___ ______ ______ ___ ______
84.655
13.011.01277.20.1
0.185
-__
_________
__________________
5.761.613.0
0.5 8.021.3 17.065 1027.3 6-87.5 0.5
0.024 0.079___
___
______
___ ___ ___
______ ___
___
______ ___
___
15.012.11447.30.1
0.311
___
___
_________
___
______
0
2c/3
U 4
a 6
10
3-04-99
10 15 20
W.T.D.O. _
10 20 30
4-13-99 6-02-99 7-14-99
DISSOLVED OXYGEN (D.O.), IN MILLIGRAMS PER LITER10 15 20
u
2
4
6
8
10
12
14
if.
- 1
-
-
-
-
-
-
i i i i 1 i i
-
-
-
-
-
-
-
i 1 i i i i_10 20 30
0
0
10 15 20
10 20 30
10 15 20u
2
4
6
8
10
12
14
16 C
--
/
, , I , i , , , . 1 1 . , ,) 10 20 3
WATER TEMPERATURE (W.T.), IN DEGREES CELSIUS
8-16-99
10 15 20U
2
4
6
8
10
12
14
16 (
i i | i i i , | i i , | i i i i
-
- j-^ /
-
/
i
) 10 20 3
I 10§12
14
16
10
s r
50 100 150
u
2
4
6
10
12
14
i f.
-
-
-
-
-
-
1 '-
-
-
-
-
-
i i0
10
50 100 150
PH, IN STANDARD UNITS 6 7 8 9 10
0 50 100 150 0
10
50 100 150 0
10
50 100 150
SPECIFIC CONDUCTANCE (S.C.), IN MICROSIEMENS PER CENTIMETER AT 25 DEGREES CELSIUS
27

z"0pg UJ 0.04
UJ >-!U a$z 8O B- 0.03U onon S5 <Qi (XL PHOSPHO IN MILLIG
0 0b b > to
gH
. i 1 . 1 , 1 i 1 i ! 1 >:
-
0 A
* * * * *
,, »^ 0 * ^ * * *%
** t
= ,1,1,1,1,1,1,1986
25
1988 1990 1992 1994 1996 1998 1999
§Pss
15
in10
1986 1988 1990 1992 1994 1996 1998 1999
0
on 1
UJ
Q£4 UuUJ"5
1986 1988 1990 1992 1994 1996 1998 1999
100
90
80
70
50
40
30
20
10
0
Eutrophic
Mesotrophic
EXPLANATION
Total Phosphorus
Chlorophyll a
Secchi
OligOtTOphiC
1986 1988 1990 1992
YEAR
1994 1996 1998 1999
Surface total phosphorus, chlorophyll a concentrations, Secchi depths, and TSI data for Big Sissabagama Lake near Stone Lake, Wisconsin.
28

454800091312900 BIG SISSABAGAMA LAKE, NORTH SITE, NEAR STONE LAKE, WI
LOCATION.--Lat 42°48'00", long 91°31'29", in NE 1/4 SE 1/4 sec.6, T.38 N., R.9 W., Sawyer County, Hydrologic Unit 07050001, near StoneLake.
DRAINAGE AREA.--9.47 mi2 . PERIOD OF RECORD.-March 1998 to current year. REMARKS.--Lake sampled near the deepest part of the North Bay. Lake ice-covered during March sampling. Water-quality analyses done by
Wisconsin State Laboratory of Hygiene.
WATER-QUALITY DATA, MARCH 04 TO AUGUST 16, 1999 (Milligrams per liter unless otherwise indicated)
Mar-4
Lake stage (ft) Secchi-depth (m) Chlorophyll a, phytoplankton Depth of sample (m) Water temperature (°C) Specific conductance (nS/cm) pH (units)Dissolved oxygen (mg/L) Phosphorus, total (as P)
Apr-13 Jun-2 Jul-14 Aug-16
_______0.50.7767.514.00.014
5.922.63.280.58.0687.412.00.014
5.751.95.880.516.1687.88.6
0.017
5.842.54.94
0.5 7.523.0 13.869 1298.1 7.28.1 0.1
0.022 0.063
5.761.616.00.521.3657.57.7
0.024
0
1
1 3Z 4 £~5
3-04-99
10 15 20
D.O.
10 20
50 100
30
10u
1METER.
UJ N>
Z 4
7
Q
- pH 1
: /1 1
-s.c.
_
1
150
4-13-99 6-02-99 7-14-99
DISSOLVED OXYGEN (D.O.), IN MILLIGRAMS PER LITER10 15 20 0 10 15 20 10 15 20
1 1 1 1 1 1 1
-
---''-/^--
. , 1 1 1
1 1 . . . 1 , . . 1 1.
-
---
/ -/
/",,.!,,,.
10 20 30 0 10 20 30 0 10 20
WATER TEMPERATURE (W.T.), IN DEGREES CELSIUS
PH, IN STANDARD UNITS
il1
10 10
50 100 150 50 100 150 50 100
30
10
-
-
i
t- x t- r- \
-----\ **«, -
150
8-16-99
10 15 20
----- ^
----
,
10 20 30
10
-
----- /-
-----i-
50 100 150
SPECIFIC CONDUCTANCE (S.C.), IN MICROSIEMENS PER CENTIMETER AT 25 DEGREES CELSIUS
29

0.05o< ~« ffl 0.04
Ul *^ U Xz wO * 0.03U c/5c/J 5D <
2 0.02S3 -05
o.oi
JFMAMJ JASONDJFMAMJ JASOND1998 1999
20
Z^15
8lO
2S
JFMAMJ JASOND 1998
JFMAMJ JASOND 1999
QI 4
JFMAMJ JASOND JFMAMJ JASOND 1998 1999
iUU
90
80
70
60
10
40
30
20
10
0
-
-
-
-
-
~
i i i i
»-=,
EXPLANATION
U Total Phosphorus
-G- Clilorophyll a
* Secclii
J F M A M
i i i i , i i | i i i i i i i i i i i
-
Eutrophic
-
--^ "** "~~~~~^~& """"^^^ "®^ Mesotropfiic
Oligotrophic
~
J JASONDJFMAMJ JASOND 1998 1999
YEAR
Surface total phosphorus, chlorophyll a concentrations, Secchi depths, and TSI data for Big Sissabagama Lake, North Site, near Stone Lake, Wisconsin.
30

434558089260600 BUFFALO LAKE, CENTER SITE, AT PACKWAUKEE, WI
LOCATION.--Lat 43°45'58", long 89°26'06", in NW 1/4 SE 1/4 sec.21, T.15 N., R.9 E., Marquette County, Hydrologic Unit 04030201, 1.1 minortheast of Packwaukee.
PERIOD OF RECORD.--May 1998 to current year. Data collected 1991-94 by Wisconsin Department of Natural Resources are available. REMARKS.-Site sampled near center of lake. Lake ice-covered during February sampling. Water-quality analyses done by Wisconsin State Lab
oratory of Hygiene.WATER-QUALITY DATA, FEBRUARY 26 TO AUGUST 19, 1999
(Milligrams per liter unless otherwise indicated)
Secchi-depth (m)Chlorophyll a, phytoplankton (ng/L)Depth of sample (m)Water temperature (°C)Specific conductance (iiS/cm)pH (units)Dissolved oxygen (mg/L)Phosphorus, total (as P)Phosphorus, ortho, dissolved (as P)Nitrogen, NO2 + NO3, diss. (as N)Nitrogen, ammonia, dissolved (as N)Nitrogen, amm. + org., total (as N)Nitrogen, total (as N)Color (Pt-Co. scale)Turbidity (NTU)Hardness, (as CaCO 3 )Calcium, dissolved (Ca)Magnesium, dissolved (Mg)Sodium, dissolved (Na)Potassium, dissolved (K)Alkalinity, (as CaCO 3 )Sulfate, dissolved (SO 4 )Chloride, dissolved (Cl)Silica, dissolved (SiO2 )Solids, dissolved, at 180°CIron, dissolved (Fe) ug/LManganese, dissolved (Mn) |ig/L
0 .50 .24486 .611.60.039
May-3
0 .718 . 80. 518 .73718 .513 . 60 . 0690 . 0030 .3990. 0211 .21 . 6306. 919038224 .91 .216618102.2230604 . 6
Jun-16
1.25 . 670.519 . 63678.37 . 2
0 . 110
Jul-15
1 .3 5 .350 .525 .43908 .17 . 1
0. 1260 . 0620 . 0480 . 0010 .560. 61
Aug-19
>1 .3 3 .220 . 5 21.93867 . 55 . 8
0. 079
2-26-99 5-03-99 6-16-99 7-15-99 8-19-99
DISSOLVED OXYGEN (D.O.), IN MILLIGRAMS PER LITER 0 5 10 15 20 0 5 10 15 20 05 10 15 20 05 10 15 20 05 10 15 20
on §0.5
PL)
3 i.oaca, § 1.5
2.0
u
0.5
1.0
1.5
o n
W.T.
-
-
,,,,!,,,,
i | i i i r
D.0._
-
-
0.5
1.0
1.5
2.0
0.5
1.0
1.5
2.0
0.5
1.0
1.5
2.00 10 20 30 0 10 20 30 0 10 20 30 0 10 20 30 0 10 20 30
WATER TEMPERATURE (W.T.), IN DEGREES CELSIUS
6 7
n <O4 0.5
£ sZ 1.0
2.0
PH, IN STANDARD UNITS
9 10 6789 10 6789 10 6789 10 67
pHS.C.
0.5
1.0
1.5
2.0
0.5
1.0
1.5
_i____i
0.5
1.0
1.5
2.0 _i____i
0.5
1.0
1.5
2.0
9 10
350 400 450 500 350 400 450 500 350 400 450 500 350 400 450 500 350 400 450 500
SPECIFIC CONDUCTANCE (S.C.), IN MICROSIEMENS PER CENTIMETER AT 25 DEGREES CELSIUS
31

z o
11"a ->u a:z wO ^ 0.3U on
\ \ i i i i i i i i i i i i i i i
22 0.2
B 0.1
120Z'
O H g 100
^ Ep jW m 80
y| 60
£g 40
^ a 2035 U
JFMAMJ JASONDJFMAMJ J ASOND 1998 1999
JFMAMJ JASONDJJFMAMJ J ASOND 1998 1999
s.Z
gB 2Ua on
JFMAMJ JASONDJFMAMJ JASOND 1998 1999
100
90
80
I 70
E 60
35 40
§ 30
20
10
Eutrophic
Mesotrophic
EXPLANATION
Bj Total Phosphorus
O Clllorophyll a
* Secclli
Oligotrophic
JFMAMJ JASONDJFMAMJ JASOND 1998 1999
YEARSurface total phosphorus, chlorophyll a concentrations, Secchi depths, and TSI
data for Buffalo Lake, Center Site, near Packwaukee, Wisconsin.
32

434720089201600 BUFFALO LAKE, EAST END, AT MONTELLO, WI
LOCATlON.-Lat 43°47'20", long 89°20'16", in SE 1/4 SW 1/4 sec. 8, T. 15 N., R. 10 E., Marquette County, Hydrologic Unit 04030201, at Montello. PERIOD OF RECORD.~May 1998 to current year. Data collected 1991-94 by Wisconsin Department of Natural Resources are available. ^EMARKS.-Site sampled at east end of lake. Lake ice-covered during February sampling. Water-quality analyses done by Wisconsin State Lab
oratory of Hygiene.
WATER-QUALITY DATA, FEBRUARY 26 TO AUGUST 19, 1999 (Milligrams per liter unless otherwise indicated)
Feb-26
Secchi-depth (m)Chlorophyll a, phytoplankton (nq/L)Depth of sample (m)Water temoerature (°C)Specific conductance (nS/cm)pH (units)Dissolved oxygen (mg/L)Phosphorus, total (as P)
May-3 Jul-15 Auq-19
__ ____0 . 50.84336. 913.80.068
0.721.70.517.43508 . 816 .40. 056
0.9400.520.23628 .39 .7
0.155
0.916.90.525.43718.27 . 6
0.136
0.951 . 00.522 . 63848.310.00. 077
2-26-99 5-03-99 6-16-99 7-15-99 8-19-99
DISSOLVED OXYGEN (D.O.), IN MILLIGRAMS PER LITER0 5 10 15 20 0 5 10 15 20 05 10 15 20 05 10 15 20 05 10 15 20
METERS o
Ui C
g 1.0
K
gl.5
2.0
-
),!..,,!
| 1 1 1 T-
~
10 20 3
u
0.5
1.0
1.5
2.0 0 (
W.T.
/D.O.
, , , i I , , , , I , , , ,) 10 20 3
u
0.5
1.0
1.5
2.0 0 (
.I,,,.,,,,,,,,,,,,,
, , , , 1 , , , , 1 , , , ,) 10 20 3
u
0.5
1.0
1.5
2.0 0
. . . . 1 , ,
-
) 10
-
20 3
u
0.5
1.0
1.5
2.0 0
1 1 1 . 1 1 1 1 1 1 1 1 1 1 1 1 1 1 1
, , , , 1 , , , , 1 , , , ,3 10 20 3
WATER TEMPERATURE (W.T.), IN DEGREES CELSIUS
o'
onW 0.5
1Z 1.0
K
gj 1.5
i n
5 7 8
-
-
- PH
PH, IN STANDARD UNITS9 1
-
S.C.-
-
0 ( 0
0.5
1.0
1.5
-i n
57891
-
-
i i
0 o (
0.5
1.0
1.5
i n
57891
-
-
i i
0 o (
0.5
1.0
1.5
-> n
5 7 8
~
9 1
-
-
° 0
0.5
1.0
1.5
TO
5 7 8 9 1(
-
-
"325 375 425 475 "325 375 425 475 "'325 375 425 475 "325 375 425 475 325 375 425 475
SPECIFIC CONDUCTANCE (S.C.), IN MICROSIEMENS PER CENTIMETER AT 25 DEGREES CELSIUS
33

ZO p
g* U 0.4
U U aO £ 0.3U i/i1/5 2D <
O O t\ -> -i u..i
O 2
i i i i i i i
J ' i i i ' < i J I 1 L.
JFMAMJ JASONDJFMAMJ JASOND 1998 1999
z"g
c* bH J
Seu <H§SC *CuO S§1BCU
120
100
80
60
40
20
i i i i i i i i i i I i i I I i i i i i i i
,_
~ ~
_
0 "~
-
1 1 1 1 1 4 1 1 1 1 1 1 1 1 1 1 1 1 1 1 1 1
JFMAMJ JASONDJFMAMJ JASOND1998 1999
JFMAMJ JASOND 1998
JFMAMJ JASOND 1999
100
90
80
70
60
50
40
30
20
10
i i i i i r -i i i i i i i i i r
Eutrophic
Mesotrophic
EXPLANATION
-B Total Phosphorus
-G- Chloaiphyll a
- « Setdii
Oligotrophic
JFMAMJ JASONDJFMAMJ JASOND 1998 1999
YEAR
Surface total phosphorus, chlorophyll a concentrations, Secchi depths, and TSI data for Buffalo Lake, East Site, at Montello, Wisconsin.
34

434414089282400 BUFFALO LAKE, WEST END, NEAR ENDEAVOR, WI
LOCATION.-Lat 43°44'14", long 89°28'24", in NW 1/4 SE 1/4 sec.31, T.15 N., R.9 E., Marquette County, Hydrologic Unit 04030201, 1.5 minorth of Endeavor.
PERIOD OF RECORD.~May 1998 to current year. Data collected 1991-94 by Wisconsin Department of Natural Resources are available. REMARKS.-Site sampled near west end of lake. Lake ice-covered during February sampling. Water-quality analyses done by Wisconsin State
Laboratory of Hygiene.
WATER-QUALITY DATA, FEBRUARY 26 TO AUGUST 19, 1999 (Milligrams per liter unless otherwise indicated)
Secchi-depth (m)Chlorophyll a, phytoplankton (ug/L)Depth of sample (m)Water temperature (°C)Specific conductance (nS/cm)pH (units)Dissolved oxygen (mg/L)Phosphorus, total (as P)
Feb-26
0.50.94487.612.80.054
May- 30.643.90.518.23988.09.5
0.093
Jun-160.88.860.519.43917.98.30.090
Jul-150.530.70.526.43988.310.00.142
Aug-190.911.00.522.13937.910.00.090
2-26-99 5-03-99 6-16-99 7-15-99 8-19-99
DISSOLVED OXYGEN (D.O.), IN MILLIGRAMS PER LITER0 5 10 15 20 0 5 10 15 20 0 5 10 15 20 _0 5 10 15 20 .0 5 10 15 20
H, IN METERS i O O in C
gl.5
T n
y
- 1.5 -
'0 10 20 30 ' 0 10 20 30 ~""0 10 20 30 ""0 10 20 30 ~'~0 10 20 30
WATER TEMPERATURE (W.T.), IN DEGREES CELSIUS
6 7PH, IN STANDARD UNITS
9 10
'350 400 450 500 '350 400 450 500 '350 400 450 500 '350 400 450 500 350 400 450 500 SPECIFIC CONDUCTANCE (S.C.), IN MICROSIEMENS PER CENTIMETER AT 25 DEGREES CELSIUS
35

Z 0.5O H
£ U 0.4zt u JU &,
O * 0.3
2 0.2
§
6 0.1
JFMAMJ JASONDJFMAMJ JASOND 1998 1999
120
10°
80
60
40
^ - 20
U
JFMAMJ JASONDJFMAMJ JASOND 1998 1999
Q£2 U U
JFMAMJ JASOND 1998
JFMAMJ JASOND 1999
XUQ£ P£C/5
U
gPS
1UU
90
80
70
60
50
30
20
10
11111111111 i i i i i i i i i i i
-
Eutrophic
.- * .. » m * &S-^e^-l-Qr"*'" ^ ""^^^y3"^iQ- "" ^^pr ^
Mesotrophic
~
-
~
EXPLANATION
Total Phosphorus
Q Chlorophyll a
* Secchi
~
Oligotrophic
~
JFMAMJ JASONDJFMAMJ JASOND1998 1999
YEAR
Surface total phosphorus, chlorophyll a concentrations, Secchi depths, and TSI data for Buffalo Lake, West Site, near Endeavor, Wisconsin.
36

423706088363400 DELAVAN LAKE NEAR DELAVAN, WI
LOCATION.--Lat 42°36'27", long 88°36'19", in SW 1/4 NE 1/4 sec.28, T.2 N., R.16 E., Walworth County, Hydrologic Unit 07090001, atDelavan Lake Sanitary District Lift Station No. 2 at Delavan Lake Yacht Club, 1.0 mi southeast of outlet, and 2.7 mi southeast of Dela-van.
DRAINAGE AREA.--41.4 mi2 , of which 2.3 mi 2 is non-contributing. Area of Delavan Lake, 2,072 acres. PERIOD OF RECORD.-October 1983 to current year. October 1983 to September 1985 data published in Water Resources Investigation
series report "Water Quality and Hydrology of Delavan Lake in Southeastern Wisconsin" by S. J. Field and M. D. Duerk (1988).
GAGE.-Water-stage recorder. Datum of gage is 922.92 ft above sea level. Prior to Sept. 5, 1989, staff gage at bridge on North Shore Driveat same datum.
REMARKS.-No estimated daily gage heights. Records good. Lake was ice covered from Dec. 30 to Mar. 21. Lake levels controlled byDelavan Lake Sanitary District. Gage-height telemeter at station.
EXTREMES FOR PERIOD OF RECORD.-Maximum gage height observed, 6.19 ft, Feb. 21, 1994; minimum daily, -4.44 ft, Nov. 6, 1989(lake drawn down for lake rehabilitation program).
EXTREMES FOR CURRENT YEAR.-Maximum gage height, 5.77 ft, June 14; minimum, 4.58 ft, Sept. 26.
GAGE HEIGHT, FEET, WATER YEAR OCTOBER 1998 TO SEPTEMBER 1999
DAILY MEAN VALUES
OCT NOV DEC FEB MAR APR MAY JUN
12345
6789
10
1112131415
1617181920
2122232425
262728293031
MEANMAXMIN
sD< 8Q
\RBITRAR\ -P>. O\
w> 20CQ
1
5 -2Ha2 -4
o -6o
4.964.955.005.015.06
5.125.125.095.045.00
4.964.954.944.934.92
4.924.985.165.175.12
5.064.994.934.934.93
4.944.964.984.974.984.98
5.005.174.92
I
4.974.964.944.924.91
4.914.904.914.915.09
5.175.125.044.974.95
4.954.954.954.944.95
4.954.944.954.964.96
4.974.974.984.995.02
4.975.174.90
1 1
5.035.025.025.015.00
5.015.065.055.045.03
5.025.015.004.994.98
4.984.984.974.974.97
4.984.974.964.954.94
4.944.934.934.944.944.94
4.995.064.93
1
4.92 4.97 4.924.96 4.99 4.935.01 5.04 4.945.01 5.07 4.935.02 5.06 4.94
5.02 5.03 4.965.02 4.99 4.965.02 4.95 4.955.02 4.92 4.975.02 4.93 4.98
5.03 4.97 4.975.03 5.06 4.975.03 5.03 4.965.02 4.99 4.965.00 4.95 4.96
4.97 4.91 4.964.96 4.90 4.974.97 4.84.95 4.8
8 4.986 4.97
4.93 4.86 4.95
4.91 4.87 4.944.97 4.8 8 4.945.07 4.89 4.945.21 4.89 4.945.27 4.89 4.94
5.24 4.89 4.945.19 4.90 4.945.15 4.92 4.945.125.075.02
4.944.944.93
5.04 4.95 4.955.27 5.07 4.984.91 4.8
1
-_ \^^^
-
-
.
-
1983 19
1
84
I
1986
1
1988
6 4.92
1
fMvw
/J
1
1990
4.944.954.964.984.98
4.954.934.945.045.03
5.025.004.984.974.95
4.964.944.924.914.91
4.934.985.345.385.25
5.155.105.145.064.99 -
5.025.384.91
1
^^tj^fj
,1992
4.984.984.984.974.97
5.005.015.005.005.00
5.005.095.115.095.06
5.055.135.195.215.18
5.135.165.135.095.02
4.954.954.964.964.974.97
5.045.214.95
1
KJWV^Vs/wL.
11994
4.995.065.065.055.03
5.035.045.024.995.01
5.115.105.335.745.61
5.415.235.084.994.96
4.944.944.964.974.97
4.974.975.055.035.00 -
5.095.744.94
1
* »*/ »*
4.974.944.954.964.96
4.964.944.924.914.89
4.874.864.854.834.81
4.804.844.874.884.89
4.904.904.924.964.96
4.964.964.944.934.924.92
4.914.974.80
1
*>*NiA>4 sj*
1
1996
4.904.884.864.844.82
4.804.794.794.784.77
4.764.784.794.784.77
4.764.764.754.794.80
4.794.794.814.874.87
4.874.874.874.874.854.84
4.824.904.75
1
1
1998
4.834.824.824.814.80
4.794.784.754.744.71
4.704.704.724.714.70
4.704.694.694.684.68
4.674.664.644.634.62
4.604.664.935.045.00---
4.745.044.60
-
|
-
-
.
~
37

423556088365001 DELAVAN LAKE AT CENTER NEAR DELAVAN LAKE, WI
LOCATION.-Lat 42°35'56", long 88°36'50", in SE 1/4 SW 1/4 sec.28, T.2 N., R.16 E., Walworth County, Hydrologic Unit 07090001,2.6 mi southeast of Delavan..
DRAINAGE AREA.-41.4 mi2 , of which 2.3 mi2 is non-contributing. PERIOD OF RECORD.-October 1983 to current year. REMARKS.-Lake ice-covered during February measurements. Water-quality analyses done by the U.S. Geological Survey National Water
Quality Laboratory. Samples for determination of chlorophyll-a concentration are collected from the top 1.5 ft of the lake.
WATER-QUALITY DATA, NOVEMBER 17, 1998 TO APRIL 13, 1999 (Milligrams per liter unless otherwise indicated)
Nov-17 Feb-9 Apr-13
Lake stage (ft)Secchi-depth (m)Chlorophyll a, phytoplankton (nq/L)Depth of sample (m)Water temperature (°C)Specific conductance (uS/cra)pH (units)Dissolved oxygen (mg/L)Phosphorus, total (as P)Phosphorus, ortho, dissolved (as P)Nitrogen, N02 + NOB, diss. (as N)Nitrogen, ammonia, dissolved (as N)Nitrogen, airuti. + org., total (as N)Nitrogen, total (as N)Color (Pt-Co. scale)Turbidity (NTU)Hardness, (as CaC03 )Calcium, dissolved (Ca)Magnesium, dissolved (Mg)Sodium, dissolved (Na)Potassium, dissolved (K)Alkalinity, (as CaC0 3 )Sulfate, dissolved (S04 )Chloride, dissolved (Cl)Silica, dissolved (Si0 2 )Solids, dissolved, at 180°CIron, dissolved (Fe) ug/LManganese, dissolved (Mn) uq/LFluoride, dissolved
4.43
0.58.15568.110.40.1100.0760.130.1180.80.93-______________-_________________---
III___
95.6.7
16.08.15588.210.00.1100.083________________________._-__________________
______
4.60
0.52.05527.712.10.1400.120.580.1860.71.3_________________________________---
______
92.7.7
15.53.47047.42.2
0.1100.095________________________________________________
______
4.70
0.59.15808.210.90.0650.0370.330.0610.71.05
2.02304232243
18527560.8336
E 2.60.140
98.6.2
15.58.05828.310.20.0730.0350.330.050.81.25
2.42404232253
18627570.8344
E 2.90.149
11-17-98
10
2-09-99
DISSOLVED OXYGEN (D.O.), IN MILLIGRAMS PER LITER
20 0 10 20
4-13-99
10 20u
C/3OS ,BJ 4HOJ2
Z 8
UJ pa
\f.
1 ' ' ' i
.~
-
-
i i i i 1 i i
.-
-..
-
-
, , I , , , ,"
12
1610 20 30 0 10 20 30
12
1610 20 30
WATER TEMPERATURE (W.T.), IN DEGREES CELSIUS
6 7 8 9 10
16400 500 600 700 800 900
PH, IN STANDARD UNITS
6 7 8 9 10
12
16
6 7 8 9 10
12
16
S.C.
400 500 600 700 800 900400 500 600 700 800 900
SPECIFIC CONDUCTANCE (S.C.), IN MICROSIEMENS PER CENTIMETER AT 25 DEGREES CELSIUS38

423556088365001 DELAVAN LAKE AT CENTER NEAR DELAVAN LAKE, WI--CONTINUED
WATER-QUALITY DATA, MAY 19 TO JULY 13, 1999 (Milligrams per liter unless otherwise indicated)
Lake stage (ft)Secchi-depth (m)Chlorophyll a, phytoplanktonDepth of sample (m)Water temperature (°C)Specific conductance (nS/cm)pH (units)Dissolved oxygen (mg/L)Phosphorus, total (as P)Phosphorus, ortho, dissolved (as P)Nitrogen, N02 + N03, diss. (as N)Nitrogen, ammonia, dissolved (as N)Nitrogen, amm. + org., total (as N)Nitrogen, total (as N)
5-19-99
10
May- 19
0.515.45608.510 .70 .0500.0020.190.011 0 .70 .86
5. 8.0.
7 .015.05628.410.0______0.260 .009
___
21 2.813.011.95788.16.6______0.310.174
___
16.011.05857 . 84.2______0 .260.48
___
0.522.85278.69 .1
0 .0380.0010 .0550.009 0.70.77
Jun-14
5. 3.6.
6.022.45328.58.4______
0 .0680 .042
___
74 .5.413.013.15817.61.1______0.220.236
___
16 .012 .75837.60.6______
0.0930.318
___
0 .524.94898.612.40.051<0 .0010.0110.017 1.11 .1
Jul
4., 1.37
6.024.05008.58.8
0.035<0.001___---
___
-13
85 4.612.014.55907.50.4
0.3100.16___---
___
15.513.16207.30.4
0.4900.4___---
___
6-14-99
DISSOLVED OXYGEN (D.O.), IN MILLIGRAMS PER LITER
20 0 10 20
7-13-99
10 20
12
16
12
1610 20 30 0 10 20 30
12
1610 20 30
WATER TEMPERATURE (W.T.), IN DEGREES CELSIUS
10
PH, IN STANDARD UNITS
6 7 8 9 10 9 10
12
16
S.C.
12
16400 500 600 700 800 900 400 500 600 700 800 900 400 500 600 700 800 900
SPECIFIC CONDUCTANCE (S.C.), IN MICROSIEMENS PER CENTIMETER AT 25 DEGREES CELSIUS
39

423556088365001 DELAVAN LAKE AT CENTER NEAR DELAVAN LAKE, WI--CONTINUED
WATER-QUALITY DATA, AUGUST 17 TO SEPTEMBER 14, 1999(Milligrams per liter unless otherwise indicated)
Aug-17 Sep-14
Lake stage (ft)Secchi-depth (m)Chlorophyll a, phytoplankton (|ig/L)Depth of sample (m)Water temcerature (°C)Specific conductance (nS/cm)pH (units)Dissolved oxygen (mg/L)Phosphorus, total (as P)Phosphorus, ortho, dissolved (as P)Nitrogen, N02 + N03, diss. (as N)Nitrogen, ammonia, dissolved (as N)Nitrogen, amm. + org., total (as N)Nitrogen, total (as N)
0.523 . 25008 . 17 . 8
0 . 0450. 001 <0 .0050 .02O n
O
2 . 023 . 25008 .27 . 7
0. 041---
5 .023 . 15018 . 27 .0
0 . 037---
4 . 1 .18
9 . 022 .95068 . 15 . 8
0 .043<0 . 001
76 5
. 911.018 . 55747 . 40 . 7
0. 150---
13 . 014 .76167 . 40 . 8
0. 440___
14 .013 . 96287 . 30.7
0 . 5400 . 37
15 .513 . 36457 . 30 . 7
0 . 6700 . 58
0 .520 . 25158 .16 .4
0 .055<0 .001 0.019<0 .002
0 0. o
0 . R7
4 . 114
11. 020 .05227 . 83 . 5
0.0570 . 004
71 . 7. 114 . 014 .36327 .10. 1
0 . 6700. 64
15 . 513 . 56537 .00 . 1
0. 8700. 74
8-17-99 9-14-99
Q 12
16
DISSOLVED OXYGEN (D.O.), IN MILLIGRAMS PER LITER
10 20 0
D.O
12
16
10 20
10 20 30 10 20 WATER TEMPERATURE (W.T.), IN DEGREES CELSIUS
30
PH, IN STANDARD UNITS
12
16
10 10
12
16400 500 600 700 800 900 400 500 600 700 800 900
SPECIFIC CONDUCTANCE (S.C.), IN MICROSIEMENS PER CENTIMETER AT 25 DEGREES CELSIUS
40

"Z.
OP< OS 0.25
w J2 w °- 20
U cfl
B < 0.15
0 0
1 d o.ioO 5as ^ * 5 d 0.05£ oH
II 1 1 - \ ~
>~
:
: * -r I ^ * ~" * ^P* * * * * " : * *! * * . V * . U .% ^: *' ?% * % *£ f m ':: V %» * %*» *:^^ ^^k
1983 1984 1985 1986 1987 1988 1989 1990 1991 1992 1993 1994 1995 1996 1997 1998 1999
AII 1OP| 100os Eii 8°o^u < 60
^§ || 40O 5
3^ 20Xu
I I
300
1 1 1 1 1
f\
*«« v*": ," ' .* * i\*,t\. \ \: i«"i^n
1983 1984 185 1986 1987 1989
u
1
3
4
6
7
8
9
10
_ v .* * ' ' . v -- «A . *, y ^ ,%^" *»; *; .. . ;.%.
! -
1983 1984 1985 1986 1987 1988 1989 1990 1991 1992 1993
% * "/ " 5.- c 0 *% * * *
i :1994 1995 1996 1997 19
m] "
. ':
-.1-
~
-i^ j
:
98 1999
100
90
80XQ 70sW 60
I »X 4°Q-
§ 30H
20
I I I I II I I I I I I I
EXPLANATION
Total Pliosphorus
Chlorophyll a
Secchi
Mesotrophic
1983 1984 I 1985 1986 1987 1988 1989 1990 1991 1992 1993 1994 1995 1996 1997 1998 1999
YEAR
Surface total phosphorus, chlorophyll a concentrations, Secchi depths, and TSI data for Delavan Lake at Center near Delavan, Wisconsin.
41

423556088365001 DELAVAN LAKE AT CENTER NEAR DELAVAN LAKE, WI--CONTINUED
ADDITIONAL WATER-QUALITY DATA, OCTOBER 9, 1998 TO SEPTEMBER 24, 1999 (Milligrams per liter unless otherwise indicated)
Lake stage (ft)
Secchi-depth (meters) Depth of sample (meters) Water temperature (°C) Phosphorus, total (as P)
Lake stage (ft) Secchi-depth (meters)
Depth of sample (meters) Water temperature (°C) Phosphorus, total (as P)
Lake stage (ft) Secchi-depth (meters) Depth of sample (meters) Water temperature (°C) Phosphorus, total (as P)
2L+5,
2.0.
15,0.
aly 4.1.
0,25,0,
_lfl.17.8.5.5.115
-1
.94
.4
.5
.0
.054
Oct.4.3.
0.14.0.
July 4.1.0.
26.0.
__2_6_.94.1
,5,0.059
_22. ,90.4.5.5.046
Ma;4
4
0160
iLL
41
029
0
y 21
.95
.9
.5
.1
.047
Iv 28 .94
.5
.5
.0
.035
ept . 1 Sent. 7 Sent. 144,1.0,
25,0,
.83
.4
.5
.0
.033
4.1.0.
23.0.
.78
.5
.5,0.035
4.711.70.5
Ju54
0190
AU410
26
0
ne.06.9
.5
.4
1
.043
q,.82.7.5.5
5.
.031
Sent.
20.2
0.055
4.
1.0.
21.0.
24637
5
1
082
42

423659088354401 DELAVAN LAKE, AT NORTH END, NEAR LAKE LAWN, WI
LOCATION.--Lat 42°36'59", long 88°35'44", in NW 1/4 SW 1/4, sec.22, T.2 N., R.16 E., Walworth County, Hydrologic Unit 07090001,2.6 mi southeast of Delavan.
DRAINAGE AREA.--41.4 mi2, of which 2.3 mi2 is non-contributing. PERIOD OF RECORD.-October 1983 to current year.
WATER-QUALITY DATA, APRIL 13 TO AUGUST 17, 1999
Apr. 13 May 19 June 14 July 13 Aug. 17
Secchi-depth (meters) 7.0 7.6 3.4 1.2 1.8
423526088380101 DELAVAN LAKE, AT SW END, NEAR DELAVAN LAKE, WI
LOCATION.-Lat 42°35'26", long 88°38'01", in SE 1/4 NW 1/4, sec.32, T.2 N., R.16 E., Walworth County, Hydrologic Unit 07090001,2.6 mi southeast of Delavan.
DRAINAGE AREA.--41.4 mi2, of which 2.3 mi2 is non-contributing. PERIOD OF RECORD.-October 1983 to current year.
WATER-QUALITY DATA, APRIL 13 TO AUGUST 17, 1999
Apr. 13 May 19 June 14 July 13 Aug. 17
Secchi-depth (meters) 8.2 7.3 3.0 1.2 1.4
43

05404500 DEVILS LAKE NEAR BARABOO, WI
LOCATION.--Lat 43°25'18", long 89°43'38", in SW 1/4 SE 1/4 sec.13, T.ll N., R.6 E., Sauk County, Hydrologic Unit 07070004, in Devils Lake State Park, 3.5 mi south of Baraboo.
DRAINAGE AREA.--4.79 mi2 . Area of Devils Lake, 361 acres.
PERIOD OF RECORD.-June 1922 to August 1930, June to August 1932, June 1934 to September 1981 (fragmentary). October 1981 to Sep tember 1984, data unpublished in district files. October 1984 to current year.
REVISED RECORDS.-WDR WI-78-1: Drainage area.
GAGE. Water-stage recorder installed July 17, 1991. Datum of gage is 955.00 ft, above sea level.
REMARKS. No estimated daily gage heights. Records good. Lake has no surface outlet.
EXTREMES FOR PERIOD OF RECORD.--Maximum gage height observed, 14.13 ft, July 18, 1993; minimum observed, 1.49 ft Feb. 8, 1965.
EXTREMES FOR CURRENT YEAR.-Maximum recorded gage height, 11.06 ft, June 11 and 13; minimum recorded, 8.76 ft, Jan. 1.
GAGE HEIGHT, FEET, WATER YEAR OCTOBER 1998 TO SEPTEMBER 1999
DAILY MEAN VALUES
OCT NOV DEC JAN FEE MAR APR JUN JUL AUG SEP
12345
6789
10
1112131415
1617181920
2122232425
262728293031
MEANMAXMIN
9.539.509.499.489.51
9.559.539.519.509.48
9.469.449.419.399.37
9.369.399.429.409.37
9.359.339.319.299.28
9.279.289.299.289.279.25
9.409.559.25
9.249.219.199.179.15
9.139.119.109.119.26
9.269.259.249.239.21
9.209.209.199.199.16
* 9.159.149.129.129.10
9.099.099.099.099.09---
9.169.269.09
9.099.089.079.079.06
9.069.059.049.029.01
9.008.998.988.978.95
8.948.938.928.918.89
8.898.878.868.858.84
8.838.828.808.818.808.79
8.949.098.79
8.778.818.858.848.84
8.858.848.848.848.84
8.848.858.868.868.85
8.858.868.878.878.86
8.858.898.908.918.92
8.918.918.908.908.898.89
8.868.928.77
8.888.898.898.888.88
8.878.878.878.878.87
8.949.099.119.139.14
9.159.169.159.159.15
9.149.149.139.139.14
9.149.159.16
______---
9.049.168.87
9.169.169.159.159.15
9.159.159.159.189.18
9.179.179.169.159.15
9.149.159.169.169.16
9.169.169.169.159.15
9.149.149.149.139.139.13
9.159.189.13
9.129.129.289.489.55
9.629.659.689.94
10.07
10.1210.1510.1710.1910.19
10.2010.2010.2010.2010.21
10.2110.3010.5910.6910.73
10.7510.7610.7610.7610.76
10.1210.769.12
10.7510.7410.7310.7210.72
10.7510.8010.8110.8110.80
10.7910.7810.7610.7510.74
10.7410.8910.9410.9510.95
10.9410.9410.9510.9410.92
10.9010.8810.8610.8510.8310.84
10.8310.9510.72
10.8510.8910.8710.8710.87
10.8710.8510.8711.0211.02
11.0311.0411.0411.0210.99
10.9610.9410.9110.8910.86
10.8410.8210.8210.8210.80
10.7710.7510.7210.6910.67
---
10.8811.0410.67
10.6810.6710.6610.6610.64
10.6210.5910.5610.5610.52
10.4910.4710.4410.4110.37
10.3610.3910.3810.4310.43
10.5210.5110.5110.5310.51
10.5010.4810.4510.4310.4110.41
10.5010.6810.36
10.3810.3410.3110.2910.26
10.2310.2310.2110.1910.17
10.1510.1410.1110.0910.06
10.0310.009.99
10.1310.13
10.1210.1010.1110.1410.13
10.1110.1010.0810.0610.0310.00
10.1410.389.99
9.979.959.939.919.88
9.869.839.809.779.74
9.719.699.679.649.61
9.599.579.549.529.50
9.489.459.439.419.39
9.379.459.469.459.42
9.639.979.37
44

425103088261500 EAGLE SPRING LAKE AT EAGLEVILLE, WI
LOCATION.--Lat 42051'03", long 88°26'15", in SE 1/4 NW 1/4 sec.36, T.5 N., R.17 E., Waukesha County, Hydrologic Unit 07120006, atEagle ville.
DRAINAGE AREA.-33.2 mi2 . PERIOD OF RECORD.-April 1991 to current year. REMARKS.-Lake sampled near southeast end at a lake depth of about 3 m. Lake ice-covered during February sampling. Water-quality analyses
done by Wisconsin State Laboratory of Hygiene. Lake-stage readings from 1991 to 1993 (except 2/4/93 and 4/19/93) were previouslyreported 1 ft too high.
WATER-QUALITY DATA, FEBRUARY 19 TO AUGUST 04, 1999 (Milligrams per liter unless otherwise indicated
Feb-19 Apr-7 Jun-11 Jul-7 Aug-4
Lake stage (ft)Secchi-depth (m)Chlorophyll a, phytoplankton (ng/L)Depth of sample (m)Water temoerature (°C)Specific conductance (nS/cm)pH (units)Dissolved oxygen (mg/L)Phosphorus, total (as P)Phosphorus, ortho, dissolved (as P)Nitrogen, NO2 + NO3, diss. (as N)Nitrogen, ammonia, dissolved (as N)Nitrogen, amm. + org., total (as N)Nitrogen, total (as N)Color (Pt-Co. scale)Turbidity (NTU)Hardness, (as CaCO3 )Calcium, dissolved (Ca)Magnesium, dissolved (Mg)Sodium, dissolved (Na)Potassium, dissolved (K)Alkalinity, (as CaCO3 )Sulfate, dissolved (SO4 )Chloride, dissolved (Cl)Silica, dissolved (SiO2 )Solids, dissolved, at 180°CIron, dissolved (Fe) ng/LManganese, dissolved (Mn) nq/L
9,--
0.55.05467.819.20.01________________________________________________
.57----
2.06.65657.619.20.014
___
______
_____________________
9.>217
0.511.54688.311.50.0120.0030.6690.0170.571.25
1.023046286.51.321212
17.02.0268
56.0.9
1.511.54698.311.30.012_____________________
_____________________
9.562.32.090.526.84577.98.2
0.021
__________________
____________
_________
9.491.52.950.528.64518.29.3
0.017______ ___
_________________________________
___1.73.210.528.04458.19.8
0.038________________________________________________
2-19-99 4-07-99
1.3
6-11-99 7-07-99 8-04-99
DISSOLVED OXYGEN (D.O.), IN MILLIGRAMS PER LITER0 5 10 15 20 25 0 5 10 15 20 25
u
6/5 05
LU
i i.ozDC 1-5
Q 2.0
9 <
~ W.T.
-
f D.O.
'7
', , . , 1 , , i , 1 ,
1 " ".
-
:-i-
-_
1 1 1 *
u
0.5
1.0
1.5
2.0
9 <
-
-
-
-
", , , , 1 ,
i i | i i i i | i i i r_
-
:-
-
-
1 1 1 1 1 1 1 1
0 5 10 15 20 25
10 20 30
u
0.5
1.0
1.5
2.0
7 <
1 i-_
', , , , 1 , , , . 1 , , , ,'
0 5 10 15 20 25u
0.5
1.0
1.5
2.0
i <
" " \ " "
7 1
-
-
L / , , , , i
'i
j
r
' -_
,,,!,,,,"
10 20 30 0 10 20 30 0 10 20 30
WATER TEMPERATURE (W.T.), IN DEGREES CELSIUS
0 5 10 15 20 25u
0.5
1.0
1.5
2.0
2.5 (
I i I I .
" 1 ^I \ i', , , , I , , . , I , , , ,") 10 20 3
PH, IN STANDARD UNITS8 9 10 8 9 10
0
S °-5
s L0zDC 1-5
fc
Q 2.0
7 *;
1
-
t-
-
PH-
1 '
-_
--
S.C. -
-
\ :
i
u
0.5
1.0
1.5
2.0
o <
1 '
~-
-
I
i
1
^--
;-
!-
0
0.5
1.0
1.5
2.0
7 <
.u ^-
-
,
u
0.5
1.0
1.5
2.0
T <;
1 '
_L
-'-
~
,
1 :
-j
--
I-
'-
~
'-
u
0.5
1.0
1.5
2.0
9 S
1 '
'-
-
-
~
,
' -
-_
I~
-
-
1
400 500 600 400 500 600 450 550 650 400 500 600 400 500 600 SPECIFIC CONDUCTANCE (S.C.), IN MICROSIEMENS PER CENTIMETER AT 25 DEGREES CELSIUS
45
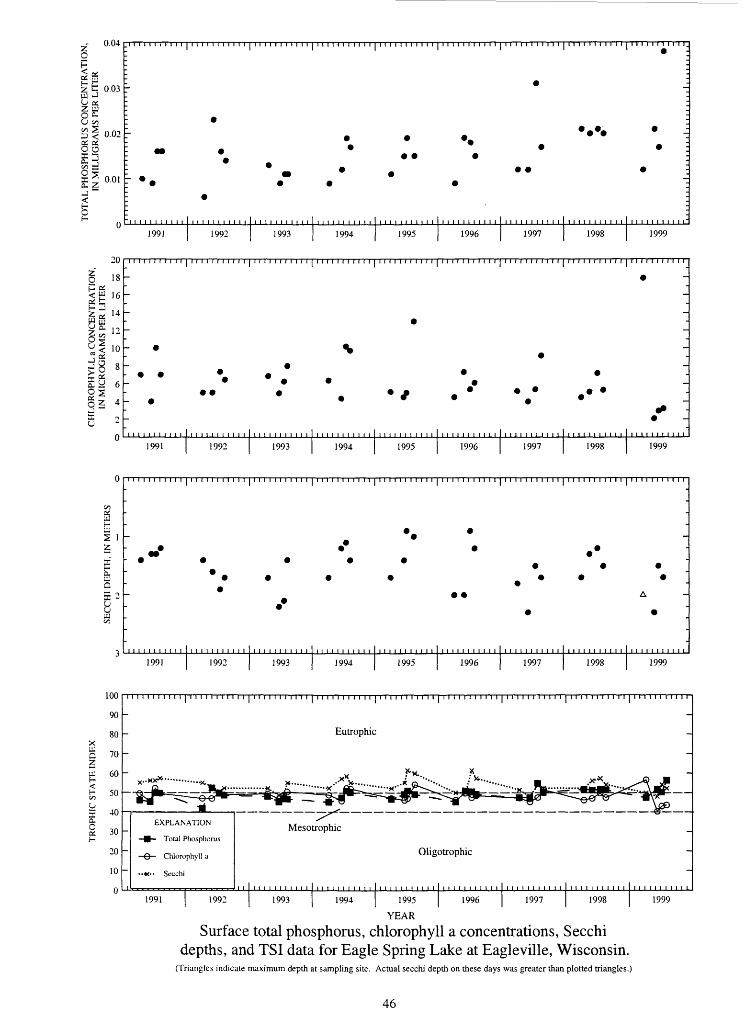
0.04
Z b 0.03UJ JO c£ Z g
U co
31 0.02O o
ilI ± 0.01
1991 1992 1993 1994 1995 1996 1997 1998 1999
M
O 18P C£<£ 16f- [jw u^ °- 120§*<* ! °
^0 8
£ y 6o 5 4
u 2
i i i i i i i i i i i i i i i i i i i i i i i i i i i i i i i i i i i i i i i i i i i i i i i i i i i i i i i i i i i i i i i i i i i i i i i i i i i i i i i i i i i i i i i i 1 1 i i i i i i i i i
- --~
-
\
* .*. « * « :-
:. . * . *. * / :*» -~ * ~1 1 1 1 1 1 1 1 1 1 1 1 1 1 1 1 1 1 1 1 1 1 1 1 1 1 1 1 1 1 1 1 1 1 1 1 1 1 1 1 1 1 1 1 1 1 1 1 1 1 1 1 1 1 1 1 1 1 1 1 1 1 1 1 1 1 1 1 1 1 1 1 1 1 1 1 1 1 1 1 1 1 1 1 1 1 1 1 1 1 1 1 1 1 1 1 1 1 10 1 1 | | | 1 [ 1
1991 1992 1993 1994 1995 1996 1997 1998 1999
1991 1992 1993 1994 1995 1996 1997 1998 1999
100
90
80XQ 70 Zg 60 <co 50UEE 40
I 30
20
10
0
EXPLANATION
- Total Phosphoru
-© Clilorophyll a
-« Secchi
Eutrophic
.,, ..Mesotrophic
Oligotrophic
1991 1992 1993 1994 1995
YEAR
1996 1997 1998
Surface total phosphorus, chlorophyll a concentrations, Secchi depths, and TSI data for Eagle Spring Lake at Eagleville, Wisconsin.
(Triangles indicate maximum depth at sampling site. Actual secchi depth on these days was greater than plotted triangles.)
1999
46

05406050 FISH LAKE NEAR SAUK CITY, WI
LOCATION.«Lat 43°17'27", long 89°39'09" in NE 1/4 SW 1/4 sec.3, T.9 N., R.7 E., Dane County, Hydrologic Unit 07070005, on north side of lake, 0.4 mi southwest of Crystal Lake, and 3.1 mi east of Sauk City.
DRAINAGE AREA.--2.23 mi2 . Area of Fish Lake, 252 acres.PERIOD OF RECORD.-November 1966 to September 1981, April 1985 to May 1987, May 1988, April 1989 to October 11,1990 (frag
mentary); continuous record from Oct. 23, 1990 to Nov. 22, 1996; nonrecording gage Nov. 23,1996 to current year.REVISED RECORDS. --WDR WI-92-1: Drainage area. WDRWI-87-1: All published values for the 1987 water year are invalid. Two valid
values for water years 1987 and 1988 are available: May 7, 1987, water surface 10.52 ft, and May 16, 1988, water surface 10.83 ft.GAGE.-Nonrecording gage. Datum of gage is 848.07 ft above sea level. Prior to Oct. 23, 1990, nonrecording gage. Local observer, Richard
Lillie, reads staff gage 2-3 times per week when lake is ice-free.REMARKS.-Lake has no surface outlet.EXTREMES FOR PERIOD OF RECORD.-Maximum gage height observed, 11.96 ft, July 4, 1999; minimum observed, 3.02 ft, Aug. 29,
1970.EXTREMES FOR CURRENT YEAR.--Maximum gage height observed, 11.96 ft, July 4; minimum observed, 11.07 ft, Jan. 7.
GAGE HEIGHT, FEET, WATER YEAR OCTOBER 1998 TO SEPTEMBER 1999 DAILY MEAN VALUES
12
10
OCT
12345
67
910
1112131415
1617181920
2122232425
262728293031
11
11
11
11
11
11
11
11
11
1111
11
.23
.20
.35
.32
.30______.28
.26___.30___
.28
___.22.22
______
______.26
NOV
11.19
DEC JAN FEB JUL AUG
11.32
11.07
11.22
11.28
11.25
11.84
11.8311.82 11.84
11.83 11.70
11.8911.8711.8511.83
11.91
11.74
11.66
SEP
1111
111111
11
11
11
11
11
---
.46
.51
___ .48.62.62
.65 .65
.65
.64___.63
___
11. 11.
-11.11.
_--
11.-
11.-
11.-
11.
11.11.
_11.
-
82 81--7979
__----84--
83--81 71
7188--90--
11. 11.
-11.11.
11.11.11.11.
-
_-
11.11.
-
11.11.11.11.11.
83 86--8483
82848284--
__--8584--
8280787574
11.95 11.9411.9511.9611.94
___11.9011.8611.86
______
___
___
11.76
11
1111
11
111111
1111
1111
1111
1111
.87
.83
.81
.79___.79.82.80
.79
.79___.77.75
.74
.73
.74
.73
11
11
111111
11
1111
11
111111
___
.64
.62
.61
.58
.56___
.51___
.45
.44
.43
.40
.39
.37
11.8411.8611.85
___
11.9011.9411.9211.90
11.73
11.7511.7411.73
11.8911.89
___
11.8811.87
11.7011.7711.76
___
11.3511.33
---
11.3711.45
1966 1968 1970 1972 1974 1976 1978 1980 1982 1984 1986 1988 1990 1992 1994 1996 1998
47

423525088260400 GENEVA LAKE AT LAKE GENEVA, WI
LOCATION.-Lat 42°35'25", long 88°26'04" in SE 1/4 NW 1/4 sec.36, T.2 N., R. 17 E., Walworth County, Hydrologic Unit 07120006, at Lake Geneva dam at Center Street at Lake Geneva.
DRAINAGE AREA.--28.7 mi 2 . Area of Lake Geneva, 5,262 acres.
PERIOD OF RECORD.-October 1997 to September 1999.
GAGE. Water-stage recorder. Datum of gage is 862.08 ft above sea level.
REMARKS.-Estimated daily gage heights: Jan. 10-11, Apr. 9, and May 27, 1998. Recording rain gage and gage-height telemeter at station.
EXTREMES FOR CURRENT PERlOD.-Water year 1998: Maximum gage height observed, 3.02 ft, June 28; minimum gage height observed, 1.86ft, Jan. 2. Water year 1999: Maximum gage height observed, 3.23 ft, May 17; minimum gage height observed, 1.84 ft, Sept. 27.
GAGE HEIGHT, FEET, WATER YEAR OCTOBER 1997 TO SEPTEMBER 1998
DAILY MEAN VALUES
DAY OCT NOV DEC JAN MAY JUN JUL AUG SEP
12345
6789
10
1112131415
1617181920
2122232425
262728293031
MEANMAXMIN
2.402.402.392.402.40
2.382.382.392.412.38
2.372.372.422.392.36
2.352.342.342.332.31
2.302.282.282.292.29
2.282.312.312.302.302.30
2.352.422.28
2.312.302.282.282.27
2.292.302.302.302.29
2.292.272.252.252.27
2.282.272.252.242.23
2.222.242.222.212.22
2.222.222.232.242.26---
2.262.312.21
2.262.262.292.312.30
2.292.282.282.282.31
2.312.312.282.262.26
2.232.212.202.182.17
2.152.142.132.122.14
2.132.102.092.082.072.05
2.212.312.05
2.022.022.032.052.10
2.122.142.162.242.21
2.172.142.152.142.14
2.132.142.132.122.11
2.112.112.122.112.10
2.092.082.082.082.072.06
2.112.242.02
2.062.082.072.062.06
2.052.052.042.032.03
2.062.102.092.072.06
2.052.072.072.062.05
2.042.022.022.032.01
2.012.052.04______
2.052.102.01
2.032.042.052.052.06
2.072.062.082.132.13
2.132.142.142.122.11
2.112.122.182.212.21
2.222.232.242.242.25
2.292.302.322.342.352.44
2.172.442.03
2.492.502.492.492.49
2.492.492.552.592.60
2.602.602.602.622.60
2.672.672.662.652.65
2.682.692.682.672.65
2.672.672.652.652.64
2.612.692.49
2.652.652.642.632.63
2.642.732.792.772.75
2.742.722.762.742.73
2.772.732.712.692.68
2.652.612.602.662.67
2.662.642.682.712.682.70
2.692.792.60
2.672.652.622.602.57
2.562.542.522.522.54
2.572.622.642.622.61
2.612.612.612.662.63
2.632.612.602.592.62
2.752.732.842.842.82---
2.632.842.52
2.772.752.732.742.71
2.712.692.682.662.64
2.632.612.592.582.57
2.532.522.512.512.51
2.552.532.512.482.46
2.442.442.432.402.382.36
2.572.772.36
2.352.342.332.342.36
2.402.412.432.432.42
2.402.382.372.382.37
2.362.362.342.332.33
2.322.322.342.332.36
2.352.352.372.382.362.35
2.362.432.32
2.352.322.302.292.29
2.292.342.312.292.29
2.282.252.252.302.38
2.372.372.372.372.37
2.352.332.322.312.31
2.332.312.302.302.29---
2.322.382.25
48

OCT
423525088260400 GENEVA LAKE AT LAKE GENEVA, WI--CONTINUED
GAGE HEIGHT, FEET, WATER YEAR OCTOBER 1998 TO SEPTEMBER 1999
DAILY MEAN VALUES
NOV DEC JAN FEE MAR APR MAY JUN JUL SEP
12345
6789
10
1112131415
1617181920
2122232425
262728293031
MEANMAXMIN
2.272.262.282.272.32
2.382.392.372.372.36
2.362.362.342.322.31
2.322.392.502.472.45
2.432.412.412.402.39
2.392.402.412.402.412.41
2.372.502.26
2.402.362.352.342.34
2.332.322.322.322.58
2.532.472.462.472.46
2.452.442.442.472.42
2.412.432.412.402.40
2.402.392.402.422.45
2.412.582.32
2.462.452.452.442.45
2.472.502.502.492.48
2.482.462.452.452.45
2.432.422.422.412.40
2.432.452.412.422.42
2.412.392.392.392.392.39
2.442.502.39
2.372.382.452.432.43
2.432.442.442.452.45
2.452.452.452.452.45
2.452.482.532.522.51
2.512.582.642.662.66
2.642.632.622.612.592.57
2.512.662.37
2.572.572.572.562.55
2.552.542.542.532.52
2.562.602.582.562.55
2.552.532.522.512.50
2.492.472.452.442.43
2.422.422.42______
2.522.602.42
2.402.402.402.382.37
2.392.382.362.392.39
2.372.352.342.332.32
2.312.332.292.292.30
2.302.302.312.312.31
2.312.322.342.342.352.36
2.342.402.29
2.352.362.362.382.37
2.432.412.402.482.50
2.522.522.522.522.52
2.552.562.572.562.57
2.582.612.772.802.78
2.772.752.782.772.76
2.562.802.35
2.742.732.712.692.70
2.762.772.752.722.70
2.692.762.752.762.76
2.792.922.942.932.92
2.922.993.002.982.96
2.922.892.862.842.822.83
2.823.002.69
2.852.892.862.832.83
2.822.832.792.772.77
2.852.903.043.153.08
3.032.972.922.872.84
2.812.792.772.772.76
2.742.722.772.742.71---
2.853.152.71
2.692.672.692.682.67
2.632.612.592.582.53
2.522.512.512.502.47
2.462.472.482.482.48
2.482.462.502.532.51
2.512.502.502.502.482.48
2.542.692.46
2.442.412.402.372.35
2.332.322.312.302.29
2.282.292.312.282.27
2.272.252.242.292.29
2.292.292.302.362.36
2.362.372.372.352.322.32
2.322.442.24
2.322.312.322.312.31
2.302.282.272.252.22
2.192.192.192.172.14
2.122.122.112.122.10
2.082.072.062.032.02
2.032.042.272.342.34___
2.192.342.02
49

423455088263800 GENEVA LAKE AT GENEVA BAY AT LAKE GENEVA, WI
LOCATION.-Lat 42°34'55", long 88°26'38", in NE 1/4 NE 1/4, sec.2, T.I N., R.17 E., Walworth County, Hydrologic Unit 07120006,0.7 misouthwest of outlet at Lake Geneva.
DRAINAGE AREA.-28.7 mi2 .PERIOD OF RECORD.-April 1997 to February 1999 (discontinued). REMARKS.-Lake sampled at a depth of about 15 m. Lake ice-covered during February sampling. Water-quality analyses done by Wisconsin
State Laboratory of Hygiene. Samples for determination of chlorophyll-a concentration are collected from the top 1.5 ft of the lake.
WATER-QUALITY DATA, FEBRUARY 08, 1999 (Milligrams per liter unless otherwise indicated)
Feb-8
Lake stage (ft)Secchi-depth (m)Chloroohvll a, onvtoolankton (uq/L)Depth of sample (m)Water temoerature (°C)Specific conductance (uS/cm)pH (units)Dissolved oxygen (mg/L)Phosphorus, total (as P)Phosphorus, ortho, dissolved (as P)Nitrogen, NO2 + N03, diss. (as N)Nitrogen, ammonia, dissolved (as N)Nitrogen, amm. + org., total (as N)Nitrogen, total (as N)
2.52.
0.51.95058.313.4
<0.0050.0020.0870.0130.420.51
54.631
14.02.15068.413.10.0070.0020.055<0.0130.620.68
02-08-99
DISSOLVED OXYGEN (D.O.), IN MILLIGRAMS PER LITER
0 10 20
10
15
W.T.
D.O.
0 10 20 30
WATER TEMPERATURE (W.T.), IN DEGREES CELSIUS
PH, IN STANDARD UNITS
6 7 8 9 100
10
15
S.C.
400 500 600
SPECIFIC CONDUCTANCE (S.C.), IN MICROSIEMENS PER CENTIMETER AT 25 DEGREES CELSIUS
50

423420088320500 GENEVA LAKE AT WILLIAMS BAY AT WILLIAMS BAY, WI
LOCATION.--Lat 42°34'20", long 88°32'05", in NE 1/4 SW 1/4, sec.6, T. 1 N., R. 17 E., Walworth County, Hydrologic Unit 07120006, at Wil liams Bay.
DRAINAGE AREA.--28.7 mi2 .PERIOD OF RECORD.-April 1997 to February 1999 (discontinued).REMARKS.-Lake sampled at adepth of about 18 m. Lake ice-covered during February sampling. Water-quality analyses done by Wisconsin
State Laboratory of Hygiene. Samples for determination of chlorophyll-a concentration are collected from the top 1.5 ft of the lake.
WATER-QUALITY DATA, FEBRUARY 08, 1999 (Milligrams per liter unless otherwise indicated)
Feb-8
Lake stage (ft)Secchi-depth (m)Chlorophyll a, phytoplanktonDepth of sample (m)Water temoerature (°C)Specific conductance (nS/cm)pH (units)Dissolved oxygen (mg/L)Phosphorus, total (as P)Phosphorus, ortho, dissolved (as P)Nitrogen, N02 + N03, diss. (as N)Nitrogen, ammonia, dissolved (as N)Nitrogen, amm. + org., total (as N)Nitrogen, total (as N)
2.52.
0.51.84778.413.8
<0.0050.0020.053<0.0130.440.49
54.866
16.52.15068.413.40.0050.0020.051<0.0130.220.27
02-08-99
DISSOLVED OXYGEN (D.O.), IN MILLIGRAMS PER LITER
0 10 20u
001 55 10
Q
on
_,,,,,,
W.T.
-
~ D.O.
', , , , 1 , , , , 1
-
-
-
-
:
0 10 20 30
WATER TEMPERATURE (W.T.), IN DEGREES CELSIUS
PH, IN STANDARD UNITS
6 7 8 9 10u
1 5H
5 10DCHOH
8 15
on
1 S.C.
- -
:
:
-
-
---
-
400 500 600
SPECIFIC CONDUCTANCE (S.C.), IN MICROSIEMENS PER CENTIMETER AT 25 DEGREES CELSIUS
51

423402088301400 GENEVA LAKE AT CENTER NEAR LAKE GENEVA, WI
LOCATION.~Lat 42°34'02", long 88°30'14", in NE 1/4 NE 1/4, sec.8, T.I N., R.17 E., Walworth County, Hydrologic Unit 07120006, 3.9 misouthwest of outlet at Lake Geneva.
DRAINAGE AREA.-28.7 mi2 .PERIOD OF RECORD.-April 1997 to March 1999 (discontinued). REMARKS. Lake sampled at a depth of about 29 m. Lake ice-covered during February sampling. Water-quality analyses done by Wisconsin
State Laboratory of Hygiene. Samples for determination of chlorophyll-a concentration are collected from the top 1.5 ft of the lake.
WATER-QUALITY DATA, OCTOBER 13 AND 26, 1998 (Milligrams per liter unless otherwise indicated)
Oct-13 Oct-26
Lake stage (ft)Secchi-depth (m)Chlorophyll a, phytoplankton (ng/L)Depth of sample (m)Water temoerature (°C)Specific conductance (nS/cm)PH (units)Dissolved oxygen (mg/L)Phosphorus, total (as P)Phosphorus, ortho, dissolved (as P)Nitrogen, NO2 + N03, diss. (as N)Nitrogen, ammonia, dissolved (as N)Nitrogen, amm. + org., total (as N)Nitrogen, total (as N)
0.516.74868.69.2
0.006<0.0020.019<0.0130.710.73
14.016.74868.58.9
0.007<0.0020.01
<0.0130. 640.65
2.34 3.83.2819.09.05187.50.7
0. 006<0.0020.013<0.0130.580.59
24.08.25187.50.6
0.008<0.0020.134<0.0130.470.60
28 .07 .35227 . 50.6
0.0290. 0170.0170.1320.660.68
0.514.34898 .49.4
<0.0050.002<0.010<0.0130 .51___
16.013.94908.49.1
<0.0050.002<0.010<0.0130.51___
2.39 5.22.1819.09.75167.61.9
0 .007<0.0020.021<0.0130.430.45
23 .08.85167.51.2
0.0080.0020.073<0.0130.510.58
28.07.85207.50.6
0.0140.0030.0310.0590.630.66
10-13-98 10-26-5
DISSOLVED OXYGEN (D.O.), IN MILLIGRAMS PER LITER
10 20 ° 10u
t>o 5PiUw 10Sg 15
sc£ 20uQ 25
jn
^_ D.O.
7
~r~~~^'!;;
: /
-, i i , i i
i i i i i _
_ii-
-;
W.T. ;-:---
-_
i i i i i .-
20
10 20 30 ° 10 20 WATER TEMPERATURE (W.T.), IN DEGREES CELSIUS
30
pi
wSgEfcUQ
u
5
10
15
20
25
in
1
- s.c.-
j-
1
rK
1 '
PH :
-.^
-j
-
PH, IN STANDARD UNITS
10 6 10
r
400 500 600 "400 500 600 SPECIFIC CONDUCTANCE (S.C.), IN MICROSIEMENS PER CENTIMETER AT 25 DEGREES CELSIUS
52

423402088301400 GENEVA LAKE AT CENTER NEAR LAKE GENEVA, WI-CONTINUED
WATER-QUALITY DATA, NOVEMBER 17, 1998 TO MARCH 22, 1999 (Milligrams per liter unless otherwise indicated)
Nov-17 Dec-16 Mar-22
Lake stage (ft)"ecchi-depth (m)Chlorophyll a, phytoplankton (nq/L)"Jepth of sample (m)
]l 'ater temperature (°C)"necific conductance (nS/cm)pH (units)rissolved oxygen (mg/L)"'hosphorus, total (as P)"'hosphorus, ortho, dissolved (as P)ritrogen, N02 + N03, diss. (as N)ritrogen, ammonia, dissolved (as N)ritrogen, amm. + org., total (as N)ritrogen, total (as N)
2.445.31.64
0.59.34978.29.4
0.0050.0020.0350.0210.400.44
28.09.14998.29.2
0.0060.0020.0190.0260.520.54
2.437.31.73
0.57.24958.211.30.0140.0030.0630.0190.500.56
28.07.24978.211.00.0140.0030.0310.0150.630.66
2.546.63.40
0.51.75008.413.40.006<0.0020.057<0.0130.480.54
27.02.55028.311.4 0.014 0.003 0.066 <0.0130.180.25
0.52 .55028.313.70.0070.0010.057<0.0130.460.52
2.305.03.38
28.02.65038.413.20.009<0.0020.077<0.0130.400.48
11-17-98 12-16-98 02-08-99 03-22-99
10u
5
10
15
20
25
-
_W.T.
_
-
-
i i i 1 ,
,,,,,_
-_
i
_:D.O. |
-|
^, , i , , . ,-
20
400
10 20 30
U
5
10
15
20
25
in
i j
B.C.
-
-
-
-
1
pH j
^
-_
i
-_
500 600
DISSOLVED OXYGEN (D.O.), IN MILLIGRAMS PER LITER
10 20U
5
10
15
20
25
-
-
-
-
-
"111
' ' '
i 1 i i .
' ' ' ' :
-_
-_
-_
-.
-_
, i , , , ,-
10 20
10 20 30
u
5
10
15
20
25
in
,,,,,.
_
"
/- (
' ' ' :
-.
-.
-_
-.
-.
tiii10 20 30
WATER TEMPERATURE (W.T.), IN DEGREES CELSIUS
u
5
10
15
20
25
30 4C
-
-
-
-
-
K) 50
-_
-.
-_
-.
-_
0 60
PH, IN STANDARD UNITS
10 10u
5
10
15
20
25
JO
1
-
-
-
-
-
- |
;-_
i
-_
-_
-_
-
400 500 600
10 20u
5
10
15
20
25
in
-
--
--
1 1 1 1 1 1
,,,!,,..
.
i
i-.
-.
-. 1 , .-
10 20 30
100
5
10
15
20
25
30 40
1 k
-
-
-
~
(0 50C
-_
-
-i
-.
-
60
SPECIFIC CONDUCTANCE (S.C.), IN MICROSIEMENS PER CENTIMETER AT 25 DEGREES CELSIUS
53

°'025
w 0.020
O e- 0.015U V5
COS
3 <0£ QJ2 2 o.oio
0.005 o o
o
I I I
15
1997 1999
§
11
H o >§£yS s 3^iU
1997 1999
1C/5
hW
13
UJ
25
§6 in
1997 1998 1999
100
90
80 X g 70
uj 60
S 50O=? 40o.oos 30
20
10
EXPLANATION
- - Total Phosphorus
-O- Chlorophyll a
-* Secclii
Eutrophic
Oligotrophic
1997 1998
YEAR
1999
Surface total phosphorus, chlorophyll a concentrations, Secchi depths, and TSI data for Geneva Lake, Center Site, near Lake Geneva, Wisconsin.
(Circles on the first three plots indicate laboratory detection limit for selected analyses. Actual concentrations for these particular analyses are less than the plotted circles.)
54

423421088272300 GENEVA LAKE AT EAST END NEAR LAKE GENEVA, WI
LOCATION.--Lat 42°34'21", long 88°27'23", in NE 1/4 SW 1/4, sec.2, T.I N., R.17 E., Walworth County, Hydrologic Unit 07120006,1.6 misouthwest of outlet at Lake Geneva.
DRAINAGE AREA.-28.7 mi2 . PERIOD OF RECORD.-April 1997 to current year. REMARKS. Lake sampled at a depth of about 23 m. Lake ice-covered during February sampling. Water-quality analyses done by Wisconsin
State Laboratory of Hygiene. Samples for determination of chlorophyll-a concentration are collected from the top 1.5 ft of the lake.
WATER-QUALITY DATA, OCTOBER 13 TO NOVEMBER 17, 1998 (Milligrams per liter unless otherwise indicated)
Oct-26 Nov-17
Lake stage (ft)fecchi-depth (m)Chloroohvll a, Dhvtoolankton (ua/L)Tepth of sample (m)Vi'ater temoerature (°C)Foecific conductance (uS/cm)]-H (units)rissolved oxygen (mg/L)rhosphorus, total (as P)rhosphorus, ortho, dissolved (as P)ritrogen, NO2 + NO3, diss. (as N)ritrogen, ammonia, dissolved (as N)ritrogen, amm. + org., total (as N)ritrogen, total (as N)
0.516.84868.59.3
<0.005<0.0020.02
<0.0130. 570. 59
15.016.64868.48.9
0.006<0.0020.02
<0.0130.510.53
2.34 4.03 .3717 .012.35167.61.4
0.007<0.0020.02
<0.0130.530.55
19.09.55187.50.6
0.007<0.0020.0170.0310.520.54
21.08.65187 . 51.00.008<0.0020.090.0170.450.54
0.514.34878.49.5
0.0090.0020.014<0.0130.640.65
2.: 5 .I. 1
18.013.34928.38.2
0.0080.0020.013<0. 0130.610.62
39 57520.09.15177.50.8
0. 0100.0020.0510.0130.580.63
23.08.85187.50.6
0.0130.0020.0560.0290.590.65
2 . 5.1.
0.58.94958.310.40.0080.0020.030.0210.450.48
44 .078
23.08.74978.39.9
0.0080.0020.0260.0250.460.49
10-13-98 10-26-98 11-17-98
10 20
DISSOLVED OXYGEN (D.O.), IN MILLIGRAMS PER LITER
0 10 20
D.O.
W.T.
u
5
10
15
20
i<
!'7
'-
\ j'{;'
-_
-_
-_
-j
10 20 30 0 10 20 30
WATER TEMPERATURE (W.T.), IN DEGREES CELSIUS
10 20u
5
10
15
20
tf
-
-
-
I
-m
-_
-j
-_
10 20 30
u
^0 c
S 102
£ 15
Q 20
95
1 '
|-
r s.c!
'- J
i
' :
pH ^
-j
I-
-_
10
PH. IN STANDARD UNITS
6 7 8 9 10 100
5
10
15
20
>«
1
-
-
-
-
1
1
-j
-j
-j
-j
:400 500 600 400 500 600 400 500
SPECIFIC CONDUCTANCE (S.C.), IN MICROSIEMENS PER CENTIMETER AT 25 DEGREES CELSIUS
600
55

423421088272300 GENEVA LAKE AT EAST END NEAR LAKE GENEVA, WI--CONTINUED
WATER-QUALITY DATA, DECEMBER 16, 1998 TO APRIL 13, 1999 (Milligrams per liter unless otherwise indicated)
Feb-8 Apr-13
Lake stage (ft)Secchi-depth (m)Chloroohvll a, Dhytoolankton (ua/L)Depth of sample (m)Water temperature (°C)Specific conductance (US/cm)pH (units)Dissolved oxygen (mg/L)Phosphorus, total (as P)Phosphorus, ortho, dissolved (as P)Nitrogen, N02 + N03, diss. (as N)Nitrogen, ammonia, dissolved (as N)Nitroaen, amm. + orq., total (as N)Nitrogen, total (as N)Color (Pt-Co. scale)Turbidity (NTU)Hardness, (as CaC0 3 )Calcium, dissolved (Ca)Magnesium, dissolved (Mg)Sodium, dissolved (Na)Potassium, dissolved (K)Alkalinity, (as CaC0 3 )Sulfate, dissolved (S0 4 )Chloride, dissolved (Cl)Silica, dissolved (Si0 2 )Solids, dissolved, at 180°CIron, dissolved (Fe) ua/LManaanese, dissolved (Mn) ua/L
2 .62 .
0 .56.74968.311.70 .0120 . 0030 .0520 .0230 .610 . 66____________________________________
43.555
22 .06.74978.311.40.0130.0030 .0490.0220.540 . 59____________________________________
2 .52 .
0.51.74998.413 .5
<0 .005<0 .0020 .016<0.0130 .410 .43____________________________________
54.864
20 .52.35128.311.70.0260 .0030.0850 .0140 -250 .34____________________________________
2 .42
0 .53 .15008.313.60 . 0080.0010 .079<0. 0130.390.47---_________________________________
30.9.9
21 . 03 .05008.413.00 . 008<0 . 0020 .072<0 . 0130.50.57____________________________________
2 .61.
0.57.55088.412 .80 .005<0 .0020 .077<0 .0130 .470.55<50.32203333171.918631350.3272
52. 702
21.55.15098.312.20 .008<0.0020 .0770. 0140.490.57_________________________________---
0.5
12-16-98
10
2-08-99 3-22-99 04-13-99
DISSOLVED OXYGEN (D.O.), IN MILLIGRAMS PER LITER
20
<S)&W
12
ad£wQ
U
5
10
15
20
i«
_,,,,,
1
'7
-
~
' ' ' :
-.-
-_i-
- ~~
(0
5
10
15
20
">*
) 10: 'w.f. ' '
p':
-
\ I
2'.
-_
D.O.-
-j
-j
0 (0
5
10
15
20
T;
) 10_ J 1 1 1 1 1
r'-
'-
". 1 1 1 1 1 1 1 1
2
-
-_
-m
-_
-_
0 (0
5
10
15
20
9^
) 10, 1^, , , 1 ,
'-
'-
-
21 ' ' ' "
-_
-j
-j
1 , . , ,'
10 20 30 10 20 30 10 20 30 10
WATER TEMPERATURE (W.T.), IN DEGREES CELSIUS
VD
PJs2
iPNPJQ
u
5
10
15
20
o<c
1
r s.c.
-
'-
-
pH -
--
-j
~
:
9 10 67
PH, IN STANDARD UNITS
8 9 10 67
20 30
100
5
10
15
20
i^
1 l
'-
'-
~
r /
:-_
-_
-_
-f
0
5
10
15
20
-K
1
'-
'-
'-
'-
' :-_
-_
-_
-_
0
5
10
15
20
9s
1 '
r
'-
'-
'-
~
-_
-_
-_
-_
400 500 600 400 500 600 400 500 600 400 500 600
SPECIFIC CONDUCTANCE (S.C.), IN MICROSIEMENS PER CENTIMETER AT 25 DEGREES CELSIUS
56

423421088272300 GENEVA LAKE AT EAST END NEAR LAKE GENEVA, WI--CONTINUED
WATER-QUALITY DATA, MAY 19 TO JUNE 14, 1999 (Milligrams per liter, unless otherwise indicated)
May-19 Jun-14
Lake stage (ft)Secchi-depth (m)Chlorophyll a, phvtoplankton (ucr/L)Depth of sample (m)Water temperature (°C)Specific conductance (uS/cm)pH (units)Dissolved oxygen (mg/L)Phosphorus, total (as P)Phosphorus, ortho, dissolved (as P)Nitrogen, N02 + N03, diss. (as N)Nitrogen, ammonia, dissolved (as N)Nitrogen, amm. + org., total (as N)Nitrogen, total (as N)
0.514.24978.410.8
<0.005<0.0020.0920.0030.560.65
11.012.34998.410.70.005<0.0020.076<0.0130.560.64
2.93 5.00.4316.09.05058.310.80.005<0.0020.0790.0060.50.58
18.08.65058.310.9
<0.005<0.0020.0830.0090.560.64
21.08.65058.310.9
<0.005<0.0020.0810.0140.570.65
0.521.44798.48.6
0.0080.0030.0710.0270.650.72
6.021.24798.48.4
<0.0050.0040.0790.0170.650.73
3.15 4.90.2613.014.14998.49.4
<0.0050.0030-0660.0170.60.67
18.09.85048.28.6
0.0080.0030.0790.0430.550.63
22.09.05068.18.1
<0.0050.0030.0760.0690.580.66
5-19-99 6-14-99
DISSOLVED OXYGEN (D.O.), IN MILLIGRAMS PER LITER
10 20
§ 10
ffi" 15
| Q 20
W.T.
D.O. -
10 20U
5
10
15
20
o<
: ' ' ' '
'-
7
'-
'- \
', , , , 1 ,
i i. i i
-_
-j
-j
-j
...lii..'
0 10 20 30 ° l° 20 30 WATER TEMPERATURE (W.T.), IN DEGREES CELSIUS
on
i§£
SQ
u
5
10
15
20
os
1
1 S.C.
i-
!-
~*
i
1
PH j
-
I-
:~
:
PH, IN STANDARD UNITS
9 10 6 7 8 9 10
400 500 600 400 500 600 SPECIFIC CONDUCTANCE (S.C.), IN MICROSIEMENS PER CENTIMETER AT 25 DEGREES CELSIUS
57

423421088272300 GENEVA LAKE AT EAST END NEAR LAKE GENEVA, WI--CONTINUED
WATER-QUALITY DATA, JULY 13 TO AUGUST 17, 1999 (Milligrams per liter unless otherwise indicated)
Jul-13 Aug-17
Lake stage (ft)Secchi-depth (m)Chlorophyll a, phvtoDlankton (ua/L)Depth of sample (m)Water temoerature (°C)Specific conductance (uS/cm)pH (units)Dissolved oxygen (mg/L)Phosphorus, total (as P)Phosphorus, ortho, dissolved (as P)Nitrogen, N02 + N03, diss. (as N)Nitrogen, ammonia, dissolved (as N)Nitrogen, amm. + org., total (as N)Nitrogen, total (as N)
0.524.84878.49.1
<0.0050.002<0.010<0.0130.39
9.023.04928.37.9
<0.0050.0030.0180.0170.370.39
2.515.51.7813.013.85058.18.1
0.0090.0020.0730.0220.570.64
18.010.55088.07.6
<0.0050.0020.0830.0530.530.61
23.09.35137.96.0
0.0110.0030.0660.0980.650.72
0.523.74928.38.6
0.009<0.002<0.0050.0120.45___
11.022.94948.37.5
0.010<0.002<0.005<0.0020.41
2.25 4.61.6515.011.85127.84.9
0.008<0.0020.138<0.0020.460.6
18.010.15147.73.6
0.011<0.0020.184<0.0020.390.57
22.59.55167.62.80.010<0.0020.2250.0060.430.65
7-13-99 8-17-99
DISSOLVED OXYGEN (D.O.), IN MILLIGRAMS PER LITER
10 20 -° 10
06tuw SzKa.taQ
u
5
10
15
20
T<;
_,,,,,,,,,_
L ) J/ '
'". ( J '-.'- /.- *"" -'- I -_
I /
; f 1
20
10 20 30 10 20 WATER TEMPERATURE (W.T.), IN DEGREES CELSIUS
30
- S.C.
PH, IN STANDARD UNITS
9 10 67
PH J
u
5
10
15
20
T;
1 '
-
r
\ 1
\ \
'
-j
-j
-_
-_
10
400 500 600 400 500 600 SPECIFIC CONDUCTANCE (S.C.), IN MICROSIEMENS PER CENTIMETER AT 25 DEGREES CELSIUS
58

423421088272300 GENEVA LAKE AT EAST END NEAR LAKE GENEVA, WI--CONTINUED
WATER-QUALITY DATA, SEPTEMBER 15, 1999 (Milligrams per liter unless otherwise indicated)
Sep-15
Lake stage (ft)Secchi-depth (m)Chloroohvll a, Dhvtoolankton (ua/L)Depth of sample (m)Water temoerature (°C)Soecific conductance (us/cm)pH (units)Dissolved oxygen (mg/L)Phosphorus, total (as P)Phosphorus, ortho, dissolved (as P)Nitrogen, N02 + N03, diss. (as N)Nitrogen, ammonia, dissolved (as N)Nitrogen, amm. + org., total (as N)Nitrogen, total (as N)
0.520.44908.38.3
0 .008<0 .002<0.0100.0040.43___
12.020.24918.28.1
0.008<0.002<0.0100.0010.48___
2.14 4.60.5616. 010.54977.52 .10.009<0 .0020 .160.0120.540.70
19 .010.14947.51.7
0 .009<0.0020.1640.0270.400.56
22 .010.14977.51.9
0.0090.0020 .1740 .0130 .490.66
9-15-99
DISSOLVED OXYGEN (D.O.), IN MILLIGRAMS PER LITER
0 10 20u
2 5
1 102£ 15wQ 20
1*
H ' ' '
^_ D.O.
1
: ^^x*f"! /f|
i
-_-
..- :W.T. ~
-~
0 10 20 30 WATER TEMPERATURE (W.T.), IN DEGREES CELSIUS
PH, IN STANDARD UNITS
6 7 8 9 100
CO c
UJ
1 .02
L S.C. pH
400 500 600
SPECIFIC CONDUCTANCE (S.C.), IN MICROSIEMENS PER CENTIMETER AT 25 DEGREES CELSIUS
59

§p< at,g5 pa 0.020
U Qi
z aO ». 0.015U t/5
5 <as a:Q 2 0.010
& 0.005
1 1 1
O O O O O
i i i i
15
1997 1998 1999
z1 *
i K j<3
11O 5 os "rOZ
u
1997 1998 1999
0
1v, OSa oH 2
Z3
ft 4
sa
j i i i i 1 i i I I L.
1997 1998 1999
100
90
80
I 70sa 60H
K 50US 40a.§ 30H
20
10
Eutrophic
Mesotrophic
EXPLANATION
B Total Phosphorus
-O- CWorophyll a
*< Secclii
OligOttOphic
1997 1998
YEAR
1999
Surface total phosphorus, chlorophyll a concentrations, Secchi depths, and TSI data for Geneva Lake, East End, near Lake Geneva, Wisconsin.
(Circles on the first three plots indicate laboratory detection limit for selected analyses. Actual concentrauons for these particular analyses are less than the plotted circles.)
60

423329088323300 GENEVA LAKE AT WEST END NEAR WILLIAMS BAY, WI
LOCATION.-Lat 42°33'29", long 88°32'33", in NE 1/4 SE 1/4, sec.12, T.I N., R.16 E., Walworth County, Hydrologic Unit 07120006, 1.3mi south of Williams Bay.
DRAINAGE AREA.-28.7 mi2 . PERIOD OF RECORD.-April 1997 to current year. REMARKS.--Lake sampled at deep hole at a depth of about 43 m. Lake ice-covered during February sampling. Water-quality analyses done
by Wisconsin State Laboratory of Hygiene. Samples for determination of chlorophyll-a concentration are collected from the top 1.5 ftof the lake.
WATER-QUALITY DATA, OCTOBER 13 AND 26, 1998 (Milligrams per liter unless otherwise indicated)
Oct-13 Oct-26
]".<ake stage (ft)fecchi-depth (m)Chlorophyll a, phytoplankton (ng/L)P'spth of sample (m)Water temoerature (°C)f-Tecific conductance (nS/cm)~H (units)1" -.ssolved oxygen (mg/L)Tiosphorus, total (as P)3:hosphorus, ortho, dissolved (as P)"itrogen, N02 + NO3, diss. (as N)"itrogen, aimionia, dissolved (as N)"itrogen, amm. + org., total (as N)"itrogen, total (as N)
0.516.74878.59.4
0.005<0.0020.025<0.0130.570.6
14.016.24918.47.90.007<0.0020.025<0.0130.690.71
2. 4.--
22.08.95157.63.7
<0.005<0.0020.045<0.0130.530.57
341 33.07.25207.51.3
<0.005<0.0020.247<0.0130.480.73
38.06.95257.50.6
0.0430.030.030.2281.61.7
43.06.85297.50.6
0.0610.047<0.0100.271.1
0.514.04918.49.20.009<0.002<0.010<0.0130.44
17.013.74948.38.3
0.013<0.002<0.010<0.0130.54
2.:5.I. 1
30.07.65187.51.2
<0.0050.0020.179<0.0130.660.84
39 59734.07.25227.50.6
0.0140.0110.0120.1020.560.57
38.07.05257.50.6
0.0410.037<0.0100.2380.81
43.06.95277.50.60.0670.066<0.0100.3551.2
10-13-98 10-26-98
DISSOLVED OXYGEN (D.O.), IN MILLIGRAMS PER LITER
0
5 c/5 <* 10SW 15
^ 20 Z" 25 K£30 w ,_Q 35
40
45
10 20
W.T. J
0 10 20
10 20 30 0 10 20
WATER TEMPERATURE (W.T.), IN DEGREES CELSIUS
PH, IN STANDARD UNITS
u
5
10
15
20
25
30
35
40A*.
1
_
s.c.------
1
i~r
1 ' -.:
pH j
^ 4
\
\
\\ -i\ -.
10
400 500 600 400 500 600 SPECIFIC CONDUCTANCE (S.C.), IN MICROSIEMENS PER CENTIMETER AT 25 DEGREES CELSIUS
u
5
10
15
20
25
30
35
40/i«
1-
-
-
-
-
-
-
-
1 1 ;-j
44--I-I
: -I
30
10
61

423329088323300 GENEVA LAKE AT WEST END NEAR WILLIAMS BAY, WI-CONTINUED
WATER-QUALITY DATA, NOVEMBER 17, 1998 TO MARCH 22, 1999 (Milligrams per liter unless otherwise indicated)
Nov-17 Dec-16 Feb-8 Mar-22
Lake stage (ft)Secchi-depth (m)Chlorophyll a, phytoplankton (ug/L)Depth of sample (m)Water temoerature (°C)Specific conductance (nS/cm)pH (units)Dissolved oxygen (mg/L)Phosphorus, total (as P)Phosphorus, ortho, dissolved (as P)Nitrogen, N02 + N03, diss. (as N)Nitrogen, ammonia, dissolved (as N)Nitrogen, amm. + org., total (as N)Nitrogen, total (as N)
0.59.35018.18.5
0.0060.0030.0370.0370.420.46
2.445.51.0440.08.55107.72.6
0.0230.0130.0420.1040.500.54
43.08.05177.50.6
0.0540.020.0060.2030.690.70
2. 62.
0.57.44968.111.20.0140.0030.0610.0120.510.57
43 .292
44.07.44988.110.60.0150.0030.0660.0110.520.59
0.51.04808.413.90.005<0.0020.052<0.0130.360.41
2.62.
10.02.05058.413.40.0050.0020.052<0.0130.280.33
54 .724
30.02.75048.210.70.0070.0020,071<0.0130.310.38
42.03.35497.86.0
0.0250.0190.1540.1130.440.59
2. 43.
0.52.35047.613.80.0070.0020.076<0.0130.420.50
30 .987
43.02.45038.313.10.008<0.0020.077<0.0130.500.58
11-17-S 12-16-98 2-08-99 3-22-99
DISSOLVED OXYGEN (D.O.), IN MILLIGRAMS PER LITER
10 20u
5
10
15
20
25
30
35
40
AS
- ' '
'- W.T.
E-
E-
E-
E-
E-
:- x'~S\
, i i ', i i
i i i i i .
4444
D.O. j
444
1 1 1 1 1 1 1 1 :10 20
enf*W
[5S2"~
KfcWQ
u
5
10
15
20
25
30
35
40
45 4C
; '
\-
-
_
-
.
/
m so
1 ;
4:
-;-
~.
j:: --i-
-E
0 6C
10
10 20u
5
10
15
20
25
30
35
40
AS.
- ' '~r
\~T
i-!-i-
\'r' i i i
1 ' I
i 1 i i
i i i i .
-:
-
-j
-
-i4--
i , i , i :30 0 10 20 30
0 10 20
0 10 20 30
WATER TEMPERATURE (W.T.), IN DEGREES CELSIUS
u
5
10
15
20
25
30
35
40<K
: 'j-
1-
i-j-j----
\
1 ;
4-j-i44444:
PH, IN STANDARD UNITS
10u
5
10
15
20
25
30
35
40
AS.
: ' "* J.
r s.c.r1-'"-
~r
i- i
1 :
PH i-.
^.
\44-j4-
10
400 500 600 400 500 600
10 20u
5
10
15
20
25
30
35
40
AS
. 1 1 1 1 | 1
i-i-E-~~-
\' -'r
i- t , , , 1 , , i ,
' ' ' :
j
4
4
44 i44
1 1 1 1 :10 20 30
10u
5
10
15
20
25
30
35
40
45 4C
- 1------
r
K) 50
4-:
-j
4\4-j
-:
0 60
SPECIFIC CONDUCTANCE (S.C.), IN MICROSIEMENS PER CENTIMETER AT 25 DEGREES CELSIUS
62

423329088323300 GENEVA LAKE AT WEST END NEAR WILLIAMS BAY, WI--CONTINUED
WATER-QUALITY DATA, APRIL 13 TO MAY 19, 1999 (Milligrams per liter unless otherwise indicated)
Apr-13 May-19
Lake stage (ft)Secchi-depth (m)Chlorophyll a, phytoplanktonDepth of sample (m)Water temoerature (°C)Specific conductance (nS/cm)pH (units)Dissolved oxygen (mg/L)Phosphorus, total (as P)Phosphorus, ortho, dissolved (as P)Nitrogen, NO2 + NO3, diss. (as N)Nitrogen, ammonia, dissolved (as N)Nitrogen, amm. + org., total (as N)Nitrogen, total (as N)Color (Pt-Co. scale)Turbidity (NTU)Hardness, (as CaCO3 )Calcium, dissolved (Ca)Magnesium, dissolved (Mg)Sodium, dissolved (Na)Potassium, dissolved (K)Alkalinity, (as CaCO3 )Sulfate, dissolved (SO4 )Chloride, dissolved (Cl)Silica, dissolved (Si02 )Solids, dissolved, at 180°CIron, dissolved (Fe) HQ/LManganese, dissolved (Mn)
2. 6.1.
0.56.65108.213.40.006<0.0020.0830.0170.450.53
50.42203434172.01853135
0.38272
52 .728
43.05.15098.312.10.010<0.0020.079<0.0130.490.57
50.52203433171.71853135
0.50274
0.513.05008.311.5
<0.005<0.0020.0770.0010.440.52
___
_________
7.012.35008.311.00.008<0.0020.081<0.0130.490.57___
_______________
2.93 7.30.5134.06.85078.210.70.006<0.0020.0720.0250.490.56
_______________
______
39.06.65088.19.8
0.008<0.0020.0740.0490.570.64___ _______________
_________
43.06.65108.08.8
0.0110.0020.0620.0850.690.75___ ____________
___
<0.40 <0.40
04-13-99 05-19-99
DISSOLVED OXYGEN (D.O.), IN MILLIGRAMS PER LITER
10 20 10 20U
5CO« 10
E- ic [tj l ->
^ 20
~- 25 K £30
§35
40
/ic
_
-
-
-
-
r
r
, 1 i . ,
-E
-E
-E
4
i , , , J
u
5
10
15
20
25
30
35
40A<
~ W.T.;;
-
-
- ;'
-
J
~ , /
-E
D.O. -E-.
-.
-_
-.
-.
, I , . , J
10 20 30 I0 20
WATER TEMPERATURE (W.T.), IN DEGREES CELSIUS
PH, IN STANDARD UNITS
u
5
10
15
20
25
30
35
40
/fv
1 1
------
\r
-.
-j
-E
-E
-i-E4-E
10
30
10U
5
10
15
20
25
30
35
40
/i«.
: '
r S.C.
r
j-
i-!- :
[T
: /
1 :
pH -E-E
-E
-E
-E
-E
-E
-E
400 500 600 400 500 600 SPECIFIC CONDUCTANCE (S.C.), IN MICROSIEMENS PER CENTIMETER AT 25 DEGREES CELSIUS
63

423329088323300 GENEVA LAKE AT WEST END NEAR WILLIAMS BAY, WI--CONTINUED
WATER-QUALITY DATA, JUNE 14 TO JULY 13, 1999 (Milligrams per liter unless otherwise indicated)
Jun-14 Jul-13
Lake stage (ft)Secchi-depth (m)Chlorophyll a, phytoplankton (ug/L)Depth of sample (m)Water teirroerature (°C)Specific conductance (nS/cm)pH (units)Dissolved oxygen (mg/L)Phosphorus, total (as P)Phosphorus, ortho, dissolved (as P)Nitrogen, N02 + N03, diss. (as N)Nitrogen, ammonia, dissolved (as N)Nitrogen, amm. + org., total (as N)Nitrogen, total (as N)Biochemical oxygen demand (5 day)
0.521.54838.38.9
0.0060.0030.072<0.0130.750.821 C
7.021.34848.38.8
0.0070.0030.0710.0090.560.63
3.4.0.
22.09.25038.29.5
0.0070.0030.0750.0420.560.631 C.
15 .63934.07.25058.18.6
0.0070.0030.0690.0710.700.77
39.07.15078.18.0
<0.0050.0040.0770.110.740.82
43.06.95098.07.1
0.0090.0080.0730.1690.810.881 "7
0.524.64888.39.4
<0.0050.002<0.010<0.0130.38---
8.023.84888.39.4
<0.0050.002<0.010<0.0130.32
2. 52.
28.08.15108.07.8
0.0050.0020.0890.0610.430.52
51 .54533.07.45137.86.3
<0.0050.0020.0840.1470.50.58
38.07.15147.85.0
0.0080.0030.0750.20.820.89
42.57.05167.74.1
0.0170.0060.0660.2750.760.83
6-14-99 7-13-99
DISSOLVED OXYGEN (D.O.), IN MILLIGRAMS PER LITER
10u
5C/3& 10
UJ 15
|20" 25
I 30
Q 35
40
A<)
:'""'
D.O.
h, , , , 1 , , , , 1 , ,
_;
-j
-j
4
-:
20 0 10 20
10 30 0 10 20
WATER TEMPERATURE (W.T.), IN DEGREES CELSIUS
PH, IN STANDARD UNITS
u
5
10
15
20
25
30
35
40 A<;
: ' ! '
r S.C. \'-
j-
\''-
~"T i
1-
\ I1
1 ;
pH -j-=
4-!-I4-j-:
10
30
10u
5
10
15
20
25
30
35
40
/is
1
-
-
-
-
-
-
-
- i
1 ;
\ i4 \-i j4i
400 500 600 400 500 600 SPECIFIC CONDUCTANCE (S.C.), IN MICROSIEMENS PER CENTIMETER AT 25 DEGREES CELSIUS
64

423329088323300 GENEVA LAKE AT WEST END NEAR WILLIAMS BAY, WI--CONTINUED
WATER-QUALITY DATA, AUGUST 17 TO SEPTEMBER 15, 1999 (Milligrams per liter unless otherwise indicated)
Aug-17 Sep-15
Lake stage (ft)Sscchi-depth (m)"ilorophyll a, phytoplankton (ng/L)"~=pth of sample (m)'*'ater tenraerature (°C).Toecific conductance (nS/cm)T.H (units)I :.ssolved oxygen (mg/L)"losphorus, total (as P)""losphorus, ortho, dissolved (as P)Kitrogen, NO2 + NO3, diss. (as N)Kitrogen, ammonia, dissolved (as N)Kitrogen, amm. + org., total (as N)Kitrogen, total (as N)
0.523.44938.38.7
0.0090.002<0.0100.0030.49___
10.023.24948.38.3
0.011<0.002<0.0100.0020.47___
2.:4.2.:
17.010.85128.17.4
0.007<0.0020.0780.0210.450.53
25 62433.07.65147.74.4
0.0090.0040.3190.0020.350.67
38.07.35177.51.6
0.0320.0230.3570.0740.510.87
42.57.25207.50.8
0.0570.0440.1430.2770.891.00
0.520.04908.18.2
0.0080.002<0.0100.0090.62___
12.019.94918.18.0
0.0080.0020.010.0060.540.55
2.4.1.
25.09.14907.75.3
0.008<0.0020.2040.0040.520.72
14.64534.07.64927.51.8
0.006<0.0020.3050.0030.490.80
39.07.24987.40.1
0.0590.0460.120.2560.730.85
42.57.24987.40.1
0.0850.072<0.0100.380.94___
8-17-99 9-15-99
DISSOLVED OXYGEN (D.O.), IN MILLIGRAMS PER LITER
0
5 or> & 10WW 15 ^ 20Z<i 25£ 30w Q 35
40
45
10 20 10 20u
5
10
15
20
25
30
35
40
.11 | i i i i .
4-D.O. -J" S '*""" ^ c: / "i- j/ -j" < ' W.T. 1r --
-E
10 20 30 0 10 20 WATER TEMPERATURE (W.T.), IN DEGREES CELSIUS
30
PH, IN STANDARD UNITS
10
PH S.C.
10
400 500 600 400 500 600 SPECIFIC CONDUCTANCE (S.C.), IN MICROSIEMENS PER CENTIMETER AT 25 DEGREES CELSIUS
65

°'°25
0.020
a J
0.015
3 <K a:2 2 o.oio
^ 5 o.oos£o
0
15
1997 1998 1999
O P as
£* 10
1997 1998 1999
13I''
w
§6
1997 1998 1999
100
90
70
60
50
Eutrophic
Mesotrophic
= 40
30
20
EXPLANATION
B Total Plwspliorus
-0- Cliloroph>lla
« Secchi
I I I I 1 I 1 L
1997 1999
YEAR
Surface total phosphorus, chlorophyll a concentrations, Secchi depths, and TSI data for Geneva Lake, West End, near Williams Bay, Wisconsin.
(Circles on the first three plots indicate laboratory detection limit for selected analyses. Actual concentrations for these particular analyses are less than the plotted circles.)
66

434928088553601 GREEN LAKE AT COUNTY TRUNK HIGHWAY A NEAR GREEN LAKE, WI
LOCATION.--Lat 43°49'28", long 88°55'36" in NE 1/4 SE 1/4 SE 1/4 sec.27, T.16 N., R.13 E., Green Lake County, Hydrologic Unit 04030201, on left bank at downstream side of County Trunk Highway A, 2.3 mi southeast of Green Lake.
DRAINAGE AREA.--103 mi2 .
PERIOD OF RECORD.-October 1993 to current year.
GAGE.-Water-stage recorder. Datum of gage is 790.00 ft above sea level.
REMARKS.-Estimated daily gage heights: Apr. 3-6. Records good except those for estimated daily gage heights, which are fair. Lake level regulated by dam at outlet at Green Lake. Gage-height telemeter at station.
EXTREMES FOR PERIOD OF RECORD.-Maximum recorded gage height, 7.03 ft, June 20, 1996; minimum recorded, 5.41 ft, Jan. 17, 1995.
EXTREMES FOR CURRENT YEAR.-Maximum recorded gage height, 7.00 ft, July 21, 22, and 23; minimum recorded, 5.79 ft, Oct. 5 and Nov. 10.
GAGE HEIGHT, FEET, WATER YEAR OCTOBER 1998 TO SEPTEMBER 1999
DAILY MEAN VALUES
DAY OCT NOV DEC APR JUN AUG
12345
6789
10
1112131415
1617181920
2122232425
262728293031
MEANMAXMIN
5.905.885.835.815.82
5.905.915.905.895.89
5.895.895.875.835.82
5.835.855.925.885.85
5.825.825.825.815.81
5.815.845.875.865.895.89
5.865.925.81
5.885.855.835.835.82
5.825.815.815.826.00
6.045.965.965.975.96
5.996.006.016.076.02
6.016.016.036.006.01
6.016.006.016.036.06---
5.956.075.81
6.056.046.056.056.06
6.076.066.066.066.06
6.056.046.046.056.05
6.046.036.036.036.02
6.056.046.016.005.98
5.975.975.965.975.965.96
6.036.075.96
5.945.945.995.985.97
5.975.965.965.965.96
5.975.986.006.006.00
6.016.026.066.066.06
6.066.106.146.186.19
6.196.196.196.196.196.19
6.056.195.94
6.196.206.206.206.19
6.196.196.196.206.20
6.246.316.326.336.34
6.366.366.366.366.35
6.346.336.336.336.34
6.346.376.38______
6.296.386.19
6.376.386.386.376.38
6.376.366.366.386.37
6.376.366.366.366.35
6.366.386.366.366.37
6.376.366.376.366.36
6.366.366.376.376.366.37
6.376.386.35
6.376.386.456.556.65
6.686.636.626.686.68
6.736.776.756.736.71
6.696.676.656.646.62
6.606.626.686.686.67
6.666.646.626.616.60---
6.636.776.37
6.586.566.546.516.52
6.576.616.616.596.56
6.556.546.526.526.51
6.526.636.686.676.66
6.656.656.676.686.65
6.626.626.616.596.556.55
6.596.686.51
6.546.646.666.646.65
6.656.666.626.606.59
6.586.586.576.566.52
6.496.486.466.436.42
6.416.406.426.436.43
6.426.426.436.456.44---
6.526.666.40
6.516.536.566.606.61
6.636.616.586.686.64
6.626.616.586.586.56
6.566.616.626.686.67
6.956.996.996.986.93
6.956.916.866.816.766.75
6.716.996.51
6.696.646.606.606.58
6.556.546.516.486.50
6.496.476.476.446.43
6.436.426.406.426.43
6.436.436.436.436.43
6.436.446.446.426.386.37
6.476.696.37
6.366.356.356.356.33
6.326.306.306.286.25
6.226.226.226.206.18
6.166.156.146.136.13
6.116.106.096.086.06
6.066.076.086.106.11
6.196.366.06
67

05427235 LAKE KOSHKONONG NEAR NEWVILLE, WI
LOCATION.-Lat 42°51'27", long 88°56'27", in NW 1/4 NE 1/4 sec.34, T.5 N., R.I3 E., Jefferson County, Hydrologic Unit 07090001, 80 ft east of Pottawatomi Trail Bridge at Bingham Point Estates, and 4.5 mi northeast of Newville.
DRAINAGE AREA.--2,560 mi2, at lake outlet. Area of Lake Koshkonong, 16.3 mi2 .
PERIOD OF RECORD.--July 1987 to current year.
GAGE. Water-stage recorder. Datum of gage is 770.00 ft above sea level.
REMARKS.-No estimated daily gage heights. Records good except those for July 14 to Aug. 3, which are fair. Lake level regulated by dam at Indianford. Gage-height telemeter at station.
EXTREMES FOR PERIOD OF RECORD.-Maximum recorded gage height, 12.23 ft, Apr. 25, 1993; minimum recorded, 5.40 ft, Dec. 26, 27, 1989.
EXTREMES FOR CURRENT YEAR.-Maximum recorded gage height, 9.73 ft, Apr. 28; minimum recorded, 5.48 ft, Jan. 5.
GAGE HEIGHT, FEET, WATER YEAR OCTOBER 1998 TO SEPTEMBER 1999
DAILY MEAN VALUES
DAY OCT NOV DEC FEE MAR SEP
12345
6789
10
1112131415
1617181920
2122232425
262728293031
MEANMAXMIN
6.286.256.276.276.37
6.456.466.466.456.45
6.436.436.416.356.31
6.286.326.466.476.48
6.476.426.396.346.30
6.256.216.186.126.096.04
6.346.486.04
5.995.935.865.845.80
5.775.745.725.695.80
5.976.016.126.276.36
6.446.496.506.596.60
6.556.536.556.496.46
6.436.396.366.316.33---
6.206.605.69
6.286.286.286.266.24
6.256.246.226.206.20
6.166.146.116.086.07
6.056.035.975.985.95
5.945.875.835.795.76
5.725.685.635.605.565.54
6.006.285.54
5.525.525.535.515.49
5.525.555.615.655.69
5.755.785.825.855.86
5.865.875.895.855.81
5.785.805.865.976.10
6.226.366.496.626.756.85
5.896.855.49
6.937.027.117.207.29
7.357.397.427.437.45
7.507.597.667.717 .77
7.817.857.847.837.78
7.717.647.587.517.46
7.397.337.29______-
7.497.856.93
7.247.197.157.107.06
7.056.976.906.856.77
6.716.666.626.576.53
6.516.566.556.506.48
6.526.486.486.486.45
6.436.416.396.406.376.32
6.677.246.32
6.306.286.296.396.39
6.586.686.806.967.14
7.357.547.707.827.90
7.987.987.977.967.93
7.937.978.348.689.06
9.369.549.679.699.67---
7.809.696.28
9.619.549.449.339.22
9.169.079.018.918.79
8.678.568.438.318.19
8.098.318.538.718.84
8.928.988.978.938.86
8.778.698.608.498.368.24
8.799.618.09
8.138.107.997.897.80
7.737.717.687.647.59
7.557.547.647.868.05
8.248.368.398.388.33
8.268.178.088.037.90
7.767.627.507.367.23
7.888.397.23
7.167.076.996.956.88
6.836.726.606.556.45
6.396.346.296.276.24
6.226.326.396.406.45
6.506.526.716.857.02
7.117.277.377.497.597.72
6.767.726.22
7.807.847.867.897.90
7.907.907.917.877.89
7.857.817.797.727.64
7.567.517.437.377.28
7.167.046.946.886.79
6.716.656.596.516.416.35
7.387.916.35
6.306.246.186.116.05
5.975.895.946.006.03
6.076.136.186.226.23
6.216.176.136.126.12
6.076.056.096.106.11
6.126.266.386.416.39
6.146.415.89
68

455446089370300 LITTLE ARBOR VITAE LAKE NEAR WOODRUFF, WI
LOCATION.-Lat 45°54'46" long 89°37'03", in SW 1/4 SE 1/4 sec.28, T.40 N., R.7 E., Vilas County, Hydrologic Unit 07070001,4 mi north east of Woodruff.
PERIOD OF RECORD.-February 1991 to current year.
GAGE.-Staff gage read by Glyn A. Roberts.
EXTREMES FOR PERIOD OF RECORD.-Maximum gage height observed, 8.02 ft, May 7, 1999; minimum observed, 7.72 ft, Feb. 28, June 12, 1991, Oct. 13, 1994, Sept.. 1-30, and Oct. 4, 1998.
EXTREMES FOR CURRENT YEAR.-Maximum gage height observed, 8.02 ft, May 7; minimum observed, 7.72 ft, Oct. 4.
GAGE HEIGHT, FEET, WATER YEAR OCTOBER 1998 TO SEPTEMBER 1999
DAILY MEAN VALUES
DAY OCT NOV DEC JAN FEE MAR APR MAY JUN JUL AUG SEP
1 7.78 7.82 --- --- -2 _-- --- 7.863 ___ ___ ___ 7.84 7.784 7.72 --- 7.88 ---5 7.82 --- 7.84 --- -
7.88 7.80 - 7.84 7.82 --- 8.02 7.86 -
7.78
7.80 7.84 7.90 7.80
7.90 7.80 --- ___ 7.84 7.84 7.80 --- -
7.94 7.82 --- --- 7.76
--- 7.80 7.86 7.80 ___ 7.88 --- 7.82 --- ---___ 7.80 --- ---
7.82 --- 7.86 7.82 --- ---7.76
7.80 7.86 --- 7.80 7.80 ---
7.80 --- 7.88 7.78 ---7.82 ---
7.82 --- --- 7.80 7.82 7.90 --- 7.74 -- 7.82 --- --- --- --- 7.80 ---
67
910
1112131415
1617181920
2122232425
262728293031
---
___7.74
___
___
7.76
_________
7.78---
_________
7.76
___7.82_________
7.88
7.80 7.82--- --- ---
7.767.78 7.82
___ ___ ______ ___ ______ ___ ___
7.80 --- ---
7.84 7.80 ___ ___ ______ ___ ___
7.82
___ ___ ___7.84
___ ___ ___7.80
7.82
___ ___ ___ 7.86___ ___ ______ ___ ___
7.80 7.82 7.88
69

432255088134700 LITTLE CEDAR LAKE, NORTH SITE, NEAR WEST BEND, WI
LOCATION.-Lat 43°22'55", long 88°13'47", in NW 1/4 NE 1/4 sec.33, T.ll N., R.19 E., Washington County, Hydrologic Unit 04040003, 2.6mi southwest of West Bend.
PERIOD OF RECORD.-February 1997 to current year. REMARKS.-Lake sampled at center of northern basin at deep hole. Lake ice-covered during February sampling. Water-quality analyses done
by Wisconsin State Laboratory of Hygiene.
WATER-QUALITY DATA, FEBRUARY 10 TO AUGUST 18, 1998 (Milligrams per liter unless otherwise indicated)
Feb-10 Apr-29 Jun-17 Jul-22 Aug-18
Lake stage (ft)Secchi-depth (m)Chloroohvll a, phvtoplankton (uct/L)Depth of sample (m)Water temperature (°C)Specific conductance (US/cm)pH (units)Dissolved oxygen (mg/L)Phosphorus, total (as P)Phosphorus, ortho, dissolved (as P)Nitrogen, N02 + N03, diss. (as N)Nitrogen, ammonia, dissolved (as N)Nitrogen, amm. + org., total (as N)
8.
-.0.53.05077.815.30.011____________
19
-_7.03.65517.79.0
0.046____________
8. 2.7.
0.510.95018.412.40.024____________
48.071
7.57.95107.88.0
0.023____________
8.4.1.
0.521.14828.07.6
0.014____________
70 .349
7.513.65197.40.5
0.101____________
9.: 2.3.
0.525.64508.48.6
0.0160.004<0.0100.0080.6
23 787
8.014.15217.30.0
0.105____________
0.522.54718.69.3
0.040---_________
8.25 1.143.06.017.25347.20.0
0.194---
---
7.515.35517.20.0
0.361---______---
2-10-99 4-29-99 6-17-99 7-22-99 8-18-99
DISSOLVED OXYGEN (D.O.), IN MILLIGRAMS PER LITER
0 5 10 15 20 0 5 10 15 20 05 10 15 20 05 10 15 20 05 10 15 20
Z 4
1
0 0
0 10 20 30 0 10 20 30 0 10 20 30 0 10 20 30 0 10 20 30
WATER TEMPERATURE (W.T.), IN DEGREES CELSIUS
PH, IN STANDARD UNITS
6 7u
onBi -,pa 2
Z 4
I
g
8
1
- PH
-
-
1 '
s.c.-
_
\
\
9 10 670
10 7 8 9 10 670
10
400 450 500 550 600 400 450 500 550 600 400 450 500 550 600 400 450 500 550 600 400 450 500 550 600
SPECIFIC CONDUCTANCE (S.C.), IN MICROSIEMENS PER CENTIMETER AT 25 DEGREES CELSIUS
70

INCENTRATION,
'ER LITERi O C
' P c
1 K u
V) S3 <g | 0.02
^ § 0.01
H
H o
1 1 1 1 1 1 1 1 1 1 1 [ 1 1 1 1 1 1 1 1 [ 1 1 1 1 1 1 1 1 1 1 1 1 1
j
E
\ :
j
JFMAMJ JASONDJFMAMJ JASONDJFMAMJ JASOND1997 1998 1999
50
§P <£II 40
20
O5
JFMAMJ JASONDJFMAMJ JASONDJFMAMJ JASOND 1997 1998 1999
uu
S 4
§ 6
10
100
90
80
70
60
50
40
30
20
10
JFMAMJ JASOND 1997
JFMAMJ JASOND 1998
J FMAMJ J ASOND 1999
EXPLANATION
-B- Total Phosphorus
-© Chlorophyll a
-* Secclii
Eutrophic
Oligotrophic
JFMAMJ JASONDJFMAMJ JASONDJFMAMJ JASOND 1997 1998 1999
YEARSurface total phosphorus, chlorophyll a concentrations, Secchi depths,
and TSI data for Little Cedar Lake, North Site, near West Bend, Wisconsin.
71

432249088134500 LITTLE CEDAR LAKE, SOUTH SITE, NEAR WEST BEND, WI
LOCATION.-Lat 43°22'49", long 88°13'45", in NW 1/4 SE 1/4 sec.33, T.ll N., R.19 E., Washington County, Hydrologic Unit 04040003, 2.8 mi southwest of West Bend.
PERIOD OF RECORD.-February 1997 to current year.REMARKS.--Lake sampled in southern basin at deep hole. Lake ice-covered during February sampling. Water-quality analyses done by Wis
consin State Laboratory of Hygiene.
WATER-QUALITY DATA, FEBRUARY 10 TO AUGUST 18, 1999 (Milligrams per liter unless otherwise indicated)
Lake stage (ft)Secchi-depth (m)Chlorophyll a, phytoplankton (ng/L)Depth of sample (m)Water temnerature (°C)Specific conductance (uS/cm)pH (units)Dissolved oxygen (mg/L)Phosphorus, total (as P)Phosphorus, ortho, dissolved (as P)Nitrogen, N02 + N03, diss. (as N)Nitrogen, ammonia, dissolved (as N)Nitrogen, amm. + org., total (as N)Nitrogen, total (as N)Color (Pt-Co. scale)Turbidity (NTU)Hardness, (as CaC03 )Calcium, dissolved (Ca)Magnesium, dissolved (Mg)Sodium, dissolved (Na)Potassium, dissolved (K)Alkalinity, (as CaC03 )Sulfate, dissolved (S04 )Chloride, dissolved (Cl)Silica, dissolved (Si02 )Solids, dissolved, at 180°CIron, dissolved (Fe) ng/LManganese, dissolved (Mn) uq/L
Feb-10
8_-
0.52.44357.915.20.009___________________________________________________
.19_---
15.53.65277.67.8
0.125___________________________________________________
Apr-29
8.44.
0.510.84988.211.80.0170.0030.0710.0730.670.74106.62103431181.718520410.3286
48.571
16.08.35048.09.0
0.038___________________________________________________
Jun-17
8.704.11.82
0.5 17.021.9 8.5464 5148.2 7.49.2 0.6
0.011 0.168___ ______ ______ ______ ______ ______ _-____ ______ ______ _--___ ______ -_-___ _--___ ______ ______ ___--- ---___ -_-
Jul-22
9.41.
0.525.54528.28.5
0.0100.0050.012<0.0130.520.53___---___---__________________---___
23.192
17.08.65107.50.0
0.251__________________---------__________________---
0.522.74688.28.7
0.019_______________---------------
____________------
Aug-18
8.251.69.008.014.05087.40.0
0.026___
______
---------------___---___---______---
16.08.85327.40.0
0.249______---______------------------------------------
9.4
2-10-99 4-29-99 6-17-99 7-22-99 8-18-99
, 10
fc 12
Q 14
16
18
10 15 20
W.T.
D.O.
10 20 30
DISSOLVED OXYGEN (D.O.), IN MILLIGRAMS PER LITER10 15 20
u
2
4
6
10
14
161Q
-
-
-
I'i i i i ill
-
-
-
-
-
-
i 1 i i , .
10 20 30
0 10 15 20
10 20 30
(0
2
4
10
12
14
16
(
) 5 10 15 2i i i , | i i , i | i , , i | i J i r
j -
' J - /; "
1 --
-
) 10 20 3
WATER TEMPERATURE (W.T.), IN DEGREES CELSIUS
10 15 20u
2
4
6
8
10
12
14
1619
-
)
-^/ s-----
10 20 30
OS 4 W
" 10
fc 12Q 14
16
18400
10
450 500 550
u
2
4
6
8
10
12
14
16IB
1
-
-
_
pH~
-
,-
-
i
1
S.C."-
_
~
-
-
-
-
i
10
PH, IN STANDARD UNITS 6 7 8 9 10
400 450 500 550 400 450 500 550
10u
2
4
6
10
12
14
161 0lo
41
-
-
-
-
-
-
1
30 450
:{
\
\
500 55 400
10
450 500 550
SPECIFIC CONDUCTANCE (S.C.), IN MICROSIEMENS PER CENTIMETER AT 25 DEGREES CELSIUS
72

z a04oH
2 1 0.03u4 ^J
Z Wo & U to
0.02
o 5s 5 o.oi o- z
JFMAMJ JASONDJFMAMJ JASONDJFMAMJ JASOND 1997 1998 1999
40
£530
§1
§5 u | 20^ erf
C erf£y10
».. * *
JFMAMJ JASONDJFMAMJ JASONDJFMAMJ JASOND 1997 1998 1999
I5 4
3 6
§10 ' ' LJFMAMJ JASOND
1997JFMAMJ JASOND
1998JFMAMJ JASOND
1999
EXPLANATION
f Total Pliosplwrus
-©- Clllorophyll a
« Secchi
Eutrophic
Mesotrophic
Oligotrophic
JFMAMJ JASONDJFMAMJ JASONDJFMAMJ JASOND 1997 1998 1999
YEARSurface total phosphorus, chlorophyll a concentrations, Secchi depths,
and TSI data for Little Cedar Lake, South Site, near West Bend, Wisconsin.
73

434412088590700 LITTLE GREEN LAKE, AT CENTER, NEAR MARKESAN, WI
LOCATION-Lat 43°44'12", long 88°59'07", in SW 1/4 SW 1/4 sec.29, T.15 N., R.13 E., Green Lake County, Hydrologic Unit 04030201, 2 mi north of Markesan.
PERIOD OF RECORD.-February 1991 to current year.REMARKS.-Lake sampled near center at the deep hole. Lake ice-covered during February sampling. Water-quality analyses done by Wisconsin
State Laboratory of Hygiene.
WATER-QUALITY DATA, FEBRUARY 23 TO JUNE 16, 1999 (Milligrams per liter unless otherwise indicated)
Apr-2 3 Aug-19
Lake s tage (ft)Secchi-depth (m)Chlorochvll a, ohytoolankton (uq/L)Depth o£ sample (m)Water temoerature (°CISpecific conductance (iiS/cm)pH (units)Dissolved oxyqen (mq/L)Phosphorus, total (as P)Phosphorus, ortho, dissolved (as P)Nitrogen, N02 + NOB, diss. (as N)Nitrogen, ammonia, dissolved (as N)Nitroqen, amm. + orq., total (as N)Nitroqen, total (as N)Color (Pt-Co. scale)Turbidity (NTU)Hardness, (as CaC0 3 )Calcium, dissolved (Ca)Maqnesium, dissolved (Mq)Sodium, dissolved (Na)Potassium, dissolved (K)Alkalinity, (as CaC0 3 )Sulfate, dissolved (S0 4 )Chloride, dissolved (CDSilica, dissolved (Si02 )Solids, dissolved, at 180°CIron, dissolved (Fe) uq/LManqanese, dissolved (Mn) uq/L
5 .
0 . 51 . 53207 . 319.40.026
_ _ _
___
80
7 . 54 . 44237 . 30 . 9
0.283
_ _ _
___
6 . 1 .9 .
0 . 510.93248 . 312 . 00.0450.003<0 . 010<0 . 013
1
07 164
7 . 510.63278 . 411 . 30.051
_ _ _
_ _ ____
6 . 1 .32
0 . 520.92849 . 18 . 1
0.081_ _ -_ _ -
__-
36 . 3
. 57 . 016 . 13268 .20 . 6
0.276_ - _
- _ ___-
6 . ' 0 .89
0 . 525.52839 . 19 . 6
0.2010.069<0 . 0100.029
2
14 3
. 87 . 518.03667 . 70 . 0
0.759
_ _ __ _ __._
0 .522.22718 . 96 . 8
0.411
_ _ __ _ _-__
6. 66 0 . 390 . 04 . 022 .22749 .06 .7
0.396
_ - -_ - ____
7 . 522.02739 . 05 . 6
0.402- _ _
_ _ _---
10 5 . 3 1402420 7 . 3 3 . 1 132 7 . 617 0 . 4 186 <10 1 .4
2-23-99 4-28-99 6-16-99 7-15-99 8-18-99
DISSOLVED OXYGEN (D.O.), IN MILLIGRAMS PER LITER0 5 10 15 20 0 5 10 15 20 05 10 15 20 05 10 15 20 05 10 15 20
0 10 20 30 0 10 20 30 0 10 20 30 0 10 20 30 0 10 20 30
WATER TEMPERATURE (W.T.), IN DEGREES CELSIUS
Z 4
af
10
S.C.
PH, IN STANDARD UNITS 6 7 8 9 10 9 10
200 300 400 500 200 300 400 500 200 300 400 500 200 300 400 500 200 300 400 500
SPECIFIC CONDUCTANCE (S.C.), IN MICROSIEMENS PER CENTIMETER AT 25 DEGREES CELSIUS
74

*yT l/.*O
oH 0.40<05
1 1 °' 35
1 g °-30o &<^ £2 0.25s<n n °-20M M
§5 d 0.15o s£ S o.ioH 0.05OH
0
L j
-i.
_ :
t * * i[ * * * ^r * ... - 1 1 1 1 1 1 1 1 M 1 1 1 1 1 I 1 1 1 1 1 1 1 1 1 1 1 1 1 1 1 1 1 1 1 I 1 1 1 1 1 1 1 1 1 i 1 1 1 1 1 1 1 1 1 1 1 1 1 1 1 1 1 1 1 1 1 1 1 1 II 1 1 1 1 1 1 1 1 1 1 1 1 1 1 1 1 1 1 1 1 1 1 1 1 1 1 |-
1991 1992 1993 1994 1995 1996 1997 1998 1999
O
Siev. r~
§!
,,,,,, ,,
1991 1992 1993 1994 1995 1996 1997 1998 1999
S 2 Z
l M 1 1 1 1 1 I 1 1
....... ......
1991 1992 1993 1994 1995 1996 1997 1998 1999
100
90
80 X§ 70Ztf 60<H 50
40
30
20
10
EXPLANATION
Total Phosphorus
Chlorophyll a
Secchi
Oligotrophic
1991 1992 1993 1994 1995
YEAR
1996 1997 1998 1999
Surface total phosphorus, chlorophyll a concentrations, Secchi depths, and TSI data for Little Green Lake near Markesan, Wisconsin.
75

425425088083500 LITTLE MUSKEGO LAKE AT MUSKEGO, WILOCATION.--Lat 42°54'25", long 88°08'35", in SE 1/4 NW 1/4 sec.9, T.5 N., R.20 E., Waukesha County, Hydrologic Unit 07120006, at
Muskego.DRAINAGE AREA.--11.6 mi2 . PERIOD OF RECORD.-October 1986 to current year. LAKE-STAGE GAGE.-Datum of gage is 693.40 ft above sea level. REMARKS.-Lake sampled at the deep hole about 1,000 ft north-northwest of dam at outlet. Lake ice-covered during February sampling. An
aeration system was operated from April to November for the years 1987-91. Water-quality analyses done by Wisconsin State Laboratoryof Hygiene. Prior to October 1987, published under station number 425450088083500.
WATER-QUALITY DATA, FEBRUARY 11 TO JUNE 08, 1999 (Milligrams per liter unless otherwise indicated)
Lake s tage (ft)Secchi-depth (m)Chlorophyll a, phvtoplankton (nq/L)Depth of sample (m)Water temoerature (°C)Specific conductance (nS/cm)pH (units)Dissolved oxygen (mg/L)Phosphorus, total (as P)Phosphorus, ortho, dissolved (as P)Nitrogen, N02 + N03, diss. (as N)Nitrogen, ammonia, dissolved (as N)Nitrogen, amm. + org., total (as N)Nitrogen, total (as N)Color (Pt-Co. scale)Turbidity (NTU)Hardness, (as CaC0 3 )Calcium, dissolved (Ca)Magnesium, dissolved (Mg)Sodium, dissolved (Na)Potassium, dissolved (K)Alkalinity, (as CaC0 3 )Sulfate, dissolved (S0 4 )Chloride, dissolved (CDSilica, dissolved (Si0 2 )Solids, dissolved, at 180°CIron, dissolved (Fe) (ig / LManganese, dissolved (Mn) ng/L
Feb-11
97.90
_ _ _0 . 53 . 77227 . 813 . 60.018_ _ _
_ _ _
_ _ __ _ _
_ _ _
_ _ _
__ _
_ _ _
_ _ _
20.02 . 88807 .48 . 0
0. 173
- _ _
- _ __ _ __ _ _
_ _ __ _ _
_ _ _
_ _ _- _ _
_ _ _
Apr-8
97.701 . 119 . 6
0 . 59 . 88048 .211. 30.028<0 . 0020.3790.0220.711 . 1102 . 62605133582 . 4197451200 . 04458
19 . 55 . 88158 . 09 . 6
0.031_ _ __ _ _
_ _ -
_ _ __ _ _
_ _ _
_ _ _
_ _ __ _ _
_ _ ____
Jun-8
98.903 . 14.68
0.5 20.08.8 8.8820 8207.6 7.60.5 0.5
0.017 0 . 140_ _ _ - - __ _ _ - - -_ _ __ _ __ _ _ _ _ __ _ __ _ _ _ _ __ _ _ _ _ -_ _ _ _ _ __ _ _ - - -_ _ _ _ _ __ _ _ - --_ _ -_ _ __ _ __ _ _-- - -- -
2-11-99
10 15 20
4-08-99
DISSOLVED OXYGEN (D.O.), IN MILLIGRAMS PER LITER
W.T.
D.O.
10 20 30
10 15 20
0 10 20 30
WATER TEMPERATURE (W.T.), IN DEGREES CELSIUS
PH, IN STANDARD UNITS
6-08-99
10 15 20
10 20 30
10u2
1 6
1 8
g 10
P« 14Q 16
18
20 6
-
-
,
- pH
-
* J
\
\ s.c.~
\ -
\ -\-
1 '
30 700 800 9C
10u
2
4
6
10
12
14
16
18Oft
' ' 1-
-
-
-
-
-
- ,1
i-
-
-
-
-
-
-
-
600 700 800 900
10
600 700 800 900
SPECIFIC CONDUCTANCE (S.C.), IN MICROSIEMENS PER CENTIMETER AT 25 DEGREES CELSIUS
76

425425088083500 LITTLE MUSKEGO LAKE AT MUSKEGO, WI
WATER-QUALITY DATA, JULY 06 TO AUGUST 05, 1999 (Milligrams per liter unless otherwise indicated)
Jul-6 Aug-5
Lake stage (ft)Secchi-depth (m)Chlorophyll a, phytoplanktonDepth of sample (m)Water temoerature (°C)Specific conductance (uS/cm)pH (units)Dissolved oxygen (mg/L)Phosphorus, total (as P)
98,0.13
0.526.96178.49.2
0.022
.80
.9.8
17.59.18237.50.4
0.129
0.526.16508.27.4
0.031
4.024.46578.13.6
0.027
98.601.18.007.015.37647.40.1
0.019
18.09.18017.40.0
0.233
20.09.08057.30.0
0.277
0
2
co 4
u 6
§ 10
| 12
H 14
18
20
7-06-99 8-05-99
DISSOLVED OXYGEN (D.O.), IN MILLIGRAMS PER LITER
10 15 20
10 20 30 WATER TEMPERATURE (W.T.), IN DEGREES CELCIUS
(0
2
4
6
10
12
14
16
18
20 (
) 5 10 15 2(
-^^J , -
V ''"' ~----
) 10 20 3
PH, IN STANDARD UNITS
10
600 700 800 900
10
600 700 800 900
SPECIFIC CONDUCTANCE (S.C.), IN MICROSIEMENS PER CENTIMETER AT 25 DEGREES CELCIUS
77

- U.10
0E o- 14lo,a -J
gg 0.10U c/j
S < 0.08as a:0 0£ J 0.06
§ | 0.04
< 0.02
H o
IIMMIIIII minimi iiiiiiiiiii iiiiiiiiiu iiniiiiiii IIIIIMMII iiiimini IIIIIIIIIM IIMIIIIIII IIHIIIIIII IIIIIIIIIH MIIIIIIIII IIMIIIIIII IIIIIHIIII~
u- -
i :- -_ ^
: ...*.. A »* ;/ * . . :A * * ** * *:". % ' X * ** V * - v *'
IIIIIIIIIII 1 1 1 1 1 1 i 1 1 1 1 1 1 1 1 1 1 1 I 1 1 1 1 1 1 1 1 1 1 1 1 1 1 1 1 1 1 1 1 I 1 1 1 1 IIIIIIIIIII IIIIIIIIIII 1 II 1 1 1 1 1 1 1 1 1 1 1 1 1 1 1 1 1 1 1 IIIIIIIIIII IIIIIIIIIII IIIIIIIIIII IIIIIIIIIII 1 1 1 1 1 1 1 1 1 LL
1986 1987 1988 1989 1990 1991 1992 1993 1994 1995 1996 1997 1998 1999
100
80
20 V
% *-*. >
pmuAI 1990 I
. l.. .*. ,...,1986 1987 1988 1989 1990 1991 1992 1993 1994 1995 1996 1997 1998 1999
Z 2I
Q 3
U U
Aw V
**TTrnrTTmirrmpinnm
1986 1987 1988 1989 1990 1991 1992 1993 1994 1995 1996 1997 1998 1999
100
90
80XQ 70 Zw 60
£ 5°u= 40sLi 30p-
20
EXPLANATION
-H Total Phosphorus
-6- Chlorophyll a
-* Secchi
1986 1987
Eutrophic
OligotrophicMesotrophic
1988 1989 1990 1991 1992 1993 1994 1995 1996 1997 1998 1999
YEAR
Surface total phosphorus, chlorophyll a concentrations, Secchi depths, and TSI data for Little Muskego Lake at Muskego, Wisconsin.
78

05390700 LITTLE ST. GERMAIN LAKE NEAR EAGLE RIVER, WI
LOCATION-Lat 45°53 1 55", long 89°27'10", in SW 1/4 SE 1/4 sec.35, T.40 N., R.8 E., Vilas County, Hydrologic Unit 07070001,9.6 mi west of Eagle River.
DRAINAGE AREA.--19.0 mi2 .
PERIOD OF RECORD.-October 1990 to current year.
GAGE.-Staff gage mounted on the dam wall at lake outlet. Datum of gage is 1,600 ft, above sea level.
REMARKS.-Lake level regulated by dam at outlet.
COOPERATION.-Gage readings furnished by Wisconsin Valley Improvement Company.
EXTREMES FOR PERIOD OF RECORD.-Maximum gage height observed, 14.00 ft, June 6,1997; minimum observed, 12.00 ft, Jan. 3 and Feb. 3, 1992.
EXTREMES FOR CURRENT YEAR.-Maximum gage height observed, 13.88, July 9; minimum observed, 12.02 ft, Feb. 9.
GAGE HEIGHT, FEET, WATER YEAR OCTOBER 1998 TO SEPTEMBER 1999.
12345
6789
10
1112131415
1617181920
2122232425
262728293031
MEANMAXMIN
OCT
13.0613.0413.0613.0613.04
13.0813.1013.1213.1213.14
13.1413.1613.1613.1613.18
13.1813.2013.2213.2613.24
13.2413.2213.2213.2013.18
13.1813.1413.1013.0813.0613.02
13.1413.2613.02
NOV
13.0012.9412.9412.9412.92
12.9012.88
12.98
12.86
12.94
12.84
12.82
12.80
12.70
DEC JAN
12.6212.26
12.58 12.2412.22
12.48 12.22
12.4012.18
12.30 12.14
DAILY MEAN VALUE
FEB MAR APR
12.20
12.14
12.10
12.14
12.10
12.12
12.30 12.14
12.10
12.10
12.02
12.18
12.28
12.4012.36
12.32
12.38
12.40
12.28 12.40
12.32 12.45
12.4812.46
12.34 12.4812.4612.46
12.4812.4812.4812.5012.5012.52
12.5212.5612.5812.6212.66
12.7412.7612.7612.8012.80
12.8012.8012.8012.8212.84
12.8612.8812.8612.8612.86
12.8812.9012.9012.8612.86
12.8612.8612.8612.8412.84
12.7912.9012.52
MAY
12.8412.8412.8212.8212.80
12.9812.9813.1613.3413.38
13.4013.4013.3813.3813.36
13.3613.4413.5613.5613.56
13.6813.7213.8213.8013.78
13.7013.7413.7413.7613.7413.72
13.4113.8212.80
JUN
13.7613.7613.7413.7213,72
13.8613.8213.8013.7813.78
13.7613.7813.7213.7213.70
13.6813.6613.6413.6213.62
13.6213.6013.6213.6213.60
13.6013.6013.6013.5813.56
13.6913.8613.56
JUL
13.5613.5613.5613.6413.64
13.7013.6813.6613.8813.84
13.8013.7813.7413.7213.70
13.6813.7013.7013.7013.68
13.7013.6813.7013.7013.68
13.7613.7613.7413.7613.7613.84
13.7113.8813.56
AUG
13.7813.7413.7213.7213.72
13.7213.7013.7013.6813.70
13.6813.6813.8013.8013.78
13.7613.7413.7013.7213.72
13.7213.7213.7213.7213.72
13.7213.7213.7013.6813.6613.64
13.7213.8013.64
SEP
13.6413.6213.6013.6013.62
13.6013.6013.6213.6013.58
13.6013.6213.6213.6013.60
13.6013.5813.5813.5813.62
13.6013.6013.6013.5813.58
13.5413.5613.5813.5813.56
13.6013.6413.54
05390700 DAILY MEAN WATER LEVEL VALUES
13
12
1990 1991
II I I I I I I I I I 11
1992 1993 1994 1995
I I I I M I I I I I I I I I
1996 1997
I I I I 11 I I I I I 11 I I
1998 1999
79

455545089262500 LITTLE ST. GERMAIN LAKE, NORTHEAST BAY, NEAR ST. GERMAIN, WI
LOCATION.-Lat 45°55'45", long 89°26'25", in SW 1/4 SE 1/4 sec.24, T.40 N., R.8 E., Vilas County, Hydrologic Unit 07070001, near St. Germain.
PERIOD OF RECORD.--April 1991 to August 1994, August 1996 to August 1997, March to October 1999.
REMARKS.-Lake sampled in northeast bay at a lake depth of about 4 m. Lake ice-covered during March sampling. Water-quality analyses by Wisconsin State Laboratory of Hygiene.
WATER-QUALITY DATA, MARCH 18 TO OCTOBER 06, 1999 (Milligrams per liter unless otherwise indicated)
Mar-18 May-13 Jun-15 Jul-22 Oct-06
Lake stage (ft)Secchi-depth (m)Chlorophyll a, phytoplankton (ng/L)Depth of sample (m)Water temoerature (°C)Specific conductance (nS/cm)pH (units)Dissolved oxygen (mg/L)Phosphorus, total (as P)Phosphorus, ortho, dissolved (as P)Nitrogen, N02 + N03, diss. (as N)Nitrogen, ammonia, dissolved (as N)Nitrogen, amm. + org., total (as N)Nitrogen, total (as N)
__----
0.50.3987.37.2
0.054____________---
_--
2.53.6936.70.8
0.034_______________
13.381.74.10.514.7747.49.5
0.030_______________
13.701.48.890.520.3757.27.6
0.029_______________
13.0.31
0.525.4799.312.50.0330.0030.1540.0621.11.3
688.1
3.023.6728.38.4
0.039_______-_______
13.1.15
0.510.67.979.010.20.060_______________
506.0
3.39.87.779.08.9
0.052_______________
0
g 2
i
3-18-99 5-13-99 6-15-99 7-22-99
DISSOLVED OXYGEN (D.O.), IN MILLIGRAMS PER LITER
10-06-99
0 5 10 15 20 25 05 10 15 20 25 05 10 15 20 25 05 10 15 20 25 05 10 15 20 25
D.OW.T._
0 10 20 30 0 10 20 30 0 10 20 30 0 10 20 30
WATER TEMPERATURE (W.T.), IN DEGREES CELSIUS
10 20 30
PH, IN STANDARD UNITS
6789 10 6789 10 6789 10 6789 10 6789 10u
IN METERS to
pj -5
Q
A
P
-
1 1 I
7s.c.
i i
-
-
, 1 1 1 1
0 25 50 75 100 125 0 25 50 75 100 125 0 25 50 75 100 125 0 25 50 75 100 125 0 25 50 75 100 125
SPECIFIC CONDUCTANCE (S.C.), IN MICROSIEMENS PER CENTIMETER AT 25 DEGREES CELSIUS
80

z ai °oH
£ w 0.08IsZ £5O & 0.06U &o
P <
2 2 o.04
§ 0.02
1991 1992 1993 1994 1995 1996 1997 1998 1999
40
20
10qs
1991 1992 1993 1994 1995 1996 1997 1998 1999
2S 2
§id , Q 3
1991 1992 1993 1994 1995 1996 1997 1998 1999
100
90
80
70
60
50
40
30
20
10
Eutrophic
Mesotrophic
EXPLANATION
Total Phosphorus
Clllorophyll a
Secchi
Oligotrophic
1991 1992 1993 1994 1995
YEAR
1996 1997 1998 1999
Surface total phosphorus, chlorophyll a concentrations, Secchi depths, and TSI data for Little St. Germain Lake, NE Bay, at St. Germain, Wisconsin.
81

455437089270800 LITTLE ST. GERMAIN LAKE, SOUTH BAY, NEAR ST. GERMAIN, WI
LOCATION.-Lat 45°54'37", long 89°27'08", in NW 1/4 NE 1/4 sec.35, T.40 N., R.8 E., Vilas County, Hydrologic Unit 07070001, 1.7 mi east of St. Germain.
PERIOD OF RECORD.-April 1991 to August 1994, August 1996 to August 1997, March to October 1999.
REMARKS.-Lake sampled in south bay at a lake depth of about 7 m. Lake ice-covered during March sampling. Water-quality analyses by Wisconsin State Laboratory of Hygiene.
WATER-QUALITY DATA, MARCH 18 TO OCTOBER 06, 1999 (Milligrams per liter unless otherwise indicated)
Mar-18 May-13 Jun-15 Jul-22 Oct-06
Lake stage (ft) 13.38 13.70Secchi-depth (m) --- 2.1 2.5Chlorophyll a, phytoplankton (uq/L) 4.99 9.30
13.68 13.502.4 2.87.26 5.00
Depth of sample (m) 0.5 5.5 0.5 0.5 0.5 5.5 0.5 5.8Water temoerature (°C) 0.4 5.0 14.5 20.0 25.7 19.2 11.1 10.5Specific conductance (nS/cm) 99 149 77 73 71 72 79 78pH (units) 6.6 6.9 7.9 8.0 £ .7 6.7 8.1 8.0Dissolved oxygen (mg/L) 1.8 0.5 10.4 8.8 9.7 5.5 10.5 9.8Phosphorus, total (as P) 0.029 0.045 0.027 0.028 0.Phosphorus, ortho, dissolved (as P) - - - 0.Nitrogen, N02 + N03 , diss. (as N) --- --- --- --- 0Nitrogen, ammonia, dissolved (as N) --- - --- 0.Nitrogen, amm. + org., total (as N) --- - --- --- 0Nitrogen, total (as N) --- - 0
021 0.092 0.022 0.026002 029 012.57.60
3-18-99 5-13-99 6-15-99 7-22-99 10-06-99
DISSOLVED OXYGEN (D.O.), IN MILLIGRAMS PER LITER0 5 10 15 20 0 5 10 15 20 05 10 15 20 05 10 15 20 05 10 15 2(
l&Is 2S 3ZI" 4
ffl 5Q
6
%
-
-
, , , , 1 , , , , 1 , , , ,
u
1
2
3
4
5
6
-
-
/- /?-
, , , , 1 , , . , 1 , ,
U
1
2
3
4
5
6
W.T.~ D.O.
-.
~ / ''~ //
*
, , , , 1 , , , , 1 , , , L
U
1
2
3
4
5
6
\J~
, . . , 1 , L7 , , , 0 10 20 30 0 10 20 30 0 10 20 30 0 10
WATER TEMPERATURE (W.T.), IN DEGREES CELSIUS
PH, IN STANDARD UNITS6 7 8 9 10 ^6 7 8 9 10 _6 7 8 9 10 _6 7
c/- ' 06£2fflS 3Zx" 4
u3 5Q
6
7
S.C.- pH
-
- -
_ _
- \ " - ,:i i
u
1
2
3
4
5
6
7
-
-
-
/
/
~
1 i
u
1
2
3
4
5
6
7
1
~
-
J
- /
~ 1
J
1 1
u
1
2
3
4
5
6
7
-
..!,,,,
\j
2
3
4
5
6
T
i i i i 1 i i i i 1 i i i i 1 i i i i
-
-
- -
-
- -
, , , , | , , , , | , , . ,
20 30 0 10 20 3
8 9 10 67891
\AU
1
2
3
4
5
6
7
- N - ! ~
!- -
1Itil
^ -i i
50 100 150 50 100 150 50 100 150 50 100 150 50 100 150
SPECIFIC CONDUCTANCE (S.C.), IN MICROSIEMENS PER CENTIMETER AT 25 DEGREES CELSIUS
82

U co£5 s ^ <gg3
0.08
0.06
0.04
0.02
1991 1992 1993 1994 1995 1996 1997 1998 1999
40z"OP OH<e£^ 30
1991 1992 1993 1994 1995 1996 1997 1998 1999
S 2
a 3
1991 1992 1993 1994 1995 1996 1997 1998 1999
100
90
80
70
60
50
40
30
20
10
0
Eutrophic
EXPLANATION
Total Phosphorus
Chlorophyll a
Secchi
OligotrophicMesotrophic
11 i i i i i i i i i1991 1992 1993 1994 1995
YEAR
1996 1997 1998 1999
Surface total phosphorus, chlorophyll a concentrations, Secchi depths, and TSI data for Little St. Germain Lake, South Bay, at St. Germain, Wisconsin.
83

455428089282400 LITTLE ST. GERMAIN LAKE, WEST BAY, AT ST. GERMAIN, WI
LOCATION.-Lat 45°54'28", long 89°28'24", in SW 1/4 NE 1/4 sec.34, T.40 N., R.8 E., Vilas County, Hydrologic Unit 07070001, at St. Germain.
PERIOD OF RECORD.-April 1991 to August 1994, August 1996 to August 1997, March to October 1999.
REMARKS.-Lake sampled in west bay at a lake depth of about 18 m. Lake ice-covered during March sampling. Water-quality analyses by Wisconsin State Laboratory of Hygiene.
WATER-QUALITY DATA, MARCH 18 TO OCTOBER 06, 1999 (Milligrams per liter unless otherwise indicated)
Mar-18
Lake stage <ft)Secchi-depth (m)Chlorophyll a, phytoplankton (nq/L)Depth of sample (m)Water temoerature (°C)Specific conductance (nS/cm)pH (units)Dissolved oxygen (mg/L)Phosphorus, total (as P)
May-13 Jun-15 Jul-22 Oct-06
0.50.4877.112.80.013
___
13.03.6806.50.9
0.019
13.383.42.01
0.5 15.513.9 5.674 767.7 6.510.5 4.50.015 0.044
13.702.84.30
0.5 15.020.0 6.073 838.1 6.49.2 0.1
0.015 0.030
13.682.92.84
0.5 15.525.3 6.371 997.8 6.78.7 0.1
0.009 0.145
13.503.45.00
0.5 15.512.3 6.976 1257.4 7.08.5 0.10.014 0.322
s 5 8I 10g!2
14
16
3-18-99
10 15 20
5-13-99 6-15-99 7-22-99 10-06-99
10 20 30
DISSOLVED OXYGEN (D.O.), IN MILLIGRAMS PER LITER10 15 20 10 15 20
10 20 30 0 10 20 30 0 10 20
WATER TEMPERATURE (W.T.), IN DEGREES CELSIUS
30
10 15 20u
2
4
6
10
12
14
if.
i i 1 1 1 1 1
-
-
u
^/-
-
i i'i 1
,,,,,. 1 ,,.,
-
-
-
-
-
-
i i i 1 i i i i10 20 30
0005ewzsaQ
u
2
6
8
10
12
14
ifi
'. ' , '
/f f
/ ' s.c.1
" f :'" /
_ /
) P^-i i
10
50 100 150
10
50 100 150
PH, IN STANDARD UNITS 10
U
2
4
6
10
12
14
\f.
-
-
-
-
-
-
1 '-
'
/
1
-
-
i i50 100 150 0 50
10
100 150 0 50
SPECIFIC CONDUCTANCE (S.C.), IN MICROSIEMENS PER CENTIMETER AT 25 DEGREES CELSIUS
10
100 150
84

0.10
£ I 0.08 -
U OSz wO & 0.06 -U co co 2
9 2 0.04K H&5 ri |S
0.02
**
1991 1992 1993 1994 1995 1996 1997 1998 1999
zop*
IIi i A i
1991 1992 1993 1994 1995 1996 1997 1998 1999
52
§3
§
1991 1992 1993 1994 1995 1996 1997 1998 1999
100
90
80
70
60
50
40
30
20
10
0
EXPLANATION
Total Phosphorus
Chlorophyll a
Secchi
Eutrophic
Oligotrophic
1991 1992 1993 1994 1995
YEAR
1996 1997 1998 1999
Surface total phosphorus, chlorophyll a concentrations, Secchi depths, and TSI data for Little St. Germain Lake, West Bay, at St. Germain, Wisconsin.
85

04074651 LITTLE SAND LAKE NEAR MOLE LAKE, WI
LOCATION.-Lat45°28'26" long 88°54'41" (revised), in SW 1/4 NE 1/4 sec.31, T.35 N., R.13 E., Forest County, Hydrologic Unit 04030202, on left bank 1 mi upstream of outlet, 3 mi southeast of Mole Lake.
PERIOD OF RECORD.-May 1996 to current year.
GAGE.-Water-stage recorder. Datum of gage is 1,587.32 ft above sea level.
REMARKS.--Recorder removed during period of ice, Nov. 20,1998 to Apr. 28, 1999. Gage heights are obtained from reference point during this period.
EXTREMES FOR PERIOD OF RECORD.-Maximum gage height observed, 5.97 ft, May 25, 1997; minimum observed, 3.78 ft, Nov. 7-9, 1999.
EXTREMES FOR CURRENT YEAR.- Maximum gage height observed, 5.01 ft, July 23, 24, 26; minimum observed, 3.78 ft, Nov. 7-9.
GAGE HEIGHT, FEET, WATER YEAR OCTOBER 1998 TO SEPTEMBER 1999
DAILY MEAN VALUES
DAY OCT NOV DEC JAN FEE MAR APR MAY JUN JUL AUG SEP
1 3.88 3.81 4.13 4.25 4.63 4.87 4.622 3.87 3.80 4.11 4.21 4.61 4.86 4.613 3.86 3.80 --- --- 4.10 4.20 4.63 4.85 4.594 3.85 3.80 --- --- --- --- 4.10 4.21 4.63 4.81 4.565 3.84 3.80 --- --- --- 4.10 4.21 4.62 4.81 4.55
6 3.86 3.79 --- 4.15 4.39 4.60 4.79 4.537 3.86 3.78 --- 4.29 4.43 4.58 4.78 4.508 3.86 3.78 --- --- 4.32 4.46 4.64 4.76 4.459 3.85 3.78 --- --- 4.30 4.60 4.81 4.74 4.46
10 3.85 3.85 4.32 4.68 4.84 4.74 4.42
11 3.85 3.87 --- --- 4.30 4.69 4.84 4.73 4.4312 3.84 3.85 --- --- --- 4.29 4.71 4.83 4.73 4.4513 3.83 3.85 4.25 4.68 4.83 4.84 4.4214 3.82 3.84 4.27 4.23 4.67 4.84 4.83 4.4015 3.81 3.85 --- --- --- 4.21 4.68 4.82 4.83 4.39
16 3.81 3.85 --- --- 4.22 4.68 4.86 4.85 4.3917 3.82 3.85 --- 4.27 4.66 4.93 4.83 4.3918 3.87 3.87 --- 4.31 4.64 4.94 4.83 4.3619 3.85 3.92 4.25 4.62 4.95 4.82 4.3920 3.84 3.92 --- 4.26 4.62 4.96 4.80 4.41
21 3.83 --- --- 4.28 4.60 4.97 4.79 4.3722 3.82 --- 4.27 4.59 4.99 4.78 4.3523 3.81 4.31 4.61 5.01 4.77 4.3324 3.81 --- --- 4.32 4.63 5.01 4.74 4.3225 3.80 --- --- 4.31 4.59 4.96 4.73 4.31
26 3.80 --- 4.27 4.58 5.01 4.75 4.3127 3.80 --- --- --- 4.26 4.58 4.98 4.73 4.3328 3.79 --- 4.26 4.59 4.94 4.70 4.3429 3.79 --- --- 4.12 4.25 4.63 4.92 4.67 4.3230 3.80 --- --- --- 4.12 4.24 4.61 4.89 4.65 4.3131 3.80 --- 4.23 4.91 4.62
MEAN 3.83 --- --- --- 4.24 4.54 4.84 4.78 4.42MAX 3.88 4.32 4.71 5.01 4.87 4.62MIN 3.79 --- --- --- 4.10 4.20 4.58 4.62 4.31

05428000 LAKE MENDOTA AT MADISON, WI
LOCATION.--Lat 43°05'42", long 89°22'12", in SE 1/4 sec. 12, T.7 N., R.9 E., Dane County, Hydrologic Unit 07090001, in city boat house at dam at outlet, in Madison.
DRAINAGE AREA.--233 mi2 . Area of Lake Mendota, 15.2 mi2 .
PERIOD OF RECORD.-December 1902 to May 1903, January 1916 to current year (incomplete).
REVISED RECORDS.--WDR WI-73-1: Drainage area.
GAGE.-Water-stage recorder. Datum of gage is 840.00 ft above sea level, or 5.60 ft below City of Madison datum. Prior to Oct. 1, 1979, at datum 7.82 ft higher; prior to Nov. 15, 1971, nonrecording gage at same site.
REMARKS.-No estimated daily gage heights. Records are good. Lake level regulated by concrete dam with two 12-foot gates and 20-foot lock at outlet. Gage-height telemeter at station.
EXTREMES FOR PERIOD OF RECORD.-Maximum gage height observed, 12.20 ft, July 14-15, 1993; minimum observed, 8.02 ft, Feb. 24 to Mar. 10, 1920, current datum.
EXTREMES FOR CURRENT YEAR.-Maximum recorded gage height, 10.83 ft, May 18; minimum recorded, 9.10 ft, Mar. 2.
GAGE HEIGHT, FEET, WATER YEAR OCTOBER 1998 TO SEPTEMBER 1999
DAILY MEAN VALUES
DAY OCT NOV DEC JAN FEE MAR APR MAY JUN JUL AUG SEP
12345
6789
10
1112131415
1617181920
2122232425
262728293031
MEANMAXMIN
10.1410.1210.1410.1410.20
10.3110.3310.3010.2710.25
10.2210.2010.1610.1110.07
10.0410.0610.1410.1110.08
10.0410.009.979.949.91
9.899.889.889.849.829.78
10.0810.339.78
9.739.689.629.579.52
9.479.429.389.349.47
9.519.519.519.539.52
9.529.519.509.529.50
9.469.459.479.459.44
9.449.439.439.439.46
9.499.739.34
9.439.449.449.449.44
9.469.459.449.439.43
9.419.409.409.399.38
9.399.389.379.389.37
9.399.369.349.349.32
9.329.329.319.329.309.29
9.389.469.29
9.299.339.369.379.37
9.379.379.389.399.39
9.419.419.439.439.44
9.449.469.499.499.48
9.479.529.569.599.60
9.589.569.549.529.509.48
9.459.609.29
9.459.449.449.439.43
9.429.409.389.379.36
9.399.479.489.479.46
9.449.439.419.399.36
9.339.309.289.269.24
9.219.209.18
______
9.379.489.18
9.169.159.169.179.19
9.219.229.239.289.29
9.309.319.339.349.35
9.369.389.409.429.43
9.469.469.479.489.49
9.499.489.479.479.459.42
9.359.499.15
9.439.439.469.559.56
9.619.609.619.779.82
9.859.879.879.879.86
9.869.859.839.839.82
9.839.96
10.2710.4110.47
10.5010.5110.5410.5310.53 -
9.9310.549.43
10.5210.5110.4910.4810.48
10.5610.5910.6110.6010.59
10.5710.5610.5310.4810.43
10.4010.6210.6710.6410.60
10.5610-5510.5510.5410.50
10.4410.4110.3810.3510.3110.28
10.5110.6710.28
10.2610.3110.2810.2710.28
10.3010.3810.4010.4210.43
10.4510.4610.5110.5310.49
10.4810.4510.4410.4110.40
10.3810.3710.3910.4210.41
10.3810.3710.3810.3910.35
---
10.3910.5310.26
10.4110.4010.3910.4010.40
10.4110.3810.3410.3510.31
10.2810.2610.2310.1910.17
10.1610.2610.2810.2910.31
10.3810.3910.3810.3810.36
10.3910.3810.3610.3510.3310.38
10.3310.4110.16
10.3710.3310.3010.2910.26
10.2310.2310.2310.2010.22
10.2010.1910.2010.1610.13
10.1110.1110.0910.0910.08
10.0710.0510.0610.1210.11
10.1010.1010.0910.0610.0210.00
10.1510.3710.00
9.999.979.969.949.94
9.929.899.889.859.81
9.789.779.769.749.72
9.709.699.679.679.66
9.649.639.629.629.61
9.609.669.729.759.74
9.769.999.60
87

424621088335500 MIDDLE LAKE AT LAUDERDALE, WI
LOCATION.-Lat 42°46'21", long 88°33'55", in SE 1/4 SE 1/4 sec.26, T.4 N., R.16 E., Walworth County, Hydrologic Unit 07120006, at Lauderdale. PERIOD OF RECORD.-November 1993 to November 1994, and February to August 1999.REMARKS.-Lake sampled near east end of lake at lake depth of about 52 ft. Lake ice-covered during February sampling. Water-quality analyses
done by Wisconsin State Laboratory of Hygiene.
WATER-QUALITY DATA, FEBRUARY 19 TO AUGUST 11, 1999 (Milligrams per liter unless otherwise indicated)
Feb-19 Apr-14 Jun-15 Jul-14 Aug-11
Secchi-depth (m)Chlorophyll a, phytoplankton (ng/L)Depth of sample (m)Water temoerature (°C)Specific conductance (nS/cm)pH (units)Dissolved oxygen (mg/L)Phosphorus, total (as P)Phosphorus, ortho, dissolved (as P)Nitrogen, N02 + N03, diss. (as N)Nitrogen, ammonia, dissolved (as N)Nitrogen, amm. + org., total (as N)Nitrogen, total (as N)Color (Pt-Co. scale)Turbidity (NTU)Hardness, (as CaC03 )Calcium, dissolved (Ca)Magnesium, dissolved (Mg)Sodium, dissolved (Na)Potassium, dissolved (K)Alkalinity, (as CaC03 )Sulfate, dissolved (S04 )Chloride, dissolved (Cl)Silica, dissolved (Si02 )Solids, dissolved, at 180°CIron, dissolved (Fe) ng/LManganese, dissolved (Mn) ug/L
_-
0.55.04318.116.10.006___________________________________________________
__--
13.53.76187.69.1
0.008____________________________________
_________-__
S0.
0.511.05358.110.80.006<0.0021.110.2440.71.85
0.525047337.61.921735223.8298
1.8330
14.09.05398.19.9
0.009__________________
______________________________
14.
0.524.04468.38.9
0.010_________________________________
_______________
.913
14.09.54907.82.5
0.016___________________________________________________
24.
0.525.44658.08.4
0.010_______________
____________---____________---
.047
14.09.64837.60.0
0.022____________---__________________---------______---
0.525.24508.18.8
0.010____________------
____________------------___---
2.93.0011.011.44787.50.0
0.018_________
---
_________
___---
------
14.09.74937.50.0
0.020_________
---------------___
------------------
0.8
2-19-99 4-14-99 6-15-99 7-14-99 8-11-99
0
v 2 e*« 4 W S 6
0 10 15 20
10 20 30
DISSOLVED OXYGEN (D.O.), IN MILLIGRAMS PER LITER10 15 20
u
2
4
6
10
12
i /i
" "1 ";"
-
-
-
-
-
i i i i ii
i i i i | i i i i
-
-
-
-
-
. 1 i i . i
10 20 30 0
10 15 20
10 20 30 0
10 15 20
10 20 30
WATER TEMPERATURE (W.T.), IN DEGREES CELSIUS
10 15 20
10 20 30
wS 6
Ew 10o
12
14400
10
500 600 700
u
2
4
6
8
10
12
1/1
1 '
-
S.C.-
-
-
1
-
pH
-
-
-
-
400
10
500 600 700
PH, IN STANDARD UNITS 10 10 10
0
2
4
6
8
10
12
14 4(
-
-
-
- '
/
i /
)0 500
-
-
\'
-
-
600 7C
0
2
4
6
8
10
12
14 K) 4(
\
-
1X) 500
-
-
-
-
-
-
600 7C
u
2
4
6
8
10
12
14 )0 4(
-
-
flX) 500
-
-
-
-
-
i600 70
SPECIFIC CONDUCTANCE (S.C.), IN MICROSIEMENS PER CENTIMETER AT 25 DEGREES CELSIUS

0.05
j* S 0.04
O ^ 0.03 U en
a a 2 2 0.02
O 5sla o.oi
1993 1994 1995 1996 1997 1998 1999
10§"
HO!
B
v.§2 2J "*
1993 1994 1995 1996 1997 1998 1999
§ 4
S 6
W 8C^i O
10 "-1
-V.
1993 1994 1995 1996 1997 1998 1999
JUU
90
80
70
60
JU
30
20
10
0
i i i i i i i i i i i 1 i i i
EXPLANATION
Total Phosphoras
Q Clllorophyll a
X" Secchi
"" ^-J
-
-
-
1993
i i i i i i i i i i i i i i i i i i | i i i i i i i i i i i | i i i i i i i i i i i i i i i i i i i i i i i i i i i i i i i i i
-
Eutrophic
~
Mesotrophic
* V ^
B^^S jJ"^/
Oligotrophic-
1994 1995 1996 1997 1998 1999
YEAR
Surface total phosphorus, chlorophyll a concentrations, Secchi depths, and TSI data for Lauderdale Lake (Middle) near Lauderdale, Wisconsin.
89

430309088284800 MIDDLE GENESEE LAKE NEAR OCONOMOWOC, WI
LOCATION.-Lat 43°03'09", long 88°28'48", in NW 1/4 SW 1/4 sec.22, T.7 N., R.17 E., WaukeshaCounty, Hydrologic Unit 07090001,1.8 mi south of Oconomowoc.
PERIOD OF RECORD.-February 1996 to current year.REMARKS.-Lake sampled near center at the deep hole. Lake ice-covered during February sampling. Water-quality analyses done by Wiscon
sin State Laboratory of Hygiene.
WATER-QUALITY DATA, FEBRUARY 10 TO AUGUST 03, 1999 (Milligrams per liter unless otherwise indicated)
Feb-10 Apr-7 Jun-2 Jul-6 Aug-3
Lake stage (ft)Secchi-depth (m)Chlorophyll a, phytoplankton (ng/L)Depth of sample (m)Water temperature (°C)Specific conductance (nS/cm)pH (units)Dissolved oxygen (mg/L)Phosphorus, total (as P)Phosphorus, ortho, dissolved (as P)Nitrogen, N02 + NOB, diss. (as N)Nitrogen, ammonia, dissolved (as N)Nitrogen, amm. + org., total (as N)Nitrogen, total (as N)Color (Pt-Co. scale)Turbidity (NTU)Hardness, (as CaC03 )Calcium, dissolved (Ca)Magnesium, dissolved (Mg)Sodium, dissolved (Na)Potassium, dissolved (K)Alkalinity, (as CaC0 3 )Sulfate, dissolved (SO,,)Chloride, dissolved (CDSilica, dissolved (Si0 2 )Solids, dissolved, at 180°CIron, dissolved (Fe) ng/LManganese, dissolved (Mn) ng/L
865.-_--
0.54 . 53577.713.8
<0.005___________________________________________________
.46--11.04 .14507 .88.10.01___________________________________________________
86542.
0.59.24168.211.70.0130 . 0020.0230 .1410 . 840 . 86
50.61802926101.716417251.6228
.48.014
11.58.54158.310.90.016_________________-________-________________________
86651.
0.520 .24088.19 .0
0.008_______________________________-____________-______
.86.749
11.011.34327 .70 .5
0.011____________-___________________________________---
8673 .2 .
0.526.74158.28.0
0.007________________________________________________---
.02.707
11.512.74637.70.4
0.023______---_______________________________________---
8663,1.
0.527 .73998.38.5
0.015______---____________---_________---____________---
.91.315
11.013.14617. 50 .0
0.041______------_________---------------___---___------
2-10-99 4-07-99 6-02-99 7-06-99 8-03-99
DISSOLVED OXYGEN (D.O.), IN MILLIGRAMS PER LITER10 15 20
on l a:OJ
I 4
1 *UJQ io
1210 20 30
10 15 20u
2
4
6
10
1 T
1 1 1 1 | 1 1 ! J 1
~
-
-
-
,,,,!.,,
-
-
-
-
i 1 i i . i
0 10 15 20 10 15 20
10 20 30 0 10 20 30 0 10 20
WATER TEMPERATURE (W.T.), IN DEGREES CELSIUS
30
( 0
2
4
6
10
n
) 5 10 15 2
- )/ / ""
- / -10 20 30
W3 2.X.UJ
I 4
5 6
10
12350
PH, IN STANDARD UNITS
789 10 6789 10 6789 10 6789 10 6789 10
S.C.
pH
10
12400 450 500 350 400 450 500 ""350 400 450 500 "350 400 450 500 "350 400
SPECIFIC CONDUCTANCE (S.C.), IN MICROSIEMENS PER CENTIMETER AT 25 DEGREES CELSIUS
450 500
90

0.025
°-020
0.015B5 OS O O
O Sei I
0.010
0.005 oo
1996
* f*£yP 2
1996
1997 1998 1999
1997 19981 1 1 1 1 1
1999
u
1CO
1 3S 4
S 5
| 6
W oCO °
9
10
i i i i i i i i i i i i i i i i i i i i i i i i i i i i i i i i i i i i i i i i i i i i i i i --i
im :
** * * ^4
j
0 ]
- -.
1996 1997 1998 1999
100
90
80XQ 70gs 60I 50u£ 40
§ 30
20
10
Eutrophic
Mesotrophic
EXPLANATION
- - Total Phosphorus
-0- Chlorophyll a
-* Secchi
Oligotrophic
I I I I I 1 I I ! I t I I I I I I I I I I 1 I I I L
1996 1997 1998 1999
YEAR
Surface total phosphorus, chlorophyll a concentrations, Secchi depths, and TSI data for Middle Genesee Lake near Oconomowoc, Wisconsin.
(Circles on the first three plots indicate laboratory detection limit for selected analyses. Actual concentrations for these particular analyses are less than the plotted circles.)
91

05429000 LAKE MONONA AT MADISON, WI
LOCATION.-Lat 43°03'48", long 89°23'49', in SW 1/4 sec.23, T.7 N., R.9 E., Dane County, Hydrologic Unit 07090001, in Brittingham Park, in Madison.
DRAINAGE AREA.--279 mi2 . Area of Lake Monona, 5.3 mi2 .
PERIOD OF RECORD.-September 1915 to current year (fragmentary) in reports of the Geological Survey. For 1856 to March 1917 in reports of Wisconsin Railroad Commission, volume 19.
REVISED RECORDS.--WSP 1338: Lake area. WDRWI-73-1: Drainage area.
GAGE.-Water-stage recorder. Datum of gage is 840.00 ft above sea level, or 5.60 ft below City of Madison datum. Prior to Oct. 1, 1979, datum 3.61 ft higher; prior to Nov. 15, 1971, nonrecording gage at same site.
REMARKS.-No estimated daily gage heights. Records good. Lake level regulated by concrete dam with four 12-foot stop-log sections and 12-foot lock at outlet of Lake Waubesa. Gage-height telemeter at station.
EXTREMES FOR PERIOD OF RECORD.-Maximum gage height observed, 7.28 ft, June 19, 1996; minimum observed, 3.22 ft, Jan. 20, 1965, current datum.
EXTREMES FOR CURRENT YEAR.~Maximum recorded gage height, 5.99 ft, June 13, 14, July 25-27, and 31; minimum recorded, 3.79 ft, Mar. 26.
GAGE HEIGHT, FEET, WATER YEAR OCTOBER 1998 TO SEPTEMBER 1999
DAILY MEAN VALUES
DAY OCT NOV DEC JAN MAR APR JUL AUG SEP
12345
6789
10
1112131415
1617181920
2122232425
262728293031
MEANMAXMIN
4.934.904.904.894.97
5.065.065.115.145.17
5.195.205.195.195.20
5.205.265.335.315.28
5.255.235.215.195.18
5.165.185.205.205.185.19
5.155.334.89
5.205.205.185.155.14
5.125.125.125.145.33
5.355.285.205.135.07
5.024.964.924.844.79
4.754.724.674.644.60
4.564.534.514.494.48---
4.945.354.48
4.464.444.424.414.39
4.384.384.364.344.31
4.294.284.274.264.24
4.204.174.164.124.10
4.064.044.054.054.05
4.044.044.044.034.014.01
4.214.464.01
4.004.034.074.074.07
4.074.074.074.074.07
4.074.074.074.064.06
4.064.074.094.094.12
4.144.234.314.374.40
4.454.504.544.584.604.63
4.204.634.00
4.654.684.714.734.75
4.764.774.784.794.80
4.874.995.005.025.02
5.014.994.984.974.95
4.944.934.924.914.91
4.914.904.89______
4.885.024.65
4.884.854.744.664.61
4.544.474.434.404.34
4.304.254.214.184.14
4.114.054.013.993.96
3.913.883.863.833.81
3.803.853.893.923.964.02
4.194.883.80
4.074.104.204.314.38
4.434.484.574.865.00
5.035.055.085.125.14
5.135.125.125.135.14
5.185.375.825.925.89
5.835.785.735.645.55
5.075.924.07
5.475.415.355.315.26
5.275.275.215.155.11
5.095.115.105.105.14
5.215.625.735.785.80
5.815.795.765.705.65
5.625.595.575.565.565.55
5.445.815.09
5.565.625.615.605.58
5.605.645.655.685.72
5.835.865.955.975.95
5.935.905.905.895.86
5.845.835.895.905.87
5.855.835.825.825.79---
5.795-975.56
5.835.825.815.795.77
5.755.715.695.685.64
5.615.595.565.545.52
5.505.765.845.855.87
5.915.895.885.885.89
5.985.995.975.945.935.97
5.795.995.50
5.945.895.865.865.84
5.815.835.825.805.82
5.815.835.835.815.80
5.795.785.785.805.80
5.795.785.815.885.88
5.875.865.865.855.815.78
5.835.945.78
5.765.755.745.735.71
5.685.675.645.605.55
5.525.495.445.395.36
5.335.315.285.255.22
5.175.125.085.045.01
4.985.045.105.095.03---
5.375.764.98
92

425344088070100 BIG MUSKEGO LAKE, BASS BAY, NEAR MUSKEGO, WI
LOCATION.~Lat 42°53'44", long 88°07'01", in SW 1/4 NE 1/4 sec. 15, T.5 N., R.20 E., Waukesha County, Hydrologic Unit 07120006, 1.3 misoutheast of Muskego.
PERIOD OF RECORD.-February 1988 to current year. REMARKS. Lake sampled near center at the deep hole. Lake ice-covered during February sampling. Water-quality analyses done by Wisconsin
State Laboratory of Hygiene.
WATER-QUALITY DATA, FEBRUARY 11 TO JUNE 08, 1999 (Milligrams per liter unless otherwise indicated)
Lake stage (ft)Secchi-depth (m)Chlorophyll a, phytoplankton (ug/L)Depth of sample (m)Water temoerature (°C)Specific conductance (uS/cm)pH (units)Dissolved oxygen (mg/L)Phosphorus, total (as P)Phosphorus, ortho, dissolved (as P)Nitrogen, NO2 + NO3, diss. (as N)Nitrogen, ammonia, dissolved (as N)Nitrogen, amm. + org., total (as N)Nitrogen, total (as N)Color (Pt-Co. scale)Turbidity (NTU)Hardness, (as CaCO3 )Calcium, dissolved (Ca)Magnesium, dissolved (Mg)Sodium, dissolved (Na)Potassium, dissolved (K)Alkalinity, (as CaCO3 )Sulfate, dissolved (SO 4 )Chloride, dissolved (Cl)Silica, dissolved (SiO2 )Solids, dissolved, at 180°CIron, dissolved (Fe) ug/LManganese, dissolved (Mn) ug/L
Feb-11
11. 87______
0.5 7.04.7 3.6600 7157.7 7.512.8 9.60.034 0.060___ -_-_-_ ---___ ______ ______ ______ ______ ______ ______ ______ ______ ______ ______ ______ ______ ______ ______ ___
Apr-21
11.684.62.27
0.510.06718.010.70. 019<0.0020.5580. 0780. 861.4200.92605430262.81836561
0.31432
7.09.86718. 010. 00.013____________________________________-___________---
Jun-8
11.823.41.83
0.525.25838.68.7
0.013__________-____________________________------___---
7.014.96337.50.6
0.030--_-__---___------___----------__---___------------
2-11-99 4-21-99 6-08-99
0 5 10 15 20
COI 2
g 4
DISSOLVED OXYGEN (D.O.), IN MILLIGRAMS PER LITER0 5 10 15 20
D.O. _
10 20 30
1 1 1 1 1 1 1 1 1 1
-
-
3 10
1 1 1 1 1 1 >
-
-
20 3
0 5 10 15 20
0 10 20 30
Z. 4
9 10
WATER TEMPERATURE (W.T.), IN DEGREES CELSIUS
PH, IN STANDARD UNITS
10 6 7 8 9 10
450 550 650 750 450 550 650 750 450 550 650 750
SPECIFIC CONDUCTANCE (S.C.), IN MICROSIEMENS PER CENTIMETER AT 25 DEGREES CELSIUS
93

425344088070100 BIG MUSKEGO LAKE, BASS BAY, NEAR MUSKEGO, WI--CONTINUED
WATER-QUALITY DATA, JULY 06 TO AUGUST 04, 1999 (Milligrams per liter unless otherwise indicated)
Jul-6 Aug-4
Lake stage (ft) Secchi-depth (m) Chlorophyll a, phytoplankton Depth of sample (m) Water temoerature (°C) Specific conductance (nS/cm) pH (units)Dissolved oxygen (mg/L) Phosphorus, total (as P)
11. 1.26
0.527.55238.49.9
0.030
.69
.2.8
7.515.46457.30.4
0.150
0.527.75228.48.3
0.026
2.027.65238.28.4
0.028
11.48 1.017.04.024.85507.40.5
0.033
6.017.36427.00.2
0.037
7.015.86707.00.2
0.078
7-06-99 8-04-99
DISSOLVED OXYGEN (D.O.), IN MILLIGRAMS PER LITER
0 5 10 15 20 0 5 10 15 20 0
0 10 20 30
WATER TEMPERATURE (W.T.), IN DEGREES CELCIUS
0 10 20 30
PH, IN STANDARD UNITS
6 7 8 9 10 6 7 8 9 10
'- S.C. -
450 550 650 750 450 550 650 750
SPECIFIC CONDUCTANCE (S.C.), IN MICROSIEMENS PER CENTIMETER AT 25 DEGREES CELCIUS
94

- u.zuOH< ^g SZ £ 0.15
Z WU co
S < o.io
§ ? 0.05CL. Z, J "
<HoH
0
MUM I Mil MM.. HIM, II Ml! Mill IMIIIIMM III,..,,... I,,.. I,,,,, MUM III II II , , 1 1 II 1 I 1 | , I 1 1 , I I 1 I I I 1 I, II I I , M | I 1 I I I 1 I, 1 , II Mill MM
"
-
~
«
* '. - *. « \ .
' .- * \ ' % _ -
\ .|| II 1 1 1 1 1 1 1 1 1 1 1 1 1 1 1 1 1 1 1 I 1 1 1 1 1 1 1 | j 1 1 1 1 1 1 ( 1 1 1 1 II 1 1 1 1 1 t 1 t 1 1 1 1 1 1 1 1 1 1 1 1 1 1 1 I 1 1 I 1 1 1 1 1 t 1 1 1 1 t 1 1 1 1 1 t 1 1 1 I 1 1 1 1 1 I 1 1 1 1 1 1 1 1 1 1 1 1 1 1 1 t 1 | 1 1 1 I 1 1 1 1 1 1 1 I 1 1
1988 1989 1990 1991 1992 1993 1994 1995 1996 1997 1998 1999
200
150
1§ I"
u
50
lA1988 1989 1990 1991 1992 1993 1994 1995 1996 1997 1998 1999
u
CO 1sUQS 2Z
EC 3
Q24uuw
6
-- .v ..- *.- .. "' .-.-' . f \ . * -
-
. i :-
_ ;
:1988 1989 1990 1991 1992 1993 1994 1995 1996 1997 1998 1999
100
90
80
70
60
50
40
30
20
10
0
Eutrophic
EXPLANATION
B Total Phosphorus
-0 Chlorophyll a
* Secchi
Oligotrophic
1988 1989 1990 1991 1992 1993 1994
YEAR
1995 1996 1997 1998 1999
Surface total phosphorus, chlorophyll a concentrations, Secchi depths, and TSI data for Big Muskego Lake, Bass Bay, near Muskego, Wisconsin.
95

425109088075000 BIG MUSKEGO LAKE NEAR WIND LAKE, WI
LOCATION.-Lat 42°51'09", long 88°07'50", in SE 1/4 NE 1/4 sec.33, T.5 N., R.20 E., Waukesha County, Hydrologic Unit 07120006, on left bank 8 ft upstream of dam outlet of Muskego Lake, 700 ft north of Muskego Dam Drive, 2 mi northeast of Wind Lake.
DRAINAGE AREA.--28.3 mi2 .
PERIOD OF RECORD.-October 1987 to September 1989, January 1991 to current year.
GAGE. Water-stage recorder. Datum of gage is 760.00 ft above sea level. October to December 1987 and January 1991 to September 1995, nonrecording gage at the same datum. December 1987 through September 1989, data collected using water-stage recorder at the same datum.
REMARKS.-Estimated daily gage heights: Dec. 17-20, May 20-26, and June 4, 5. Lake levels regulated by concrete dam with one 5-ft lift gate. Prior to October 1993, published as Muskego Lake Outlet near Wind Lake, WI.
EXTREMES FOR PERIOD OF RECORD.-Maximum observed gage height, 12.60 ft, Oct. 7, 1991 and Aug. 8, 1994; minimum instanta neous, less than 8.72 ft, July 12, 1996 to Feb. 18, 1997, due to drawdown of lake.
EXTREMES FOR CURRENT YEAR.--Maximum observed gage-height, 12.49 ft, June 15; minimum observed, 11.01 ft, Sept. 26.
GAGE HEIGHT, FEET, WATER YEAR OCTOBER 1998 TO SEPTEMBER 1999
DAILY MEAN VALUES
DAY OCT NOV DEC JAN FEE MAR APR MAY JUN JUL AUG SEP
1 11.61 11.68 11.66 11.67 11.95 11.77 11.74 11.96 11.87 11.83 11.54 11.342 11.60 11.71 11.67 11.71 11.95 11.78 11.73 11.90 11.81 11.82 11.52 11.333 11.64 11.68 11.68 11.74 11.95 11.79 11.76 11.86 11.82 11.70 11.48 11.324 11.65 11.64 11.71 11.73 11.97 11.78 11.76 11.84 11.81 11.68 11.48 11.325 11.68 11.63 11.70 11.72 11.96 11.80 11.76 11.82 11.79 11.68 11.47 11.30
6 11.71 11.62 11.72 11.72 11.94 11.82 11.66 11.86 11.77 11.69 11.45 11.307 11.72 11.61 11.76 11.71 11.92 11.78 11.68 11.85 11.81 11.68 11.44 11.278 11.73 11.62 11.74 11.71 11.88 11.78 11.77 11.92 11.82 11.65 11.47 11.259 11.72 11.63 11.73 11.71 11.87 11.80 11.97 11.93 11.79 11.65 11.43 11.22
10 11.71 11.57 11.74 11.71 11.86 11.81 11.86 11.92 11.79 11.65 11.47 11.20
11 11.70 11.81 11.71 11.71 11.87 11.81 11.85 11.90 11.85 11.61 11.47 11.2112 11.69 11.88 11.72 11.71 11.95 11.81 11.81 12.00 11.92 11.59 11.46 11.1913 11.68 11.86 11.73 11.72 11.96 11.81 11.79 12.00 12.15 11.56 11.47 11.1914 11.68 11.84 11.72 11.71 11.94 11.81 11.76 11.94 12.40 11.52 11.47 11.1815 11.66 11.82 11.70 11.71 11.93 11.80 11.74 11.88 12.47 11.51 11.43 11.19
16 11.67 11.81 11.72 11.71 11.91 11.81 11.79 11.86 12.43 11.49 11.40 11.1917 11.69 11.78 11.72 11.72 11.88 11.78 11.68 11.91 12.35 11.58 11.41 11.1718 11.77 11.74 11.72 11.75 11.84 11.87 11.64 11.99 12.26 11.60 11.41 11.1619 11.81 11.67 11.71 11.74 11.81 11.88 11.63 12.03 12.18 11.61 11.45 11.1520 11.81 11.69 11.71 11.73 11.77 11.85 11.63 12.02 12.11 11.61 11.43 11.21
21 11.81 11.68 11.70 11.73 11.73 11.88 11.68 11.99 12.04 11.61 11.41 11.1922 11.77 11.63 11.70 11.85 11.69 11.84 11.82 11.96 11.98 11.61 11.40 11.1623 11.72 11.66 11.70 11.95 11.67 11.80 12.14 11.93 11.93 11.62 11.41 11.1624 11.68 11.69 11.69 12.00 11.69 11.83 12.18 11.90 11.90 11.61 11.45 11.1725 11.65 11.68 11.69 12.02 11.71 11.81 12.22 11.87 11.90 11.61 11.45 11.15
26 11.64 11.68 11.69 12.02 11.73 11.78 12.22 11.84 11.87 11.60 11.43 11.1027 11.64 11.68 11.68 12.02 11.75 11.76 12.21 11.80 11.86 11.60 11.41 11.1728 11.66 11.68 11.68 12.02 11.76 11.72 12.19 11.79 11.84 11.57 11.41 11.4529 11.65 11.65 11.68 12.01 11.74 12.09 11.77 11.84 11.54 11.42 11.5130 11.66 11.68 11.68 11.99 11.71 12.01 11.75 11.84 11.54 11.37 11.4931 11.67 --- 11.67 11.97 --- 11.66 11.73 11.54 11.35
MEAN 11.69 11.70 11.70 11.80 11.85 11.80 11.86 11.89 11.97 11.62 11.44 11.24MAX 11.81 11.88 11.76 12.02 11.97 11.88 12.22 12.03 12.47 11.83 11.54 11.51MIN 11.60 11.57 11.66 11.67 11.67 11.66 11.63 11.73 11.77 11.49 11.35 11.10
96

425212088072800 BIG MUSKEGO LAKE, SOUTH SITE, NEAR MUSKEGO, WI
LOCATION.--Lat 42°52'12", long 88°07'28", in NW 1/4 NW 1/4 sec.27, T.5 N., R.20 E., Waukesha County, Hydrologic Unit 07120006, nearMuskego.
DRAINAGE AREA.--33.9 mi2 . ^ERIOD OF RECORD.-February 1988 to current year. ^EMARKS.--Lake sampled at south end of lake at a depth of about 1 m. Lake ice-covered during February sampling. Water-quality analyses
done by Wisconsin State Laboratory of Hygiene.
WATER-QUALITY DATA, FEBRUARY 11 TO AUGUST 04, 1999(Milligrams per liter unless otherwise indicated)
Lake stage (ft)Secchi-depth (m)Chlorophyll a, phytoplanktonDepth of sample (m)Water temnerature (°C)Specific conductance (nS/cm)pH (units)Dissolved oxygen (mg/L)Phosphorus, total (as P)Phosphorus, ortho, dissolved (as P)Nitrogen, NO2 + N03, diss. (as N)Nitrogen, ammonia, dissolved (as N)Nitrogen, amm. + org., total (as N)Nitrogen, total (as N)Color (Pt-Co. scale)Turbidity (NTU)Hardness, (as CaC03 )Calcium, dissolved (Ca)Magnesium, dissolved (Mg)Sodium, dissolved (Na)Potassium, dissolved (K)Alkalinity, (as CaC0 3 )Sulfate, dissolved (S04 )Chloride, dissolved (Cl)Silica, dissolved (Si02 )Solids, dissolved, at 180°CIron, dissolved (Fe) n<?/LManganese, dissolved (Mn) M-9/L
2-11-99 4.21-99
Feb-11
11.87
0.510.06247.910.70.024
Apr-21
11.68 >1.00 14.500.5 26.85568.05.3
0.032 <0.0020.02 0.1051.31.4303.72405525252.620239541.53681020
11.82>1.001.270.529.05227.86.7
0.033
Jul-6
11.69>1.005.520.526.75598.19.8
0.027
Aug-4
11.48>1.003.400.526.85578.19.8
0.035
6-08-99 7-06-99 8-04-99
DISSOLVED OXYGEN (D.O.), IN MILLIGRAMS PER LITER0 5 10 15 20 25 05 10 15 20 25 05 10 15 20 25 05 10 15 20 25 05 10 15 20 25
1.00
""l""l"
W.T.
-
", , . , I . .
'l""l""
-
-
D.O.
,l,.,i
0
0.25
0.50
0.75
i nn
""l""l
-
-
-
, , , , 1 ,
,,,,,,,,,,,,,
-
-
-
,,,!,,,,
0
0.25
0.50
0.75
i nn
-
-
-
-
-
-
, 1 , , , , 1 , , , .
0
0.25
0.50
0.75
i nn
,,,,,,
-
-
-
-
'"I""!""!""
-
.
.
J.
1 1 1 1 . i t 1 1 .
10 20 30 10 20 30 0 10 20
WATER TEMPERATURE (W.T.), IN DEGREES CELSIUS
0.25 -
0.50 -
0.75 -
1.0030 0 10 20 30 0 10
6 7
1.00
PH, IN STANDARD UNITS
9 10 6789 10 6789 10 67 9 10 67 9 1011!
S.C.
" \ / "
~ / \ '
: PH x :
0
0.25
0.50
0.75
i nn
1
-
-
-
1 '
.-
-
-
0
0.25
0.50
0.75
i nn
1
-
-
-
i
.-
-
-
1
0
0.25
0.50
0.75
i nn
1
-
-
-
!
1 '
.
-
-
,
u
0.25
0.50
0.75
i nn
1 '
-
-
i
1
.~
-
-
t _100 300 500 700 ' 100 300 500 700 ' 100 300 500 700 ' 100 300 500 700 100 300 500 700
SPECIFIC CONDUCTANCE (S.C.), IN MICROSIEMENS PER CENTIMETER AT 25 DEGREES CELSIUS
97

Z- 0.15tu -J u a: Z ai0£
| | 0.10
O 0
on d
§:? o.osa. Z V
1988 1989 1990 1991 1992 1993 1994 1995 1996 1997 1998 1999
200
0£ fc
gg
S on
150
< 100
50
iiiiiiiiiii1988 1989 1990 1991 1992 1993 1994 1995 1996 1999
oi wH
I 0.5 Z
Ua £ i.o
800
1.5
AA A A/A
1988 1989 1990 1991 1992 1993 1994 1995 1996 1997 1998 1999
100
90
80 X§ 70 ZS 60 <fc 50
U S 40
I 30H
20
EXPLANATION
- - Total Phosphoru
-G- Chlorophyll a
-* Secchi
Oligotrophic
1988 1989 1990 1991 1992 1993 1994
YEAR
1995 1996 1997 1998 1999
Surface total phosphorus, chlorophyll a concentrations, Secchi depths, and TSI data for Big Muskego Lake, South Site, near Muskego, Wisconsin.
(Triangles indicate maximum depth at sampling site. Actual Secchi depth on these days was greater than plotted triangles.)
98

461224091033200 NAMEKAGON LAKES, GARDEN LAKE, NEAR CABLE, WI
LOCATION.--Lat 46°12'24", long 91°03'32", in NW 1/4 SE 1/4 sec.13, T.43 N., R.6 W., Bayfield County, Hydrologic Unit 07030002, near Cable.
PERIOD OF RECORD.-March 1998 to current year.REMARKS.-Lake sampled at deepest part of Garden Lake. Lake ice-covered during March measurements. Water-quality analyses done by
Wisconsin State Laboratory of Hygiene.
WATER-QUALITY DATA, MARCH 04 TO AUGUST 17, 1999 (Milligrams per liter unless otherwise indicated)
Apr-20 Jul-7 Aug-17
Lake stage (ft)Secchi-depth (m)Chlorophyll a, phytoplankton (ug/L)Depth of sample (m)Water temperature (°C)Specific conductance (uS/cm)pH (units)Dissolved oxygen (mg/L)Phosphorus, total (as P)Phosphorus, ortho, dissolved (as P)Nitrogen, N02 + N03, diss. (as N)Nitrogen, ammonia, dissolved (as N)Nitrogen, amm. + org., total (as N)Nitrogen, total (as N)Color (Pt-Co. scale)Turbidity (NTU)Hardness, (as CaC0 3 )Calcium, dissolved (Ca)Magnesium, dissolved (Mg)Sodium, dissolved (Na)Potassium, dissolved (K)Alkalinity, (as CaC0 3 )Sulfate, dissolved (S0 4 )Chloride, dissolved (CDSilica, dissolved (Si0 2 )Solids, dissolved, at 180°CIron, dissolved (Fe) ug/LManganese, dissolved (Mn)
_--
0. 50.21007.211.70. 020______________________________--._ _ __--__________________
----
6. 04 .71266 .82 . 9
0. 121_________________________________________________________
8.75 8.432.2 1.82.25 3 . 53
0.5 6.0 0.5 6.06.6 6.4 15.6 13 -791 91 89 927.1 7.1 7.7 7.010.3 10.6 8.3 3.40.022 0 . 021 0 . 026 0. 0280.007 --- --- ---0.127 --- --- ---0.013 --- --- ---0.39 --- --- ---0.52 --- --- ---50 --- --- ---2 ___ ___ ___
4512 ___ _ _ _ ___3.6 --- --- ---
1.90.941<45 --- --- ---1Q ___ _ ___
14 ___ ___ ___80 --- --- ---330 --- ---180 --- --- ---
8.751. 84.11
0.5 5.522.4 19.987 917.9 7.28.1 4.2
0.033 0.0270.004 ---0.012 ---0.019 ---0.59 ---
0 . 6 ---___ ______ ______ ______ ______ ______ ______ ______ ______ ______ ______ ______ __-___ ___--- ---
8.801. 13.17
0.5 6.020.5 19 .983 837.4 7.27.4 5.5
0.045 0.054_ __ _-____ ______ ______ ______ ______ ______ ______ ______ __---- ------ ---___ ______ ______ ______ ______ _-____ ______ ___--- ---
3-04-99 4-20-99 6-02-99 7-07-99 8-17-99
DISSOLVED OXYGEN (D.O.), IN MILLIGRAMS PER LITER
S &2
£ 3
1* W°5
10 15 20
10 20 30
10 15 20
-
,1111,
. i , , , i , , , L
10 15 20
-
-
-
-/
-
-
-
-
10 15 201 1 1 1 1 1 1
r1 1 1 1 1
1 1 1 1 1 1
, , . i
-
10 20 30 0 10 20 30 0 10 20 WATER TEMPERATURE (W.T.), IN DEGREES CELSIUS
30
10 15 201 1 1 1 1 ,
-
-
-
-
", /
1 1 1 1 1 1 1 1 1 1 1 1
-
-
-
-
,.,.!,,,,10 20 30
10u
C/3 1
W
1g 3
wQ 5
e.
''I.
_ pH\
/ S Cu50 100 150
10
-
-
-
-
-
-
-
--
-
1 1
50 100 150
PH, IN STANDARD UNITS 10
-
-
-
-
- I
1-
-
-
-
50 100 150
10
50 100 150
-
-
-
-
-
-
-
-
-
-
10
50 100 150
SPECIFIC CONDUCTANCE (S.C.), IN MICROSIEMENS PER CENTIMETER AT 25 DEGREES CELSIUS
99

0.10
0.08
w J
O o, 0.06
os os 2 2 o.04
0.02
1 1 1 1 1 1 1
JFMAMJ JASONDJFMAMJ JASOND 1998 1999
20
18 1512
oS 5EC U
JFMAMJ JASONDJFMAMJ JASOND 1998 1999
W ., Q 3
JFMAMJ JASOND 1998
JFMAMJ JASOND 1999
100
90
80 X § 70
60
50
40
Eutrophic
9 © o Mesotrophic
EXPLANATION
- Total Phosphorus
© CWorophyll a
« Secchi
Oligotrophic
JFMAMJJASONDJFMAMJ JASOND 1998 1999
YEAR
Surface total phosphoras, chlorophyll a concentrations, Secchi depths, and TSI data for Namekagon Lake (Garden) near Cable, Wisconsin.
100

461457091065900 NAMEKAGON LAKES, JACKSON LAKE, NEAR CABLE, WI
LOCATION.--Lat 46°14'57", long 91°06'59", in NE 1/4 SE 1/4 sec.33, T.44 N., R.6 W., Bayfield County, Hydrologic Unit 07030002, near Cable.
PERIOD OF RECORD.-March 1998 to current year.
REMARKS.-Lake sampled at deepest part of Jackson Lake. Lake ice-covered during March measurements. Water-quality analyses done by Wisconsin State Laboratory of Hygiene.
WATER-QUALITY DATA, MARCH 03 TO AUGUST 17, 1999 (Milligrams per liter unless otherwise indicated)
Apr-20 Aug-17
Lake stage (ft)Secchi-depth (m)Chlorophyll a, phytoplankton (mg/L)Depth of sample (m)Water temperature (oC)Specific conductance (mS/cm)pH (units)Dissolved oxygen (mg/L)Phosphorus, total (as P)Phosphorus, ortho, dissolved (as P)Nitrogen, NO2 + NO3, diss. (as N)Nitrogen, ammonia, dissolved (as N)Nitrogen, amm. + org., total (as N)Nitrogen, total (as N)Color (Pt-Co. scale)Turbidity (NTU)Hardness, (as CaCO3)Calcium, dissolved (Ca)Magnesium, dissolved (Mg)Sodium, dissolved (Na)Potassium, dissolved (K)Alkalinity, (as CaCO3)Sulfate, dissolved (SO4)Chloride, dissolved (CDSilica, dissolved (Si02)Solids, dissolved, at 180oCIron, dissolved (Fe) mg/LManganese, dissolved (Mn) mg/L
_--
0 . 50 . 0846. 46 . 9
0.039
__________ _ _
______
----
3 . 04. 61126. 60 . 4
0 . 061
_________
_________
8 .19 .
0 . 58 .466
7 . 09 . 1
0 . 0410.0060 . 1430 . 0230.720 . 8660
3 . 930
75. 397
3 . 07 . 1666. 88 . 3
0.039
______
_ _ _____ _ ____
8 .I5 .
0 . 515. 4627 . 27 . 7
0.044
_____--___ _ __________
43. 362
3 . 514 . 0626 . 96 . 5
0.039
______
_ _ _
__ _
8.1 .15
0 . 523.964
7 . 47 . 4
0.0340.004<0 . 0100.0160.81
__ ____
754
. 93 . 522.0726.71. 6
0.037
_ -___-____ _ __________
8 .0 .18
0 . 520 . 660
7 . 26. 9
0 . 062
____--____ __
___---
808
. 03 . 520. 3617.06.3
0 . 054
____-_
_-____-_----
2 . 52 . 30 . 727
4 . 52 . 7
968
88078
3-03-99 4-20-99 6-02-99 7-07-99 8-17-99
0
DISSOLVED OXYGEN (D.O.), IN MILLIGRAMS PER LITER 0 5 10 15 20 0 5 10 15 20 05 10 15 20 05 10 15 20 05 10 15 20
0
W.T.
10 20 30
D.O. _
10 20 30 0 10 20 30 0 10 20 WATER TEMPERATURE (W.T.), IN DEGREES CELSIUS
30 10 20 30
6 7
pH
S.C.
PH, IN STANDARD UNITS9 10 6789 10 67 Oi i i i I 0 9 10
50 100 150 0 50 100 150 0 50 100 150 0 50 100 150 0 50 100 150 SPECIFIC CONDUCTANCE (S.C.), IN MICROSIEMENS PER CENTIMETER AT 25 DEGREES CELSIUS
101

< a:°f £ 0.08
§3U OC
O S o.06U C/5
C/5 SD <OS OSg 2 0.04
w5 d 22
5 0.02
JFMAMJ JASONDJFMAMJ JASOND 1998 1999
P 5K U
JFMAMJ JASONDJFMAMJ JASOND 1998 1999
OS 1U
UJS5 2
§3
JFMAMJ JASOND 1998
JFMAMJ JASOND 1999
100
90
80XQ 70ZU 60
<£ 50U£ 40
S 30i-
20
10
0
Eutrophic
Mesotrophic
EXPLANATION
H§- Total Phospliorus
-©- Clllorophyll a
«< Secchi
Oligotrophic
JFMAMJ JASOND1998
JFMAMJ JASOND 1999
YEAR
Surface total phosphorus, chlorophyll a concentrations, Secchi depths, and TSI data for Namekagon Lake (Jackson) near Cable, Wisconsin.
102

461308091065100 NAMEKAGON LAKE, DEEP HOLE, NEAR CABLE, WI
LOCATION.--Lat 46°13'08", long 91°06'51", in NE 1/4 SE 1/4 sec.9, T.43 N., R.6 W., Bayfield County, Hydrologic Unit 07030002, near Cable. PERIOD OF RECORD.-March 1998 to current year.
REMARKS.-Lake sampled near center of the lake at the deep hole. Lake ice-covered during March sampling. Water-quality analyses done by Wisconsin State Laboratory of Hygiene.
WATER-QUALITY DATA, MARCH 04 TO AUGUST 17, 1999 (Milligrams per liter unless otherwise indicated)
Mar-3 Apr-20 Jun-2 Jul-7 Aug-17
Lake stage (ft)Secchi-depth (m)Chlorophyll a, phytoplankton (ug/L)Depth of sample (m)Water temcerature (°C)Specific conductance (nS/cm)pH (units)Dissolved oxygen (mg/L)Phosphorus, total (as P)Phosphorus, ortho, dissolved (as P)Nitrogen, N02 + N03, diss. (as N)Nitrogen, ammonia, dissolved (as N)Nitrogen, amm. + org., total (as N)Nitrogen, total (as N)Color (Pt-Co. scale)Turbidity (NTU)Hardness, (as CaC0 3 )Calcium, dissolved (Ca)Magnesium, dissolved (Mg)Sodium, dissolved (Na)Potassium, dissolved (K)Alkalinity, (as CaC0 3 )Sulfate, dissolved (S0 4 )Chloride, dissolved (Cl)Silica, dissolved (Si0 2 )Solids, dissolved, at 180°CIron, dissolved (Fe) u9/LManganese, dissolved (Mn) ng/L
______
0.5 9.50.2 3.898 1097.1 5.212 . 1 5.30.018 0.018-._- ______ ______ ______ ______ ______ ______ ______ ______ ______ ______ ______ ______ ______ ______ ______ ______ _____- ______ ___
8.753 .22.34
0.5 14. 06.0 5.597 987.3 7.110.2 8.90.011 0.015<0.002 ---0.09 ---0.015 ---0.330.42 ---151.1 ---45 ---12 ---3.62.40.655 ---
<4.52.812 ---727045 ___
8 .43 8 .3.8 22.81 4.
0.5 14 . 0 0.515.1 10.0 22.195 108 937.6 6.7 7.88.4 0.3 8.2
0.017 0.045 0.024--- 0.003
--- --- <0.010--- --- <0.013--- --- 0.46___ ___ ______ ___ _____ _ -_- ---___ ___ ______ ___ ______ ___ ______ ___ ______ ___ -_____ ___ ______ ___ ______ ___ ______ ___ ______ ___ ______ ___ ---___ ___ --_
75.303
14. 013.01267 .10.1
0. 152__________________________________________---_________---
8 .801.612. 0
0.5 10.020.7 16.791 1197.6 6.97.8 0.30.031 0.046___ ______ ______ ______ ______ ______ ______ __-___ _____ _ ______ ______ __-___ __-___ ______ ___--- ---___ ______ ___--- ------ ---
14. 014.31467.20.1
0.035_________________________________------___------___------
3-03-99
30
4-20-99 7-07-99
DISSOLVED OXYGEN (D.O.), IN MILLIGRAMS PER LITER(
0
2
4
6
10
12
1 A
) 5 1
-
-
-
, , , I .i
0 15 2
-
-
-
-
0 (0
2
4
6
10
12
\A
) 5
-
- 1
- /
f /
10 15 2'l""l""
-
-
;
0 C0
2
4
6
10
12
1A
5 10 15 2,,,,,,, ,,,.,,_,.,,,
^ / :;...,./. .,...."
10 20 30 "0 10 20 30 "0 10 20 WATER TEMPERATURE (W.T.), IN DEGREES CELSIUS
30
8-17-99
10 15 20u
2
4
6
10
12
1 A
I I I I | .
-
~
Y-
---
; '
I
10 20 30
6 7
C/3
PJ
S
2
PC
UJQ
u
2
4
6
8
10
12
\A
1 1 1 1
- pH
1 S C ~-J , ;-
, ,
10u
2
4
6
10
12
1 A
1 '
-
-
-
-
-
1
. ' '
-
-
-
-
-
j
10
PH, IN STANDARD UNITS 8 9 10
u
o
4
6
10
12
\A
1 '
~
-
' 1
- /
/1
1 '
-
-
-
-
\*,
10 8 9 10
50 100 150 0 50 100 150 0 50 100 150 0 50 100 150 0 50
SPECIFIC CONDUCTANCE (S.C.), IN MICROSIEMENS PER CENTIMETER AT 25 DEGREES CELSIUS
100 150
103

Z 0.10oH
£ U 0.08z^W *JU QJ
O S 0.06%%§32 2 o.04CO
§S
0.02
i i i i i i i i i i i iJFMAMJ JASOND
1998JFMAMJ J ASOND
1999
§ H OS 20
ie
JFMAMJ JASONDJFMAMJ JASOND 1998 1999
S 2
§3
§
JFMAMJ JASOND 1998
JFMAMJ JASOND 1999
XQ(5
§CO
U1os
1UU
90
80
70
60
50
30
20
10
0
-
_
-
-
~
i i i i
» ^
Gr^ x-''
EXPLANATION
B Total Phosphorus
Q Chlorophyll a
«< Secclli
J F M A M
1111111 i i i i i i i i i i i
-
_
Eutrophic-
» «^*^~--^«. -. » -Ji
Oligotrophic
~
J JASONDJFMAMJ JASOND1998 1999
YEAR
Surface total phosphorus, chlorophyll a concentrations, Secchi depths, and TSI data for Namekagon Lake, Deep Hole, near Cable, Wisconsin.
104

461228091044300 NAMEKAGON LAKE, EAST BASIN, NEAR CABLE, WI
LOCATION.--Lat 46°12'28", long 91°04'43", in NW 1/4 SE 1/4 sec. 14, T.43 N., R.6 W., Bayfield County, Hydrologic Unit 07030002, near Cable.
PERIOD OF RECORD.-March 1998 to current year.
REMARKS.-Lake sampled at deepest part of the eastern basin. Lake ice-covered during March sampling. Water-quality analyses done by Wisconsin State Laboratory of Hygiene.
WATER-QUALITY DATA, MARCH 04 TO AUGUST 17, 1999 (Milligrams per liter unless otherwise indicated)
Mar-4
Lake stage (ft)Secchi-depth (m)Chlorophyll a, phytoplanktonDepth of sairple (m)Water temoerature (°C)Specific conductancepH (units)Dissolved oxygen (mg/L)Phosphorus, total (as P)
Apr-20 Jun-2 Jul-7 Aug-17
___ 0.50.11037.010.60.026
8.752.07.110.56.5947.310.50.021
8.432.54.70.515.3947.58.30.021
8.752.16.95
0.5 7.022.4 14.592 1337.8 7.27.8 0.10.020 0.120
8.801.318.00.521.0887.57.90.040
1onOS -, tq 2 H tq 3s 3Z 4
3-04-99 4-20-99 6-02-99 7-07-99
DISSOLVED OXYGEN (D.O.), IN MILLIGRAMS PER LITER
8-17-99
(0
1OS -, tq 2Hs g 4
X 5(XW 6Q
7
(
) 5 10 15 2
;....,....,.,..,..,,
-
-
-.
;-
3 10 20 3
0 (0
1
2
3
4
5
6
7
0 (
) 5 1
_
-
-
-
i i
'
,,,,!,,
) 10
0 15 2. . . . 1 . . . .
-
-
-
-
,,!,,,,
20 3
0 (0
1
2
3
4
5
6
7
0 (
) 5
_
_ D.O.
r
-
-
^} 1^^
/
~ '
1 1 , 1 1
) 10
10 15 21 1 " ' ' 1 ' ' ' ';
W.T. --
-
-
/ I'
,,,!,,,,
20 3
0 C0
1
2
3
4
5
6
7
0 C
5. . . . 1 . .
-
-
-^Jr~~*^-
"-
. i 1) 10
10 1'
fs°'
'
20
5 2
_
-
-
-
-
..I3
D (0
1
2
3
4
5
6
7
0 (
) 5
_
-
-
-
-
....I) 10
10 15 2
_
-
-
-
-
,11,1....20 3(
WATER TEMPERATURE (W.T.), IN DEGREES CELSIUS
10 10
- pH
-
-
-
-
-
-
( 0 (-. -----
1 1
PH, IN STANDARD UNITS 10 10 10
1
-
-
-
-
-
- /
-
1 ' :-
-
-
-
-
-
-
0
1
2
3
4
5
6
7
9
1
-
-
-
-
-(
1 '-
-
-
-
.
''., -
-
u
1
2
3
4
5
6
7
R
1
-
-
-
-
-
'
-
1 '
-
-
-
-
-
-
-
50 100 150 50 100 150 50 100 150 50 100 150 50 100 150
SPECIFIC CONDUCTANCE (S.C.), IN MICROSIEMENS PER CENTIMETER AT 25 DEGREES CELSIUS
105

a 0.08 h
^ 0.06
$ 2 0.04A J
0.02
I____I____I____I
JFMAMJJASOND 1998
JFMAMJJASOND 1999
10
p 5u
0 J i i I i i i i i i i i i i ' I I I L
JFMAMJ JASONDJFMAMJ JASOND 1998 1999
I'll 1_JFMAMJJASOND
1998JFMAMJ JASOND
1999
X
QZ
B
ucZ 0r-
1UU
90
80
70
60
40
20
10
0
-
_
-
-
-
~
i i i i
--.
x.-^xor
EXPLANATION
Total Phosphorus
-0- Clilorophyll a
X" Secchi
J F M A M
i i i i i i ! | i i i i i i i i i i i
-
_
Eutrophic-
-^^ ^ ^l^-i^-i^..^^..^... _ ^ ^ ^f*
Mesotrophic*®^^
Oligotrophic
~
J JASONDJFMAMJ JASOND1998 1999
YEAR
Surface total phosphorus, chlorophyll a concentrations, Secchi depths, and TSI data for Namekagon Lake, East Basin, near Cable, Wisconsin.
106

461410091050700 NAMEKAGON LAKE, NORTHEAST BASIN, NEAR CABLE, WI
LOCATION.--Lat 46°14'10", long 91°05'07", in SE 1/4 NW 1/4 sec.2, T.43 N., R.6 W., Bayfield County, Hydrologic Unit 07030002, near Cable. PERIOD OF RECORD.-March 1998 to current year.REMARKS.-Lake sampled at deepest part of the northeast bay. Lake ice-covered during March sampling. Water-quality analyses done by
Wisconsin State Laboratory of Hygiene.
WATER-QUALITY DATA, MARCH 03 TO AUGUST 17, 1999 (Milligrams per liter unless otherwise indicated)
Lake stage (ft) Secchi-depth (m) Chlorophyll a, phytoplankton Depth of sanple (m) Water temperature (°C) Specific conductance (^S/cm) pH (units)Dissolved oxygen (mg/L) Phosphorus, total (as P)
Mar-3 Apr-20 Jun-2 Jul-7
0.015 0.032 0.018 0.019 0.034 0.130 0.164
Au.g-17
0.50.4977.011.6
_ _
11.54.61407.20.7
8.752.35.040.56.9897.210.3
8.433.03.16
0.5 10.015.7 9.092 1027.5 6.68.2 0.3
8.752.45.21
0.5 11.022.9 11.389 1237.6 7.17.5 0.1
8.8C1.318
0.521.1857.78.0
)
10.012.81397.10.2
0.038 0.265
3-03-99 4-20-99 6-02-99 7-07-99 8-17-99
DISSOLVED OXYGEN (D.O.), IN MILLIGRAMS PER LITER
0
w 2 Oi UJH 4
S 6sW °10
12(
) 5 10 15 2
_\ W.T. /
/
y D.O.
/ , , ") 10 20 3
0 ( 0
2
4
6
8
10
12 0 (
) 5 10 15 2
-
~
-
-
-
) 10 20 3
0 ( 0
2
4
6
8
10
12 0 (
) 5 10 15 2, , , , | , ,
V
-
.
, , , , 1 I , , , 1 , , , ,) 10 20 3
0 ( 0
2
4
6
8
10
12 0 (
) 5 10 15 20 0 5 10 15 2(, , , , 1 . .
r^-
~
,
-
) 10 20 3
2
4
6
0
10
12 0 (
~
r < i~
-
L ;, , , , i , . . . i . . , .
) 10 20 3(
WATER TEMPERATURE (W.T.), IN DEGREES CELSIUS
PH, IN STANDARD UNITS(
n 2
aH 4
Z 6
J5 8UJ Q 10
n
57891
_-PH
-
-
-
_
s.c._
.
;
\ -
0 ( 0
2
4
6
8
10
n
57891
_
-
-
-
_
-
-
_
i i
0 ( 0
2
4
6
8
10
1 1
57891
_
-
_
-
" /
" /
./ t -
0 ( 0
2
4
6
8
10
n
5789 10 67891
-
_
-
-
:|\1
2
4
6
8
10
1?
_
-
_
-
-
: f \50 100 150 50 100 150 50 100 150 50 100 150 50
SPECIFIC CONDUCTANCE (S.C.), IN MICROSIEMENS PER CENTIMETER AT 25 DEGREES CELSIUS
100 150
107

z" °' 14o< * 0-12
iia j o.ioZ B3
8 co 0.08
D <O o 0.06
0.04
0.02
0JFMAMJ JASONDJFMAMJ JASOND
1998 1999
25
|
<| 20a: G H j
£gO 5£>u
JFMAMJ JASONDJFMAMJ JASOND 1998 1999
S Z 2
5 3
U
JFMAMJ JASOND 1998
JFMAMJ JASOND 1999
1UU
90
80
70
60
50
jO
20
10
0
-
_
-
~
i i i i
» _
EXPLANATION
B Total Phosphorus
0- CWorophyll a
»< Secclii
J F M A M
1111111 i i i i i i i i i i i
-
_Eutrophic
m.
^^^^^^ *f ^s*r:.*^& Mesotrophic ~~ ~**i®At*^^»~*r
Oligotrophic
J JASONDJFMAMJ JASOND1998 1999
YEAR
Surface total phosphorus, chlorophyll a concentrations, Secchi depths, and TSI data for Namekagon Lake, Northeast Basin, near Cable, Wisconsin.
108

430551088273500 OCONOMOWOC LAKE NO. 1 (CENTER) AT OCONOMOWOC, WI
LOCATION.--Lat 43°05'51", long 88°27'35", in NW 1/4 SE 1/4 sec.2, T.7 N., R. 17 E., Waukesha County, Hydrologic Unit 07090001, at Ocono- mowoc.
PERIOD OF RECORD.--March 1986 to current year.
REMARKS.--Lake sampled near center at the deep hole. Lake ice-covered during February sampling. Water-quality analyses done by Wis consin State Laboratory of Hygiene.
WATER-QUALITY DATA, FEBRUARY 10 TO AUGUST 09, 1999 (Milligrams per liter unless otherwise indicated)
Lake stage (ft) Secchi-depth (m Chlorophyll a. Depth of sample Water temperatu Specific conduc pH (units) Dissolved oxyge Phosphorus, tot Phosphorus, ort Nitrogen, N02 + Nitrogen, ammon Nit rogen, amm. Nitrogen, total Color (Pt-Co. s Turbidity (NTH) Hardnes s, (as C Calc ium, dissol Magnesium, diss Sodium, dissolv Potassium, diss Alka1inity, (as Sulfate, dissol Chloride, disso Si 1 i ca, dissolv Solids, dissolv Iron, dissolved Manganese, diss
phytoplankton (mg/L)
re (oC)tance (mS/cm)
n (mg/L)al (as P)ho, dissolved (as P)N03, diss. (as N)
ia, dissolved (as N) + org . , total (as N)(as N)
cale)
aC03 ) ved (Ca) olved (Mg) ed (Na) olved (K)CaC03 )
ved (SO4) Ived (Cl) ed (Si02 ) ed, at 180oC(Fe) mg/L
olved (Mn) mg/L
Feb-10
7.10
_ _ _0.5 18.03.6 2.9550 6647.7 7.813.8 10.3
<0.005 0.010_ _ _- _ _ _ _ _- - -_ _ _ _ _ -_ _ _- - -_ _ _ _ _ -_ _ _- _ _ _ _ -_ _ __ _ _- - -- - -_ _ _- - -- - -. . .
Apr
8 .2 .5.
0 . 59 . 35658 . 413.00.010<0 . 0020.241<0 . 0130.540.7810
1 . 4240443 11 52
2212 5365 . 3318
-20
17. 073
17.57 . 1572S . 09 . 1
0.009_ _ _
_ _ __ _ _
_ _ __ - __ _ __ _ _
_ _ __ _ __ _ _
_ _ _
_ . .
Jun- 17
8.043 . 11 . 52
0.5 17.522.0 8.7517 5668.0 7.59.3 0.9
0.009 0.045_ _ __ _ __ _ _ _ _ __ _ __ _ _ _ _ __ _ __ _ _ - - -_ _ __ _ _ - - -_ _ _ _ _ __ - _ _ _ __ _ _ - - -_ _ __ _ _ - _ __ _ _ _ - -_ _ _ - - -_ _ -
Jul- 12
7.992 . 11.94
0.5 18.026.6 8.6528 5798.2 7.63.8 0.0
0.008 0.029_ . _ _ _ __ _ - _ _ __ _ - - - -_ _ _ - - __ _ - _ _ __ _ __ _ _ _ _ __ _ - - - __ _ __ . _ - - -_ _ -_ _ -_ _ -_ _ - - - -_ _ -_ _ -_ . -
Aug-9
3.041 . 92.62
0.5 11.024.4 11.5500 5678.1 7.68.3 0.4
0.016 0.020_ _ _- - -- - - - - -- - _- - -- - -_ _ - - - -_ _ _- - - _ _ __ _ _ _ _ __ _ __ _ _ _ _ __ _ _ _ _ __ _ __ _ _ _ _ __ _ _- - -
18.0S . 65877 . 50 . 0
0.031
_ _ _
_ _ __ _ _- - -- - -
_ _ _
- - _
- - _
- _ _
- - -
2-10-99 4-20-99 6-17-99 7-12-99
10 15 20U
2C/3tt< 4
W ^
^ 8 ""1 10
aswQ 14
16
19
" W.T.
-
-
D.O.
~ , />
-
-
-
-
~
10 20 30
DISSOLVED OXYGEN (D.O.), IN MILLIGRAMS PER LITERo'
2
4
6
10
12
14
1619
) 5 10
-
-
1
15 2
-
-
-
-
-
1 , , , ,
10 15 20 10 15 20
10 20 30 0 10 20 30 0 10 20 WATER TEMPERATURE (W.T.), IN DEGREES CELSIUS
30
8-09-99
10 15 20u
2
4
6
10
12
14
1619
-
~
~ / S ~_~V /---
10 20 30
PH, IN STANDARD UNITS10
u
2C/3tt< 4
W 6^ 8
"1 10as
§u161 Qlo
5(
:'-
-
' \...^)0 550 60
_
-
-
-
-
-
-
0 650 7C
10u
2
4
6
10
12
14
161 O
1 '
~ S.C.-
-
_
-
-
/i /
1-
-
-
_
PH _
-
-
i500 550 600 650 700
10
500 550 600 650 700
10
500 550 600 650 700
10
500 550 600 650 700
SPECIFIC CONDUCTANCE (S.C.), IN MICROSIEMENS PER CENTIMETER AT 25 DEGREES CELSIUS
109

- 0.025O
< 06£ ffl 0.020
0.015
PJ J U asZ UJO a.
CO S5 <on oi$ 2 o.oio
= 0.005 O
CD «D
1986 1987 1988 1989 1990 L991 1992 1993 1994 1995 1996 1997 1998 1999
O 5U < 1«
ooo
1986 1987 1988 1989 1990 1991 1992 1993 1994 1995 1996 1997 1998 1999
g 6
10 Ulli
1986 1987 1988 1989 1990 1991 1992 1993 1994 1995 1996 1997 1998 1999
100
90
80XQ 70 Zw 60
H 50U5 40
I 30 H
20
10
EXPLANATION
U Total Phosphoru
O- Chlorophyll a
* Secchi
Eutrophic
Oligotrophic
1986 1987 1988 1989 1990 1991 1992 1993 1994 1995 1996 1997 1998 1999
YEAR
Surface total phosphorus, chlorophyll a concentrations, Secchi depths, and TSI data for Oconomowoc Lake, No. 1 (Center) at Oconomowoc, Wisconsin.
(Circles on the first three plots indicate laboratory detection limit for selected analyses. Actual concentrations for these particular analyses are less than the plotted circles.)
110

430609088262200 OCONOMOWOC LAKE NO. 2 (OFF HEWITT POINT) AT OCONOMOWOC, WI
LOCATION.-Lat 43°06'09", long 88°26'22", in NW 1/4 NW 1/4 sec. 1, T.7 N., R. 17 E., Waukesha County, Hydrologic Unit 07090001, at Ocono- mowoc.
PERIOD OF RECORD.-March 1986 to current year.REMARKS.-Lake sampled at the deepest point in northeast bay near Hewitt Point. Lake ice-covered during February sampling. Water-quality anal
yses done by Wisconsin State Laboratory of Hygiene.
WATER-QUALITY DATA, FEBRUARY 10 TO AUGUST 09, 1999 (Milligrams per liter unless otherwise indicated)
Feb-10 Apr-20 Jun-17 Jul-12 Aug-9
Lake stage (ft)Secchi-depth (m)Chlorouhvll a, Dhvtoulankton (ucr/L)Depth of sample (m)Water temnerature (°C)Specific conductance (uS/cm)pH (units)Dissolved oxygen (mg/L)Phosphorus, total (as P)Phosphorus, ortho, dissolved (as P)Nitrogen, N02 + N03, diss. (as N)Nitrogen, ammonia, dissolved (as N)Nitrogen, amm. + org., total (as N)Nitrogen, total (as N)
7.
--0.53.05518.114.4
<0.005
____________
10
.-14.03.46157.89.3
0.010
____________
8. 4.l.
0.59.56068.211.6
<0.005
0.2250.090.550.77
17 505
14.57.86128.09.1
0.009
____________
8.2.0.
0.522.15448.29.4
0.008
____________
04 .794
14.58.76147.40.6
0.041
____________
7. 2.1.
0.526.45638.28.5
0.006
____________
99.773
14.58.86307.50.0
0.053
____________
0.524.25388.38.5
0.012
____________
8.04 2.13.2210.010.75997.60.2
0.018
____________
14.08.86377.40.0
0.055
____________
2-10-99
0 5 10 15 20
4-20-99 6-17-99 7-12-99
u
00 3
W s 6zE 9
wQ 12
1 *
1 1 1 1 1 1 1 1 1 1 1 1
' W.T.
-
r-
, , i , 1 , , , , 1
| i i i r
-
-
D.O. '
0 10 20 30
DISSOLVED OXYGEN (D.O.), IN MILLIGRAMS PER LITER0 5 10 15 20
u
3
6
9
12
i ^
-
-
r-
y, , , , /.
----
, i , , , , 0 10 20 30
0 5 10 15 20
0 10 20 30
0 5 10 15 20
10 20 30
8-09-99
10 15 20
10 20 30
WATER TEMPERATURE (W.T.), IN DEGREES CELSIUS
PH, IN STANDARD UNITS
*s 6zHf 9£WQ 12
15
9 10 9 10U
3
6
9
12
i s
1 '
"
_PH
-
/
.
S.C. ' ~
_
-
-
i
12
15
9 10 9 10u
3
6
9
12
r <
1 '
-
-
- /
- |
1
-
-
\
i
9 10
500 550 600 650 500 550 600 650 500 550 600 650 500 550 600 650 500 550 600 650
SPECIFIC CONDUCTANCE (S.C.), IN MICROSIEMENS PER CENTIMETER AT 25 DEGREES CELSIUS
111
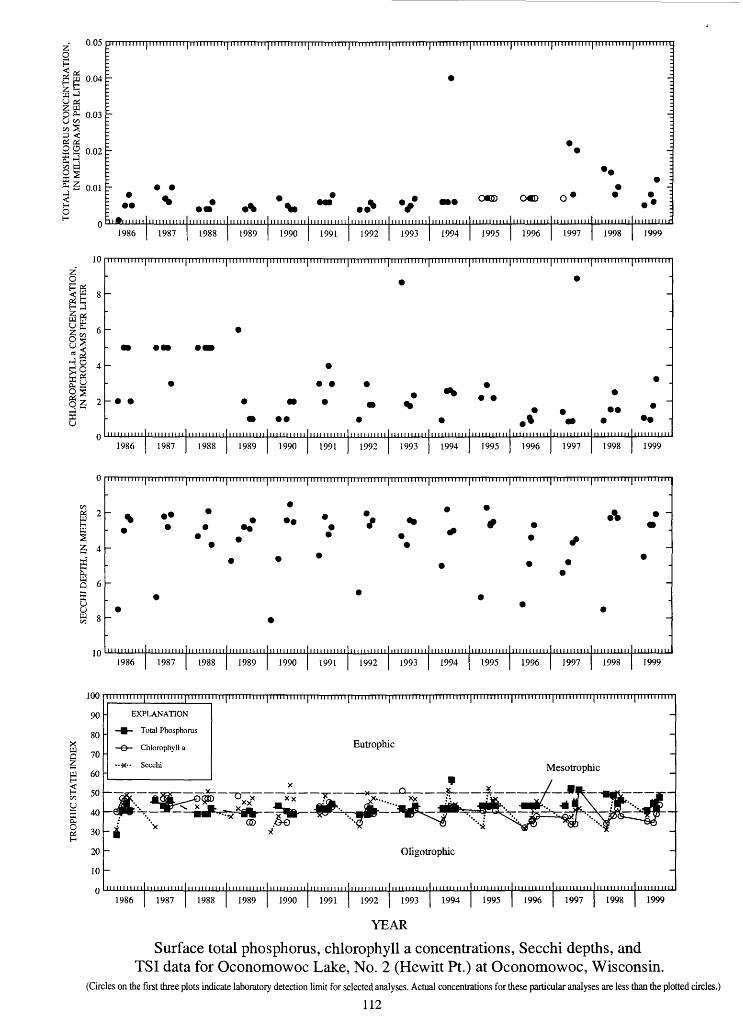
U coCO SD <
0.05
0.04
0.03
°°o.o2
s 0.01
. *
O«D O
n urn ii n nun i n ir
1986 1987 1988 1989 1990 1991 1992 1993 1994 1995 1996 1997 1998 1999
10 TTTn|.lHTTTmi|irmTM,ll f T
P;U
0 Lum1986 1987 1988 1989 1990 1991 1992 1993 1994 1995 1996 1997 1998 1999
1 22 4
Q 6
O
10
100
90
80
70
60
50
40
30
20
10
1986ii n 11111 n
1987 1988 1989 1990 1991 1992 1993 1994 1995 1996 1997 1998 1999
EXPLANATION
Total Phosphorus
Chlorophyll a
Secchi
Eutrophic
Mesotrophic
Oligotrophic
1986 1987 1988 1989 1990 1991 1992 1993 1994 1995 1996 1997 1998 1999
YEAR
Surface total phosphorus, chlorophyll a concentrations, Secchi depths, and TSI data for Oconomowoc Lake, No. 2 (Hewitt Pt.) at Oconomowoc, Wisconsin.
(Circles on the first three plots indicate laboratory detection limit for selected analyses. Actual concentrations for these particular analyses are less than the plotted circles.)
112

430723088252100 OKAUCHEE LAKE AT OKAUCHEE, WI
'.OCATION.--Lat 43°07'23", long 88°25'21", in SE 1/4 SE 1/4, sec.25, T.8 N., R.17 E, Waukesha County, Hydrologic Unit 07090001, at Okauchee.DRAINAGE AREA.--80.7 mi2 .°ERIOD OF RECORD.-February 1984 to current year.".ARE-STAGE GAGE.-Datum of gage is 869.00 ft above sea level.REMARKS.-A detailed water quality management plan has been developed for Okauchee Lake by Southeastern Wisconsin Regional Planning Com
mission; previous water-quality data are available in this report. Lake sampled near center at the deep hole. Lake ice-covered during February sampling. Water-quality analyses done by Wisconsin State Laboratory of Hygiene.
WATER-QUALITY DATA, FEBRUARY 10 TO AUGUST 09, 1999 (Milligrams per liter unless otherwise indicatedd)
Feb-10 Apr-20 Jun-18 Jul-12 Aug-9
Lake stage (ft)Secchi-depth (m)Chlorophyll a, phytoplanktonDepth of sample (m)Water tenvoerature (°C)Specific conductance (uS/cm)pH (units)Dissolved oxygen (mg/L)Phosphorus, total (as P)Phosphorus, ortho, dissolved (as P)Nitrogen, N02 + N03, diss. (as N)Nitrogen, ammonia, dissolved (as N)Nitrogen, amm. + org., total (as N)Nitrogen, total (as N)Color (Pt-Co. scale)Turbidity (NTU)Hardness, (as CaC03 )Calcium, dissolved (Ca)Magnesium, dissolved (Mg)Sodium, dissolved (Na)Potassium, dissolved (K)Alkalinity, (as CaC03 )Sulfate, dissolved (S04 )Chloride, dissolved (Cl)Silica, dissolved (Si02 )Solids, dissolved, at 180°CIron, dissolved (Fe) txqYLManganese, dissolved (Mn)
4.--
0.52.77407.914.50.007___________________________________________________
.35----
27.52.65697.98.7
0.101___________________________________________________
4.1.13
0.58.95688.413.90.014<0.0020.378<0.0130.661.0101.32605032131.923425323.1328
65.7.128.56.65778.19.8
0.014___________________________________________________
4.15.
0.521.65178.28.7
0.012_________________________________________________-_
79.908
287.55697.50.6
0.024_______-_________________________---_______________
4.15.
0.525.65418.08.4
0.012___________________________---___------____________
76.320
27.57.55767.60.0
0.029______---____________---___---------------_________
0.524.45178.07.40.023___---------_______________------___------___---___
4.781.37.0011
10.85627.71.0
0.018________________________------____________------__-
26.57.65707.60.00.034_________---_________------------------------------
<0.40
2-10-99 4-20-99 6-18-99 7-12-99 8-09-99
10 15 20u
3C/3 sQ/ O
H 9
1 12
£ 15
E 18
w 21Q 24
27in
it i i | i i i i | i i i i
W.T.
-
-
-
-
D.O.-
s^
i i i i 1 i i i i 1
1 i i i i-
-
-
-
-
-
-
-
-
i i i i_10 20 30
10
DISSOLVED OXYGEN (D.O.), IN MILLIGRAMS PER LITER10 15 20
10 20 30
0 10 15 20
0 10 20 30
0 10 15 20
0 10 20
WATER TEMPERATURE (W.T.), IN DEGREES CELSIUS
10PH, IN STANDARD UNITS
10
30
10
(0
3
6
9
12
15
18
21
24
27 in
) 5 10 15 2(,n
1 ' :-
i i i 1 . . . . 1 . . . .10 20 30
100
3
2 ^e 9u§ 12
£ 15
DC 18
w 21Q 24
27
30 5(
..i >
s.c. '
--
--
: 1)0 600 70
i_
-
-
-
-
pH ~
-
0 800 9C
0
3
6
9
12
15
18
21
24
27
30 )0 5(
I i-
-
-
,-
i i)0 600 700
i_
-'
-
-
_
-
800 9C
0
3
6
9
12
15
18
21
24
27
30 0 5(
!!.l)0 600 700 800 9C
0
3
6
9
12
15
18
21
24
27
30 K) 5(
i-i
i *«- -_
1 t lX) 600 1
i. i1/ :' -
-
~~
-
-
i i00 800 9C
u
3
6
9
12
15
18
21
24
27
30 )0 5(
t" \~
-
-
~
X) 600
1 ' :J 1
-
~~.
-
-
~
700 800 90
SPECIFIC CONDUCTANCE (S.C.), IN MICROSIEMENS PER CENTIMETER AT 25 DEGREES CELSIUS
113

TR
OPH
IC S
TA
TE
IN
DE
X
UJ
-te.
'Vt
C*\
-J
(
o
o
o
o
o
<
CO
O&
ft
)5
<-* D
* O
H
P
a O
«m
-^
- * v
> SO
21
^ ~
^rfT
tn
:
I-H cr
k^±
ft>
p
" SI
II 0 CT.
.« a
&o'
GOO
ft)
O
Q
n>
M
SEC
CH
I D
EPT
H,
IN M
ET
ER
S
CH
LO
RO
PHY
LL
a C
ON
CE
NT
RA
TIO
N,
IN M
ICR
OG
RA
MS
PER
LIT
ER
TO
TA
L P
HO
SPH
OR
US
CO
NC
EN
TR
AT
ION
, IN
MIL
LIG
RA
MS
PER
LIT
ER

430759088244200 OKAUCHEE LAKE, NO. 1, NEAR OKAUCHEE, WI
LOCATION.-Lat 43°07'59", long 88°24'42", in NE 1/4 NW 1/4 sec.30, T.8 N., R. 18 E., Waukesha County, Hydrologic Unit 07090001, near Okauchee.
PERIOD OF RECORD.-April 1986 to current year.
LAKE-STAGE GAGE.-Datum of gage is 869.00 ft above sea level.
REMARKS.-Lake sampled in Crane's Nest Bay, in the northeast part of the lake, at an approximate depth of 2 m. Water-quality analyses done by Wisconsin State Laboratory of Hygiene.
WATER-QUALITY DATA, APRIL 20 TO AUGUST 09, 1999 (Milligrams per liter unless otherwise indicated)
Apr-20 Jun-18 Jul-12 Aug-9
Lake stage (ft) 4.65 4.79 4.76 4.78Secchi-depth (m) 1.4 1.9 1.1 1.5Chlorophyll a, phytoplankton (ng/L) 15.3 2.69 3.58 10Depth of sample (m) 0.5 0.5 0.5 0.5Water temoerature (°C) 9-0 21.9 25.9 24.4Specific conductance (nS/cm) 594 518 547 517pH (units) 8.6 8.3 8.2 8.3Dissolved oxygen (mg/L) 14.8 9.0 8.4 7.6Phosphorus, total (as P) 0.021 0.012 0.011 0.022
430645088264500 OKAUCHEE LAKE, NO. 2, AT OKAUCHEE, WI
LOCATION.-Lat 43°06'45", long 88°26'45", in SE 1/4 NE 1/4 sec.35, T.8 N., R.17 E., Waukesha County, Hydrologic Unit 07090001, at Okauchee.
PERIOD OF RECORD.-April 1986 to current year.
LAKE-STAGE GAGE.-Datum of gage is 869.00 ft above sea level.
REMARKS.-Lake sampled in Lower Okauchee Lake, at an approximate depth of 5 m. Water-quality analyses done by Wisconsin State Lab oratory of Hygiene.
WATER-QUALITY DATA, APRIL 20 TO AUGUST 09, 1999 (Milligrams per liter unless otherwise indicated)
Apr-20 Jun-18 Jul-12 Aug-9
Lake stage (ft) 4.65 4.79 4.76 4.78Secchi-depth (m) 1.1 1.4 1.6 2.1Chlorophyll a, phytoplankton (ng/L) 10.5 2.44 4.34 4.10Depth of sample (m) 0.5 0.5 0.5 0.5Water teirroerature (°C) 10.4 22.3 26.5 24.5Specific conductance (nS/cm) 563 504 520 498pH (units) 8.5 8.3 8.2 8.1Dissolved oxygen (mg/L) 13.4 8.7 9.0 7.5Phosphorus, total (as P) 0.012 0.013 0.013 0.025
115

430642088252400 OKAUCHEE LAKE, NO. 3, AT OKAUCHEE, WI
LOCATION.--Lat 43°06'42", long 88°25'24", in NE 1/4 SE 1/4 sec.36, T.8 N., R.17 E., Waukesha County, Hydrologic Unit 07090001, at Okauchee.
PERIOD OF RECORD.--April 1986 to current year.
LAKE-STAGE GAGE.-Datum of gage is 869.00 ft above sea level.
REMARKS.-Lake sampled in Ice House Bay, in the southern part of the lake, at an approximate depth of 4 m. Water-quality analyses done by Wisconsin State Laboratory of Hygiene.
WATER-QUALITY DATA, APRIL 20 TO AUGUST 09, 1999 (Milligrams per liter unless otherwise indicated)
Apr-20 Jun-18 Jul-12 Aug-9
Lake stage (ft) 4.65 4.79 4.76 4.78Secchi-depth (m) 1.3 1.3 1.3 1.5Chlorophyll a, phytoplankton (ng/L) 9.61 5.59 6 7.00Depth of sample (m) 0.5 0.5 0.5 0.5Water temoerature (°C> 9.6 21.7 26.1 24.1Specific conductance (nS/cm) 560 502 525 500pH (units) 8.6 8.3 8.2 8.2Dissolved oxygen (mg/L) 13.4 9.1 8.6 7.6Phosphorus, total (as P) 0.011 0.019 0.015 0.026
430757088261700 OKAUCHEE LAKE, NO. 4, AT OKAUCHEE, WI
LOCATION.-Lat 43°07'57", long 88°26'17", in NW 1/4 NW 1/4 sec.25, T.8 N., R.17 E., Waukesha County, Hydrologic Unit 07090001, at Okauchee.
PERIOD OF RECORD.-June 1986 to current year.
LAKE-STAGE GAGE.-Datum of gage is 869.00 ft above sea level.
REMARKS.-Lake sampled near McDowell (Crazyman's) Island, in the northwest bay of the lake, at an approximate depth of 2 m. Water- quality analyses done by Wisconsin State Laboratory of Hygiene.
WATER-QUALITY DATA, APRIL 20 TO AUGUST 09, 1999 (Milligrams per liter unless otherwise indicated)
Apr-20 Jun-18 Jul-12 Aug-9
Lake stage (ft) 4.65 4.79 4.76 4.78Secchi-depth (m) 1.3 1-7 1.1 1.3Chlorophyll a, phytoplankton (ng/L) 8.90 2.62 4.42 6.00Depth of sample (m) 0.5 0.5 0.5 0.5Water temoerature (°C) 9.1 21.9 26.4 23.9Specific conductance (nS/cm) 569 517 540 513pH (units) 8.5 8.3 8.1 8.4Dissolved oxygen (mg/L) 13.1 8.5 7.7 8.1Phosphorus, total (as P) 0.011 0.015 0.011 0.021
116

424905088204000 POTTER LAKE NEAR MUKWONAGO, WI
LOCATION.-Lat 42°49'05", long 88°20'40", in NW 1/4 SW 1/4 sec. 11, T.4 N., R.18 E., Walworth County, Hydrologic Unit 07120006, 3.3 misouth of Mukwonago.
PERIOD OF RECORD.-February 1993 to current year.REMARKS.-Lake sampled at the deep hole. Lake ice-covered during February sampling. Water-quality analyses done by Wisconsin State Lab
oratory of Hygiene.WATER-QUALITY DATA, FEBRUARY 11 TO AUGUST 05, 1999
(Milligrams per liter unless otherwise indicated)
Feb-ll Apr-21 Jun-11 Aug-5
Lake stage (ft)Secchi-depth (m)Chlorophyll a, phytoplankton (ng/L)Depth of sample (m)Water temoerature (°C)Specific conductance (nS/cm)pH (units)Dissolved oxygen (mg/L)Phosphorus, total (as P)Phosphorus, ortho, dissolved (as P)Nitrogen, N02 + N03, diss. (as N)Nitrogen, ammonia, dissolved (as N)Nitrogen, amm. + org., total (as N)Nitrogen, total (as N)Color (Pt-Co. scale)Turbidity (NTU)Hardness, (as CaC03 )Calcium, dissolved (Ca)Magnesium, dissolved (Mg)Sodium, dissolved (Na)Potassium, dissolved (K)Alkalinity, (as CaC03 )Sulfate, dissolved (S04 )Chloride, dissolved (Cl)Silica, dissolved (Si02 )Solids, dissolved, at 180°CIron, dissolved (Fe) ng/LManganese, dissolved (Mn)
8.31
0.5 6.55.4 4.7452 5087.6 7.410.6 4.50.051 0.228___ ______ ___
_________ ______ ______ ______ ______ ______ ______ ______ ______ ______ ___
______ ______ ______ ___ ___
8.31.
0.511.24868.111.20.0170.0110.0480.1961.31.315
0.901804020202.21717.645
0.16272204.9
13.291
7.010.74878.010.70.034
____________
_________________________________
8.271.17.74
0.5 7.026.9 15.8445 5138.3 7.49.1 0.6
0.022 0.047___ ______ ______ ___
______ ______ ______ ______ ______ ______ ______ ______ ___
_________ _________ ______ ___
7 .0.19
0.526.84448.18.2
0.0460.0180.0210.0481.71.8_______________________________________
96,7.6
7.015.95316.90.5
0.062_______________________________________
____________
0.526.94798.17.8
0.041___
___________________________________________________
7.641.18.006.021.55646.70.2
0.048
__________________ _________
___
___
___
7.019.86126.60.0
0.057___-____________________
______
_________
2-11-99
10 15 20u
1CO
I 3^ 4
I 6
7
Q
-
-
J
- /
~
,,,,!.,
-
-
~
-
-
,,!,!,,
10 20 30
4-21-99 6-11-99 7-08-99
DISSOLVED OXYGEN (D.O.), IN MILLIGRAMS PER LITER10 15 20
1 1 .. 1 1 1 1 1 1
- W.T.-
-
-
-
-
i i i 1 i i ..
-
-
-
-
-
D.O. _
10 20 30
0
0
10 15 20
10 20 30
0
0
10 15 20
10 20 30
WATER TEMPERATURE (W.T.), IN DEGREES CELSIUS
8-05-99
10 15 20
10 20 30
PH, IN STANDARD UNITS10
u
1COI 2
Z 4
cu
7
4(
^ '
- \*«
-
-
X) 50
1 ' :-
"
-
-
) 600 70
_
-
-
-
-
-
- s.c
_
pH _
-
-
-
-
-
10 8 10 10 8 9 10
400 500 600 700 400 500 600 700 400 500 600 700 400 500 600 700
SPECIFIC CONDUCTANCE (S.C.), IN MICROSIEMENS PER CENTIMETER AT 25 DEGREES CELSIUS
117

z' °'05oH< as? la 0.04
U as
O & 0.03U </3
D <as as o g 0.02
o.oi
1993 1994 1995 1996 1997 1998 1999
oH OS<e 20
S« ,5 5*8
.*
1993 1994 1995 1996 1997 1998 1999
Z 2
S
Q 3
5 1 i i i i i i i i < i i i i i ' ' i i i i i ' i i i ' ' ' i ' i i '
1993 1994 1995 1996 1997 1998 1999
100
90
80 X§ 70 ZW 60
I 50
U5 «>
I 30f-
20
10
0
Eutrophic
EXPLANATION
t- Total Phosphorus
Clllorophyll a
Secchi
Oligotrophic
1993 1994 1995 1996
YEAR
1997 1998 1999
Surface total phosphorus, chlorophyll a concentrations, Secchi depths, and TSI data for Potter Lake near Mukwonago, Wisconsin.
118

423246088175800 POWERS LAKE AT POWERS LAKE, WI
LOCATION.--Lat 42°32'46", long 88°17'58", in NW 1/4 SE 1/4 sec.13, T.I N., R.18 E., Walworth County, Hydrologic Unit 07120006, at PowersLake.
DRAINAGE AREA.--3.42 mi2 .PERIOD OF RECORD.-March 1986 to August 1996, and April 1998 to current year. REMARKS. Lake sampled near center at the deep hole. Lake ice-covered during February sampling. Water-quality analyses done by Wisconsin
State Laboratory of Hygiene.WATER-QUALITY DATA, FEBRUARY 19 TO AUGUST 04, 1999
(Milligrams per liter unless otherwise indicated)
Feb-19 Apr-14 Jun-10 Jul-7 Aug-4
Lake stage (ft)Secchi-depth (m)Chlorophyll a, phytoplankton (nq/L)Depth of sample (m)Water temoerature (°C)Specific conductance (nS/cm)pH (units)Dissolved oxygen (mg/L)Phosphorus, total (as P)Phosphorus, ortho, dissolved (as P)Nitrogen, N02 + N03, diss. (as N)Nitrogen, ammonia, dissolved (as N)Nitrogen, amm. + org., total (as N)Nitrogen, total (as N)Color (Pt-Co. scale)Turbidity (NTU)Hardness, (as CaC03 )Calcium, dissolved (Ca)Magnesium, dissolved (Mg)Sodium, dissolved (Na)Potassium, dissolved (K)Alkalinity, (as CaC03 )Sulfate, dissolved (S04 )Chloride, dissolved (Cl)Silica, dissolved (Si02 )Solids, dissolved, at 180°CIron, dissolved (Fe) nq/LManganese, dissolved (Mn)
10.----
0.54.94157.818.60.011___________________________________________________
13--
9.03.85187.915.10.009___________________________________________________
1062.
0.511.95078.210.70.010<0.0020.070.0370.60.67
50.52203631172.318331385.8282
.00
.157
10.09.45118.19.4
0.013___________________________________________________
1032.
0.525.64828.29.2
0.012___________________________________________________
.23
.177
10.013.75287.50.6
0.024________________________________.__-__-____________
10.223.33.12
0.5 10.026 14446 5248.2 7.58.2 0.4
0.013 0.0840.002 ---<0.010 0.016 ---0.58 ---___ ______ ______ _-____ ______ ______ ______ ______ ______ ______ ______ ______ ______ ___
9.831.92.81
0.5 8.027.1 19.3455 4908.1 7.38.1 0.6
0.019 0.024___ ______ ______ ______ ______ ______ ______ ______ ______ ______ ______ ______ ___--- ---___ ______ ______ ______ ___
9.514.65307.20.0
0.061____________________________________---____________
1.9
2-19-99 4-14-99 6-10-99 7-07-99 8-04-99
0
& 13« , s 4
K 6fc U0 8
10
10 15 20
10 20 30
DISSOLVED OXYGEN (D.O.), IN MILLIGRAMS PER LITER10 15 20
.... I ....
W.T. ;
-
,,,..,,
-
D.O.
. 1 . , . L
0 10 15 20 0
10
10 15 20
10 20 30 0 10 20 30 0 10 20
WATER TEMPERATURE (W.T.), IN DEGREES CELSIUS
30
10 15 20
1010 20 30
PH, IN STANDARD UNITS
0
5/3 2
H
H 4zX 6fc U Q 8
10 4(
7891
-!. -
/
\;
i iK) 450 500 550 6C
0 0
2
4
6
8
10 0 4(
7891
- pH
-
-
_
-
B.C.
X) 450 500 550 6C
Q 0
2
4
6
8
10 0 4(
7891
_
-
!/;'.
\
)0 450 500 550 6C
0 0
2
4
6
8
10 >0 4(
7891
_
-
_
-
"ft, /)0 450 500 550 6C
0 0
2
4
6
8
10 >0 4(
7 8 9 1(
\-
A :i i i
)0 450 500 550 60
SPECIFIC CONDUCTANCE (S.C.), IN MICROSIEMENS PER CENTIMETER AT 25 DEGREES CELSIUS
119

0.06
0.04
0.02
*
*o
1986 1987 1988 1989 1990 1991 1992 1993 1994 1995 1996 1997 1998 1999
£510
5 s 5oS
00
1986 1987 1988 1989 1990 1991 1992 1993 1994 1995 1996 1997 1998 1999
U 6
MM II HIM
1986 1987 1988 1989 1990 1991 1992 1993 1994 1995 1996 1997 1998 1999
1UU
90
80XQ 70
W 60
<en ^U H 40&pj 30
20
10
0
EXPLANATION-
Total Phosphorus
-Q- Chlorophyll a
* Secchi
J^ ' ^ v, fc
oJR? nll(P> JD 5"_^L % ' x _T§
X : x~~X
-
-
IMMIMIM Illllllllll Illllll
1986 1987 198$
III Illllllllll Illllllllll Illllllllll Illllllllll MIMMIMI Illllllllll Illllllllll IMMIMIM Illllllllll IIIIIMIIII Illllllllll
-
Eutrophic
~
Mesotrophicj_ V \ X* /T> - ^ ) .. . \ 2£.. ^ ^~ ^ jk. "* liit---u_. - onT ^^_ ~* yJL "y- -^^- ' -.. pi^:-.. **'' -. P^-^l$^*&^ ___ l'li-^_*xirQ^__
O ^< ' x 5?
Oligotrophic-
Ml MMIMMII Illllllllll Illllllllll Illllllllll Illllllllll Illllllllll Illllllllll MllliMIII Illllllllll Illllllllll IIIIIIMIIJ
$ 1989 1990 1991 1992 1993 1994 1995 1996 1997 1998 1999
YEAR
Surface total phosphorus, chlorophyll a concentrations, Secchi depths, and TSI data for Powers Lake at Powers Lake, Wisconsin.
(Circles on the first three plots indicate laboratory detection limit for selected analyses. Actual concentrations for these particular analyses are less than the plotted circles.)
120

05334000 SHELL LAKE AT SHELL LAKE, WI
LOCATION-Lat 45°44'46", long 91°55'00", in NE 1/4 sec.25, T.38 N., R.13 W., Washburn County, Hydrologic Unit 07030001, 500 ft east of Peterson Boat Factory in the village of Shell Lake.
DRAINAGE AREA.--26.0 mi2 . Area of Shell Lake, 3,200 acres.
PERIOD OF RECORD.-August 1936 to September 1999.
REVISED RECORD.--WDR WI-80-1: Drainage area.
GAGE.-Nonrecording gage. Datum of gage is 1,215.88 ft ft, National Geodetic Vertical Datum of 1929. May 3, 1952 to Apr. 21, 1961, 2.3 mi southeast of village of Shell Lake at same datum.
REMARKS.-Stage measured on the west side of lake intermittently by an observer from 1936 to 1998. In 1998-99 water year, stage was continuously measured during non-freezing periods.
EXTREMES FOR PERIOD OF RECORD.-Maximum gage height observed, 6.31 ft, June 27, 1998; minimum observed, -0.92 ft, Nov. 28, 1949.
EXTREMES FOR CURRENT PERIOD.-1998 water year: Maximum gage height observed, 6.31, June 27; minimum observed, 5.32 ft, Sept. 24. 1999 water year: Maximum gage height observed, 5.34, Oct. 1; minimum observed, 3.40 ft, Sept. 29, 30.
GAGE HEIGHT, FEET, WATER YEAR OCTOBER 1997 TO SEPTEMBER 1998
DAILY MEAN VALUE
DAY OCT NOV DEC JAN FEE MAR APR MAY JUN JUL AUG SEP
1 --- --- 6.22 6.24 5.79 5.702 6.28 6.22 6.24 5.77 5.683 --- 6.20 6.23 5.78 5.674 6.18 6.21 5.78 5.645 --- --- 6.18 6.16 6.19 5.77 5.62
6 5.90 6.17 6.14 6.21 5.77 5.617 6.17 6.13 6.22 5.77 5.598 6.16 6.12 6.21 5.79 5.579 6.15 6.11 6.20 5.78 5.55
10 --- - --- 6.34 6.14 6.10 6.19 5.76 5.53
11 6.13 6.11 6.18 5.74 5.5012 5.67 6.12 6.14 6.16 5.72 5.5013 5.96 6.12 6.14 6.15 5.71 5.4914 --- 6.11 6.13 6.14 5.69 5.4815 6.12 6.13 6.17 5.67 5.47
16 6.16 6.12 6.15 5.65 5.4517 5.65 --- 6.15 6.11 6.13 5.83 5.4418 --- 6.16 6.14 6.11 5.83 5.4219 6.22 6.21 6.09 5.80 5.4120 5.84 5.79 6.38 6.21 6.24 6.07 5.83 5.41
21 6.20 6.25 6.05 5.82 5.3822 5.78 --- 6.18 6.23 6.03 5.83 5.3723 --- 6.16 6.22 5.99 5.85 5.3424 6.14 6.23 5.95 5.84 5.3225 6.12 6.26 5.93 5.82 5.34
26 6.12 6.26 5.91 5.80 5.4027 6.30 6.11 6.31 5.90 5.79 5.3928 5.72 6.10 6.29 5.88 5.78 5.3829 6.09 6.27 5.85 5.76 5.3630 6.14 6.25 5.82 5.74 5.3631 6.25 5.80 5.72
TOTAL --- --- --- 185.62 188.60 178.98 164.37MEAN --- --- --- 6.19 6.08 5.77 5.48MAX --- 6.31 6.24 5.85 5.70MIN --- --- --- 6.10 5.80 5.65 5.32
121

05334000 SHELL LAKE AT SHELL LAKE, WI--CONTINUED
GAGE HEIGHT, FEET, WATER YEAR OCTOBER 1998 TO SEPTEMBER 1999 DAILY MEAN VALUES
OCT NOV
12345
6789
10
1112131415
1617181920
2122232425
262728293031
TOTALMEANMAXMIN
55555
55555
55555
55555
5.5.5.55,
5.55,55.5
16355.5.
.34
.32
.30
.28
.27
.30
.29
.28
.26
.25
.24
.23
.22
.21
.18
.21
.31
.33
.32
.31
.31
.29
.27
.26
.27
.26
.26
.26
.25
.25
.25
.38
.27
.34
.18
55555
55555
55555
55555
55555
55555
155555
.23
.22
.21
.19
.19
.18
.17
.16
.15
.20
.21
.21
.20
.19
.18
.18
.17
.19
.21
.21
.21
.20
.20
.20
.20
.20
.20
.19
.19
.19___
.83
.19
.23
.15
5.195.185.185.185.24
5.245.245.235.225.22
5.21____________
___________---
______--___
_________________
__________-_
JAN
5.19
5.20
5.20
5.23
5.26
FEE JUN AUG SEP
4.4.4.4.4.
4.4.4.4.4.
4.4.4.4.4.
4.4.4.4.4.
4.4.4.4.4.
4.4.4.---
131.4.4.4.
7877777676
7575747373
7272717170
6969686867
6766656564
646363-_----
68707863
44444
44444.
4.44.44
4.44,44,
4,44.4,4.
4,4.4.4,4.4.
140.4.4,4.
.62
.61
.61
.60
.60
.59
.59
.58
.57
.57
.56
.56
.55
.55
.54
.53
.53
.52
.52
.51
.50
.50
.49
.49
.48
.48
.47
.46
.46
.45
.45
.54
.53,62.45
44444
44444
44444
44444
44444
44444
130444
.44
.44
.43
.42
.42
.41
.41
.40
.40
.39
.38
.38
.37
.37
.36
.36
.35
.34
.34
.33
.33
.32
.32
.31
.30
.30
.29
.29
.28
.28---
.76
.36
.44
.28
444.44
4.4.4,4,4.
4.4,4,4.4.
4.4.4.4.4.
4.4.4.4,4.
4.4,4.4.4.4,
129.4.4.4.
.27
.26
.26
.25
.25
.24
.24
.23
.22
.22
.21
.21
.20
.19
.19
.18
.18
.17
.17
.16
.15
.15
.14
.14
.13
,13,12.11.11,10.10
.68,18,27,10
44444
44444
44444
44333
33333
33333
120443
.09
.09
.08
.07
.07
.06
.06
.05
.05
.04
.03
.03
.02
.02
.01
.01
.00
.99
.99
.98
.98
.97
.97
.96
.95
.95
.94
.94
.93
.93---
.26
.01
.09
.93
33333.
3,33,33,
3.3.3,3.3,
3,3,3,3.3,
3.3,3,3,3.
3,3,3.3,3.3,
118,3.3.3.
.92
.91
.91
.90
.90
.89
.88
.88
.87
.87
.86
.86
.85
.84
.84
.83
.83
.82
.82
.81
.80
.80
.79
.79
.78
.78
.77
.76
.76
.75
.75
.82,83.92.75
3.743.743.733.723.72
3.713.713.703.703.69
3.683.683.673.673.66
3.663.653.643.643.63
3.633.623.613.613.60
3.603.593.593.583.573.57
113.313.663.743.57
33333
33333
33333
33333
33333
33333
104333
.56
.56
.55
.55
.54
.53
.53
.52
.52
.51
.51
.50
.49
.49
.48
.48
.47
.47
.46
.45
.45
.44
.44
.43
.43
.42
.41
.41
.40
.40---
.40
.48
.56
.40
122

423153088184800 TOMBEAU LAKE NEAR POWERS LAKE, WI
LOCATION.--Lat 42°31 1 53", long 88°18'48", in SE 1/4 NE 1/4 sec.24, T.I N., R. 18 E., Walworth County, Hydrologic Unit 07120006,1.5 mi south west of Powers Lake.
PERIOD OF RECORD.-May 1998 to current year. REMARKS.-Lake sampled near center at deep hole. Water-quality analyses done by Wisconsin State Laboratory of Hygiene.
WATER-QUALITY DATA, APRIL 15 TO AUGUST 04, 1999(Milligrams per liter unless otherwise indicated)
Apr-15 Aug-4
Lake stage (ft)Secchi-depth (m)Chlorophyll a, phytoplankton (iig/L)Depth of sample (m)Water temoerature (°C)Specific conductance (iiS/cm)pH (units)Dissolved oxygen (mg/L)Phosphorus, total (as P)Phosphorus, ortho, dissolved (as P)Nitrogen, N02 + N03, diss. (as N)Nitrogen, ammonia, dissolved (as N)Nitrogen, amm. + org., total (as N)Nitrogen, total (as N)Color (Pt-Co. scale)Turbidity (NTU)Hardness, (as CaC03 )Calcium, dissolved (Ca)Magnesium, dissolved (Mg)Sodium, dissolved (Na)Potassium, dissolved (K)Alkalinity, (as CaC0 3 )Sulfate, dissolved (S04 )Chloride, dissolved (Cl)Silica, dissolved (Si0 2 )Solids, dissolved, at 180°CIron, dissolved (Fe) ng/LManganese, dissolved (Mn)
8252.6.
0.511.66378.212.10.0280.0021.220.0530.842 .1151.22805634162.523042416.8358
.09.446
8.07.16477.64.6
0.101____________________________________-______________
826.262.34 .94
0.5 8.027 .8 8.1563 6688.2 7.89.5 0.7
0.021 0.014___ ______ ______ ______ _-____ ______ ______ ______ ______ ______ ______ ______ ______ ______ ______ ______ ______ ___
8251.6.
0.527.85298.39.8
0.0250.0030.2830.0190.821.1_________________________________---
.65.772
8.58.06727.30.4
0.024________________________________________________---
825.712.36.00
0.5 6.027.2 9.9542 5908.3 7.410.8 0.10.024 0.029___ ______ ______ ______ ______ ______ ______ ______ ______ ______ ______ ______ ______ ______ ______ ___--- ------ ---
8.08.26557.10.0
0.147__________________________________________---------
3.6
04-15-99
10
6-10-99 7-07-99 8-04-99
DISSOLVED OXYGEN (D.O.), IN MILLIGRAMS PER LITER
20
D.O.
10 20 30
0
10 l-LJ-0
10 20 00
10 20 30 0
10 20
10 20 30 10 20 30
WATER TEMPERATURE (W.T.), IN DEGREES CELSIUS
10
S.C. pH
10
PH, IN STANDARD UNITS
8 10 10
10
10
10500 600 700 800 500 600 700 800 500 600 700 800 500 600 700 800
SPECIFIC CONDUCTANCE (S.C.), IN MICROSIEMENS PER CENTIMETER AT 25 DEGREES CELSIUS
123

0.030
« 0.025B
« 0.020
< 0.015
O
^ 0.010S z
0.005
JFMAMJ JASONDJFMAMJ JASOND 1998 1999
20
O H M
10
s
JFMAMJ J ASOND JFMAMJ J ASOND 1998 1999
P 1
I 2;
S I,
JFMAMJ J ASOND 1998
JFMAMJ JASOND 1999
XSzUH
VI
y£of-1
100
90
80
70
60
50
40
30
20
10
0
-
_
-
-
-
-
i i i i
^
Mesotrophic *
EXPLANATION
B Total Phosphorus
0- Chlorophyll a
*< Secchi
J F M A M
1111111 i i i i i i i i i i i
-
Eutrophic
-
-
-^ y^\m * -~ Jt^jfc^-"\^"/ \^^^ ................... --3*^ jji-^-*^?
-
Oligotrophic
JJASONDJFMAMJ JASOND 1998 1999
YEAR
Surface total phosphorus, chlorophyll a concentrations, Secchi depths, and TSI data for Tombeau Lake near Powers Lake, Wisconsin.
124

461321091520900 WHITEFISH LAKE, NORTH SITE, NEAR GORDON, WI
LOCATION.--Lat 46°13'21", long 91°52'09", in NW 1/4 SE 1/4 sec.9, T.43 N., R. 12 W., Douglas County, Hydrologic Unit 07030002, near Gor don.
PERIOD OF RECORD.-March 1998 to current year.REMARKS.-Lake sampled at deepest part of northern basin. Lake ice-covered during March sampling. Water-quality analyses done by Wis
consin State Laboratory of Hygiene.
WATER-QUALITY DATA, MARCH 03 TO AUGUST 16, 1999 (Milligrams per liter unless otherwise indicated)
Lake stage (ft)Secchi-depth (m)Chlorophyll a, phvtoplankton (ucr/L)Depth of sample (m)Water temperature (°C)Specific conductance (uS/cm)pH (units)Dissolved oxygen (mg/L)Phosphorus, total (as P)
Mar-3 Apr-14 Jun-2 Jul-14 Aug-16
_________0.50.6417.413.6
<0.005
4.819.10.530.57.2386.913.0
<0.005
4.758.61.810.516.4387.89.4
<0.005
5.086.41.250.523.5398.18.7
<0.005
5.416.90.74
0.5 16.022.0 12.437 647.7 6.68.8 0.1
<0.005 0.044
10§12
14
16
3-03-99
10 15 20
4-14-99 6-02-99 7-14-99
10
0
2 on
S 6
g 8
H" 10
§12
14
16
20
\ s.c.
30
10
0 25 50 75 100
DISSOLVED OXYGEN (D.O.), IN MILLIGRAMS PER LITER10 15 20
u
2
4
6
10
12
14
if.
- :^ '-
---,,,,!,,,,
-
-
-
-
-
-
1 , , , ,
10 20 30
0 10 15 20
0 10 20 30
0 10 15 20
0 10 20
WATER TEMPERATURE (W.T.), IN DEGREES CELSIUS
PH, IN STANDARD UNITS
u
2
4
6
10
12
14
\f.
-
-
-
-
-
-
-
-
-
-
-
-
i i i
10
0 25 50 75 100
10
0 25 50 75 100
30
10
0 25 50 75 100
8-16-99
10 15 20u
2
4
6
10
12
14
\f,
-
-
-
S, . , i 1 i
-
-
-
..- '
;'
:, , , 1 1 1 1 ,
10 20 30
10
25 50 75 100
SPECIFIC CONDUCTANCE (S.C.), IN MICROSIEMENS PER CENTIMETER AT 25 DEGREES CELSIUS
125

0.020
< -,
H£Z t 0.015a ju a. z a O a. U oo
o.oioO O
0.005 o ooo oo
I i i
JFMAMJ JASONDJFMAMJ JASOND1998 1999
15
0 SI 1u
JFMAMJ JASONDJFMAMJ JASOND 1998 1999
g 6
10JFMAMJ JASONDJFMAMJ JASOND
1998 1999
TE INDEX
U
na.
1UU
90
80
70
60
50
40
30
20
10
0
-
-
J
i i i i
EXPLANATION
B Total Phosphorus
Q- Chlorophyll a
* Secchi
Cr**rrC^
l 1 1 l
F M A M
111111 i i i i i i i i i i i
Eutrophic
_ _.«__«.. - - .«- Mesotrophic
1rN> * _^^^~~~~^^e
Oligotrophic
J J ASONDJFMAMJ JASOND1998 1999
YEAR
Surface total phosphorus, chlorophyll a concentrations, Secchi depths, and TSI data for Whitefish Lake, North Site, near Gordon, Wisconsin.
(Circles on the first three plots indicate laboratory detection limit for selected analyses. Actual concentrations for these particular analyses are less than the plotted circles.)
126

461212091523200 WHITEFISH LAKE, SOUTH BASIN, NEAR GORDON, WI
LOCATION.--Lat 46°12'12", long 91°52'32", in SE 1/4 SW 1/4 sec. 16, T.43 N., R.12 W., Douglas County, Hydrologic Unit 07030002, near Gordon.
PERIOD OF RECORD.-March 1998 to current year.REMARKS.-Lake sampled at deepest part of southern basin. Lake ice-covered during March sampling. Water-quality analyses done by Wis
consin State Laboratory of Hygiene.
WATER-QUALITY DATA, MARCH 03 TO AUGUST 16, 1999 (Milligrams per liter unless otherwise indicated)
Mar-3 Apr-14 Jun-2 Jul-14 Aug-16
Lake stage (ft)Secchi-depth (m)Chlorophyll a, phytoplankton (ng/L)Depth of sample (m)Water temperature (°C)Specific conductance (nS/cm)pH (units)Dissolved oxygen (mg/L)Phosphorus, total (as P)Phosphorus, ortho, dissolved (as P)Nitrogen, N02 + H03, diss. (as N)Nitrogen, ammonia, dissolved (as N)Nitrogen, amm. + org., total (as N)Nitrogen, total [as N)Color (Pt-Co. sccile)Turbidity (NTU)Hardness, (as CaC0 3 )Calcium, dissolved (Ca)Magnesium, dissolved (Mg)Sodium, dissolved (Na)Potassium, dissolved (K)Alkalinity, (as CaC0 3 )Sulfate, dissolved (S0 4 )Chloride, dissolved (Cl)Silica, dissolved (Si02 )Solids, dissolved, at 180°CIron, dissolved (Fe) ng/LManganese, dissolved (Mn) ng/L
3-03-99
_________
0.5 28.00.4 3.842 667.1 6.614. 6 0.7
<0.005 0.149___ ______ ______ ______ ______ ______ ______ -_____ __-___ ______ ______ ______ -_____ ______ ______ ._____ ______ ______ ______ ___
4 . 819.20 .49
0.5 27.06.7 4.237 ---6.8 6.612.6 10.70.005 0.0110.004 ---0.045 ---0.03 ---0.29 ---0.34 ---<5 ---0.7 ---185
1.3 ---0.93 ---0.618 ---
<2.0 ---0.50.928 ---305.7
4.75 5.089.7 7.31.43 0.64
0.5 27. 0 0.5 29.015.8 6.3 23 . 0 6.538 40 39 447.6 6.5 7.9 6.49.2 6.5 8.7 1.1
<0.005 0.011 <0.005 0.210--- --- 0.003 ---
--- <0.010 ------ --- 0.005 ------ --- 0.32 ---___ ___ ___ ______ ___ ___ ______ ___ -__ ______ ___ ___ ____._ ___ ___ ______ ___ __- -_____ ___ -__ ______ ___ ___ ______ ___ ___ ______ ___ ___ ______ ___ ___ ______ ___ ___ ______ ___ ___ ______ ___ ___ ___--- --- --- ---
5.416 .30.95
0.5 13 .021.8 12.437 387.8 7.38.6 9.5
<0.005 0.008___ ______ ______ ______ ______ ______ ______ ______ ______ ___--- ---___ ______ ______ ______ ______ ___--- ------ ---___ __-___ -__
29 .06.6496.50. 1
0.041_________---______------------___---___------------------
4-14-99 6-02-99 7-14-99 8-16-99
DISSOLVED OXYGEN (D.O.), IN MILLIGRAMS PER LITER
0
3
2 6e 9I 12
5 15K 18
Q 24
27
30
10 15 20
D.O.
0 10 20 30
10
(0
3
6
9
12
15
18
21
24
27 in
)
-
-
-
-
-
-
-
-
-
5 10 .I i , 1 1 1 1
.,,,,,
15 2
1-
-
-
-
-
-
-
I . i i i10 20 30
10 15 20
10 20 30
0 10 15 20 15 20
10 20
WATER TEMPERATURE (W.T.), IN DEGREES CELSIUS
PH, IN STANDARD UNITS
u
3^ £.C6
J2 9
5 155C 18
Q 24
27in
~ PH
-
-
- ,
-/
-(
1
1
« 1 1--
-
--
s.c. --..
1 1
25 50 75 100
u
3
6
9
12
15
18
21
24
27
in
-
-
-
-
-
-
-
-
-
i
i
i '-
-
-
-
-
-
-
-
-
i i
10
0 25 50 75 100
10
0 25 50 75 100
30
10
10
25 50 75 100
20 30
10
25 50 75 100
SPECIFIC CONDUCTANCE (S.C.), IN MICROSIEMENS PER CENTIMETER AT 25 DEGREES CELSIUS
127

0.020
P S5 fc 0.015w J y «U on c^S
00
0.010
§ !f 0.005D- §
O O O O O
I____I____I____I____I____I____I____I____1_
JFMAMJ JASONDJFMAMJ JASOND 1998 1999
10
i i i i i iJFMAMJ JASONDJFMAMJ JASOND
1998 1999
5 4
10JFMAMJ JASONDJFMAMJ JASOND
1998 1999
uu
90
80
70
60
50
40
30
20
10
0 .
i 1 1 1 1 11 1 1 1 I 1 ' 1 1 -" 1 1 II 1 1 1 1
-
-
~
-
EXPLANATION
B Total Phosphorus
-©- Chlorophyll a
»< Secchi
-
Eutrophic
-
Mesotrophic^<^^~^ ~ ~ ~ ~ " ~ ~ ~ ~^^^^G
Oligotrophic
-
JFMAMJ JASONDJFMAMJ JASOND 1998 1999
YEAR
Surface total phosphorus, chlorophyll a concentrations, Secchi depths, and TSI data for Whitefish Lake, South Site, near Gordon, Wisconsin.
(Circles on the first three plots indicate laboratory detection limit for selected analyses.Actual concentrations for these particular analyses are less than the plotted circles.)128

424608088414800 WHITEWATER LAKE NEAR WHITEWATER, WI
LOCATION.--Lat 42°46'08", long 88°41'48", in NW 1/4 NW 1/4 sec.35, T.4 N., R.15 E., Walworth County, Hydrologic Unit 07090001, at outlet, 5.0 mi southeast of Whitewater and 10.0 mi north of Delavan.
DRAINAGE AREA.--10.9 mi2 , of which 8.5 mi2 is non-contributing.
PERIOD OF RECORD.-November 1990 to current year.
GAGE.-Water-stage recorder. Datum of gage is 861.00 ft above sea level, revised, (Wisconsin Department of Natural Resources).
REMARKS.-No estimated daily gage heights. Records good. Point of zero flow of dam crest is 10.97 ft. Rainfall data published in 1991 under this station number are now stored under station number 424559088420300.
EXTREMES FOR PERIOD OF RECORD.-Maximum gage height, 11.42 ft, June 18, 19, 1996; minimum daily gage height, 8.89 ft, Oct. 2, 3, 1991.
EXTREMES FOR CURRENT YEAR.-Maximum gage height, 11.41 ft, Apr. 24, 25; minimum daily gage height, 10.53 ft, Sept. 25, 26.
GAGE HEIGHT, FEET, WATER YEAR OCTOBER 1998 TO SEPTEMBER 1999
DAILY MEAN VALUES
DAY OCT NOV DEC JAN FEE APR MAY JUN AUG SEP
12345
6789
10
1112131415
1617181920
2122232425
262728293031
MEANMAXMIN
10.9210.9110.9310.9410.94
10.9910.9811.0211.0211.03
11.0411.0411.0211.0211.01
11.0110.9511.0511.0511.07
11.0711.0611.0611.0511.05
11.0511.0611.0611.0611.0611.03
11.0211.0710.91
10.9511.0011.0111.0111.00
11.0011.0010.9410.9311.12
11.1311.1211.1111.1111.11
11.1011.0510.9811.0211.02
11.0111.0511.0511.0511.05
11.0511.0511.0511.0511.07
11.0411.1310.93
11.0711.0811.0811.0811.08
11.0911.1211.1311.1211.11
11.1111.1111.1111.1011.10
11.1011.0911.1011.0811.08
11.0811.0711.0711.0711.07
11.0711.0611.0611.0711.0811.08
11.0911.1311.06
11.0811.0811.0711.0711.07
11.0711.0711.0711.0811.08
11.0811.0811.0811.0811.08
11.0811.0711.0711.0711.07
11.0711.0711.0711.0711.07
11.0711.0711.0711.0611.0511.05
11.0711.0811.05
11.0511.0511.0411.0411.04
11.0411.0511.0511.0811.19
11.2211.2611.2511.2411.23
11.2311.2211.2211.2111.20
11.1911.1811.1711.1711.18
11.1811.1811.18
______
11.1511.2611.04
11.1811.1811.1611.1611.15
11.1711.1611.1611.1711.17
11.1711.1711.1611.1611.16
11.1611.1611.1411.1311.12
11.1211.1111.1111.1011.09
11.0811.0811.0811.0711.0611.07
11.1311.1811.06
11.0611.0611.0911.1411.13
11.1311.1211.1211.1411.19
11.1811.1711.1611.1611.15
11.1611.1511.1411.1311.13
11.1411.2011.3511.3811.36
11.3811.3711.3611.3311.32
11.2011.3811.06
11.2811.3211.2911.2911.27
11.2811.2811.2511.2411.22
11.2111.2311.2211.2011.19
11.1911.2511.2811.2811.26
11.2311.1911.1811.1811.19
11.1711.1611.1511.1411.1411.14
11.2211.3211.14
11.1411.1511.1911.1911.19
11.1911.2111.1911.1711.20
11.2811.2511.3311.3411.30
11.2711.0410.9910.9910.98
10.9810.9710.9710.9710.96
10.9610.9610.9610.9510.95
---
11.1111.3410.95
10.9510.9511.0911.1011.07
11.0511.0511.0511.0411.02
11.0010.9910.9810.9610.91
10.9010.9410.9510.9410.95
10.9510.9510.9810.9710.97
10.9810.9910.9810.9810.9710.97
10.9911.1010.90
10.9510.9210.9010.8810.87
10.8510.8310.8310.8210.82
10.8110.8310.8310.8210.81
10.7910.7810.7810.7810.78
10.7810.7710.7710.7710.76
10.7610.7610.7610.7710.7710.77
10.8110.9510.76
10.7710.7610.7610.7510.73
10.7210.7010.6910.6710.64
10.6310.6210.6110.6010.58
10.5710.5610.5610.5510.57
10.5710.5610.5510.5410.53
10.5310.5510.6710.7110.71
---
10.6310.7710.53
129

424915088083900 WIND LAKE AT WIND LAKE, WI
LOCATION.-Lat 42°49'15", long 88°08'39", in NW 1/4 SW 1/4 sec.9, T.4 N., R.20 E., Racine County, Hydrologic Unit 07120006, at Wind Lake. PERIOD OF RECORD.-February 1985 to current year.REMARKS.-Lake sampled near center at the deep hole. Lake ice-covered during February sampling. Water-quality analyses done by Wisconsin
State Laboratory of Hygiene.
WATER-QUALITY DATA, FEBRUARY 11 TO JUNE 23, 1999 (Milligrams per liter unless otherwise indicated)
Feb-ll Jun-23
Lake stage (ft)Secchi-depth (m)Chlorophyll a, phytoplankton (ng/L)Depth of sample (m)Water temoerature (°C)Specific conductance (nS/cm)pH (units)Dissolved oxygen (mg/L)Phosphorus, total (as P)Phosphorus, ortho, dissolved (as P)Nitrogen, N02 + NOB, diss. (as N)Nitrogen, ammonia, dissolved (as N)Nitrogen, amm. + org., total (as N)Nitrogen, total (as N)Color (Pt-Co. scale)Turbidity (NTU)Hardness, (as CaC03 )Calcium, dissolved (Ca)Magnesium, dissolved (Mg)Sodium, dissolved (Na)Potassium, dissolved (K)Alkalinity, (as CaC0 3 )Sulfate, dissolved (S0 4 )Chloride, dissolved (Cl)Silica, dissolved (Si02 )Solids, dissolved, at 180°CIron, dissolved (Fe) ug/LManganese, dissolved (Mn)
7.23 7.28--- 1.2 10.7
0.5 12.5 0.5 14.54.9 3.1 10.8 10.2605 791 669 6807.7 7.4 8.2 8.213.5 8.1 10.5 9.50.029 0.032
--- <0.002 ---0.31 ---
--- --- 0.122 ------ --- 1.2 ---___ 1.5
204.4250
___ ___ 54 ___28 383.4
___ 191 ___47
___ 78 0.03 ---
392
0.523.55747.88.4
0.030_________________________________-_________________
8.441.79.615.019.75997.21.8
0.036---__________________---____________------_________
14.013.66657.30.4
0.107---__________________---______------------_________
0.7
2-11-99
10 15 20
4-08-99
DISSOLVED OXYGEN (D.O.), IN MILLIGRAMS PER LITER0 5 10 15 20
w fs 6za 9fcwQ 12
W.T.
D.O.
10 20 30
u
3
6
9
12
i <;
i . i i 1 i i .
-
-
-
-
i , , , 1 ii
1111,1.11
-
-
-
-
,,),,..
0 10 20 30 WATER TEMPERATURE (W.T.), IN DEGREES CELSIUS
6-23-99
0 5 10 15 20
10 20 30
10
PH, IN STANDARD UNITS 6 7 8 9 10
1 *z3C 9fc ttiQ 12
15
X S.C.
PH
u
3
6
9
12
1 <C
1
-
-
-
-
, !
1
-
-
-
-
1 1
10
550 600 650 700 750 800 550 600 650 700 750 800 "550 600 650 700 750 800
SPECIFIC CONDUCTANCE (S.C.), IN MICROSIEMENS PER CENTIMETER AT 25 DEGREES CELSIUS
130

424915088083900 WIND LAKE AT WIND LAKE, WI-CONTINUED
WATER-QUALITY DATA, JULY 27 TO AUGUST 25, 1999 (Milligrams per liter unless otherwise indicated)
Jul-27 Aug-25
Lake stage (ft)Secchi-depth (m)Chlorophyll a, phytoplanktonDepth of saitple (m)Water tencerature (°C)Specific conductance (MS/on)pH (units)Dissolved oxygen (mg/L)Phosphorus, total (as P)Phosphorus, ortho, dissolved (as P)Nitrogen, N02 + N03, diss. (as N)Nitrogen, artrtiDnia, dissolved (as N)Nitrogen, arrai. + org., total (as N)
0.528.05728.18.5
0.033
2.027.85718.28.4
0.033
8.13 1.16.007.020.86057.30.0
0.038
11.014.26487.20.0
0.100
15.013.86587.20.0
0.132
0.522.15778.17.6
0.0310.003<0.0100.009i ^
7.021.35857.72.3
0.034
7.81 1.111.010.015.06577.00.0
0.063
12.014.06717.00.0
0.097
14.013.86807.00.0
0.113
7-27-99 8-25-99
DISSOLVED OXYGEN (D.O.), IN MILLIGRAMS PER LITER10 15 20
u
3
6
9
12
i «
-^ // DO / --
W.T.
10 20 30 0
WATER TEMPERATURE (W.T.), IN DEGREES CELCIUS
PH, IN STANDARD UNITS
(0
3
6
9
12
1 ^
j 7
- %
-
-
,
8 9 1
/ pH
-
\
S.C.
, , ,
10 15 20u
3
6
9
12
15
.,.,,..,.,...._,,,,,
-
-x j --
10 20 30
10
550 600 650 700 750 800 550 600 650 700 750 800
SPECIFIC CONDUCTANCE (S.C.), IN MICROSIEMENS PER CENTIMETER AT 25 DEGREES CELCIUS
131

TR
OPH
IC S
TA
TE
IN
DE
XC
HL
OR
OPH
YL
L a
CO
NC
EN
TR
AT
ION
, IN
MIC
RO
GR
AM
S PE
R L
ITE
RT
OT
AL
PH
OSP
HO
RU
S C
ON
CE
NT
RA
TIO
N,
IN M
ILL
IGR
AM
S PE
R L
ITE
R
Is)
8 S
SEC
CH
I D
EPT
H, I
N M
ET
ER
S
Jft % ,
. i
< :
V
*

424848088083100 WIND LAKE OUTLET AT WIND LAKE, WI
LOCATION.~Lat 42°48'48" long 88°08'31", in NE 1/4 NW 1/4 sec.16, T.4 N., R.20 E., Racine County, Hydrologic Unit 07120006, at Wind Lake.
DRAINAGE AREA.-39.6 mi2 .
PERIOD OF RECORD.-March 1985 to current year.
REVISED RECORDS.-WDR WI-91-1: 1988(m).
GAGE.-Water-stage recorder and concrete dam. Datum of gage is 760.30 ft above sea level. Prior to Oct. 2, 1987, nonrecording gage at same site and datum.
REMARKS.--No estimated daily gage heights. Records good. Lake level regulated by dam with two 10-foot gates at outlet. Lake ice-covered Dec. 27 to Mar. 17. Prior to October 1987, published as Wind Lake at Wind Lake, Wis.
EXTREMES FOR PERIOD OF RECORD.-Maximum gage height, 8.93 ft, June 15, 1999; minimum recorded, 5.95 ft, Jan. 2, 1996.
EXTREMES FOR CURRENT YEAR.~Maximum recorded gage height, 8.93 ft, June 15; minimum recorded, 7.07 ft, Mar. 30.
GAGE HEIGHT, FEET, WATER YEAR OCTOBER 1998 TO SEPTEMBER 1999
DAILY MEAN VALUES
OCT NOV DEC JAN FEE MAR AUG SEP
12345
6789
10
1112131415
1617181920
2122232425
262728293031
MEANMAXMIN
8.158.138.158.188.21
8.268.278.258.208.18
8.188.198.218.208.22
8.318.418.418.308.25
8.248.268.288.298.27
8.248.178.168.158.168.17
8.238.418.13
8.198.208.218.218.21
8.208.198.198.198.34
8.338.248.168.158.11
8.048.068.068.088.16
8.188.188.208.208.21
8.228.228.218.198.18 -
8.188.348.04
8.127.987.857.737.60
7.507.457.347.247.18
7.187.177.197.207.21
7.227.237.227.247.24
7.267.237.247.267.27
7.287.307.307.337.347.35
7.368.127.17
7.357.427.517.537.55
7.587.597.617.637.63
7.617.617.617.607.58
7.537.497.447.367.27
7.227.277.407.617.73
7.717.607.527.417.297.29
7.507.737.22
7.337.367.417.427.36
7.297.207.147.137.14
7.237.417.417.347.27
7.227.187.147.147.15
7.197.197.197.147.15
7.177.207.24______
7.247.427.13
7.267.307.357.357.35
7.357.307.277.267.25
7.227.197.177.177.16
7.157.217.287.307.34
7.377.347.317.257.18
7.127.117.107.107.097.09
7.247.377.09
7.127.157.207.267.28
7.307.297.287.447.51
7.487.367.257.197.22
7.407.537.647.747.76
7.797.908.328.518.52
8.468.378.308.218.20
7.678.527.12
8.218.218.208.138.09
8.228.318.338.328.28
8.228.278.318.328.30
8.308.368.298.248.17
8.118.158.238.338.38
8.358.298.258.208.188.18
8.258.388.09
8.228.248.198.228.25
8.298.358.378.388.41
8.478.468.588.828.91
8.918.848.718.558.40
8.298.288.448.488.41
8.328.268.308.348.33---
8.438.918.19
8.348.348.348.348.32
8.308.268.238.228.20
8.188.178.148.128.09
8.088.138.158.158.15
8.158.158.168.168.15
8.148.138.118.088.078.07
8.188.348.07
8.058.017.987.967.94
7.917.907.907.887.89
7.887.877.887.867.83
7.817.817.797.827.81
7.807.797.797.817.81
7.797.787.787.767.737.71
7.858.057.71
7.707.697.687.677.66
7.647.617.607.577.54
7.527.517.527.507.49
7.477.467.457.457.46
7.447.427.417.407.38
7.377.407.667.727.70
7.547.727.37
133

04082500 LAKE WINNEBAGO AT OSHKOSH, WI
LOCATION.-Lat 44°00'35", long 88°31'38", in NE 1/4 NE 1/4 sec.25, T.18 N., R.16 E., Winnebago County, Hydrologic Unit 04030203, at 905 Bay Shore Drive, 800 ft east of mouth of the upper Fox River.
DRAINAGE AREA.-5,880 mi2 , at lake outlet at Menasha Dam. Area of Lake Winnebago, 215 mi2 .
PERIOD OF RECORD.--October 1938 to current year in reports of Geological Survey. Records from 1882 to 1938 in files of Geological Survey and U.S. Army Corps of Engineers. A report on Fox River by U.S. Army Corps of Engineers, published as House Document No. 146, 67th Congress, 2nd session, contains semi-monthly records of inflow of Lake Winnebago for the period 1896-1917.
REVISED RECORD.-WDR WI-83-1: Drainage area.
GAGE.-Water-stage recorder. Nonrecording gage read once daily October 1938 to October 1978. Datum of gage is 745.05 ft above mean tide at New York City (levels by U.S. Army Corps of Engineers). Datum of Deuchman gage is 745.00 ft above mean tide at New York City.
REMARKS.-No estimated daily gage heights. Records good. Lake elevations controlled by dams at Menasha and Neenah, which are oper ated in the interest of navigation. Crests of both dams are at elevation 746.73 ft. Present limits of regulation are from 21 1/4 in. above the crest of Menasha dam to crest during navigation season, plus additional 18 in. below crest during winter. Oshkosh staff gage gives true level of lake, while Deuchman gage readings are affected by loss of head in the channel between lake and dam. Data-collection platform at station.
EXTREMES FOR PERIOD OF RECORD.-Maximum gage height observed, 5.33 ft (Deuchman gage) Nov. 8, 1881; minimum observed, -2.00 ft (Deuchman gage) Nov. 28, 1891.
EXTREMES FOR CURRENT YEAR.-Maximum daily mean gage height, 3.22 ft, July 22; minimum recorded, 1.65 ft, Feb. 11 and Mar. 28.
GAGE HEIGHT, FEET, WATER YEAR OCTOBER 1998 TO SEPTEMBER 1999
DAILY MEAN VALUES
DAY OCT NOV DEC JAN FEE MAR APR MAY JUN JUL AUG SEP
1 2.62 2.79 2.46 2.11 1.85 1.91 1.96 2.63 3.04 2.94 3.04 2.922 2.63 2.82 2.45 2.12 1.83 1.89 1-98 2.63 3.06 2.98 3.03 2.933 2.67 2.75 2.43 2.15 1.81 1.90 2.11 2.62 3.09 3.00 3.01 2.924 2.63 2.69 2.42 2.15 1.80 1.89 2.19 2.62 3.06 3.02 3.01 2.925 2.65 2.69 2.40 2.14 1.77 1.86 2.29 2.61 3.00 3.02 3.03 2.90
6 2.65 2.66 2.38 2.14 1.75 1.85 2.13 2.62 2.99 3.07 3.00 2.917 2.70 2.66 2.40 2.13 1.73 1.84 2.32 2.64 2.95 3.08 2.94 2.898 2.73 2.65 2.36 2.11 1.72 1.84 2.40 2.71 2.98 3.07 2.95 2.839 2.71 2.66 2.35 2.10 1.71 1.82 2.52 2.78 2.97 3.03 2.89 2.82
10 2.73 2.51 2.33 2.09 1.70 1.83 2.50 2.78 2.96 3.07 2.87 2.79
11 2.74 2.57 2.31 2.08 1.72 1.83 2.49 2.78 2.99 3.05 2.89 2.8112 2.69 2.70 2.31 2.08 1.79 1.83 2.52 2.85 2.98 3.01 2.89 2.7613 2.72 2.68 2.30 2.08 1.80 1.83 2.60 2.85 3.01 2.96 2.93 2.7514 2.75 2.66 2.27 2.07 1.82 1.82 2.64 2.83 3.00 2.90 2.95 2.7415 2.74 2.68 2.26 2.05 1.83 1.82 2.67 2.86 2.97 2.89 2.93 2.75
16 2.71 2.69 2.24 2.03 1.85 1.82 2.71 2.87 2.97 2.86 2.89 2.7517 2.74 2.71 2.24 2.03 1.88 1.79 2.67 3.01 2.95 2.91 2.91 2.7418 2.67 2.71 2.20 2.05 1.89 1.84 2.68 3.05 2.93 2.88 2.94 2.7219 2.74 2.55 2.19 2.04 1.88 1.83 2.68 3.12 2.90 2.96 2.96 2.6920 2.75 2.67 2.21 2.02 1.89 1.82 2.66 3.09 2.87 3.05 2.95 2.73
21 2.75 2.66 2.09 1.99 1.89 1.84 2.64 3.08 2.85 3.19 2.97 2.7122 2.74 2.60 2.12 2.00 1.89 1.87 2.71 3.10 2.82 3.22 2.97 2.6823 2.74 2.56 2.15 2.03 1.88 1.85 2.70 3.04 2.82 3.17 2.99 2.7024 2.73 2.61 2.14 2.04 1.88 1.90 2.61 3.08 2.85 3.12 3.01 2.6925 2.75 2.55 2.13 2.03 1.89 1.91 2.60 3.05 2.86 3.09 3.02 2.66
26 2.76 2.56 2.13 2.01 1.88 1.91 2.59 3.04 2.84 3.00 3.02 2.6427 2.77 2.54 2.12 1.98 1.89 1.92 2.60 3.01 2.86 2.97 3.01 2.7328 2.79 2.52 2.12 1.96 1.90 1.89 2.60 3.01 2.95 2.94 3.01 2.7729 2.78 2.50 2.12 1.93 1.91 2.58 3.00 2.95 2.96 3.04 2.7730 2.75 2.43 2.12 1.90 1.95 2.60 2.99 2.93 2.98 2.97 2.7131 2.78 2.12 1.88 1.94 2.97 3.00 2.92
MEAN 2.72 2.63 2.25 2.05 1.83 1.86 2.50 2.88 2.95 3.01 2.97 2.78MAX 2.79 2.82 2.46 2.15 1.90 1.95 2.71 3.12 3.09 3.22 3.04 2.93MIN 2.62 2.43 2.09 1.88 1.70 1.79 1.96 2.61 2.82 2.86 2.87 2.64
134

04084255 LAKE WINNEBAGO NEAR STOCKBRIDGE, WI
LOCATION.~Lat 44°04'17", long 88°19'52", Stockbridge Indian Reservation, Calumet County, Hydrologic Unit 04030203, on east shore of Lake Winnebago, 300 ft south of County Highway E and 1.6 mi west of Stockbridge.
DRAINAGE AREA.--5.880 mi2 , at lake outlet at Menasha Dam. Area of Lake Winnebago, 215 mi2 .
PERIOD OF RECORD.-November 1982 to current year.
GAGE. Water-stage recorder. Datum of gage is 745.05 ft above mean tide of New York City (levels by U. S. Army Corps of Engineers).
REMARKS.-No estimated daily gage heights. Records good. Lake elevations controlled by dams at Menasha and Neenah, which are oper ated in the interest of navigation. Crests of both dams are at elevation 746.73 ft. Present limits of regulation are from 21 1/4 in. above the crest of Menasha dam to crest during navigation season, plus additional 18 in. below crest during winter. Data-collection platform at station.
EXTREMES FOR PERIOD OF RECORD.-Maximum daily mean gage height, 3.85 ft, July 9,11, 1993; minimum observed, 0.30 ft, Mar. 1, 1986.
EXTREMES FOR CURRENT YEAR.~Maximum daily mean gage height, 3.21 ft, July 9; minimum recorded, 1.60 ft, Feb. 8.
GAGE HEIGHT, FEET, WATER YEAR OCTOBER 1998 TO SEPTEMBER 1999
DAILY MEAN VALUES
DAY OCT DEC JAN MAR MAY AUG SEP
12345
6789
10
1112131415
1617181920
2122232425
262728293031
MEANMAXMIN
2.632.582.482.492.48
2.652.722.682.692.70
2.692.742.782.692.65
2.672.732.852.812.79
2.712.732.732.732.71
2.722.742.752.702.722.72
2.692.852.48
2.672.552.572.632.64
2.652.622.622.592.91
2.892.712.662.672.70
2.632.682.632.782.73
2.662.642.652.582.54
2.552.502.482.462.50---
2.642.912.46
2.502.422.392.372.36
2.382.372.382.362.37
2.362.292.262.282.27
2.232.242.172.192.14
2.202.192.112.112.08
2.092.082.082.092.092.08
2.242.502.08
2.072.092.132.112.10
2.102.082.072.062.06
2.042.042.042.022.00
1.991.992.022.001.97
1.951.962.002.001.99
1.961.941.921.891.861.83
2.012.131.83
1.801.791.761.771.73
1.711.691.671.681.66
1.681.771.771.771.79
1.821.841.841.841.85
1.851.841.831.831.85
1.831.851.88______
1.791.881.66
1.871.851.871.841.82
1.811.801.781.771.79
1.801.791.791.781.78
1.771.791.841.781.78
1.821.841.871.841.85
1.871.871.911.951.931.94
1.831.951.77
1.911.932.002.122.15
2.272.322.292.212.33
2.382.542.592.612.61
2.552.612.652.652.63
2.562.402.442-562.57
2.552.462.432.522.57---
2.412.651.91
2.592.592.562.532.49
2.652.802.762.742.69
2.702.682.682.762.81
2.842.993.093.083.06
3.063.033.123.133.11
3.033.002.982.982.972.98
2.853.132.49
2.963.023.043.002.98
2.983.022.972.952.97
3.003.003.002.993.01
2.972.962.942.892.86
2.842.842.862.872.88
2.872.872.923.002.97
2.953.042.84
2.993.013.033.093.13
3.203.173.083.213.18
3.173.153.143.133.06
3.033.033.023.093.07
3.173.193.173.123.06
3.012.952.952.982.973.05
3.083.212.95
3.013.003.013.033.02
2.952.902.852.862.86
2.852.852.862.892.90
2.932.912.862.882.91
2.942.962.942.912.95
2.972.983.002.922.892.88
2.923.032.85
2.882.892.882.872.88
2.872.852.862.892.86
2.752.752.822.792.72
2.692.692.702.692.66
2.652.692.652.622.61
2.642.682.682.742.79___
2.762.892.61
135

WISCONSIN DISTRICT PUBLICATIONS PERTAINING TO LAKES
The reports published in a U.S. Geological Survey series are for sale by the U.S. Geological Survey, Box 25425, Federal Center, Denver, CO 80225. Prepayment is required. Remittance should be sent by check or money order payable to the U.S. Geological Survey. Prices can be obtained by writing to the above address or by calling (303) 236-7476. Reprints of journal articles may be obtained by writing directly to the author at U.S. Geological Survey, 8505 Research Way, Middleton, Wl 53562.
1999
Lathrop, R.C., Carpenter, S.R., and Robertson, D.M., 1999, Summer water clarity responses to phosphorus, Daphnia grazing, and internal mixing in Lake Mendota, Limnology and Ocean ography, Vol. 44 (1), p. 137-146.
Krohelski, J.T., Feinstein, D.T., and Lenz, B.N., 1999, Simulation of stage and hydrologic bidget for Shell Lake, Washburn County, Wisconsin, U.S. Geological Survey Water-Resources Investigations Report 99-4209, 23 p.
Panuska, J.C., and Robertson, D.M., 1999, Estimating phosphorus concentrations following alum treatment using apparent settling velocities, Lakes and Reservoir Management, Vol. 15(1), p. 28-38.
1998
Hunt, R.J, Anderson, M.P., and Kelson, V.A., 1998, Improving a complex finite-difference ground water flow model through the use of an analytic element screening model, Ground Water, Vol. 36, No. 6, p. 1011-1017.
Hunt, R.J, Anderson, M.P., and Kelson, V.A., 1998, Linking an analytic element flow code to MOD- FLOW - Implementation and benefits, p. 477-504 in MODFLOW98: Proceedings of the 3rd International Conference of the International Ground Water Center. Golden, CO: Colorado School of Mines.
Krabbenhoft, D.P., Gilmour, C.C., Benoit, J.M., Babiarz, C.L, Andren, A.W., and Hurley, J.P., 1998, Methyl mercury dyanmics in littoral sediments of a temperate lake, Canadian Journal of Fisheries and Aquatic Sciences, Vol. 55, p. 835-844.
Robertson, D.M., Elder, J.F., Goddard, G.L., and James, W.F., 1998, Dynamics in phosphorus re tention in wetlands upstream of Delavan Lake, Wisconsin, Lakes and Reservoir Management, Vol. 14, No. 4, p. 466-477.
Rose, W.J., and Robertson, D.M., 1998, Hydrology, water quality, and phosphorus loading of Kir- by Lake, Barren County, Wisconsin, U.S. Geological Survey Fact Sheet FS-066-98, 4 p.
Walker, J.F. and Krabbenhoft, D.P., 1998, Groundwater and surface-water interactions in riparian and lake-dominated systems, in Kendall, C. and McDonnell, J.J. eds., Isotope tracers in catch ment hydrology, Elsevier Publishing, New York, 839 P.
1997
Elder, J.F., Manion, B.J., and Goddard, G.L., 1997, Mesocosm experiments to assess factors af fecting phosphorus retention and release in an extended Wisconsin wetland: U.S. Geological Survey Water-Resources Investigations Report 97-4272, 14 p.
Goddard, G.L., and Elder, J.F., 1997, Retention of sediments and nutrients in Jackson Creek Wet land near Delavan Lake, Wisconsin, 1993-95, U.S. Geological Survey Water-Resources In vestigations Report 97-4014, 22 p.
136

Hornewer, N.J., Johnson, G.P., Robertson, D.M. and Hondzo, M., 1997, Field-scale tests for determining mixing patterns associated with coarse-bubble air diffuser configurations, Egan Quarry, Illinois, In: Environmental and Coastal Hydraulics: Protecting the Aquatic Habitat, Proceedings of the International Association of Hydraulic Research, San Francisco, CA, USA, p. 57-63.
Robertson, D.M., 1997, Regionalized loads of sediment and phosphorus to Lakes Michigan and Superior - High flow and long-term average, Journal of Great Lakes Research, Vol. 23, p. 416- 439.
1996
Anderson, W.L., Robertson, D.M., and Magnuson, J.J., 1996, Evidence of recent warming and El Nino-related variation in ice breakup of Wisconsin lakes, Limnology and Oceanography, Vol. 41, p. 815-821.
Elder, J.F. and Goddard, G.L., 1996, Sediment and nutrient trapping efficiency of a constructed wetland near Delavan Lake, Wisconsin, 1993-1995: U.S. Geological Survey Fact Sheet FS- 232-96.
Garn, H.S., Olson, D.L., Seidel, T.L., and Rose, W.J., 1996, Hydrology and water quality of Lau- derdale Lakes, Walworth County, Wisconsin, 1993-94: U.S. Geological Survey Water-Re sources Investigations Report 96-4235, 29 p.
Hunt, R.J. and Krohelski, J.T., 1996, The application of an analytical element model to investigate groundwater-lake interactions at Pretty Lake, Wisconsin, Lake and Reservoir Management, Vol. 12, p. 487-495.
Imberger, J., Robertson, D.M., and Boland, K., 1996, Lake Number: A quantitative indicator of mixing to be used in water quality management. Scientific Impeller, Solna, Sweden, No. 4, p. 9-15.
Kammerer, P.A., Jr., 1996, Hydrology and water quality of Park Lake, Sourth-central Wisconsin: U.S. Geological Survy Fact Sheet FS-197-96.
Robertson, D.M., Field, S.J, Elder, J.F., Goddard, G.L, and James, W.F., 1996, Phosphorus dy namics of Delavan Lake Inlet in southeastern Wisconsin. U.S. Geological Survey Water-Re sources Investigations Report 96-4160, 18 p.
1995
Assel, R.A. and Robertson, D.M. 1995, Changes in winter air temperatures near Lake Michigan during 1851 -1993, as determined from regional lake-ice records, Limnology and Oceanogra phy, v. 40, p 165-176.
Assel, R.A., Robertson, D.M., Hoff, M.H., and Selgeby, J.H., 1995, Climatic-change implications from long-term (1823-1994) ice records near the Laurentian Great Lakes: Annals of Glaciolo- gy, v. 21, p. 383-386.
Krabbenhoft, D.P., and Webster, K.E., 1995, Transient hydrogeological controls on the chemistry of a seepage lake: Water Resources Research, v. 31, no. 9, p. 2295-2305.
Krohelski, J.T. and Batten, W.G., 1995, Simulation of stage and the hydrologic budget of Devils Lake, Sauk County, Wisconsin: U.S. Geological Survey Open-File Report 94-348, 22 p.
Wentz, D.A., Rose, W.J., and Webster, K.E., 1995, Long-term hydrologic and biogeochemical re sponses of a soft water seepage lake in north central Wisconsin: Water Resources Research, v. 31, no. 1, p 199-212.
137

1994
Elder, J.F., 1994, Distribution and grain-size partitioning of metals in bottom sediments of an ex perimentally acidified lake: Water Resources Bulletin, v. 30, no. 2, p. 251-259.
Goddard, G.L., and Field, S.J., 1994, Hydrology and water quality of Whitewater and Rice Lakes in southeastern Wisconsin, 1990-91: U.S. Geological Survey Water-Resources Investigations Report 94-4101,36 p.
Greb, S.R., and Wentz, D.A., 1994, Chemical budgets, in Klepinger, K.E., ed., RILWAS 1983-86: Wisconsin Regional Integrated Lake Watershed Acidification Study, Volume 1: Madison, Wis consin Department of Natural Resources, PUBL-RS-909-94, Chapter 7, 20 p.
Hurley, J.P., Krabbenhoft, D.P., Babiarz, C.L., and Andren, A.W., 1994, Cycling processes of mer cury across sediment/water interfaces in seepage lakes, in Baker, L.A. ed., Environmental Chemistry of Lakes and Reservoirs: Advances in Chemistry Series, American Chemical Soci ety, Washington, D.C., p. 426-449.
Krabbenhoft, D.P., Bowser, C.J., Kendall, C., and Gat, J.R., 1994, Use of oxygen-19 and deuteri um to assess the hydrology of ground-water/lake systems, in Baker, L.A. ed., Environmental Chemistry of Lakes and Reservoirs: Advances in Chemistry Series, American Chemical Soci ety, Washington, D.C., p. 67-90.
Robertson, D.M., Anderson, W., and Magnuson, J.J., 1994, Relations between El Nino/Southern Oscillation events and the climate and ice cover of lakes in Wisconsin. P 48-57, in Greenland, D. ed., El Nino and Long-Term Ecological Research (LTER) Sites: Publication No. 18. LTER Network Office: University of Washington, Seattle, WA, USA., 57 p.
Robertson, D.M. and Imberger, J. 1994, Lake Number, a quantitative indicator of mixing used to estimate changes in dissolved oxygen, Internationale Revue der gesamten Hydrobiologie, v. 79, p. 159-176.
Watras, C.J., Bloom, N.S., Hurley, J.P., Fitzgerald, W.F., Andren, A.W., Krabbenhoft, D.P., and Porcella, D.B., 1994, Sources and fates of mercury and methylmercury in Wisconsin lakes, in Watras and Huckabee eds., Mercury as a Global Pollutant: Intergration and Synthesis, Lewis Pub., Chelsea, ML, p 153-177.
Wentz, D.A., 1994, Chemistry of snowpack and ground water, in Klepinger, K.E., ed., RILWAS 1983-86: Wisconsin Regional Integrated Lake Watershed Acidification Study, Volume 1: Mad ison, Wisconsin Department of Natural Resources, PUBL-RS-909-94, Chapter 6, 45 p.
Wentz, D.A., Krohelski, J.T., and Rose, W.J., 1994, Hydrology, in Klepinger, K.E., ed., RILWAS 1983-86: Wisconsin Regional Integrated Lake Watershed Acidification Study, Volume 1: Mad ison, Wisconsin Department of Natural Resources, PUBL-RS-909-94, Chapter 7, 74 p.
1993
Field, S.J., 1993, Hydrology and water quality of Powers Lake, southeastern Wisconsin: U.S. Geological Survey Water-Resources Investigations Report 90-4126, 36 p.
Field, S.J., 1993, Hydrology and water quality of Wind Lake in southeastern Wisconsin: U.S. Geo logical Survey Water-Resources Investigations Report 91-4107, 61 p.
House, L.B., 1993, Simulation of the effects of hypothetical residential development on water levels in Graber Pond, Middleton, Wisconsin: U.S. Geological Survey Water-Resources Investigations Report 92-4029, 10 p.
138

House, L.B., Waschbusch, R.J., and Hughes, P.E., 1993, Water quality of an urban wet detention pond in Madison, Wisconsin, 1987-88: U.S. Geological Survey Open-File Report 93-172, 57 p.
Hughes, P.E., 1993, Hydrology, water quality, trophic status, and aquatic plants of Fowler Lake, Wisconsin: U.S. Geological Survey Water-Resources Investigations Report 91-4076, 44 p.
Rose, W.J., 1993, Hydrology of Little Rock Lake in Vilas County, north-central Wisconsin: U.S. Geological Survey Water-Resources Investigations Report 93-4139, 22 p.
Rose, W.J., 1993, Water and phosphorus budgets and trophic state, Balsam Lake, northwestern Wisconsin, 1987-1989: U.S. Geological Survey Water-Resources Investigations Report 91-4125, 28 p.
1992
Elder, J.F., Krabbenhoft, D.P, and Walker, J.F., 1992, Water, energy, and biogeochemical bud gets (WEBB) program: Data availability and research at the northern temperate lakes site, Wisconsin: U.S. Geological Survey Open-File Report 92-48, 15 p.
Krabbenhoft, D.P., and Babiarz, C.L., 1992, Role of groundwater transport in aquatic mercury cy cling: Water Resources Research, vol. 28, no. 12, p. 3119-3128.
Krabbenhoft, D.P., and Krohelski, J.T., 1992, Data on water quality, lake sediment, and lake-level fluctuation, St. Croix Indian Reservation, Wisconsin, 1981-87: U.S. Geological Survey Open- File Report 92-26, 53 p.
Robertson, D.M., Ragotzkie, R.A., and Magnuson, J.J. 1992, Lake ice records used to detect his torical and future climatic changes: Climatic Change, v. 21, p. 407-427.
1991
Wentz, D.A., and Rose, W.J., 1991, Hydrology of Lakes Clara and Vandercook in North-Central Wisconsin: U.S. Geological Survey Water-Resources Investigations Report 89-4204, 24 p.
Watras, C.J., Andre, A.W., Bloom, N.S., Fitzgerald, W.F., Hurley, J.P., Krabbenhoft, D.P., Rada, R.G., Wiener, J.G., 1991, Mercury in temperate lakes: a mechanistic field study: Verhandlun- gen Internat. Verein. Limnologie, 24, p. 2199-2202.
Pre-1990
Walker, J.F., Pickard, S.A., and Sonzogni, W.C., 1989 Spreadsheet watershed modeling for non- point-source pollution management in a Wisconsin basin: Water Resources Bulletin, v. 25, no. 1, p. 139-147.
Wentz, D.A., Garrison, P.J., and Bockheim, J.G., 1989, Section 7 Chemical input-output bud gets, in Knauer, D., and Brouwer, S.A., eds., The Wisconsin Regional Integrated Lake-Water shed Acidification Study (RILWAS): 1981-1983: Palo Alto, California, Electric Power Research Institute Report EA-6214, p. 7-1 to 7-30.
Wentz, D.A., and Rose, W.J., 1989, Interrelationships among hydrologic-budget components of a northern Wisconsin seepage lake and implications for acid-deposition modeling: Archives of Environmental Contamination and Toxicology, v. 18, p. 147-155.
Wentz, D.A., Rose, W.J., and Krohelski, J.T., 1989, Section 5 Hydrologic component, in Knauer, D., and Brouwer, S.A., eds., The Wisconsin Regional Integrated Lake-Watershed Acidification Study (RILWAS): 1981-1983: Palo Alto, California, Electric Power Research Institute Report EA-6214, p. 5-1 to 5-77.
139

Field, S.J., and Duerk, M.D., 1988, Hydrology and water quality of Delavan Lake in southeastern Wisconsin: U.S. Geological Survey Water-Resources Investigations Report 87-4168, 61 p.
Krug, W.R., Ostenso, N.A., and Krohelski, J.T., 1988, Prediction of the effects of mine dewatering on four lakes near Crandon, Wisconsin, by use of a water-budget model: U.S. Geological Sur vey Open-File Report 87-471, 63 p.
Wentz, D.A., Krohelski, J.T., Rose, W.J., Bockheim, J.G., Garrison, P.J., Knauer, D.R., and Gold- stein, R.A., 1987, Hydrologic and chemical budgets of Wisconsin lakes, in Perrry, R., Harrison, R.M., Bel, J.N.B., and Lester, J.N., eds., Acid Rain: Scientific and Technical Advances, Selper Ltd., London, p. 309-316.
House, L.B., 1986, Stage fluctuations of Wisconsin Lakes: Wisconsin Geological and Natural His tory Survey Information Circular No. 49, 84 p.
House, L.B., 1984, Effects of urbanization on three ponds in Middleton, Wisconsin: U.S. Geolog ical Survey Water-Resources Investigations Report 84-4051, 17 p.
Krug, W.R., and House, L.B., 1984, Evaluation of alternative reservoir-management practices in the Rock River basin, Wisconsin: U.S. Geological Survey Water-Resources Investigations Report 83-4186, 21 p.
House, L.B., 1981, An assessment of streamflow, water quality, and the effects of construction on impoundment on Bridge Creek at Augusta, Wisconsin: U.S. Geological Survey Water- Resources Investigations Open-File Report 81-1192, 25 p.
Krug, W.R., 1981, Hydrologic effects of proposed changes in management practices, Winnebago Pool, Wisconsin: U.S. Geological Survey Water-Resources Investigations 80-107, 19 p.
Batten, W.G., and Hindall, S.M., 1980, Sediment deposition in the White River Reservoir, north western Wisconsin: U.S. Geological Survey Water-Supply Paper 2069, 30 p.
Novitzki, R.P., and Holmstrom, B.K., 1979, Monthly and annual water budgets of Lake Wingra, Madison, Wisconsin, 1971-77: U.S. Geological Survey Water-Resources Investigations 79-100,31 p.
Rose, W.J., 1977, Hydrologic considerations associated with dredging spring ponds in Wisconsin: U.S. Geological Survey Water-Resources Investigations 77-18, 35 p.
Oakes, E.L., Hendrickson, G.E., and Zuehls, E.E., 1975, Hydrology of the Lake Wingra basin, Dane County, Wisconsin: U.S. Geological Survey Water-Resources Investigations 17-75, 31 p.
Novitzki, R.P., 1971, Hydrologic investigations of Heart Lake, Green Lake County, Wisconsin: U.S. Geological Survey Administrative Report, 9 p.
140