Water for Offshore Oil and Gas Sample Pages
22
Water for Offshore Oil & Gas Opportunities in sulphate removal, produced water treatment & deepwater operations www.globalwaterintel.com A Global Water Intelligence publication
-
Upload
stephen-blackburne -
Category
Documents
-
view
220 -
download
0
description
Type of different water treatment via zones
Transcript of Water for Offshore Oil and Gas Sample Pages

7/18/2019 Water for Offshore Oil and Gas Sample Pages
http://slidepdf.com/reader/full/water-for-offshore-oil-and-gas-sample-pages 1/21
Water for Offshore Oil & GasOpportunities in sulphate removal, produced water treatment & deepwater operations
www.globalwaterintel.com
A Global Water Intelligence publication

7/18/2019 Water for Offshore Oil and Gas Sample Pages
http://slidepdf.com/reader/full/water-for-offshore-oil-and-gas-sample-pages 2/21
GlobalWater Intelligence 1Introduction

7/18/2019 Water for Offshore Oil and Gas Sample Pages
http://slidepdf.com/reader/full/water-for-offshore-oil-and-gas-sample-pages 3/21
1. INTRODUCTION
6 © Global Water Intelligence, 2014. Contact [email protected] for permissions.
The following figure summarises our regional forecast of investment in water treatment for the oil and gasindustry.
Figure 1.7 Capital expenditure on water treatment by region, 2011–2020
$ m i l l i o n
2020201920182017201620152014201320122011
Region ($m) 2011 2012 2013 2014 2015 2016 2017 2018 2019 2020
Source: GWI
1.3.1 Produced water volumes
In Water for Offshore Oil & Gas, we have estimated the total volume of produced water generated from offshore oiland gas production for each region of our forecast. To calculate the future volumes of produced water generatedoffshore, we have analysed how changes in production and the age of fields affect the volume of water extracted. Tothis end, we have collected detailed data describing the volume of oil, gas, and water produced from fields aroundthe world. When data on produced water volumes was unavailable for a particular country, we made an estimatebased on total oil production, date of first production, and water-to-oil ratios (WORs) for similar countries. Whereappropriate we used data on WOR collected for our previous report, Water for Onshore Oil & Gas.
We estimate that the total volume of water that will be produced by the offshore oil and gas industry in 2014 is .Older oil producing regions can be expected to have high produced water volumes and low potential increases,such as the with an estimated produced by the end of 2014.Regions that can expect to see a lot of development over the coming decade, ,will have a higher growth in the volume of water handled.

7/18/2019 Water for Offshore Oil and Gas Sample Pages
http://slidepdf.com/reader/full/water-for-offshore-oil-and-gas-sample-pages 4/21
9
MARKET FORECAST
© Global Water Intelligence, 2014. Contact [email protected] for permissions.
The following figure summarises our forecast for produced water treatment by equipment.
Figure 1.9 Global capital expenditure on produced water treatment equipment, 2011–2020
$ m i l l i o n
2020201920182017201620152014201320122011
Equipment ($m) 2011 2012 2013 2014 2015 2016 2017 2018 2019 2020
Source: GWI
When analysing the market for produced water treatment we have assumed that water that is dischargedoverboard will require a lower, and less expensive, level of treatment than water that is reinjected into thereservoir. Therefore, we have divided our forecast of produced water volumes by the disposal methodsthat are common in each region. Regions where overboard discharge is a more common disposal method,
, will have comparatively lower expenditure on produced water treatmentthan regions where reinjection is more prevalent. The largest regional markets for produced water treatmentare , where treatment systems must beupgraded to cope with ageing oil fields; ; and
.

7/18/2019 Water for Offshore Oil and Gas Sample Pages
http://slidepdf.com/reader/full/water-for-offshore-oil-and-gas-sample-pages 5/21
GlobalWater Intelligence2Water injection

7/18/2019 Water for Offshore Oil and Gas Sample Pages
http://slidepdf.com/reader/full/water-for-offshore-oil-and-gas-sample-pages 6/21
2. WATER INJECTION
14 © Global Water Intelligence, 2014. Contact [email protected] for permissions.
damage to downstream equipment. This can be prevented by biocide treatment of injected seawater to remove thebacteria, but a far more effective method is to use NF to remove the sulphate ions that fuel the process.
2.1.1.1 Regional markets
The use of NF membranes for sulphate removal has so far been limited to installations in the Atlantic Rim. Thedecision to use a membrane-based solution is made according to the reservoir characteristics, concentration of
barium and strontium in formation water, and the cost of well workovers to remove built-up scale. This has madethe deepwater developments the biggest market for these solutions,where the high workover cost and complex subsea architecture make chemical intervention less attractive.
Adoption of NF membranes for sulphate removal in the rest of the worldis . Despite the success of the membranes in the Atlantic, manyoperators will still want to see pilot tests to prove their effectiveness. The first sulphate removal package(SRP) installation in the Persian Gulf is expected to be contracted within the next few years. ZADCO
. A FEED study forSRP has been completed by , and a tender has been issued to find EPC contractors for the project.
The following figure shows the location of installed and planned sulphate removal systems, with the capacity ofcontracted systems in each region.
Figure 2.2 Location of installed and planned sulphate removal systems
Gulf of Mexico
( m3 /d)
Brazil
( m3 /d)
West Africa
( m3 /d)
North Sea
( m3 /d)
Persian Gulf
( m3 /d)
Source: GWI DesalData
7/18/2019 Water for Offshore Oil and Gas Sample Pages
http://slidepdf.com/reader/full/water-for-offshore-oil-and-gas-sample-pages 7/21
17
IMPROVED OIL RECOVERY (IOR)
© Global Water Intelligence, 2014. Contact [email protected] for permissions.
Brazil
When the Roncador field in Brazil was first developed, studies showed that previous developments in the CamposBasin were susceptible to barium sulphate scale. To combat this, sulphate removal systems have been installedon five out of the seven production units in the field, reducing sulphate concentration in the injected seawater to<100 ppm. provided the sulphate removal system to the first FPSO, the FPSO Brasil, in2001. This was the first membrane-based sulphate removal system installed in Brazil.
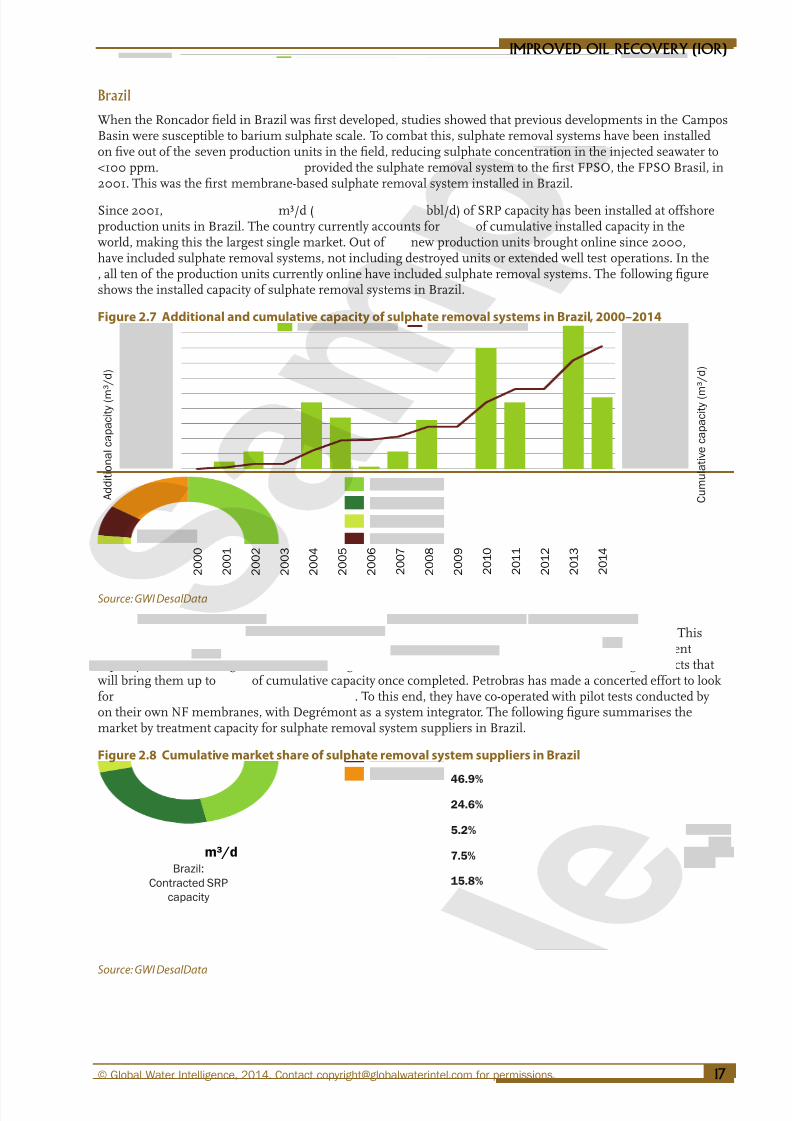
Since 2001, m³/d ( bbl/d) of SRP capacity has been installed at offshoreproduction units in Brazil. The country currently accounts for of cumulative installed capacity in theworld, making this the largest single market. Out of new production units brought online since 2000,have included sulphate removal systems, not including destroyed units or extended well test operations. In the, all ten of the production units currently online have included sulphate removal systems. The following figureshows the installed capacity of sulphate removal systems in Brazil.
Figure 2.7 Additional and cumulative capacity of sulphate removal systems in Brazil, 2000–2014
2 0 1 4
2 0 1 3
2 0 1 2
2 0 1 1
2 0 1 0
2 0 0 9
2 0 0 8
2 0 0 7
2 0 0 6
2 0 0 5
2 0 0 4
2 0 0 3
2 0 0 2
2 0 0 1
2 0 0 0
A d d i t i o n a l c a p a c i t y ( m
³ / d )
C u m u l a t i v e c a p a c i t y ( m
³ / d )
Source: GWI DesalData
Historically has dominated the Brazilian market, with of installed capacity. Thisis also the strongest market for , who have around a quarter of plants by treatmentcapacity. Since 2012, Degrémont has made significant inroads into the Brazilian market, winning contracts thatwill bring them up to of cumulative capacity once completed. Petrobras has made a concerted effort to lookfor . To this end, they have co-operated with pilot tests conducted byon their own NF membranes, with Degrémont as a system integrator. The following figure summarises themarket by treatment capacity for sulphate removal system suppliers in Brazil.
Figure 2.8 Cumulative market share of sulphate removal system suppliers in Brazil
m³/d
Brazil:
Contracted SRP
capacity
46.9%
24.6%
5.2%
7.5%
15.8%
Source: GWI DesalData

7/18/2019 Water for Offshore Oil and Gas Sample Pages
http://slidepdf.com/reader/full/water-for-offshore-oil-and-gas-sample-pages 8/21
2. WATER INJECTION
20 © Global Water Intelligence, 2014. Contact [email protected] for permissions.
The following figure illustrates the market share of the two membrane suppliers for sulphate removal systems.
Figure 2.12 Global cumulative market share of membrane suppliers for sulphate removal
m³/d
Global contracted
SRP capacity
Source: GWI DesalData
is by far the biggest operator
of platforms using sulphate removal systems. This dominance is unlikely to change in the future, particularly as
international oil companies are the main end users for these systems. These companies are more likely to act asoperators in complex and difficult developments, where the financial consequences of failure are greater. The nextthree biggest operators all have producing assets using sulphateremoval in deepwater fields in Angola. is using sulphate removal on the FPSO serving the, with another SRP planned for deepwater project.
The following figure illustrates the biggest end users for sulphate removal systems.
Figure 2.13 Cumulative contracted capacity of sulphate removal systems by operator
m³/d
Global contracted
SRP capacity
53.8%
10.5%
7.3%
4.7%
2.7%
21.0%
Source: GWI DesalData
2.1.1.3 Technology developments
Sulphate removal has become a mature technology, and the treatment trains installed utilise the same basicprocesses. There are still some advances that could be made in improving the sulphate rejection rate of NFmembranes, but most of the variability in this area lies in the pretreatment methods used to remove suspendedsolids:
• The most common method, used on most early installations, is coarse filtration. Dual mediafiltration is more efficient, but it may not be used on platforms where space is at a premium.
• Microfiltration is the most efficient method for suspended solids removal and has a much smallerfootprint, but it is significantly more expensive.
The main factors that will drive the adoption of more expensive solutions such as microfiltration areThis becomes particularly
important on smaller platforms and FPSOs serving marginal fields.

7/18/2019 Water for Offshore Oil and Gas Sample Pages
http://slidepdf.com/reader/full/water-for-offshore-oil-and-gas-sample-pages 9/21
GlobalWater Intelligence3Produced water
treatment

7/18/2019 Water for Offshore Oil and Gas Sample Pages
http://slidepdf.com/reader/full/water-for-offshore-oil-and-gas-sample-pages 10/21
3. PRODUCED WATER TREATMENT
30 © Global Water Intelligence, 2014. Contact [email protected] for permissions.
water from the . However, this is only used to a minimalextent within the industry.
The management of global produced water is shown in the following figure. Overboard discharge is by far themost commonly used method in the global offshore oil and gas industry, and is expected to remain so to 2020. In2013, of global offshore produced water was managed by overboard discharge, while was reinjectedand the remaining was disposed of in onshore deep wells. However, the amount of produced water managedby overboard discharge is predicted to decrease, owing predominantly to the increased use of produced water forreinjection. Onshore disposal will remain minimal.
Figure 3.2 Global offshore produced water management, 2000–2020
m
i l l i o n b b l
0
5,000
10,000
15,000
20,000
20202018201620142012201020082006200420022000
Source: GWI
Overboard discharge clearly dominates produced water management around the world. However, there are somedifferences in management between different regions:
• North Sea: Produced water is predominantly discharged to sea for disposal. Yet in 2013,was utilised for reinjection; the highest proportion of produced water used for
this purpose by any region in the world. The percentage of reinjection undertaken in the NorthSea is expected
• Gulf of Mexico: Overboard discharge has always been the most common method ofproduced water management, with almost all produced water managed in this way. In 2013,
Reinjection in the Gulf of Mexico was estimated to be usedto manage
• Persian Gulf : Overboard discharge dominates as is the case with all regions, butThis method is likely to increase in the Persian Gulf by 2020, particularly due to a
• Caspian Sea: is the predominant produced water management
method in the Caspian Sea region as a whole. However, tightening of regulations in the regionshas resulted in whichis likely to continue to increase. This method is particularly commonin Azerbaijan, of the produced water from itsmanaged in this way in 2013. andalso occurs here, but only to a minimal extent.

7/18/2019 Water for Offshore Oil and Gas Sample Pages
http://slidepdf.com/reader/full/water-for-offshore-oil-and-gas-sample-pages 11/21
GlobalWater Intelligence4Regions:
Part 1

7/18/2019 Water for Offshore Oil and Gas Sample Pages
http://slidepdf.com/reader/full/water-for-offshore-oil-and-gas-sample-pages 12/21
49
BRAZIL
© Global Water Intelligence, 2014. Contact [email protected] for permissions.
Figure 4.11 Production facilities operated by Petrobras offshore in Brazil, by start up year
Field Unit type
Production
facility name
Start up
year
Crude Oil
nominal
capacity (bbl/d)
Gas nominal
capacity
(mmcf/d)
Water
depth
(metres) Basin
Semi-
Submersible
2013 180,000 211.9 1,790 Campos
FPSO 2013 140,000 35.3 1,170 Campos
FPSO 2013 120,000 176.6 2,141 Santos
FPSO 2013 120,000 176.6 2,200 Santos
FPSO 2013 80,000 70.6 200 Santos
FPSO 2014 180,000 211.9 1,550 Campos
FPSO 2014 180,000 211.9 1,400 Campos
FPSO 2014 150,000 211.9 2,100 Santos
FPSO 2014 150,000 282.5 2,100 Santos
TLWP 2014 0 0 1,180 Campos
FPSO 2015 150,000 282.5 2,100 Santos
FPSO 2016 150,000 211.9 2,100 Santos
FPSO 2016 150,000 211.9 2,100 Santos
FPSO 2016 150,000 211.9 2,100 Santos
FPSO 2016 150,000 247.2 2,100 Santos
FPSO 2016 150,000 211.9 2,100 Santos
FPSO 2016 150,000 247.2 2,100 Santos
FPSO 2016 100,000 176.6 2,100 Santos
FPSO 2017 150,000 211.9 2,100 Santos
FPSO 2017 150,000 211.9 2,100 Santos
FPSO 2017 150,000 247.2 2,100 Santos
FPSO 2017 150,000 211.9 2,100 Santos
FPSO 2017 150,000 247.2 2,100 Santos
FPSO 2017 120,000 120 1,000 Campos
FPSO 2018 150,000 211.9 2,100 Santos
FPSO 2018 150,000 211.9 2,100 Santos
FPSO 2018 150,000 282.5 2,100 Santos
FPSO 2018 150,000 211.9 2,100 Santos
To be bid 2018 - - - Campos
To be bid 2018 - - - -
To be bid 2018 - - - -
To be bid 2018 - - - Campos
To be bid 2018 - - - Campos
Source: Petrobras, 2014b

7/18/2019 Water for Offshore Oil and Gas Sample Pages
http://slidepdf.com/reader/full/water-for-offshore-oil-and-gas-sample-pages 13/21
4. REGIONS: PART 1
58 © Global Water Intelligence, 2014. Contact [email protected] for permissions.
4.2.3 Main E&P companies
The North Sea’s top oil and gas operators in 2013 can be seen in the following figures.is by far the largest producer of both gas and oil, accounting for of oil productionand of gas production.
The remainder of their operations take place in the UKCS.
Figure 4.22 Top oil and gas operators in the North Sea, 2013
44.81%
North Sea
top gas operators
(2013)
16.57%
5.76%
5.38%
3.45%
24.03%
40.83%
North Sea
top oil operators
(2013)
8.80%
7.70%
6.14%
7.77%
28.76%
Source: GWI
4.2.4 Reserves and exploration
Despite the production decline, the North Sea still has significant reserves that are yet to be exploited. The oil andgas reserves for the North Sea regions between 1980 and 2014 can be seen in the following figures. In 2014, totaloil and gas reserves equalled and respectively.
Norway has the largest oil and gas reserves in Europe. These are all located on theNorwegian Continental Shelf (NCS), of which the North Sea region is the largestproducer. , if the current rate of drilling continues, itwill take over to explore and exploit the reserves on theUKCS alone. Therefore, if managed correctly, the North Sea could continue its offshore oil and gas production forseveral more decades.
Figure 4.23 Estimated North Sea oil reserves, 1980–2014
b i l l i o n b
b l
0
5,000
10,000
15,000
20,000
25,000
201420102006200219981994199019861982

7/18/2019 Water for Offshore Oil and Gas Sample Pages
http://slidepdf.com/reader/full/water-for-offshore-oil-and-gas-sample-pages 14/21
67
GULF OF MEXICO
© Global Water Intelligence, 2014. Contact [email protected] for permissions.
Figure 4.36 WOR in the Gulf of Mexico by well depth, 1996–2013
0.0
0.5
1.0
1.5
2.0
2.5
3.0
3.5
4.0
4.5
201320112009200720052003200119991997
Source: BSE, 2014
The majority of produced water from offshore production in the Gulf of Mexico is discharged into the sea. In 2013,this method accounted for of produced water generated, with the rest being transferred away from theproduction platform. The following figure shows the disposal methods used for produced water in 2013.
Figure 4.37 Produced water disposal methods on the Gulf of Mexico OCS, 2013
Produced water
disposal methods,Gulf of Mexico
(2013)
Source: BOEM, 2014
4.3.1.3 Major E&P companies
Over the last seven years the largest producers by total oil production (crude andcondensate)rounding out the top four spots annually (see the following figures).
the largest cumulativeoperator by production volume in the GOM. iscurrently the largest operator in the Gulf of Mexico.

7/18/2019 Water for Offshore Oil and Gas Sample Pages
http://slidepdf.com/reader/full/water-for-offshore-oil-and-gas-sample-pages 15/21
GlobalWater Intelligence5Regions:
Part 2

7/18/2019 Water for Offshore Oil and Gas Sample Pages
http://slidepdf.com/reader/full/water-for-offshore-oil-and-gas-sample-pages 16/21
83
WEST AFRICA
© Global Water Intelligence, 2014. Contact [email protected] for permissions.
The following figure shows the location of new offshore oil and gas installations off the coast of West Africa since2000.
Figure 5.4 Map of offshore oil and gas installations in West Africa since 2000
Installation
Oil/gas field
Ocean depth
Maritime boundary
Angola
GhanaNigeria
Republic of
Congo
Equatorial
Guinea
Source: Infield Systems, 2014; PRIO, 2014; GWI
5.1.2 Major E&P operators
Exploration and production (E&P) in offshore West Africa is made up of
The national governments of these nations typically have a stake in all the fields underproduction through their national oil companies. The government stake in these ventures can range from a 5%production interest, to a majority stake, and operatorship of the project. The national oil companies in the regionare as follows:
• Angola: Sonangol
• Nigeria: Nigerian National Petroleum Corporation (NNPC)
• Ghana: Ghana National Petroleum Corporation (GNPC)
• Equatorial Guinea: Government of Equatorial Guinea
• Republic of Congo: Société Nationale des Pétroles du Congo (SNPC)

7/18/2019 Water for Offshore Oil and Gas Sample Pages
http://slidepdf.com/reader/full/water-for-offshore-oil-and-gas-sample-pages 17/21
99
CASPIAN SEA
© Global Water Intelligence, 2014. Contact [email protected] for permissions.
Figure 5.26 Produced water volumes from fields, 2008–2013
m i l l i o n b b l
0
1
2
3
4
5
201320122011201020092008
Source: BP, 2008-2013
These increased produced water volumes require more complex water management, and there are three mainways in which produced water is managed in Azerbaijan, as shown in the following figure. The predominantmethod is of produced water from beingmanaged in this way in 2013.
Some of the suppliers that provided equipment for produced water treatment at the Sangachal terminal include (supplying six dissolved gas flotation units) and (supplying cartridge filtersand de-oiling hydrocyclones).
Figure 5.27 Methods of produced water management from BP’s fields in Azerbaijan, 2013
Produced water
management methods
at BP’s fields,
Azerbaijan
(2013)
Source: BP, 2013
Although the volume of produced water is rising, much less is being discharged into the Caspian Sea. Azerbaijanlimits the amount of water discharged into the Caspian, allowing discharge only in cases of emergency or aftertreatment. The country’s current oil in water discharge limit is set at 42 mg/L as a daily maximum, but 29mg/L as a monthly mean.

7/18/2019 Water for Offshore Oil and Gas Sample Pages
http://slidepdf.com/reader/full/water-for-offshore-oil-and-gas-sample-pages 18/21
5. REGIONS: PART 2
104 © Global Water Intelligence, 2014. Contact [email protected] for permissions.
to , and the natural gas reserves amount to , of which70% require deepwater exploration.
The East China Sea holds of the proven technically recoverable offshore crude oil reserves, and the operationdepth is approximately 90m.
The following figure shows a breakdown of China’s proven technically recoverable offshore oil reserves by region.
Figure 5.33 China’s proven technically recoverable offshore oil reserves by region, 2011
Region
Oil Reserves
(million bbl) %
Total 100.0 58%
Offshore oil reserves
(2011)
41%
1%
Source: China’s Mineral Resources Reserves Bulletin (2011)
5.4.1.1 Offshore oil and gas production
According to the data released in the 2013 Statistics Bulletin of China’s Marine Economy, China’s total offshorecrude oil production was in 2013, accounting for of its total crude oilproduction , as shown in the following figure.
Although onshore oil production still dominates, the increase has been slower mostly because many large onshore
oilfields are now mature and production is stagnating. Thus China has encouraged offshore exploration in aneffort to increase its domestic oil and gas reserves.
Offshore oil production increased at a CAGR of over the period 2000–2010, becoming one ofthe main contributors to the increase in China’s oil production. The production in 2011 decreased due to
though production at this field has since resumed in 2013.
Figure 5.34 China’s crude oil production, 2000–2013
m i l l i o n b b l
Offshore
Onshore0
300
600
900
1,200
1,500
20132012201120102009200820072006200520042003200220012000
Source: China Energy Statistical Year Book (2000–2013); China Marine Statistical Year Book (2000–2012); 2013 Statistics Bulletin of
China’s Marine Economy; GWI

7/18/2019 Water for Offshore Oil and Gas Sample Pages
http://slidepdf.com/reader/full/water-for-offshore-oil-and-gas-sample-pages 19/21
109
ASIA PACIFIC
© Global Water Intelligence, 2014. Contact [email protected] for permissions.
are often used. For the land treatment plant,technology are included. is often used when the produced water is reused as injection
water.
The following figure lists the major equipment suppliers for produced water treatment in China, highlighting thefact that the market is dominated by
Figure 5.43 Major offshore produced water equipment providers in ChinaCompany name General overview Water treatment equipment and services
An integrated offshore oil and gas equipment
provider
Both an EPC and equipment supplier in
produced water treatment.
State-controlled holdings, COEEC has 6.48%
of the share of the company, engaged in
the research, development, manufacture,
design and installation of petroleum and
petrochemical equipment
Both an EPC and equipment supplier in the
produced water treatment and water injection
services. It has the largest market share in the
offshore oil and water separators.
Oil & Gas industry equipment and service
provider
Providing produced water treatment solutions
and equipment. The exclusive partner of
in China and the exclusive system integrator
for in China
Oil & Gas industry equipment and serviceprovider
Equipment supplier in produced watertreatment.
Engaged in R&D, consulting, procurement,
manufacturing, engineering and BOT
investment in the areas of heavy oil recovery,
wastewater treatment and energy conservation
from different industries.
Both an EPC and equipment supplier in
produced water treatment.
A subsidiary of , focusing on the oil
spill treatment.
Water treatment EPC for the land terminals in
the Bohai Bay area
An integrated water treatment company Produced water treatment equipment supplier
Source: GWI
5.4.1.4 Regulatory standards for produced waterIn 2008, China published the Effluent Limitations for Pollutants from Offshore Petroleum Exploration andProduction (GB 4914-2008), an update to the existing version from 1985, in order to account for the developmentof the offshore industry. The discharge limitations are defined by the distance from the shore:
• Class I: Includes Bohai Bay, Beibu Gulf (located in the northwest of the South China Sea), marineprotected areas, and other areas within 4 nautical miles of land.
• Class II: Includes all areas between 4 and 12 nautical miles from land (except for Bohai Bay,Beibu Gulf and marine protected areas).
• Class III: Includes all areas greater than 12 nautical miles from land.
In 2008, the original Class I area was divided into Class I and Class II. The previous standard for Class I wasapplied to the newly defined Class II area and a stricter standard was applied to the newly defined Class I (see thefollowing figure). For the Class III area (the old Class II), the monthly average discharge limit was lowered from50 to 45 mg/L and the maximum discharge limit from 75 to 65 mg/L.
Figure 5.44 Standards for produced water discharged to the sea
Contaminant Sea area Limit (mg/L)
Oil and grease Class I Maximum
limit
Monthly
averageClass II
Class III
Source: Effluent Limitations for Pollutants from Offshore Petroleum Exploration and Production, 2008
5.4.1.5 Future development
According to the 12th Five-Year Plan for the Marine Economy, released in January 2013, China aims to increaseoffshore proven oil reservesThe plan calls for

7/18/2019 Water for Offshore Oil and Gas Sample Pages
http://slidepdf.com/reader/full/water-for-offshore-oil-and-gas-sample-pages 20/21
GlobalWater Intelligence6Procurement

7/18/2019 Water for Offshore Oil and Gas Sample Pages
http://slidepdf.com/reader/full/water-for-offshore-oil-and-gas-sample-pages 21/21
6. PROCUREMENT IN THE OFFSHORE OIL AND GAS INDUSTRY
6.2 Water equipment sale in offshore oil and gas
The following figure depicts three different ways in which water treatment equipment is procured in offshore oiland gas, emphasizing the dominant role of the EPC procurement model in the industry.
• Equipment suppliers
• Equipmentsuppliers,
• Equipment suppliers
Figure 6.3 Water equipment sale in the offshore oil and gas industry
Source: GWI
There is a general trend among clients
6.2.1 Water injection equipment
Certain systems for seawater injection, such as sulphate removal packages (SRPs), are usually procuredas a complete treatment train from one supplier. This complete seawater treatment system would include
Some systems may include
For system integrators, providing treatment trains is the preferred option of delivery of watertreatment equipment, as it enables them to maximise their revenue from a project.
However, in some cases
This increases the engineering and design requirements of the project, and as such this method is often preferredby consulting engineers.
6.2.2 Produced water treatment equipment
A produced water treatment system is a relatively simple system and istherefore EPCcontractors would usually
Even when the EPC prefers to have a complete treatment train from one supplier, the