
Water for Everything & the Transformative Technologies to ... · per year globally to produce...
46
Water for Everything & the Transformative Technologies to Improve Water Sustainability John C. Crittenden, Ph.D., P.E., NAE (US & China) Brook Byers Institute for Sustainable Systems, Georgia Institute of Technology, Atlanta, GA E-Mail: [email protected]
Transcript of Water for Everything & the Transformative Technologies to ... · per year globally to produce...
Water for Everything & the Transformative Technologies to
Improve Water Sustainability
John C. Crittenden, Ph.D., P.E., NAE (US & China)
Brook Byers Institute for Sustainable Systems,
Georgia Institute of Technology, Atlanta, GA
E-Mail: [email protected]
Sustainable Systems
We need to recreate the anthroposphere to exist within the means of nature. That is, use renewable resources that nature provides and generate waste nature can assimilate without overwhelming natural cycles.
This will require us to examine the interactions between the natural, engineered, social and economic systems.
There will always be room for engineering reductionism but the greatest sustainability gains in the 21st century will be from systems analysis and managing complexity will drive greater adoption of more sustainable infrastructure.
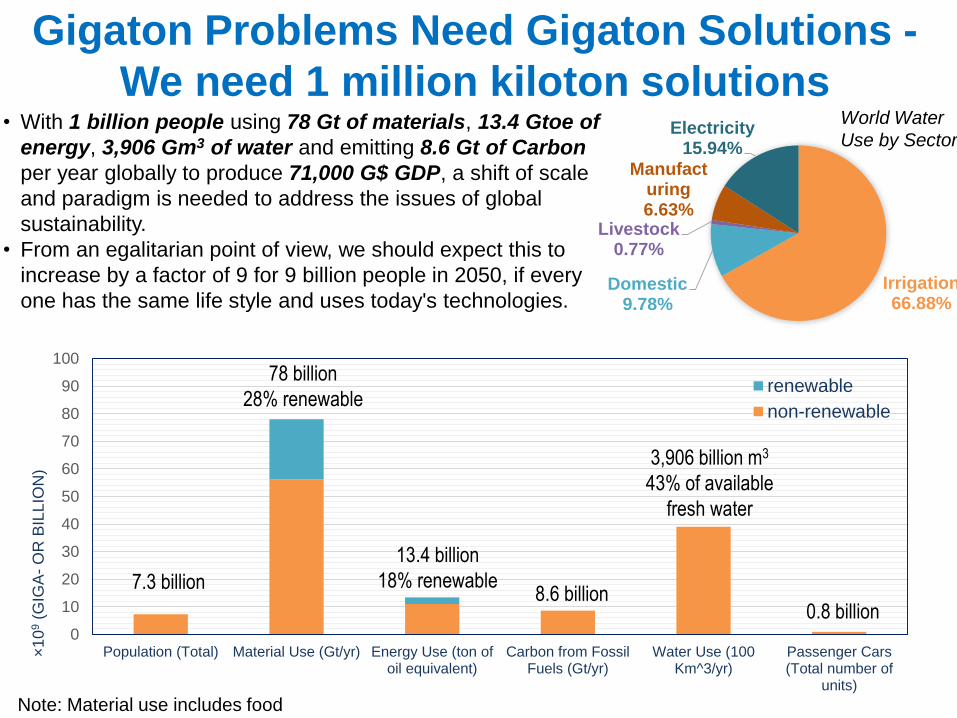
Gigaton Problems Need Gigaton Solutions -
We need 1 million kiloton solutions• With 1 billion people using 78 Gt of materials, 13.4 Gtoe of
energy, 3,906 Gm3 of water and emitting 8.6 Gt of Carbon
per year globally to produce 71,000 G$ GDP, a shift of scale
and paradigm is needed to address the issues of global
sustainability.
• From an egalitarian point of view, we should expect this to
increase by a factor of 9 for 9 billion people in 2050, if every
one has the same life style and uses today's technologies.
Note: Material use includes food
Irrigation66.88%
Domestic9.78%
Livestock0.77%
Manufacturing6.63%
Electricity15.94%
World Water
Use by Sector
0
10
20
30
40
50
60
70
80
90
100
Population (Total) Material Use (Gt/yr) Energy Use (ton ofoil equivalent)
Carbon from FossilFuels (Gt/yr)
Water Use (100Km^3/yr)
Passenger Cars(Total number of
units)
×1
09
(GIG
A-
OR
BIL
LIO
N)
renewable
non-renewable
7.3 billion
78 billion
28% renewable
13.4 billion
18% renewable8.6 billion
3,906 billion m3
43% of available
fresh water
0.8 billion

Climate Change
Rate of temperature change (°F per century) in the United States, 1901-2014
Anthropogenic warming
is estimated to have
accounted for 8–27% of
the observed California
drought anomaly in
2012–2014 and 5–18%
in 2014. (Source:
Williams, A. P., et al
2015)
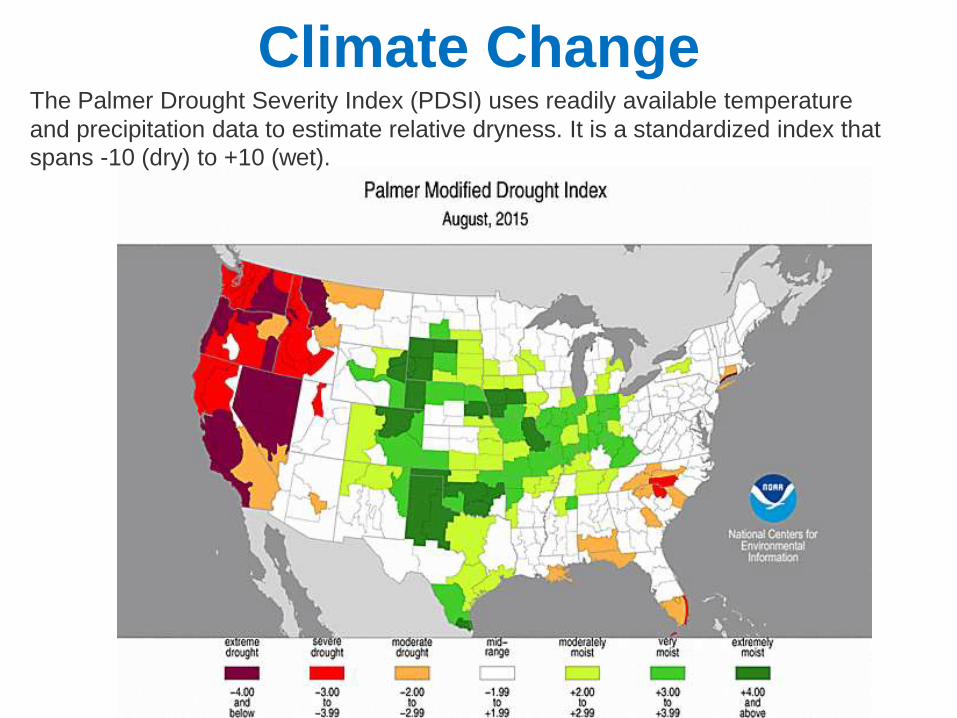
Climate ChangeThe Palmer Drought Severity Index (PDSI) uses readily available temperature
and precipitation data to estimate relative dryness. It is a standardized index that
spans -10 (dry) to +10 (wet).
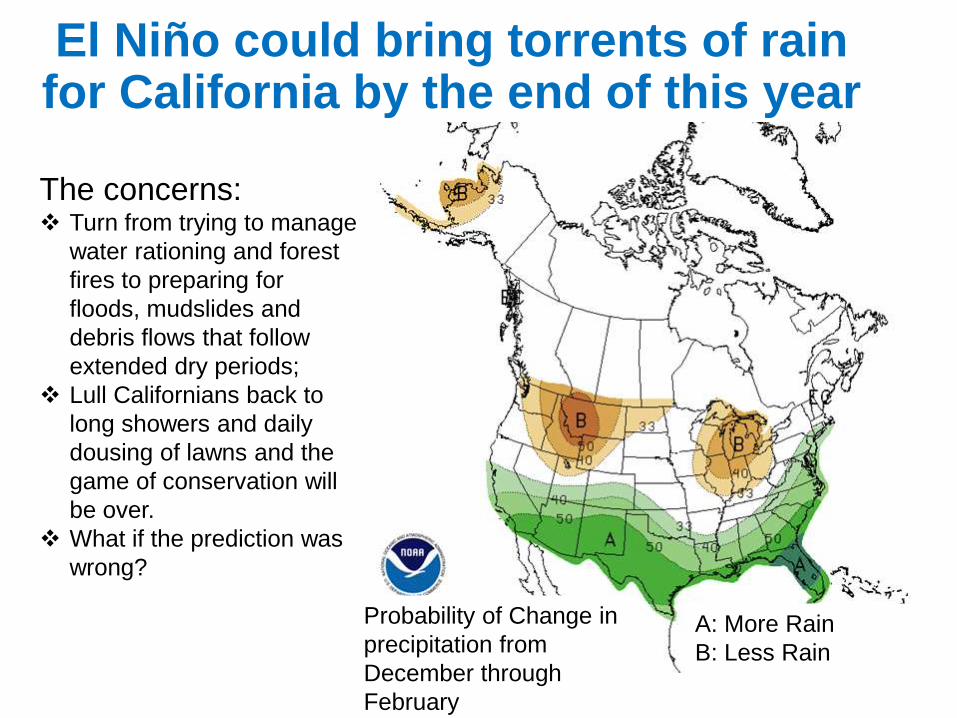
El Niño could bring torrents of rain for California by the end of this year
Probability of Change in
precipitation from
December through
February
A: More Rain
B: Less Rain
The concerns: Turn from trying to manage
water rationing and forest
fires to preparing for
floods, mudslides and
debris flows that follow
extended dry periods;
Lull Californians back to
long showers and daily
dousing of lawns and the
game of conservation will
be over.
What if the prediction was
wrong?
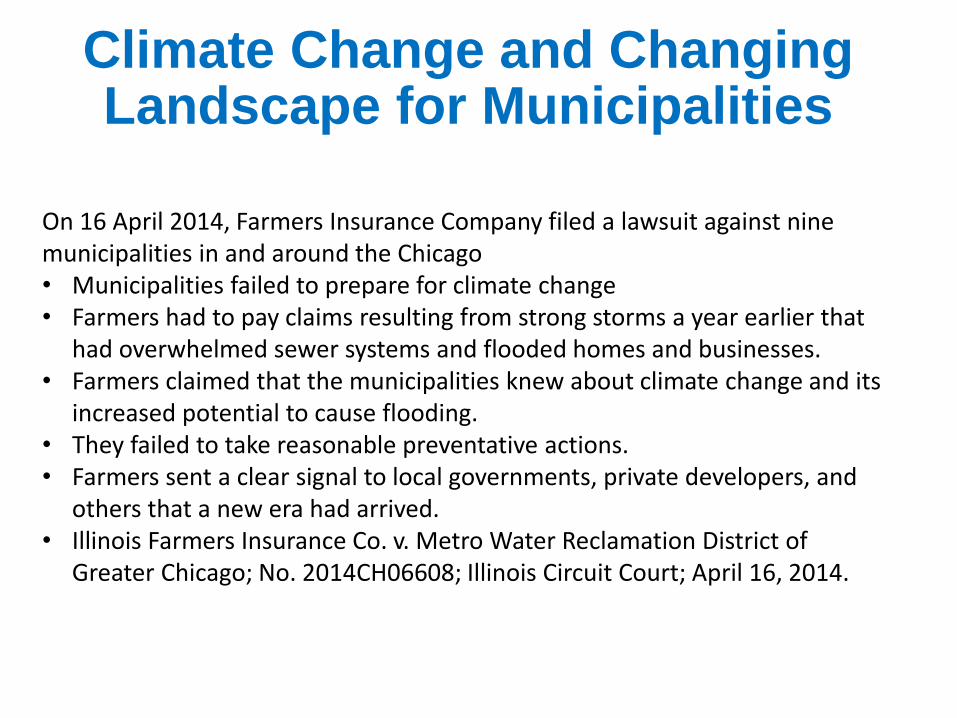
Climate Change and Changing Landscape for Municipalities
On 16 April 2014, Farmers Insurance Company filed a lawsuit against nine municipalities in and around the Chicago• Municipalities failed to prepare for climate change• Farmers had to pay claims resulting from strong storms a year earlier that
had overwhelmed sewer systems and flooded homes and businesses. • Farmers claimed that the municipalities knew about climate change and its
increased potential to cause flooding.• They failed to take reasonable preventative actions. • Farmers sent a clear signal to local governments, private developers, and
others that a new era had arrived.• Illinois Farmers Insurance Co. v. Metro Water Reclamation District of
Greater Chicago; No. 2014CH06608; Illinois Circuit Court; April 16, 2014.

System View of Water
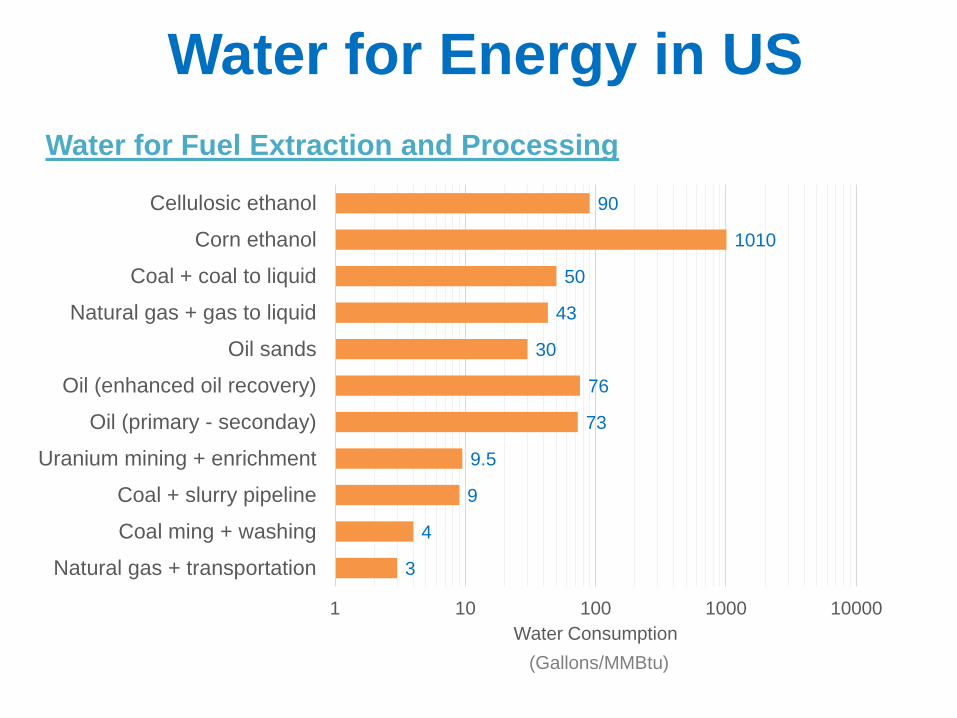
Water for Energy in US
Water for Fuel Extraction and Processing
3
4
9
9.5
73
76
30
43
50
1010
90
1 10 100 1000 10000
Natural gas + transportation
Coal ming + washing
Coal + slurry pipeline
Uranium mining + enrichment
Oil (primary - seconday)
Oil (enhanced oil recovery)
Oil sands
Natural gas + gas to liquid
Coal + coal to liquid
Corn ethanol
Cellulosic ethanol
Water Consumption
(Gallons/MMBtu)
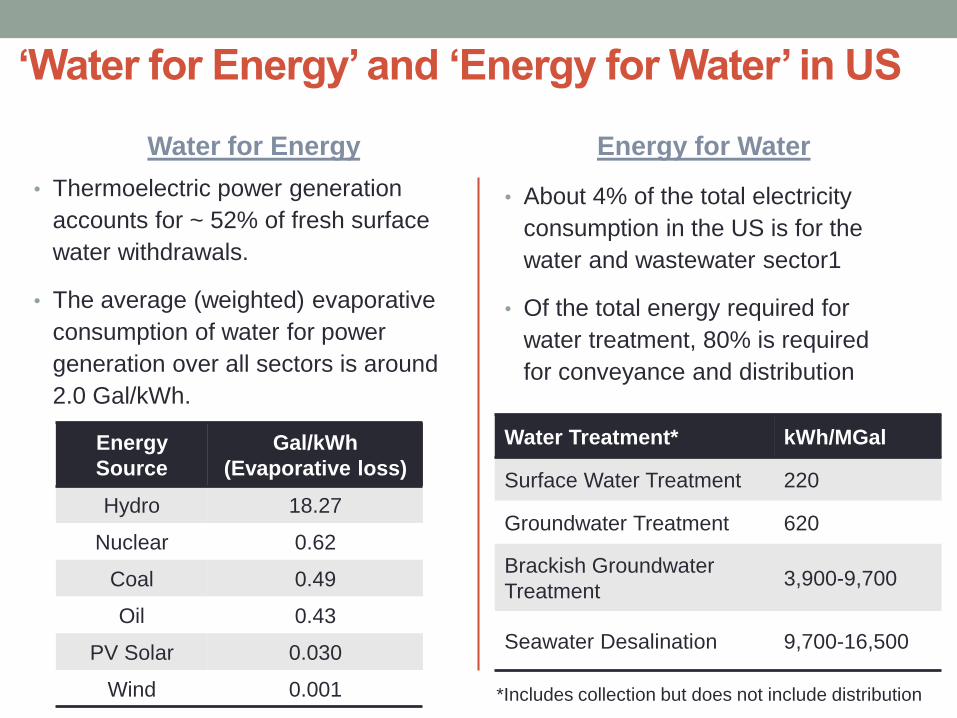
‘Water for Energy’ and ‘Energy for Water’ in US
Water for Energy
• Thermoelectric power generation
accounts for ~ 52% of fresh surface
water withdrawals.
• The average (weighted) evaporative
consumption of water for power
generation over all sectors is around
2.0 Gal/kWh.
Energy for Water
• About 4% of the total electricity
consumption in the US is for the
water and wastewater sector1
• Of the total energy required for
water treatment, 80% is required
for conveyance and distribution
Energy
Source
Gal/kWh
(Evaporative loss)
Hydro 18.27
Nuclear 0.62
Coal 0.49
Oil 0.43
PV Solar 0.030
Wind 0.001
Water Treatment* kWh/MGal
Surface Water Treatment 220
Groundwater Treatment 620
Brackish Groundwater
Treatment3,900-9,700
Seawater Desalination 9,700-16,500
*Includes collection but does not include distribution
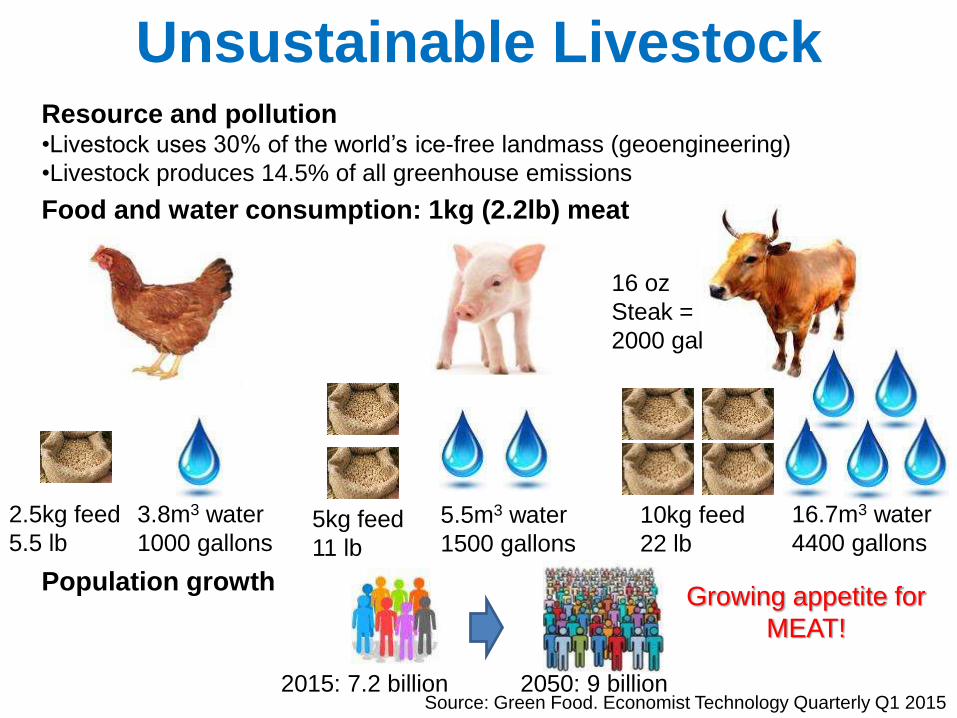
Unsustainable LivestockResource and pollution•Livestock uses 30% of the world’s ice-free landmass (geoengineering)
•Livestock produces 14.5% of all greenhouse emissions
Food and water consumption: 1kg (2.2lb) meat
Population growth
2.5kg feed
5.5 lb5kg feed
11 lb
10kg feed
22 lb
2015: 7.2 billion 2050: 9 billion
Growing appetite for
MEAT!
Source: Green Food. Economist Technology Quarterly Q1 2015
16.7m3 water
4400 gallons
5.5m3 water
1500 gallons
3.8m3 water
1000 gallons
16 oz
Steak =
2000 gal
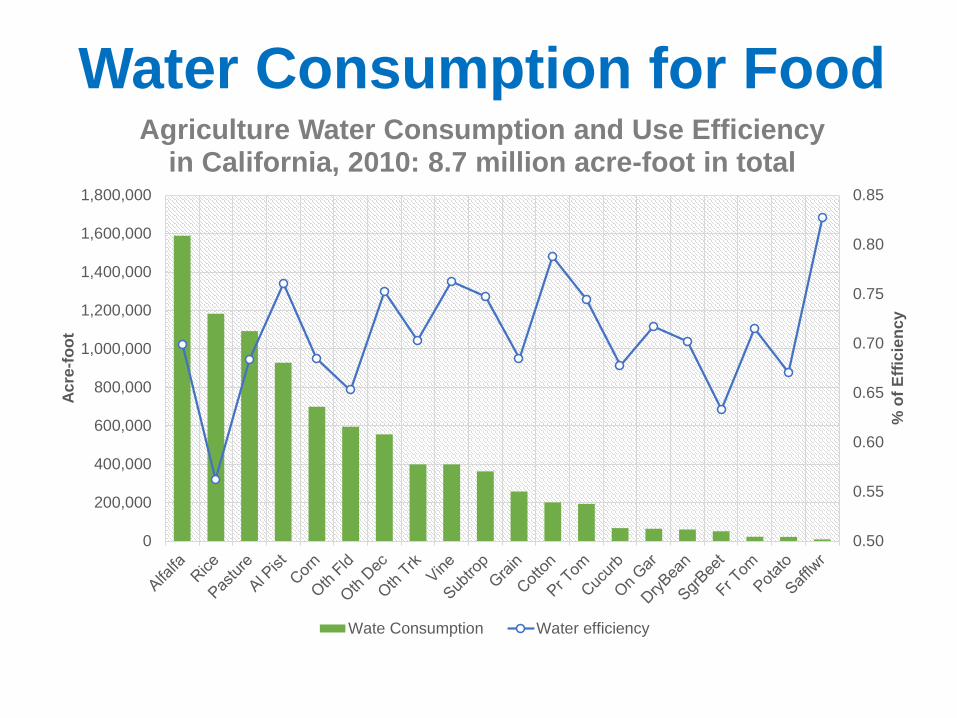
Water Consumption for Food
0.50
0.55
0.60
0.65
0.70
0.75
0.80
0.85
0
200,000
400,000
600,000
800,000
1,000,000
1,200,000
1,400,000
1,600,000
1,800,000
% o
f E
ffic
ien
cy
Ac
re-f
oo
t
Agriculture Water Consumption and Use Efficiency in California, 2010: 8.7 million acre-foot in total
Wate Consumption Water efficiency
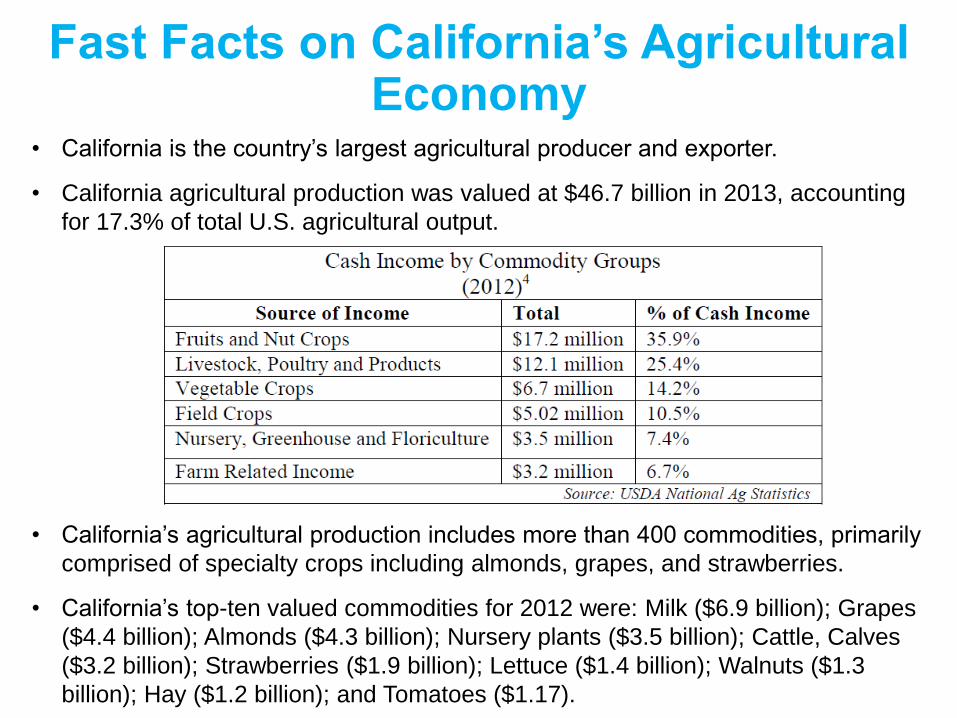
• California is the country’s largest agricultural producer and exporter.
• California agricultural production was valued at $46.7 billion in 2013, accounting
for 17.3% of total U.S. agricultural output.
• California’s agricultural production includes more than 400 commodities, primarily
comprised of specialty crops including almonds, grapes, and strawberries.
• California’s top-ten valued commodities for 2012 were: Milk ($6.9 billion); Grapes
($4.4 billion); Almonds ($4.3 billion); Nursery plants ($3.5 billion); Cattle, Calves
($3.2 billion); Strawberries ($1.9 billion); Lettuce ($1.4 billion); Walnuts ($1.3
billion); Hay ($1.2 billion); and Tomatoes ($1.17).
Fast Facts on California’s Agricultural Economy
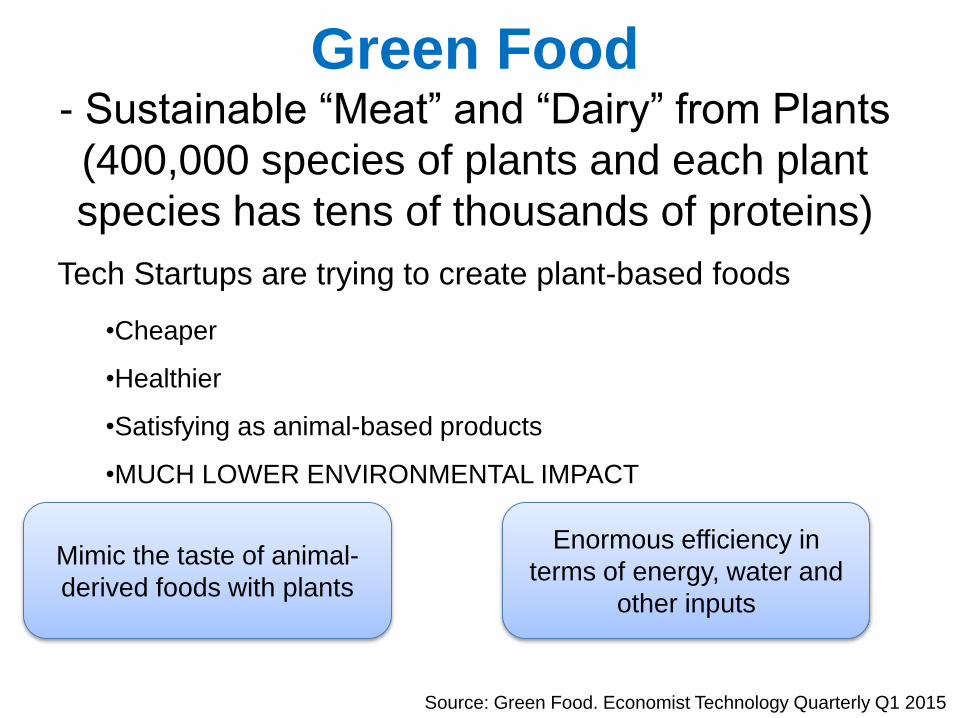
Green Food- Sustainable “Meat” and “Dairy” from Plants
(400,000 species of plants and each plant
species has tens of thousands of proteins)
Tech Startups are trying to create plant-based foods
•Cheaper
•Healthier
•Satisfying as animal-based products
•MUCH LOWER ENVIRONMENTAL IMPACT
Enormous efficiency in
terms of energy, water and
other inputs
Mimic the taste of animal-
derived foods with plants
Source: Green Food. Economist Technology Quarterly Q1 2015
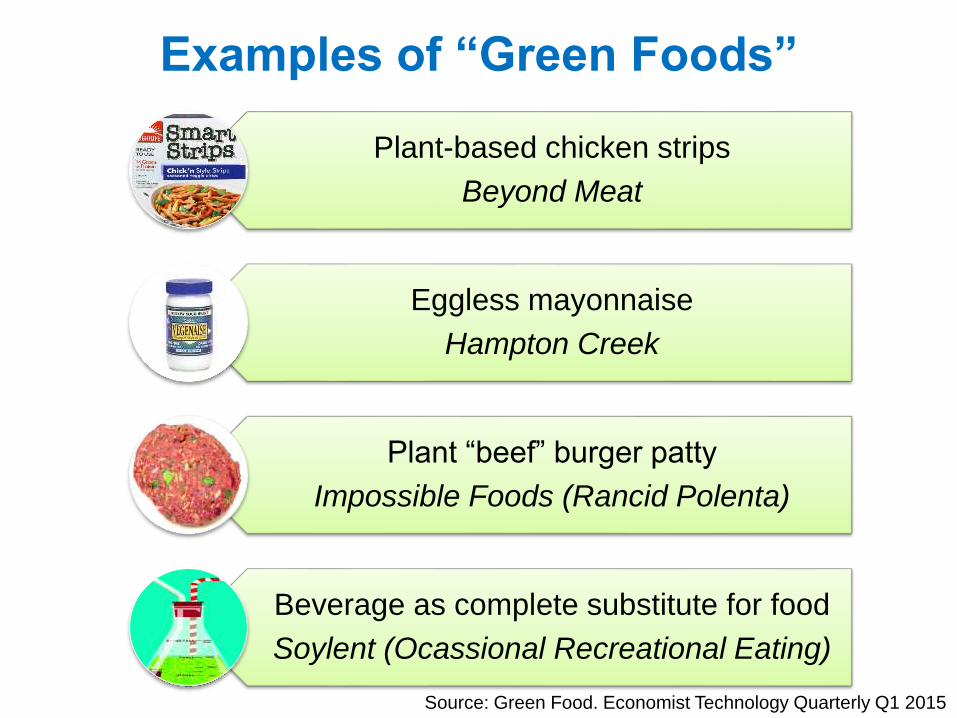
Examples of “Green Foods”
Plant-based chicken strips
Beyond Meat
Eggless mayonnaise
Hampton Creek
Plant “beef” burger patty
Impossible Foods (Rancid Polenta)
Beverage as complete substitute for food
Soylent (Ocassional Recreational Eating)
Source: Green Food. Economist Technology Quarterly Q1 2015
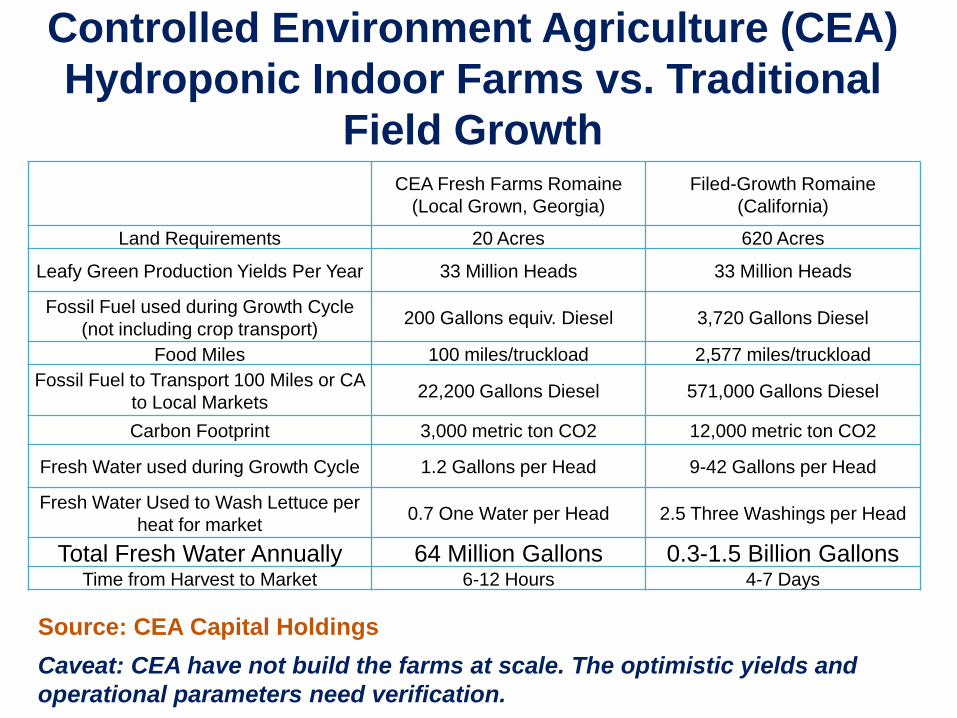
Controlled Environment Agriculture (CEA)
Hydroponic Indoor Farms vs. Traditional
Field Growth CEA Fresh Farms Romaine
(Local Grown, Georgia)
Filed-Growth Romaine
(California)
Land Requirements 20 Acres 620 Acres
Leafy Green Production Yields Per Year 33 Million Heads 33 Million Heads
Fossil Fuel used during Growth Cycle
(not including crop transport)200 Gallons equiv. Diesel 3,720 Gallons Diesel
Food Miles 100 miles/truckload 2,577 miles/truckload
Fossil Fuel to Transport 100 Miles or CA
to Local Markets22,200 Gallons Diesel 571,000 Gallons Diesel
Carbon Footprint 3,000 metric ton CO2 12,000 metric ton CO2
Fresh Water used during Growth Cycle 1.2 Gallons per Head 9-42 Gallons per Head
Fresh Water Used to Wash Lettuce per
heat for market 0.7 One Water per Head 2.5 Three Washings per Head
Total Fresh Water Annually 64 Million Gallons 0.3-1.5 Billion GallonsTime from Harvest to Market 6-12 Hours 4-7 Days
Source: CEA Capital Holdings
Caveat: CEA have not build the farms at scale. The optimistic yields and
operational parameters need verification.
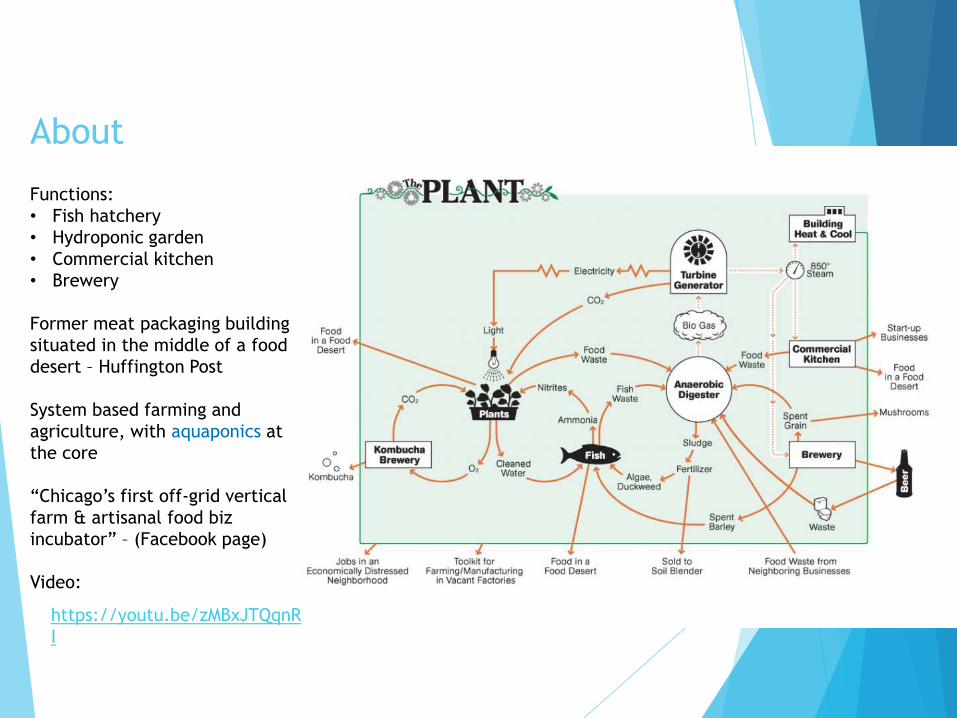
https://youtu.be/zMBxJTQqnR
I
About
Functions:
• Fish hatchery
• Hydroponic garden
• Commercial kitchen
• Brewery
Former meat packaging building
situated in the middle of a food
desert – Huffington Post
System based farming and
agriculture, with aquaponics at
the core
“Chicago’s first off-grid vertical
farm & artisanal food biz
incubator” – (Facebook page)
Video:
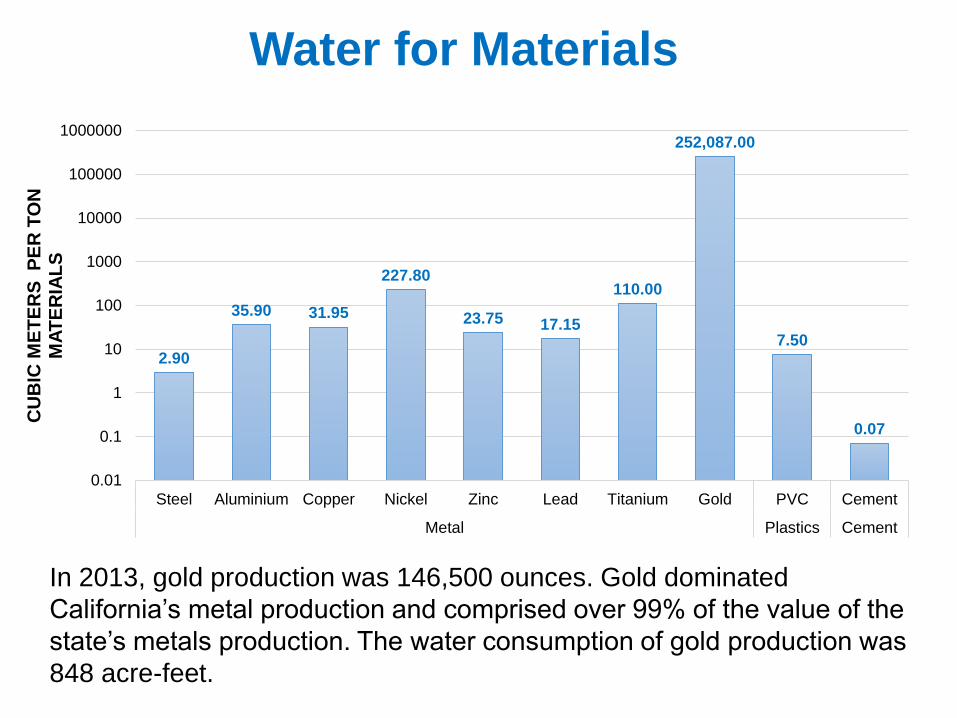
Water for Materials
2.90
35.90 31.95
227.80
23.75 17.15
110.00
252,087.00
7.50
0.07
0.01
0.1
1
10
100
1000
10000
100000
1000000
Steel Aluminium Copper Nickel Zinc Lead Titanium Gold PVC Cement
Metal Plastics Cement
CU
BIC
ME
TE
RS
P
ER
TO
N
MA
TE
RIA
LS
In 2013, gold production was 146,500 ounces. Gold dominated
California’s metal production and comprised over 99% of the value of the
state’s metals production. The water consumption of gold production was
848 acre-feet.
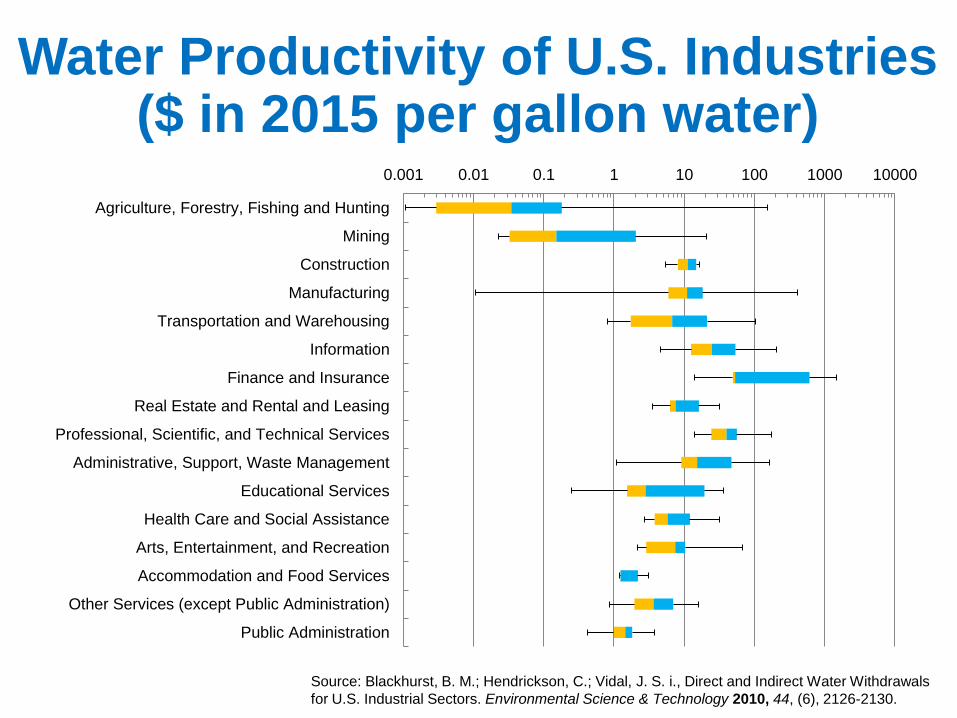
Water Productivity of U.S. Industries ($ in 2015 per gallon water)
0.001 0.01 0.1 1 10 100 1000 10000
Agriculture, Forestry, Fishing and Hunting
Mining
Construction
Manufacturing
Transportation and Warehousing
Information
Finance and Insurance
Real Estate and Rental and Leasing
Professional, Scientific, and Technical Services
Administrative, Support, Waste Management
Educational Services
Health Care and Social Assistance
Arts, Entertainment, and Recreation
Accommodation and Food Services
Other Services (except Public Administration)
Public Administration
Source: Blackhurst, B. M.; Hendrickson, C.; Vidal, J. S. i., Direct and Indirect Water Withdrawals
for U.S. Industrial Sectors. Environmental Science & Technology 2010, 44, (6), 2126-2130.

Water for Transportation: Impact of Fuel Types and Vehicle Technologies
0.1
1
10
100C
oa
l +
Carb
on s
eq
ue
str
ation
So
lar
PV
Co
nce
ntr
ate
d S
ola
r P
ow
er
Un
lea
de
d
Co
rn e
tha
no
l
Sw
itch
gra
ss—
no
irr
iga
tio
n
Sw
itch
gra
ss—
irrig
atio
n
So
y b
iod
iese
l
Alg
ae
bio
die
se
l—open
Alg
ae
bio
die
se
l—clo
se
d
Plug-in hybrid electricvehicle (PHEV)
Conventional (internal combustion engine)
Ga
llon
s p
er
ve
hic
le m
ile tra
ve
led
Life-cycle Water Consumption Per Vehicle Mile
Fuel consumption
Vehicle production
0.770.59
0.79
0.32
4.35
0.44
12.25
2.453.85
0.97
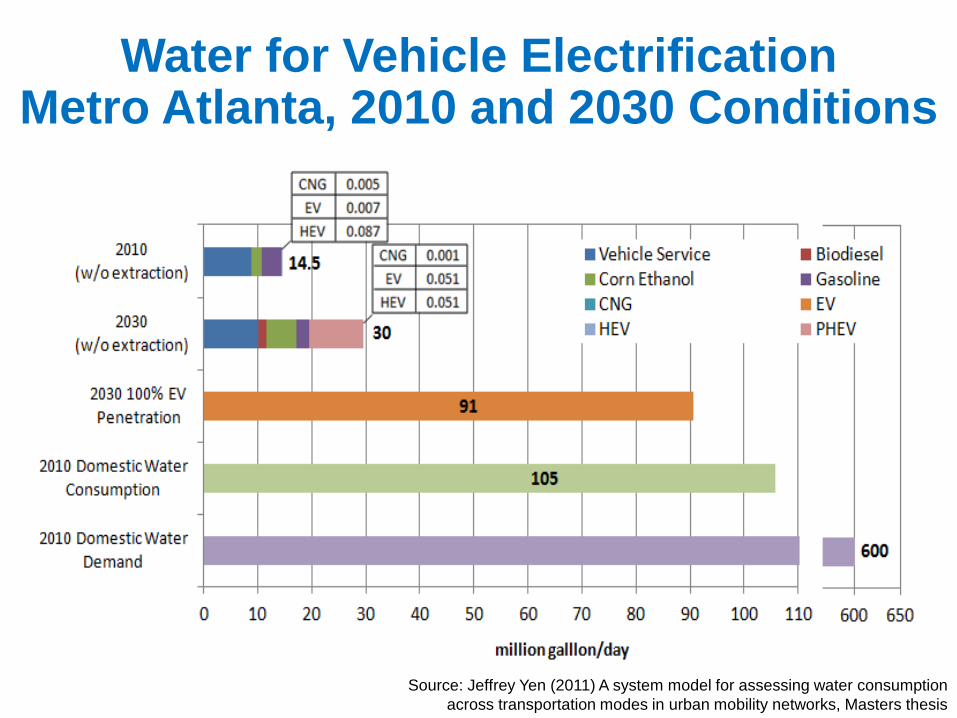
Source: Jeffrey Yen (2011) A system model for assessing water consumption
across transportation modes in urban mobility networks, Masters thesis
Water for Vehicle Electrification Metro Atlanta, 2010 and 2030 Conditions

System Thinking of Infrastructure Ecology
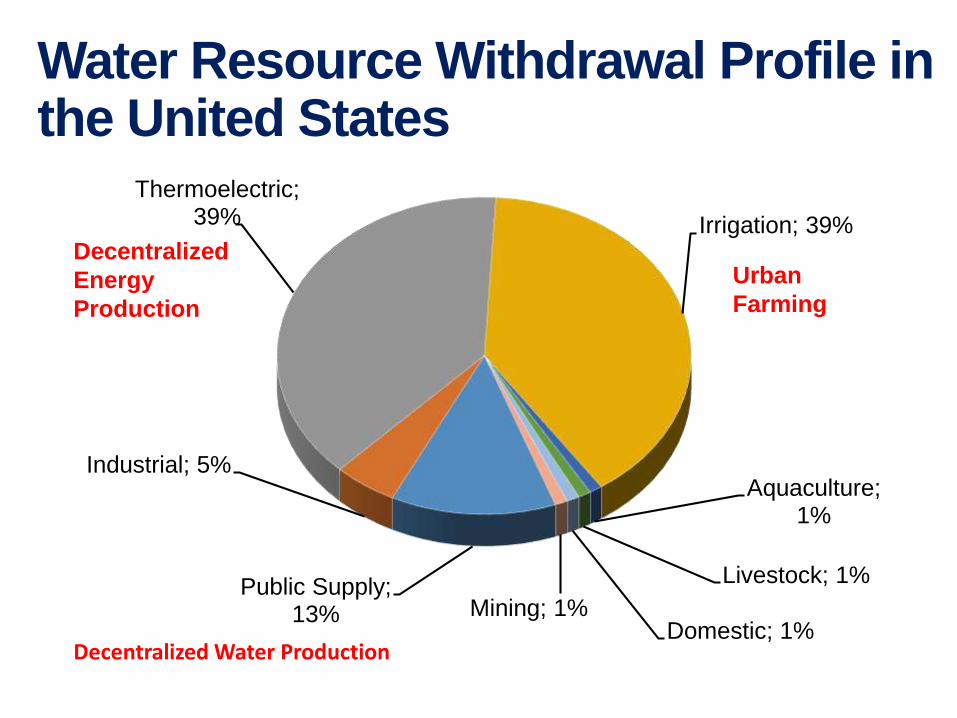
Water Resource Withdrawal Profile in the United States
Public Supply; 13%
Industrial; 5%
Thermoelectric; 39% Irrigation; 39%
Aquaculture; 1%
Livestock; 1%
Domestic; 1%Mining; 1%
Decentralized Water Production
Decentralized
Energy
Production
Urban
Farming
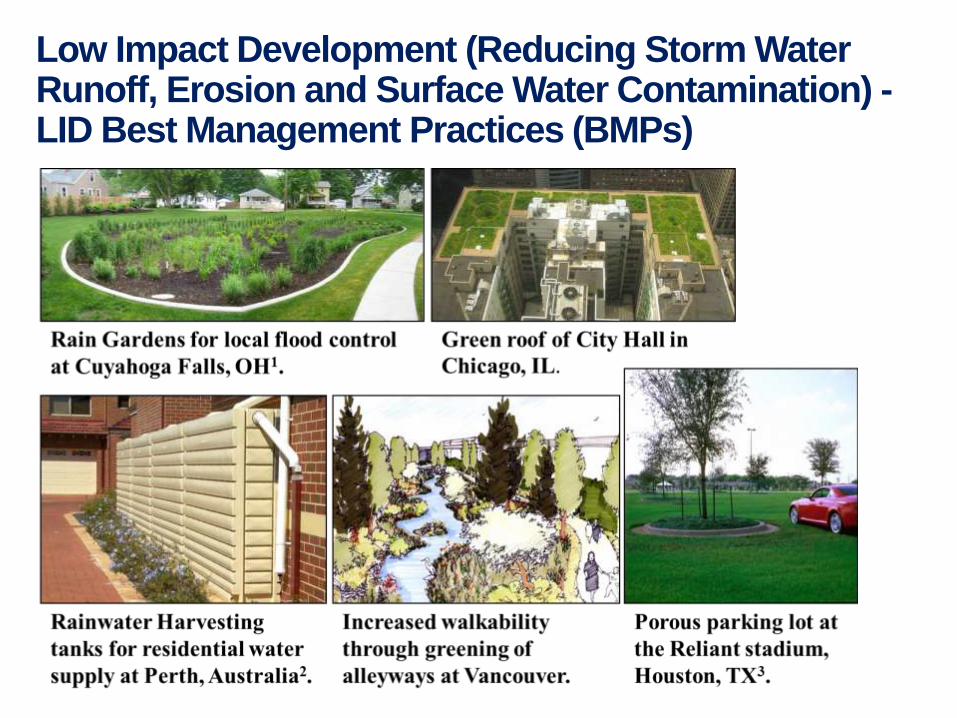
Low Impact Development (Reducing Storm Water Runoff, Erosion and Surface Water Contamination) -LID Best Management Practices (BMPs)

Same Size
Waste Water
Treatment
Plant
Smaller Flow,
More
Concentrated;
Smaller Plant:
Better energy
and nutrient
recovery.
Water Flows with LID and Reclamationa 2-story apartment unit of Atlanta, GA (Gal/Capita-day)
Smaller
Water
Treatment
Plant
Potential of
off-grid water
supply
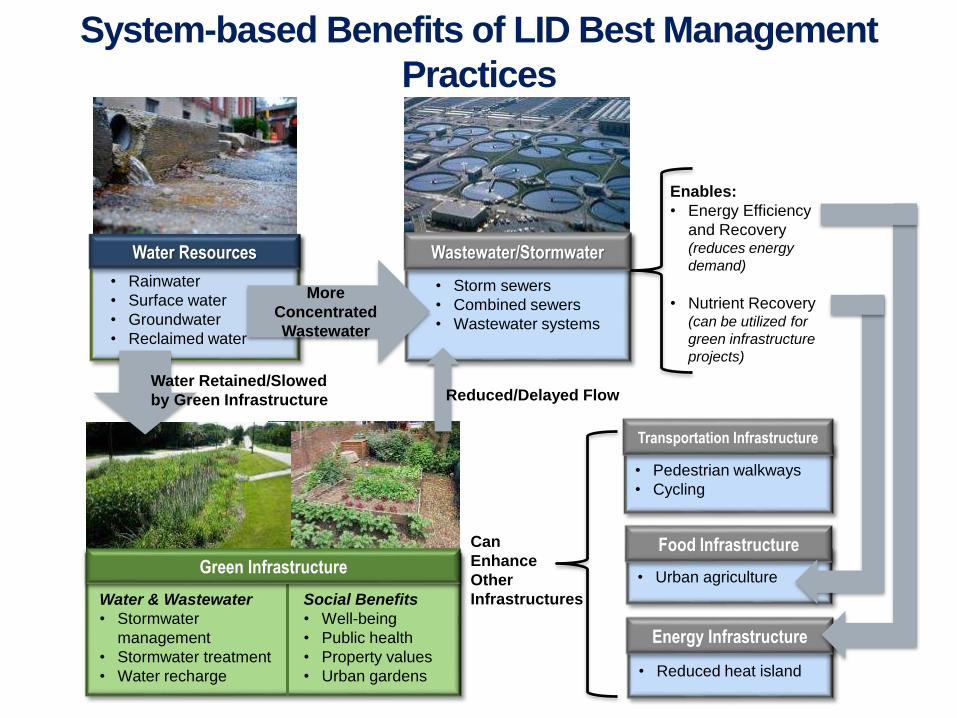
Water & Wastewater
• Stormwater
management
• Stormwater treatment
• Water recharge
Social Benefits
• Well-being
• Public health
• Property values
• Urban gardens
Green Infrastructure
• Rainwater
• Surface water
• Groundwater
• Reclaimed water
Water Resources
• Storm sewers
• Combined sewers
• Wastewater systems
Wastewater/Stormwater
System-based Benefits of LID Best Management
Practices
Reduced/Delayed FlowWater Retained/Slowed
by Green Infrastructure
Enables:
• Energy Efficiency
and Recovery (reduces energy
demand)
• Nutrient Recovery (can be utilized for
green infrastructure
projects)
More
Concentrated
Wastewater
• Pedestrian walkways
• Cycling
Transportation Infrastructure
Can
Enhance
Other
Infrastructures
• Urban agriculture
Food Infrastructure
• Reduced heat island
Energy Infrastructure
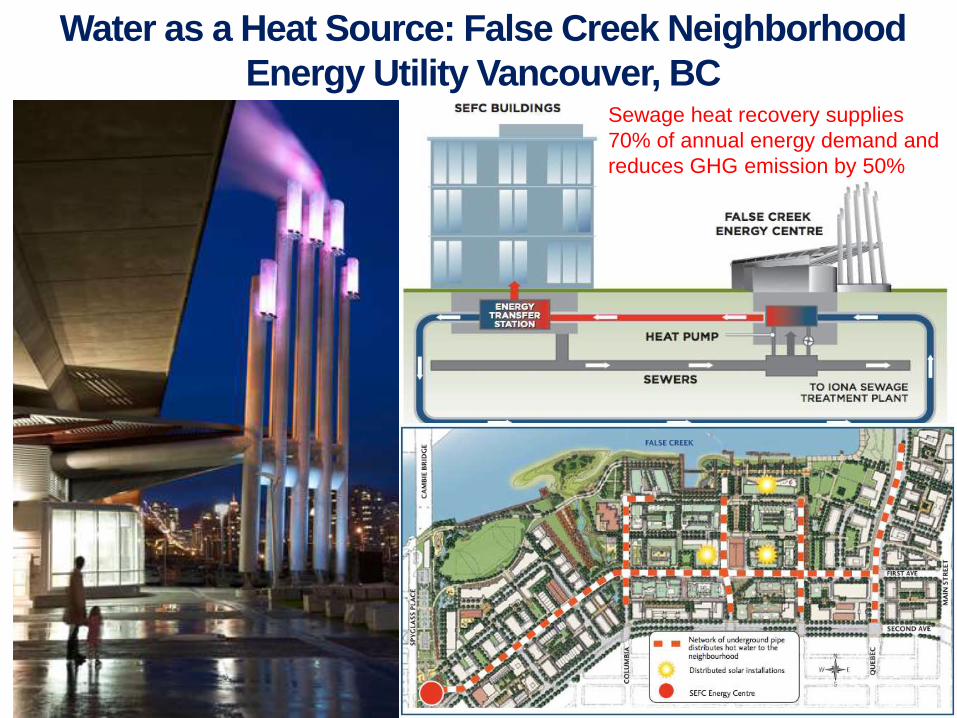
Water as a Heat Source: False Creek Neighborhood
Energy Utility Vancouver, BCSewage heat recovery supplies
70% of annual energy demand and
reduces GHG emission by 50%
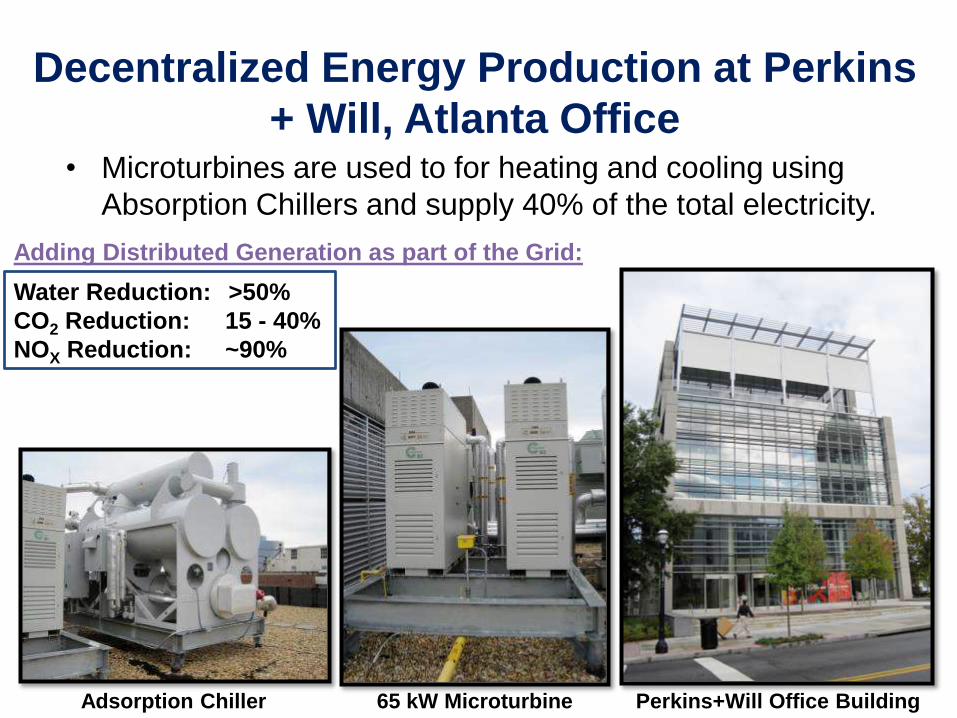
Decentralized Energy Production at Perkins
+ Will, Atlanta Office• Microturbines are used to for heating and cooling using
Absorption Chillers and supply 40% of the total electricity.
Adsorption Chiller 65 kW Microturbine Perkins+Will Office Building
Water Reduction: >50%
CO2 Reduction: 15 - 40%
NOX Reduction: ~90%
Adding Distributed Generation as part of the Grid:

Future Research: Expanding the
Current CCHP System 2.0
Wind
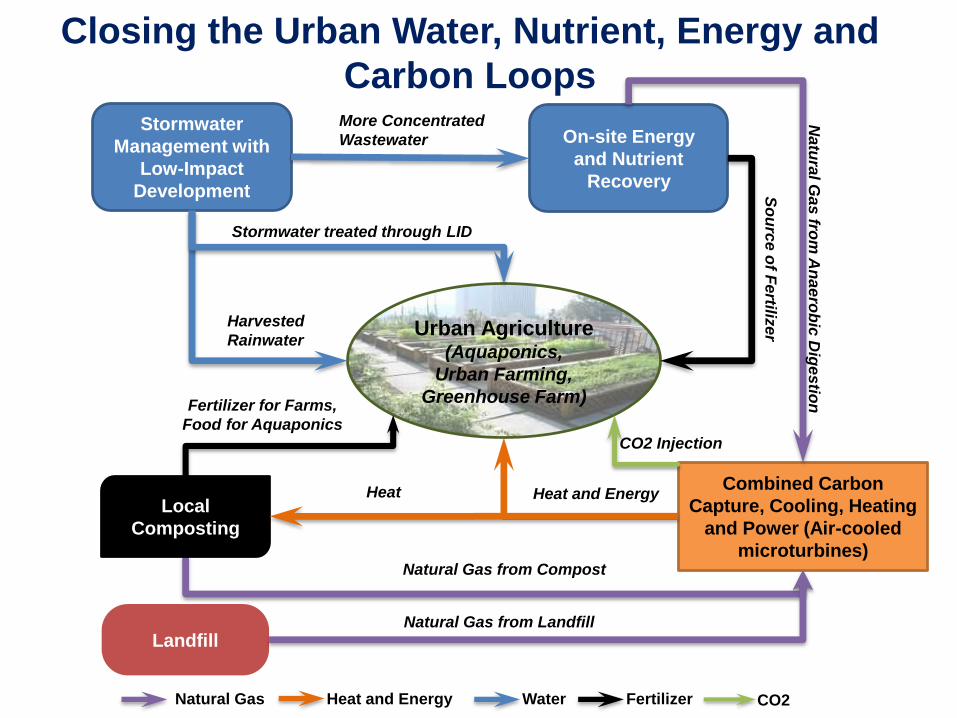
Closing the Urban Water, Nutrient, Energy and
Carbon Loops
Urban Agriculture (Aquaponics,
Urban Farming,
Greenhouse Farm)
Stormwater
Management with
Low-Impact
Development
More Concentrated
Wastewater On-site Energy
and Nutrient
Recovery S
ou
rce
of F
ertiliz
er
Harvested
Rainwater
Stormwater treated through LID
Combined Carbon
Capture, Cooling, Heating
and Power (Air-cooled
microturbines)
Heat and EnergyLocal
Composting
Fertilizer for Farms,
Food for Aquaponics
Heat
Natu
ral G
as
from
An
ae
rob
ic D
ige
stio
n
Natural Gas from Compost
Natural Gas
Heat and Energy Water FertilizerNatural Gas
CO2 Injection
CO2
LandfillNatural Gas from Landfill
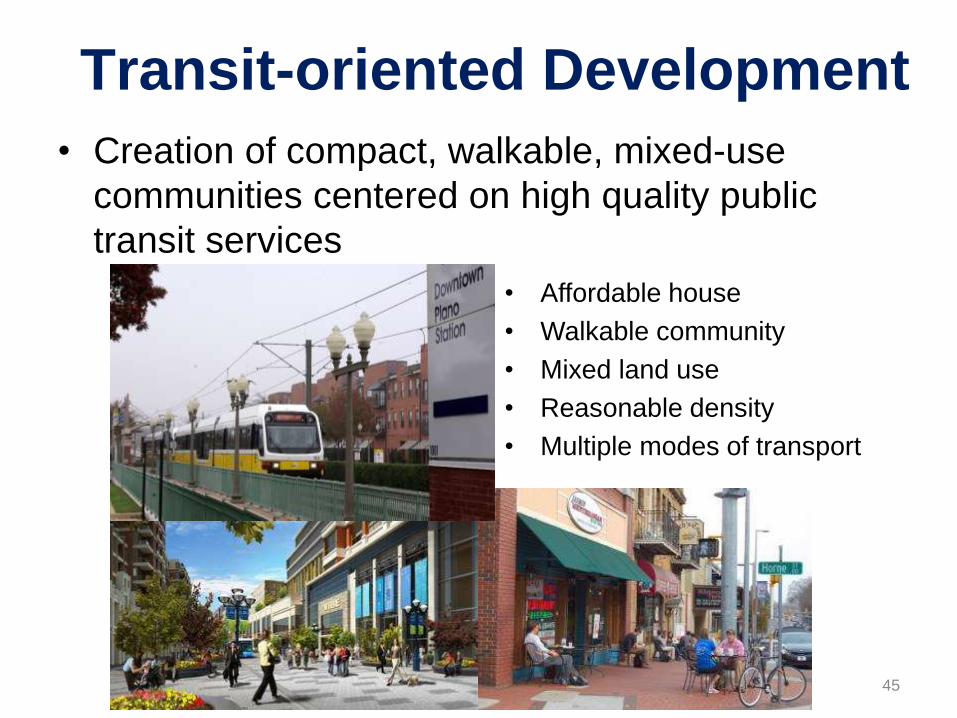
Transit-oriented Development
• Creation of compact, walkable, mixed-use
communities centered on high quality public
transit services
• Affordable house
• Walkable community
• Mixed land use
• Reasonable density
• Multiple modes of transport
45

The Connection between Autonomous Vehicles, Tranport, Green Space and
Water80% penetration of
autonomous vehicles
28% of the cars we have today;
Extend the distance of TOD (10 min)
At least 72% reduction in parking space
24.7% reduction of impervious area and stormwater runoff
Additional 17% of city land for green space and stormwater
management
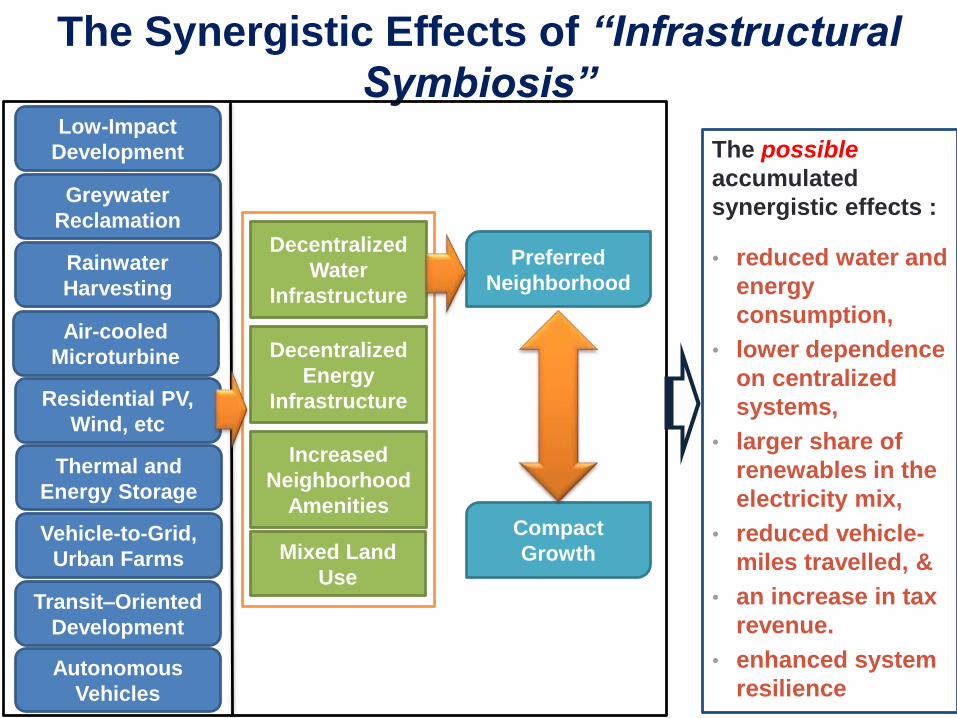
The Synergistic Effects of “Infrastructural
Symbiosis”
The possible
accumulated
synergistic effects :
• reduced water and
energy
consumption,
• lower dependence
on centralized
systems,
• larger share of
renewables in the
electricity mix,
• reduced vehicle-
miles travelled, &
• an increase in tax
revenue.
• enhanced system
resilience
Low-Impact
Development
Greywater
Reclamation
Rainwater
Harvesting
Air-cooled
Microturbine
Residential PV,
Wind, etc
Vehicle-to-Grid,
Urban Farms
Compact
Growth
Preferred
Neighborhood
Transit–Oriented
Development
Decentralized
Water
Infrastructure
Decentralized
Energy
Infrastructure
Increased
Neighborhood
Amenities
Mixed Land
Use
Autonomous
Vehicles
Thermal and
Energy Storage
Grids Closing the Loops on Carbon,
Water, Nutrients, Material Flows
• To become more sustainable and
resilient, we need coordinate and
restructure at least 8 important
grids. They include: (1) nutrients, (2)
natural gas, (3) water, (4) electricity, (5)
thermal, (6) transportation and (7)
material grids, and (8) economic flows.
• In past, these grids were mostly
constructed in isolation and we did not
consider there interactions.
Manage the Complexity in
Infrastructure Systems
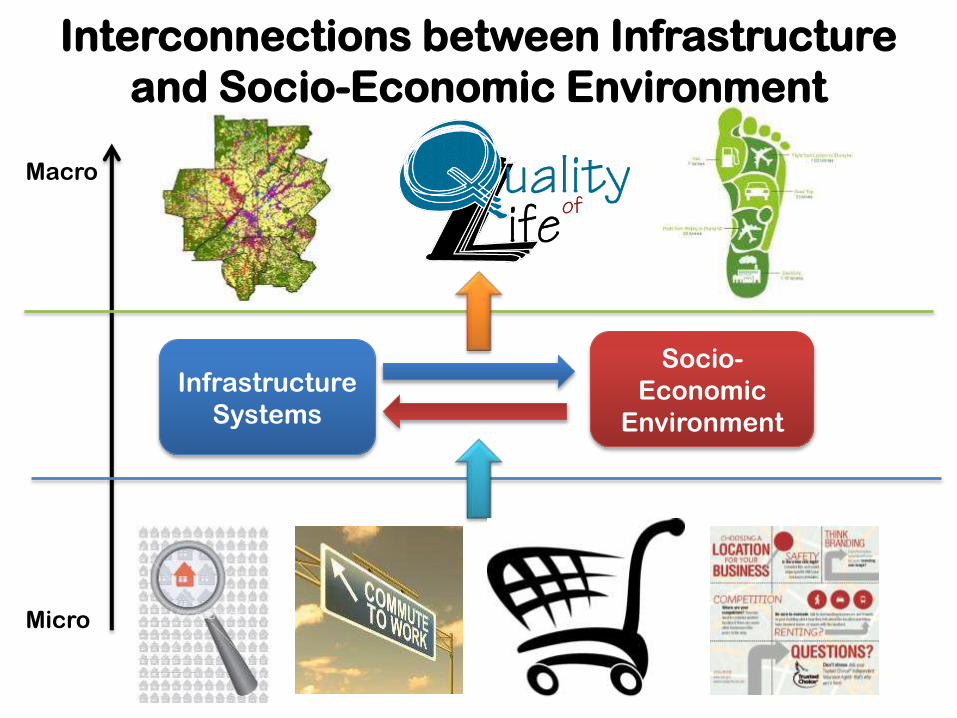
Interconnections between Infrastructure
and Socio-Economic Environment
Macro
Micro
Infrastructure
Systems
Socio-
Economic
Environment
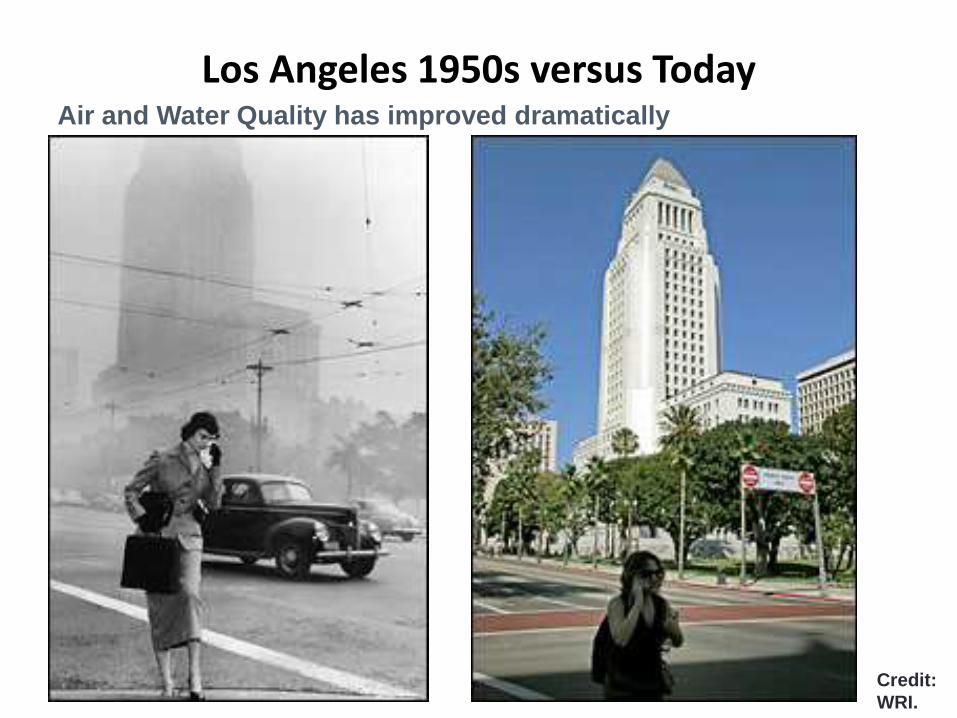
Los Angeles 1950s versus TodayAir and Water Quality has improved dramatically
Credit:
WRI.
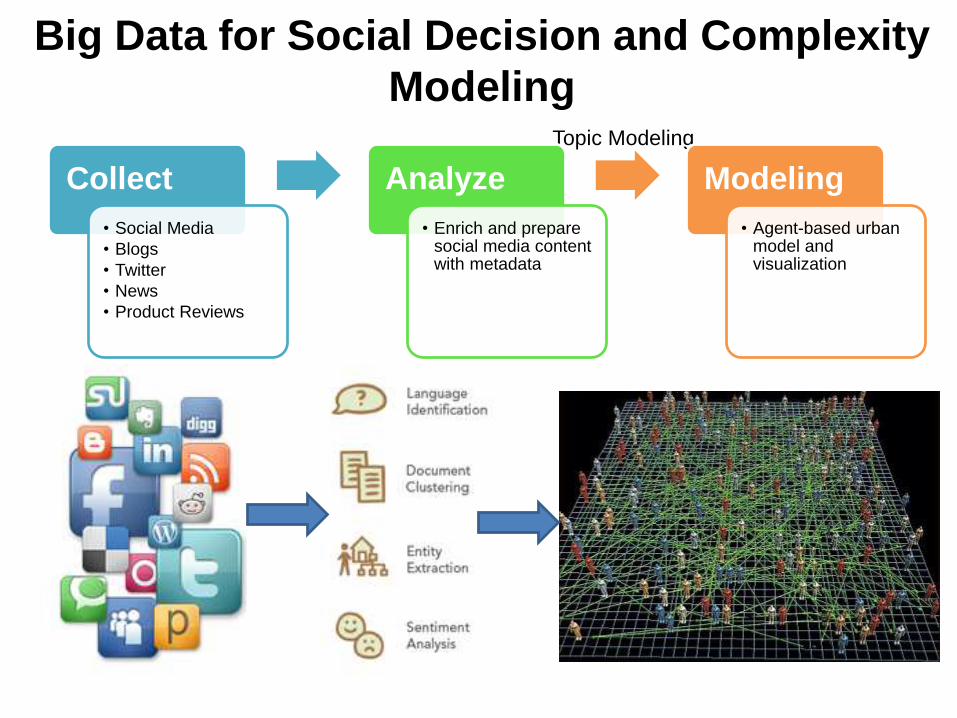
Big Data for Social Decision and Complexity
ModelingTopic Modeling
Collect
• Social Media
• Blogs
• News
• Product Reviews
Analyze
• Enrich and prepare social media content with metadata
Modeling
• Agent-based urban model and visualization
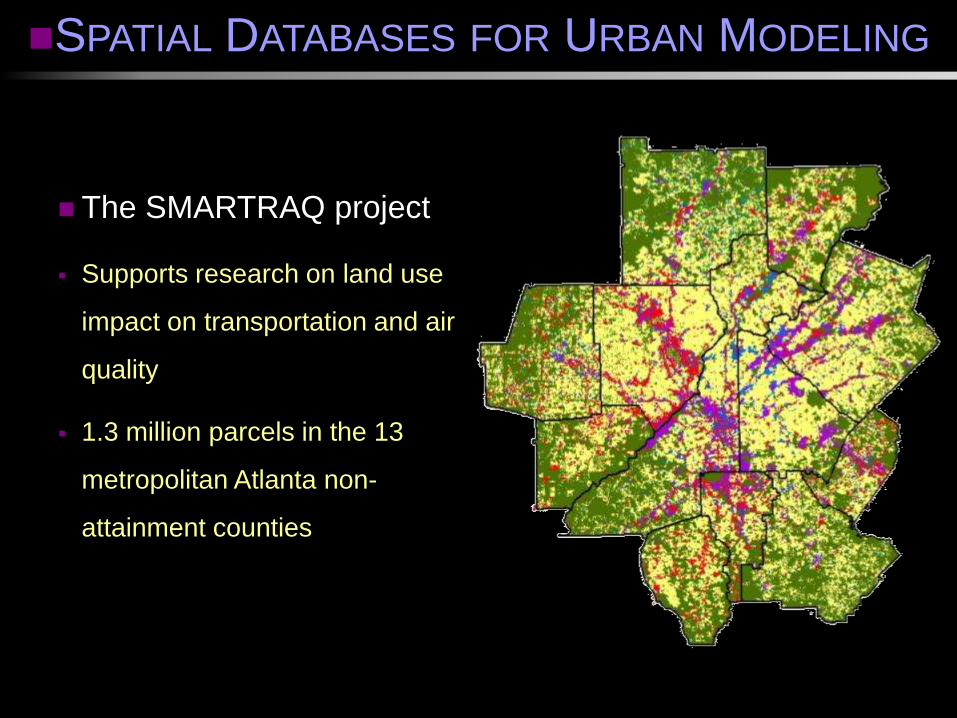
SPATIAL DATABASES FOR URBAN MODELING
The SMARTRAQ project
Supports research on land use
impact on transportation and air
quality
1.3 million parcels in the 13
metropolitan Atlanta non-
attainment counties
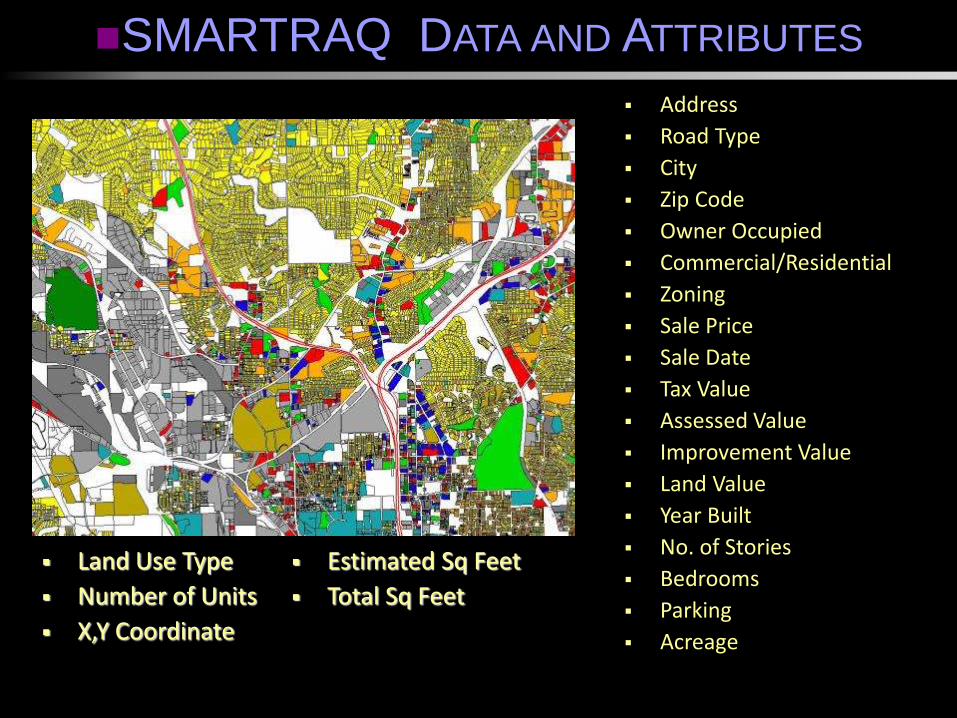
SMARTRAQ DATA AND ATTRIBUTES
Address
Road Type
City
Zip Code
Owner Occupied
Commercial/Residential
Zoning
Sale Price
Sale Date
Tax Value
Assessed Value
Improvement Value
Land Value
Year Built
No. of Stories
Bedrooms
Parking
Acreage
Land Use Type
Number of Units
X,Y Coordinate
Estimated Sq Feet
Total Sq Feet

Business As Usual
Year 2030
More Sustainable
Development Year 2030
Existing Land Use Base
Year 2005
Growth Scenarios
in Atlanta
Courtesy: French, S; GT
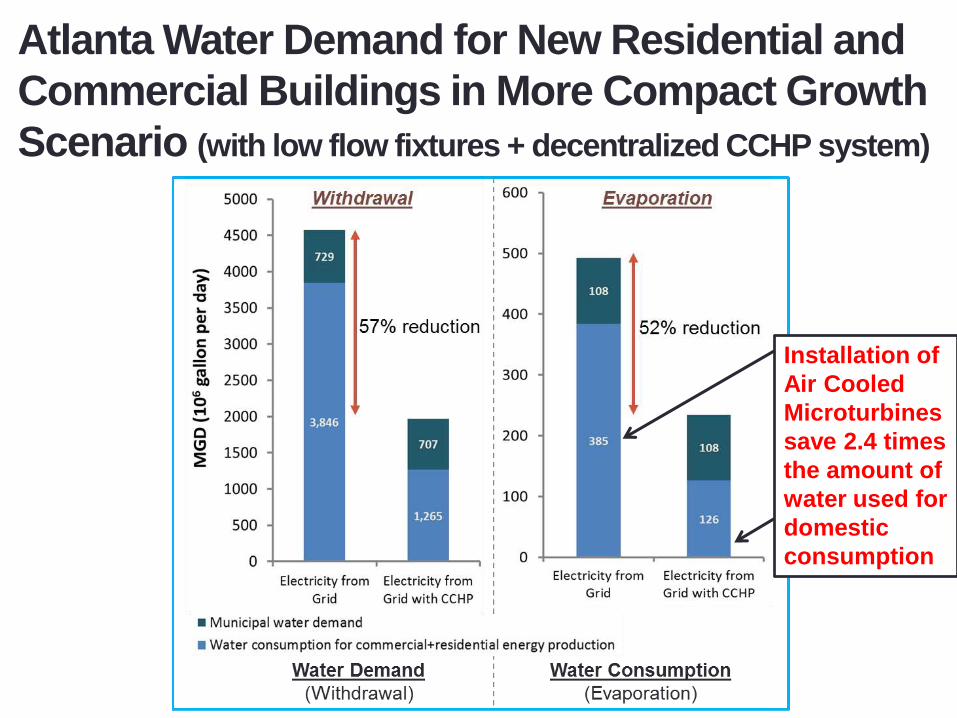
Atlanta Water Demand for New Residential and
Commercial Buildings in More Compact Growth
Scenario (with low flow fixtures + decentralized CCHP system)
Installation of
Air Cooled
Microturbines
save 2.4 times
the amount of
water used for
domestic
consumption
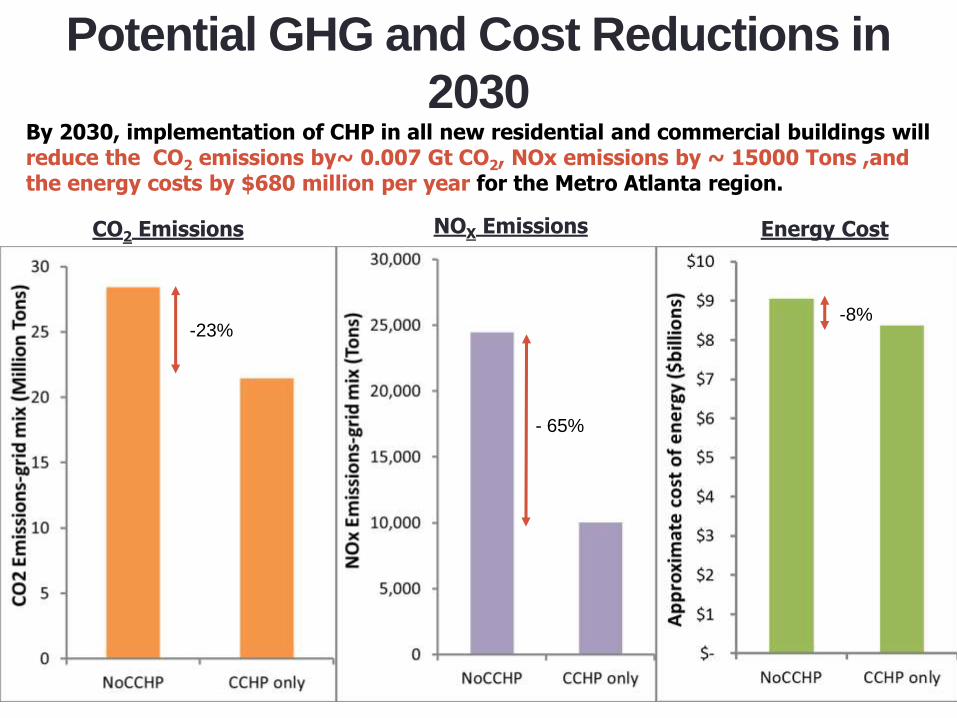
Potential GHG and Cost Reductions in
2030By 2030, implementation of CHP in all new residential and commercial buildings will reduce the CO2 emissions by~ 0.007 Gt CO2, NOx emissions by ~ 15000 Tons ,and the energy costs by $680 million per year for the Metro Atlanta region.
-25%
CO2 Emissions NOX Emissions Energy Cost
-23%
- 65%
-8%
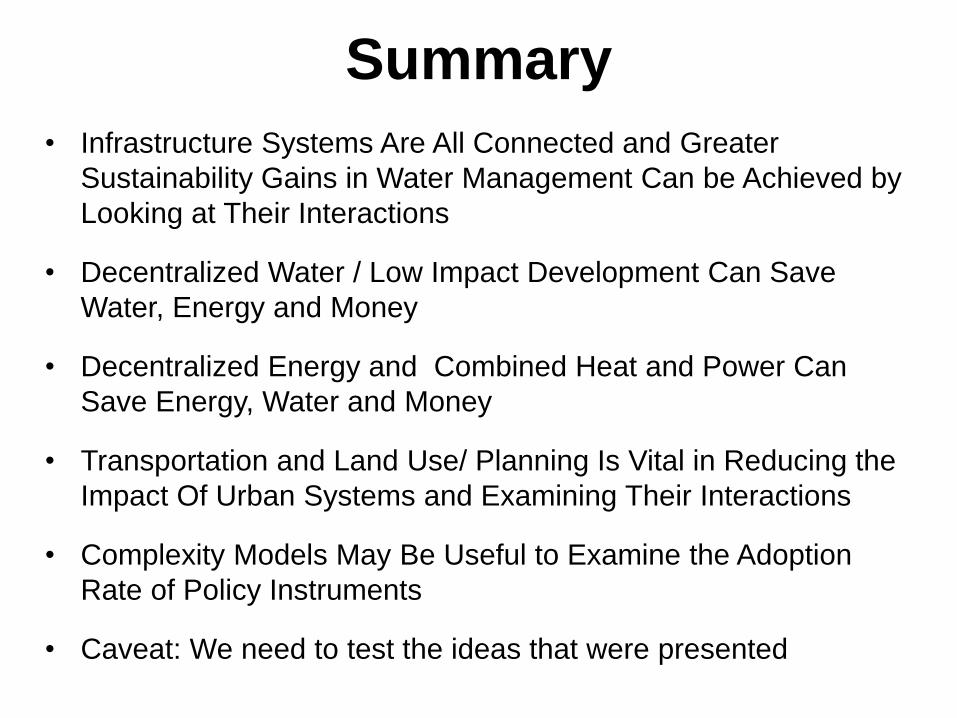
Summary
• Infrastructure Systems Are All Connected and Greater
Sustainability Gains in Water Management Can be Achieved by
Looking at Their Interactions
• Decentralized Water / Low Impact Development Can Save
Water, Energy and Money
• Decentralized Energy and Combined Heat and Power Can
Save Energy, Water and Money
• Transportation and Land Use/ Planning Is Vital in Reducing the
Impact Of Urban Systems and Examining Their Interactions
• Complexity Models May Be Useful to Examine the Adoption
Rate of Policy Instruments
• Caveat: We need to test the ideas that were presented
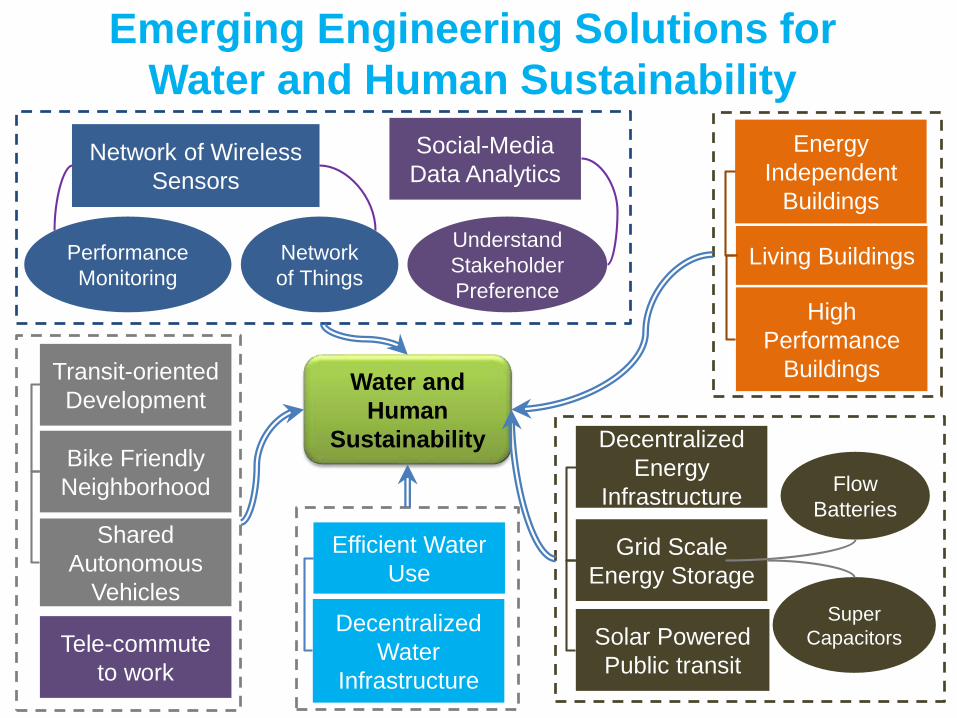
Emerging Engineering Solutions for
Water and Human Sustainability
Water and
Human
Sustainability
Transit-oriented
Development
Bike Friendly
Neighborhood
Tele-commute
to work
Shared
Autonomous
Vehicles
Network of Wireless
Sensors
Social-Media
Data Analytics
Understand
Stakeholder
Preference
Performance
Monitoring
Network
of Things
High
Performance
Buildings
Living Buildings
Energy
Independent
Buildings
Grid Scale
Energy Storage
Flow
Batteries
Super
CapacitorsSolar Powered
Public transit
Decentralized
Energy
Infrastructure
Decentralized
Water
Infrastructure
Efficient Water
Use
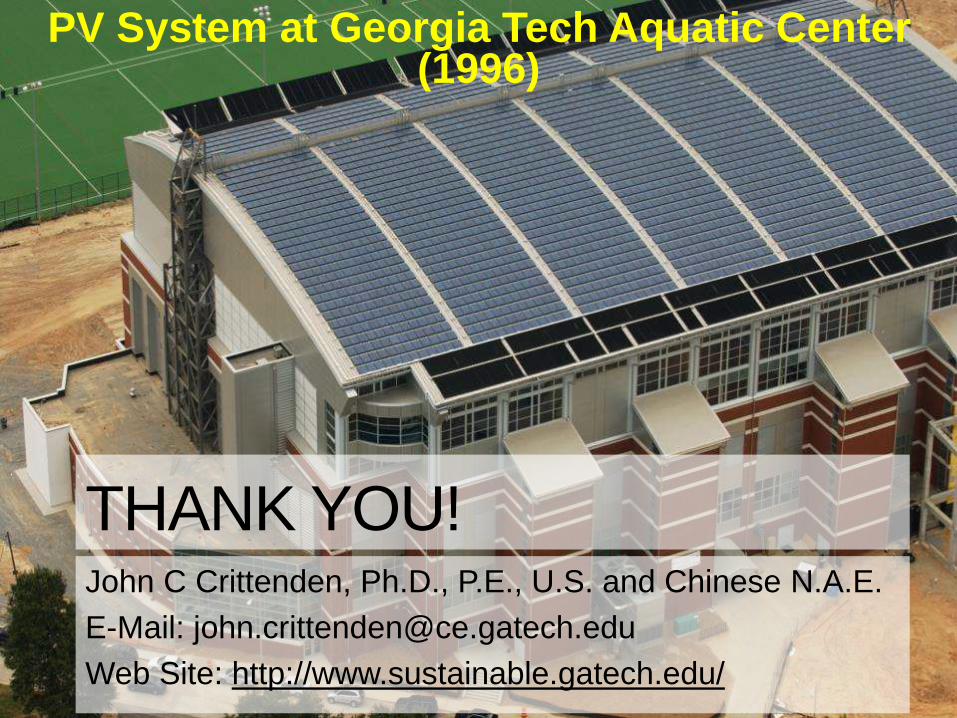
PV System at Georgia Tech Aquatic Center (1996)
THANK YOU!John C Crittenden, Ph.D., P.E., U.S. and Chinese N.A.E.
E-Mail: [email protected]
Web Site: http://www.sustainable.gatech.edu/


