
Water for a Healthy Country of acidic, metal-contaminated groundwater Page iv List of Tables Table...
48
Water for a Healthy Country Treatment of saline, acidic, metal- contaminated groundwater from the WA Wheatbelt Use of fluidised bed biofilm reactors for increasing pH and removal of metals Peter D Franzmann 1 , Jason J Plumb 1 , Jason T Wylie 1 , Wendy R Robertson 1 , Grant B Douglas 1 , Trevor P Bastow 1 , Anna H Kaksonen 2 and Jaakko A Puhakka 2 1 CSIRO Land and Water, Underwood Ave, Floreat WA 6014 2 Tampere University of Technology, 33101 Tampere, Finland
Transcript of Water for a Healthy Country of acidic, metal-contaminated groundwater Page iv List of Tables Table...

Water for a Healthy Country
Treatment of saline, acidic, metal-contaminated groundwater from the
WA Wheatbelt
Use of fluidised bed biofilm reactors for increasing pH and removal of metals
Peter D Franzmann1, Jason J Plumb1, Jason T Wylie1,
Wendy R Robertson1, Grant B Douglas1, Trevor P Bastow1, Anna H Kaksonen2 and
Jaakko A Puhakka2
1CSIRO Land and Water, Underwood Ave, Floreat WA 6014 2Tampere University of Technology, 33101 Tampere, Finland
Water for a Healthy Country
Treatment of saline, acidic, metal-contaminated groundwater from the
WA Wheatbelt
Use of fluidised bed biofilm reactors for increasing pH and removal of metals
Peter D Franzmann1, Jason J Plumb1, Jason T Wylie1, Wendy R Robertson1, Grant B Douglas1,
Trevor P Bastow1, Anna H Kaksonen2 and Jaakko A Puhakka2
1CSIRO Land and Water, Underwood Ave, Floreat WA 6014 2Tampere University of Technology, 33101 Tampere, Finland

The Water for a Healthy Country National Research Flagship is a research partnership between CSIRO, state and federal governments, private and public industry and other research providers.
The Flagship was established in 2003 as part of the CSIRO National Research Flagship Initiative.
The work contained in this report is collaboration between CSIRO Land and Water and the Institute of Environmental Engineering and Biotechnology, Tampere University of Technology, 33101 Tampere, Finland. It was funded by the Premier’s Water Foundation of Western Australia, and the CSIRO Water for a Healthy Country Flagship.
© Commonwealth of Australia 2007 All rights reserved. This work is copyright. Apart from any use as permitted under the Copyright Act 1968, no part may be reproduced by any process without prior written permission from the Commonwealth.
Citation: Franzmann, P.D., Plumb, J.J., Wylie, J.T., Robertson, W.R., Douglas, G.B., Bastow, T.P., Kaksonen, A.H., Puhakka, J.A., 2007. Treatment of saline, acidic, metal-contaminated groundwaters from the WA Wheatbelt. CSIRO: Water for a Healthy Country National Research Flagship Canberra.
DISCLAIMER You accept all risks and responsibility for losses, damages, costs and other consequences resulting directly or indirectly from using this report and any information or material available from it.
To the maximum permitted by law, CSIRO excludes all liability to any person arising directly or indirectly from using this report and any information or material available from it.
The views expressed in this report are not necessarily the views of the Government of Western Australia, nor the Premier’s Water Foundation.
For further information contact: Ph: 02 6246 4565
Fax: 02 6246 4564
www.csiro.au
Printed 2007

Treatment of acidic, metal-contaminated groundwater Page i
Acknowledgements
This study was funded by the Premier’s Water Foundation of Western Australia and the CSIRO Water for a Healthy Country Flagship.
The authors thank Don McFarlane (CSIRO), Brad Degens (Department of Water), and Richard George (Department of Agriculture) for reviewing drafts of this report, Mrs Viv Baker for formatting and report production, and Mr Steve Fry, Landcare co-ordinator for the Narembeen district, for assistance with water collection and logistics.

Treatment of acidic, metal-contaminated groundwater Page ii
Table of Contents
Acknowledgements................................................................................................................ i Table of Contents .................................................................................................................. ii List of Figures....................................................................................................................... iii List of Tables ........................................................................................................................ iv Summary................................................................................................................................ v 1. Introduction................................................................................................................. 1
1.1 Secondary salinisation and drainage in the Western Australian Wheatbelt....................1 1.2 Use of sulfate-reducing fluidised bed reactors (FBR) for removal of metals and
acidity...............................................................................................................................3 1.3 Aims of this study.............................................................................................................4
2. Materials and Methods............................................................................................... 5 2.1 Sources of water, bacteria and bioreactor configuration .................................................5 2.2 Methods for the analysis of reactor influent, effluent, mineral salts and sulfidic
precipitates ......................................................................................................................8 3. Results and Discussion ........................................................................................... 10
3.1 Reactor performance.....................................................................................................10 3.1.1. Reactor performance for treating Narembeen groundwater ...........................10 3.1.2. Reactor performance on Kellerberrin influent water........................................16 3.1.3. Technical evaluation of the potential for treating Wheatbelt groundwater by
sulfate-reducing bioreactors ............................................................................19 3.2 Metals collected from the treatment of Narembeen groundwater .................................20 3.3 Salts from the treatment of Wheatbelt groundwaters ....................................................23 3.4 Economic Estimates ......................................................................................................30
References ........................................................................................................................... 35

Treatment of acidic, metal-contaminated groundwater Page iii
List of Figures
Figure 1.1 Photograph of a drain at Narembeen in the wheatbelt of Western Australia ...1 Figure 2.1 Collection of groundwater from production bore NB 27I in Narembeen...........5 Figure 2.2 Photograph and schematic drawing of the fluidised bed sulfate-reducing bioreactors fed with saline acidic groundwater from the Wheatbelt of Western Australia, ethanol as an electron donor, and nutrients .......................................................6 Figure 3.1 Hydraulic retention time (HRT) and water quality changes in Narembeen water during treatment by a sulfate-reducing fluidised bed film bioreactor under different operational settings for reactor A: ......................................................................12 Figure 3.1 (cont’d) Water quality changes in Narembeen water during treatment by a sulfate-reducing fluidised bed bioreactor under different operational settings for Reactor A: ........................................................................................................................13 Figure 3.2 Water quality changes in Kellerberrin water during treatment by a sulfate-reducing fluidised bed bioreactor with different hydraulic retention times (HRT) .............16 Figure 3.3 XRD analysis of precipitates from the settler of bioreactor A while treating Narembeen water. The analysis shows a mixture of amorphous compounds with a trace signal for quartz in green.........................................................................................22 Figure 3.4 Particle size distribution of precipitates in the settler of bioreactor A during treatment of Narembeen influent water. The median particle size was 2.0 μm, and the maximum particle size was ca. 120 μm............................................................................22 Figure 3.5 Modelled pH versus reaction progress (expressed as a fraction of the initial volume evaporated) for FBR-treated Narembeen water ..................................................24 Figure 3.6 Modelled mineral saturation index (log Q/K) versus reaction progress (expressed as a fraction of the initial volume evaporated) for FBR-treated Narembeen water. A number of minerals that remain under-saturated (log (Q/K)<0) throughout the evaporation have been omitted for clarity. .......................................................................24 Figure 3.7 Modelled solution composition versus reaction progress (expressed as a fraction of the initial volume evaporated) for FBR-treated Narembeen water ..................25 Figure 3.8 Modelled mass of precipitated minerals versus reaction progress (expressed as a fraction of the initial volume evaporated) for FBR-treated Narembeen water.................................................................................................................................25 Figure 3.9 Modelled pH versus reaction progress (expressed as a fraction of the initial volume evaporated) for untreated Narembeen water.......................................................26 Figure 3.10 Modelled mineral saturation index (log Q/K) versus reaction progress (expressed as a fraction of the initial volume evaporated) for untreated Narembeen water. A number of minerals that remained undersaturated (log (Q/K)<0) throughout the evaporation have been omitted for clarity ..................................................................27 Figure 3.11 Modelled solution composition versus reaction progress (expressed as a fraction of the initial volume evaporated) for untreated Narembeen water.......................27 Figure 3.12 Modelled mass of precipitated minerals versus reaction progress (expressed as a fraction of the initial volume evaporated) for untreated Narembeen water.................................................................................................................................28

Treatment of acidic, metal-contaminated groundwater Page iv
List of Tables
Table 3.1 Concentrations of major cations and anions in Narembeen water influent water to, and effluent from, sulfate reducing bioreactors on 18th September, 2006, and the average % removal of ions on ten separate sampling occasions between days 300 to 314 of operation, compared with ion removal by lime treatment to the same pH. Underlined values are above Australian Drinking Water Quality Guidelines for health or aesthetics, although values are not provided in the guidelines for many of the ions. Values in blue are for ions that were not as effectively removed by lime than by the bioreactor. Values in red are for ions that are not as effectively removed by the bioreactor than by lime. ....................................................................................................15 Table 3.2 Concentrations of major and trace cations and anions in Kellerberrin water influent to and effluent from sulfate-reducing bioreactors on 1st to 9th of September, 2006, and the average % removal of ions on ten separate sampling occasions. Underlined values are above Australian Drinking Water Quality Guidelines for health or aesthetics, although guidelines are not provided for many of the ions.............................18 Table 3.3 Comparison of the rate of sulfate reduction achieved in this study with those achieved in other studies that employed fluidised bed reactors.......................................20 Table 3.4 Concentrations of metals and metalloids (mg kg-1) in precipitates collected in the settlers from the effluent of two sulfate-reducing bioreactors treating Narembeen water.................................................................................................................................21 Table 3.5 Percent evaporation and estimated moles of Na and Mg precipitated and Na/Mg molar ratio in the precipitate from FBR-treated Narembeen effluent water ..........24 Table 3.6 Concentrations of metals and metalloids in solution after dissolution of 1 gram of salt (crystallised by evaporation of bioreactor effluent and Narembeen influent waters to dryness at 50 °C) in 100 mL of MilliQ water, compared with the metals in 1 g of commercially available table salt dissolved in 100 mL MilliQ water. Values in red are for elements that are in greater amounts in salts precipitated from FBR-treated water than in commercial table salt, whereas values in blue are for cations that are in lesser amounts in salts precipitated from FBR-treated water than in commercial table salt.......29 Table 3.7 Average values of pH, depth to groundwater and electrical conductivity for Wheatbelt rural towns.......................................................................................................31 Table 3.8 Estimate of the costs associated with the treatment of 310 kL day-1 of Narembeen saline, metal contaminated, acidic water with a sulfate-reducing fluidised-bed bioreactor for the production of 155 kL day-1 potable water through desalination.....32

Treatment of acidic, metal-contaminated groundwater Page v
Summary
The Wheatbelt of Western Australia has an excess of water of poor quality due to recent landscape clearing, its flat topography, high salt stores and rising water tables. As a result, secondary salinisation associated with the rising groundwater threatens road and town infrastructure, agricultural productivity in the valleys, and the biodiversity in remnant bushland and wetlands in the region. Groundwater drainage is often problematic due to the low relief in the landscape. These groundwaters in many regions are also acidic, and contain elevated concentrations of metal contaminants such as aluminium, iron, zinc, lead, copper, chromium and uranium.
There have been a number of reports that have called for the examination of the potential to use this saline, metal-containing water as a resource; as a source of potable water derived from desalination, and as a source of metals and salts collected from the desalination reject waters (George & Coleman, 2001; Barron, 2006; Barron & Zil, 2006; Sparks et al., 2006). For many of these uses, the pH of the water must be raised and the metal contents need to be reduced. The potential of sulfate-reducing fluidised bed bioreactors for the pre-treatment of acidic, metal-contaminated, saline groundwater from the Wheatbelt of Western Australia was examined in this project. Sulfate-reducing processes are being introduced into the mining industry to deal with the treatment of acid mine drainage (Doshi, 2006), to recover metals from process streams (De Vegt et al., 1998) and to ameliorate the pH of the drainage waters (Doshi, 2006). Sulfate-reducing processes have not been tested on saline waters such as those of the Wheatbelt. Given the potential for the technology, examination of its application to the problematic waters of the Wheatbelt of Western Australia was warranted, especially because of the expectation of the recovery of metals, and salts free from metal contaminants.
One of the rural towns with shallow, saline acidic groundwater is Narembeen. Treatment of water from Narembeen is challenging because of its low pH of 3.1 and its high salt content of 59 g L-1 (the salinity of seawater is ca. 35 g L-1 or 35 ppt), with relatively high concentrations of aluminium, lead, zinc and uranium; 156 mg L-1, 152 μg L-1, 722 μg L-1 and 16 μg L-1, respectively. Less challenging waters from the nearby town of Kellerberrin were also tested briefly.
The sulfate-reducing process used ethanol as an electron donor, and could operate on Narembeen groundwater under continuous conditions with a hydraulic retention time (HRT) of 20 hours. The process limits were tested on a number of occasions and process performance was found to be unstable with a HRT of 16 hours. At higher HRT, effluent water pH was raised to pH values > 6, and the concentrations of most metals were substantially reduced. For example, concentrations of aluminium, lead, zinc and uranium were reduced by 98%, 99%, 98% and >97%, respectively. Notably, dissolved silicon, the major foulant of desalination membranes when treating groundwater from the Wheatbelt, was reduced from 54 to 3.8 mg L-1 by the sulfate reducing fluidised bed bioreactor process.
Metal sulfide precipitate collected from the process was amorphous in nature. In the opinion of representatives of two mining companies the complexity of the mixture of metals most probably precluded recovery of economic amounts of refined metals from the precipitate. Therefore the potential for establishment of a mineral recovery industry associated with desalination would be very low. The metal precipitate would need to be managed as a waste by-product unless some other use for the material could be found.
Modelling of the precipitation of salts from water treated by the sulfate-reducing fluidised bed reactor indicated that relatively magnesium-free halite (NaCl) could be recovered with evaporation of 85 to 90 % of its water content. Salt produced via the evaporation of the treated water contained a suite of minor metal contaminants similar in concentrations to those found in commercially available table salt. Concentrations of five trace metal contaminants were slightly elevated in the salt prepared from treated Narembeen water,

Treatment of acidic, metal-contaminated groundwater Page vi
whereas a further 27 trace metal contaminants were in lesser concentration than found in commercially available table salt. Pre-treatment of saline Wheatbelt water via sulfate-reducing fluidised bed bioreactors prior to desalination may allow the development of commercial salt production from the desalination reject waters.
Less challenging Kellerberrin water (pH, 4.2; total salts, 25.3 g L-1) that contained aluminium, lead, zinc and uranium at concentrations of 3.3 mg L-1, 150 μg L-1, 68 μg L-1 and 72 μg L-1, respectively, was much more easily treated than the Narembeen water. For the treatment of Kellerberrin water, a stable bioreactor pre-treatment was achieved with a HRT of 4 hours. The maximal rate of sulfate reduction using either type of water in the laboratory system was similar at about 3 g sulfate (L-reactor)-1. The unit (L-reactor)-1 equates to “per litre of reactor volume”. The rates compare well with rates determined in other systems (2.2 to 6.8 g sulfate (L-reactor)-1).
An estimate of cost for implementing the sulfate-reducing fluidised bed pre-treatment at Narembeen was developed with the intent of providing pre-treatment for 310 kL day-1 of groundwater, for production of the average annual potable water use of the town; 115 kL day-1. In making this estimate, a range of assumptions and estimates were required and these are detailed in the final section of the report. Cost of the sulfate-reducing fluidised bed bioreactor treatment with associated infrastructure was estimated at $3.72 kL-1. This value included an estimate of a financial return based on the economic value of salt production. Costs of implementation of the process at other Wheatbelt towns may not vary greatly. In the case of Kellerberrin, because the HRT of the process dictates the volume of reactor vessel required for treatment of a fixed volume of water, the capital cost in constructing bioreactors for treatment of Kellerberrin groundwater would be about 66% of the cost of treatment of Narembeen water. However, as costs of much of the associated infrastructure such as salaries, evaporation ponds and piping do not change with the retention time the overall costs of implementation do not vary greatly. When the recovery of costs through salt production is considered, the costs of treating the same volume of Kellerberrin and Narembeen water are very similar, as Kellerberrin water contains considerably less salt.
Barron and Zil (2006) estimated the cost of groundwater desalination at another Wheatbelt rural town, Katanning, was about $2.21 kL-1, Pre-treatment of the water at Katanning was not considered by Barron and Zil, and some reservations concerning potential fouling of desalination membranes due to silicon were expressed in the report. An estimate of the cost of treating Narembeen groundwater for the production of potable water and salt inclusive of the costs of pre-treatment and desalination is therefore $5.93 kL-1. Interpretation of these estimates for a full-scale process based on the outcomes of laboratory experimentation should be treated with great caution. The estimation of these costs was based on the purchase of all new capital equipment. The use of second had pumps and tanks could see the costs reduce. There may also be potential to consider other reactor configurations such as shandies of mixed “pre- processed” with raw waters to reduce processing costs. The cost of implementation determined in this study with all its inherent assumptions on costs, can be compared with estimates of delivering potable water from the Kalgoorlie scheme ($3.02 kL-1) or water for areas remote from the Kalgoorlie pipeline ($7.56 kL-1; Gary Crisp, Water Corporation, as cited by Barron and Zil, 2006).
The economic benefit of implementing a combined pre-treatment and desalination technology for treating acidic, saline, metal-contaminated groundwater should not be restricted to the consideration of the value of the produced water and salt. These comparisons do not take into account the environmental and infrastructure damage associated with acidity and salinisation. The cost of repairing such damage at Narembeen could amount to as much as $2.05 million with a time to impact of five years. In the Wheatbelt generally economic losses associated with risks to biodiversity and to road and rail infrastructure have been estimated at $854million and $2,114million, respectively (Sparkes et al., 2006).

Treatment of acidic, metal-contaminated groundwater Page vii
Implementation of sulfate-reducing fluidised bed reactor technology for treating acidic, saline, metal-containing water from the Wheatbelt of Western Australia cannot be proceeded with based on the outcomes from this study only. The next step towards its implementation, should it be considered appropriate, would be to prove the technology at pilot scale. This would improve confidence in the technology, and provide a more reliable understanding of the cost of implementation which cannot be derived accurately from laboratory scale tests. If sulfate-reducing fluidised bed reactors were considered technologically appropriate at larger scale, the decision to use them or not would be based on; the necessity to take action, the comparative effectiveness of competing technologies, and the relative costs of competing technologies such as lime treatment or mixing of waters with waters of naturally higher pH. Douglas and Degens (2006) examined the potential that many of the competing technologies could offer for the treatment of acidic, metal-contaminated waters. Their desk top study of available technologies does not allow comparisons of outcomes or costs, or advantages and disadvantages, associated with treatment of Wheatbelt waters, as the technologies were not tested. A comparison of competing technologies cannot be made as yet and is beyond the scope of this study. For example, lime treatment is considered the standard approach for the remediation of acidic waters, but its application in the Wheatbelt in a continuous process has not been tested. Operational considerations for use of lime would include the potential for over or under dosing, the need for mechanical mixing, the behaviour of metals at different pH values, whether cationic flocculants were required, the practicality of sludge dewatering, the impact of higher calcium concentrations in the product water, mechanical and labour requirements for dosing, and the long term stability of the sludge. In our experiments, lime dosing was not quite as effective as the sulfate-reducing fluidised bed bioreactor at removing uranium, arsenic, nickel, cobalt, selenium and chromium.
Sulfate-reducing technology is being taken up by the mining industry for the treatment of acidic, metal contaminated environmental waters in the USA and South Africa. Experience with this technology in Western Australia is limited to research laboratories. There is a need for cost effective methods for treating acid drainage or surface waters in Western Australia, such as for improving the water quality in Collie lakes (such Kepwari Lake with pH of 4.5-4.9, and Chicken Creek Lake with pH of 2.6), for treating acid drainage from soils in the Swan and Peel Estuaries, and for treating mine lakes associated with the mining of iron ore in the Pilbara region of WA. Sulfate-reducing technology may have a role in ameliorating acidity and associated metal contents in these waters.

Treatment of acidic, metal-contaminated groundwater Page 1
1. Introduction
1.1 Secondary salinisation and drainage in the Western Australian Wheatbelt
In the Wheatbelt of Western Australia, the reduction in evapotraspiration associated with land clearing that occurred largely after the 1940s, has lead to rising water levels in saline aquifers with impacts on many valley floor farms, infrastructure and towns in the region. Restoration of these lands by revegetation is not considered feasible (Hatton et al., 2003). Currently, over one million hectares are affected by the secondary salinisation; salinisation caused by changes to land use. Deep open drains have been used as an engineering solution, and by 2005, as much as 15000 km of drains had been constructed in the WA wheatbelt (Fitzpatrick et al., 2005). The drains have been estimated to influence water tables beneath land in the eastern Wheatbelt for up to 300 m from the drain (Ali et al., 2004). In one instance, installation of 23 km of drainage cost $100,000, which is expected to be recovered from the increased agricultural productivity of the land (Landline 2005). There is no consensus in Wheatbelt communities as to whether the use of drainage for the reclamation of salinised land is appropriate, as the drainage has generally been applied in the absence of a regulatory framework, and in some cases, without due consideration of the science of drainage, the disposal of the drainage waters or the costs of transporting them. Recent legal action has also made drainage less certain. The court determined that existing drains worth $150,000 must be blocked until a disposal system is developed to stop saline water running into the creek system of downstream properties (The West Australian, 9th January 2007). This ruling has put the future construction of deep drains as an engineering solution to the salinity problem in some doubt, especially where adequate disposal systems have not been developed.
Figure 1.1 Photograph of a drain at Narembeen in the wheatbelt of Western Australia

Treatment of acidic, metal-contaminated groundwater Page 2
Some drainage waters and groundwaters are highly acidic and enriched in metal contaminants such as aluminium, iron, zinc, arsenic, lead, copper, chromium and uranium and some rare earth elements such as lanthanum and cerium (Fitzpatrick et al., 2005). There are concerns around the impact the acid and metals in the drainage waters may have on receiving environments such as wetlands, lakes, floodplains and creek lines. Water from deep drainage is likely to increase the frequency of acidic surface waters in the wheatbelt. Naturally occurring acidic saline playas around Scaddon are the most species poor wetlands in Western Australia (Halse, 2004) so an increase in acidity in wetlands may impact upon the biodiversity of aquatic systems in the wheatbelt region (Davis, 2004). Modelling of the geochemical changes that occur during the evaporation of Narembeen water shows the pH might decrease to < -1.0 when 99.9 % of the water is evaporated (Grant Douglas, unpublished data). This increase in acidity in evaporative receiving bodies could have serious environmental consequences, as lower pH can affect the biodiversity in the receiving environments (Halse, 2004).
There have been a number of reports that have called for the examination of the potential to use this saline, metal-containing water as a resource; as a source of potable water derived from desalination, and as a source of metals and salts collected from the desalination reject waters (George & Coleman, 2001; Barron, 2006; Barron & Zil, 2006; Sparks et al., 2006). In seeking solutions to the problems associated with secondary salinity in the wheatbelt, there is considerable interest in obtaining an economic return from the productive use of saline water such as is done in Victoria by Pyramid Salt Pty Ltd (http://www.pyramidsalt.com.au/products.html). In Western Australia, salt recovered from 1 ML of hypersaline water (TDS 186 g L-1) per day could return $1Million per year, although transportation costs of inland salt production usually puts it at an economic disadvantage to production at the coast (Aral and Barron, 2004). One company, WA Salt Supply, has been producing salt from the wheatbelt since 1944, and in 2001/02 produced $5.6 million worth of salt from Lake Deborah (Department of Local Government and Regional Development, 2003). For low pH waters that carry considerable concentrations of heavy metals, a method for metal removal to lower the levels of metal contaminants in saline water prior to collection of the salts via evaporation would need to be used. It has been speculated that if metals, such as rare earth elements, could be captured from the saline drainage water, some further economic benefit could be realised (Barron et al., 2003).
The other commodity of value in saline, acidic wheatbelt water is the water itself. A business plan developed for the town of Katanning showed that the cost of providing potable water by desalinisation of local groundwater at Katanning was potentially less than the provision of water through the existing scheme which supplies water via a pipeline from Perth (Barron & Zil, 2006) although that analysis did not account for the cost of lost opportunity from not utilising the existing pipeline infrastructure for the current water supply. Although this estimate did not take into account the liability and risk costs associated with operating a small desalination unit in the wheatbelt, it also did not account for the economic opportunity associated with reduction of the water table and associated environmental protection.
The low pH of some wheatbelt water may affect its suitability for treatment by desalination, as desalination increases the acidity of low pH waters to extremely low pH values (pH < 0.0) making it unsuitable for machinery and environmental or human exposure. Recovery of the resources of water, metals and salt from low pH waters would depend upon an economic process that could raise the pH and remove metals from the water prior to desalination, for the production of potable water, and for the production of salt through evaporation of the “metal depleted” waste water reverse osmosis reject stream.
Acid waste waters are problematic for the environment world wide. They are largely produced through Acid Rock Drainage (ARD) generated by mining operations. The Mineral Policy Centre of the US EPA estimates that the cost of reclaiming the worst 363,000 abandoned mine land sites in the USA at $US32 to $US72 Billion (Doshi, 2006). Validated methods for the amelioration of acidic metal-containing waters are required, and if successful, would have international application.

Treatment of acidic, metal-contaminated groundwater Page 3
1.2 Use of sulfate-reducing fluidised bed reactors (FBR) for removal of metals and acidity
Low pH (pH 2.5) metal containing (350 mg L-1 zinc) waters have been treated successfully in laboratory scale sulfate-reducing fluidised bed bioreactors to increase pH (to above pH 7.5) and to remove 99 % of the metal (as zinc sulfide) (Kaksonen et al., 2003b).
Ethanol was used as the electron donor for sulfate reduction in the following two step reaction, carried out by sulfate-reducing bacteria:
2CH3CH2OH + SO42- 2CH3COO- + H+ + HS- + 2H2O [1]
2CH3COO- + 2SO42- 4HCO3
- + 2HS- [2]
In reality, the bacteria excrete hydrogen sulfide that partially dissociates in water to release protons.
H2S HS- + H+ pHa1 = 6.97 (25 °C). [3]
The bicarbonate generated by reaction [2] decreases acidity.
HCO3- + H+ CO2 (g) + H2O [4]
The hydrogen sulfide precipitates metal ions as solid metal sulfides.
H2S + M2+ MS (s) + 2H+ [5]
Although the final reaction [5] generates protons, in practice, provided sulfate reduction produces H2S in excess [1 and 2], then proton consumption associated with bicarbonate production greatly exceeds the proton production via metal precipitation and results in a higher pH final product (Kaksonen et al., 2003b). Some metals, for example uranium, are directly enzymatically reduced by sulfate reducing bacteria to form insoluble precipitates (Spear et al., 2000). Aluminium, which often occurs in acid drainage, can be removed in sulfate reducing systems through the formation of alunite (see equation [6]; Gusek, 2002). Lime treatment systems generally precipitate aluminium as gibbsite [Al (OH)3] which is a gelatinous solid that tends to cause plugging and fouling.
3Al3+ + K+ + 6H2O + 2SO42- KAl3(OH)6(SO4)2 (Alunite) + 6H+ [6]
If urea is used as a nitrogen source for the growth of the bacterial community, carbonate is generated through the hydrolysis of urea [7], as described by Fujita et al (2000). The carbonate decreases acidity [8].
CO(NH2)2 +2H2O NH4+ + CO3
2- [7]
CO32- + 2H+ 2HCO3
- [8]

Treatment of acidic, metal-contaminated groundwater Page 4
Biologically generated hydrogen sulfide has been used commercially to recover copper and remove arsenic and cadmium at Kennecott’s Utah copper mine. It has been suggested that H2S can be produced biologically for less than $US500/ton S (de Vegt et al., 1998). Metals are recovered as a compact metal sulfide sludge and discharge waters contain ppb concentrations of metals. Hydrogen was used as the electron donor, instead of ethanol, at the Kennecott operation. Biologically produced H2S has been used in a number of operations for metal recovery or treatment of contaminated mine waters.
The economics of the treatment of metal containing low pH waste waters by biological sulfate reduction has been compared with that of lime treatment. According to de Vegt et al. (1998), the biological route offers considerable savings, roughly about half the cost of lime treatment when costs of sludge disposal are considered. Metals that are readily removed by reaction with H2S include zinc, copper, cobalt, iron, nickel, cadmium, and other divalent metals. Rare earth elements also form metal sulfide complexes (G.B. Douglas, Personal Communication), and aluminium is removed as described above. Uranium is reduced to its relatively insoluble U(VI), and selenium is reduced to its relatively insoluble form, elemental selenium (Gusek, 2002). Removal of metals and increase in the pH of the water should allow desalination and the recovery of potable water and salt from the saline waters of the wheat belt. The value of the captured metals themselves may not be great (Barron et al., 2003), but may add to the net economic benefit.
Although sulfate reduction occurs in marine and hypersaline waters (Brandt & Ingvorsen, 1997), and indeed in the surface sediments of most of the drains of the wheatbelt (Fitzpatrick et al., 2005), the application of bioreactors for the treatment of acidic metal-containing waters has concentrated on low salinity waste streams. To determine the ultimate process requirements which are dependent on reaction kinetics, experimentation with the actual wastewaters is required.
1.3 Aims of this study
The aims of this study were to:
Develop a sulfate-reducing fluidised bed bioreactor fed by saline, low pH, metal containing groundwater from Narembeen in the Wheatbelt of Western Australia. The bioreactor would be similar in design to the reactor used by Kaksonen et al (2003b) and sulfidic saline sediments from the wheatbelt would serve as the source of the sulfate-reducing bacteria:
Once the sulfate reducing process is active in the reactor, reduce the hydraulic retention time (HRT) of the influent water to determine the minimum possible treatment time:
Examine the geochemistry and mineralogy of the solids produced by the process and based on their composition and morphology, assess their potential economic value:
Examine salts crystallised from the reactor effluent and determine their suitability for productive use:
Based on an understanding of the performance of the reactor, prepare cost estimates for treating Narembeen groundwater for the reduction of acidity to a pH of > 6 with removal of metals:
Conduct a short duration test on the suitability of the fluidised bed reactor for treating less acidic and less saline groundwater from the wheatbelt region of Kellerberrin.
Completion of these objectives should enable a reasonable assessment as to the appropriateness (or not) of using bioreactors for treating acidic, metal-contaminated drainage waters in the wheatbelt of Western Australia, so as to reduce their environmental impact, and to determine if these waters could serve as a resource for the region.

Treatment of acidic, metal-contaminated groundwater Page 5
2. Materials and Methods
2.1 Sources of water, bacteria and bioreactor configuration
Sources of acidic, saline, metal contaminated water for the study Previous surveys of groundwaters in the Wheatbelt have located saline waters of low pH with high metal concentrations (David Grey, CSIRO Exploration and Mining, Personal Communication). Groundwater was chosen as the source of natural saline acidic water from the Wheatbelt so as to provide a constant, uniform supply of influent water to enable the development of stable bioreactor performance over a period of months. Drainage waters were not used as the water quality and quantity can vary greatly with season (Fitzpatrick et al., 2005), although some can be dominated by groundwater discharge. For the major part of the study, water from a production bore in Narembeen, bore NB 27I, was used (Figure 2.1). The water from the bore was pH 3.1, electrical conductivity 7300 mS m-1, contained a sulfate concentration of 2.26 g L-1, total salts 58.77 g L-1,and contained a suite of metals such as aluminium, 156 mg L-1; lead, 152 μg L-1, zinc 722 μg L-1; and uranium, 16 μg L-1.
A secondary objective of the study was to test the efficacy of the sulfate-reducing fluidised bed bioreactor on less saline and less acidic water which commonly occurs in the Wheatbelt. For this objective, water was collected from a mixture of two bores near Kellerberrin, bores 00KE23D (20 L) and 00KE25D (180 L). The mixed water was of pH 4.2, electrical conductivity 3820 mS m-1, and contained sulfate 0.78 g L-1; total salts 25.26 g L-1, aluminium, 3.3 mg L-1; lead, 150 μg L-1, zinc 68 μg L-1; and uranium, 72 μg L-1.
Figure 2.1 Collection of groundwater from production bore NB 27I in Narembeen
Treatment of acidic, metal-contaminated groundwater Page 6
Sediment samples and enrichment cultures for sulfate-reducing bacteria Sediment samples were collected from a saline, sulfide-rich creek and drain near the town of Narembeen (32° 06’04.13S; 118° 13’11.36”E). The samples had an odour of hydrogen sulfide and contained amorphous black precipitates. The collection vials were filled and sealed without any headspace. The samples were used to inoculate media prepared for the growth of sulfate-reducing bacteria. The media contained urea, 0.6 g; KH2PO4, 0.5 g, and either ethanol 0.62 g or sodium acetate 0.82 g that was dissolved in 1000 mL of Narembeen groundwater (originally of pH 3.4, electrical conductivity 73 mS cm-1, total salts 58.77 g L-1, sulfate concentration 2.26 g L-1) which had been neutralised to pH 7 with 3 M NaOH. The media were purged with N2 gas and sealed under butyl rubber with a N2 headspace. Sodium sulfide (Na2S.9H2O) was added from a sterile stock solution to a final concentration of 0.075 g L-1. Enrichment cultures were incubated at 28 °C and subcultured into fresh medium (10 % by volume) when microscopic examination of the medium showed bacterial growth. The prepared cultures showed good growth on ethanol but sustained microbial growth on acetate was problematic. The fluidised bed reactors were inoculated with cultures grown on ethanol and some (ca. 5 g) of the sulfidic mud that had been collected from Narembeen.
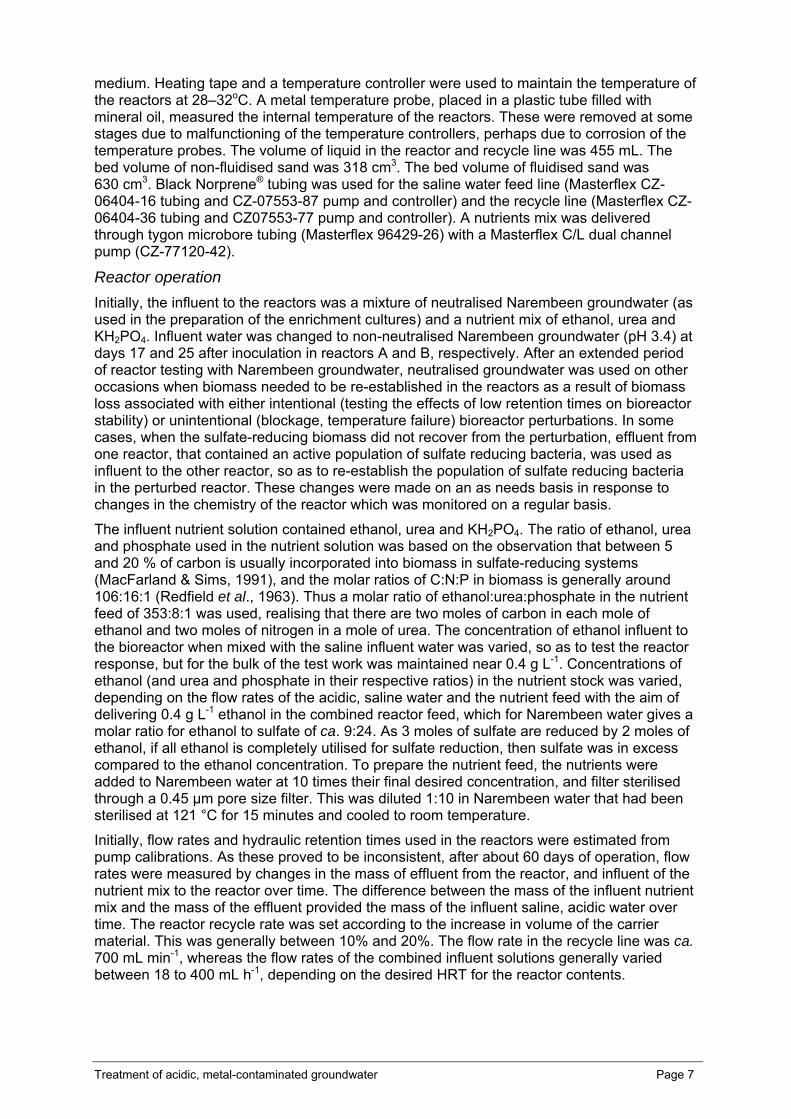
Reactor design and set-up Two fluidised bed reactors (FBRs) were built based on a design used previously for the treatment of synthetic acidic mine wastewater by sulfate-reducing bacteria (Kaksonen et al. 2003a). Initially, the design was closely modelled on that used by Kaksonen et al., with the saline acidic water and nutrients being added at the base of the reactor after the recycle pump, but after some initial experimentation, the positions of the influent lines were changed to just prior to the pump that drove the recycling, so as to ensure no backpressure through the lines that fed the reactor with acidic saline water and nutrients (Figure 2.2).
Figure 2.2 Photograph and schematic drawing of the fluidised bed sulfate-reducing bioreactors fed with saline acidic groundwater from the Wheatbelt of Western Australia, ethanol as an electron donor, and nutrients
Initially, Perlite®, 0.25 to 0.5 mm, was used as the support medium, and glass beads were placed at the base of the reactor to prevent the movement of the medium into the lines that fed the base of the reactor. Although the Perlite® was initially fluidised, after a period of operation, it tended to float at the surface of the reactor and was therefore unsatisfactory as a biomass support medium. Sand (0.25–0.5 mm size fraction) was then used as support
Saline Acidic Water
Electron Donor + Nutrients
Settler
Temperature Probe
Effluent
Treatment of acidic, metal-contaminated groundwater Page 7
medium. Heating tape and a temperature controller were used to maintain the temperature of the reactors at 28–32oC. A metal temperature probe, placed in a plastic tube filled with mineral oil, measured the internal temperature of the reactors. These were removed at some stages due to malfunctioning of the temperature controllers, perhaps due to corrosion of the temperature probes. The volume of liquid in the reactor and recycle line was 455 mL. The bed volume of non-fluidised sand was 318 cm3. The bed volume of fluidised sand was 630 cm3. Black Norprene® tubing was used for the saline water feed line (Masterflex CZ-06404-16 tubing and CZ-07553-87 pump and controller) and the recycle line (Masterflex CZ-06404-36 tubing and CZ07553-77 pump and controller). A nutrients mix was delivered through tygon microbore tubing (Masterflex 96429-26) with a Masterflex C/L dual channel pump (CZ-77120-42).
Reactor operation Initially, the influent to the reactors was a mixture of neutralised Narembeen groundwater (as used in the preparation of the enrichment cultures) and a nutrient mix of ethanol, urea and KH2PO4. Influent water was changed to non-neutralised Narembeen groundwater (pH 3.4) at days 17 and 25 after inoculation in reactors A and B, respectively. After an extended period of reactor testing with Narembeen groundwater, neutralised groundwater was used on other occasions when biomass needed to be re-established in the reactors as a result of biomass loss associated with either intentional (testing the effects of low retention times on bioreactor stability) or unintentional (blockage, temperature failure) bioreactor perturbations. In some cases, when the sulfate-reducing biomass did not recover from the perturbation, effluent from one reactor, that contained an active population of sulfate reducing bacteria, was used as influent to the other reactor, so as to re-establish the population of sulfate reducing bacteria in the perturbed reactor. These changes were made on an as needs basis in response to changes in the chemistry of the reactor which was monitored on a regular basis.
The influent nutrient solution contained ethanol, urea and KH2PO4. The ratio of ethanol, urea and phosphate used in the nutrient solution was based on the observation that between 5 and 20 % of carbon is usually incorporated into biomass in sulfate-reducing systems (MacFarland & Sims, 1991), and the molar ratios of C:N:P in biomass is generally around 106:16:1 (Redfield et al., 1963). Thus a molar ratio of ethanol:urea:phosphate in the nutrient feed of 353:8:1 was used, realising that there are two moles of carbon in each mole of ethanol and two moles of nitrogen in a mole of urea. The concentration of ethanol influent to the bioreactor when mixed with the saline influent water was varied, so as to test the reactor response, but for the bulk of the test work was maintained near 0.4 g L-1. Concentrations of ethanol (and urea and phosphate in their respective ratios) in the nutrient stock was varied, depending on the flow rates of the acidic, saline water and the nutrient feed with the aim of delivering 0.4 g L-1 ethanol in the combined reactor feed, which for Narembeen water gives a molar ratio for ethanol to sulfate of ca. 9:24. As 3 moles of sulfate are reduced by 2 moles of ethanol, if all ethanol is completely utilised for sulfate reduction, then sulfate was in excess compared to the ethanol concentration. To prepare the nutrient feed, the nutrients were added to Narembeen water at 10 times their final desired concentration, and filter sterilised through a 0.45 μm pore size filter. This was diluted 1:10 in Narembeen water that had been sterilised at 121 °C for 15 minutes and cooled to room temperature.
Initially, flow rates and hydraulic retention times used in the reactors were estimated from pump calibrations. As these proved to be inconsistent, after about 60 days of operation, flow rates were measured by changes in the mass of effluent from the reactor, and influent of the nutrient mix to the reactor over time. The difference between the mass of the influent nutrient mix and the mass of the effluent provided the mass of the influent saline, acidic water over time. The reactor recycle rate was set according to the increase in volume of the carrier material. This was generally between 10% and 20%. The flow rate in the recycle line was ca. 700 mL min-1, whereas the flow rates of the combined influent solutions generally varied between 18 to 400 mL h-1, depending on the desired HRT for the reactor contents.

Treatment of acidic, metal-contaminated groundwater Page 8
2.2 Methods for the analysis of reactor influent, effluent, mineral salts and sulfidic precipitates
Routine analyses of reactor influent and effluent Influent water to and effluent solution from the bioreactors were analysed on a routine basis for: pH, alkalinity, total and volatile suspended solids and concentrations of ethanol, acetate, dissolved sulfide, iron and aluminium. Measurement of sulfate concentrations on influent and effluent solutions began 66 and 77 days after inoculation in Reactors A and B.
For the analysis of ethanol and acetate, aqueous samples (~10 mL) were centrifuged to remove solids and the supernatant acidified to < pH 2 (using 50 µL of 9 M hydrochloric acid). The acidified aqueous samples (500 μL) were transferred into GC autosampler vials (2 mL), to which 1.0 mL of deionized water and surrogate standards (100 μL of an aqueous solution containing 950 mg L−1 iso-butyric acid and 804 mg L−1 n-propanol; followed by 100 μL of a 6 M oxalic acid solution) were added. Quantitative analyses were carried out on samples using external and normalization standards. External standards with concentrations ranging from 5 to 1000 mg L−1 were prepared for ethanol and acetate using the sample preparation procedure described. n-Propanol and iso-butyric acid were used as normalization standards and added to the samples and external standards in known concentrations (160.8 mg L−1 and 190 mg L−1). All analyses were carried out in duplicate. The analyses were performed using a gas chromatograph (Hewlett Packard 5890) equipped with a split/splitless injector and flame ionization detector (FID) fitted with an AT-Aquawax-DA column (30 m x 0.32 mm i.d., film thickness 0.25 μm, Alltech). The GC oven temperature was programmed from 45 °C (1 min) to 180 °C at 15 °C min−1 and held at 180 °C form 1.2 min. Samples (1 μL) were injected using the split/splitless injector in split mode (split ratio of 40:1) using an Agilent 6890 series autosampler. Helium was used as the carrier gas at a constant head pressure of 6.5 psi. The injector and detector temperatures were 150 °C and 250 °C, respectively.
Dissolved sulfide was determined spectrophotometrically by a modification of the method of Cord-Ruwisch (1985). For this analysis, 1 mL of the sample was added to 4 mL of CuSO4 reagent (5 mM CuSO4
.5H2O in 50 mM HCl) and unamended CuSO4 reagent was used as a blank. Sulfate was measured using a Hach™ sulfate test kit (Model SF-1) with the modification that absorbance was read at 450 nm in a Unicam® Helios Epsilon spectrophotometer. Initially, alkalinity was measured using the low alkalinity Gran titration method (Andersen 2002) but after 50 days it was measured using the European Standard potentiometric method for measuring total alkalinity (EN ISO 9963-1:1994).
Suspended solids were determined using the method of the Wisconsin State Lab of Hygiene (1993) (ESS Method 340.2). A 5 mL sample of suspension was filtered through a Whatman® GF/A glass fibre filter that had been dried at 105 oC for at least 1 hour. Total suspended solids were determined by drying the filters overnight at 105 oC and volatile suspended solids were then determined by heating the filters for a further 15 minutes at 500oC. Concentrations of metals (Fe and Al) were determined using a Varian SpectrAA-40 Atomic Absorption Spectrometer. Solutions were prepared by adding 0.3 mL of 50% HNO3 to 1 mL of acidified sample (pH<2 using conc. HCl). Samples for Fe analysis also included 2.5 mL of 1.8 mM CaCO3. Solutions were made up to 10 mL with deionised water. Fe standards were made from a stock solution consisting of FeCl3.6H2O (4.84 g L-1) acidified with 50% HNO3 (10 mL L-1). Aluminium standards were made from a stock consisting of Al metal (1 g L-1) dissolved in a mixture of HCl (4 mL L-1) and HNO3 (1 mL L-1). Stocks were made to volume using deionised water. Standard solutions of a range of concentrations were made by diluting stocks in artificial seawater (3.14 g L-1 Na2SO4, 3.66 g L-1 CaCl2, 36.93 g L-1 NaCl and 50% HNO3, 5 mL L-1). Standards were prepared for the AAS in the same way as described above for samples.
Analysis of precipitates in the reactor effluent Black sulfidic material from the bioreactor settlers through which the reactor effluent flowed (Figure 2.2) was collected after a three week period of stable bioreactor operation on

Treatment of acidic, metal-contaminated groundwater Page 9
Narembeen acidic, saline water. The sedimented precipitates were washed twice in 100 mL of distilled water (pH 7.0), and collected by centrifugation (6000 g for 10 min) after each wash. The material was dried overnight at 60 °C. The composition of a sub-sample of the dried material was analysed by UltraTrace Pty Ltd (Canning Vale, Western Australia). The material was digested with a mixture of acids including hydrofluoric, nitric, hydrochloric and perchloric. Most elements were recovered in solution however sulfide sulfur was lost through volatilisation. Cu, Zn, Co, Ni, Cr, Mn, P, Sc, V, Fe, Al, Ca, Mg, Ti, Na, K, and S were determined by Inductively Coupled Plasma Optical Emission Spectrometry (ICP-OES). As, Ag, Ba, Be, Bi, Cd, Ga, Li, Mo, Pb, Sb, Sn, Sr, W, Ta, Y, Hf, Sr, Nb, La, Ce, Pr, Nd, Sm, Eu, Gd, Tb, Dy, Ho, Er, Tm, Yb, Lu, Th, U, Se, Rb, In, Te, Cs, Re, Ti were determined by Inductively Coupled Plasma Mass Spectrometry ICP-MS. Another subsample was fused with sodium peroxide and the melt was dissolved in hydrochloric acid. In this preparation, B, Cr, Si and Ti were determined by ICP-OES with Ge determined by ICP-MS.
For the geochemical analysis of the material by X-Ray Fluorescence (XRF), a 1 g of sub-sample was oven dried (105°C) and accurately weighed with 4 g of 12-22 lithium borate flux. The mixtures were fused at 1050°C in a Pt/Au crucible for 20 minutes then poured into a 32 mm Pt/Au mould heated to a similar temperature. The melt was cooled quickly over a compressed air stream and the resulting glass disks were analysed on a Philips PW1480 wavelength dispersive XRF system using a dual anode Sc/Mo tube and algorithms developed by CSIRO Land and Water’s Adelaide laboratory. For mineralogical analysis by X-Ray Diffraction (XRD), samples were ground in an agate mortar and pestle then lightly pressed into aluminium sample holders to achieve random orientation of the mineral particles for XRD analysis. XRD patterns were recorded with a Philips PW1710 microprocessor-controlled diffractometer using Co Kα radiation, 1° divergence slit, and graphite monochromator. The diffraction patterns were recorded in steps of 0.05° 2θ with a 3.0 second counting time per step, and logged to data files on an IBM-compatible PC for analysis using the XPLOT data analysis program.
On another occasion, black sulfidic material collected from the settlers was analysed for its particle size distribution at CSIRO Minerals using a Malvern Mastersizer 2000 particle size analyser (Malvern Instruments Ltd. Worcestershire, UK). Twenty mL of settler suspension was mixed with 10 mL of sodium hexametaphosphate (1 g L-1) to assist particle dispersion and sonicated for 10 minutes prior to analysis.
Detailed analysis of water samples for major cations and anions During a period of stable reactor performance, between days 300 and 314 of operation, influent water to and effluent water from the bioreactors was collected for the analysis of major cations, anions and trace metals. For most trace metals, 20 mL samples were filtered through a 0.2 μm pore size filter and the filtrate was acidified with 10 μL of concentrated HCl prior to analysis by ICP-MS. For the determination of lead and gold, 1 mL of concentrated HCl was added to 10 mL of 0.2 μm filtered samples prior to analysis by ICP-MS. For the analysis of major cations and anions, 100 mL of influent or effluent water was filtered through 0.45 μm pore size filter and the major anions were analysed by ion chromatography and major cations were analysed by ICP-OES.
Comparison of the major anions, cations and trace metals in bioreactor treated water with water treated with lime Commercially available hydrated lime was added slowly to 1000 mL of Narembeen groundwater (pH 3.3) until the pH had risen to a target pH of 7.3. The amount of Ca(OH)2 added was 1.281 g and the reaction occurred over 1 hour. The water was centrifuged to remove solids, and the supernatant was treated as outlined above for the analysis of the same components in the waters influent to and effluent from the bioreactors.
Analysis of salts prepared from bioreactor influent and effluent waters To determine the amount of metal contaminants in salts prepared from Narembeen and Kellerberrin groundwater, before and after bioreactor treatment, about 750 mL of each solution was filtered through a 0.2 μm filter then evaporated to dryness at 50 °C over a

Treatment of acidic, metal-contaminated groundwater Page 10
number of days. Once dry, 1 g of each salt was dissolved in 100 mL of milliQ water to which 100 μL of concentrated HCL was added. The salts were analysed for their major cations and anions and minor trace components. A sample of commercial table salt (Saxa Salt, Salpak Salt Pty Ltd, Seven Hills, Australia) was analysed in the same way for comparison. In addition, a known volume of Narembeen and Kellerberrin groundwaters were evaporated to dryness at 100 °C to determine the mass of total salts in the water.
The evaporation of Narembeen and Kellerberrin influent waters and effluent waters after treatment in a bioreactor has been modelled using the React module in The Geochemists WorkBench™ v6.04 (Bethke, 2006). Given the initially high and increasing salinity during the evaporation simulation, the thermodynamic database thermo_hmw.dat was used. This hmw (Harvie-Møller-Weare) database uses virial methods to calculate electrolyte activities at high salinities in the system: Na-K-Mg-Ca-H-Cl-SO4-OH-HCO3-CO3-CO2-H2O at 25oC (Harvie and Weare, 1980, Harvie et al., 1984). This database has been previously demonstrated to accurately predict the evaporation of seawater almost to the point of desiccation (e.g. Eugster et al., 1980). Hence, the use of this database is considered the most appropriate for the modelling (simulation) of the evaporation of already saline to hypersaline Narembeen and Kellerberrin influent waters and effluent waters.
3. Results and Discussion
3.1 Reactor performance
3.1.1. Reactor performance for treating Narembeen groundwater
A sulfate-reducing fluidised bed reactor was run on Narembeen water (pH 3.2; total salts 65.9 g kg-1) for 330 days in an attempt to develop a stable sulfate-reducing bioreactor process to effectively neutralise the acidic groundwater, and remove metal contaminants. A summary of performance of the reactor is shown in Figure 3.1 on pages 12 and 13. Changes in the metal contaminant composition of the water due to the bioreactor operation are shown in Table 3.1, and the metal composition of the sedimented precipitates that were formed during the process is discussed in Section 3.2.
The experimentation was undertaken to test the limits of the process, so that the minimum HRT required for effective treatment of the water could be determined. The experimentation was also designed to provide an understanding of the effectiveness of the bioreactor in treating acidic, metal-contaminated saline Narembeen water. In testing process limits, it was known that periodic upset of the process would result, and periods of recovery of the microbial biomass and its activity would be necessary. Populations of sulfate-reducing bacteria do not function well in environments of pH < 4 (Doshi, 2006). The intent of the high recycle rate of reactor effluent to the influent Narembeen water at pH 3.2 was to rapidly adjust and raise the pH of the influent mixture to above pH 4 before the reactor biomass was exposed to it. It was expected that a process failure would be especially problematic for the biomass as the reactor effluent would have a lower neutralising capacity when mixed with the incoming low pH Narembeen water.
Although reactor limits under the conditions of treating Narembeen water were not known a priori, Kaksonen et al (2004a) had demonstrated good performance of a very similar bioreactor configuration for the treatment of synthetic non-saline water of pH 3.0 to 3.2 at HRTs down to 6.5 hours.
So as to establish biomass in the bioreactor as quickly as possible, the reactor was inoculated and pH adjusted Narembeen water was used as influent (Phase A: Days 0 to 24 in Figure 3.1). During that time sulfide production rapidly developed and the pH of the system ranged between 6 and 8. During the final stage of phase A, pH of the influent Narembeen water was slowly reduced to ca. 6, and the pH of the effluent remained around pH 8.

Treatment of acidic, metal-contaminated groundwater Page 11
As the reactor seemed to be functioning well, the influent water to the reactor was switched to non-pH adjusted Narembeen water (pH 2.7 to 3.0) with a HRT of 16 hours (Phase B: Days 24 to 46). The pH of the reactor effluent slowly decreased to a pH of 6.7 and sulfide concentration dropped slowly. On day 46, due to corrosion of the temperature probe that controlled the heating of the column, the thermostat control on the bioreactor failed and the bioreactor overheated to 80 °C with catastrophic effect on the process performance due to pasteurisation of the biomass.
Continual re-inoculations of the bioreactor to re-establish biomass while using non pH adjusted Narembeen water (Phase C: days 46 to 83) were problematic, and although the pH of the reactor effluent water remained higher than the pH of the reactor influent water, perhaps due to alkalinity release from solid phases in the bioreactor formed during Phases A and B, dissolved sulfide concentrations were extremely low indicating poor process performance. The indication from this Phase was that a sulfate-reducing fluidised bed cannot be established on non pH adjusted Narembeen water in a reasonable time frame.
During phases D, E and F (Days 83 to 137) sulfate-reducing activity was re-established by using pH adjusted Narembeen water as influent. Too early use of non-pH adjusted Narembeen water as influent water for 10 days in phase E caused the effluent pH to drop to 5.5, and, therefore, the influent was returned to pH adjusted Narembeen water. The target HRT in this phase was 15 hours. Hydrogen sulfide production recommenced and alkalinity started to increase. The ethanol was fully utilised and only minor amounts of acetate accumulated. Acetate accumulates with incomplete microbial oxidation of ethanol by sulfate-reducing bacteria.
During Phase G (Days 137 to 195) the reactor was returned to non-pH adjusted Narembeen water, but unlike previously, the target HRT was set at 24 hours. In practice, it was not possible to keep a steady HRT, but on average an HRT close to 23 hours was achieved. During this phase, dissolved sulfide increased to a maximum of 200 μmol L-1, the sulfate reduction rate steadily climbed to a maximum of 3 g (L reactor volume)-1 day-1, effluent pH was maintained at pH 6.5 to 7, alkalinity slowly increased, and ethanol was completely oxidised as acetate did not accumulate. From this phase it was clear that a stable sulfate-reduction process could be maintained on Narembeen influent water (pH 3.2) with a HRT of 24 hours. Aluminium removal averaged 93 %.
In Phase H (Days 195 to 209), so as to test the limits of the reactor, the target HRT was reduced to 16 hours. At this HRT there was a reduction in the performance of the sulfate-reducing process and the effluent pH decreased to < 6, sulfide concentrations fell in concert with a decrease in the rate of sulfate reduction. Stable reactor conditions could not be maintained at an HRT of 16 hours. Acetate appeared as an intermediate reaction product.
In Phase I (Days 209 to 242), reactor HRT was returned to a target HRT of 24 hours. The pH of the effluent water increased again to 6.5. The rate of sulfate reduction continued to fall, but began to increase from day 226 onwards.
At the commencement of Phase J (Days 242 to 271), on day 242, a blockage of the nutrient feed line over a three day long weekend during which the reactors were not checked resulted in a sudden drop in the sulfate reduction rate, loss of alkalinity production, a drop in effluent pH to < 6, and a change of the colour of the sand biofilm support from black to light grey. The reactor biofilm was clearly damaged through exposure to low pH influent water with a lack of carbon and energy source required for the production of alkalinity to ameliorate the acidity of the influent stream. To re-establish the biomass, effluent from another functioning bioreactor was used as influent to this test reactor through Phase J. This influent water carried its own alkalinity (and inoculum) so during this phase, influent pH was high, effluent pH returned to close to pH 7, but the sulfate reduction rate dropped to close to zero as the influent water was severely depleted in sulfate as it had previously passed through a sulfate-reducing bioreactor. During this phase acetate appeared as an intermediate which suggests that either

Treatment of acidic, metal-contaminated groundwater Page 12
0
5
10
15
20
25
30
35
40
45H
RT
A B C D E F G H I J K L
Actual HRT Target HRT
0
5
10
15
20
25
30
35
40
0
50
100
150
200
250
300
A B C D E F G H I J K L Sulfate in Sulfate out Sulfide out
Sulfa
te (m
mol
L)
-1
Sulfi
de (
ol L
)-1
µm
0
50
100
150
200
0 50 100 150 200 250 300Days
Alu
min
ium
(mg
L)
-1
Aluminium out Aluminium in
2.02.53.03.54.04.55.05.56.06.57.07.58.08.5
pH
0 50 100 150 200 250 300Days
pH out pH in
Figure 3.1 Hydraulic retention time (HRT) and water quality changes in Narembeen water during treatment by a sulfate-reducing fluidised bed film bioreactor under different operational settings for reactor A: A. Days 0 to 24: Biomass establishment phase, pH adjusted Narembeen water used as
reactor influent. B. Days 24 to 46: Narembeen water used as influent, HRT set to 16 hours, pH of effluent
slowly dropped and reactor overheated on day 46 due to temperature probe failure. C. Days 46 to 83: Continual problems in re-establishing sulfate reducing activity on
Narembeen water and continued re-inoculation with sediments from another reactor. D. Days 83 to 100: pH-adjusted Narembeen water as influent to assist the re-establishment of
sulfate reduction. E. Days 100 to 110: Narembeen water as influent, HRT 15 hr, pH of effluent slowly fell to pH
5.5. F. Days 110 to 137: pH-adjusted Narembeen water as influent to re-establish sulfate-reducing
activity. G. Days 137 to 195: Narembeen water as influent with HRT increased to 24 hours, sulfate
reduction running relatively smoothly. H. Days 195 to 209: HRT reduced to 16 hours, pH of effluent dropped rapidly to <6 I. Days 209 to 242: HRT increased to target 24 hours to restore sulfate-reducing activity J. Days 242 to 271: Nutrient pump failure over 3 days led to drop of pH to 6, and loss of
colour from sand (loss of sulfate-reducing activity), effluent from another sulfate-reducing bioreactor used as influent to re-establish biomass.
K. Days 271 to 292: pH adjusted Narembeen water used as influent to re-establish sulfate reduction activity.
L. Days 292-320: Narembeen water as influent, reactor working well with HRT ≥ 24 hr.

Treatment of acidic, metal-contaminated groundwater Page 13
0
20
40
60
80
100
120
0 50 100 150 200 250 300Days
A B C D E F G H I J K L
Alk
alin
ity (
mm
ol L
)-1
0
10
20
30
40
50
A B C D E F G H I J K L
Ethanol in Acetate out Ethanol out
Eth
anol
or A
ceta
te (
mm
ol L
)-1 pump failures
0
500
1000
1500
2000
2500
3000
3500
0 50 100 150 200 250 300Days
Sul
fate
red
uctio
n ra
te (m
g L
d)
-1-1
Figure 3.1 (cont’d) Water quality changes in Narembeen water during treatment by a sulfate-reducing fluidised bed bioreactor under different operational settings for Reactor A:
A. Days 0 to 24: Biomass establishment phase, pH adjusted Narembeen water used as reactor influent.
B. Days 24 to 46: Narembeen water used as influent, HRT set to 16 hours, pH of effluent slowly dropped and reactor overheated on day 46 due to temperature probe failure.
C. Days 46 to 83: Continual problems in re-establishing sulfate reducing activity on Narembeen water and continued re-inoculation with sediments from another reactor.
D. Days 83 to 100: pH-adjusted Narembeen water as influent to assist the re-establishment of sulfate reduction.
E. Days 100 to 110: Narembeen water as influent, HRT 15 hr, pH of effluent slowly fell to pH 5.5.
F. Days 110 to 137: pH-adjusted Narembeen water as influent to re-establish sulfate-reducing activity.
G. Days 137 to 195: Narembeen water as influent with HRT increased to 24 hours, sulfate reduction running relatively smoothly.
H. Days 195 to 209: HRT reduced to 16 hours, pH of effluent dropped rapidly to <6 I. Days 209 to 242: HRT increased to target 24 hours to restore sulfate-reducing activity J. Days 242 to 271: Nutrient pump failure over 3 days led to drop of pH to 6, and loss of
colour from sand (loss of sulfate-reducing activity), effluent from another sulfate-reducing bioreactor used as influent to re-establish biomass.
K. Days 271 to 292: pH adjusted Narembeen water used as influent to re-establish sulfate reduction activity.
L. Days 292-320: Narembeen water as influent, reactor working well with HRT ≥ 24 hr.
Treatment of acidic, metal-contaminated groundwater Page 14
the re-introduced population of sulfate-reducers lacked acetate-oxidising sulfate-reducing bacteria or low sulfate concentrations limited acetate oxidation that generally proceeds at a slower rate than ethanol oxidation by sulfate-reducing bacteria.
In Phase K (Days 271 to 292), to overcome the problem of sulfate limitation and to re-establish sulfate-reduction, pH adjusted Narembeen water was reintroduced as influent water to the reactor, and the target HRT was left at 24 hours. The sulfate-reduction rate rapidly increased to just under 3 g (L reactor volume)-1day-1 and dissolved sulfide concentrations in the effluent again reached 200 μmol L-1. Alkalinity in the effluent aqueous phase first dropped and then increased in response to the increase in sulfate reduction. It should be noted that alkalinity increase due to sulfate reduction may not be fully reflected in water chemistry due to the removal of the hydroxide component of alkalinity in precipitation reactions (Doshi, 2006) such as the precipitation of aluminium hydroxy sulfates such as alunite (equation 6, page 3)
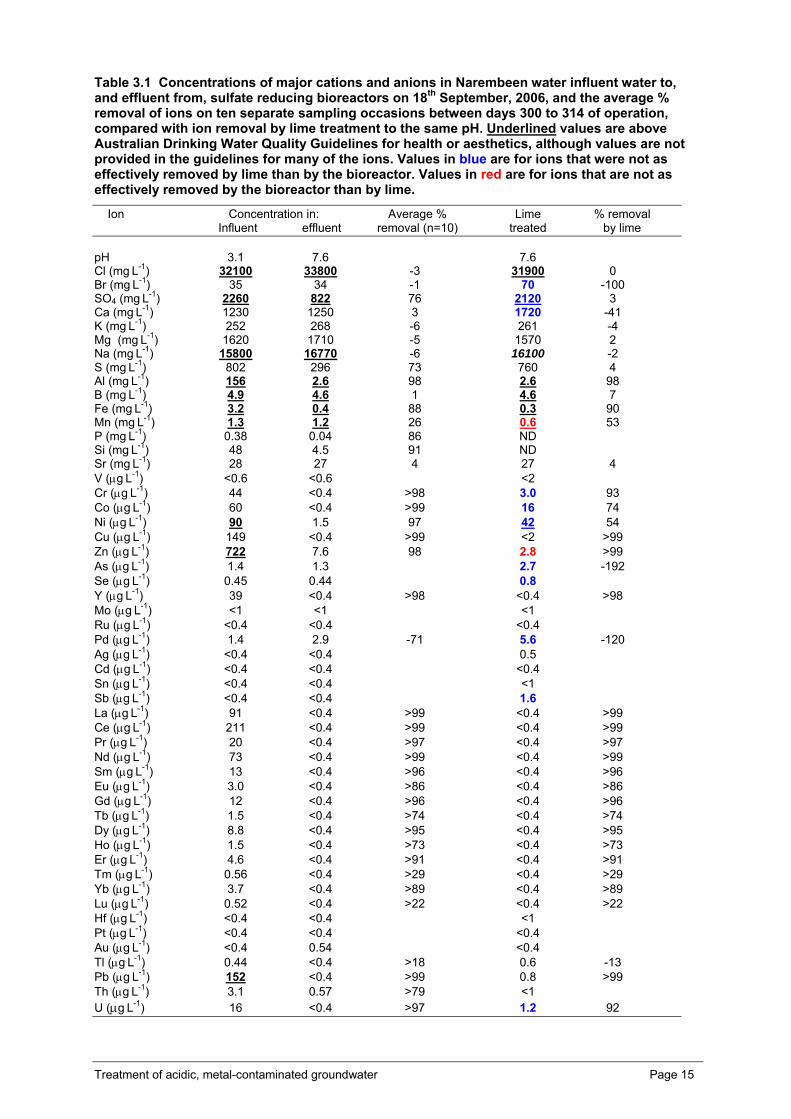
At the start of Phase L (Days 292 to 320) when the influent to the reactor was returned to non-pH adjusted Narembeen water with a HRT of 24 hours, and sulfate-reduction remained fairly stable at just over 2 g L-1 day-1, and effluent pH was maintained at ca. pH 6.5, a complete metal analysis of the influent water and effluent water was undertaken on a number of separate occasions. The results are shown in Table 3.1, where metal removal from Narembeen water by the bioreactor is compared with the chemical removal of metals from Narembeen water when it is treated to the same pH with lime.
The sulfate-reducing bioreactor and lime were in general equally effective in reducing the concentrations of metals in the aqueous phase of treated Narembeen water. Most of the rare earth elements (such as lanthanum and cerium) were in this category as were a range of non-rare earth elements such as aluminium (98 % removal).
For a number of elements, the sulfate-reducing process removed greater amounts than were removed by lime treatment, such as occurred with chromium, cobalt, nickel, selenium, sulfur, uranium, palladium and antimony. For other elements, the lime treatment removed more, as occurred with zinc and manganese. Although both treatment options removed most of the zinc (98 % removal for the sulfate-reducing bioreactors and >99 % removal for the lime treatment, the reducing conditions and pH in sulfate reduction based processes are often inappropriate for manganese removal (Doshi, 2006). The sulfate-reducing bioreactor removed 26 % of the manganese whereas lime treatment removed 53 %. When the concentrations of manganese have been of concern, an aerobic bacterial manganese oxidation polishing step has been successfully employed in field operations (Doshi, 2006). Silicon removal was not measured after the lime treatment, however the sulfate-reducing bioreactor removed 91 % of this element. This is significant, as it is the presence of silica that is the main limitation to the efficiency of reverse osmosis (RO) membrane treatment of groundwater from the Wheatbelt of WA (Barron et al., submitted). A range of aluminosilica clays form when biogenic sulfide and lime are mixed with acid rock drainage waters with a resultant loss of SiO4
+ from solution (Hammack et al., 1994). Addition of lime substantially increased the calcium content of Narembeen water, and increased to a small degree the concentrations of bromide (35 mg L-1), and arsenic, palladium, antimony and selenium (μg L-1 quantities). The latter were probably minor contaminants in the lime reagent.
For many elements there are no guideline values in the Australian Drinking Water Quality Guidelines (NHMRC and NRMMC, 2004). Of those that are listed in the guidelines, nickel, zinc and lead were removed to such an extent by the sulfate-reducing bioreactor, 97, 98 and >99 % respectively, that their concentrations were below the guideline thresholds, whereas chloride, sulfate, sodium, aluminium, boron, iron and aluminium concentrations remained above guideline values.
Treatment of acidic, metal-contaminated groundwater Page 15
Table 3.1 Concentrations of major cations and anions in Narembeen water influent water to, and effluent from, sulfate reducing bioreactors on 18th September, 2006, and the average % removal of ions on ten separate sampling occasions between days 300 to 314 of operation, compared with ion removal by lime treatment to the same pH. Underlined values are above Australian Drinking Water Quality Guidelines for health or aesthetics, although values are not provided in the guidelines for many of the ions. Values in blue are for ions that were not as effectively removed by lime than by the bioreactor. Values in red are for ions that are not as effectively removed by the bioreactor than by lime.
Ion Concentration in: Average % Lime % removal Influent effluent removal (n=10) treated by lime pH 3.1 7.6 7.6 Cl (mg L-1) 32100 33800 -3 31900 0 Br (mg L-1) 35 34 -1 70 -100 SO4 (mg L-1) 2260 822 76 2120 3 Ca (mg L-1) 1230 1250 3 1720 -41 K (mg L-1) 252 268 -6 261 -4 Mg (mg L-1) 1620 1710 -5 1570 2 Na (mg L-1) 15800 16770 -6 16100 -2 S (mg L-1) 802 296 73 760 4 Al (mg L-1) 156 2.6 98 2.6 98 B (mg L-1) 4.9 4.6 1 4.6 7 Fe (mg L-1) 3.2 0.4 88 0.3 90 Mn (mg L-1) 1.3 1.2 26 0.6 53 P (mg L-1) 0.38 0.04 86 ND Si (mg L-1) 48 4.5 91 ND Sr (mg L-1) 28 27 4 27 4 V (μg L-1) <0.6 <0.6 <2 Cr (μg L-1) 44 <0.4 >98 3.0 93 Co (μg L-1) 60 <0.4 >99 16 74 Ni (μg L-1) 90 1.5 97 42 54 Cu (μg L-1) 149 <0.4 >99 <2 >99 Zn (μg L-1) 722 7.6 98 2.8 >99 As (μg L-1) 1.4 1.3 2.7 -192 Se (μg L-1) 0.45 0.44 0.8 Y (μg L-1) 39 <0.4 >98 <0.4 >98 Mo (μg L-1) <1 <1 <1 Ru (μg L-1) <0.4 <0.4 <0.4 Pd (μg L-1) 1.4 2.9 -71 5.6 -120 Ag (μg L-1) <0.4 <0.4 0.5 Cd (μg L-1) <0.4 <0.4 <0.4 Sn (μg L-1) <0.4 <0.4 <1 Sb (μg L-1) <0.4 <0.4 1.6 La (μg L-1) 91 <0.4 >99 <0.4 >99 Ce (μg L-1) 211 <0.4 >99 <0.4 >99 Pr (μg L-1) 20 <0.4 >97 <0.4 >97 Nd (μg L-1) 73 <0.4 >99 <0.4 >99 Sm (μg L-1) 13 <0.4 >96 <0.4 >96 Eu (μg L-1) 3.0 <0.4 >86 <0.4 >86 Gd (μg L-1) 12 <0.4 >96 <0.4 >96 Tb (μg L-1) 1.5 <0.4 >74 <0.4 >74 Dy (μg L-1) 8.8 <0.4 >95 <0.4 >95 Ho (μg L-1) 1.5 <0.4 >73 <0.4 >73 Er (μg L-1) 4.6 <0.4 >91 <0.4 >91 Tm (μg L-1) 0.56 <0.4 >29 <0.4 >29 Yb (μg L-1) 3.7 <0.4 >89 <0.4 >89 Lu (μg L-1) 0.52 <0.4 >22 <0.4 >22 Hf (μg L-1) <0.4 <0.4 <1 Pt (μg L-1) <0.4 <0.4 <0.4 Au (μg L-1) <0.4 0.54 <0.4 Tl (μg L-1) 0.44 <0.4 >18 0.6 -13 Pb (μg L-1) 152 <0.4 >99 0.8 >99 Th (μg L-1) 3.1 0.57 >79 <1 U (μg L-1) 16 <0.4 >97 1.2 92
Treatment of acidic, metal-contaminated groundwater Page 16
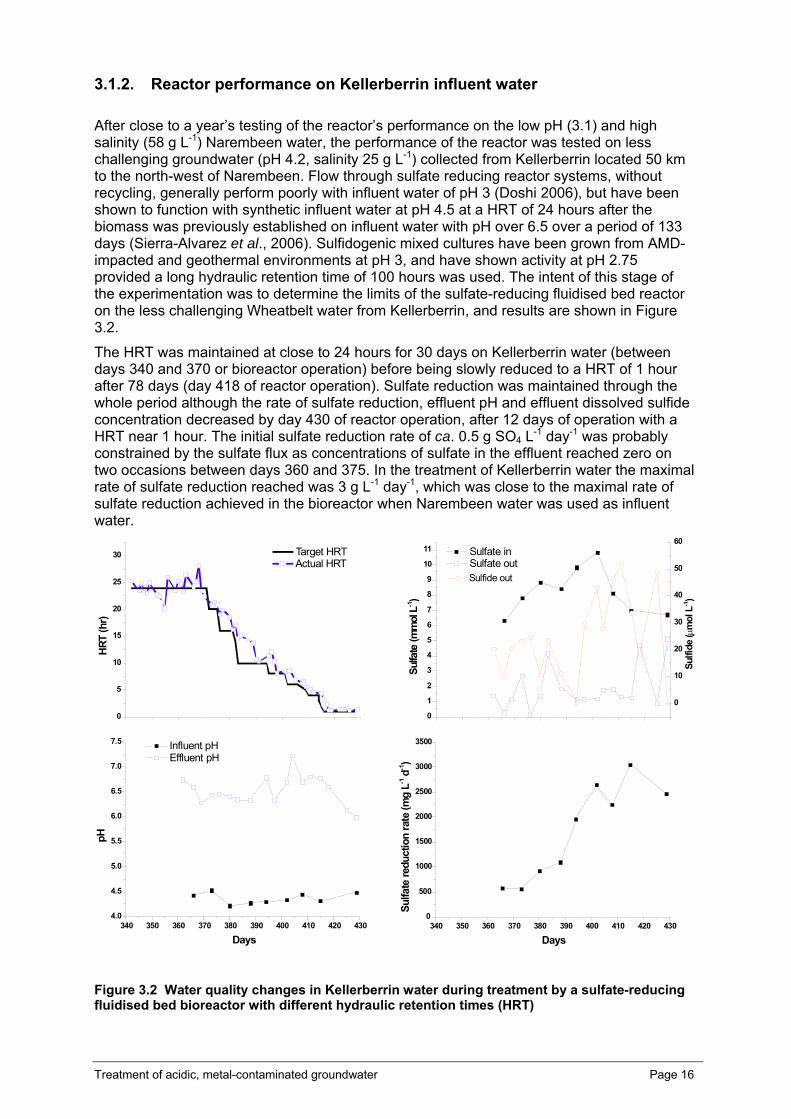
3.1.2. Reactor performance on Kellerberrin influent water
After close to a year’s testing of the reactor’s performance on the low pH (3.1) and high salinity (58 g L-1) Narembeen water, the performance of the reactor was tested on less challenging groundwater (pH 4.2, salinity 25 g L-1) collected from Kellerberrin located 50 km to the north-west of Narembeen. Flow through sulfate reducing reactor systems, without recycling, generally perform poorly with influent water of pH 3 (Doshi 2006), but have been shown to function with synthetic influent water at pH 4.5 at a HRT of 24 hours after the biomass was previously established on influent water with pH over 6.5 over a period of 133 days (Sierra-Alvarez et al., 2006). Sulfidogenic mixed cultures have been grown from AMD-impacted and geothermal environments at pH 3, and have shown activity at pH 2.75 provided a long hydraulic retention time of 100 hours was used. The intent of this stage of the experimentation was to determine the limits of the sulfate-reducing fluidised bed reactor on the less challenging Wheatbelt water from Kellerberrin, and results are shown in Figure 3.2.
The HRT was maintained at close to 24 hours for 30 days on Kellerberrin water (between days 340 and 370 or bioreactor operation) before being slowly reduced to a HRT of 1 hour after 78 days (day 418 of reactor operation). Sulfate reduction was maintained through the whole period although the rate of sulfate reduction, effluent pH and effluent dissolved sulfide concentration decreased by day 430 of reactor operation, after 12 days of operation with a HRT near 1 hour. The initial sulfate reduction rate of ca. 0.5 g SO4 L-1 day-1 was probably constrained by the sulfate flux as concentrations of sulfate in the effluent reached zero on two occasions between days 360 and 375. In the treatment of Kellerberrin water the maximal rate of sulfate reduction reached was 3 g L-1 day-1, which was close to the maximal rate of sulfate reduction achieved in the bioreactor when Narembeen water was used as influent water.
0
5
10
15
20
25
30 Target HRT Actual HRT
HRT
(hr)
0
1
2
3
4
5
6
7
8
9
10
11
Sulfi
de(μ
mol
L-1)
Sulfate in Sulfate out
Sulfa
te(m
mol
L-1)
0
10
20
30
40
50
60
Sulfide out
340 350 360 370 380 390 400 410 420 4304.0
4.5
5.0
5.5
6.0
6.5
7.0
7.5 Influent pH Effluent pH
pH
Days340 350 360 370 380 390 400 410 420 430
0
500
1000
1500
2000
2500
3000
3500
Sulfa
tere
duct
ion
rate
(mg
L-1d-1
)
Days
Figure 3.2 Water quality changes in Kellerberrin water during treatment by a sulfate-reducing fluidised bed bioreactor with different hydraulic retention times (HRT)

Treatment of acidic, metal-contaminated groundwater Page 17
Metal removal from Kellerberrin water by the sulfate-reducing bioreactor is shown in Table 3.2. As was the case with the treatment of Narembeen water in this reactor, many elements that are considered detrimental to the environment were substantially reduced in concentration by treatment in the bioreactor (aluminium, 72 %; lead, >99 %; uranium, 98 %, zinc, 98 %). Selenium, which is not removed via lime treatment, was lowered in concentration to its limit of detection for the analytical laboratory, and silicon, which as previously mentioned is the major foulant of RO membrane in the treatment of Wheatbelt water was reduced in concentration by 93 %. As with the treatment of Narembeen water, treatment of Kellerberrin water by sulfate reduction did not remove manganese. Unlike in the treatment of Narembeen water, nickel was poorly removed (only 12 % removal). The Kellerberrin water contained significantly higher concentrations of rare earth elements (such as lanthanum and cerium) and uranium than Narembeen water and these were largely removed from solution via the sulfate-reducing bioreactor.

Treatment of acidic, metal-contaminated groundwater Page 18
Table 3.2 Concentrations of major and trace cations and anions in Kellerberrin water influent to and effluent from sulfate-reducing bioreactors on 1st to 9th of September, 2006, and the average % removal of ions on ten separate sampling occasions. Underlined values are above Australian Drinking Water Quality Guidelines for health or aesthetics, although guidelines are not provided for many of the ions.
Ion Concentration in Average % Influent effluent removal (n=10) pH 4.2 7.8 Cl (mg L-1) 12117 13933 -15 Br (mg L-1) 27 30 -11 SO4 (mg L-1) 778 49 94 Ca (mg L-1) 909 1031 -13 K (mg L-1) 139 149 -7 Mg (mg L-1) 611 668 -9 Na (mg L-1) 6165 6875 -12 S (mg L-1) 270 6.8 97 Al (mg L-1) 3.3 0.9 72 B (mg L-1) 1.5 1.7 -10 Fe (mg L-1) 0.1 0.1 39 Mn (mg L-1) 2.7 2.7 2 Si (mg L-1) 54 3.8 93 Sr (mg L-1) 14 16.1 -13 PO4 (mg L-1) 0.2 0.0 >99 V (μg L-1) <2 <2 Cr (μg L-1) <0.8 <0.8 Co (μg L-1) 29 2.6 91 Ni (μg L-1) 16 13.6 12 Cu (μg L-1) 32 <2 >93 Zn (μg L-1) 68 1.2 98 As (μg L-1) 4.1 <1 >76 Se (μg L-1) 1.3 <0.8 >38 Y (μg L-1) 160 <0.4 >99 Mo (μg L-1) <1 <1 Ru (μg L-1) <0.4 <0.4 Pd (μg L-1) 3.6 2.6 26 Ag (μg L-1) <0.4 <0.4 Cd (μg L-1) <0.4 <0.4 Sn (μg L-1) <1 <1 Sb (μg L-1) <0.7 <0.7 La (μg L-1) 405 2.1 99 Ce (μg L-1) 1043 1.4 >99 Pr (μg L-1) 94 <0.4 >99 Nd (μg L-1) 335 <0.4 >99 Sm (μg L-1) 56 <0.4 >99 Eu (μg L-1) 7.6 <0.4 >94 Gd (μg L-1) 49 <0.4 >99 Tb (μg L-1) 6.3 <0.4 >93 Dy (μg L-1) 33 <0.4 >98 Ho (μg L-1) 6.2 <0.4 >93 Er (μg L-1) 17 <0.4 >97 Tm (μg L-1) 2.0 <0.4 >80 Yb (μg L-1) 11 <0.4 >96 Lu (μg L-1) 1.6 <0.4 >74 Hf (μg L-1) <1 <1 Pt (μg L-1) <0.4 <0.4 Au (μg L-1) <0.4 <0.4 Tl (μg L-1) 0.6 <0.4 >28 Pb (μg L-1) 150 <0.4 >99 Th (μg L-1) <1 <1 U (μg L-1) 72 1.4 98
Treatment of acidic, metal-contaminated groundwater Page 19
3.1.3. Technical evaluation of the potential for treating Wheatbelt groundwater by sulfate-reducing bioreactors
As with most biological processes that are used to treat waste streams under extreme conditions, initial establishment of the sulfate-reducing biomass for the treatment of low pH Narembeen water required that the biomass was not exposed to the unmodified target water. Instead, the biomass was grown initially on pH adjusted Narembeen water. When the reactor process suffered due to the intentional testing of the process limits, or due to unintentional disruptions such as pump or thermostat failures, re-establishment of the process always required some amelioration of the influent pH. It usually required about one month for successful re-establishment, as when shorter periods were attempted (e.g. in Phases E or J during treatment of Narembeen water, See Figure 3.1), the effluent pH and rates of sulfate reduction fell. There were numerous practical difficulties associated with running these experiments. Clogging of bioreactors and their feed and recycling lines is a common operational problem for long term experimentation with laboratory scale bioreactors (Tsukamoto et al., 2004). In large scale field operations this can be overcome through the use of larger pumps and pipe work.
The limits of the sulfate-reducing process used here for treating Wheatbelt groundwater depended on the quality of the water being treated. Whenever the HRT for treatment of Narembeen water was reduced to 16 hours or less, the pH of the effluent from the bioreactor fell rapidly (Phase B in Figure 3.1), or the bioreactor could not maintain an effluent pH of 6 or above (Phases H in Figure 3.1). When the bioreactor was used to treat Narembeen water, a stable bioreactor process could be maintained at a target HRT of 24 hours (Phases G and L in Figure 3.1), although the actual HRT periodically and intermittently fluctuated above and below this target. Successful treatment of Narembeen groundwater would seem to require an HRT of 24 hours.
Treatment of Kellerberrin water was successful at an HRT of 1 hour, although prolonged maintenance of this HRT produced a poorer quality effluent (pH of ca. 6) compared with the effluent quality at HRT’s of 2.2 hours and above (pH values > 6.5). The bioreactor limits were dependent on the pH of the influent water which is an observation that is consistent with those of other studies. Passive sulfate-reducing bioreactor systems for treating acid mine drainage generally require pH adjustment of influent water to 4 or above with sodium hydroxide additions or lime treatment before they are effective (Doshi, 2006). Tsukamoto et al (2004) noted that generation of alkalinity was less effective when treating water of pH 3. Laboratory scale bioreactors, when operated in the pH range of 6 to 4, sustained sulfate reduction rates of 553-1052 mmol m-3 day-1 (=0.05-0.1 g L-1 day-1) but the rate dropped to 3.35 mmol m-3 day-1 (0.0003 g L-1 day-1) when the influent pH was dropped to 3.5 (Doshi, 2006).
It is interesting to note that a similar reactor to the one used in this study operated down to an HRT of > 6.1 hours when treating synthetic acidic metal contaminated water that contained substantially less salt < 5 g L-1 (Kaksonen et al., 2004). The single major difference in the reactor design was that the biomass carrier material used in this study was sand, whereas in the study of Kaksonen et al. (2004) the carrier used was Filtralite, a porous expanded clay aggregate which was sourced from Norway, and which would be expected to carry more biomass, and be able to protect biofilms due to its porous nature. Greater biomass in the reactor would equate with greater efficiency. As the use of Filtralite as a carrier material would be impractical for large scale application in the Wheatbelt of WA, sand was chosen as the biomass carrier in this study. The rates of sulfate reduction achieved in this study are compared with the rates achieved in fluidised bed bioreactors in other studies as shown in Table 3.3. The rates vary, as would be expected with bioreactors using different HRTs, influent pH, biofilm supports and carbon and energy sources. The fastest rates have been achieved with higher pH influent waters. Sulfate-reducing up-flow anaerobic sludge blanket bioreactors have been used previously to treat hypersaline waters of influent pH 7.0+0.2. Maximal rates of sulfate reduction under these conditions were 2800 mg (L-reactor)-
1 day-1 for water with 51 g L-1 salt when ethanol was used as a carbon and energy source, with lower rates achieved at salt concentrations of 71 g L-1 salt (Vallero et al., 2004).

Treatment of acidic, metal-contaminated groundwater Page 20
Table 3.3 Comparison of the rate of sulfate reduction achieved in this study with those achieved in other studies that employed fluidised bed reactors
HRT Feed Substrate Sulfate removal rate Reference (h) pH mg (L-reactor)-1 day-1 16 2.5 Lactate 2220 [1] 16 2.5 Ethanol 2320 [2] 6.5 3 Ethanol 4290 [3] 6.8 5.2 Molasses 6860 [4] 5.1 7+0.3 Ethanol + 6330 [5] Yeast Extract 21 3.1 Ethanol 3032 Narembeen 4.5 4.4 Ethanol 3052 Kellerberrin 1 = Kaksonen et al. 2003b; 2 = Kaksonen et al. 2003a; 3 = Kaksonen et al., 2004; 4 = Somlev and Banov, 1998; 5 = Nagpal et al., 2000.
Sulfate-reducing fluidised bed bioreactors are technically capable of treating high salt, low pH, metal containing waters from the Wheatbelt so as to reduce acidity and produce an effluent with a pH close to neutral, and to remove most of the undesirable metal contaminants. The HRT limits for the process depends on the pH of the influent water. An HRT of about 20 hours will be required to treat low pH waters (pH ca. 3), however HRTs approaching 1 to 2 hours could be used to successfully treat higher pH waters (ca. 4.4 or above). The removal of metal contaminants and pH increase would lessen the environmental impacts of these waters should they be disposed of to lakes and wetlands, as is currently practiced. As the concentration of silicon is also greatly reduced through the bioreactor process, the potential for successful treatment of the reactor effluent by RO, so as to produce potable water and a high concentrate brine is also enhanced, as silica is the major foulant and limitation of the use of RO membranes for treating Wheatbelt saline waters.
3.2 Metals collected from the treatment of Narembeen groundwater
It has been suggested previously that if Wheatbelt water could be treated so as to capture metals, the metals may represent a valuable by-product so as to increase the economic potential for any process for dealing with problematic Wheatbelt waters. Concentrations of rare earth elements in Wheatbelt waters can be relatively high (see Table 3.1), and it has been estimated that capture of these metals from the treatment of 10 ML day-1 of water could return $365,000 year-1 (Barron et al., 2003).
An analysis of the metal/metalloid composition of the acid digest of the precipitate material taken from the settlers of two bioreactors during the treatment of Narembeen water is given in Table 3.4. As expected, the metals/metalloids in the precipitates are consistent with those removed from the water by the bioreactor, with the precipitates rich in aluminium, sulfur, zinc, phosphorus, lead, as well as major cations that are in high concentrations in the groundwater (sodium, calcium and magnesium). Reasonable amounts of rare earth metals cerium and lanthanum occurred in the sediments. XRD analysis of the metals revealed an amorphous mixture, defined as a small hump superimposed over a small set of quartz peaks (Figure 3.3). The sediment precipitates had an median particle size of 2 μm, which is similar in size to the metal sulfides precipitated in the fixed film reactors of Kaksonen et al. (2004b); average of 1 μm.

Treatment of acidic, metal-contaminated groundwater Page 21
Table 3.4 Concentrations of metals and metalloids (mg kg-1) in precipitates collected in the settlers from the effluent of two sulfate-reducing bioreactors treating Narembeen water
Metal Reactor A Reactor B Cu 160 167 Zn 667 663 Co 70 54 Ni 209 214 As 3 17 Ag 1 2 Cr 175 165 Ba 18 108 Be 7.5 5.4 Bi <0.1 0.4 Cd 0.5 1 Ga 3 6.4 Li 8 49 Mn 83 68 Mo 1 3 P 3740 8640 Pb 180 2020 Sb 0.2 11.4 Sc 8.5 9.5 Sn 11 9 Sr 658 600 V 10 22 W <0.5 <0.5 Ta 0.1 0.2 Y 40.5 26.4 Hf 0.4 0.8 Zr 13 31 Nb 1 2.5 La 86.8 56 Ce 199 128 Pr 19.4 12.7 Nd 67.1 44.1 Sm 12.2 8.2 Eu 2.8 1.9 Gd 9.8 6.6 Tb 1.4 0.9 Dy 7.7 5.3 Ho 1.5 1 Er 3.9 2.6 Tm 0.5 0.4 Yb 3.4 2.3 Lu 0.5 0.3 Th 6.1 11.3 U 13.9 10.6 Se <5 <5 Rb 4.4 16.8 In 0.2 0.2 Te <0.2 <0.2 Cs 1 1.1 Re 0.2 <0.1 Tl 0.7 0.7 Fe 7300 12200 Al 169000 148000 Ca 9000 10700 Mg 2600 3300 Ti 300 900 Na 7000 7400 K 800 3500 Sa 14000 8460 a Some sulfide sulfur was lost from the analysis during acidification of the sample prior to analysis.
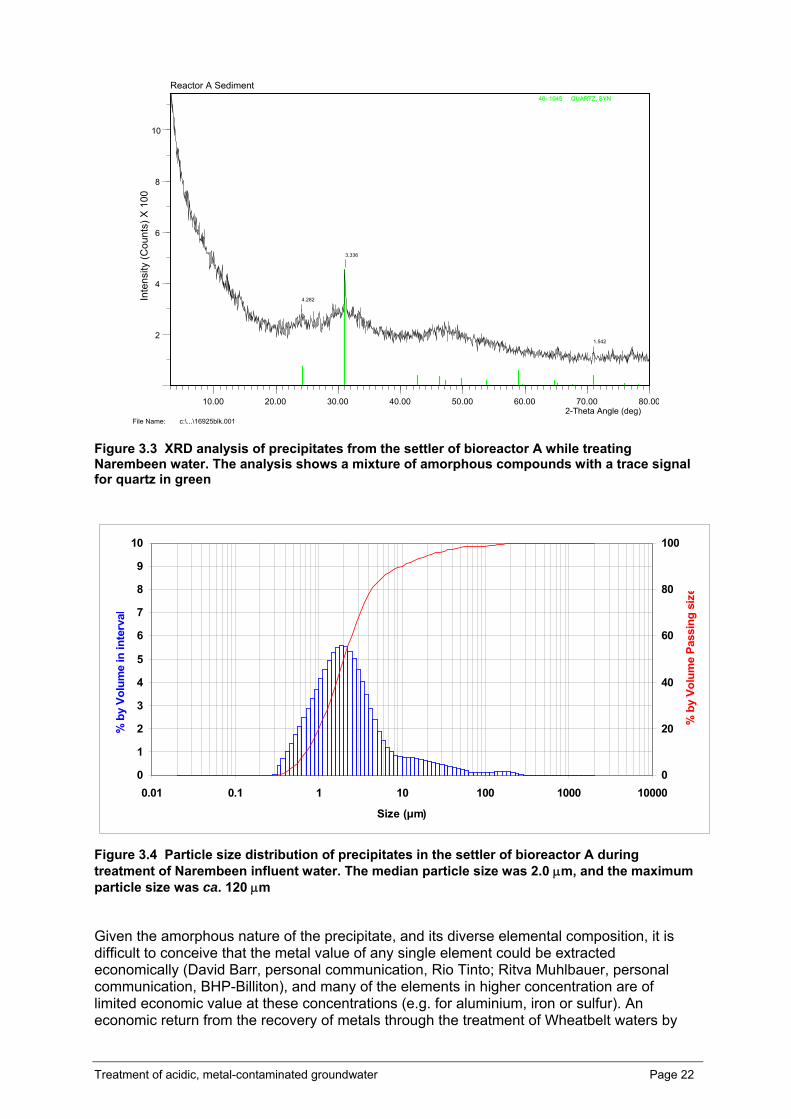
Treatment of acidic, metal-contaminated groundwater Page 22
46- 1045 QUARTZ, SYN
File Name: c:\...\16925blk.001
Reactor A Sediment
2-Theta Angle (deg)10.00 20.00 30.00 40.00 50.00 60.00 70.00 80.00
2
4
6
8
10In
tens
ity (C
ount
s) X
100
4.282
3.336
1.542
Figure 3.3 XRD analysis of precipitates from the settler of bioreactor A while treating Narembeen water. The analysis shows a mixture of amorphous compounds with a trace signal for quartz in green
0
1
2
3
4
5
6
7
8
9
10
0.01 0.1 1 10 100 1000 10000
Size (µm)
% b
y Vo
lum
e in
inte
rval
0
20
40
60
80
100
% b
y Vo
lum
e Pa
ssin
g si
ze
Figure 3.4 Particle size distribution of precipitates in the settler of bioreactor A during treatment of Narembeen influent water. The median particle size was 2.0 μm, and the maximum particle size was ca. 120 μm
Given the amorphous nature of the precipitate, and its diverse elemental composition, it is difficult to conceive that the metal value of any single element could be extracted economically (David Barr, personal communication, Rio Tinto; Ritva Muhlbauer, personal communication, BHP-Billiton), and many of the elements in higher concentration are of limited economic value at these concentrations (e.g. for aluminium, iron or sulfur). An economic return from the recovery of metals through the treatment of Wheatbelt waters by

Treatment of acidic, metal-contaminated groundwater Page 23
sulfate reducing bioreactors would seem improbable given current metal processing technologies.
3.3 Salts from the treatment of Wheatbelt groundwaters
Using the analyses of major cations and anions in treated and untreated Narembeen and Kellerberrin water (Tables 3.1 and 3.2), the salts that form during evaporation of each water type was modelled using the React module in The Geochemists WorkBench™ v6.04 (Bethke, 2006). Solution pH, mineral saturation expressed as log (Q/K), where log (Q/K) = 0, <0 and >0 represent mineral equilibrium with solution, mineral under-saturation and over-saturation respectively, solution major ion composition (mg/kg) and mass of minerals precipitated (expressed as log grams) were estimated. The results of these evaporation scenarios conducted using The Geochemists WorkBench™ were intended to provide a general guide to solute behaviour and mineral precipitation during evaporation.
Evaporation of FBR-treated Narembeen water During a simulated evaporation sequence, FBR-treated Narembeen water showed an initial slow, decline from pH 6.5 to pH 5 at 85% evaporation (Figure 3.5). Thereafter a second phase of pH decline commenced, initially slowly and then more rapidly to pH 2.5 near desiccation (>99% theoretical evaporation). The initial decline in pH corresponded to a progressive increase in hydrogen ion concentration with evaporation. Superimposed on this evaporative concentration profile was the progressive precipitation of a suite of minerals, most notably gypsum (CaSO4·2H2O) at approximately 75% evaporation which was then replaced by anhydrite (CaSO4) at approximately 80% evaporation, halite (NaCl) and then bischofite (MgCl2·6H2O) at approximately 85% and 99% evaporation, respectively (Figure 3.6). Dolomite was nominally saturated throughout the entire evaporative sequence. In practical terms, however, dolomite precipitation kinetics are often slow relative to other minerals and, hence its co-precipitation may not occur concomitantly with the above mineral phases.
The solution composition of the FBR-treated Narembeen water reflected the sequence and relative mass of precipitated minerals (Figures 3.7 and 3.8). With increasing evaporation the solution progressively became a Na-Cl – dominated brine until approximately 85% evaporation. Thereafter, the halite precipitated and became the most abundant precipitated mineral by mass (Figure 3.8). Gypsum and then anhydrite, and ultimately bischofite, all of which are largely insensitive to solution pH continued to precipitate. As evaporation proceeded the remnant solution became more acidic ultimately resulting in a H-Mg-Ca-Cl brine as the solution reached desiccation.
Maximum solution Na concentration was attained at approximately 85 % evaporation which occurred immediately prior to the onset of halite precipitation (Figures 3.7 and 3.8). The predicted solution Na:Mg molar ratio at approximately 85 % evaporation was approximately 10.7. This compares with a domestic table salt molar ratio of 6650 (Table 3.5). Predicted net loss of Na from solution due to halite precipitation between approximately 85 % and 90 % evaporation interval resulted in a Na:Mg molar ratio in the precipitate of around 7800 with a precipitate mass of approximately 18 g NaCl per litre of effluent. Evaporation exceeding approximately 90-95 % resulted in co-precipitation of Mg-bearing minerals such as bischofite (MgCl2.6H2O) and carnallite (KMgCl3.6H2O) which substantially decreased the Na:Mg molar ratio. Hence, preparation of a domestic table salt from FBR-treated Narembeen water would require collection of the salts at ca. 90 % water loss but prior to the onset of the precipitation of magnesium bearing salts.

Treatment of acidic, metal-contaminated groundwater Page 24
Table 3.5 Percent evaporation and estimated moles of Na and Mg precipitated and Na/Mg molar ratio in the precipitate from FBR-treated Narembeen effluent water
Percent evaporation Na Mg Na/Mg interval mol ppt mol ppt ratio 84.8-90.0 0.313 0.00004 7818 90.0-98.4 0.762 0.00151 505 98.4-98.9 0.767 0.00734 105 98.9-99.3 0.768 0.05946 13
0 .1 .2 .3 .4 .5 .6 .7 .8 .9 1
2.5
3
3.5
4
4.5
5
5.5
6
6.5
Rxn progress
pH
Figure 3.5 Modelled pH versus reaction progress (expressed as a fraction of the initial volume evaporated) for FBR-treated Narembeen water
0 .1 .2 .3 .4 .5 .6 .7 .8 .9 1–2
–1.6
–1.2
–.8
–.4
0
.4
.8
Rxn progress
Sat
urat
ion,
som
e m
iner
als
(log
Q/K
)
Anhydrite Bischofite
Carnallite
Dolomite
Gypsum
Halite
Figure 3.6 Modelled mineral saturation index (log Q/K) versus reaction progress (expressed as a fraction of the initial volume evaporated) for FBR-treated Narembeen water. A number of minerals that remain under-saturated (log (Q/K)<0) throughout the evaporation have been omitted for clarity.

Treatment of acidic, metal-contaminated groundwater Page 25
0 .1 .2 .3 .4 .5 .6 .7 .8 .9 10
5e4
1e5
1.5e5
2e5
2.5e5
3e5
Rxn progress
Som
e sp
ecie
s (m
g/kg
)
Cl-
H+HCO3- K+
Mg++Na+
SO4--
Figure 3.7 Modelled solution composition versus reaction progress (expressed as a fraction of the initial volume evaporated) for FBR-treated Narembeen water
0 .1 .2 .3 .4 .5 .6 .7 .8 .9 1–4
–3
–2
–1
0
1
2
Rxn progress
Min
eral
s (lo
g gr
ams)
Dolomite
GypsumAnhydrite
Halite
Carnallite
Bischofite
Figure 3.8 Modelled mass of precipitated minerals versus reaction progress (expressed as a fraction of the initial volume evaporated) for FBR-treated Narembeen water

Treatment of acidic, metal-contaminated groundwater Page 26
Untreated Narembeen water The pH during the simulated evaporation of untreated Narembeen water describes a similar profile to that of the FBR-treated effluent water, albeit commencing at approximately 3 pH units lower (Figures 3.9 and 3.5). Similarly, the suite of minerals precipitated is similar to the FBR-treated Narembeen water except for dolomite which was predicted to not precipitate at the initially lower pH. The onset of precipitation of gypsum occurred at approximately 50% evaporation whereas for FBR-treated Narembeen water gypsum precipitation occurred at approximately 70 % evaporation. Other major mineral phases such as halite (NaCl) and then bischofite (MgCl2.6H2O) precipitated at approximately 85% and 99% evaporation, respectively (Figure 3.10).
The solution composition of untreated Narembeen water during evaporation reflected the sequence and relative mass of precipitated minerals (Figures 3.11 and 3.12). With increasing evaporation the solution progressively became an Na-Cl – dominated brine until approximately 85% evaporation. As was the case of the FBR-treated Narembeen water, halite precipitated and became the most abundant precipitated mineral by mass (Figure 3.8). Gypsum and then anhydrite, and ultimately bischofite, all of which are largely insensitive to solution pH continued to precipitate. As evaporation continued, the remnant solution became more acidic, ultimately resulting in a H-Mg-Ca-Cl brine as the solution reached desiccation.
0 .1 .2 .3 .4 .5 .6 .7 .8 .9 1–1.5
–1
–.5
0
.5
1
1.5
2
2.5
3
Rxn progress
pH
Figure 3.9 Modelled pH versus reaction progress (expressed as a fraction of the initial volume evaporated) for untreated Narembeen water
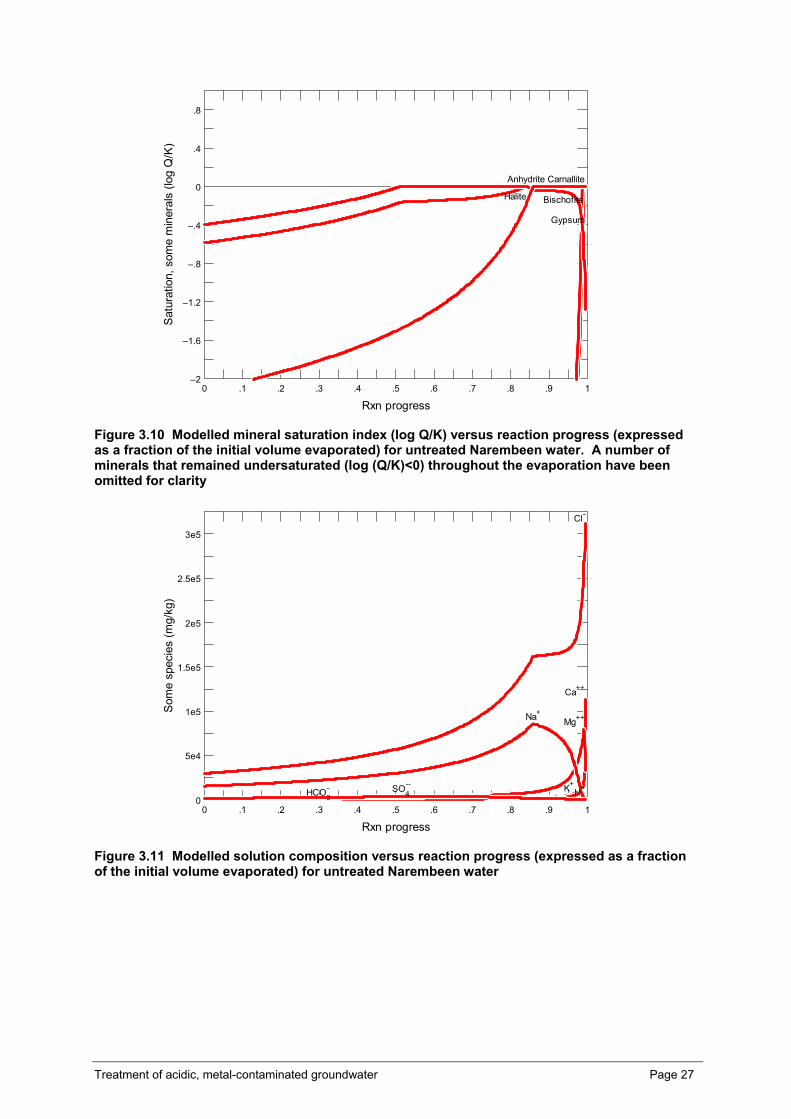
Treatment of acidic, metal-contaminated groundwater Page 27
0 .1 .2 .3 .4 .5 .6 .7 .8 .9 1–2
–1.6
–1.2
–.8
–.4
0
.4
.8
Rxn progress
Sat
urat
ion,
som
e m
iner
als
(log
Q/K
)Anhydrite
Bischofite
Carnallite
Gypsum
Halite
Figure 3.10 Modelled mineral saturation index (log Q/K) versus reaction progress (expressed as a fraction of the initial volume evaporated) for untreated Narembeen water. A number of minerals that remained undersaturated (log (Q/K)<0) throughout the evaporation have been omitted for clarity
0 .1 .2 .3 .4 .5 .6 .7 .8 .9 10
5e4
1e5
1.5e5
2e5
2.5e5
3e5
Rxn progress
Som
e sp
ecie
s (m
g/kg
)
Ca++
Cl-
H+HCO3- K+
Mg++Na+
SO4--
Figure 3.11 Modelled solution composition versus reaction progress (expressed as a fraction of the initial volume evaporated) for untreated Narembeen water

Treatment of acidic, metal-contaminated groundwater Page 28
0 .1 .2 .3 .4 .5 .6 .7 .8 .9 1
–6
–5
–4
–3
–2
–1
0
Rxn progress
Min
eral
s (lo
g m
oles
)Gypsum Anhydrite
Halite
Carnallite
Bischofite
Figure 3.12 Modelled mass of precipitated minerals versus reaction progress (expressed as a fraction of the initial volume evaporated) for untreated Narembeen water
Trace metal contaminants in salts prepared from FBR-treated and untreated Narembeen water Preparation of salts from untreated Narembeen water, that contains numerous metals in high concentration, would produce salts that are not suitable for consumption. FBR-treatment removed most of the metals from solution (Table 3.1). The trace metal contents in salts prepared by complete evaporation of untreated Narembeen water and FBR-treated Narembeen water are compared with the trace metal content of a commercially available table salt in Table 3.6. Evaporation of untreated Narembeen water produced salts high in contaminants such as aluminium, zinc, lead and cerium. Except for the concentrations of the major cations calcium, potassium and magnesium, that could be controlled by removal of bitterns at the appropriate degree of evaporation, salts prepared from FBR-treated Narembeen water contained lower contents of many elements than occur in commercially available table salt (e.g. silicon, aluminium and lead; Table 3.6). Exceptions were boron, manganese, nickel, strontium and zinc.

Treatment of acidic, metal-contaminated groundwater Page 29
Table 3.6 Concentrations of metals and metalloids in solution after dissolution of 1 gram of salt (crystallised by evaporation of bioreactor effluent and Narembeen influent waters to dryness at 50 °C) in 100 mL of MilliQ water, compared with the metals in 1 g of commercially available table salt dissolved in 100 mL MilliQ water. Values in red are for elements that are in greater amounts in salts precipitated from FBR-treated water than in commercial table salt, whereas values in blue are for cations that are in lesser amounts in salts precipitated from FBR-treated water than in commercial table salt.
Commercial Bioreactor B Bioreactor A Narembeen Salt effluent effluent water Ca (mg L-1) 4.5 169 181 282 K (mg L-1) 1.9 51 40 34 Mg (mg L-1) 0.6 329 256 218 Na (mg L-1) 3775 2305 2415 2410 Al (mg L-1) 2.7 <0.5 <0.5 21 B (mg L-1) <0.5 0.8 0.7 0.6 Fe (mg L-1) <0.5 <0.5 <0.5 <0.5 Mn (mg L-1) <0.05 0.1 0.2 0.1 Si (mg L-1) 2.2 <0.2 <0.2 0.9 Sr (mg L-1) 0.1 3.7 3.6 4.2 V (μg L-1) <1 <1 <1 <1 Cr (μg L-1) <0.4 <0.4 <0.4 6.3 Co (μg L-1) 0.6 0.6 <0.5 8.6 Ni (μg L-1) <1 2.1 1.4 13 Cu (μg L-1) <1 <1 <1 19 Zn (μg L-1) <1 1.7 6.9 112 As (μg L-1) <1 <1 <1 <1 Se (μg L-1) <0.4 <0.4 <0.4 <0.4 Y (μg L-1) 0.8 0.6 <0.5 5.8 Mo (μg L-1) <1 <1 <1 <1 Ru (μg L-1) 0.5 <0.4 <0.4 <0.4 Pd (μg L-1) <1 <1 <1 <1 Ag (μg L-1) 0.9 0.7 0.5 <0.5 Cd (μg L-1) 0.7 0.5 <0.4 <0.4 Sn (μg L-1) 1.2 0.8 0.6 0.5 Sb (μg L-1) 1.3 0.8 0.5 0.6 La (μg L-1) 1 0.7 0.6 17 Ce (μg L-1) 1.6 1.2 1 42 Pr (μg L-1) 0.7 0.5 <0.4 4.2 Nd (μg L-1) 0.9 0.6 <0.4 14 Sm (μg L-1) 0.6 <0.5 <0.5 2.5 Eu (μg L-1) 0.6 <0.5 <0.5 0.7 Gd (μg L-1) 0.6 <0.5 <0.5 2.1 Tb (μg L-1) 0.6 <0.5 <0.5 0.5 Dy (μg L-1) 0.6 <0.5 <0.5 1.5 Ho (μg L-1) 0.6 <0.5 <0.5 0.5 Er (μg L-1) 0.6 <0.5 <0.5 0.8 Tm (μg L-1) 0.6 <0.5 <0.5 <0.5 Yb (μg L-1) 0.6 <0.5 <0.5 0.6 Lu (μg L-1) 0.6 <0.5 <0.5 <0.5 Hf (μg L-1) 1.3 1.1 0.9 0.8 Pt (μg L-1) 0.5 <0.5 <0.5 <0.5 Au (μg L-1) 0.6 <0.5 <0.5 <0.5 Tl (μg L-1) 0.5 <0.5 <0.5 <0.5 Pb (μg L-1) 1.1 0.7 0.5 28 Th (μg L-1) 0.7 0.5 0.5 0.6 U (μg L-1) <1 <1 <1 <1

Treatment of acidic, metal-contaminated groundwater Page 30
3.4 Economic Estimates
Evaluation of the costs of implementation of the sulfate-reducing process The estimation of costs for the full scale implementation in the Wheatbelt of a sulfate-reducing fluidised bed reactor process for the treatment of acidic, saline, metal-contaminated water, based on laboratory experimentation will be, at best, imprecise. Nonetheless, decisions on whether to take further steps towards evaluating the practical use of sulfate-reducing fluidised bed reactors for treatment of acidic, saline, water from the Wheatbelt will require an estimate of the economics of the process.
Better definition of costs would be derived from pilot scale studies in the field, because of potential efficiencies (or inefficiencies) associated with scale-up and because of the necessity to interface the process with associated technologies and services, which will have a bearing on the final cost structure. Of the major Wheatbelt towns, groundwater from Narembeen probably represents the “worst case scenario” for treatment, because of its low pH and higher salt content. The cost of many components of the process will be determined by the minimal HRT for effective treatment, as this will determine the volume of water that will need to be held within the treatment reactors, and hence the size and capital cost of the process. The laboratory experimentation showed that the HRT required for effective treatment of Narembeen water was about 20 hours, whereas water from Kellerberrin could be treated with an HRT of 2 to 4 hours.
A number of data, observations and assumptions were used in the development of the process cost estimates. The costing was based on the use of the technology at Narembeen as a pre-treatment for desalination of the water for potable use. The average daily use of scheme water in Narembeen town over the nine years from 1998 to 2007 was 155.1 kL. Desalination of groundwater from Katanning has been proposed with a reject proportion of 20 % of the influent flow (Barron and Sil, 2006). Costs of a bore field construction and operation and two, 1-hectare evaporation basins were included in the cost estimates for desalination provided by Barron and Sil (2006). For Narembeen, a reject of 50 % was assumed, which necessitates treatment of 310.2 kL day-1 via sulfate reduction. With an HRT of 20 hours, a total tank volume of 369 kL is required if filled to 70 % capacity. To accommodate these assumptions, and the need to compartmentalise the process, it was decided that four 100 kL lined tanks would be required.
To accommodate this, four ethanol/nutrient stainless steel and non-sparking injection pumps with back pressure valves capable of delivery of 1.6 L h-1 (Iwaki, LK-F21S6-04) are required, as are four water delivery pumps and pressure valves capable of delivery of 3.8 kL h-1 (Iwaki, 2AXBC-DL100VC-22 Duplex Head) and four large recycle pumps capable of delivery of 240 kL h-1 (Munsch, NP 150-125-315). When the recycle ratio was greater than 10, the performance of the recycle, fixed-bed reactor closely approximated that of a completely mixed biofilm reactor (Rittman, 1982). Power usage by these pumps will be less than their maximal rating, but for the purposes of power costs, the maximal power usage was used, with a power cost of $0.17 (kWh)-1 (Data from Western Power, as cited by Barron and Zil, 2006).
For the treatment of 310 kL day-1 of Narembeen groundwater, which requires the addition of 0.4 g L-1 of ethanol, 4796 L of ethanol are required per month. As excess ethanol storage capacity is required on site, it is expected that three 5000 L bunded solvent tanks would be required (at $7,500 per unit, Harvey Johnstone, BP Petroleum) with delivery of 10,000 L of ethanol every two months (at $0.12 L-1; Harvey Johnstone, BP Petroleum). As the cost of ethanol can range from $0.47 to $1.10 L-1 (Australian Government, Department of Industry, Tourism and Resources) an average of $0.78 L-1 was used for these estimates. Construction of an ethanol production facility is proposed for Kwinana commencing in 2007 for the production of up to 160 million litres per annum of ethanol. Small additions of nutrients are required for the process (urea, 3.6 kg day-1; phosphate 1.0 kg day-1) at minimal cost ($3.69 day-1). Biodiesel production waste, which contains methanol, triglycerides, and hydroxides may be an alternate form of carbon and energy for sulfate-reducing bioreactors (Doshi, 2006) and its use could reduce costs if a biodiesel industry develops in the Wheatbelt.
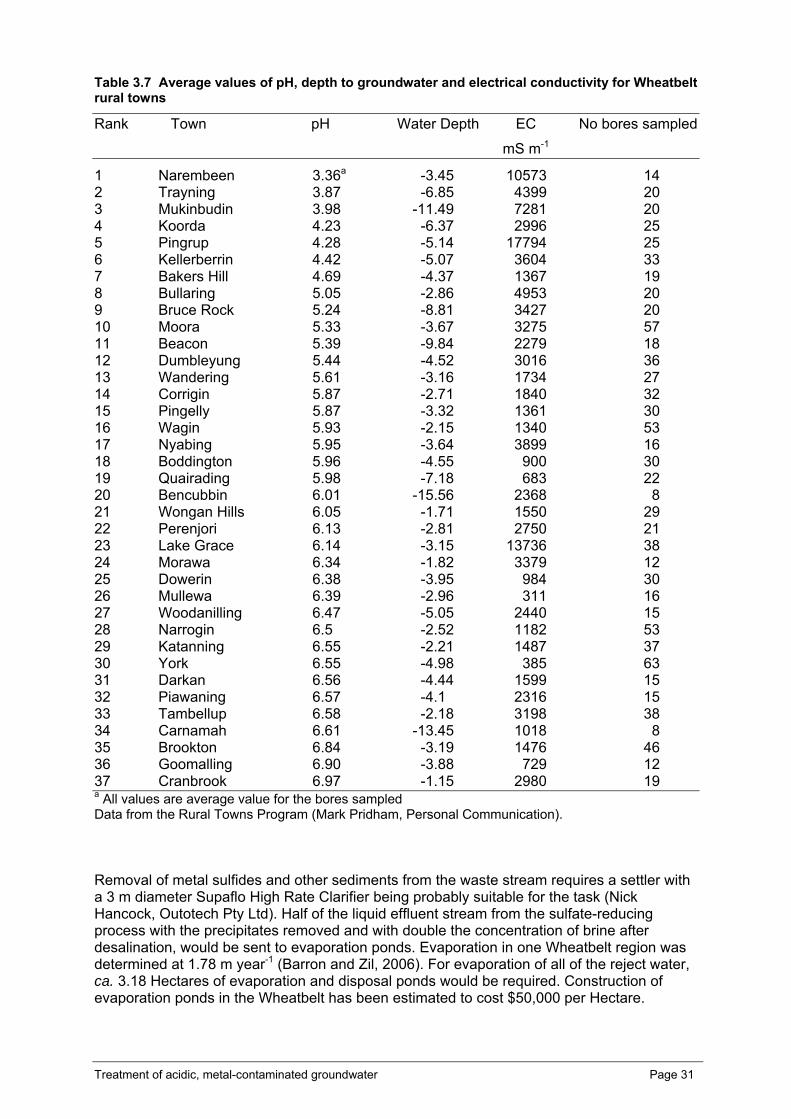
Treatment of acidic, metal-contaminated groundwater Page 31
Table 3.7 Average values of pH, depth to groundwater and electrical conductivity for Wheatbelt rural towns
Rank Town pH Water Depth EC No bores sampled
mS m-1
1 Narembeen 3.36a -3.45 10573 14 2 Trayning 3.87 -6.85 4399 20 3 Mukinbudin 3.98 -11.49 7281 20 4 Koorda 4.23 -6.37 2996 25 5 Pingrup 4.28 -5.14 17794 25 6 Kellerberrin 4.42 -5.07 3604 33 7 Bakers Hill 4.69 -4.37 1367 19 8 Bullaring 5.05 -2.86 4953 20 9 Bruce Rock 5.24 -8.81 3427 20 10 Moora 5.33 -3.67 3275 57 11 Beacon 5.39 -9.84 2279 18 12 Dumbleyung 5.44 -4.52 3016 36 13 Wandering 5.61 -3.16 1734 27 14 Corrigin 5.87 -2.71 1840 32 15 Pingelly 5.87 -3.32 1361 30 16 Wagin 5.93 -2.15 1340 53 17 Nyabing 5.95 -3.64 3899 16 18 Boddington 5.96 -4.55 900 30 19 Quairading 5.98 -7.18 683 22 20 Bencubbin 6.01 -15.56 2368 8 21 Wongan Hills 6.05 -1.71 1550 29 22 Perenjori 6.13 -2.81 2750 21 23 Lake Grace 6.14 -3.15 13736 38 24 Morawa 6.34 -1.82 3379 12 25 Dowerin 6.38 -3.95 984 30 26 Mullewa 6.39 -2.96 311 16 27 Woodanilling 6.47 -5.05 2440 15 28 Narrogin 6.5 -2.52 1182 53 29 Katanning 6.55 -2.21 1487 37 30 York 6.55 -4.98 385 63 31 Darkan 6.56 -4.44 1599 15 32 Piawaning 6.57 -4.1 2316 15 33 Tambellup 6.58 -2.18 3198 38 34 Carnamah 6.61 -13.45 1018 8 35 Brookton 6.84 -3.19 1476 46 36 Goomalling 6.90 -3.88 729 12 37 Cranbrook 6.97 -1.15 2980 19 a All values are average value for the bores sampled Data from the Rural Towns Program (Mark Pridham, Personal Communication).
Removal of metal sulfides and other sediments from the waste stream requires a settler with a 3 m diameter Supaflo High Rate Clarifier being probably suitable for the task (Nick Hancock, Outotech Pty Ltd). Half of the liquid effluent stream from the sulfate-reducing process with the precipitates removed and with double the concentration of brine after desalination, would be sent to evaporation ponds. Evaporation in one Wheatbelt region was determined at 1.78 m year-1 (Barron and Zil, 2006). For evaporation of all of the reject water, ca. 3.18 Hectares of evaporation and disposal ponds would be required. Construction of evaporation ponds in the Wheatbelt has been estimated to cost $50,000 per Hectare.

Treatment of acidic, metal-contaminated groundwater Page 32
Table 3.8 Estimate of the costs associated with the treatment of 310 kL day-1 of Narembeen saline, metal contaminated, acidic water with a sulfate-reducing fluidised-bed bioreactor for the production of 155 kL day-1 potable water through desalination
Item ($) Source Capital Costs Cost of 3 X 5,000L bunded ethanol fuel tanks ($) $22,500 1 Cost of 4 x 100 kL reactor tanks $200,000 2 Ethanol injection pumps x 4 with pressure valve $18,036 3 Water injection pumps x 4 with pressure valves $71,152 3 Large recycling pumps x 4 $146,000 3 Cost of Supraflow High Rate Clarifier - Settler for metal sulfides $185,000 4 Cost of 3.18 HA Evaporation pondsa $159,028 5 Extra piping and power installation $64,000 6 pH monitoring system with pump switches $15,000 Total cost of capital items $880,716 Annual cost for repairs and maintenance (at 10 % of capital) $88,072 Capital cost per kL based on a 20 year life producing 155 kL/day $0.78 Repairs and maintenance costs per kL $1.56 Operating costs Cost of ethanol with transportation ($/kL) $0.63 Costs of Nutrients ($/kL) $0.02 Power costs ($/kL) $1.25 Labour and science support costs ($/kL) $1.59 Cost of disposal of metal sediments ($/kL) $0.12 Cost of secure transport of metal sediments $0.10 Value of salt recovery ($/kL)b -$2.33 Total cost ($/kL of product) $3.72 1 Personal Communication, Harvey Johnstone, BP Australia 2 Brian Clark, Pioneer Water Tanks - lined (estimate) 3 Sean Vartha, Iwaki Pumps 4 Neil Hancock, Outotech Pty Ltd 5 Derived from Barron (2006) - $50,000 per Hectare 6 Rough estimate based on costs at Katanning for desalination unit (Barron, 2006)
a Note that a further 2 Hectares of evaporation ponds are part of the desalination costs of Barron and Sil (2006) as are the costs of a bore field and its operation. b If the salt were considered gourmet salts, this value would increase by close to an order of magnitude.
A further 2 x 1 Hectare evaporation ponds were included in the cost estimates of a desalination plant for evaporation of final the final bitterns as determined by Barron and Zil, 2006). Salt in 25 kg bags sells for $145 ton-1, however after discounting for the operation costs, the base price of bulk salt is $55 ton-1 (Maunsell Australia Pty Ltd 2003). The value of the sodium chloride collected by evaporation from desalination reject water (which contains 84.8 g L-1 halite) over one year is ca $246,250. If the salt was able to be sold to the gourmet market, a price of $500-1 ton could be realised (Maunsell Australia Pty Ltd 2003). Analysis of the metal sludge produced (ca. 260 kg day-1) suggests it contains no easily extractable metal values. If the sludge could not be disposed of to a tailings dam or used within mineral extraction operations, the cost of transportation of the sludge and its disposal in a Class IV landfill in Western Australia would be $12,512 year-1 (personal communications; Brain Jones, Red Hill Waste Facility; Laurie Cassisi, Effective Transport Pty Ltd.).

Treatment of acidic, metal-contaminated groundwater Page 33
There would be labour costs associated with maintaining the process (ca. $40,000 per year), and as the process is established some on-going operational scientific analysis would be required (perhaps $50,000 per year). This does not include continued scientific evaluation of the process which would be required to support the process through pilot and full-scale testing.
Costs of implementation of the process at other Wheatbelt towns may not vary greatly. In the case of Kellerberrin, because the HRT of the process dictates the volume of reactor vessel required for treatment of a fixed volume of water, the capital cost in constructing bioreactors for treatment of Kellerberrin groundwater would be about 66% of the cost of treatment of Narembeen water. However, as costs of much of the associated infrastructure such as salaries, evaporation ponds and piping do not change with the retention time the overall costs of implementation do not vary greatly. When the recovery of costs through salt production is considered, the costs of treating the same volume of Kellerberrin and Narembeen water are very similar, as Kellerberrin water contains considerably less salt. An analysis of costs of implementation at Kellerberrin returned a final cost of $3.83 kL-1 compared with the cost of $3.72 kL-1 at Narembeen.
Interpretation of these estimates for a full-scale process based on the outcomes of laboratory experimentation should be treated with great caution. The estimation of these costs was based on the purchase of all new capital equipment. The use of second had pumps and tanks could see the costs reduce. There may also be potential to consider other reactor configurations such as shandies of mixed “pre- processed” with raw waters to reduce processing costs.
The value of the process integrated with production of potable water by desalination Barron and Zil (2006) proposed that “…the real cost of providing water to the Wheatbelt under the current scheme is high. Local desalination plants could provide water to many areas of he Wheatbelt at less than the current real cost, while at the same time improving the urban environment, providing a degree of water independence, local abundance and security, create jobs, and open up opportunities for new technologies such as mineral extraction from brine.”
The cost of desalination of 200 kL day-1 at Katanning was estimated at $2.21 kL-1 inclusive of collection, capital investment over 20 years, and operating costs (Barron and Zil, 2006). Although the cost of desalination at Narembeen may differ from the cost at Katanning, it is beyond the scope of this study to investigate those costs at Narembeen, so the cost at Katanning, although imprecise, is used here as a guide. If linked to a sulfate-reducing process for the pre-treatment of the water for metal removal and salt recovery, the total cost of potable water production, with offsets for salt production, but not accounting for the economic benefit of reducing the surplus of water, metal contaminants and salt at Narembeen could be estimated at ca. $5.93 kL. Where saline water pumping or disposal is required to protect infrastructure or the environment, reduced water disposal costs can strongly support the economic argument for water reuse technologies. The economics can improve as part of salinity control measures. Salinity control may be required at Narembeen and many other Wheatbelt towns. At Narembeen damage costs associated with salinity has been estimated to cost $2.05 million with a time to impact of 5 years (Sparks et al., 2006). Management costs to protect biodiversity assets from salinisation in the Wheatbelt have been estimated to cost $854 Million. Protection and repair of road and rail infrastructure has been estimated to cost $2,114 Million (Sparks et al., 2006).
According to Barron, quoting Gary Crisp of the Water Corporation, the cost of delivering water on the main Kalgoorlie scheme pipeline is $3.02 kL-1. The cost at remote areas not serviced by the pipeline can be as high as $7.56 kL-1. Without pre-treatment, local desalination plants could deliver water to many of the Wheatbelt rural towns at less than the current cost and could deliver significant benefits across the triple bottom line (Barron and Zil, 2006). Pre-treatment of acidic saline metal contaminated water via sulfate-reducing fluidised bed bioreactors (ca. $4.00 kL-1), combined with desalination ($2.20 kL-1) would

Treatment of acidic, metal-contaminated groundwater Page 34
produce water at a price close to the maximum price of water delivered to a remote area, however the economic benefits associated with dealing with the contamination and the inclusion of other benefits would substantially improve the economic balance in favour of desalination with pre-treatment.
Implementation of sulfate-reducing fluidised bed reactor technology for treating acidic, saline, metal-contaminated water from the Wheatbelt of Western Australia cannot be proceeded with based only on the outcomes from this study. The next step towards its implementation would be to prove the technology at pilot scale, so as to improve confidence in the technology, and to obtain a more reliable understanding of the cost of implementation which cannot be derived accurately from laboratory scale tests. If sulfate-reducing fluidised bed reactors were considered technologically appropriate at larger scale, the decision to use them or not would be based on; the necessity to take action, the comparative effectiveness of competing technologies, and the relative costs of competing technologies such as lime treatment or mixing of waters with waters of naturally higher pH. Douglas and Degens (2006) examined the potential that many of the competing technologies could offer for the treatment of acidic, metal-contaminated waters. Their desk top study of available technologies does not allow comparisons of outcomes or costs, or advantages and disadvantages, associated with treatment of Wheatbelt waters, as the technologies were not tested. A comparison of competing technologies with sulfate-reducing fluidised bed reactors cannot be made as yet and is beyond the scope of this study. For example, lime treatment is considered the standard approach for the remediation of acidic waters, but its application in the Wheatbelt in a continuous process has not been tested in the laboratory or the field. Operational considerations for use of lime would include the potential for over or under dosing, the need for mechanical mixing, the behaviour of metals at different pH values, whether cationic flocculants were required, the practicality of sludge dewatering, the impact of higher calcium concentrations in the product water, mechanical and labour requirements for dosing, and the long term stability of the sludge.
Sulfate-reducing technology is being taken up by the mining industry for the treatment of acidic, metal contaminated environmental waters in the USA and South Africa. Experience with this technology in Western Australia is limited to research laboratories. There is a need for cost effective methods for treating acid drainage or acidic surface waters in Western Australia, such as for improving the water quality in Collie lakes (such Kepwari Lake with pH of 4.5-4.9, and Chicken Creek Lake with pH of 2.6), for treating acid drainage from soils in the Swan and Peel Estuaries, and for treating mine lakes associated with the mining of iron ore in the Pilbara region of WA. Sulfate-reducing technology may have a role in ameliorating acidity and associated metal contents in these waters.

Treatment of acidic, metal-contaminated groundwater Page 35
References
Ali, R., Hatton, T., George, R., Byrne, J., & Hodgson, G. 2004, Evaluation of the impacts of deep open drains on groundwater levels in the wheatbelt of Western Australia, Australian Journal of Agricultural Research, 55: 1159-1171.
Aral, H. & Barron, O. 2004, Salt extraction – another approach to the salinity problem, in “Engineering Salinity Solutions” Conference Proceedings of the 1st National Salinity Engineering Conference, eds. S Dogramaci & A. Waterhouse, Institution of Engineers, Australia, 37-42.
Barron, O. 2006, Desalination options and their possible implementation in Western Australia: Potential role for CSIRO Land and Water. CSIRO Water for a Healthy Country Report. CSIRO, Perth, Australia.
Barron, O., Aral, H., Hatton, T. & Taylor, M. 2003, Rural town water management (T3.S2.P3). Technical Report 1/03. Healthy Country Flagship Program, CSIRO Land and Water.
Barron, O. & Zil, K. 2006, Katanning Desalination Demonstration Plant: Business Plan, CSIRO Water for a Healthy Country National Research Flagship Canberra.
Barron, O., Turner, J,. Barr, A,. Smales, T., Pridham, M., Burton, M. & Pluske, J. Submitted, Integrating science within the West Australian rural towns liquid assets project. “Integrated mission directed research: learning from experience in environment and natural resource management” Eds: S Hatfield-Dodds, L Van Kerkhoff and W Proctor, Elsevier IDEA series.
Bethke, C.M. 2006, The Geochemists Workbench, v.6.0, A Users Guide to Rxn, Act2, Tact, React, and Gtplot. Hydrogeology Program, University of Illinois.
Brandt, KK & Ingvorsen, K 1997, Desulfobacter halotolerans sp nov, a halotolerant acetate-oxidising sulfate-reducing bacterium isolated from sediments of Great Salt lake, Utah. Systematic and Applied Microbiology, 20, 366-373.
Cord-Ruwisch, R. 1985, A quick method for the determination of dissolved and precipitated sulfides in cultures of sulfate reducing bacteria. Journal of Microbiological Methods, 4, 33-36.
Davis, J.A. 2004, Valleys of salt, channels of water, pools of life: Environmental aspects of salinity engineering, in “Engineering Salinity Solutions” Conference Proceedings of the 1st National Salinity Engineering Conference, eds. S Dogramaci & A. Waterhouse, Institution of Engineers, Australia, pp 177-182.
Department of Local Government and Regional Development, 2003, Wheatbelt Economic Perspective. Government of Western Australia.
De Vegt, A.L., Kijkman, H. & Buisman, C.J. 1998, Hydrogen sulfide produced from sulfate by biological reduction for use in metallurgical operations. In: J.A. Asteljoki & R.L. Stephens (Eds). Sulfide Smelting ’98: Current and Future Practices. The Minerals, Metals & Materials Society, 463-471.
Doshi, S.M. 2006, Bioremediation of acid mine drainage using sulfate-reducing bacteria. U.S Environmental Protection Agency, Washington D.C.
Douglas, G. & Degens, B. 2006, A synopsis of potential amendments and remediation techniques for the neutralization of acidic drainage waters in the Western Australian Wheatbelt. CRC LEME Open File Report 209, 22 pages.
Eugster, H.P., Harvie, C.E. & Weare, J.H. 1980, Mineral equilibria in the six component water system, Na-K-Mg-Ca- SO4- Cl-H2O at 25oC. Geochim et Cosmochim Acta., 44: 1335-1347.
Fitzpatrick, R.W., Baker, A.K.M., Raven, M., Rogers, S., Degens, B., George, R. & Kirby, J. 2005, Mineralogy, biogeochemistry, hydro-pedology and risks of sediments, salt

Treatment of acidic, metal-contaminated groundwater Page 36
efflorescence and soils in open drains in the wheatbelt of Western Australian. In: Regolith 2005 – Then Years of the CRC LEME, Ed. I.C. Roach, CRC – LEME, Perth Western
Fujita, Y., Ferris, E.G., Lawson, R.D., Colwell, F.S.& Smith, R.W. 2000, Calcium carbonate precipitation by ureolytic subsurface bacteria. Geomicrobiology Journal 17: 305-318.
George, R.J. & Coleman, M. 2001, Hidden menace or opportunity – groundwater hydrology, playasa, and commercial options for salinity in wheatbelt valleys. pp. 1 – 21 In Proceedings of the Wheatbelt Valley Conference. ed. V. Read. Water and Rivers Commission, Perth.
Gusek, J.J. 2002, Sulfate-reducing bioreactor design and operating issues: Is this the passive treatment technology for your mine drainage? Proceedings of the 2002 National Association of Abandoned Mine Land Programs Annual Conference, September 15-18, 2002, Park City Utah. http://www.epa.gov/NE/superfund/sites/elizmine/43547.pdf
Halse, S.A .2004, Impacts of drainage disposal on biodiversity in wetlands of the Western Australian wheatbelt, in “Engineering Salinity Solutions” Conference Proceedings of the 1st National Salinity Engineering Conference, eds. S Dogramaci & A. Waterhouse, Institution of Engineers, Australia, 373-378.
Hammack, R.W., Edenborn, H.M. & Dvorak 1994, Treatment of water from an open-pit copper mine using biogenic sulfide and limestone: A feasibility study. Water Research 28: 2321-2329.
Harvie, C.E. & Weare, J.H. 1980, The prediction of mineral solubilities in the natural waters, the Na-K-Mg-Ca-H-Cl-SO4-OH-HCO3-CO3-CO2-H2O system from zero to high ionic strengths at 25oC. Geochim et Cosmochim Acta., 44: 981-997.
Harvie, C.E., Moller, N. & Weare, J.H. 1984, The prediction of mineral solubilities in the natural waters, the Na-K-Mg-Ca-H-Cl-SO4-OH-HCO3-CO3-CO2-H2O system to high ionic strengths at 25oC. Geochim et Cosmochim Acta., 48, 723-751.
Hatton, T.J., Ruprecht, J. & George, R.J. 2003, Preclearing hydrology of the Western Australian wheatbelt: Target for the future? Plant and Soil 257: 341-356.
Kaksonen, A.H., Riekkola-Vanhanen, M.-L. & Puhakka, J.A. 2003a, Optimisation of metal sulfide precipitation in fluidized-bed treatment of acidic wastewater. Water Research 37: 255-266.
Kaksonen, A.H., Franzmann, P.D. & Puhakka, J.A. 2003b, Performance of ethanol oxidation kinetics of a sulfate-reducing fluidized-bed reactor treating acidic metal-containing wastewater. Biodegradation 14: 207-217.
Kaksonen, A.H., Franzmann, P.D. & Puhakka, J.A. 2004, Effects of hydraulic retention time and sulfide toxicity on ethanol and acetate oxidation in sulfate-reducing metal-precipitating fluidized-bed reactor. Biotechnology and Bioengineering 86, 332-343.
Landline 2005, WA faces salinity crisis, http://www.abc.net.au/landline/content/2005/s1358543.htm
MacFarland, M.J. & Sims, R.C.1991, Thermodynamic framework for evaluating PAH degradation in the subsurface. Groundwater 29: 885-896.
Maunsell Australia Pty Ltd. 2003. Solar saltfield at Toolibin Lake, Feasibility Study. Department of Conservation and Land Management. Western Australia. http://www.naturebase.net/pdf/projects/salinity/toolibin/solar_saltfield_study.pdf
Nagpal, S., Chuichulcherm, S., Peeva, L. & Livingston, A. 2000, Microbial sulfate reduction in a liquid-solid fluidized bed reactor. Biotechnology and Bioengineering 70: 370-380.
NHMRC and NRMMC (National Health and Medical Research Council and Natural Resource Management Ministerial Council) (2004). Australian Drinking Water Guidelines, Australian Government, Canberra.
Redfield, A.C., Ketchum, B.H. & Richards, F.A. 1963, The influence of organisms on the composition of seawater. The Sea Volume 2. Wiley, New York, 26-77.

Treatment of acidic, metal-contaminated groundwater Page 37
Rittman, B.E. 1982, Comparative performance of biofilm reactor types. Biotechnology and Bioengineering 24, 1341-1370
Sierra-Alvarez, R., Karri, S. & Field, J.A. 2006, Biological treatment of heavy metals in acid mine drainage using sulfate reducing bioreactors. Water Science and Technology 54: 179-185.
Somlev, V. & Banov, S. 1998, Three stage process for complex biotechnological treatment of industrial wastewater from uranium mining. Biotechnology Techniques 12: 637-639.
Sparks, T., George, R., Wallace, K., Pannell, D., Burnside, D. & Stelfox, L. 2006, Salinity Investment Framework Phase II. Salinity and Land Use Impacts Series, Report No SLUI 34. Department of Agriculture and Food, Department of Environment and Conservation and Department of Water, Government of Western Australia.
Spear, J.R., Figueroa, L.A .& Honeyman, B.D. 2000, Modeling reduction of uranium U(VI) under variable sulfate concentrations by sulfate-reducing bacteria. Applied and Environmental Microbiology 66: 3711-3721.
Tsukamoto, T.K., Killion, H.A. & Miller, G.C. 2004, Column experiments for microbiological treatment of acid mine drainage: low-temperature, low-pH and matrix investigations. Water Research 38: 1405-1418.
Vallero, M.V.G., Sipma, J., Lettinga, G. & Lens, P.N.L. 2004, High-rate sulfate reduction at high salinity (up to 90 mS.cm-1) in mesophilic UASB reactors. Biotechnology and Bioengineering 86: 226-235.

Treatment of acidic, metal-contaminated drainage water Page 38


![Real-Time Water Quality Monitoring Systems: UV-Vis ... · Real-Time Water Quality Monitoring: The Vienna Experience © s::can Messtechnik p.9 Appl. "INFLUENT" - COD [mg/l] R2 = 0,94](https://static.fdocuments.us/doc/165x107/5fbc1adb62acba0b361322ff/real-time-water-quality-monitoring-systems-uv-vis-real-time-water-quality-monitoring.jpg)

