WATER, FOOD AND ENERGY NEXUS...
26
WATER, FOOD AND ENERGY NEXUS CHALLENGES business solutions for a sustainable world
Transcript of WATER, FOOD AND ENERGY NEXUS...

WATER, FOOD AND ENERGY NEXUS CHALLENGES
business solutions for a sustainable world
2Water, food and energy nexus challenges
CONTENTS
1 Introduction 3
2 Forecasts on future demand for food, fiber and fodder 8
3 Implications for land management 10
4 Perspectives on water use 11
5 Impact of climate change on agriculture 13
6 Energy requirements in agriculture 15
7 Impact on greenhouse gas emissions 17
8 Agriculture and water quality 18
9 Impacts on markets 21
References 22
3Water, food and energy nexus challenges
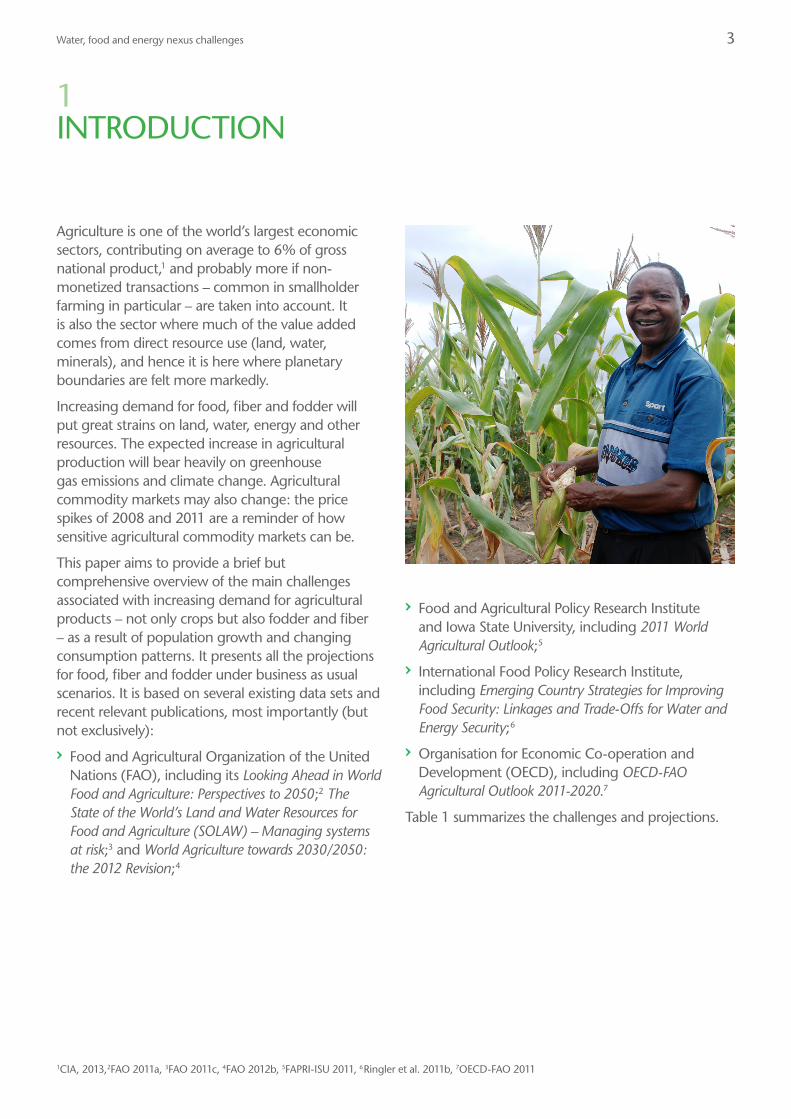
Agriculture is one of the world’s largest economic sectors, contributing on average to 6% of gross national product,1 and probably more if non-monetized transactions – common in smallholder farming in particular – are taken into account. It is also the sector where much of the value added comes from direct resource use (land, water, minerals), and hence it is here where planetary boundaries are felt more markedly.
Increasing demand for food, fiber and fodder will put great strains on land, water, energy and other resources. The expected increase in agricultural production will bear heavily on greenhouse gas emissions and climate change. Agricultural commodity markets may also change: the price spikes of 2008 and 2011 are a reminder of how sensitive agricultural commodity markets can be.
This paper aims to provide a brief but comprehensive overview of the main challenges associated with increasing demand for agricultural products – not only crops but also fodder and fiber – as a result of population growth and changing consumption patterns. It presents all the projections for food, fiber and fodder under business as usual scenarios. It is based on several existing data sets and recent relevant publications, most importantly (but not exclusively):
› Food and Agricultural Organization of the United Nations (FAO), including its Looking Ahead in World Food and Agriculture: Perspectives to 2050;2 The State of the World’s Land and Water Resources for Food and Agriculture (SOLAW) – Managing systems at risk;3 and World Agriculture towards 2030/2050: the 2012 Revision;4
› Food and Agricultural Policy Research Institute and Iowa State University, including 2011 World Agricultural Outlook;5
› International Food Policy Research Institute, including Emerging Country Strategies for Improving Food Security: Linkages and Trade-Offs for Water and Energy Security;6
› Organisation for Economic Co-operation and Development (OECD), including OECD-FAO Agricultural Outlook 2011-2020.7
Table 1 summarizes the challenges and projections.
1 INTRODUCTION
1CIA, 2013,2FAO 2011a, 3FAO 2011c, 4FAO 2012b, 5FAPRI-ISU 2011, 6Ringler et al. 2011b, 7OECD-FAO 2011
4Water, food and energy nexus challenges
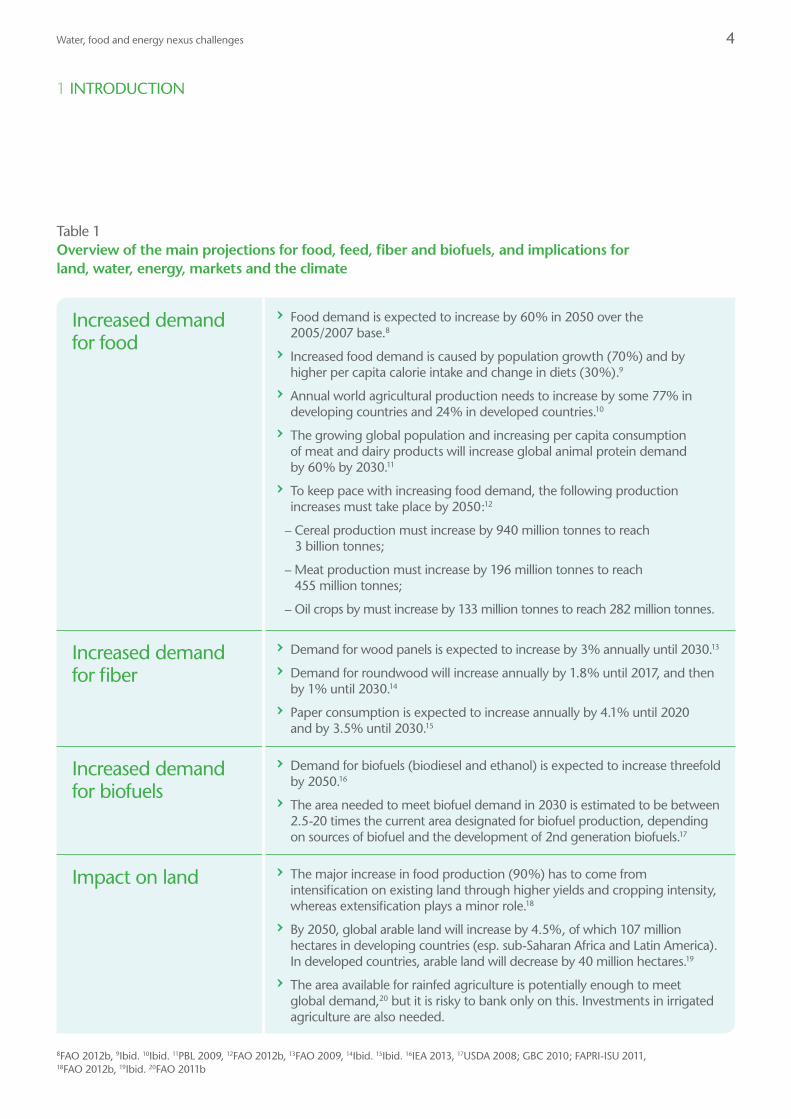
Increased demand for food
› Food demand is expected to increase by 60% in 2050 over the 2005/2007 base.8
› Increased food demand is caused by population growth (70%) and by higher per capita calorie intake and change in diets (30%).9
› Annual world agricultural production needs to increase by some 77% in developing countries and 24% in developed countries.10
› The growing global population and increasing per capita consumption of meat and dairy products will increase global animal protein demand by 60% by 2030.11
› To keep pace with increasing food demand, the following production increases must take place by 2050:12
– Cereal production must increase by 940 million tonnes to reach 3 billion tonnes;
– Meat production must increase by 196 million tonnes to reach 455 million tonnes;
– Oil crops by must increase by 133 million tonnes to reach 282 million tonnes.
Increased demand for fiber
› Demand for wood panels is expected to increase by 3% annually until 2030.13
› Demand for roundwood will increase annually by 1.8% until 2017, and then by 1% until 2030.14
› Paper consumption is expected to increase annually by 4.1% until 2020 and by 3.5% until 2030.15
Increased demand for biofuels
› Demand for biofuels (biodiesel and ethanol) is expected to increase threefold by 2050.16
› The area needed to meet biofuel demand in 2030 is estimated to be between 2.5-20 times the current area designated for biofuel production, depending on sources of biofuel and the development of 2nd generation biofuels.17
Impact on land › The major increase in food production (90%) has to come from intensification on existing land through higher yields and cropping intensity, whereas extensification plays a minor role.18
› By 2050, global arable land will increase by 4.5%, of which 107 million hectares in developing countries (esp. sub-Saharan Africa and Latin America). In developed countries, arable land will decrease by 40 million hectares.19
› The area available for rainfed agriculture is potentially enough to meet global demand,20 but it is risky to bank only on this. Investments in irrigated agriculture are also needed.
Table 1 Overview of the main projections for food, feed, fiber and biofuels, and implications for land, water, energy, markets and the climate
8FAO 2012b, 9Ibid. 10Ibid. 11PBL 2009, 12FAO 2012b, 13FAO 2009, 14Ibid. 15Ibid. 16IEA 2013, 17USDA 2008; GBC 2010; FAPRI-ISU 2011, 18FAO 2012b, 19Ibid. 20FAO 2011b
1 INTRODUCTION
5Water, food and energy nexus challenges
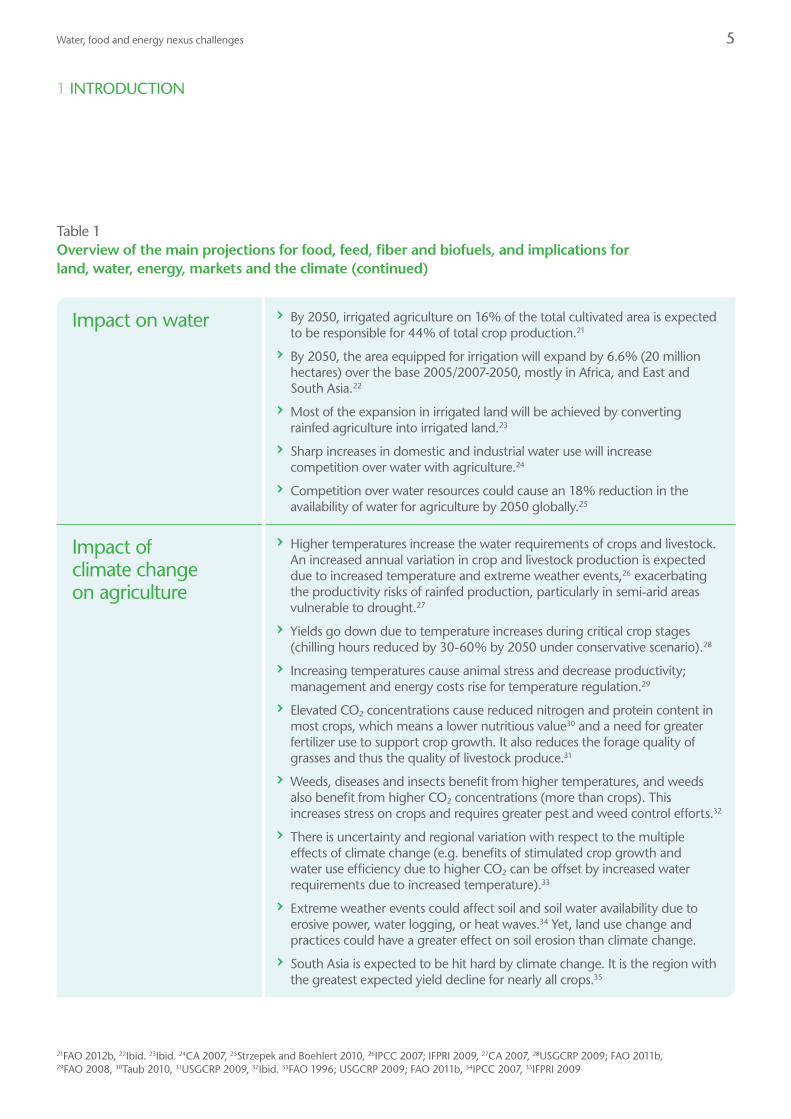
Impact on water › By 2050, irrigated agriculture on 16% of the total cultivated area is expected to be responsible for 44% of total crop production.21
› By 2050, the area equipped for irrigation will expand by 6.6% (20 million hectares) over the base 2005/2007-2050, mostly in Africa, and East and South Asia.22
› Most of the expansion in irrigated land will be achieved by converting rainfed agriculture into irrigated land.23
› Sharp increases in domestic and industrial water use will increase competition over water with agriculture.24
› Competition over water resources could cause an 18% reduction in the availability of water for agriculture by 2050 globally.25
Impact of climate change on agriculture
› Higher temperatures increase the water requirements of crops and livestock. An increased annual variation in crop and livestock production is expected due to increased temperature and extreme weather events,26 exacerbating the productivity risks of rainfed production, particularly in semi-arid areas vulnerable to drought.27
› Yields go down due to temperature increases during critical crop stages (chilling hours reduced by 30-60% by 2050 under conservative scenario).28
› Increasing temperatures cause animal stress and decrease productivity; management and energy costs rise for temperature regulation.29
› Elevated CO2 concentrations cause reduced nitrogen and protein content in most crops, which means a lower nutritious value30 and a need for greater fertilizer use to support crop growth. It also reduces the forage quality of grasses and thus the quality of livestock produce.31
› Weeds, diseases and insects benefit from higher temperatures, and weeds also benefit from higher CO2 concentrations (more than crops). This increases stress on crops and requires greater pest and weed control efforts.32
› There is uncertainty and regional variation with respect to the multiple effects of climate change (e.g. benefits of stimulated crop growth and water use efficiency due to higher CO2 can be offset by increased water requirements due to increased temperature).33
› Extreme weather events could affect soil and soil water availability due to erosive power, water logging, or heat waves.34 Yet, land use change and practices could have a greater effect on soil erosion than climate change.
› South Asia is expected to be hit hard by climate change. It is the region with the greatest expected yield decline for nearly all crops.35
Table 1 Overview of the main projections for food, feed, fiber and biofuels, and implications for land, water, energy, markets and the climate (continued)
21FAO 2012b, 22Ibid. 23Ibid. 24CA 2007, 25Strzepek and Boehlert 2010, 26IPCC 2007; IFPRI 2009, 27CA 2007, 28USGCRP 2009; FAO 2011b, 29FAO 2008, 30Taub 2010, 31USGCRP 2009, 32Ibid. 33FAO 1996; USGCRP 2009; FAO 2011b, 34IPCC 2007, 35IFPRI 2009
1 INTRODUCTION

6Water, food and energy nexus challenges
Impact on energy › The food sector currently accounts for around 30% of the world's total energy consumption.36
› Global energy demand is projected to increase by 80% in 2050.37
› Agricultural commodity prices are sensitive to increased energy prices – price elasticity is around 0.27.38
› Public finances will be affected too – energy inputs in agriculture (fertilizer, pumping) are heavily subsidized in China, India, Yemen and several African countries.
› An increase in food production of 60% will lead to an increase in energy consumption in agriculture of 84%.39
Greenhouse gas emissions
› Global greenhouse gas emissions are expected to grow by 50% between 2012 and 2050, mostly driven by energy demand and economic growth in key emerging economies.40
› Agriculture is responsible for 13.5% of total greenhouse gas emissions – especially nitrous oxide (N2O) and methane (CH4).41
› 75% of global land-use change is attributed to agriculture, which contributes an additional 12-14% of global greenhouse gas emissions.42
› The energy supply sector is accountable for 25.9% of global greenhouse gas emissions.43
› The combined effect of all the structural and technological changes is that in 2050 CO2 emissions will be 2.25 times greater than in 1990.44
Agricultural commodity markets
› Commodity prices are likely to remain high and volatile.45
› With increased demand or scarcity setting the boundaries in some regions, there will be more international food trade and with it more price volatility.46
› Rising oil prices translate into higher agricultural production costs. Energy prices pass through to food (elasticity 0.27) and fertilizer prices (elasticity 0.55).47
› With prolonged high oil prices, future food and fertilizer commodity prices will also be high and price spikes will last longer.48
› Food trade needs to buffer fluctuations in food production (due to climate change).49
Table 1 Overview of the main projections for food, feed, fiber and biofuels, and implications for land, water, energy, markets and the climate (continued)
36FAO 2011a, 37OECD 2012, 38Baffes 2009, 39Pimentel and Pimentel 2008, 40OECD 2012, 41IPCC 2007, 42Vermeulen et al. 2012, 43IPCC 2007, 44EC 2007, 45OECD-FAO 2011 46Baffes 2007 and 2009; Allan 2011, 47Baffes 2009; OECD-FAO 2011, 48Baffes 2007 and 2009, 49CA 2007
1 INTRODUCTION

7Water, food and energy nexus challenges
Impact on water quality
› The build-up of nitrogen and phosphorus compounds due to agricultural water pollution could cause catastrophic shifts (eutrophication) in aquatic ecosystems, both marine and freshwater.50
› Salinity limits the productivity of agricultural crops, particularly in arid and semi-arid climatic zones, and is often irreversible.51 In many cases secondary salinization is due to the low quality of water used in irrigation, but rising sea levels also causes salt intrusion.
› High nitrate and nitrite concentrations in drinking water are considered dangerous for human health, as they might cause cancers and (though rarely) infant methaemoglobinaemia (the reduced ability of red blood cells to release oxygen to tissues).52
› Globally at least 4 to 6 million hectares of land are irrigated with either untreated wastewater or polluted water, but other estimates suggest this number is closer to 20 million hectares, almost 8% of the global irrigated area.53
› FAO54 estimates that globally about 34 million hectares (about 11% of the total irrigated area) are currently affected by salinity. An additional 60-80 million hectares are affected to some extent by water logging and related salinity.
Table 1 Overview of the main projections for food, feed, fiber and biofuels, and implications for land, water, energy, markets and the climate (continued)
The current challenges set the scene for a new “Green New Deal”55 – simultaneously addressing the numerous pressures and investing in better resource use – as an antidote to the current underinvestment or the previous overinvestment in property rather than in productive assets. The core of the Green New Deal is that solutions and investment address different challenges at the same time and hence tap into different cost and benefit streams, making them more profitable than if they had been addressed individually.
The idea behind working on the nexuses between water, energy and food is that this will co-optimize production increases, reduce pressure on water and land, and achieve higher energy efficiency while avoiding negative side effects. This is the subject of a second analysis, which draws on different solutions and sees how they affect the different dimensions.
The next paragraphs present the challenges at stake under business as usual scenarios. Section 2 forecasts future demand for food, fodder and fiber; sections 3 to 6 present implications for land, water, energy, climate and markets.
55Green New Deal refers to the New Deal of U.S. president F.D. Roosevelt and is a political concept developed in 2008 at the start of the economic crisis to stimulate environmentally sound initiatives. The concept strives for a win-win-win solution by combating the economic crisis of 2008, climate change and peak oil (when the global peak in oil production will be reached and an eternal decline in production will start). In 2008, the United Nations presented the Green Economy initiative, which is also known as the Global Green New Deal. In October 2011, the Dutch government presented a Green Deal and the UK government launched a Green Deal in October 2012; both are designed to stimulate the implementation of energy-saving measures for properties.
50Scheffer et al. 2001, 51Rozema and Flowers 2008, 52WHO 2011, 53WHO 2006; Jiménez et al. 2010; Bruinsma 2011, 54FAO 2011b
1 INTRODUCTION

8Water, food and energy nexus challenges
The FAO’s food and agriculture projections to 205056 provide the most comprehensive and consistent picture relative to food and feed demand. They incorporate diet changes, trade and production. The worldwide population is expected to rise 9.6 billion people in 2050.57 FAO estimates that in the same period, the world’s average daily calorie availability will increase to 3,070-3,130 kcal per person, a 9-11% increase over the 2003 level.58 Note that even so, projections still assume “no end to hunger” for many undernourished people in the developing world.
This projected change in diets means that per capita production will have to rise by some 22%. That a 22% production increase only results in an 11% calorie intake increase has to do with shifts to higher value diets (vegetables and fruits) and livestock products, both with lower caloric content.
Agricultural production will continue to increase – but the rate of growth is expected to taper off. Its annual growth is projected to fall from 2.2% over the last decade to 1.5% by 2030 and to 0.9% from 2030 to 2050. Even then, agricultural production will still need to increase by 60% (and nearly 100% in developing countries) by 2050. The unprecedented growth of the last forty years is over, but a very steady increase is still required in crop and meat production.
On top of demands for agricultural products to meet food security, increasing demand for biofuels (biodiesel as well as bioethanol) puts strains on agriculture and might well compete with food production. Biofuel production (especially ethanol) is expected to grow steadily though not as dramatically as during the past several years. The most recognized figures are:
› IEA59 – Biofuels use triples, rising from 1.3 million barrels of oil equivalent per day (mboe/d) in 2011 to 4.1 mboe/d in 2035, by which time it represents 8% of road-transport fuel demand.
› OECD-FAO60 – Global ethanol and biodiesel production are projected to continue to expand rapidly over the projected period 2010-2020. Biofuel production projections in many developing countries are quite uncertain following little or no production increases in recent years. Ethanol production derived from sugar cane is expected to expand rapidly, growing by almost 6% per year over the projection period to meet both domestic and international demand.
› Bruinsma and Alexandratos61 – “Limited biofuels scenario”: Biofuels will increase threefold in the period 2005-2030, levelling off after 2020.
Despite varying estimations, the shared notion is that biofuel supply, demand and trade will increase significantly in the next decade. The large unknown in the biofuels industry is “second generation” biofuel technology (based on biomass waste): if this technology does not become widely available, competition between biofuels and food production for land will become a serious issue.62 The critical question related to the expansion of biofuels, greenhouse gas (GHG) emissions and food security is which land category will be converted to biofuel production (bare arable land, cultivated land, wetlands or forests). Though they might not contribute to price shocks as in 2008, the underlying long-term trend in rapidly increasing global demand for (bio) energy is expected to be the primary source of pressure on food production and prices.63
2FORECASTS ON FUTURE DEMAND FOR FOOD, FIBER AND FODDER
56FAO 2011b and 2012b, 57UNDESA 2012, 58FAO 2011b and 2012b, 59IEA 2013, 60OECD-FAO 2011, 61Bruinsma and Alexandratos 2012, 62OECD 2008, 63Trostle 2008

9Water, food and energy nexus challenges
Commercial forestry represents a third category of agricultural products. Global forest area accounted for 4 billion hectares (30% of total land area) in 2010.64 Close to half of this area was designated for the production of wood and non-wood forest products. This proportion is expected to change.
Increasing demand for wood, notably from paper and pulp industries and from the energy sector to supply biofuels, are expected to put pressure on forests and biodiversity.65 Sawn wood (timber/lumber) production is projected to increase by 45% by 2030 relative to 2005. For wood panels, the increase is 120%. The production of paper and paperboard is estimated to increase by 100%, and the production of roundwood is estimated to increase by 47%.66
Following projections of increasing demand for commercial forest products, the OECD Environmental Outlook estimates that natural forests will decrease by 13% worldwide in the period 2005 to 2030. In 2010, forest covered about 4 billion hectares.67 The average annual net loss of forest has been about 5.2 million hectares in the past 10 years.68 The greatest conversion will occur in South Asia and Africa.
In the period 2001-2010, forests were lost or modified to other uses (incl. production forests) at an average rate of 13 million hectares/year. Large-scale planting of forests in this period resulted in a net reduction of 5.2 million hectares/year.69 The rate of change is expected to increase. Part of this is due to uncontrolled forest operations and the expansion of agriculture. It is estimated that 8-10% of global industrial roundwood production comes from illegal logging (in 2005 approximately 160 million m3/year).
Although an annual loss of 0.2% in the period 1990-2010 is being seen in primary forests and forests mainly designated for production,70 plantation forests are increasing. China, India and Vietnam have established targets for large-scale forest planting and also developed incentive programs for smallholders to plant more trees. China plans to increase its planted forest area by 50 million hectares by 2020. Vietnam achieved its target of restoring its forest cover by 43% by 2010.71
64FAO 2011c, 65OECD 2008; FAO 2009, 66FAO 2009, 67FAO 2011c and 2012a, 68FAO 2011c and 2012a, 69FAO 2011c, 70FAO 2011a, 71Ibid.
2 FORECASTS ON FUTURE DEMAND FOR FOOD, FIBER AND FODDER

10Water, food and energy nexus challenges
The increased production of food, fodder and fiber will put heavy demand on land use – either through extensification (bringing new land under cultivation) or intensification (increasing the productivity of existing areas). The expansion of the arable land is important, but the intensification of agriculture (higher yields and cropping intensities) is expected to be the dominant scenario to feed and supply the world. The major contribution to increased food demand is to come from yield increases (80%), with increased cropping intensity contributing 10% and land expansion another 10%.72 By reducing food losses and waste, which currently account for 32% of global food production, a consequent amount of land could be turned over to other uses rather than to produce food that never reaches the fork.
At present, about 12% (more than 1.5 billion hectares) of the globe’s land surface (13.4 billion hectares) is cropped (arable land and land under permanent crops). This area represents 36% of the land estimated to be to some degree suitable for crop production. The remaining 2.7 billion hectares with crop production potential (of which the majority is in developing countries) suggests that there is scope for further expansion of agricultural land. However, realistically, little increase is possible because of the unfavorable conditions of this remaining potential73 as well as socio-economic and technological limitations.74 Estimates suggest that a 4% increase is realistic, almost entirely in sub-Saharan Africa and Latin America, albeit often at the expense of deforestation.75 Arable land would expand by 70 million hectares (less than 5%), the result of an expansion of about 120 million hectares in developing countries and a decline of 50 million hectares in developed countries.
The deterioration of land productivity can occur in many ways: loss of organic matter, physical and chemical degradation of the soil leading to loss of nutrients, structure and fertility. Globally only half of the nutrients that crops take up from the soil are replaced. Estimates put the annual global cost of land degradation at some US$ 40 billion.76 Bai et al.77 identify land degradation on 24% of the total land area, mostly in sub-Saharan Africa, South-East Asia and southern China. Cropland makes up more than 20% of the total degraded area, whereas forests, 28% of the globe’s land surface, represent 42% of total degraded area. About 16% of this area, however, shows to be improving: 18% of the improving area is cropland, 23% is forest and 43% is rangeland.
3IMPLICATIONS FOR LAND MANAGEMENT
72FAO 2012b, 73Bruinsma 2011, 74FAO 2012b, 75Bruinsma 2011, 76LADA 2009, 77Bai et al. 2008
11Water, food and energy nexus challenges
Yearly, about 110,000 km3 of rain falls on the Earth’s surface. Through the global water cycle, renewable water sources amount to 42,000 km3/year. Total global blue water (rivers, lakes and groundwater) withdrawals for irrigation are estimated to be 2,711 km3 and global irrigation efficiency is 46%. Current total evaporation from rainfed agriculture is 495,000 km3.78 Yet global averages mask great geographical variability.
Rainfed agriculture is the predominant agricultural system worldwide, at 85% of total cultivated area, and is responsible for 58% of total crop production.79 Agriculture in sub-Saharan Africa and Latin America is mainly rainfed-based. The gap between actual and potential yields is largest in parts of sub-Saharan Africa, which have the potential to double their yields even with low-input farming. Bruinsma80 estimates that rainfed agriculture will expand globally by 2.8% by 2050 (reaching 1.4 billion hectares), with a decrease in developed countries and decreasing its contribution to total crop production to 57%. In order to avoid considerable expansion of rainfed cultivated areas − causing loss of forests and other valuable ecological systems − the productivity of existing rainfed systems needs to increase through improvements in land and (green) water management and input supply.81 Investment costs to upgrade rainfed areas tend to be low compared to irrigated agriculture. In principle, if the gap between the actual and potential yield is bridged by 80%, 85% of projected food demand can be met by 2050.82 A major challenge in rainfed farming is how to introduce accessible technical solutions to improve land and water management and agricultural production without increasing risks of soil and water degradation.
Irrigated agriculture is practiced on 15% of the total cultivated land area and is responsible for 42% of total crop production. Bruinsma83 projects an increase in irrigated area from 240 million hectares in 2005 to 273 million hectares in 2050, contributing to 16% of total cultivated area and 43% of total crop production. The expansion of irrigation will be solely in developing countries. Most of the expansion in irrigated land will be achieved by converting rainfed agriculture into irrigated agriculture. However, irrigation also takes place on arid and hyper-arid (desert) land, which is not suitable for rainfed agriculture. Of the 219 million hectares currently irrigated in developing countries, an estimated 40 million hectares is on arid and hyper-arid land, which could increase to 43 million hectares in 2050.84 Increasing the share of irrigated land would also contribute to greater cropping intensity and yields. A major challenge in irrigated farming is to avoid crop intensification resulting in land and water degradation and to sustainably withdraw water for irrigation in arid regions to secure food security.
About 70% of the total area equipped for irrigation is in Asia, where it accounts for about 39% of the cultivated area. China and India alone account for more than half (56%) of the irrigated area in developing countries, although the overall arable area in China is expected to decrease further. Most of this irrigation is large-scale within major river basins, primarily for paddy rice production. Irrigation is also very important for western Asia, where it accounts for 37% of the cultivated area, of which 46% is based on groundwater. Groundwater withdrawals are intensifying, with key aquifers depleting as withdrawals have proved to be almost impossible to regulate.
4PERSPECTIVES ON WATER USE
78CA 2007; FAO 2011b and 2011c, 79Bruinsma 2011, 80Ibid. 81FAO 2011c, 82CA 2007; Fraiture et al. 2009, 83Bruinsma 2011, 84FAO 2011b,

12Water, food and energy nexus challenges
A further risk is salinization of groundwater resources. This can occur when saline irrigation water percolates to an aquifer, but also by seawater intrusion in fresh groundwater layers in coastal zones and small islands due to intensive pumping of groundwater. Some key food-producing regions are dependent on groundwater, like Punjab and the North China Plain for grain production. The contribution of groundwater to irrigation in India and the United States (US) is respectively 64% and 59%. These countries are among the largest food producers, and deterioration or depletion of aquifers could cause risks for global food security.85
Drainage systems are used to avoid water logging and to manage high groundwater tables. In semi-arid and arid regions, drainage of irrigated lands helps reduce the risk of salinization. GWSP86 estimates that about 166.7 million hectares of agricultural land is equipped with drainage facilities. On-farm water logging and salinization are the main problems caused by improper irrigation and drainage management. In some cases, drainage water can be reused by creating loops in the water delivery system or by farmers pumping directly from drains. The use of this “unconventional” water poses agricultural and environmental risks due to salinization and soil and water quality degradation. Actions to prevent salinization are needed (including risk assessments and monitoring). Desalinization of salty and brackish waters is still uneconomic due to high energy costs, with the exception of high-value horticulture.87
Agricultural water use will face increased competition from other users. By 2050, competing water uses are expected to more than double, approaching more than 900 km3 per year; developing countries are projected to contribute most to the increase in demand, while total domestic and industrial water consumption in developed countries is expected to increase only moderately. Globally, domestic water demand is projected to increase from 161 km3 in 2005 to 234 km3 by 2030 and 286 km3 by 2050. For industrial demand, increases are projected from 176 km3 in 2005 to 363 km3 by 2020 and 639 km3 by 2050.88 Globally, this can cause an 18% reduction in water availability for agriculture by 2050.89
The global population is expected to rise from 6.9 billion in 2010 to 9.6 billion by 2050. Urban populations are projected to see the fastest growth, rising from 49% of the total population today to 70% of the total in 2050.90 As urbanization grows, more urban wastewater (municipal and industrial) will be available. Wastewater has the advantage of being nutrient rich and available close to markets, but often poses a threat to human health and the environment. However, currently 90% of wastewater is discharged untreated into the environment or directly and indirectly (diluted with other water sources) used in informal urban agricultural systems.
85Siebert et al. 2010; FAO 2011a and 2011b 86GWSP 2008, 87FAO 2011c, 88Ringler et al. 2011a, 89Strzepek and Boehlert 2010, 90FAO 2012b
4 PERSPECTIVES ON WATER USE

13Water, food and energy nexus challenges
Climate change will have multiple effects on crop and livestock production through the combination of diverse climatic and physical events such as rising temperatures and CO2 concentrations, changing weather patterns and the increased frequency of extreme precipitation or dry spells. Regardless of greenhouse gas emission reductions, due to the build-up of emissions that already have occurred91 elevated CO2 has some effects on crop phenology, but stages of plant development are primarily regulated by temperature, time and photoperiod. IFPRI92 concludes that agriculture and human well-being will be negatively affected by climate change, especially in the tropical developing world. Therefore, agricultural productivity investments are needed (projection of US$ 7.1-7.3 billion) to increase food security enough to offset the negative impacts of climate change on health and well-being.
Many crops do show positive responses to higher CO2 concentrations93 and low levels of warming, but this holds mainly for temperate climate zones. Higher temperatures (more than 3°C) affect growth and yields negatively: insufficient winter chilling hours for fruit and nut trees reduce their performance. Weeds, (insect) pests and diseases often benefit from warming and higher CO2 concentrations.94 The increased frequency of extreme weather events (heavy downpours, droughts) is likely to reduce crop yields as water excesses and deficits have negative impacts on plant growth. The quality of pastures and rangelands declines with higher CO2 concentrations as it affects the plant nitrogen and protein contents,95 reducing the quality of livestock feed. Climate change-induced higher temperatures, diseases and weather extremes are expected to reduce livestock productivity.96
Changes in atmospheric CO2 will have a great influence on plant physiology. Under higher CO2, most plants show higher rates of photosynthesis, increased growth, decreased water use (due to decreases in stomatal conduction causing lower transpiration, if temperature rise is not included), and decreased nitrogen and protein concentrations in plant tissue (affecting the nutritious value).97
Temperature increases of up to approximately 3°C will likely increase agricultural production; increases beyond 3°C will likely decrease agricultural production.98 Increased temperatures will extend cropping seasons and increase yields in the near term (when temperature increases are still within the 3°C limit) in more temperate regions.99 It shortens the growth stages of the crop cycle (which might allow multiple growing seasons and thus higher annual yields), but shorter growth stages also reduce the seed filling stage, which implies lower yields per growing season. In wheat, high temperatures reduce grain yields as a reduced number of grains are formed because of a shorter grain growth time (60 to 36 days when temperature is increased from 15/10°C day/night to 21/15°C day/night.100 However, extended cropping seasons might limit these near-term benefits as longer cropping seasons will put additional pressure on natural resources and require additional agricultural inputs (like fertilizers). Earlier or later planting of crops, due to changing rainfall patterns, for instance, can also affect the phenological timing of crops by decreasing the duration of grain-filling or increasing vegetative growth (stems and leaves rather than fruits or grains), for example.101
91CCSP 2008, 92IFPRI 2009, 93FAO 1996, 94USGCRP 2009, 95FAO 1996; Taub 2010, 96USGCRP 2009, 97Taub 2010, 98Schneider et al. 2007, 99CalCAN 2011, 100Masters, Baker and Flood 2010, 101FAO 1996
5IMPACT OF CLIMATE CHANGE ON AGRICULTURE
14Water, food and energy nexus challenges
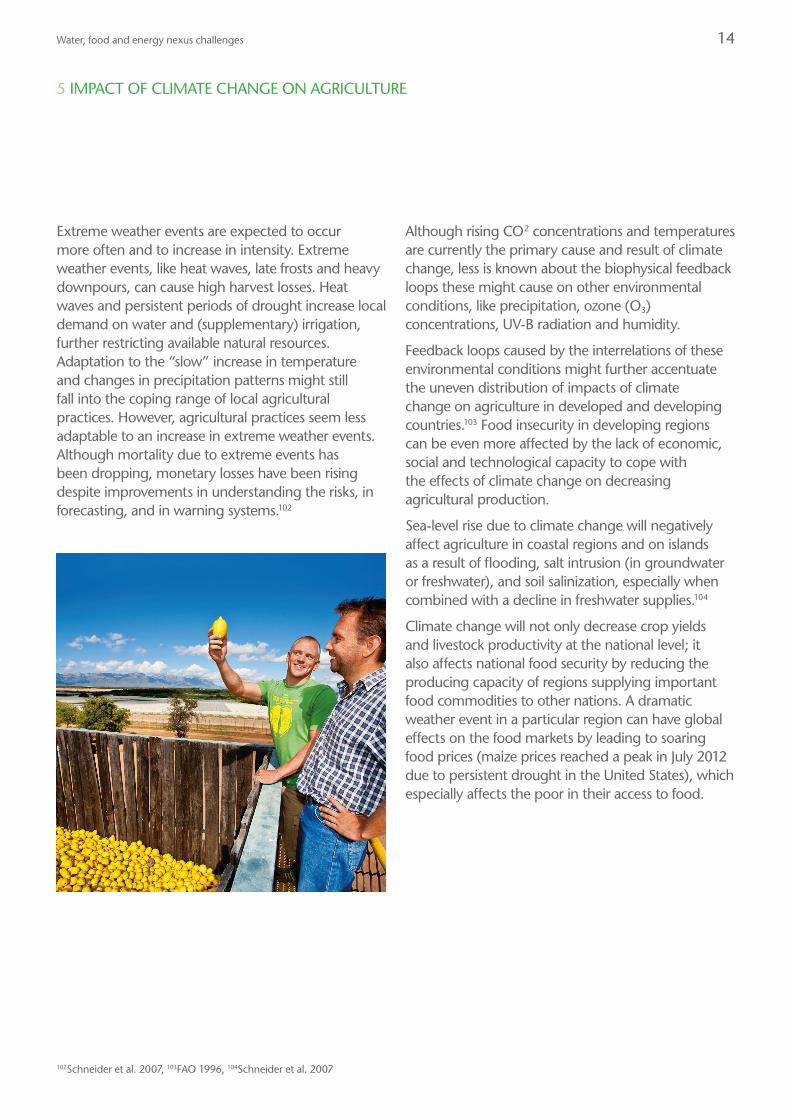
Extreme weather events are expected to occur more often and to increase in intensity. Extreme weather events, like heat waves, late frosts and heavy downpours, can cause high harvest losses. Heat waves and persistent periods of drought increase local demand on water and (supplementary) irrigation, further restricting available natural resources. Adaptation to the “slow” increase in temperature and changes in precipitation patterns might still fall into the coping range of local agricultural practices. However, agricultural practices seem less adaptable to an increase in extreme weather events. Although mortality due to extreme events has been dropping, monetary losses have been rising despite improvements in understanding the risks, in forecasting, and in warning systems.102
Although rising CO2 concentrations and temperatures are currently the primary cause and result of climate change, less is known about the biophysical feedback loops these might cause on other environmental conditions, like precipitation, ozone (O3) concentrations, UV-B radiation and humidity.
Feedback loops caused by the interrelations of these environmental conditions might further accentuate the uneven distribution of impacts of climate change on agriculture in developed and developing countries.103 Food insecurity in developing regions can be even more affected by the lack of economic, social and technological capacity to cope with the effects of climate change on decreasing agricultural production.
Sea-level rise due to climate change will negatively affect agriculture in coastal regions and on islands as a result of flooding, salt intrusion (in groundwater or freshwater), and soil salinization, especially when combined with a decline in freshwater supplies.104
Climate change will not only decrease crop yields and livestock productivity at the national level; it also affects national food security by reducing the producing capacity of regions supplying important food commodities to other nations. A dramatic weather event in a particular region can have global effects on the food markets by leading to soaring food prices (maize prices reached a peak in July 2012 due to persistent drought in the United States), which especially affects the poor in their access to food.
102Schneider et al. 2007, 103FAO 1996, 104Schneider et al. 2007
5 IMPACT OF CLIMATE CHANGE ON AGRICULTURE

15Water, food and energy nexus challenges
Increasing food production is impossible without extra energy inputs. Energy is consumed in agricultural production for land preparation, the use of fertilizer and other agri-inputs and for transport. Energy consumption varies by crop, agro-climatic zone and production system.
The International Fertilizer Association estimates that globally 1.2% of all energy is used for the production of fertilizer only.105 This is in line with the analysis for all energy inputs in agricultural production: in OECD countries these make up 3-5% of the total energy inputs. In developing countries the rate is between 4-8%. Moreover, the additional use of energy in food processing doubles this figure – bringing it to 8-12%. Though not the largest user, agriculture is a substantial energy consumer globally.106 Including, however, the whole food chain, the food sector currently accounts for around 30% of the world’s total energy consumption.107
Energy costs are also an import cost factor in agriculture. This has two consequences:
1. On agricultural prices: agricultural price increases will be triggered by higher energy prices. The price elasticity of cereals, edible oils and other food is estimated respectively at 0.28, 0.29 and 0.22 – meaning a 100% increase in energy price translates, in the case of cereals, to a 28% price increase.108 Fertilizers show the largest elasticity at 0.55.109 The higher the energy input in the production processes the higher the price elasticity.
2. On public finance: agriculture receives considerable subsidies – in the shape of subsidized fertilizer (China, India, some African countries), free or below market cost energy supplies for agricultural water pumping (India, Pakistan, Yemen) or energy supply to greenhouses (Europe).
Hence, growing demand for food and other agricultural products will have an important impact on energy demand. Extensive work on energy requirements in agriculture has been done by Pimentel110 and Pimentel and Pimentel,111 documenting energy requirements in farm production. In this work a number of energy-crop positions are given, describing energy requirements in crop production, energy output/input ratios, and energy consumption over different farm activities. The energy output/input ratios are of particular interest as they describe the energy productivity in food – comparing the energy used in growing the crop (minus solar energy and earth warmth) and the energy produced (in caloric value of the biomass). From the different energy-crop positions, a number of factors stand out:
› Energy productivity is low, sometimes even below zero, for horticultural crops. It is median for the main staple crops (rice, wheat, corn). Energy output to input is particularly high for crops such as sugarcane and cassava.
› Within crops, energy productivity varies – there is a particularly large difference between extensive (low yield per hectare) and intensive production (high yield per hectare). In general, energy productivity decreases when farming systems intensify: for instance for corn it is 0.76; for rice 0.56; for wheat 0.72. As crop production becomes more intensive, the use of external energy sources increases – because of mechanization, pumping and the increased use of agri-inputs. This is highly relevant as 90% of the increase in food production by 2050 is to come from intensification.112
6ENERGY REQUIREMENTS IN AGRICULTURE
105Kongshaug 1998, 106OECD-FAO 2011, 107FAO 2011a, 108Mensbrugghe et al. 2009, 109Baffes 2009, 110Pimentel 2009, 111Pimentel and Pimentel 2008, 112FAO 2012b

16Water, food and energy nexus challenges
› The same pattern of higher yields and lower energy productivity is true for intensive versus extensive livestock keeping: Mora Delgado et al.113 estimate that energy productivity for milk produced under intensive livestock keeping in Costa Rica is 2.3 times lower than under extensive traditional systems, and for meat this is 2.1 times lower. On the other hand, yields in intensive livestock farms were relatively higher, 3.8 and 0.4 for milk and meat, respectively.
› In intensive agriculture there is a larger dependence on high-kinetic value energy sources, i.e. fossil fuels for fertilizer production, pumping water and operating farm machinery. The energy sources are not easily substituted with low-kinetic value energy sources.114
Under the “business as usual” projections above, energy requirements for agriculture are set to increase by 84%115 – and maybe more if additional increments due to increased pumping costs and fertilizer use (to counter degradation) are taken into account.
113Mora Delgado et al. 2004, 114With the exception of replacing cooling and heating – for instance in cold stores or in greenhouses. 115Based on required increase in production (60%); the part to be taken care of by intensification (90%) multiplied by the loss in energy productivity (0.72) and added to this the energy neutral effect of extensification (10%).
6 ENERGY REQUIREMENTS IN AGRICULTURE

17Water, food and energy nexus challenges
7IMPACT ON GREENHOUSE GAS EMISSIONS
Agriculture is a major contributor to greenhouse gases, accounting for 14% of global greenhouse gas emissions in 2004.116 Methane and nitrogen emitted by agriculture have a high global warming potential. The main sources are:
› Methane emissions from livestock;
› Methane emission from inundated rice cultivation systems;
› Nitrogen fertilizer applied to the fields under soil compaction (which causes anaerobic conditions and thus increases nitrogen oxide emissions);
› Nitrogen from livestock feeding.
Under business as usual, methane emissions from agriculture are expected to increase 10% in the period from 2010 to 2025 and N2O is predicted to increase 14%.
Meat production has long been associated with CO2 emissions and food waste. The FAO report Livestock’s long shadow117 shows that agriculture (and especially meat production) emits more CO2 equivalents than the transport sector. Korthals118 argues for the consideration of at least the relation between control of climate change gas emissions in animal husbandry and animal welfare. The reduction of emissions from animal husbandry currently still requires increasing the intensity of the system, which reduces animal welfare. Fairlie119 addresses the issue from a different perspective and asks the question of how human-animal relationships can contribute to sustainability and animal welfare. Fairlie relates to the debate of taking proper food away from the poor and feeding it to animals, such as wheat, soya and maize. Pigs, for example, are perfectly capable of converting food waste into pork. At the same time, people are not able to digest grasses like cows.120 Fairlie concludes that half of meat supplies would be retained if animals were no longer fed grains, leaving people to benefit from the higher nutritional value meat from grass-fed animals. On top of this, related to global food waste, reducing meat production to zero means the impossibility of using food waste for animal fodder.121 Only when grains are not used for animal feed can meat production have a positive impact on sustainable development and food security.122
116OECD 2009, 117Steinfeld et al. 2006, 118Korthals 2012, 119Fairlie 2010, 120Fairlie 2010; Korthals 2012; Stuart 2009, 121Stuart 2009, 122Fairlie 2010

18Water, food and energy nexus challenges
8AGRICULTURE AND WATER QUALITY
Good water quality is essential for the sustainable development of societies: to support human health, ecosystem services, and agricultural and industrial production. At the same time, agricultural production is a major cause of water pollution. Pollution – causing eutrophication, acidification, toxic contamination and micro-pollutants (e.g. medicines, biocide residues, cleaning agents) – places stress on water resource availability and increases water scarcity. It increases the water purification costs of potable water and reduces economic benefits in agricultural and industrial production.
It is already known that the Millennium Development Goal on access to basic sanitation will not be met in 2015,123 and by 2050 almost 1.4 billion people are projected to be without basic sanitation services.124 Within most OECD countries, continued efficiency improvements in agricultural fertilization management and wastewater treatment are expected to stabilize and restore surface water quality by 2050.125 In the developing world, however, nutrient flows from agriculture and untreated sewage are expected to increase in the coming decades, further deteriorating water and soil. Water quality deterioration is expected as wastewater collection is rarely systematically connected to wastewater treatment. Further water quality deterioration will have severe consequences on human health and the environment (with consequent negative economic externalities, for example on fisheries).
Agriculture is a major cause of environmental (water) pollution and the build-up of nitrogen and phosphorus in water ecosystems. This build up can cause locally catastrophic shifts due to eutrophication,126 both in freshwater and marine ecosystems. The manufacturing of fertilizers and the cultivation of leguminous crops convert about 120 million tonnes of atmospheric nitrogen per year into reactive forms.127 Much of this reactive nitrogen is polluting water bodies and accumulates in soil systems. Significant parts also react with oxygen, creating nitrous oxide (N2O), the most important non-CO2 greenhouse gas, and thus contributing directly to the increase in climate change-induced global warming. Rockström et al.128 argue that atmospheric nitrogen fixation must be reduced globally to a quarter of its current rate, to 35 million tonnes per year, in order to keep within sustainable operating boundaries.
Then there is phosphorus, a non-renewable fossil mineral that is mined from rocks (mostly in the form of phosphate as a result of long-term geological processes) and used as a nutrient in soil. About 20 million tonnes of phosphorus is mined every year.129 Current global phosphorus reserves are expected to be depleted in 50-100 years.130 Phosphate rock reserves are distributed unevenly over the globe and are in the control of a few countries,mainly Morocco, China and the US.131
123MDG Target 7.C: Halve, by 2015, the proportion of the population without sustainable access to safe drinking water and basic sanitation. Access to improved sanitation facilities increased from 36% in 1990 to 56% in 2010 in the developing regions as a whole. The greatest progress was achieved in eastern and southern Asia, sub-Saharan Africa is lagging behind. 124OECD 2012, 125Ibid. 126Scheffer et al. 2001, 127Rockström et al. 2009, 128Ibid. 129Rockström et al. 2009, 130Cordell et al. 2010, 131Jasinsky 2006

19Water, food and energy nexus challenges
Phosphate is already subject to international policies, and an increase in scarcity and demand will likely increase the importance of phosphorus in global policy. China, for example, is drastically reducing exports to secure domestic supplies, and the US has less than 30 years of supplies left. Europe and India are totally dependent on imports.132
Phosphorus demand is projected to increase in the coming decades, and the expected global peak in phosphorus production is predicted to occur around 2030. Although the timing is disputed, it is widely acknowledged within the fertilizer industry that the quality of the remaining phosphorus reserves is decreasing and mining and production costs are increasing.133
Historical geographical analyses show that large ocean anoxic events (combined with mass marine life extinctions) occurred when phosphorus thresholds were crossed. Around 8.5-9.5 million tonnes of phosphorus finds its way into the oceans via untreated wastewater and agricultural runoff.134 Rockström et al.135 argue that – despite the large uncertainties involved– no more than 11 million tonnes of phosphorus should be allowed to flow into the oceans per year to safely move away from the risk of ocean anoxic events (knowing that current levels are already passing critical local thresholds for many estuaries and freshwater systems).
The current trend is that pollution is increasing and rivers are drying up because of increased agricultural production and urbanization processes. This again affects land and water resources for agriculture, fisheries (important to many livelihoods of the rural poor), and for human health.136
Although modern agriculture is a major cause of water pollution, at the same time agriculture can be regarded as a solution to closing nutrient cycles (especially nitrogen and phosphorus). Jiménez et al.137 estimate that globally at least 4 to 6 million hectares of land are irrigated with either untreated wastewater or polluted water. The WHO138 estimates this to be as much as 20 million hectares, almost 8% of the global irrigated area.139 It is estimated that in four out of five cities in the developing world, wastewater is used for irrigation.140 Although the use of wastewater in agriculture is accompanied by human and environmental health risks due to chemical compounds from industries and pathogens from urban wastewater, it also has valuable advantages. The most notable advantage of wastewater reuse is the recovery of its nutrient content (reducing the outflow of nutrients towards the ocean). Wastewater irrigation recycles organic matter, and urban wastewater contains a larger diversity of nutrients than any commercial fertilizer can provide. Reclaiming urban wastewater can reduce fertilizer demand significantly.141 When wastewater collection and treatment are not systematically connected through sewerage infrastructure and administrative, management and governance structures, private undertakings (the private sector and sometimes the informal sector) play an important role in collection, processing and selling reclaimed waste products to end users (like treated sludge).
132Rosmarin 2004, 133Cordell et al. 2010, 134Rockström et al. 2009, 135Ibid. 136CA 2007, 137Jiménez et al. 2010, 138WHO 2006, 139Bruinsma 2011, 140Raschid-Sally and Jayakody 2008, 141Evers et al. 2010
8 AGRICULTURE AND WATER QUALITY
20Water, food and energy nexus challenges
Another impact on agricultural water quality is caused by salinization processes. Salinity limits the productivity of agricultural crops, particularly in arid and semi-arid climatic zones, and is often irreversible.142 In many cases, irrigation results in the accumulation of salts in the root zones of arable lands. Salinization may materialize when irrigation releases salts already present in the soil, or when irrigation water or mineral fertilization brings new salts to the land.143 Worldwide, FAO144 estimates that 34 million hectares (11% of irrigated area) are affected by some level of salinization, and an additional 60-80 million hectares are to some extent also water logged. When saline irrigation or drainage water percolates to deeper aquifers, it can also contaminate groundwater resources. In addition, continuous sea level rise causes salt intrusion in coastal lowlands and small islands, which is accelerated by excessive pumping of fresh groundwater. Salinized groundwater reservoirs lose their buffer capacity, which is especially necessary in the face of increased competition with cities and industries for good-quality water. The key solution is active management of groundwater aquifers by reducing extraction and investing in modernizing existing irrigation systems, especially in reducing leaching and improving drainage.145 Saline water intrusion barriers can be created by the artificial injection of freshwater, but this is costly and requires a high degree of management and control.146 Except for intensive horticulture (flowers and high-value cash crops in greenhouses), desalination is still uneconomic due to high energy costs. However, due to declining costs and the increasing price of surface and groundwater, it is becoming a more and more competitive option.147
At the same time, the need to increase food production for a growing global population demands investments in the development of crops with enhanced salt tolerance. In arid regions, the irrigation of moderately salt tolerant crops is feasible.148 In coastal zones, saline agriculture could be combined with fish and shrimp aquaculture. Integrated agriculture-aquaculture has a strong history, especially in Asia, and also provides opportunities for improved nutrient management, especially for small-scale agriculture.149
Water pollution prevention from agriculture, industries and urban settlements will be a major challenge for the coming decades in order to safeguard the environmental services of ecosystems for human development. In the European Union (EU) alone several hundred directives on environmental policy have been produced. It is a challenge for policy-makers (and law enforcers) to balance the short- and long-term interests of industries, agriculture, ecosystems, and society as a whole.
142Rozema and Flowers 2008, 143FAO 2011c, 144FAO 2011b, 145CA 2007, 146FAO 2011c, 147FAO 2011c, 148Pitman and Läuchli 2002, 149Prein 2002
8 AGRICULTURE AND WATER QUALITY

21Water, food and energy nexus challenges
9IMPACTS ON MARKETS
Crude oil prices pass through to overall non-energy commodity prices.150 Fertilizer prices have the highest pass-through rates (elasticity of 0.55) followed by food (0.27). The implication is that if crude oil prices remain high or increase, which is expected, fertilizer and food prices will also remain high and price peaks will last much longer.151
The rise in food commodity prices is especially a burden for the poor in developing countries, who spend roughly half of their income on food. The commodity price peak between 2006 and 2008 was fuelled by many interrelated factors: biofuels, low past investments in extractive commodities, a weak US dollar, fiscal expansion, lax monetary policies, commodity investment fund activities, in combination with adverse weather conditions. Two aspects in the 2008 food price peak are especially recognized as crucial: biofuel production152 and the “financialization of commodities”.153 The large increase in biofuel production from food grains and oilseeds in the US and EU had a big impact on the rise in food prices.154 EU and US policies provided strong incentives for the growth in biofuel production. The negative impacts of this production increase on food prices poses questions about the suitability of these subsidies.155 The financialization of commodities, or the use of commodities by financial investors, has also been largely responsible for the 2008 food price peak.156 The latter poses questions about the role of investors in global food security.
The effects of climate change on commodity markets might be quite significant. Rising temperatures and changing precipitation may strongly affect regional agricultural production and put extra pressure on global food markets.
The globalization of trade in (agricultural) goods at the same time increases the trade of virtual water.157 The concepts of virtual water and water footprints158 highlight the relationship between trade globalization and global water use. The concepts have been developed primarily for strategic decision-making for water allocation in water scarce regions. Virtual water trade refers to the idea that when agricultural (and other) goods and services are traded, so is its embedded virtual water (the water that is needed for its production, but not contained in the product159).
When a country imports wheat instead of producing it, it saves domestic water. If an importing country is water-scarce, it can allocate its “saved” water for other uses. If the exporting country is water-scarce, the virtual water is exported because it is not (or at least not fully) available for other domestic uses. Increased local water scarcity would therefore increase global food trade.
The concept is, however, challenged in practice as it assumes that all sources of water (soil moisture, rainfall, groundwater, surface water in large-scale irrigation systems) are of the same value and can be reallocated to other uses (implicitly assuming that these other uses are more sustainable or economically more valuable). The concept also does not take the reuse of (runoff) water into account from higher value uses to lower value uses. The concepts of virtual water and water footprint offer a valuable tool for the awareness of the relationship between local consumption and global water use. However, in practice many politicians focus their rhetoric and policies on national self-sufficiency rather than on creating dependencies on foreign (food) producers to save local water resources. Also, one can hardly reallocate agricultural water to other uses when local people very much depend on it for their self-subsistence.
150Baffes 2007 and 2009, 151Ibid. 152Mitchell 2008, 153Baffes and Haniotis 2010, 154Mitchell 2008, 155Ibid. 156 Baffes and Haniotis 2010, 157Allan 2011, 158Hoekstra and Hung 2002; Chapagain and Hoekstra 2004, 159For example, on average it takes 140 liters of water to produce one cup of coffee.
22Water, food and energy nexus challenges
REFERENCES
Allan, J.A., 2011. Virtual Water. Tackling the threat to our planet’s most precious resource. I.B. Tauris& Co. Ltd, London, UK.
Baffes, J. 2007. Oil spills on other commodities. World Bank Policy Research Working Paper no.4333. World Bank, Washington, DC.
Baffes, J. 2009. More on the energy/non-energy commodity price link. World Bank Policy Research Working Paper no. 4982. World Bank, Washington, DC.
Baffes, J., T. Haniotis, 2010. Placing the 2006/08 commodity price boom into perspective. World Bank Policy Research Working Paper no. 5371. World Bank, Washington, DC.
Bai, Z.G., D.L. Dent, L. Olsson, M.E. Schaepman, 2008. Global Assessment of Land Degradation and Improvement. 1. Identification by Remote Sensing. Report 2008/01. ISRIC – World Soil Information, Wageningen, The Netherlands.
Bruinsma, J., 2011. “The resources outlook: by how much do land, water and crop yields need to increase by 2050?” In P. Conforti (eds). Looking ahead in world food and agriculture: perspective to 2050. Food and Agriculture Organization of the United Nations, Rome, Italy.
Bruinsma, J. and N. Alexandratos, 2012. World agriculture towards 2030/2050: The 2012 revision (Working Paper No. 12-03). Rome: FAO Agricultural Development Economics Division (ESA).
CA (Comprehensive Assessment of Water Management in Agriculture), 2007. Water for Food, Water for Life: A Comprehensive Assessment of Water Management in Agriculture. Earthscan, London, UK/International Water Management Institute, Colombo, Sri Lanka.
CalCAN (California Climate & Agricultural Network), 2011. Climate change impacts on agriculture. CalCAN, Sebastopol, CA. Available online at http://calclimateag.org/wpcontent/uploads/2011/09/Impacts-fact-sheet.pdf.
CCSP (US Climate Change Science Program), 2008. The Effects of Climate Change on Agriculture, Land Resources, Water Resources, and Biodiversity in the United States. US Climate Change Science Program and the Subcommittee on Global Change Research.
Chapagain, A.K., A.Y. Hoekstra, 2004. Water footprints of nations. Volume 1: Main Report. Value of Water Research Report Series No.16 Volume 2. UNESCO-IHE, Delft.
CIA (Central Intelligence Agency), 2013. The World Factbook. Central Intelligence Agency. Viewed online at https://www.cia.gov/library/publications/the-world-factbook/
Cordell, D., J.O. Drangert, S. White, 2010. The story of phosphorus: Global food security and food for thought. Global Environmental Change 19(2), 292-305.
EC (European Commission). 2007. World Energy Technology Outlook - 2050 - WETO H2. EUR 22038. Luxembourg: Office for Official Publications of the European Communities.
Evers, J.G., F.P. Huibers, B.J.M. van Vliet, 2010. “Institutional aspects of integrating irrigation into urban wastewater management: The case of Hanoi, Vietnam”. Irrigation and Drainage 59, 336-344.
Fairlie, S., 2010. Meat: a benign extravagance. Permanent Publications, Hampshire, UK.
FAO (Food and Agriculture Organization of the United Nations), 1996. Global Climate Change and Agricultural Production: Direct and Indirect Effects of Changing Hydrological, Pedological and Plant Physiological Processes. Bazzaz, F., W. Sombroek (eds). Food and Agriculture Organization of the United Nations, Rome, Italy.
FAO (Food and Agriculture Organization of the United Nations), 2008. Climate Change. Implications for Food Safety. Food and Agriculture Organization of the United Nations, Rome, Italy.
FAO (Food and Agriculture Organization of the United Nations), 2009. State of the World’s Forests 2009. Food and Agriculture Organization of the United Nations, Rome, Italy.
FAO (Food and Agriculture Organization of the United Nations), 2011a. Energy-Smart Food for People and Climate. Issue Paper. Food and Agriculture Organization of the United Nations, Rome, Italy.
FAO (Food and Agriculture Organization of the United Nations), 2011b. Looking Ahead in World Food and Agriculture: Perspective to 2050. Conforti, P. (ed.). Food and Agriculture Organization of the United Nations, Rome, Italy.
FAO (Food and Agriculture Organization of the United Nations), 2011c. The State of the World’s Land and Water Resources for Food and Agriculture (SOLAW) – Managing systems at risk. Earthscan, London/Food and Agriculture Organization of the United Nations, Rome, Italy.
FAO (Food and Agriculture Organization of the United Nations), 2012a. State of the World’s Forests 2012. Food and Agriculture Organization of the United Nations, Rome, Italy.
FAO (Food and Agriculture Organization of the United Nations), 2012b. World Agriculture towards 2030/2050: the 2012 Revision. ESA Working Paper No. 12-03. Food and Agriculture Organization of the United Nations, Rome, Italy.
Food and Agricultural Policy Research Institute (FAPRI) and Iowa State University (ISU), 2011. World Agricultural Outlook. Available online at http://www.fapri.iastate.edu/outlook/2011/.
Fraiture, C. de, L. Karlberg, J. Rockström, 2009. “Can rainfed agriculture feed the world? An assessment of potentials and risk”. In Wani, S.P., J. Rockström, T. Oweis (eds). Rainfed agriculture: Unlocking the potential. CAB international, Cambridge, MA.
GBC (Global Biofuel Centre), 2010. Global Biofuels Outlook 2010-2020. Hart Energy Publishing,Houston.
GWSP (Global Water System Project), 2008. “Digital Water Atlas. Map 70: Drained Agricultural Areas (V1.0)”. Available online at http://atlas.gwsp.org.
Hoekstra, A.Y., P.Q. Hung, 2002. Virtual water trade: A quantification of virtual water flows between nations in relation to international crop trade. Value of Water Research Report Series No.11, UNESCO-IHE, Delft.
IEA (International Energy Agency), 2013. World Energy Outlook 2013. IEA, Paris.
IFPRI (International Food Policy Research Institute), 2009. Climate Change. Impact on agriculture and costs of adaptation. IFPRI, Washington DC.
IPCC (Intergovernmental Panel on Climate Change), 2007. Climate Change 2007. Synthesis report. IPCC, Geneva.
23Water, food and energy nexus challenges
Jasinski, S.M., 2006. Phosphate Rock, Statistics and Information. US Geological Survey.
Jiménez, B., P. D. Kone, A. Bahri, L. Raschid-Sally, M. Qadir, 2010. “General wastewater, sludge and excreta use situation”. In Drechsel, P., C.A. Scott, L. Raschid-Sally, M. Redwood, A. Bahri (eds.) Wastewater Irrigation and Health: Assessing and Mitigating Risks In Low-Income Countries. Earthscan, London.
Kongshaug, G., 1998. Energy Consumption and Greenhouse Gas Emissions in Fertilizer Production. International Fertilizer Association. Available online at http://www.fertilizer.org/ifa/HomePage/LIBRARY/Publication-database.html/Energy-Consumption-and-Greenhouse-Gas-Emissions-in-Fertilizer-Production.html
Korthals, M., 2012. “Emotions, Truths and Meanings Regarding Cattle: Should We Eat Meat?” Journal of Agricultural and Environmental Ethics 25(4), 625-629.
LADA (Land Degradation Assessment in Drylands), 2009. Assessing the status, causes and impact of land degradation. Factsheet. Food and Agriculture Organization of the United Nations, Rome. Available online at http://www.fao.org/nr/lada/index.php?option=com_docman&task=cat_view&gid=22&Itemid=157&lang=en.
Masters, G., P. Baker, J. Flood, 2010. Climate Change and Agricultural Commodities. CABI Working Paper 2, 38 pp.
Mensbrugghe, D. van der, I. Osorio Rodarte, A. Burns, J. Baffes, 2009. How to feed the world in 2050: Macroeconomic environment, commodity markets – A longer term outlook. MPRA Paper No. 19061. The World Bank/FAO.
Mitchell, D., 2008. A Note on Rising Food Prices. World Bank Policy Research Working Paper no. 4682. World Bank, Washington, DC.
Mora-Delgado, J., R. Velásquez-Vélez, V.A. Holguín, M.A. Ibrahim, 2004. Energy productivity in livestock farms with and without silvopastoral systems in the tropics of Costa Rica. Serie Técnica. Reuniones Técnicas no. 9. Semana Científica. VI. Memorias Turrialba CR 11-12 Mar., 2004., 136-137. Turrialba CATIE CR.
OECD (Organisation for Economic Co-operation and Development), 2008. OECD Environmental Outlook to 2030. OECD, Paris.
OECD (Organisation for Economic Co-operation and Development), 2009. Climate Change and Agriculture: Impacts, Adaptation, Mitigation and Options for the OECD. OECD, Paris.
OECD (Organisation for Economic Co-operation and Development), 2012. Environmental Outlook to 2050. OECD, Paris.
OECD-FAO (Organisation for Economic Co-operation and Development and Food and Agriculture Organization of the United Nations), 2011. OECD-FAO Agricultural Outlook 2011-2020. Organisation for Economic Cooperation and Development, Paris, France/Food and Agriculture Organization of the United Nations, Rome, Italy. Available online at http://dx.doi.org/10.1787/agr_outlook-2011-en.
PBL (Planbureau voor de Leefomgeving), 2009. Milieubalans 2009. Bilthoven: Planbureau voor de Leefomgeving. Available online at http://www.pbl.nl/nl/publicaties/2009/milieubalans/.
Pimentel, D., 2009. Energy Inputs in Food Crop Production in Developing and Developed Nations. Energies 2, 1-24.
Pimentel, D., M. H. Pimentel, 2008. Food, Energy, and Society. 3rd Edition. CRC Press, New York, US.
Pitman, M. G., A. Läuchli, 2002. “Global impact of salinity and agricultural ecosystems”. In Läuchli, A.,U. Lüttge (eds). Salinity: environment–plants–molecules. Kluwer Academic Publishers, Dordrecht, The Netherlands, pp. 3-20.
Prein, M., 2002. “Integration of aquaculture into crop–animal systems in Asia”. Agricultural systems 71(1), 127-146.
Raschid-Sally, L., P. Jayakody, 2008. “Drivers and Characteristics of Waste water Agriculture in Developing Countries – Results from a Global Assessment”. In Comprehensive Assessment of Water Management in Agriculture. International Water Management Institute, Colombo, Sri Lanka.
Ravindranath, N.H., R. Manuvie, J. Fargione, J.G. Canadell, G. Berndes, J. Woods, H. Watson, J. Sathaye, 2008. “Greenhouse gas implications of land use and land conversion to biofuel crops”. SCOPE Biofuel Report Chapter 4. Available online at http://www.globalbioenergy.org/uploads/media/0810_Ravindranath_et_al_-_GHG_implications_of_land_use_and_land_conversion_to_biofuel_crops.pdf.
Ringler, C., T. Zhu, S. Gruber, R. Treguer, A. Laurent, L. Addams, N. Cenacchi, T. Sulser, 2011a. Sustaining growth via water productivity: Outlook to 2030/2050. IFPRI, Washington DC.
Ringler, C., Z. Karelina, R. Pandya-Lorch, 2011b. Emerging Country Strategies for Improving Food Security: Linkages and Trade-Offs For Water and Energy Security. Thematic Background Paper for International Food Policy Research Institute (IFPRI) Hot Topic Session. Presented at the Bonn 2011 Conference: The Water, Energy, and Food Security Nexus, November 17, 2011.
Rockström, J., W. Steffen, K. Noone, Å. Persson, F.S. Chapin, E.F. Lambin, et al., 2009. “A safe operating space for humanity”. Nature 461(7263), 472-475.
Rosmarin, A., 2004. “The Precarious Geopolitics of Phosphorous, Down to Earth”. Science and Environment Fortnightly, 2004, pp. 27–31.
Rozema, J., and T. Flowers, 2008. “Crops for a salinized world”. Science 322(5907), 1478-1480.
Scheffer, M., S.R. Carpenter, J.A. Foley, C. Folke, B. Walker, 2001. “Catastrophic shifts in ecosystems”. Nature 413, 591-596.
Schneider, S.H., S. Semenov, A. Patwardhan, I. Burton, C.H.D. Magadza, M. Oppenheimer, A.B. Pittock, A. Rahman, J.B. Smith, A. Suarez, F. Yamin, 2007. “Assessing key vulnerabilities and the risk from climate change. Climate Change 2007: Impacts, Adaptation and Vulnerability”. In Parry, M.L., O.F. Canziani, J.P. Palutikof, P.J. van der Linden, C.E. Hanson (eds.), Contribution of Working Group II to the Fourth Assessment Report of the Intergovernmental Panel on Climate Change, Cambridge University Press, Cambridge, UK, pp.779-810.
Siebert, S., J. Burke. J.M. Faurès, K. Frenken, J. Hoogeveen, P. Döll, Portmann, F.T., 2010.“Groundwater use for irrigation – a global inventory”. Hydrology and Earth System Sciences 14, 1863-1880.
Steinfeld, H., P. Gerber, T. Wassenaar, V. Castel, M. Rosales, C. De Haan, 2006. Livestock’s long shadow. Environmental issues and options. Food and Agriculture Organization of the United Nations, Rome.
REFERENCES continued

24Water, food and energy nexus challenges
Strzepek, K., B. Boehlert, 2010. “Competition for water for the food system”. Philosophical Transitions of the Royal Society Biology 2010) 365, 2927–2940.
Stuart, T., 2009. Waste: uncovering the global food scandal. Penguin Books Ltd, London, UK.
Taub, D., 2010. “Effects of Rising Atmospheric Concentrations of Carbon Dioxide on Plants”. Nature Education Knowledge 3(10), 21.
Trostle, R., 2008. Global agricultural supply and demand: Factors contributing to the recent increase in food commodity prices. WRS-0801. Economic Research Service, US Department of Agriculture, Washington, DC.
UNDESA (United Nations Department of Economic and Social Affairs), 2012. World Population Prospects. The 2012 Revision. United Nations Department of Economic and Social Affairs.
US EPA (United States Environmental Protection Agency), 2012. Global anthropogenic non-CO2 greenhouse gas emissions: 1990 – 2030. Report nr. EPA 430-R-12-006. Office of Atmospheric Programs, Climate Change Division, U.S. Environmental Protection Agency, Washington, DC.
USDA (United States Department of Agriculture), 2008. USDA Agricultural Projections to 2017. Long-term Projections Report OCE-2008-1. USDA, Washington DC.
USGCRP (United States Global Change Research Program), 2009. Global Climate Change Impacts in the United States. Karl, T.R., J.M. Melillo, T.C. Peterson (eds). Cambridge University Press, Cambridge, UK.
Vermeulen, S.J., B.M. Campbell, J.S.I. Ingram, 2012. “Climate change and food systems”. Annual Review of Environment and Resources 37, 195–222.
WHO (World Health Organization), 2006. “Guidelines for the Safe Use of Wastewater, Excreta and Greywater”. Vol. 2: Wastewater Use in Agriculture. WHO, Geneva.
WHO (World Health Organization), 2011. Nitrate and nitrite in drinking-water. Background document for development of WHO Guidelines for Drinking-water Quality. WHO/SDE/WSH/07.01/16/Rev/1. WHO, Geneva.
REFERENCES continued
25Water, food and energy nexus challenges
About the WBCSD
The World Business Council for Sustainable Development is a CEO-led organization of forward thinking companies that galvanizes the global business community to create a sustainable future for business, society and the environment. Together with its members, the Council applies its respected thought leadership and effective advocacy to generate constructive solutions and take shared action. Leveraging its strong relationships with stakeholders as the leading advocate for business, the Council helps drive debate and policy change in favor of sustainable development solutions.
The WBCSD provides a forum for its 200 member companies – which represent all business sectors, all continents and combined revenue of more than US$7 trillion – to share best practices on sustainable development issues and to develop innovative tools that change the status quo. The Council also benefits from a network of 60 national and regional business councils and partner organizations, a majority of which are based in developing countries.
Acknowledgments
Written by Cecilia Borgia, Jaap Evers, Matthijs Kool and Frank van Steenbergen, MetaMeta MetaMeta provides research and consultancy services in water governance, and offers specialized communication products geared to the international resource management & development sectors. MetaMeta has also developed innovative new models for managing and monitoring complex programmes.
Nexus Model methodology prepared by Ankit Patel, Resourcematics Ltd.
Sincere gratitude and thanks to the WBCSD member companies and external experts who provided input and guidance throughout the process, in particular member companies that have provided case studies.
Water Cluster leadership group (as of May 2014) Co-chairs: Borealis and EDF. Members: BASF, Bayer, Deloitte, DSM, DuPont, GDF Suez, Greif, Kimberly-Clark, Monsanto, Nestlé, PepsiCo, PwC, SABMiller, Schneider Electric, Shell, Suncor Energy, Unilever, Veolia.
This piece of work was led by WBCSD water team Violaine Berger, Joppe Cramwinckel, Tatiana Fedotova, Julie Oesterlé.
Disclaimer
This publication is released in the name of the WBCSD. Like other WBCSD publications, it is the result of a collaborative effort by members of the secretariat, senior executives from member companies and external experts. A wide range of members and experts reviewed drafts, thereby ensuring that the document broadly represents the majority of the WBCSD membership. It does not mean, however, that every member company agrees with every word.
This publication has been prepared for general guidance on matters of interest only, and does not constitute professional advice. You should not act upon the information contained in this publication without obtaining specific professional advice. No representation or warranty (express or implied) is given as to the accuracy or completeness of the information contained in this publication, and, to the extent permitted by law, the WBCSD, its members, employees and agents do not accept or assume any liability, responsibility or duty of care for any consequences of you or anyone else acting, or refraining to act, in reliance on the information contained in this publication or for any decision based on it.
Copyright © WBCSD, May 2014. ISBN 978-2-940521-17-3

World Business Council for Sustainable Development Maison de la Paix, Chemin Eugène-Rigot 2, Case postale 246, 1211 Geneve 21, Switzerland, [email protected], Tel. +41 (0)228393100
World Business Council for Sustainable Development Maison de la Paix, Chemin Eugène-Rigot 2, Case postale 246, 1211 Geneve 21, Switzerland, [email protected], Tel. +41 (0)228393100