Water Filtration
99
CHAPTER 8 GRANULAR BED AND PRECOAT FILTRATION John L. Cleasby, Ph.D., P.E. Professor Emeritus Department of Civil and Construction Engineering Iowa State University Ames, Iowa Gary S. Logsdon, D.Sc., P.E. Director,Water Process Research Black and Veatch, Engineers-Architects Cincinnati, Ohio AN OVERVIEW OF POTABLE WATER FILTRATION The filtration processes discussed in this chapter are used primarily to remove par- ticulate material from water. Filtration is one of the unit processes used in the pro- duction of potable water. Particulates removed may be those already present in the source water or those generated during treatment processes. Examples of particu- lates include clay and silt particles; microorganisms (bacteria, viruses, and protozoan cysts); colloidal and precipitated humic substances and other natural organic partic- ulates from the decay of vegetation; precipitates of aluminum or iron used in coagu- lation; calcium carbonate and magnesium hydroxide precipitates from lime softening; and iron and manganese precipitates. Types of Filters A number of different types of filters are used in potable water filtration, and they may be described by various classification schemes. The granular bed and precoat filters discussed herein are comprised of porous granular material. In recent years, interest has grown in the use of membrane filtration in place of, or in addition to, granular bed filtration. Membrane processes are discussed in Chapter 11. 8.1
-
Upload
ehsanelahimirza -
Category
Documents
-
view
92 -
download
20
description
Granullar Water Filtration techniques
Transcript of Water Filtration

CHAPTER 8GRANULAR BED ANDPRECOAT FILTRATION
John L. Cleasby, Ph.D., P.E.Professor Emeritus
Department of Civil and Construction EngineeringIowa State University
Ames, Iowa
Gary S. Logsdon, D.Sc., P.E.Director, Water Process Research
Black and Veatch, Engineers-ArchitectsCincinnati, Ohio
AN OVERVIEW OF POTABLE WATER FILTRATION
The filtration processes discussed in this chapter are used primarily to remove par-ticulate material from water. Filtration is one of the unit processes used in the pro-duction of potable water. Particulates removed may be those already present in thesource water or those generated during treatment processes. Examples of particu-lates include clay and silt particles; microorganisms (bacteria, viruses, and protozoancysts); colloidal and precipitated humic substances and other natural organic partic-ulates from the decay of vegetation; precipitates of aluminum or iron used in coagu-lation; calcium carbonate and magnesium hydroxide precipitates from limesoftening; and iron and manganese precipitates.
Types of Filters
A number of different types of filters are used in potable water filtration, and theymay be described by various classification schemes. The granular bed and precoatfilters discussed herein are comprised of porous granular material. In recent years,interest has grown in the use of membrane filtration in place of, or in addition to,granular bed filtration. Membrane processes are discussed in Chapter 11.
8.1
8.2 CHAPTER EIGHT
FIGURE 8.1 A rapid sand filtration system. (Source: Courtesy of F. B. LeopoldCompany.)
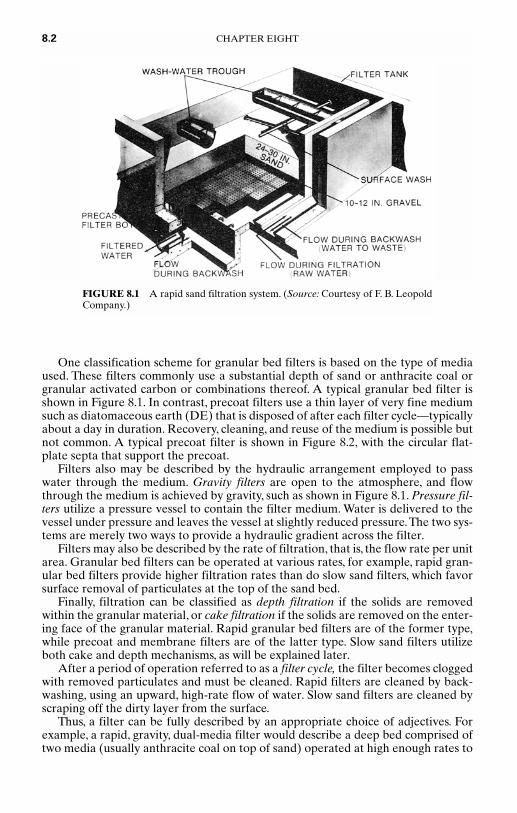
One classification scheme for granular bed filters is based on the type of mediaused. These filters commonly use a substantial depth of sand or anthracite coal orgranular activated carbon or combinations thereof. A typical granular bed filter isshown in Figure 8.1. In contrast, precoat filters use a thin layer of very fine mediumsuch as diatomaceous earth (DE) that is disposed of after each filter cycle—typicallyabout a day in duration. Recovery, cleaning, and reuse of the medium is possible butnot common. A typical precoat filter is shown in Figure 8.2, with the circular flat-plate septa that support the precoat.
Filters also may be described by the hydraulic arrangement employed to passwater through the medium. Gravity filters are open to the atmosphere, and flowthrough the medium is achieved by gravity, such as shown in Figure 8.1. Pressure fil-ters utilize a pressure vessel to contain the filter medium. Water is delivered to thevessel under pressure and leaves the vessel at slightly reduced pressure.The two sys-tems are merely two ways to provide a hydraulic gradient across the filter.
Filters may also be described by the rate of filtration, that is, the flow rate per unitarea. Granular bed filters can be operated at various rates, for example, rapid gran-ular bed filters provide higher filtration rates than do slow sand filters, which favorsurface removal of particulates at the top of the sand bed.
Finally, filtration can be classified as depth filtration if the solids are removedwithin the granular material, or cake filtration if the solids are removed on the enter-ing face of the granular material. Rapid granular bed filters are of the former type,while precoat and membrane filters are of the latter type. Slow sand filters utilizeboth cake and depth mechanisms, as will be explained later.
After a period of operation referred to as a filter cycle, the filter becomes cloggedwith removed particulates and must be cleaned. Rapid filters are cleaned by back-washing, using an upward, high-rate flow of water. Slow sand filters are cleaned byscraping off the dirty layer from the surface.
Thus, a filter can be fully described by an appropriate choice of adjectives. Forexample, a rapid, gravity, dual-media filter would describe a deep bed comprised oftwo media (usually anthracite coal on top of sand) operated at high enough rates to
encourage depth removal of particulates within the bed, and operated by gravity inan open tank.
Dominant Mechanisms, Performance, and Applications
Cake filtration of particulates involves physical removal by straining at the surface.In addition, for the slow sand filter the surface cake of accumulated particulatesincludes a variety of living and dead micro- and macroorganisms. The biologicalmetabolism of the organisms causes some alteration in the chemical composition ofthe water, and the development of this dirty layer (or schmutzdecke) enhancesremoval of particulates as well. As the filter cake develops, the cake itself assumes adominant role in particulate removal. Because of this, filtrate turbidity improves asthe filter run progresses, and deterioration of the filtrate turbidity is normally notobserved at the end of the filter cycle. Because the mechanism of cake filtration islargely physical straining, chemical pretreatments such as coagulation and sedimen-tation are not generally provided. To obtain reasonable filter cycles, however, thesource water must be of quite good quality (which will be defined later).
In contrast, depth filtration involves a variety of complex mechanisms to achieveparticulate removal. Particles to be removed are generally much smaller than thesize of the interstices formed between filter grains. Transport mechanisms areneeded to carry the small particles into contact with the surface of the individual fil-ter grains, and then attachment mechanisms hold the particles to the surfaces. Thesemechanisms will be discussed in more detail later.
Chemical pretreatment is essential to particulate removal in depth filtration. Itserves to flocculate the colloidal-sized particulates into larger particles, whichenhances their partial removal in pretreatment processes (such as sedimentation,flotation, or coarse-bed filtration, all located ahead of the filter) and/or enhances thetransport mechanisms in filtration. In addition, chemical pretreatment enhances the
GRANULAR BED AND PRECOAT FILTRATION 8.3
FIGURE 8.2 Precoat filter of rotating leaf type (sluice type during backwash). (Source: Courtesy ofManville Products Corporation.)
attachment forces retaining the particles in the filter. The focal point of particulateremoval in depth filtration moves progressively deeper into the bed as the cycle pro-gresses, and if the cycle continues long enough, deterioration of the filtrate may beobserved.
The provision of pretreatment makes the depth filtration process more versatilein meeting a variety of source water conditions. With appropriate coagulation, floc-culation, and solids separation ahead of depth filtration, source waters of high tur-bidity or color can be treated successfully. Better quality source waters may betreated by coagulation, flocculation, and depth filtration, a process referred to asdirect filtration, or by in-line filtration, which utilizes only coagulation and very lim-ited flocculation before depth filtration.
In some cases, biological metabolism will result in partial removal of biodegrad-able organic matter in depth filters, if biological growth is allowed to develop in thefilter medium. This is especially important if ozonation precedes filtration. Chapter13 includes information on biological filtration.
Regulatory Requirements for Filtration
The U.S. Environmental Protection Agency’s (USEPA) Surface Water TreatmentRule (SWTR), promulgated on June 29, 1989 (Federal Register 40 CFR Parts 140and 141, p. 27486–27568), requires community water systems to disinfect all surfacewaters and requires filtration for most surface water sources. The Surface WaterTreatment Rule imposed stricter turbidity limits on filtration processes and madethem specific to the type of process used (see Table 8.1). The total extent of inacti-vation and physical removal must be at least 3-log (99.9 percent) for Giardia cystsand 4-log (99.99 percent) for viruses.The supplementary information published withthe rule presented recommended minimum levels of disinfection and assumed logremovals to be credited to the following defined filtration processes: conventionalfiltration, direct filtration, diatomaceous earth filtration, and slow sand filtration.Conventional filtration and direct filtration were defined in the SWTR to includechemical coagulation; flocculation; and in the case of conventional filtration, sedi-mentation; ahead of the filtration process. Slow sand filtration was defined as filtra-tion of water, without chemical coagulation, through a bed of sand at rates of up to0.16 gpm/ft2 (0.40 m/h). Filtration processes that do not function on the principles of
8.4 CHAPTER EIGHT
TABLE 8.1 SWTR Assumed Log Removals and Turbidity Requirements
Log removals*
Filtration process Giardia Virus Turbidity requirement
Conventional 2.5 2.0 = or < 0.5 ntu in 95% of samples each month and never > 5 ntu
Direct 2.0 1.0 = or < 0.5 ntu in 95% of samples each month and never > 5 ntu
Slow sand 2.0 2.0 = or < 1 ntu in 95% of samples each month** and never > 5 ntu
Diatomaceous earth 2.0 1.0 = or < 1 ntu in 95% of samples each month and never > 5 ntu
* From Table IV-2 in Supplementary Information, p. 27511.** Special provision was made for slow sand filters to exceed 1 ntu in some cases, providing effective dis-
infection was maintained.

the processes defined in the SWTR are called alternative filtration processes, and thelog removal for Giardia cysts or viruses that can be allowed for alternative processesmust be determined for each alternative process.
Removal of Microorganisms by Granular Bed and Precoat Filtration
In North America, waterborne disease outbreaks caused by Giardia lamblia andCryptosporidium parvum, pathogenic protozoa with high resistance to disinfectants,have resulted in numerous studies of pilot plants and full-scale treatment plants toevaluate removal of microorganisms. Many of these studies focused on filtrationprocess trains involving coagulation, but some investigations of the efficacy of slowsand filtration and diatomaceous earth filtration have also been carried out.
Pilot plant studies (Logsdon et al., 1985; Al-Ani et al., 1986) established the needfor attaining effective coagulation and filtered water turbidity in the range of 0.1 to0.2 ntu for effective removal of Giardia cysts. Additional research by Nieminski andOngerth (1995) on Giardia and Cryptosporidium confirmed the necessity of attain-ing low filtered water turbidity and the importance of maintaining proper coagula-tion chemistry. They evaluated a small (4900 m3/d) plant for removal of protozoancysts and concluded that a properly operated treatment plant producing finishedwater turbidity of 0.1 to 0.2 ntu, using either the direct filtration mode or the con-ventional treatment mode, could achieve 3-log removal of Giardia cysts and about2.6-log removal of Cryptosporidium. However, when they corrected the test resultsfor recovery efficiency in both the influent and the effluent samples, they reported3.7- to 4.0-log removals for Giardia and Cryptosporidium in both conventional treat-ment and direct filtration. The similarity of results for direct filtration and conven-tional treatment is different from the outcome reported by Patania et al. (1995), whoobserved 1.4- to 1.8-log additional removal for Cryptosporidium and 0.2- to 1.8-logadditional removal for Giardia when sedimentation was included in the treatmenttrain, in comparison with in-line filtration treatment employing only coagulationand filtration. Nieminski and Ongerth (1995) reported that oocyst removals calcu-lated on the basis of the oocyst concentration in the seed suspension being fed to theraw water were 1-log higher than oocyst removals calculated on the basis of the con-centration of oocysts actually measured in the seeded influent water, which is themore rational method of evaluation.
LeChevallier et al. (1991) examined raw and filtered water samples from 66 sur-face water treatment plants in 14 states and 1 Canadian province. Log removals ofGiardia and Cryptosporidium ranged from less than 0.5 to greater than 3.0. Logremovals averaged slightly above 2.0 for each organism. Some of these plants werepracticing disinfection (usually chlorination) during clarification, so the Giardiaresults may have been influenced somewhat by disinfection.They reported that pro-duction of low turbidity water (<0.5 ntu) did not ensure that the treated effluentswere free of cysts or oocysts. Treatment plants evaluated by LeChevallier et al. veryprobably would have removed cysts and oocysts more effectively if they had beenattaining lower filtered water turbidity. In pilot plant testing carried out by Pataniaet al. (1995), when filtered water turbidity was equal to or less than 0.1 ntu, removalof cysts and oocysts was greater by as much as 1.0-log, as compared to removal whenfiltered water turbidity was between 0.1 and 0.3 ntu.
Payment (1997) reported on biweekly monitoring of a conventional water treat-ment plant (coagulation, flocculation, sedimentation, and filtration) for over 12months. Clarification through filtration before any use of disinfectant attained thefollowing results:
GRANULAR BED AND PRECOAT FILTRATION 8.5
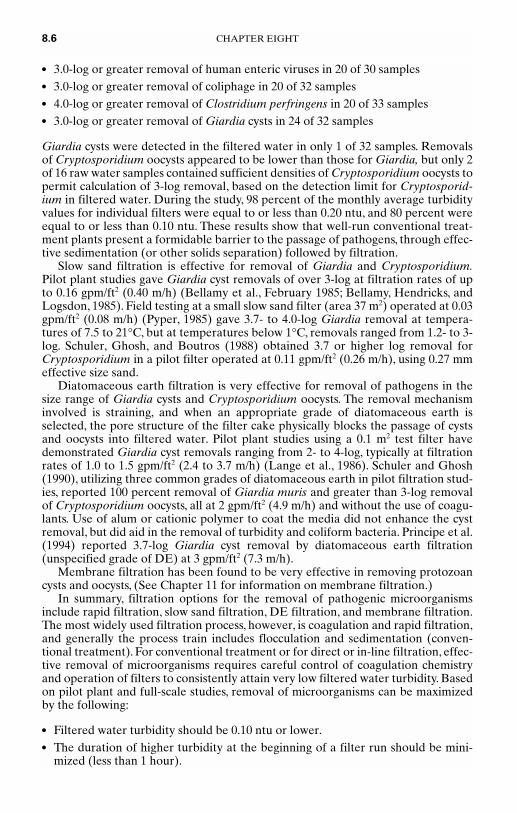
● 3.0-log or greater removal of human enteric viruses in 20 of 30 samples● 3.0-log or greater removal of coliphage in 20 of 32 samples● 4.0-log or greater removal of Clostridium perfringens in 20 of 33 samples● 3.0-log or greater removal of Giardia cysts in 24 of 32 samples
Giardia cysts were detected in the filtered water in only 1 of 32 samples. Removalsof Cryptosporidium oocysts appeared to be lower than those for Giardia, but only 2of 16 raw water samples contained sufficient densities of Cryptosporidium oocysts topermit calculation of 3-log removal, based on the detection limit for Cryptosporid-ium in filtered water. During the study, 98 percent of the monthly average turbidityvalues for individual filters were equal to or less than 0.20 ntu, and 80 percent wereequal to or less than 0.10 ntu. These results show that well-run conventional treat-ment plants present a formidable barrier to the passage of pathogens, through effec-tive sedimentation (or other solids separation) followed by filtration.
Slow sand filtration is effective for removal of Giardia and Cryptosporidium.Pilot plant studies gave Giardia cyst removals of over 3-log at filtration rates of upto 0.16 gpm/ft2 (0.40 m/h) (Bellamy et al., February 1985; Bellamy, Hendricks, andLogsdon, 1985). Field testing at a small slow sand filter (area 37 m2) operated at 0.03gpm/ft2 (0.08 m/h) (Pyper, 1985) gave 3.7- to 4.0-log Giardia removal at tempera-tures of 7.5 to 21°C, but at temperatures below 1°C, removals ranged from 1.2- to 3-log. Schuler, Ghosh, and Boutros (1988) obtained 3.7 or higher log removal forCryptosporidium in a pilot filter operated at 0.11 gpm/ft2 (0.26 m/h), using 0.27 mmeffective size sand.
Diatomaceous earth filtration is very effective for removal of pathogens in thesize range of Giardia cysts and Cryptosporidium oocysts. The removal mechanisminvolved is straining, and when an appropriate grade of diatomaceous earth isselected, the pore structure of the filter cake physically blocks the passage of cystsand oocysts into filtered water. Pilot plant studies using a 0.1 m2 test filter havedemonstrated Giardia cyst removals ranging from 2- to 4-log, typically at filtrationrates of 1.0 to 1.5 gpm/ft2 (2.4 to 3.7 m/h) (Lange et al., 1986). Schuler and Ghosh(1990), utilizing three common grades of diatomaceous earth in pilot filtration stud-ies, reported 100 percent removal of Giardia muris and greater than 3-log removalof Cryptosporidium oocysts, all at 2 gpm/ft2 (4.9 m/h) and without the use of coagu-lants. Use of alum or cationic polymer to coat the media did not enhance the cystremoval, but did aid in the removal of turbidity and coliform bacteria. Principe et al.(1994) reported 3.7-log Giardia cyst removal by diatomaceous earth filtration(unspecified grade of DE) at 3 gpm/ft2 (7.3 m/h).
Membrane filtration has been found to be very effective in removing protozoancysts and oocysts, (See Chapter 11 for information on membrane filtration.)
In summary, filtration options for the removal of pathogenic microorganismsinclude rapid filtration, slow sand filtration, DE filtration, and membrane filtration.The most widely used filtration process, however, is coagulation and rapid filtration,and generally the process train includes flocculation and sedimentation (conven-tional treatment). For conventional treatment or for direct or in-line filtration, effec-tive removal of microorganisms requires careful control of coagulation chemistryand operation of filters to consistently attain very low filtered water turbidity. Basedon pilot plant and full-scale studies, removal of microorganisms can be maximizedby the following:
● Filtered water turbidity should be 0.10 ntu or lower.● The duration of higher turbidity at the beginning of a filter run should be mini-
mized (less than 1 hour).
8.6 CHAPTER EIGHT
● Filtered water turbidity above 0.2 ntu should be considered turbidity break-through, signaling the need to backwash filters.
The U.S. Environmental Protection Agency’s Surface Water Treatment Rule, effec-tive since June 1993, mandates disinfection of all surface waters used for communitywater systems and also requires filtration for most surface waters. In response towaterborne disease outbreaks caused by Cryptosporidium (Kramer et al., 1996), thisrule may be made more stringent in the future.
FILTER MEDIA
Types of Media
The common types of media used in granular bed filters are silica sand, anthracitecoal, and garnet or ilmenite. These may be used alone or in dual- or triple-mediacombinations. Garnet and ilmenite are naturally occurring, high-density mineralsand are described further in the next paragraph.American Water Works AssociationStandard B100-96 (AWWA, 1996) provides standard requirements for properties,sampling, testing, placement, and packaging of these filter materials. Other types ofmedia have also been used in some cases. For example, granular activated carbon(GAC) has been used for reducing taste and odor in granular beds that serve bothfor filtration and adsorption, that is, as filter adsorbers (Graese, Snoeyink, and Lee,1987). Granular activated carbon is also being used after filtration for adsorption oforganic compounds. American Water Works Association Standard B604-90(AWWA, 1991) provides standard requirements for physical properties, sampling,testing, and packaging of GAC.
Garnet is somewhat of a generic term referring to several different minerals,mostly almandite, andradite, and grossularite, which are silicates of iron, aluminum,and calcium mixtures. Ilmenite is an iron titanium ore, which invariably is associatedwith hematite and magnetite, both iron oxides. Garnet specific gravities range from3.6 to 4.2, while those for ilmenite range from 4.2 to 4.6.
Precoat filters use diatomaceous earth or perlite as a filter medium. Standardrequirements for precoat filter media are presented in AWWA Standard B101-94(AWWA, 1995b). Diatomaceous earth (DE or diatomite) is composed of the fos-silized skeletons of microscopic diatoms that grew in fresh or marine waters.Deposits of this material from ancient lakes or oceans are mined and then processedby flux calcining, milling, and air classification into various size grades for assortedfiltration applications. The grades used in potable water filtration have a mean poresize of the cake from about 5 to 17 µm.
A less common medium for precoat filtration is perlite, which comes from glassyvolcanic rock. It is a siliceous rock containing 2 to 3 percent water.When heated, therock expands to form a mass of glass bubbles. It is crushed and classified into severalsize grades.
Important Granular Media Properties
A number of properties of a filter medium are important in affecting filtration per-formance and also in defining the medium.These properties include size, shape, den-sity, and hardness. The porosity of the granular bed formed by the grains is alsoimportant.
GRANULAR BED AND PRECOAT FILTRATION 8.7

8.8 CHAPTER EIGHT
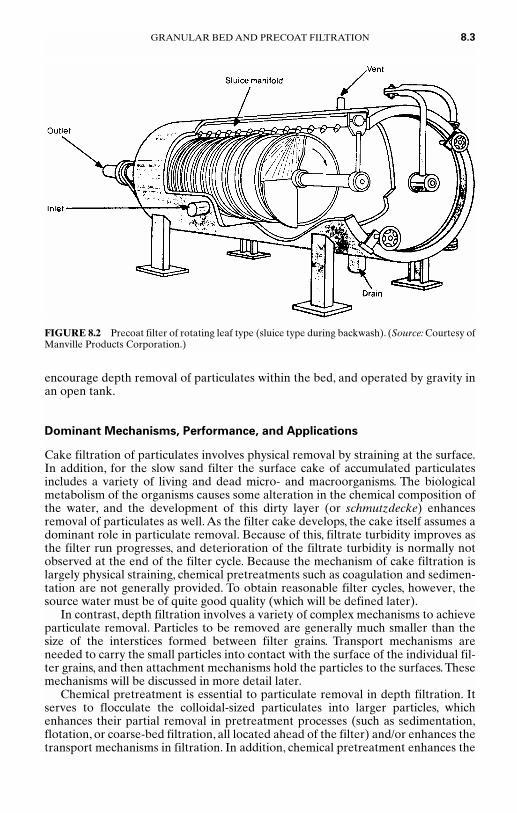
FIGURE 8.3 Typical sieve analysis of two filter media.
Grain Size and Size Distribution. Grain size has an important effect on filtra-tion efficiency and on backwashing requirements for a filter medium. It is deter-mined by sieve analysis using American Society for Testing and Materials (ASTM)Standard Test C136-92, Sieve Analysis of Fine and Coarse Aggregates (ASTM,1993). A log-probability plot of a typical sieve analysis is presented in Figure 8.3.Sieve analyses of most filter materials plot in nearly a linear manner on log-probability paper.
In the United States, the size gradation of a filter medium is described by theeffective size (ES) and the uniformity coefficient (UC).The ES is that size for which10 percent of the grains are smaller by weight. It is read from the sieve analysis curveat the 10 percent passing point on the curve, and is often abbreviated by d10.The UCis a measure of the size range of the media. It is the ratio of the d60/d10 sizes that areread from the sieve analysis curve, d60 being the size for which 60 percent of thegrains are smaller by weight. In some other countries, the lower and upper size of themedia are specified with some maximum percentage allowance above and below the specified sizes.
Values of d10, d60, and d90 can be read from an actual sieve analysis curve such asshown in Figure 8.3. If such a curve is not available and if a linear log-probabilityplot is assumed, they can be interrelated by the following equation derived from thegeometry of such linear plots for different UC:
d90 = d10(101.67 log UC) (8.1)
This relationship is useful because the d90 size is recommended for calculation of therequired backwash rate for a filter medium.
Grain Shape and Roundness. The shape and roundness of the filter grains areimportant because they affect the backwash flow requirements for the medium, thefixed bed porosity, the head loss for flow through the medium, the filtration effi-ciency, and the ease of sieving.
Different measures of grain shape have evolved in the geological and chemicalengineering literature, leading to considerable confusion in terminology (Krumbein,1941; McCabe and Smith, 1976). The chemical engineering literature defines thesphericity (ψ) as the ratio of the surface area of an equal volume sphere (diameterof deq) to the surface area of the grain (McCabe and Smith, 1976). The equivalentspherical diameter can be determined by a tedious count, weigh, and calculationprocedure (Cleasby and Fan, 1981). In the absence of such data, the mean size forany fraction observed from the sieve analysis plot (e.g., Figure 8.3) can be used as anacceptable approximation of the equivalent spherical diameter.
The chemical engineering definition will be used in the following discussion. Thesphericity of filter media by this definition can be determined indirectly by measur-ing pressure drop for flow of water or air through a bed of uniformly sized grains.The Kozeny or Ergun equation for flow through porous media (presented later) isused to calculate ψ after determining all other parameters of the equation (Cleasbyand Fan, 1981).
Grain Density or Specific Gravity. Grain density, mass per unit grain volume, isimportant because it affects the backwash flow requirements for a filter medium.Grains of higher density but of the same diameter require higher wash rates toachieve fluidization.
Grain density is determined from the specific gravity following ASTM StandardTest C128-93, Specific Gravity and Absorption of Fine Aggregate (ASTM, 1993).ThisASTM test uses a displacement technique to determine the specific gravity. Twoalternative tests are detailed in the ASTM standard.The procedure for “bulk specificgravity, saturated surface dry” would be best from a theoretical standpoint for flu-idization calculations. However, starting with a reproducible saturated surface drycondition is difficult. Therefore, the “apparent specific gravity” that starts with anoven-dry sample is more reproducible and is an acceptable alternative for fluidiza-tion calculations. For porous materials such as anthracite coal or GAC, the sampleshould be soaked to fill the pores with water before final measurements are made.
Grain Hardness. The hardness of filter grains is important to the durability of thegrains during long-term service as a filter medium. Hardness is usually described bythe MOH hardness number, which involves a scale of hardness based on the abilityof various minerals to scratch or be scratched by one another. A sequence of miner-als of specified hardnesses is listed by Trefethen (1959).
The two materials of known MOH hardness that can and cannot scratch the fil-ter medium are used to estimate the hardness of the medium. This is a rather crudetest and difficult to apply to small filter grains. Of the filter media listed earlier, onlyanthracite coal and GAC have low hardness worthy of concern. Silica sand, garnet,and ilmenite are very hard, and their hardness need not be of concern. A minimumMOH hardness of 2.7 or 3 is often specified for anthracite coal filter medium,although accurately measuring partial values closer than 0.5 is doubtful.
Two standard mechanical abrasion tests are presented in the AWWA Standard forGranular Activated Carbon (Standard B604-90, AWWA, 1991) to evaluate the abra-sion resistance of GAC. Although GAC is more friable than anthracite, the progressivereduction that takes place in its grain size due to backwashing and regeneration opera-tions is not reported to be a serious problem in actual practice (Graese, Snoeyink, andLee, 1987).
GRANULAR BED AND PRECOAT FILTRATION 8.9

Fixed-Bed Porosity. Fixed-bed porosity is the ratio of void volume to total bedvolume, expressed as a decimal fraction or as a percentage. It is important because itaffects the backwash flow rate required, the fixed-bed head loss, and the solids-holding capacity of the medium. Fixed-bed porosity is affected by the grain spheric-ity; angular grains (i.e., those with lower sphericity) have higher fixed-bed porosity(Cleasby and Fan, 1981), as is evident in Table 8.2. For the low UC commonly speci-fied for filter media, UC has no effect on porosity. However, for natural materialswith very high UC, the nesting of small grains within the voids of the large grains canreduce the average bed porosity.
Fixed-bed porosity is determined by placing a sample of known mass and densityin a transparent tube of known internal diameter. The depth of the filter medium inthe tube is used to calculate the bed volume. The grain volume is the total mass ofmedium in the column divided by the density. The void volume is thus the bed vol-ume minus the grain volume. The fixed-bed porosity is substantially affected by theextent of compaction of the medium placed in the column and by the column diam-eter. The loose-bed porosity can be measured in a column of water. If the bed is agi-tated by inversion and then allowed to settle freely in the water with no compaction,the highest porosity (i.e., the loose-bed porosity) will be obtained. It may be as muchas 5 percent greater than the porosity measured after gentle compaction of the bed.Materials of lower sphericity show greater change in porosity between the loose bedand compacted bed conditions.
The porosity of the granular filter medium is higher near the wall of the filter.This can be important in small pilot scale filter columns because it causes the aver-age bed porosity to be higher than in full-scale filters, and affects the particulateremoval and head loss behavior during filtration studies. It is common to make thediameter of such filter columns at least 50 times the grain size of the coarser filtergrains to be studied (e.g., d90) to minimize such wall effects.
Sieve Analysis Considerations
The standard procedure for conducting a sieve analysis of a filter medium is detailed inASTM Standard Test C136-92 (ASTM, 1993).This standard does not specify a sievingtime or a specific mechanical apparatus for shaking the nest of sieves. Rather, it speci-fies that sieving should be continued “for a sufficient period and in such manner that,after completion,not more than 1 weight percent of the residue on any individual sievewill pass that sieve during one minute of hand sieving” conducted in a mannerdescribed in theASTM standard.With softer materials such as anthracite coal or GAC,abrasion of the material may occur when attempting to meet the 1 percent passing test.
8.10 CHAPTER EIGHT
TABLE 8.2 Typical Properties of Common Filter Media for Granular-Bed Filters (Cleasbyand Fan, 1981; Dharmarajah and Cleasby, 1986; Cleasby and Woods, 1975)
Granular Silica Anthracite activated sand coal carbon Garnet Ilmenite
Grain density, ρs′ Kg/m3 2650 1450–1730 1300–1500* 3600–4200 4200–4600Loose-bed porosity �o 0.42–0.47 0.56–0.60 0.50 0.45–0.55 **Sphericity ψ 0.7–0.8 0.46–0.60 0.75 0.60 **
* For virgin carbon, pores filled with water, density increase when organics are adsorbed.** Not available.
When sieving a 100-g sample of hard materials such as sand, on 8-in sieves, andusing a Ro-Tap type of sieving machine, it is common to require three sieving peri-ods of 5 min each to satisfy the 1 percent passing test. The Ro-Tap machine impartsboth a rotary shaking and a vertical hammering motion to the nest of sieves. Withsome other sieving machines, the ASTM requirement will not be achieved even afterthree 5-min periods of sieving.
When sieving anthracite coal, the sample should be reduced to 50 g because of itslower density. The Ro-Tap machine should be used and the time fixed at 5 min. Thiswill not meet the 1 percent passing test, but prolonged sieving may cause continueddegradation of the anthracite, yielding a more erroneous result.
Because of sieving and sampling difficulties, and because of the tolerance allowedin manufacture of the sieves themselves (ASTM Standard Test E11-87, Wire-clothSieves for Testing Purposes, 1993), a reasonable tolerance should be allowed in thespecified size when specifying filter media. Otherwise, producers of filter materialmay not be able to meet the specification, or a premium price will be charged. A tol-erance of 10 percent plus or minus is suggested. For example, if a sand of 0.5 mm ESis desired, the specification should read 0.45 to 0.55 mm ES. If an anthracite coal of1.0 mm ES is desired, the specification should read 0.9 to 1.1 mm ES.
Typical Properties of Granular Filter Media
With the prior understanding of the importance of various properties of granular fil-tering materials,Table 8.2 is presented to illustrate typical measured values for someproperties.The large difference in grain densities evident in Table 8.2 allows the con-struction of dual- and triple-media filters, with coarse grains of low-density materialon top and finer grains of higher density beneath. Alluvial sands have the highestsphericity, and crushed materials such as anthracite, ilmenite, and some garnet havelower sphericity. Some anthracites contain an excessive amount of flat, elongatedjagged grains, resulting in lower sphericity. The loose-bed porosity is inverselyrelated to the sphericity (i.e., the lower the sphericity the higher the loose-bed poros-ity). An approximate empirical relationship between sphericity and loose-bedporosity was used in developing a predictive model for fluidization that will be pre-sented later (Cleasby and Fan, 1981).
HYDRAULICS OF FLOW THROUGH POROUS MEDIA
Head Loss for Fixed-Bed Flow
The head loss (i.e., pressure drop) that occurs when clean water flows through aclean filter medium can be calculated from well-known equations.The flow througha clean filter of ordinary grain size (i.e., 0.5 mm to 1.0 mm) at ordinary filtrationvelocities (2 to 5 gpm/ft2; 4.9 to 12.2 m/h) would be in the laminar range of flowdepicted by the Kozeny equation (Fair, Geyer, and Okun, 1968) that is dimension-ally homogeneous (i.e., any consistent units may be used that are dimensionallyhomogeneous*):
GRANULAR BED AND PRECOAT FILTRATION 8.11
* Units will not be presented for all dimensionally homogeneous equations in this chapter.
= ��av
��2
V (8.2)
where h = head loss in depth of bed, Lg = acceleration of gravityε = porosity
a/v = grain surface area per unit of grain volume = specific surface (Sv) = 6/dfor spheres and 6/ψdeq for irregular grains
deq = grain diameter of sphere of equal volume,V = superficial velocity above the bed = flow rate/bed area (i.e., the filtra-
tion rate)µ = absolute viscosity of fluidρ = mass density of fluidk = the dimensionless Kozeny constant commonly found close to 5 under
most filtration conditions (Fair, Geyer, and Okun, 1968)
The Kozeny equation is generally acceptable for most filtration calculations becausethe Reynolds number Re based on superficial velocity is usually less than 3 underthese conditions, and Camp (1964) has reported strictly laminar flow up to Re ofabout 6:
Re = deq Vρ/µ (8.3)
The Kozeny equation can be derived from the fundamental Darcy-Weisbach equa-tion for flow through circular pipes:
h = f (8.4)
where f = the friction factor, a function of pipe Reynolds numberD = the pipe diameterU = the mean flow velocity in the pipe
The derivation is achieved by considering flow through porous media analogous toflow through a group of capillary tubes of hydraulic radius r (Fair, Geyer, and Okun,1968). The hydraulic radius is approximated by the ratio of the volume of water inthe interstices per unit bed volume divided by the grain surface area per unit bedvolume. If N is the number of grains per unit bed volume, v is the volume per grain,and a is the surface area per grain, then the bed volume = Nv/(1 − ε), and the inter-stitial volume = Nvε/(1 − ε), and the surface area per unit bed volume is the productof N times a leading to r = εv/(1 − ε)a. The following additional substitutions aremade: D = 4r; U = interstitial velocity = V/ε; f = 64/Re′ for laminar flow; and Re′ =4(V/ε)r ρ/µ is the Reynolds number based on interstitial velocity.
For larger filter media, where higher velocities are used in some applications, orfor velocities approaching fluidization (as in backwashing considerations), the flowmay be in the transitional flow regime, where the Kozeny equation is no longer ade-quate. Therefore, the Ergun equation (Ergun, 1952a), Equation 8.5, should be usedbecause it is adequate for the full range of laminar, transitional, and inertial flowthrough packed beds (Re from 1 to 2,000). The Ergun equation includes a secondterm for inertial head loss.
= � �2
V + k2 � � (8.5)V2
�g
a�v
(1 − ε)�
ε3
a�v
(1 − ε)2
�ε3
4.17µ�
ρgh�L
LU2
�D(2g)
(1 − ε)2
�ε3
kµ�ρg
h�L
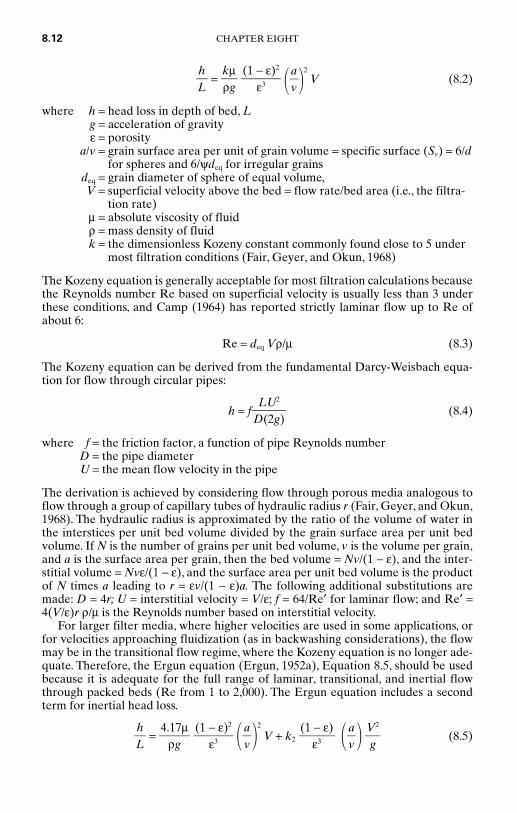
8.12 CHAPTER EIGHT

Note that the first term of the Ergun equation is the viscous energy loss that is pro-portional to V. The second term is the kinetic energy loss that is proportional to V2.Comparing the Ergun and Kozeny equations, the first term of the Ergun equation(viscous energy loss) is identical with the Kozeny equation, except for the numericalconstant. The value of the constant in the second term, k2, was originally reported tobe 0.29 for solids of known specific surface (Ergun, 1952a). In a later paper, however,Ergun reported a k2 value of 0.48 for crushed porous solids (Ergun, 1952b), a valuesupported by later unpublished studies at Iowa State University. The second term inthe equation becomes dominant at higher flow velocities because it is a square func-tion of V. The Kozeny equation, however, is more convenient to use and is quiteacceptable up to Re = 6.
As is evident from equations 8.2 or 8.5, the head loss for a clean bed depends onthe flow rate, grain size, porosity, sphericity, and water viscosity. As filtration pro-gresses and solids are deposited within the void spaces of the medium, the porositydecreases, and sphericity is altered. Head loss is very dependent upon porosity, andreduction in porosity causes the head loss to increase.
The ability to calculate head loss through a clean fixed bed is important in filterdesign because provision for this head must be made in the head loss provided in theplant. In addition, of course, head must be provided in the plant design for theincrease in head loss resulting from the removal of particulates from the influentwater on top of and within the filter bed.This is referred to as the clogging head loss.The clogging head loss to be provided is usually based on prior experience for simi-lar waters and treatment processes or on pilot studies.
EXAMPLE 8.1 Calculate the head loss for the 3-ft- (0.91-m) deep bed of filter sandshown in Figure 8.3 at a filtration rate of 6 gpm/ft2 (14.6 m/h) and a water tempera-ture of 20°C, using a grain sphericity of 0.75 and a porosity of 0.42 estimated fromTable 8.2. Sphericity and porosity can be assumed to be constant for the full beddepth.
SOLUTION Because the sand covers a range of sizes and will be stratified duringbackwashing, divide the bed into five equal segments and use the middle sieve open-ing size for the diameter term in the solution. Solving in SI units:
Kozeny Equation = � � 2 V (8.2)
= =
= υ = 1.004E − 6 m2/s at 20°C
g = 9.81 m/s2
k = Kozeny’s constant, which is typically 5 for common filter mediaV = 6 gpm/ft2 = 4.08Ε − 3 m/s
= 5 ⋅ ⋅ ⋅ 4.08Ε − 3 =
From Figure 8.3, select mid-diameters and calculate h/L for each selected mid-diameter.
6.0671E − 7��
d2
62
�0.752d2
(1 − 0.42)2
��0.423
1.004E − 6��
9.81h�L
µ�ρ
6�0.75d
6�ψd
a�v
a�v
(1 − ε)2
�ε3
kµ�ρg
h�L
GRANULAR BED AND PRECOAT FILTRATION 8.13
Size Middiameter (mx1000) Layer depth (ft) h (ft)
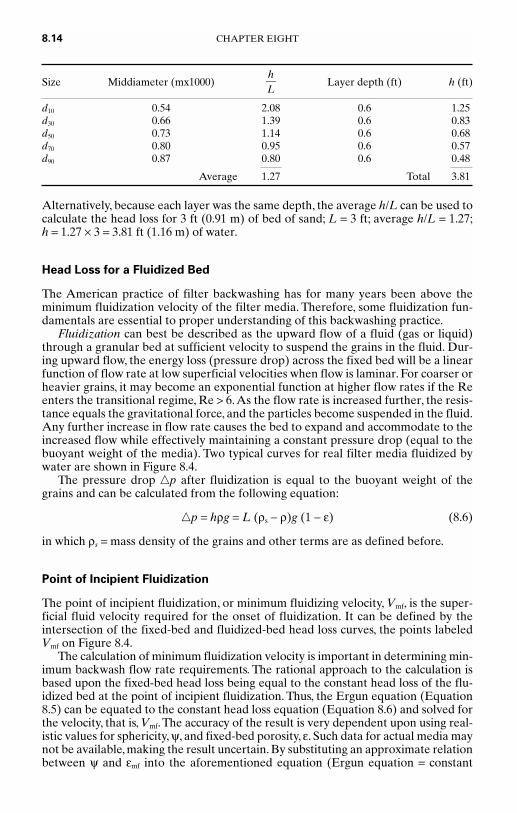
d10 0.54 2.08 0.6 1.25d30 0.66 1.39 0.6 0.83d50 0.73 1.14 0.6 0.68d70 0.80 0.95 0.6 0.57d90 0.87 0.80 0.6 0.48
Average 1.27 Total 3.81
Alternatively, because each layer was the same depth, the average h/L can be used tocalculate the head loss for 3 ft (0.91 m) of bed of sand; L = 3 ft; average h/L = 1.27;h = 1.27 × 3 = 3.81 ft (1.16 m) of water.
Head Loss for a Fluidized Bed
The American practice of filter backwashing has for many years been above theminimum fluidization velocity of the filter media. Therefore, some fluidization fun-damentals are essential to proper understanding of this backwashing practice.
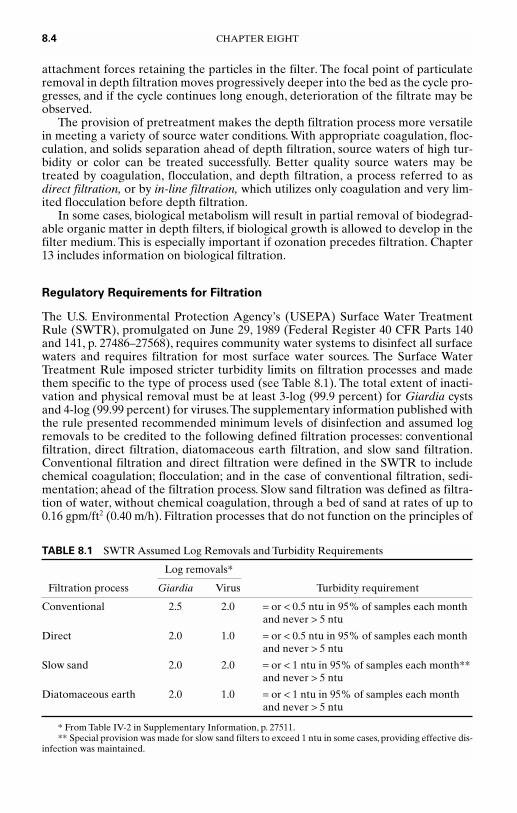
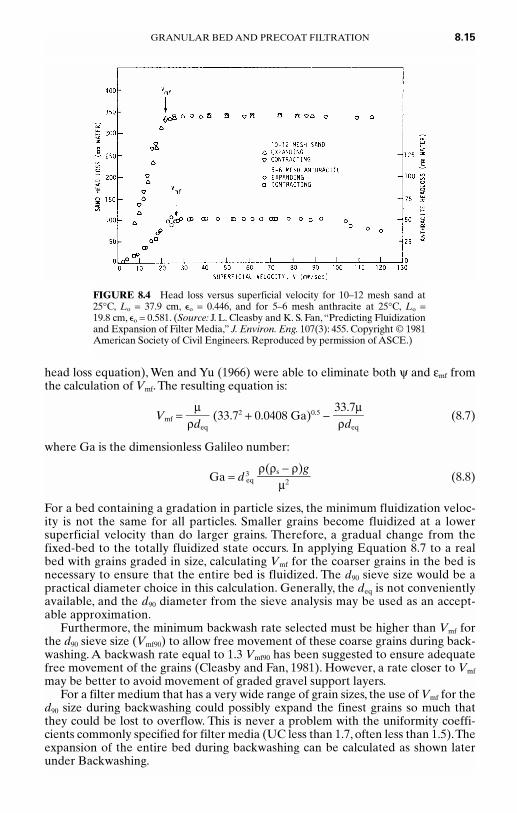
Fluidization can best be described as the upward flow of a fluid (gas or liquid)through a granular bed at sufficient velocity to suspend the grains in the fluid. Dur-ing upward flow, the energy loss (pressure drop) across the fixed bed will be a linearfunction of flow rate at low superficial velocities when flow is laminar. For coarser orheavier grains, it may become an exponential function at higher flow rates if the Reenters the transitional regime, Re > 6.As the flow rate is increased further, the resis-tance equals the gravitational force, and the particles become suspended in the fluid.Any further increase in flow rate causes the bed to expand and accommodate to theincreased flow while effectively maintaining a constant pressure drop (equal to thebuoyant weight of the media). Two typical curves for real filter media fluidized bywater are shown in Figure 8.4.
The pressure drop �p after fluidization is equal to the buoyant weight of thegrains and can be calculated from the following equation:
�p = hρg = L (ρs − ρ)g (1 − ε) (8.6)
in which ρs = mass density of the grains and other terms are as defined before.
Point of Incipient Fluidization
The point of incipient fluidization, or minimum fluidizing velocity, Vmf, is the super-ficial fluid velocity required for the onset of fluidization. It can be defined by theintersection of the fixed-bed and fluidized-bed head loss curves, the points labeledVmf on Figure 8.4.
The calculation of minimum fluidization velocity is important in determining min-imum backwash flow rate requirements. The rational approach to the calculation isbased upon the fixed-bed head loss being equal to the constant head loss of the flu-idized bed at the point of incipient fluidization. Thus, the Ergun equation (Equation8.5) can be equated to the constant head loss equation (Equation 8.6) and solved forthe velocity, that is, Vmf.The accuracy of the result is very dependent upon using real-istic values for sphericity, ψ, and fixed-bed porosity, ε. Such data for actual media maynot be available, making the result uncertain. By substituting an approximate relationbetween ψ and εmf into the aforementioned equation (Ergun equation = constant
h�L
8.14 CHAPTER EIGHT
head loss equation), Wen and Yu (1966) were able to eliminate both ψ and εmf fromthe calculation of Vmf. The resulting equation is:
Vmf = (33.72 + 0.0408 Ga)0.5 − (8.7)
where Ga is the dimensionless Galileo number:
Ga = d 3eq (8.8)
For a bed containing a gradation in particle sizes, the minimum fluidization veloc-ity is not the same for all particles. Smaller grains become fluidized at a lowersuperficial velocity than do larger grains. Therefore, a gradual change from thefixed-bed to the totally fluidized state occurs. In applying Equation 8.7 to a realbed with grains graded in size, calculating Vmf for the coarser grains in the bed isnecessary to ensure that the entire bed is fluidized. The d90 sieve size would be apractical diameter choice in this calculation. Generally, the deq is not convenientlyavailable, and the d90 diameter from the sieve analysis may be used as an accept-able approximation.
Furthermore, the minimum backwash rate selected must be higher than Vmf forthe d90 sieve size (Vmf90) to allow free movement of these coarse grains during back-washing. A backwash rate equal to 1.3 Vmf90 has been suggested to ensure adequatefree movement of the grains (Cleasby and Fan, 1981). However, a rate closer to Vmf
may be better to avoid movement of graded gravel support layers.For a filter medium that has a very wide range of grain sizes, the use of Vmf for the
d90 size during backwashing could possibly expand the finest grains so much thatthey could be lost to overflow. This is never a problem with the uniformity coeffi-cients commonly specified for filter media (UC less than 1.7, often less than 1.5).Theexpansion of the entire bed during backwashing can be calculated as shown laterunder Backwashing.
ρ(ρs − ρ)g��
µ2
33.7µ�ρdeq
µ�ρdeq
GRANULAR BED AND PRECOAT FILTRATION 8.15
FIGURE 8.4 Head loss versus superficial velocity for 10–12 mesh sand at25°C, Lo = 37.9 cm, �o = 0.446, and for 5–6 mesh anthracite at 25°C, Lo =19.8 cm, �o = 0.581. (Source: J. L. Cleasby and K. S. Fan, “Predicting Fluidizationand Expansion of Filter Media,” J. Environ. Eng. 107(3): 455. Copyright © 1981American Society of Civil Engineers. Reproduced by permission of ASCE.)

EXAMPLE 8.2 Calculate the minimum fluidization velocity for the anthracite shownin Figure 8.3, at a water temperature of 20°C, using an anthracite density of 1.6 g/cm3
(1600 Kg/m3) estimated from Table 8.2.
SOLUTION Calculate the fluidization velocity (Vmf) for the d90 size of the anthraciteas suggested in the text. The d90 size from Figure 8.3 = 0.29 cm (2.9Ε − 3 m).
Wen and Yu, Equation 8.7:
Vmf = (33.72 + 0.0408 Ga)0.5 −
Galileo number Equation 8.8
Ga = d 3eq
Solving in SI units:
µ = 1.002Ε − 3 Ns/m2
ρ = 998.207 Kg/m3
µ/ρ = υ = 1.004Ε − 6 m2/s
g = 9.81 m/s2
deq (use d90) = 2.9Ε − 3 m
Ga = = 143,170 dimensionless
Vmf = −
= 0.01725 m/s
The recommended backwash rate would be up to 30 percent higher as discussed intext.
Backwash rate = 1.3 ⋅ 0.01725 = 0.0223 m/s (80 m/h)
= 32.8 gpm/ft2
This is a higher than normal backwash rate because of the very coarse anthracitegrain size, the rather warm water, and the choice of a 30 percent factor above Vmf.Without that factor applied, the rate would be 25.2 gpm/ft2.
RAPID GRANULAR BED FILTRATION
General Description
Rapid granular bed filtration, formerly known as “rapid sand filtration,” usually con-sists of passage of pretreated water through a granular bed at rates of between 2 and
60s�min
0.0929 m2
��ft2
gal�3.785 L
1000 L�
m3
0.0223 m3
��m2s
33.7 ⋅ (1.002Ε − 3)��
998 ⋅ (2.9Ε − 3)1.002Ε − 3 (33.72 + .0408 ⋅ 143170)0.5
����998 ⋅ (2.9Ε − 3)
(2.9Ε − 3)3 ⋅ 998 (1600 − 998) 9.81����
(1.002Ε − 3)2
ρ(ρs − ρ)g��
µ2
33.7µ�
ρdµ
�ρd
8.16 CHAPTER EIGHT

10 gpm/ft2 (5 to 25 m/h). Flow is typically downward through the bed, although someuse of upflow filters is reported in Latin America, Russia, and the Netherlands. Bothgravity and pressure filters are used, although some restrictions are imposed againstthe use of pressure filters on surface waters or other polluted source waters or fol-lowing lime soda softening (Great Lakes Upper Mississippi River Board of StateSanitary Engineers, 1992).
During operation, solids are removed from the water and accumulate within thevoids and on the top surface of the filter medium. This clogging results in a gradualincrease in head loss (i.e., clogging head loss) if the flow rate is to be sustained. Thetotal head loss may approach the maximum head loss provided in the plant, sometimescalled the available head loss. After a period of operation, the rapid filter is cleaned bybackwashing with an upward flow of water, usually assisted by some auxiliary scour-ing system.The operating time between backwashes is referred to as a filter cycle or afilter run. The head loss at the end of the filter run is called the terminal head loss.
The need for backwash is indicated by one of the following three criteria,whichever occurs first:
1. The head loss across the filter increases to the available limit or to a lower estab-lished limit (usually 8 to 10 ft, i.e., 2.4 to 3.0 m) of water.
2. The filtrate begins to deteriorate in quality or reaches some set upper limit.3. Some maximum time limit (usually 3 or 4 days) has been reached.
Typical filter cycles range from about 12 hours to 96 hours, although some plantsoperate with longer cycles. Setting an upper time limit for the cycle is desirablebecause of concern with bacterial growth in the filter, and because of concern thatcompaction of the solids accumulated in the filter will make backwashing difficult.
Pretreatment of surface waters by chemical coagulation (see Chapter 6) is essen-tial to achieve efficient removal of particulates in rapid filters. In addition, filter-aiding polymers may be added to the water just ahead of filtration to strengthen theattachment of the particles to the filter media. Groundwaters treated for iron andmanganese removal by oxidation, precipitation, and filtration generally do not needother chemical pretreatment.
Filter Media for Rapid Filters
Common filter materials used in rapid filters are sand, crushed anthracite coal,GAC, and garnet or ilmenite.Typical configurations of filter media are shown in Fig-ure 8.5. The most commonly used of these configurations are the conventional sandand dual-media filters, but a substantial number of triple-media filters have beeninstalled in the United States. Granular activated carbon replaces sand or anthracitein filter-adsorbers. It can be used alone or in dual- or triple-media configurations.The first three configurations in Figure 8.5 are backwashed with full fluidization andexpansion of the bed. Fluidization results in stratification of the finer grains of eachmedium near the top of that layer of medium.
The single-medium deep-bed filter using coarse sand or anthracite coal [Figure8.5(4)] differs from the conventional sand filter in two ways. First, because themedium is coarser, a deeper bed is required to achieve comparable removal of par-ticulates. Second, because excessive wash rates would be required to fluidize thecoarse medium, it is washed without fluidization by the concurrent upflow of air andwater.The air-water wash causes mixing of the medium, and little or no stratificationby size occurs.
GRANULAR BED AND PRECOAT FILTRATION 8.17
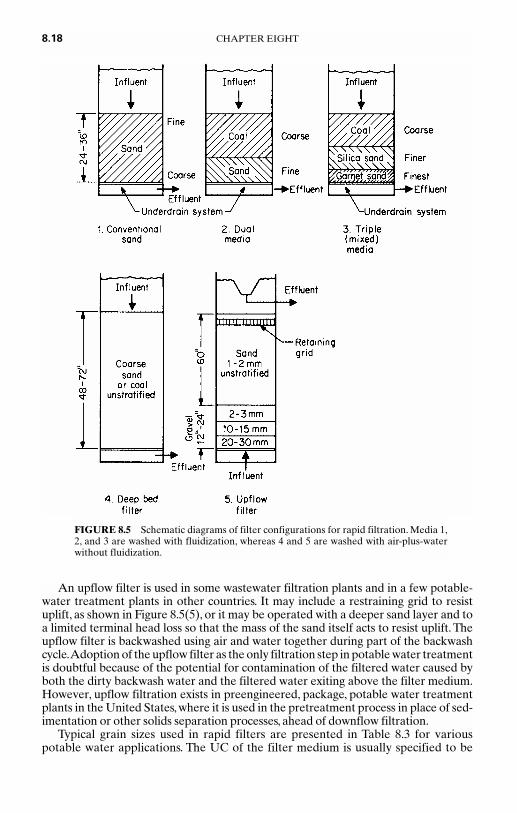
An upflow filter is used in some wastewater filtration plants and in a few potable-water treatment plants in other countries. It may include a restraining grid to resistuplift, as shown in Figure 8.5(5), or it may be operated with a deeper sand layer and toa limited terminal head loss so that the mass of the sand itself acts to resist uplift. Theupflow filter is backwashed using air and water together during part of the backwashcycle.Adoption of the upflow filter as the only filtration step in potable water treatmentis doubtful because of the potential for contamination of the filtered water caused byboth the dirty backwash water and the filtered water exiting above the filter medium.However, upflow filtration exists in preengineered, package, potable water treatmentplants in the United States, where it is used in the pretreatment process in place of sed-imentation or other solids separation processes, ahead of downflow filtration.
Typical grain sizes used in rapid filters are presented in Table 8.3 for variouspotable water applications. The UC of the filter medium is usually specified to be
8.18 CHAPTER EIGHT
FIGURE 8.5 Schematic diagrams of filter configurations for rapid filtration. Media 1,2, and 3 are washed with fluidization, whereas 4 and 5 are washed with air-plus-waterwithout fluidization.

less than 1.65 or 1.7. Use of a lower UC is beneficial for coarser filter media sizes thatare to be backwashed with fluidization, however, because this will minimize the d90
size and thereby reduce the required backwash flow rate. But the lower the specifiedUC, the more costly the filter medium, because a greater portion of the raw materialfalls outside the specified size range. Therefore, the lowest practical UC is about 1.4.Anthracite coal that will meet this UC is commercially available.
There is growing interest in the use of deeper beds of filtering materials, eithermono or dual media, especially for direct filtration applications. For example, deepbeds of dual media were used in pilot studies of cyst removal by Patania et al. (1995)in Seattle. These studies included in-line filtration using dual media with 80 in (2.0 m)of 1.25-mm ES anthracite over 10 in (0.25 m) of 0.6-mm ES sand. The media wereselected to meet stringent turbidity and particle removal goals and operated with opti-mized chemical pretreatment. Pilot studies for proposed plants for Sydney, Australia,included deep-bed mono- and dual-media configurations (Murray and Roddy, 1993).The dual media studied included anthracite 39 to 118 in (1.0 to 3.0 m) in depth, with1.7- to 2.5-mm ES over 6 to 12 in (0.15 to 0.30 m) of crushed sand with 0.65- to 1.0-mmES.The coarser dual media performed best in production per cycle and in filtrate qual-ity. One reason expressed for the interest in deep beds was the possible future conver-sion of the filters to GAC with empty-bed contact times of at least 7.5 minutes.
In addition to the configurations of filtering materials shown in Figure 8.5, otherproprietary media are being used in some applications. The following examples arediscussed in more detail in the section titled “Other Filters” in this chapter. A buoy-ant crushed plastic medium is being used in an upflow mode as a contact flocculatorand pretreatment filter ahead of a downflow triple-media bed (Benjes, Edlund, andGilbert, 1985). Several manufacturers are marketing traveling backwash filters inwhich the filter is divided into cells and utilizes a shallow layer of fine sand, usuallyabout 12 in. in depth (Medlar, 1974).
GRANULAR BED AND PRECOAT FILTRATION 8.19
TABLE 8.3 Typical Grain Sizes for Different Applications
Effective Total size, mm depth, m
A. Common U.S. Practice After Coagulation and Settling1. Sand alone 0.45–0.55 0.6–0.72. Dual media 0.9–1.1 0.6–0.9
Add anthracite (0.1 to 0.7 of bed)3. Triple media 0.2–0.3 0.7–1.0
Add garnet (0.1 m)
B. U.S. Practice for Direct FiltrationPractice not well established. With seasonal diatom blooms,use coarser top size.
Dual-media or deep mono-medium, 1.5-mm ES.
C. U.S. Practice for Fe and Mn Filtration1. Dual media similar to A-2 above2. Single medium <0.8 0.6–0.9
D. Coarse Single-Medium Filters Washed with Air and Water Simultaneously1. For coagulated and settled water 0.9–1.0 0.9–1.22. For direct filtration 1.4–1.6 1–23. For Fe and Mn removal 1–2 1.5–3

The Concept of Equivalent Depth of Filter Media
When considering the use of deeper beds of coarser media, the provision of a deeperbed is sometimes used so that the ratio of bed depth to grain diameter L/d is heldconstant. Hopefully, this will result in equal filtrate quality when filtering the sameinfluent suspension at the same filtration rate. The concept is supported by theexperiments of Ives and Sholji (1965). However, these authors also analyzed thework of other investigators and suggested the relationship should be L/dβ, with βvalues from 1.5 to 1.67.
Nevertheless, the use of L/d has grown in recent years. For graded beds, the effec-tive size de has been suggested for the diameter term (Montgomery 1985, p. 538). Fordual and multimedia filters, the sum of the L/de for each layer is calculated (i.e., theweighted average L/de for the bed). Some typical values for L/de for common bedconfigurations, quoted directly from Kawamura (1991, p 211), are as follows:
● L/de ≥ 1000 for ordinary fine sand and dual-media beds● L/de ≥ 1250 for triple-media (anthracite, sand, garnet) beds● L/de ≥ 1250 for a deep, monomedium beds (1.5 mm> de >1.0 mm)● L/de = 1250–1500 for very coarse, deep, monomedium beds (2.0 mm> de > 1.5mm)
For a common dual-media filter with 2.0 ft (0.6 m) of anthracite of 1.0-mm ES over 1.0 ft (0.3 m) of sand of 0.5-mm ES, the total L/de would be 600/1.0 plus 300/0.5 = 1200,meeting Kawamura’s criterion. Of course, this is a simplistic concept for a complexprocess, but it does assist in selecting alternative filter media for pilot scale evaluations.
Monomedium Versus Multimedia Filters
The media utilized in rapid filters evolved from fine sand, monomedium filtersabout 2 to 3 ft (0.5 to 0.9 m) deep to dual media and later to triple (mixed) media ofabout the same depth. Still later, success at Los Angeles had led to strong interest indeep-bed (4 to 6 ft, 1.2 to 1.8 m), coarse, monomedium filters. The rationale for thisevolution is discussed in this section.
Early research on rapid sand filters with sand about 0.4- to 0.5-mm ES demon-strated that most of the solids were removed in the top few inches of the sand, andthat the full bed depth was not being well-utilized. The dual-media filter bed, con-sisting of a layer of coarser anthracite coal on top of a layer of finer silica sand, wastherefore developed to encourage penetration of solids into the bed.
The use of dual-media filters is now widespread in the United States. It is not a newidea. Camp (1961) reported using dual media for swimming pool filters beginningabout 1940, and later in municipal treatment plant filters. Baylis (1960) described earlywork in the mid-1930s at the Chicago Experimental Filtration Plant, where a 3-in layer(7.5 cm) of 1.5-mm ES anthracite over a layer of 0.5-mm ES sand greatly reduced therate of head loss development in treatment of Lake Michigan water.
The benefit of dual media in reducing the rate of head loss development—thuslengthening the filter run—is well-proven by a number of later studies (Conley andPitman, 1960a; Conley, 1961; Tuepker and Buescher, 1968). However, the presumedbenefit to the quality of the filtrate is not well-demonstrated.
Based on their experiences, Conley and Pitman (1960b) concluded that the alumdosage should be adjusted to achieve low levels of uncoagulated matter in the fil-trate (low turbidity) early in the filter run (after 1 h), and that the filter-aiding poly-mer should be adjusted to the minimum level required to prevent terminal
8.20 CHAPTER EIGHT

breakthrough of alum floc near the end of the run. At the same time, to preventexcessive head loss development, the dosage of polymer should not be higher thannecessary.
Further research comparing dual media with a fine sand medium was reported byRobeck, Dostal, and Woodward (1964). They compared three filter media during fil-tration of alum-coagulated surface water. These comparisons were made by runningfilters in parallel, so the benefits of dual media were more conclusively demonstrated.The rate of head loss development for the dual-media filter was about one half of thatfor the sand medium, but the effluent turbidity was essentially the same prior tobreakthrough, which was observed under some weak flocculation conditions.
The evidence clearly demonstrated lower head loss for a dual-media filter, ascompared to a traditional fine sand filter. For a typical dual media with anthraciteES that is about double the sand ES, the head loss development rate should be aboutone-half the rate of the fine sand filter when both are operated at the same filtrationrate on the same influent water.
The benefits gained by the use of dual-media filters led to the development of thetriple-media filter, in which an even finer layer of high-density media (garnet orilmenite) is added as a bottom layer (Conley, 1965; Conley, 1972). The bottom layerof finer material should improve the filtrate quality in some cases, especially athigher filtration rates. There is growing evidence to support that expectation.
The triple-media filter is sometimes referred to as a mixed-media filter because inthe original development, the sizes and uniformity coefficients of the three layerswere selected to encourage substantial intermixing between the adjacent layers.Thiswas done to come closer to the presumed ideal configuration of “coarse to fine” fil-tration. The original patents have now expired, and other specifications for triplemedia are being used with various degrees of intermixing.
The initial clean-bed head loss will be higher for the triple-media filter due to theadded layer of fine garnet or ilmenite. Thus, for a plant with a particular total avail-able filter system head loss, the clogging head loss available to sustain the run isreduced, which may shorten the run compared to the run obtained with a dual-media filter (Robeck 1966).
Some comparisons of triple media versus dual media have demonstrated triplemedia to be superior in filtered water quality. On Lake Superior water at Duluth,a mixed-media (triple-media) filter was superior to dual media in amphibole fiberremoval (Logsdon and Symons, 1977; Peterson, Schleppenbach, and Zaudtke,1980). Twenty-nine out of 32 samples of filtrate were below or near detection levelfor the dual-media filter, and 18 out of 18 for the mixed-media filter. Mixed mediawas recommended for the plant. Mixed media was also reported to be superior inresisting the detrimental effects of flow disturbances on filtrate quality (Logsdon,1979).
In contrast, Kirmeyer (1979) reported pilot studies for the Seattle water supply inwhich two mixed-media and two dual-media filters were compared. No difference infiltrate quality was observed in either turbidity or asbestos fiber content with filtra-tion rates of 5.5 to 10 gpm/ft2 (13.4 to 24.4 m/h). Some differences in production perunit head loss were observed, favoring dual media at lower rates and mixed media athigher rates.
A number of laboratory studies have compared triple media versus single-medium (fine sand) filters, (Diaper and Ives, 1965; Rimer, 1968; Oeben, Haines, andIves, 1968; Mohanka, 1969). All of these studies have clearly shown the head lossbenefit gained by filtering in the direction of coarse grains to fine grains.Three of thestudies also clearly showed benefits to the filtrate quality for the triple media (Dia-per and Ives, 1965; Rimer, 1968; Oeben, Haines, and Ives, 1968).
GRANULAR BED AND PRECOAT FILTRATION 8.21

Cleasby et al. (1992) summarized twelve unpublished pilot and plant scale studiesconducted for utilities, comparing dual, triple-media, and deep monomedium filters inhigh-rate filtration of surface waters. The studies supported the superiority of triple-media filters over dual media (with comparable depths of anthracite and sand) in pro-ducing the best-quality filtered water. However, higher initial head losses and bettersolids capture resulted in shorter filter cycles for triple-media filters, other factorsbeing the same. The studies comparing deep-bed, coarse, monomedium filters withdual- or triple-media filters were inconclusive with regard to quality of filtrate. How-ever, the deep-bed, coarse, monomedium filters achieved longer filter cycles andgreater water production per cycle than traditionally sized dual- or triple-media filters.
Use of GAC in Rapid Filtration
Granular activated carbon is being used in filter-adsorbers that serve both for filtra-tion of particles and for adsorption of organic compounds, as well as in biological fil-ters and post-filter-adsorbers. (See Chapter 13 for more detail.) The principalapplication of filter-adsorbers to date is for removal of taste and odor, where full-scale experience shows successful removal for periods of from 1 to 5 years before theGAC must be regenerated (Graese, Snoeyink, and Lee, 1987). High concentrationsof competing organic compounds, however, can reduce this duration. Most existingGAC filter-adsorbers are retrofitted rapid filters where GAC has replaced part or allof the sand in rapid sand filters, or replaced anthracite in dual- or triple-media filters.Several filter adsorbers, however, have been initially constructed with GAC.
Granular activated carbon used in retrofitted filters is typically 15 to 30 in (0.38to 0.76 m) of 12 × 40 mesh GAC (ES 0.55 to 0.65 mm) or 8 × 30 mesh GAC (ES 0.80to 1.0 mm) placed over several inches of sand (ES 0.35 to 0.60 mm) in a dual-mediaconfiguration.These GAC materials have a higher UC (≤2.4) than traditionally usedfilter materials (≤1.6). The high UC can contribute to more fine grains in the upperlayers and shorter filter cycles, but it also results in less size intermixing during back-washing, which is beneficial to adsorption.
The use of retrofitted filters as filter-adsorbers is primarily for removal of tri-halomethane (THM) precursors. The removal of less strongly adsorbed compoundssuch as trihalomethanes and volatile organic compounds is limited.The short empty-bed contact times typical of such filter-adsorbers (about 9 min) would result in fre-quent regeneration or replacement of the GAC if used for THM adsorption.
Some filter-adsorbers designed for GAC initially use up to 48 in (1.2 m) ofcoarser GAC (ES-1.3 mm) with lower uniformity coefficients (1.4). This provisionshould result in longer filter cycles, and longer periods between GAC regenerations.
Granular activated carbon is being used successfully on both monomedium anddual-media filter-adsorbers. It is as effective in its filtration function as conventional(sand or dual) filter media, provided an appropriately sized medium has beenselected (Graese, Snoeyink, and Lee, 1987). Particulates removed in the filter-adsorber, however, do impede the adsorption function somewhat, compared to post-filter-adsorbers with the same contact time (see Chapter 13).
The layer of fine sand in the dual-media filter-adsorber may be essential wherevery-low-turbidity filtered water is the goal.The use of sand and GAC in dual-mediabeds, however, causes problems during regeneration because of the difficulty ofremoving sand-free GAC from the filter-adsorber, and of separating the sand afterremoval. Sand causes difficulties in regeneration furnaces (Graese, Snoeyink, andLee, 1987).
8.22 CHAPTER EIGHT

Bacteria proliferate in GAC beds, making periodic backwashing essential. Back-washing should be minimized, however, because of its possible effect on adsorptionefficiency. Application of chlorine to the influent of the adsorbers does not preventbacterial growth and can cause other detrimental effects (see Chapter 13). Post-adsorption disinfection is essential.
Granular activated carbon is softer than anthracite, but the attrition of GACmedia in full-scale plants has not been excessive. Losses of from 1 to 6 percent peryear have been reported (Graese, Snoeyink, and Lee, 1987), which are not higherthan typical losses of anthracite. A modest reduction in grain size of GAC has beenmeasured at some plants. Granular activated carbon has a lower density thananthracite, posing some concerns about losses during backwashing (a topic that willbe discussed later).
Rates of Filtration
Fuller (1898) is commonly credited with establishing a standard rate of filtration of2 gpm/ft2 (5 m/h) for chemically pretreated surface waters. This filtration rate wasconsidered practically inviolable for the first half of the twentieth century in theUnited States. Fuller observed, however, that with properly pretreated water, higherrates gave practically the same water quality. Of equal importance, Fuller acknowl-edged that without adequate chemical pretreatment, no assurance of acceptable fil-tered water existed even at filtration rates of 2 gpm/ft2 (5 m/h).
In the 1950s and 1960s, many plant-scale studies were conducted comparing filterperformance at different filtration rates (Brown, 1955; Baylis, 1956; Hudson, 1962).These studies were generally conducted as utilities were considering uprating exist-ing filters, or building new plants with filtration rates higher than the traditional 2 gpm/ft2 (5 m/h).
The results of such studies—as illustrated in Tables 8.4 and 8.5, and other similarstudies (Cleasby and Baumann, 1962; Conley and Hsuing, 1969)—demonstrated thathigher filtration rates do result in somewhat poorer filtrate quality, as both theory andintuition would predict. However, at the time, the turbidity standard was 1 JacksonTurbidity Unit, and it was presumed that chlorine disinfection would handle anypathogens that happened to pass through the filters. Nevertheless, there was a gradualacceptance of filtration rates of up to 4 gpm/ft2 (9.8 m/h), with conventional pretreat-
GRANULAR BED AND PRECOAT FILTRATION 8.23
TABLE 8.4 Full-Scale Results at Three Filtration Rates (Brown, 1955)*
Filter no.
12 (2 gpm/ft2) 13 (3 gpm/ft2) 14 (4 gpm/ft2) Item (4.9 m/h) (7.3 m/h) (9.8 m/h)
Length of run, h 135.2 116.7 81.3Wash water, % 1.21 0.89 0.99Turbidity, ppm 0.34 0.38 0.43Bacteria, colonies/mL 0.32 0.42 0.36Coliform organisms Negative Negative Negative
* The total amount of water passing through the individual filters during the 3-year tests period is notknown, because they were unmetered. It may be assumed, however, that the quantities were proportional tothe rates, since the accuracy of the standard venturi controllers was checked before and during the tests.Thefilters were operated continuously during the trial period, except when backwashing.
ment and without the use of filter-aiding polymers to increase filtration efficiency(King et al., 1975).
Pioneering work at even higher filtration rates, assisted by filter-aiding polymers,included the following studies. Robeck, Dostal, and Woodward (1964) comparedperformance of pilot filters at 2 to 6 gpm/ft2 (5 to 15 m/h), filtering alum-coagulatedsurface waters through single and dual-media filters. They concluded that withproper coagulation ahead of the filters, the effluent turbidity, coliform bacteria, poliovirus, and powdered carbon removal was as good at 6 gpm/ft2 (15 m/h) as at 4 or 2gpm/ft2 (10 or 5 m/h). Pretreatment included activated silica when necessary to aidflocculation and a polyelectrolyte as a filter aid (referred to as a coagulant aid in theoriginal article). The benefit of using filter-aiding polymers in retarding terminalbreakthrough is shown in Figure 8.6.
Conley and Pitman (1960a) showed the detrimental effect of high filtrationrates of up to 15 gpm/ft2 (37 m/h) in the treatment of Columbia River water, usingalum coagulation followed by short detention flocculation and sedimentationbefore filtration. A proper dose of nonionic polymer added to the water as itentered the filters, however, resulted in the same filtrate quality from 2 to 35gpm/ft2 (5 to 85 m/h). [Note that the turbidity unit being reported in Conley’s stud-ies was later acknowledged (Conley, 1961) to be equivalent to about 50 JacksonTurbidity Units.]
However, the more recent concerns about Giardia and Cryptosporidium haveemphasized the need to achieve filtered water turbidities at or below 0.10 ntu, andhave emphasized log reduction of cysts or cyst-sized particles to ensure the absenceof protozoan pathogens. Some results of such studies were presented in the Intro-duction section of this chapter, and more follow.
When chemical pretreatment was optimized for turbidity and particle removal,resulting in filtered water turbidity below 0.10 ntu, Patania et al. (1995) found no dif-ference in Giardia cyst and Cryptosporidium oocyst removal in pilot studies at Con-tra Costa, California, at filtration rates of 3 and 6 gpm/ft2 (7 to 15 m/h), and at Seattleat 5 and 8 gpm/ft2 (12 to 20 m/h). Conventional pretreatment preceded filtration atContra Costa, whereas in-line filtration was used at Seattle. Both used deep-beddual-media filters and dual coagulants (alum plus cationic polymer). Filter-aidingpolymer was also used in the Seattle pilot plant.
Design and operation guidelines for optimization of high-rate filtration plantswere reported by Cleasby et al. (1989, 1992). The reports were based on a survey of
8.24 CHAPTER EIGHT
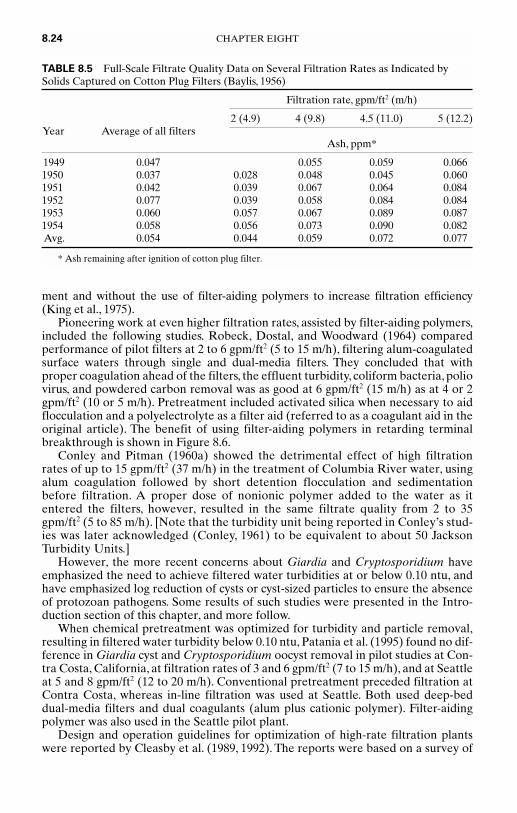
TABLE 8.5 Full-Scale Filtrate Quality Data on Several Filtration Rates as Indicated bySolids Captured on Cotton Plug Filters (Baylis, 1956)
Filtration rate, gpm/ft2 (m/h)
2 (4.9) 4 (9.8) 4.5 (11.0) 5 (12.2)Year Average of all filters
Ash, ppm*
1949 0.047 0.055 0.059 0.0661950 0.037 0.028 0.048 0.045 0.0601951 0.042 0.039 0.067 0.064 0.0841952 0.077 0.039 0.058 0.084 0.0841953 0.060 0.057 0.067 0.089 0.0871954 0.058 0.056 0.073 0.090 0.082Avg. 0.054 0.044 0.059 0.072 0.077
* Ash remaining after ignition of cotton plug filter.

21 surface water treatment plants with consistent operational success in produc-ing filtered water turbidity below 0.2 ntu at filtration rates at or above 4 gpm/ft2
(10 m/h).These plants were characterized by management support of a low-turbiditygoal, optimal chemical pretreatment, the use of polymeric flocculation and/or filter-aiding chemicals, the use of dual- or tri-media filters, continuous monitoring of eachfilter effluent turbidity, and good operator training.
The turbidity and particle count results of this study were summarized by Bel-lamy et al. (1993) as presented in Tables 8.6 and 8.7. Table 8.6 shows that whensource water turbidities were above 5 ntu, the log reductions from source water tofinished water turbidity agreed well with log reductions in total particle count andcyst-sized particle count. Log reductions in turbidity and particle counts were 2-logor higher in all of the plants in Table 8.6. However, with lower source water turbid-ity (Table 8.7), the agreement between log reductions in turbidity and particle countwas not good because of the inability to measure turbidities below about 0.05 ntu. Inspite of this, the log reduction in cyst-sized particles was near 2-log except in 4 of the11 plants treating such waters.
The use of unusually high filtration rates was reported at the Contra CostaCounty Water District plant. By precoating the dual-media filters with a small doseof polymer during the backwash operation, Harris (1970) reported successful oper-ation at 10 gpm/ft2 (24 m/h). Harris also reported that the initial period of poorerwater quality was eliminated by this precoating operation.The Contra Costa CountyWater District plant is now authorized by the State of California to operate at 10 gpm/ft2 (24 m/h).
GRANULAR BED AND PRECOAT FILTRATION 8.25
FIGURE 8.6 Effect of polyelectrolyte on length of run.The data shown were obtained under the fol-lowing operating conditions: raw-water turbidity, 10 units; alum dose, 75 mg/L; filtration rate 2 gpm/ft2;settling tank effluent turbidity, 8 units; and activated carbon, 2 mg/L. In both graphs, the dashed curveis for the filter influent with no polyelectrolyte added; and the solid curve is for 0.08 mg/L polyelec-trolyte added. In the upper graph, Point B shows the time of filter breakthrough, 16 h. The length ofrun with polyelectrolyte added was more than 22 h. (Source: G. G. Robeck; K. A. Dostal; and R. L.Woodward, “Studies of Modification in Water Filtration,” Jour. AWWA, 56(2), February 1964: 198.)

TABLE 8.6 Turbidity and Particle Count Data for Plants Treating Source Waters with Turbidity AboveAbout 5 ntu (Bellamy et al., 1993)
Turbidity Total particle count* Cyst-sized particles
Log reduction,†‡
City (plant) Source ntu Log reduction† Number/mL Log reduction† 3.7-µm size 7.8-µm size
Conventional plantsGlendale, Ariz. (Cholla) 4.4 2.0 69,000 2.1 2.0 2.2Phoenix, Ariz. (Val Vista) 6.9 2.0 99,000 2.4 2.4 2.4Contra Costa, Calif. (Bollman) 9.0 2.9 170,000 2.8 2.8 2.8Winnetka, Ill. 49.0 3.7 500,000 3.0 3.1 3.2Corvallis, Ore. (Taylor) 4.9 1.8 71,000 2.0 2.0 2.2Merrifield, Va. (Corbalis) 5.7 2.3 51,000 2.4 2.4 2.4
Two-stage clarification and lime softeningJohnson County, Kan. (Hanson) 9.2 1.9 66,000 1.6 1.5 1.9
* Particle counter range—1 µm to 60 µm† Source water to filter effluent‡ Particle range for mean diameter of 3.7 µm was 3.06 to 4.43 µm; range for mean diameter of 7.8 µm was 6.43 to
9.33 µm.
8.2
6

TABLE 8.7 Turbidity and Particle Count Data for Plants Treating Source Waters with Turbidity LessThan 5 ntu (Bellamy et al., 1993)
Turbidity Total particle count* Cyst-sized particles
Log reduction,†‡
City (plant) Source ntu Log reduction† Number/mL Log reduction† 3.7-µm size 7.8-µm size
Conventional plantsTuscaloosa, Ala. (Ed Love) 1.2 1.6 17,000 1.5 1.4 1.5Colo. Springs, Colo. (Pine Valley) 0.96 1.5 52,000 2.5 2.4 2.5Loveland, Colo. (Chasteens Grove) 1.5 1.7 11,000 2.0 2.1 2.2Duluth, Minn. (Lakewood) 0.4 1.2 4,000 2.0 2.1 1.9
Rapid mix, detention, filtration plantsOnondaga, N.Y. (Otisco Lake) 2.4 1.3 73,000 1.5 1.4 1.8Eugene, Ore. (Haydon Bridge) 1.5 1.5 29,000 2.0 2.1 2.0Lake Oswego, Ore. 2.4 1.5 46,000 1.5 1.5 1.4
Direct filtration plantsPhoenix, Ariz. (Union Hills) 1.2 0.8 29,000 1.4 1.4 1.3Los Angeles, Calif. (LA Aqueduct) 3.6 1.7 55,000 1.9 2.0 2.1Oceanside, Calif. (Wiese) 2.1 1.5 38,000 1.9 2.0 1.8Las Vegas, Nev. (Smith) 0.21 0.5 3,200 1.0 1.2 1.3
* Particle counter range—1 µm to 60 µm† Source water to filter effluent‡ Particle range for mean diameter of 3.7 µm was 3.06 to 4.43 µm; range for mean diameter of 7.8 µm was 6.43 to
9.33 µm.
8.2
7
Another example of an unusually high design filtration rate is the 13.5 gpm/ft2
(33 m/h) selected for the Los Angeles direct filtration plant. This filtration rate wasselected and approved by the state after more than five years of extensive pilot scalestudies (Trussell et al., 1980; McBride and Stolarik, 1987). The plant uses ozone, fer-ric chloride, and cationic polymer in pretreatment, and deep-bed (6 ft, 1.8 m) coarseanthracite (1.5 mm ES, 1.4 UC), monomedium filters. It has operated successfully atthe design rate, producing filtered water below 0.1 ntu on a consistent basis.
Both of these are large treatment plants, treating high-quality surface water, withcompetent management and operation. Thus, filtration rates of these magnitudesprobably will not become common. With poorer source waters and in smaller plantswith less careful surveillance or operation, lower filtration rates at or below 4 gpm/ft2
(9.8 m/h) will continue to be the prudent choice.Nevertheless, the success at Los Angeles has stimulated great interest in deep-
bed monomedium filtration. Other similar plants are now in service, but not a suchhigh filtration rates. For example, the Modesto, California, plant uses the same filtermedium as in the Los Angeles plant, but the design filtration rate is 6 gpm/ft2
(15 m/h) (Short, Gilton, and Henderson, 1996).Acceptance of filtration rates above 2 gpm/ft2 (5 m/h) varies among state regula-
tory agencies, however, and plant or pilot-scale demonstrations are still required bysome state agencies before acceptance.
The use of higher filtration rates shortens the filter cycle in proportion roughlyinversely to the rate. This problem is minimized by the use of dual- or triple-mediafilters or deep-bed, coarser, monomedium filters. These filters provide for betterpenetration of solids into the filter medium, and thus better utilization of themedium for solids storage during the filter cycle.
Acceptable Run Length and Production per Run
Higher filtration rates have two conflicting impacts on plant production. First, theclean-bed head loss is increased. Thus, for a given amount of available head loss inthe plant hydraulic profile, less clogging head loss is available to sustain the filtercycle. This will shorten the filter cycle length if it is terminated based on reachingmaximum available head loss. Second, the head loss increases at a faster rate perhour at higher filtration rates because solids are captured at a faster rate. However,the production per unit time also increases, so that production per day is increasedsubstantially unless the filter cycles get too short. Therefore, the common impor-tance attached to the length of filter run can be misleading. Rather than emphasiz-ing the effect of filtration rate on length of run, one should emphasize the effect offiltration rate on filtrate quality, net plant production, and production efficiency.
Figure 8.7 illustrates the effect of unit filter run volume on net water productionat three filtration rates (Trussell et al., 1980). Unit filter run volume is the actualthroughput of a filter during one filter run; it also can be called gross production perfilter run. The figure is based on the assumption that 100 gal/ft2 (4 m3/m2) is used foreach backwash operation, and 30 min downtime is required per backwash. Similarfigures can be constructed with other assumptions.The following example illustratesthe preparation of the figure.
● Assume four cycles per day per filter.● Use a run time per cycle = 360 min/cycle − 30 min/wash = 330 min/cycle.● Assume desired maximum filtration rate = 5 gpm/ft2.
8.28 CHAPTER EIGHT
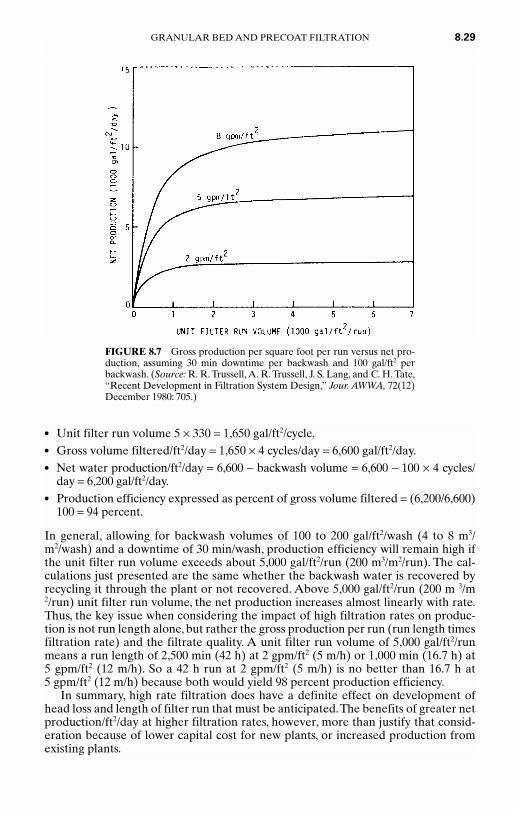
● Unit filter run volume 5 × 330 = 1,650 gal/ft2/cycle.● Gross volume filtered/ft2/day = 1,650 × 4 cycles/day = 6,600 gal/ft2/day.● Net water production/ft2/day = 6,600 − backwash volume = 6,600 − 100 × 4 cycles/
day = 6,200 gal/ft2/day.● Production efficiency expressed as percent of gross volume filtered = (6,200/6,600)
100 = 94 percent.
In general, allowing for backwash volumes of 100 to 200 gal/ft2/wash (4 to 8 m3/m2/wash) and a downtime of 30 min/wash, production efficiency will remain high ifthe unit filter run volume exceeds about 5,000 gal/ft2/run (200 m3/m2/run). The cal-culations just presented are the same whether the backwash water is recovered byrecycling it through the plant or not recovered. Above 5,000 gal/ft2/run (200 m 3/m2/run) unit filter run volume, the net production increases almost linearly with rate.Thus, the key issue when considering the impact of high filtration rates on produc-tion is not run length alone, but rather the gross production per run (run length timesfiltration rate) and the filtrate quality. A unit filter run volume of 5,000 gal/ft2/runmeans a run length of 2,500 min (42 h) at 2 gpm/ft2 (5 m/h) or 1,000 min (16.7 h) at 5 gpm/ft2 (12 m/h). So a 42 h run at 2 gpm/ft2 (5 m/h) is no better than 16.7 h at 5 gpm/ft2 (12 m/h) because both would yield 98 percent production efficiency.
In summary, high rate filtration does have a definite effect on development ofhead loss and length of filter run that must be anticipated.The benefits of greater netproduction/ft2/day at higher filtration rates, however, more than justify that consid-eration because of lower capital cost for new plants, or increased production fromexisting plants.
GRANULAR BED AND PRECOAT FILTRATION 8.29
FIGURE 8.7 Gross production per square foot per run versus net pro-duction, assuming 30 min downtime per backwash and 100 gal/ft2 perbackwash. (Source: R. R. Trussell, A. R. Trussell, J. S. Lang, and C. H. Tate,“Recent Development in Filtration System Design,” Jour. AWWA, 72(12)December 1980: 705.)

8.30 CHAPTER EIGHT
FIGURE 8.8 Rapid gravity filter with manifold and lat-eral underdrain system. (Source: After C. P. Hoover,WaterSupply & Treatment, National Lime Assoc.)
Underdrain and Support Gravel
The underdrain system serves to support the filter medium, collect filtered water (indownflow filters), and distribute backwash water and air scour if air is used. A widevariety of underdrain systems are in use, but they can be grouped into three majortypes.
The first and oldest type is the manifold-lateral system, in which perforated pipelaterals are located at frequent intervals along a manifold (Figure 8.8). Perforationsin the laterals are 1⁄4 to 1⁄2 in (6 to 13 mm) in diameter, located on 3- to 12-in (8- to 30-cm) spacing.
The second type is the fabricated self-supporting underdrain system that isgrouted to the filter floor as in Figure 8.1. One example is a vitrified clay blockunderdrain now marketed by several companies. Recently, a similar plastic blockunderdrain has been marketed that is capable of delivering backwash air or water,or air and water simultaneously. Top openings on these types of underdrains areabout 1⁄4 in (6 mm) in diameter.
The third type of underdrain is the false-floor underdrain with nozzles (Figure8.9). A false-floor slab (or a steel plate in pressure filters) is located 1 to 2 ft (0.3 to 0.6 m) above the bottom of the filter, thus providing an underdrain plenum belowthe false floor. Nozzles to collect the filtrate and distribute the backwash water arelocated at 5- to 8-in centers (13 to 20 cm). Nozzles may have coarse openings ofabout 1⁄4 in (6 mm), or they may have very fine openings that are sufficiently smallto retain the filter medium. The nozzles may be equipped with a stem protrudingabout 6 to 9 in (15 to 23 cm) into the underdrain plenum. One or two small holesor slots in the stem serve to distribute air, either alone or in combination withwater.
Most filters use underdrain systems with openings larger than the filter mediumto be supported. As a result, several layers of graded gravel between the underdrainopenings and the filter medium are necessary to prevent the medium from leakingdownward into the underdrain system. The conventional gravel system begins withcoarse-sized gravel at the bottom, with progressively finer-sized gravel layers up tothe filter medium. Typical rules of thumb for the gradations of adjacent layers,reported by Huisman (1974) in Europe, are as follows:
● Each gravel layer should be as uniform as possible, preferably with the 10 and 90percent passing diameters not more than a factor of �2� apart. In the United

States, a sieve size ratio of 2 for the passing and retaining sieves is commonlyaccepted (American Water Works Association 1996).
● Bottom layer lower grain size limit should be 2 to 3 times the orifice diameter ofthe underdrain system.
● Top layer lower grain size limit should be 4 to 4.5 times the ES of the media to beretained.
GRANULAR BED AND PRECOAT FILTRATION 8.31
FIGURE 8.9 Nozzle underdrain system consisting of a monolithic, cast-in-place, concrete slab on apermanent plastic underdrain form with nozzles capable of air and water distribution. (Source: Mul-ticrete II, Courtesy of General Filter Co., Ames, Iowa.)
● From layer to layer, the upper grain size limit of the coarser layer should be 4times the lower grain size limit of the adjacent finer layer.
● Each layer should be at least 3 in (7 cm) thick, or 3 times the upper grain size limitof the layer, whichever is greater.
The U.S. interpretation of these guidelines is that the upper and lower grain size lim-its refer to the sieve sizes that pass and retain the gravel. No more than 8 percent bydry weight shall be finer than the lower grain size limit, and a minimum of 92 percentshall be finer than the upper grain size limit (American Water Works Association1996, Standard B100-96).
When air scour is to be delivered through the supporting gravel, great dangerexists that the gravel will be disrupted during the backwash cycle, especially if airand water are used simultaneously.Two solutions are being used. One is to use a noz-zle underdrain with small enough openings so that gravel is not required. The otheris to use a double-reverse graded gravel system in which the layers are graded fromcoarse on the bottom to fine in the middle and back up to coarse on the top. Thisconcept—originally used by Baylis to solve gravel migration problems in large filtersin Chicago (American Water Works Association 1971)—is now being used in air andwater backwash filters supplied by several companies.
In addition to the systems just described, various new proprietary underdrain sys-tems are being marketed that eliminate the need for supporting graded-gravel lay-ers. The long-term success of these new systems remains to be demonstrated. Sincefilter failures are often attributed to underdrain deficiencies, adoption of unprovensystems is a matter of concern.
THEORY OF RAPID FILTRATION AND MODELING
Mechanisms of Filtration
The mechanisms involved in removal of suspended solids during rapid filtration arecomplex. Many workers have discussed the various factors that may play an impor-tant role in particle removal. A notable early example of such discussions is byO’Melia and Stumm (1967).
During rapid granular bed filtration, particle removal is primarily within the fil-ter bed and is referred to as depth filtration. The efficiency of depth removal dependson a number of mechanisms. Some solids may be removed by the simple mechanicalprocess of physical screening if the particle is larger than the smallest openingthrough which the water flows. Removal of other solids, particularly the smallerones, involves two steps. First, a transport mechanism must bring the small particlefrom the bulk of the fluid within the interstices close to the surfaces of the grains.Transport mechanisms may include gravitational settling, Brownian diffusion, inter-ception, and hydrodynamics that are affected by such physical characteristics as sizeand shape of the filter grains, filtration rate, fluid temperature, and the density, size,and shape of the suspended particles.
Second, as particles approach the surface of a grain, or previously depositedsolids on the grain, short-range surface forces must be favorable for attachment tooccur. If the particles have been destabilized sufficiently so that electrostatic repul-sive forces are minimized, the interaction of these forces and short-range attractiveVan der Waal’s forces results in a net attractive force, and attachment of the particleto the grain surface (or to previous deposits) can occur.The collision and attachmentprocess is comparable to coagulation of destabilized particles (see Chapter 6).
8.32 CHAPTER EIGHT
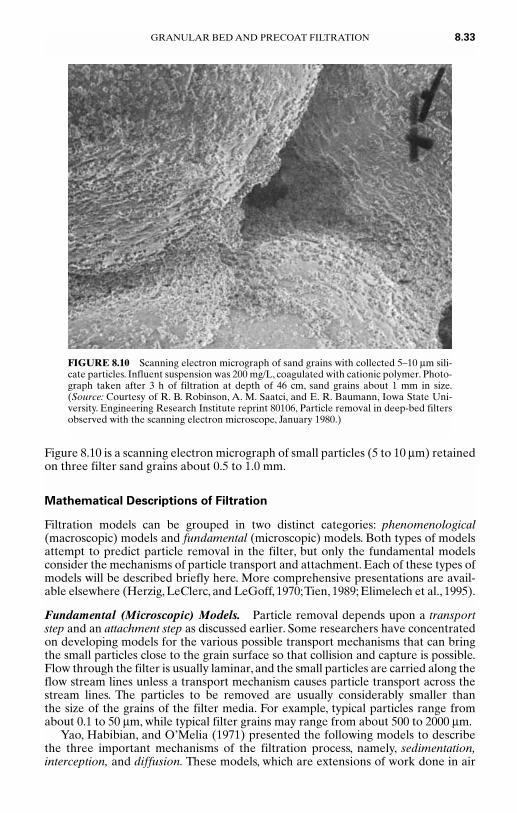
Figure 8.10 is a scanning electron micrograph of small particles (5 to 10 µm) retainedon three filter sand grains about 0.5 to 1.0 mm.
Mathematical Descriptions of Filtration
Filtration models can be grouped in two distinct categories: phenomenological(macroscopic) models and fundamental (microscopic) models. Both types of modelsattempt to predict particle removal in the filter, but only the fundamental modelsconsider the mechanisms of particle transport and attachment. Each of these types ofmodels will be described briefly here. More comprehensive presentations are avail-able elsewhere (Herzig, LeClerc, and LeGoff, 1970;Tien, 1989; Elimelech et al., 1995).
Fundamental (Microscopic) Models. Particle removal depends upon a transportstep and an attachment step as discussed earlier. Some researchers have concentratedon developing models for the various possible transport mechanisms that can bringthe small particles close to the grain surface so that collision and capture is possible.Flow through the filter is usually laminar, and the small particles are carried along theflow stream lines unless a transport mechanism causes particle transport across thestream lines. The particles to be removed are usually considerably smaller than the size of the grains of the filter media. For example, typical particles range fromabout 0.1 to 50 µm, while typical filter grains may range from about 500 to 2000 µm.
Yao, Habibian, and O’Melia (1971) presented the following models to describethe three important mechanisms of the filtration process, namely, sedimentation,interception, and diffusion. These models, which are extensions of work done in air
GRANULAR BED AND PRECOAT FILTRATION 8.33
FIGURE 8.10 Scanning electron micrograph of sand grains with collected 5–10 µm sili-cate particles. Influent suspension was 200 mg/L, coagulated with cationic polymer. Photo-graph taken after 3 h of filtration at depth of 46 cm, sand grains about 1 mm in size.(Source: Courtesy of R. B. Robinson, A. M. Saatci, and E. R. Baumann, Iowa State Uni-versity. Engineering Research Institute reprint 80106, Particle removal in deep-bed filtersobserved with the scanning electron microscope, January 1980.)

filtration, are useful in indicating the various parameters that are important in trans-port of particles of different size and density in granular bed filters of different grainsize, water velocity, and temperature. Each mechanism is expressed in terms of a the-oretical single spherical collector efficiency η, which is the ratio of the number ofsuccessful collisions to the total number of potential collisions in the projected cross-sectional area of the collector.
The larger or heavier particles can be transported to the collector by sedimenta-tion. The single collector efficiency for sedimentation transport ηs, is the ratio of theStokes’s settling velocity Vs to the filtration rate (i.e., approach velocity of the flow, V):
ηs = = (8.9)
where dp is the particle diameter and other terms as defined earlier.
If the stream line carrying a particle passes within dp/2 of the collector surface, the par-ticle can be removed by interception.The single collector model for interception is:
ηI = � �2
(8.10)
where dc is the collector diameter.
Very small colloidal-sized particles, less than about 1 µm in size, will be moved in arandom pattern away from their stream lines by Brownian diffusion. The single col-lector model for diffusive transport, ηD, which incorporates Einstein’s equation forthe diffusion coefficient of suspended particles, is:
ηD = 0.9 � �2/3
(8.11)
where K is Boltzman’s constant, T is absolute temperature, and the other terms areas defined before.
The overall collector efficiency is the sum of the three individual collector efficien-cies:
ηo = ηs + ηI + ηD (8.12)
If the particles are not adequately destabilized, the removal efficiency of the collec-tor will be less than ηo. An empirical collision efficiency factor α is applied toaccount for this, so that the actual single collector removal efficiency is:
η = α ηo (8.13)
With adequate destabilization, α = 1 since repulsive forces are eliminated.These relationships predict that collection of particles will be hindered by higher
filtration rates (V−1 or V−2/3) (except for interception which is independent of veloc-ity); by larger grain sizes (dc
−2 or dc−2/3); or by colder waters of higher viscosity (µ−1 or
µ−2/3). Capture is also hindered by smaller and lighter particles (dp2 and ρs − ρ) unless
they are small enough for diffusive transport (dp−2/3). These observations based on
theoretical models are in general agreement with actual observations of filtrationand with intuition. Higher rates of filtration, larger grain sizes, and colder watersyield poorer filtration. Because real suspensions contain a range of particle sizes, all
KT�µdpdcV
dp�dc
3�2
(ρs − ρ) gdp2
��18µV
Vs�V
8.34 CHAPTER EIGHT
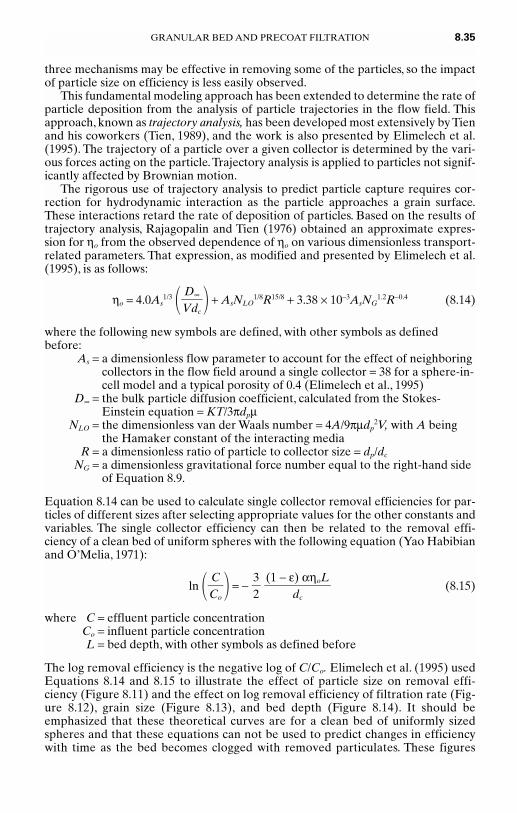
three mechanisms may be effective in removing some of the particles, so the impactof particle size on efficiency is less easily observed.
This fundamental modeling approach has been extended to determine the rate ofparticle deposition from the analysis of particle trajectories in the flow field. Thisapproach, known as trajectory analysis, has been developed most extensively by Tienand his coworkers (Tien, 1989), and the work is also presented by Elimelech et al.(1995). The trajectory of a particle over a given collector is determined by the vari-ous forces acting on the particle.Trajectory analysis is applied to particles not signif-icantly affected by Brownian motion.
The rigorous use of trajectory analysis to predict particle capture requires cor-rection for hydrodynamic interaction as the particle approaches a grain surface.These interactions retard the rate of deposition of particles. Based on the results oftrajectory analysis, Rajagopalin and Tien (1976) obtained an approximate expres-sion for ηo from the observed dependence of ηo on various dimensionless transport-related parameters. That expression, as modified and presented by Elimelech et al.(1995), is as follows:
ηo = 4.0As1/3 � � + AsNLO
1/8R15/8 + 3.38 × 10⁻³AsNG1.2R−0.4 (8.14)
where the following new symbols are defined, with other symbols as definedbefore:
As = a dimensionless flow parameter to account for the effect of neighboringcollectors in the flow field around a single collector = 38 for a sphere-in-cell model and a typical porosity of 0.4 (Elimelech et al., 1995)
D∞ = the bulk particle diffusion coefficient, calculated from the Stokes-Einstein equation = KT/3πdpµ
NLO = the dimensionless van der Waals number = 4A/9πµdp2V, with A being
the Hamaker constant of the interacting mediaR = a dimensionless ratio of particle to collector size = dp/dc
NG = a dimensionless gravitational force number equal to the right-hand sideof Equation 8.9.
Equation 8.14 can be used to calculate single collector removal efficiencies for par-ticles of different sizes after selecting appropriate values for the other constants andvariables. The single collector efficiency can then be related to the removal effi-ciency of a clean bed of uniform spheres with the following equation (Yao Habibianand O’Melia, 1971):
ln � � = − (8.15)
where C = effluent particle concentrationCo = influent particle concentrationL = bed depth, with other symbols as defined before
The log removal efficiency is the negative log of C/Co. Elimelech et al. (1995) usedEquations 8.14 and 8.15 to illustrate the effect of particle size on removal effi-ciency (Figure 8.11) and the effect on log removal efficiency of filtration rate (Fig-ure 8.12), grain size (Figure 8.13), and bed depth (Figure 8.14). It should beemphasized that these theoretical curves are for a clean bed of uniformly sizedspheres and that these equations can not be used to predict changes in efficiencywith time as the bed becomes clogged with removed particulates. These figures
(1 − ε) αηoL��
dc
3�2
C�Co
D∞�Vdc
GRANULAR BED AND PRECOAT FILTRATION 8.35
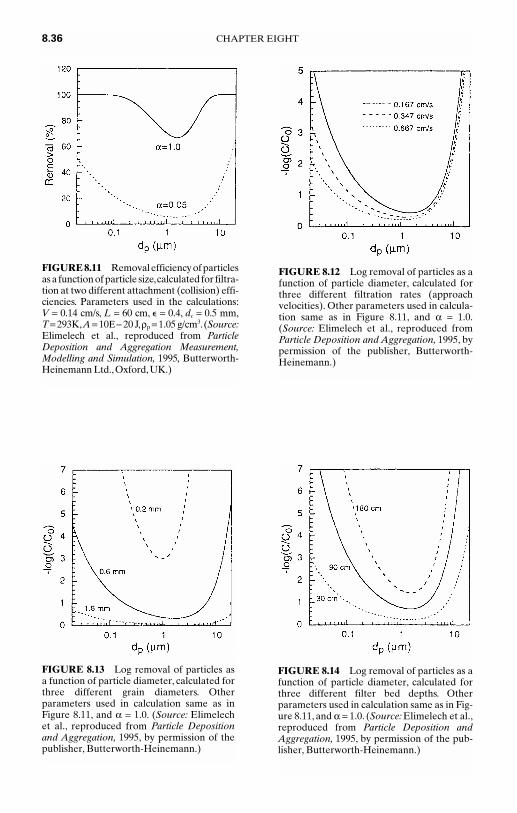
8.36 CHAPTER EIGHT
FIGURE 8.11 Removal efficiency of particlesas a function of particle size,calculated for filtra-tion at two different attachment (collision) effi-ciencies. Parameters used in the calculations:V = 0.14 cm/s, L = 60 cm, � = 0.4, dc = 0.5 mm,T = 293K,A = 10Ε − 20 J,ρp = 1.05 g/cm3.(Source:Elimelech et al., reproduced from ParticleDeposition and Aggregation Measurement,Modelling and Simulation, 1995, Butterworth-Heinemann Ltd.,Oxford,UK.)
FIGURE 8.12 Log removal of particles as afunction of particle diameter, calculated forthree different filtration rates (approachvelocities). Other parameters used in calcula-tion same as in Figure 8.11, and α = 1.0.(Source: Elimelech et al., reproduced fromParticle Deposition and Aggregation, 1995, bypermission of the publisher, Butterworth-Heinemann.)
FIGURE 8.13 Log removal of particles asa function of particle diameter, calculated forthree different grain diameters. Otherparameters used in calculation same as inFigure 8.11, and α = 1.0. (Source: Elimelechet al., reproduced from Particle Depositionand Aggregation, 1995, by permission of thepublisher, Butterworth-Heinemann.)
FIGURE 8.14 Log removal of particles as afunction of particle diameter, calculated forthree different filter bed depths. Otherparameters used in calculation same as in Fig-ure 8.11, and α = 1.0. (Source: Elimelech et al.,reproduced from Particle Deposition andAggregation, 1995, by permission of the pub-lisher, Butterworth-Heinemann.)
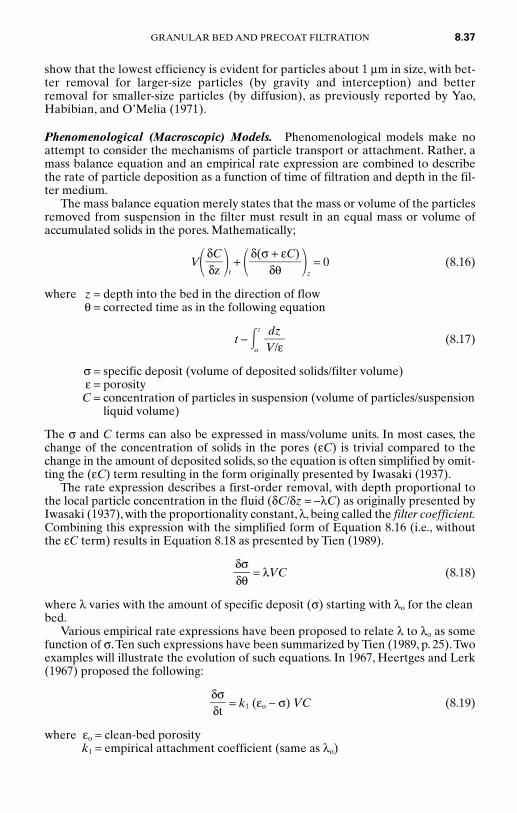
show that the lowest efficiency is evident for particles about 1 µm in size, with bet-ter removal for larger-size particles (by gravity and interception) and betterremoval for smaller-size particles (by diffusion), as previously reported by Yao,Habibian, and O’Melia (1971).
Phenomenological (Macroscopic) Models. Phenomenological models make noattempt to consider the mechanisms of particle transport or attachment. Rather, amass balance equation and an empirical rate expression are combined to describethe rate of particle deposition as a function of time of filtration and depth in the fil-ter medium.
The mass balance equation merely states that the mass or volume of the particlesremoved from suspension in the filter must result in an equal mass or volume ofaccumulated solids in the pores. Mathematically;
V� �t+ � �
z= 0 (8.16)
where z = depth into the bed in the direction of flowθ = corrected time as in the following equation
t − �z
o
(8.17)
σ = specific deposit (volume of deposited solids/filter volume)ε = porosity
C = concentration of particles in suspension (volume of particles/suspensionliquid volume)
The σ and C terms can also be expressed in mass/volume units. In most cases, thechange of the concentration of solids in the pores (εC) is trivial compared to thechange in the amount of deposited solids, so the equation is often simplified by omit-ting the (εC) term resulting in the form originally presented by Iwasaki (1937).
The rate expression describes a first-order removal, with depth proportional tothe local particle concentration in the fluid (δC/δz = −λC) as originally presented byIwasaki (1937), with the proportionality constant, λ, being called the filter coefficient.Combining this expression with the simplified form of Equation 8.16 (i.e., withoutthe εC term) results in Equation 8.18 as presented by Tien (1989).
= λVC (8.18)
where λ varies with the amount of specific deposit (σ) starting with λo for the cleanbed.
Various empirical rate expressions have been proposed to relate λ to λo as somefunction of σ.Ten such expressions have been summarized by Tien (1989, p. 25).Twoexamples will illustrate the evolution of such equations. In 1967, Heertges and Lerk(1967) proposed the following:
= k1 (εo − σ) VC (8.19)
where εo = clean-bed porosityk1 = empirical attachment coefficient (same as λo)
δσ�δt
δσ�δθ
dz�V/ε
δ(σ + εC)��
δθδC�δz
GRANULAR BED AND PRECOAT FILTRATION 8.37
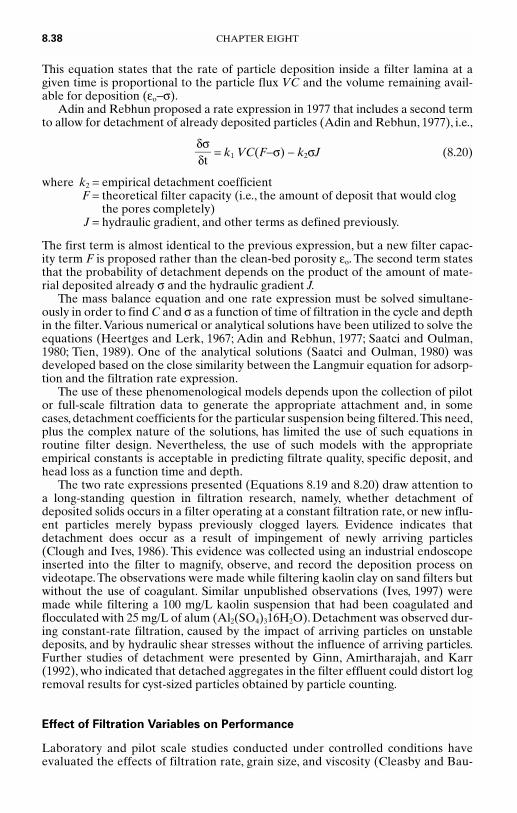
This equation states that the rate of particle deposition inside a filter lamina at agiven time is proportional to the particle flux VC and the volume remaining avail-able for deposition (εo−σ).
Adin and Rebhun proposed a rate expression in 1977 that includes a second termto allow for detachment of already deposited particles (Adin and Rebhun, 1977), i.e.,
= k1 VC(F−σ) − k2σJ (8.20)
where k2 = empirical detachment coefficientF = theoretical filter capacity (i.e., the amount of deposit that would clog
the pores completely)J = hydraulic gradient, and other terms as defined previously.
The first term is almost identical to the previous expression, but a new filter capac-ity term F is proposed rather than the clean-bed porosity εo. The second term statesthat the probability of detachment depends on the product of the amount of mate-rial deposited already σ and the hydraulic gradient J.
The mass balance equation and one rate expression must be solved simultane-ously in order to find C and σ as a function of time of filtration in the cycle and depthin the filter.Various numerical or analytical solutions have been utilized to solve theequations (Heertges and Lerk, 1967; Adin and Rebhun, 1977; Saatci and Oulman,1980; Tien, 1989). One of the analytical solutions (Saatci and Oulman, 1980) wasdeveloped based on the close similarity between the Langmuir equation for adsorp-tion and the filtration rate expression.
The use of these phenomenological models depends upon the collection of pilotor full-scale filtration data to generate the appropriate attachment and, in somecases, detachment coefficients for the particular suspension being filtered.This need,plus the complex nature of the solutions, has limited the use of such equations inroutine filter design. Nevertheless, the use of such models with the appropriateempirical constants is acceptable in predicting filtrate quality, specific deposit, andhead loss as a function time and depth.
The two rate expressions presented (Equations 8.19 and 8.20) draw attention toa long-standing question in filtration research, namely, whether detachment ofdeposited solids occurs in a filter operating at a constant filtration rate, or new influ-ent particles merely bypass previously clogged layers. Evidence indicates thatdetachment does occur as a result of impingement of newly arriving particles(Clough and Ives, 1986). This evidence was collected using an industrial endoscopeinserted into the filter to magnify, observe, and record the deposition process onvideotape.The observations were made while filtering kaolin clay on sand filters butwithout the use of coagulant. Similar unpublished observations (Ives, 1997) weremade while filtering a 100 mg/L kaolin suspension that had been coagulated andflocculated with 25 mg/L of alum (Al2(SO4)316H2O). Detachment was observed dur-ing constant-rate filtration, caused by the impact of arriving particles on unstabledeposits, and by hydraulic shear stresses without the influence of arriving particles.Further studies of detachment were presented by Ginn, Amirtharajah, and Karr(1992), who indicated that detached aggregates in the filter effluent could distort logremoval results for cyst-sized particles obtained by particle counting.
Effect of Filtration Variables on Performance
Laboratory and pilot scale studies conducted under controlled conditions haveevaluated the effects of filtration rate, grain size, and viscosity (Cleasby and Bau-
δσ�δt
8.38 CHAPTER EIGHT
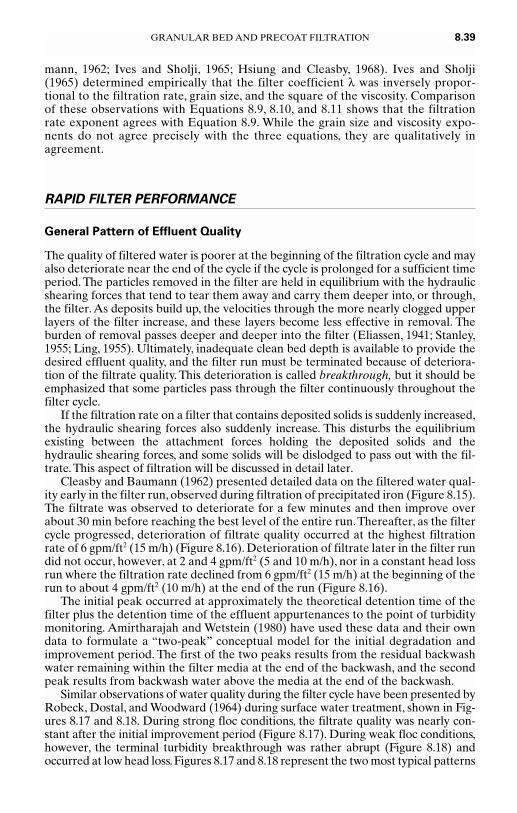
mann, 1962; Ives and Sholji, 1965; Hsiung and Cleasby, 1968). Ives and Sholji(1965) determined empirically that the filter coefficient λ was inversely propor-tional to the filtration rate, grain size, and the square of the viscosity. Comparisonof these observations with Equations 8.9, 8.10, and 8.11 shows that the filtrationrate exponent agrees with Equation 8.9. While the grain size and viscosity expo-nents do not agree precisely with the three equations, they are qualitatively inagreement.
RAPID FILTER PERFORMANCE
General Pattern of Effluent Quality
The quality of filtered water is poorer at the beginning of the filtration cycle and mayalso deteriorate near the end of the cycle if the cycle is prolonged for a sufficient timeperiod. The particles removed in the filter are held in equilibrium with the hydraulicshearing forces that tend to tear them away and carry them deeper into, or through,the filter. As deposits build up, the velocities through the more nearly clogged upperlayers of the filter increase, and these layers become less effective in removal. Theburden of removal passes deeper and deeper into the filter (Eliassen, 1941; Stanley,1955; Ling, 1955). Ultimately, inadequate clean bed depth is available to provide thedesired effluent quality, and the filter run must be terminated because of deteriora-tion of the filtrate quality. This deterioration is called breakthrough, but it should beemphasized that some particles pass through the filter continuously throughout thefilter cycle.
If the filtration rate on a filter that contains deposited solids is suddenly increased,the hydraulic shearing forces also suddenly increase. This disturbs the equilibriumexisting between the attachment forces holding the deposited solids and thehydraulic shearing forces, and some solids will be dislodged to pass out with the fil-trate. This aspect of filtration will be discussed in detail later.
Cleasby and Baumann (1962) presented detailed data on the filtered water qual-ity early in the filter run, observed during filtration of precipitated iron (Figure 8.15).The filtrate was observed to deteriorate for a few minutes and then improve overabout 30 min before reaching the best level of the entire run.Thereafter, as the filtercycle progressed, deterioration of filtrate quality occurred at the highest filtrationrate of 6 gpm/ft2 (15 m/h) (Figure 8.16). Deterioration of filtrate later in the filter rundid not occur, however, at 2 and 4 gpm/ft2 (5 and 10 m/h), nor in a constant head lossrun where the filtration rate declined from 6 gpm/ft2 (15 m/h) at the beginning of therun to about 4 gpm/ft2 (10 m/h) at the end of the run (Figure 8.16).
The initial peak occurred at approximately the theoretical detention time of thefilter plus the detention time of the effluent appurtenances to the point of turbiditymonitoring. Amirtharajah and Wetstein (1980) have used these data and their owndata to formulate a “two-peak” conceptual model for the initial degradation andimprovement period. The first of the two peaks results from the residual backwashwater remaining within the filter media at the end of the backwash, and the secondpeak results from backwash water above the media at the end of the backwash.
Similar observations of water quality during the filter cycle have been presented byRobeck, Dostal, and Woodward (1964) during surface water treatment, shown in Fig-ures 8.17 and 8.18. During strong floc conditions, the filtrate quality was nearly con-stant after the initial improvement period (Figure 8.17). During weak floc conditions,however, the terminal turbidity breakthrough was rather abrupt (Figure 8.18) andoccurred at low head loss. Figures 8.17 and 8.18 represent the two most typical patterns
GRANULAR BED AND PRECOAT FILTRATION 8.39

of filtrate quality observed. In some cases, however, the filtrate quality may improvethroughout the run, and no terminal breakthrough is observed (Cleasby, 1969b).
The Value of Filtering-to-Waste
The initial water quality degradation period also has been demonstrated in studiesusing Giardia cysts (Logsdon et al., 1981). Giardia muris was used as a model for thehuman pathogen, Giardia lamblia. G. muris was spiked into a low turbidity surfacewater, coagulated with alum alone or alum and nonionic polymer, flocculated, andfiltered through granular media filters. Initial concentration of cysts in the filtratewere from 10 to 25 times higher than those following the initial improvement period,even though the turbidity improved less than 0.1 ntu during the period.
In conventional water treatment practice, passage of turbidity during the initialdegradation and improvement (i.e., “ripening”) period is small when averaged overthe entire filter run, and compared to the total turbidity passed during the run. Formany years, little attention was paid to the impact of the initial period on the averagefiltrate quality, on the assumption that disinfection would control any pathogenicmicroorganisms that passed through the filters. Consequently, based on this assump-tion, the early practice of filtering-to-waste at the beginning of the filter cycle waslargely abandoned. However, there is renewed interest in filtering-to-waste because of
8.40 CHAPTER EIGHT
FIGURE 8.15 Initial effluent improvement.After water in filter has been displaced, turbidity dropsto minimum. Numbers by curves indicate filtration rate in gallons per minute per square foot.(Source: J. L. Cleasby and E. R. Baumann, “Selection of Sand Filtration Rates,” Jour. AWWA, 54(5)May 1962: 579.)
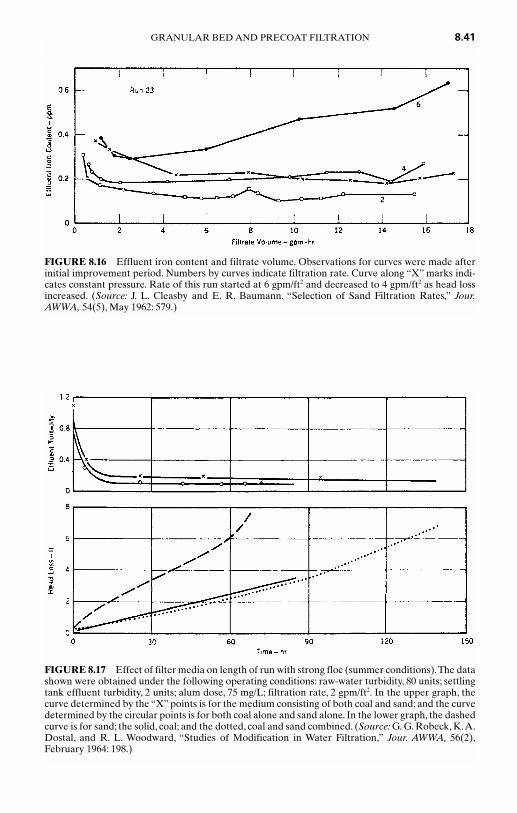
GRANULAR BED AND PRECOAT FILTRATION 8.41
FIGURE 8.16 Effluent iron content and filtrate volume. Observations for curves were made afterinitial improvement period. Numbers by curves indicate filtration rate. Curve along “X” marks indi-cates constant pressure. Rate of this run started at 6 gpm/ft2 and decreased to 4 gpm/ft2 as head lossincreased. (Source: J. L. Cleasby and E. R. Baumann, “Selection of Sand Filtration Rates,” Jour.AWWA, 54(5), May 1962: 579.)
FIGURE 8.17 Effect of filter media on length of run with strong floc (summer conditions).The datashown were obtained under the following operating conditions: raw-water turbidity, 80 units; settlingtank effluent turbidity, 2 units; alum dose, 75 mg/L; filtration rate, 2 gpm/ft2. In the upper graph, thecurve determined by the “X” points is for the medium consisting of both coal and sand; and the curvedetermined by the circular points is for both coal alone and sand alone. In the lower graph, the dashedcurve is for sand; the solid, coal; and the dotted, coal and sand combined. (Source: G. G. Robeck, K.A.Dostal, and R. L. Woodward, “Studies of Modification in Water Filtration,” Jour. AWWA, 56(2),February 1964: 198.)

increasing outbreaks of Giardiasis and Cryptosporidiosis caused by protozoan cyststhat are very resistant to chlorine disinfection (Hibler et al., 1987; Kramer et al., 1996).Provision of the “filter-to-waste period” is now strongly encouraged because of thelow infective dose for these protozoan pathogens (Kirner, Littler, and Angelo, 1978;Kramer et al., 1996). (See Chapters 2 and 18.)
The Value of Continuous Turbidity Monitoring and Particle Counting
From the foregoing discussion of effluent quality patterns, the value of providingcontinuous monitoring of the filtrate quality of each filter becomes apparent. It isuseful to observe the length of the initial improvement period to guide the durationof filtering-to-waste. It is also useful to detect the onset of terminal breakthrough.The cycle could then be terminated at the onset of breakthrough, even if the headloss has not reached the normal maximum available at the plant.This would be espe-cially important if the passage of Giardia cysts, Cryptosporidium oocysts, viruses, orasbestos fibers are of concern, because increases in turbidity indicate simultaneousincreases in other particulates, often of larger relative magnitude than the increasesin turbidity. For example, Figures 8.19 and 8.20 indicate increases in viruses andasbestos fibers, coinciding with breakthrough in turbidity (Robeck, Dostal, andWoodward, 1964; Logsdon, Symons, and Sorg, 1981). In Figure 8.20 the fiber countincreases much more than the turbidity. Similar evidence in Figure 8.21 shows thechange in concentration of Giardia cysts during a turbidity breakthrough and fol-
8.42 CHAPTER EIGHT
FIGURE 8.18 Effect of filter media on length of run with weak floc.The data shown were obtainedunder the following operating conditions: source-water turbidity, approximately 20 units; alum dose,100 mg/L; activated carbon, 2 mg/L; filtration rate, 2 gpm/ft2; settling tank effluent turbidity, 15 units.In the upper graph, the curve determined by the “X” points is for coal; that by open circles, sand; andthat by solid circles, coal and sand. In the lower graph, the dashed curve is for sand; the dotted, coaland sand; and the solid, coal. (Source: G. G. Robeck, K. A. Dostal, and R. L. Woodward, “Studies ofModification in Water Filtration,” Jour. AWWA, 56(2), February 1964: 198.)

lowing the backwash operation (Logsdon et al., 1985). In this case a threefoldchange in turbidity corresponds to a 30- to 40-fold change in concentration of cysts.
Large numbers of very small particles can exist in filtered water with turbidity lessthan 1 ntu. This has been demonstrated for asbestos fibers (Logsdon and Symons1977), bacteria (O’Connor et al., 1984), Giardia cysts (Logsdon et al., 1981) and Cryp-tosporidium oocysts (Patania et al., 1995). Because small changes in filtered waterturbidity can be accompanied by large increases in microscopic particles, water utili-ties are increasingly applying on-line particle counters to monitor filtered water qual-ity. Particle counters can detect increases in particle concentration that may not beassociated with increases in filtrate turbidity, and so can provide plant operators withearly warning of incipient turbidity breakthrough. This is especially true for low tur-bidity waters below 0.1 ntu because the turbidity measurement is reaching its lowerlimit of detection.The use of particle counting can improve monitoring and control ofthe filtration process.
The Importance of Adequate Pretreatment
Adequate and continuous pretreatment is absolutely essential to producing good fil-trate. Any interruption of good pretreatment results in almost immediate deteriora-
GRANULAR BED AND PRECOAT FILTRATION 8.43
FIGURE 8.19 Virus and floc breakthrough at highrate on coarse sand or coal. The curves with solid cir-cles represent sand filters. Those with open circles,coal plus sand. The filtration rate was 6 gpm/ft2, withblended water containing an alum dose of 10 mg/L.The virus load was 8400 PFU/mL; turbidity load, 10Jackson units. (Source: G. G. Robeck, K. A. Dostal,and R. L. Woodward, “Studies of Modification inWater Filtration,” Jour.AWWA, 56(2), February 1964:198.)
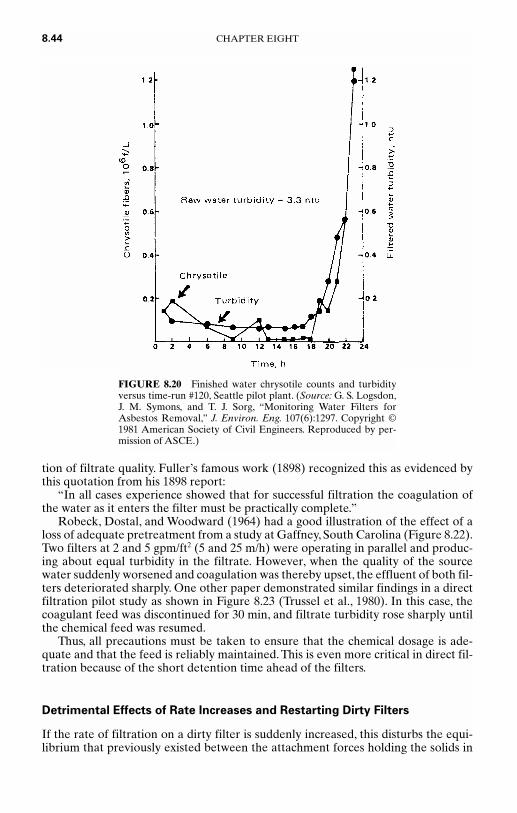
tion of filtrate quality. Fuller’s famous work (1898) recognized this as evidenced bythis quotation from his 1898 report:
“In all cases experience showed that for successful filtration the coagulation ofthe water as it enters the filter must be practically complete.”
Robeck, Dostal, and Woodward (1964) had a good illustration of the effect of aloss of adequate pretreatment from a study at Gaffney, South Carolina (Figure 8.22).Two filters at 2 and 5 gpm/ft2 (5 and 25 m/h) were operating in parallel and produc-ing about equal turbidity in the filtrate. However, when the quality of the sourcewater suddenly worsened and coagulation was thereby upset, the effluent of both fil-ters deteriorated sharply. One other paper demonstrated similar findings in a directfiltration pilot study as shown in Figure 8.23 (Trussel et al., 1980). In this case, thecoagulant feed was discontinued for 30 min, and filtrate turbidity rose sharply untilthe chemical feed was resumed.
Thus, all precautions must be taken to ensure that the chemical dosage is ade-quate and that the feed is reliably maintained. This is even more critical in direct fil-tration because of the short detention time ahead of the filters.
Detrimental Effects of Rate Increases and Restarting Dirty Filters
If the rate of filtration on a dirty filter is suddenly increased, this disturbs the equi-librium that previously existed between the attachment forces holding the solids in
8.44 CHAPTER EIGHT
FIGURE 8.20 Finished water chrysotile counts and turbidityversus time-run #120, Seattle pilot plant. (Source: G. S. Logsdon,J. M. Symons, and T. J. Sorg, “Monitoring Water Filters forAsbestos Removal,” J. Environ. Eng. 107(6):1297. Copyright ©1981 American Society of Civil Engineers. Reproduced by per-mission of ASCE.)
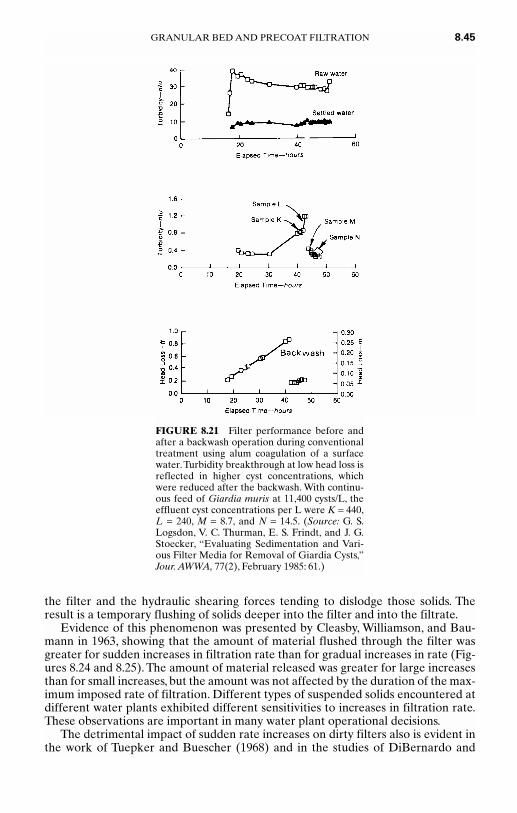
the filter and the hydraulic shearing forces tending to dislodge those solids. Theresult is a temporary flushing of solids deeper into the filter and into the filtrate.
Evidence of this phenomenon was presented by Cleasby, Williamson, and Bau-mann in 1963, showing that the amount of material flushed through the filter wasgreater for sudden increases in filtration rate than for gradual increases in rate (Fig-ures 8.24 and 8.25). The amount of material released was greater for large increasesthan for small increases, but the amount was not affected by the duration of the max-imum imposed rate of filtration. Different types of suspended solids encountered atdifferent water plants exhibited different sensitivities to increases in filtration rate.These observations are important in many water plant operational decisions.
The detrimental impact of sudden rate increases on dirty filters also is evident inthe work of Tuepker and Buescher (1968) and in the studies of DiBernardo and
GRANULAR BED AND PRECOAT FILTRATION 8.45
FIGURE 8.21 Filter performance before andafter a backwash operation during conventionaltreatment using alum coagulation of a surfacewater.Turbidity breakthrough at low head loss isreflected in higher cyst concentrations, whichwere reduced after the backwash. With continu-ous feed of Giardia muris at 11,400 cysts/L, theeffluent cyst concentrations per L were K = 440,L = 240, M = 8.7, and N = 14.5. (Source: G. S.Logsdon, V. C. Thurman, E. S. Frindt, and J. G.Stoecker, “Evaluating Sedimentation and Vari-ous Filter Media for Removal of Giardia Cysts,”Jour. AWWA, 77(2), February 1985: 61.)

Cleasby (1980). Filtration rate increases on dirty filters should be avoided or madegradually (over 10 min).
Studies by Logsdon et al. (1981) showed similar effects when the filtration ratewas suddenly increased from 4.5 to 11 gpm/ft2 (11 to 27 m/h). Turbidity in the efflu-ent rose sharply and then rapidly declined. Concentrations of G. muris cyst followedthe turbidity trends. “A fourfold increase in turbidity was accompanied by a 25-foldincrease in the cyst concentration in the filtered water.” The same study demon-strated the detrimental effect of loss of coagulant feed, and of extending the filterrun into the period of terminal breakthrough. In both instances, large increases inconcentration of cysts were observed in the effluent.
Similar disturbances sometimes occur when starting up a dirty filter after briefidle periods, as evident in Figure 8.26. In the investigation of the causes of a Cryp-tosporidiosis outbreak in Georgia, Logsdon, Mason, and Stanley (1990) reportedthat restarting dirty filters resulted in filtered water turbidities of 0.5 to 5 ntu thatpersisted for 1 to 1.5 hours. In contrast, filters operated continuously after back-washing had low turbidities of 0.1 to 0.2 ntu. As a result, it was recommended thatdirty filters should not be restarted.
8.46 CHAPTER EIGHT
FIGURE 8.22 Turbidity values at filtration rates of 2 and 5 gpm/ft2. In theupper graph, the dotted curve is for 5 gpm/ft2; the solid, 2 gpm/ft2. In the lowergraph, the numbers at the top are the raw-water turbidity values at the timeshown during the run; the dashed curve is for filter influent; the dotted for filtereffluent at 2 gpm/ft2; and the solid for filter effluent at 5 gpm/ft2. (Source: G. G.Robeck, K. A. Dostal, and R. L. Woodward, “Studies of Modification in WaterFiltration,” Jour. AWWA, 56(2), February 1964: 198.)

Filters with automatic rate controllers sometimes exceed the target rate on start-up and disturb previously deposited solids.Thus, systems that provide no mechanicaleffluent rate manipulation are attractive (Dibernardo and Cleasby, 1980; Cleasby,1969a). Nonmechanical filter control systems will be discussed later.
The Detrimental Effects of Negative Head
Some filter arrangements and operating practices can result in pressures belowatmospheric pressure (i.e., negative head) in the filter medium during a filter cycle.This can occur in gravity filters when the total head loss down to any point in the fil-ter medium exceeds the static head (i.e., water depth) down to that point. Negativehead is more likely to occur if gravity filters are operated with low submergence ofthe medium, and if the filter effluent exits to the clearwell at an elevation below thetop elevation of the filter medium.
Negative head is undesirable because dissolved gases in the influent water may bereleased in the zone of negative pressure, causing gas bubbles to accumulate (a processcalled air binding) during the filter cycle. Such accumulations of gas lead to more rapiddevelopment of head loss and poorer quality of filtrate because the flow velocity ishigher around the gas pockets. Negative head can be completely avoided by terminat-ing the filter run before the total head loss reaches the submergence depth of themedium, or by causing the effluent to exit at or above the surface of the filter medium.
Head Loss Development During a Filter Run
The rate of increase in head loss during the filter run is roughly proportional to therate of solids capture by the filter. Assuming essentially complete capture of incom-ing solids, the head loss will develop in proportion to the filtration rate, V, and the
GRANULAR BED AND PRECOAT FILTRATION 8.47
FIGURE 8.23 Influence of loss of chemical feed onfilter performance. Direct filtration; no flocculation;15 m/h (6 gpm/ft2); influent turbidity, 8.4 TU; chemicalfeed, 2 mg/L polymer and 2 mg/L alum (shut down for30 min 2 h into operation). (Source: R. R. Trussell, A.R. Trussell, J. S. Lang, and C. H. Tate, “Recent Devel-opment in Filtration System Design,” Jour. AWWA,72(12), December 1980: 705.)
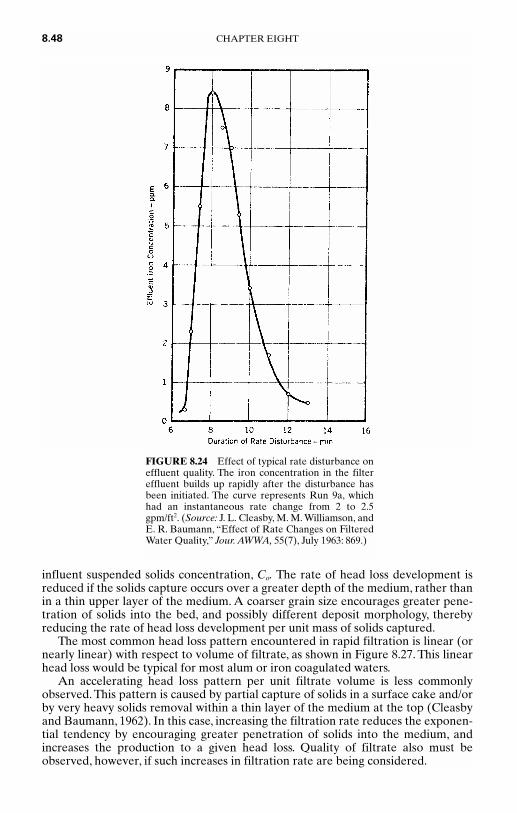
influent suspended solids concentration, Co. The rate of head loss development isreduced if the solids capture occurs over a greater depth of the medium, rather thanin a thin upper layer of the medium. A coarser grain size encourages greater pene-tration of solids into the bed, and possibly different deposit morphology, therebyreducing the rate of head loss development per unit mass of solids captured.
The most common head loss pattern encountered in rapid filtration is linear (ornearly linear) with respect to volume of filtrate, as shown in Figure 8.27. This linearhead loss would be typical for most alum or iron coagulated waters.
An accelerating head loss pattern per unit filtrate volume is less commonlyobserved. This pattern is caused by partial capture of solids in a surface cake and/orby very heavy solids removal within a thin layer of the medium at the top (Cleasbyand Baumann, 1962). In this case, increasing the filtration rate reduces the exponen-tial tendency by encouraging greater penetration of solids into the medium, andincreases the production to a given head loss. Quality of filtrate also must beobserved, however, if such increases in filtration rate are being considered.
8.48 CHAPTER EIGHT
FIGURE 8.24 Effect of typical rate disturbance oneffluent quality. The iron concentration in the filtereffluent builds up rapidly after the disturbance hasbeen initiated. The curve represents Run 9a, whichhad an instantaneous rate change from 2 to 2.5gpm/ft2. (Source: J. L. Cleasby, M. M. Williamson, andE. R. Baumann, “Effect of Rate Changes on FilteredWater Quality,” Jour. AWWA, 55(7), July 1963: 869.)
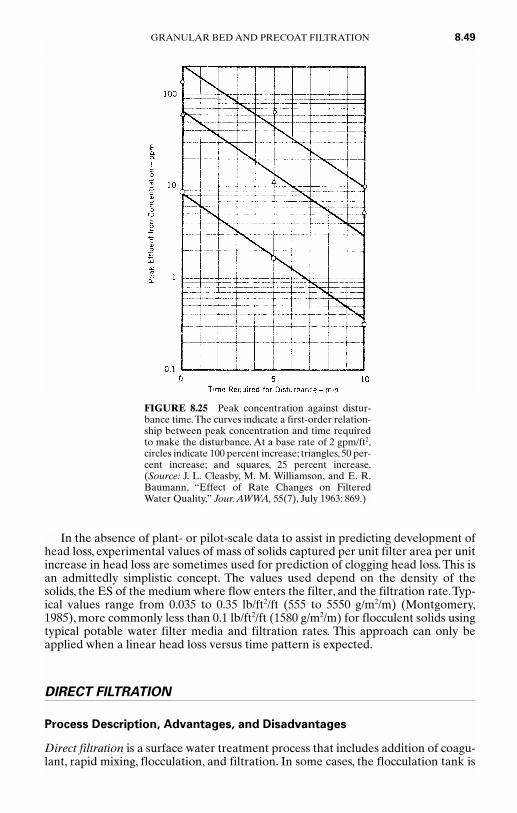
In the absence of plant- or pilot-scale data to assist in predicting development ofhead loss, experimental values of mass of solids captured per unit filter area per unitincrease in head loss are sometimes used for prediction of clogging head loss. This isan admittedly simplistic concept. The values used depend on the density of thesolids, the ES of the medium where flow enters the filter, and the filtration rate.Typ-ical values range from 0.035 to 0.35 lb/ft2/ft (555 to 5550 g/m2/m) (Montgomery,1985), more commonly less than 0.1 lb/ft2/ft (1580 g/m2/m) for flocculent solids usingtypical potable water filter media and filtration rates. This approach can only beapplied when a linear head loss versus time pattern is expected.
DIRECT FILTRATION
Process Description, Advantages, and Disadvantages
Direct filtration is a surface water treatment process that includes addition of coagu-lant, rapid mixing, flocculation, and filtration. In some cases, the flocculation tank is
GRANULAR BED AND PRECOAT FILTRATION 8.49
FIGURE 8.25 Peak concentration against distur-bance time.The curves indicate a first-order relation-ship between peak concentration and time requiredto make the disturbance. At a base rate of 2 gpm/ft2,circles indicate 100 percent increase; triangles, 50 per-cent increase; and squares, 25 percent increase.(Source: J. L. Cleasby, M. M. Williamson, and E. R.Baumann, “Effect of Rate Changes on FilteredWater Quality,” Jour. AWWA, 55(7), July 1963: 869.)

omitted and the process is referred to as in-line filtration, with flocculation occurringin the filter itself.
The use of direct filtration for good quality, low-color, surface waters is increasingbecause it has several advantages over conventional treatment for such waters. Capi-tal costs are lower because no sedimentation tank is required. Lower coagulantdosages are generally used in direct filtration with the goal of forming a pinpoint-sizedfloc that is filterable, rather than a large settleable floc. Therefore, direct filtrationresults in lower chemical costs compared to conventional treatment, and lower sludgeproduction, resulting in lower costs for sludge treatment and disposal. Direct filtrationalso results in lower operation and maintenance costs because the sedimentation tank(and sometimes the flocculation tank) need not be powered or maintained.
Several disadvantages to direct filtration exist, however. It cannot handle watersthat are high in turbidity and/or color. Less response time is available for the opera-tor to respond to changes in source water quality, and less detention time is availablefor controlling seasonal tastes and odors.
Instrumentation is very important for automatic control of a direct filtrationplant. Monitoring of source and finished water quality are needed to alert the oper-ator to changes, and a fail-safe plant shutdown mode is desirable in the event the fin-ished water does not meet treatment goals. If taste and odor episodes are expected,
8.50 CHAPTER EIGHT
FIGURE 8.26 Influence of stop-start on filter per-formance. Dual media; 15 m/h (6 gpm/ft2); influent par-ticles (≥2.5 µm), 2000 particulates/mL; polymer,1 mg/L; alum, 4 mg/L. (Source: R. R. Trussell, A. R.Trussell, J. S. Lang, and C. H. Tate, “Recent Develop-ment in Filtration System Design,” Jour. AWWA,72(12), December 1980: 705.)

a pretreatment or contact basin may be used to provide the needed contact timewith powdered activated carbon or oxidizing chemicals (Conley and Pitman, 1960b).
Appropriate Source Waters for Direct Filtration
The desire to use direct filtration has prompted a number of efforts to define accept-able source waters for the process (Culp, 1977).The key issues in determining appro-priate waters for direct filtration are the type and dosage of coagulants needed toachieve desired quality of filtrate as demonstrated by pilot or full-scale observations.Hutchison (1976) suggested that if alum is the primary coagulant, 12 mg/L of alum(Al2(SO4)314H2O) on a continuous basis would yield 16- to 20-h filter runs at 5 gpm/ft2 (12 m/h).This was considered sufficiently long to limit backwash water vol-ume to 4 percent of the product.Waters with up to 25 color units were considered assuitable candidates for direct filtration, with partial substitution of polymer foralum. Hutchison also suggested that diatom levels from 1000 to 2000 areal standardunits per mL (asu/mL) required use of coarser anthracite and more frequent use ofpolymer to prevent breakthrough. One asu is 20 × 20 µm or 400 (µm)2. Anthracitewith 1.5-mm ES could handle diatoms of 2500 asu/mL and produce 12-hour runs at5 gpm/ft2 (12 m/h).
GRANULAR BED AND PRECOAT FILTRATION 8.51
FIGURE 8.27 Total head loss and filtrate volume. No optimum-rate tendency appears. Uncon-trolled run (along “X” marks) started at 6 gpm/ft2 and was allowed to decrease in rate as head lossincreased. (Source: J. L. Cleasby, and E. R. Baumann, “Selection of Sand Filtration Rates,” Jour.AWWA, 54(5), May 1962: 579.)

Wagner and Hudson (1982) suggested the use of jar tests and filtration throughstandard laboratory filter paper as a screening technique to select appropriatewaters for direct filtration. Waters requiring more than 15 mg/L of alum (as filteralum) to produce an acceptable quality of filtrate were doubtful candidates fordirect filtration. Waters requiring only 6 to 7 mg/L of alum and a small dose of poly-mer were considered favorable candidates. If the results of this bench-scale screen-ing test are favorable, then pilot plant tests are needed to determine full-scale designparameters.
An AWWA report on direct filtration (Committee Report, 1980) defined a watermeeting the following criteria as a “perfect candidate” for direct filtration:
Color < 40 color unitsTurbidity < 5 ntuAlgae < 2000 asu/mLIron < 0.3 mg/LManganese < 0.05 mg/L
However, the proposed “enhanced coagulation” approach to controlling DBP pre-cursor materials tends to make these criteria obsolete (see Chapter 6).
Cleasby et al. (1984) considered the AWWA committee guidelines acceptableexcept for turbidity, which was considered too low. During seasons with low algae,they suggested turbidity limits of 12 ntu when using alum alone, or 16 ntu when usingcationic polymer alone. During seasons with high algae, they suggested limits of 7 ntu using alum alone and 11 ntu using cationic polymer alone. Best performancewas achieved during seasons with low algae with alum dosages between 5 and 10mg/L. During seasons with high algae, dosages up to 20 mg/L were attempted withonly moderate success, and with runs as short as 12 h at 3 gpm/ft2 (7.3 m/h).
Chemical Pretreatment for Direct Filtration
The selection of the coagulant dosage for direct filtration is best determined by full-length filter cycles using pilot or full-scale filters. Jar tests are often misleadingbecause the goal in direct filtration is to form small pinpoint floc that are barely vis-ible but that will filter effectively.Thus, the usual criteria used to judge jar test obser-vations, such as formation of a large floc or a clear supernatant liquor, after settling,are not appropriate for direct filtration. The jar test and filter paper filtration tech-nique (Wagner and Hudson, 1982) is somewhat better, but it provides no informa-tion on terminal breakthrough behavior or rate of generation of head loss.Substitution of a miniature granular bed filter for the filter paper (Bower, Bowers,and Newkirk, 1982) suffers from similar weaknesses. Kreissl, Robeck, and Som-merville (1968) demonstrated that a clean filter could be operated at very high ratesto simulate the hydraulic shear that would exist in the more clogged layers of the fil-ter late in the filter run. This would predict whether the chemical dosage would besuccessful through the full length of the filter run. In spite of these various tech-niques of using bench or pilot tests to select chemical dosages, the most commonapproach involves confirmation of the selected dosage with pilot scale or full-scalefilter runs of full duration at the design filtration rate.
When using alum or iron salts alone, the optimum dosage of coagulant for directfiltration is the lowest dosage that will achieve filtrate quality goals. An optimumdosage is normally not observed based on filtrate quality alone. Rather, as the
8.52 CHAPTER EIGHT

dosage is increased, the filtrate quality gets marginally better—but the head lossdevelops at a higher rate and early breakthrough is encouraged (Cleasby et al.,1984). One advantage of alum or iron coagulants is that the dosage is less sensitiveto the quality of the source water.
When using cationic polymer alone as a primary coagulant, a distinct optimumdose may be found that produces the best-quality filtrate. In pilot studies, one methodof detecting whether a particular dosage is above or below the optimum is to shut offthe polymer feed for a few minutes. If the filtrate improves momentarily, the priordose is excessive. If the filtrate deteriorates immediately, the prior dose was at orbelow optimum (Cleasby et al., 1984).
A number of studies have reported successful use of alum and cationic polymerssimultaneously.Typical dosages are 2 to 10 mg/L of alum plus about 0.2 to 2 mg/L ofcationic polymer (Cleasby et al., 1984; McBride et al., 1977;Tate, Lang, and Hutchin-son, 1977; Monscvitz et al., 1978).These dosages are drawn from pilot and plant-scaleexperience.
The impact of flocculation on direct filtration has been the subject of several stud-ies that have been summarized by Cleasby et al. (1984). These studies can assist theoperator in deciding whether flocculation should be provided in direct filtration.Comparing operation with and without flocculation, the provision of flocculation wasgenerally found to (1) improve filtrate quality before breakthrough, (2) shorten theinitial improvement period of the filter cycle, and (3) reduce the rate of head lossdevelopment, but (4) result in earlier breakthrough. Even though head loss isreduced, the length of the filter run may be shortened because of early breakthrough.
The benefits or detriments of providing flocculation are best determined on acase-by-case basis by pilot or full-scale studies. In some cases, flocculation has beenfound to be of no benefit (Al-Ani et al., 1986). Nevertheless, current practice usuallyincludes a short flocculation period in direct-filtration plants, typically about 10 minof high-energy flocculation at a velocity gradient (G) of up to 100 sec−1, although therange of flocculation detention times in existing plants has been very great, rangingfrom no flocculation up to 60 min of flocculation (Letterman and Logsdon, 1976).
In-line filtration is appropriate for source waters that are consistently very low inturbidity and color. If flocculation were provided for such waters, long times of floc-culation would be required because of the poor opportunity for collision of particles.For example, flocculation was added to the in-line filtration plant at Las Vegas whenthe capacity was increased from 200 mgd to 400 mgd (Monscvitz et al., 1978), but 30min of detention was needed for this excellent source water. Therefore, waters thatare low in turbidity and color are more economically treated by the addition of coag-ulant and an extended rapid mix of three to five min to achieve only the initial stagesof particle aggregation before filtration. Few in-line plants are being built, however,because flocculation adds flexibility to the plant operation. A bypass around theflocculator can be provided for contingencies.
Filter Details for Direct Filtration
Two summaries of direct filtration (Committee Report, 1980; Letterman and Logs-don, 1976) indicated filtration rates of full-scale operating plants between 1 and 6 gpm/ft2 (2.4 and 15 m/h). Direct-filtration pilot studies at three locations showed,however, that effluent turbidity was nearly constant over the range from 2 to 12 gpm/ft2 (5 to 29 m/h) and in one case as high as 18 gpm/ft2 (44 m/h) (Trussel et al.,1980). In these studies both alum and cationic polymer were used for chemical pre-treatment. Dual media and deep beds of coarse sand were compared.
GRANULAR BED AND PRECOAT FILTRATION 8.53

An unusual direct-filtration plant is operated by the Los Angeles Department ofWater and Power to treat water from the Los Angeles Aqueduct. The plant designwas based on extensive pilot studies that led to the choice of deep beds of anthracite(6 ft, 1.8 m) with an ES of 1.5 mm and UC < 1.4. The design filtration rate is 13.5 gpm/ft2 (33 m/h). Pretreatment includes ozone to assist coagulation with ferricchloride and cationic polymer, and flocculation is provided before filtration. The fil-ters are backwashed by air alone first at 4 cfm/ft2 (1.2 m/min), followed by air pluswater at 10 gpm/ft2 (24 m/h).The air is terminated before overflow occurs to preventloss of filter medium, and the water wash is continued alone at higher rate duringoverflow (McBride and Stolarik, 1987). Some of the pilot studies were reported byTrussell et al. (1980). Certainly, this facility represents a marked departure from cur-rent direct filtration practice.
FLOW CONTROL IN FILTRATION
Why Control Is Needed
The need for some method of filter flow control has been recognized since the earlydays of potable water filtration. If no attempt is made to control flow, the filters maynot share the total plant flow in a reasonably equal manner, or sudden changes inflow rate may occur, both of which could cause filtrate quality to suffer. For that rea-son, a number of papers presenting alternative flow control systems have been pub-lished (Aultman, 1959; Baylis, 1959b; Hudson, 1959; Cleasby, 1969a; Arboleda, 1974;Arboleda-Valencia, 1985; Cleasby and DiBernardo, 1980; Cleasby, 1981; CommitteeReport, 1984).
Rate Control Systems for Gravity Filters
Filter control systems currently in use can be divided into two categories: mechani-cal control systems, and nonmechanical control systems (that achieve control by theinherent hydraulics of the operating filters). Control systems can also be classified asequal rate systems or declining rate systems, as was done by Browning (1987). Fivecontrol systems are shown in Figure 8.28, using Browning’s classification system andnomenclature:
Equal-Rate Systems
● Variable-level influent flow splitting● Proportional-level influent flow splitting● Proportional-level equal rate
Declining-Rate Systems
● Variable-level declining rate● Proportional-level declining rate
It should be noted that none of the systems are called “constant-rate filtration” sys-tems. True constant-rate filtration can only occur if the total plant flow rate is con-stant and the number of filters in service is constant. This is seldom the case. Plant
8.54 CHAPTER EIGHT
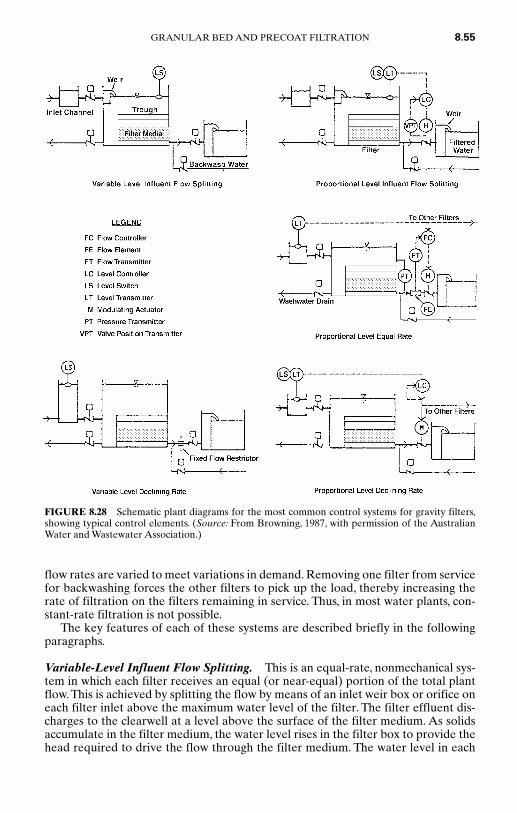
flow rates are varied to meet variations in demand. Removing one filter from servicefor backwashing forces the other filters to pick up the load, thereby increasing therate of filtration on the filters remaining in service. Thus, in most water plants, con-stant-rate filtration is not possible.
The key features of each of these systems are described briefly in the followingparagraphs.
Variable-Level Influent Flow Splitting. This is an equal-rate, nonmechanical sys-tem in which each filter receives an equal (or near-equal) portion of the total plantflow.This is achieved by splitting the flow by means of an inlet weir box or orifice oneach filter inlet above the maximum water level of the filter. The filter effluent dis-charges to the clearwell at a level above the surface of the filter medium. As solidsaccumulate in the filter medium, the water level rises in the filter box to provide thehead required to drive the flow through the filter medium. The water level in each
GRANULAR BED AND PRECOAT FILTRATION 8.55
FIGURE 8.28 Schematic plant diagrams for the most common control systems for gravity filters,showing typical control elements. (Source: From Browning, 1987, with permission of the AustralianWater and Wastewater Association.)
filter box is different and depends on the extent to which the filter medium isclogged. When the water level in a filter box rises to some selected maximum level,that filter must be backwashed.
No instrumentation is required for flow rate or head loss measurement on theindividual filters. This is the simplest system for operators because the head loss isclearly evident merely from observing the water level in the filter box, and there isno control equipment or instrumentation to maintain.
Proportional-Level Influent Flow Splitting. This is an equal-rate mechanical sys-tem in which flow control occurs by inlet flow splitting as in the prior system.A flow-splitting weir or orifice at the inlet of each filter is located above the operating waterlevel of the filter. However, each filter requires a level transmitter, a level controller,a modulating valve, and a head-loss instrument.The modulating valve acts to controlthe water level in the associated filter, not as a flow-rate controller. The degree ofopening of the effluent modulating valves is proportional to the water level in theassociated filter, being closed when the level is at the bottom of a preselected waterlevel band, and open when the water level is at the top of the band.
Head loss is monitored for backwash initiation. No flow-measurement instru-mentation is required for the individual filters.
Proportional-Level Equal Rate. This has been the most common equal-ratemechanical control system. It splits the total plant flow equally among the operatingfilters, and maintains the water level in the influent channel within a preselectedband. Each filter requires a flow meter, a flow controller, a modulating control valve,and a head-loss instrument. A single level transmitter in the inlet channel, serving abank of several filters, sends an equal signal to the flow controller in each filter thatis proportional to the water level within the band, and represents the required flow.The flow controllers adjust the modulating valves to make measured flow matchrequired flow.
When everything is working properly, flow rate through each filter will be equal.However, equipment malfunction often results in unequal flow that often goesundetected. Head loss is monitored for backwash initiation.
Variable-Level Declining Rate. This is a declining-rate nonmechanical system.Flow enters the filter below the normal water level in each filter and discharges tothe clearwell above the level of the filter medium. Because the inlet to the filters isbelow the normal water level in each filter, all filters connected by a common inletchannel or pipe operate at approximately the same water level and thus have thesame total head loss available to the effluent weir level at any instant.Therefore, thecleanest filter operates at the highest filtration rate, and the dirtiest filter operates atthe lowest filtration rate.
As solids accumulate in the filter media, the water level rises in all connected fil-ters to provide the head required to drive the flow through the filter media. Waterlevel is monitored at a single location for backwash initiation. In some plants, back-wash is initiated when the filtration rate of the dirtiest filter drops to a preselectedlevel, or on a time-interval basis. The filtration rate of each filter declines in a step-wise fashion after each backwash. As a clean (backwashed) filter is returned to ser-vice, it assumes the highest rate of filtration.
A fixed-flow restrictor (orifice plate or fixed-position valve) is provided for eachfilter to limit the starting rate on a clean filter. No instrumentation for flow rate orhead loss measurement is required on individual filters. However, operating person-nel prefer to have some flow-rate indication to help them understand the system and
8.56 CHAPTER EIGHT

for diagnostic purposes. Less total filter system head loss must be provided becausehead consumed in turbulent head losses early in the filter run is reallocated to clog-ging head loss as the filtration rate declines (DiBernardo and Cleasby, 1980; Corn-well et al., 1991).
Proportional-Level Declining Rate. Browning (1987) suggested one additionalflow-control system combining the features of declining rate with proportional levelcontrol from the level in the filter inlet channel. As in the preceding system, sub-merged filter inlets result in a common water level in all filters. However, in this sys-tem a modulating valve in the effluent of each filter is controlled by the water levelin the inlet channel. All valves receive the same set point, and are fully closed whenwater level in the channel is at the bottom of the band and are at their maximum uti-lized opening when the water level is at the top of the band. This system functionslike a variable declining rate system, but with filter water level controlled in a pre-selected band width. Browning claimed that the depth of the filter box could bereduced with this system, as compared with the previous declining-rate system.
Common Elements of Filter Control Systems
Some common elements of the various rate-control systems should be recognized.The total filter system head provided to operate the gravity filter is the vertical dis-tance from the water level (hydraulic grade line) in the filter inlet conduit to thewater level at the downstream control point. The downstream control point can bean overflow weir to the clearwell or an upturned elbow in the clearwell, or the levelin the clearwell if it is higher.
If the downstream control point is located above the top surface of the medium,no possibility of having pressures below atmospheric pressure (i.e., negative head)exists anywhere within the filter medium or underdrain system because the staticwater level is above the surface of the medium. Also, no possibility of accidentallyallowing the filter water level to drop below the top surface of the medium (i.e., par-tially dewatering the filter medium) exists. These advantages are not obtained with-out cost, however, because all of the needed head to operate the filter must beplaced above the downstream control level, and this means a deeper filter box.
The three equal-rate systems have the common characteristic that the entire fil-ter system operating head provided, which is essentially constant, is consumedthroughout the filter run. The head that is not utilized by the dirty filter medium iswasted either in the modulating control valve of the mechanical systems, or in freefall into the filter box for the influent flow-splitting system. The declining-rate sys-tems have a lower total filter system head requirement in the plant hydraulic profilebecause the total head is reallocated as the filter cycle proceeds as described earlier.
The two nonmechanical systems (i.e., without proportional level control) havethe inherent advantage that sudden changes in filtration rate cannot be imposed onthe filter. If the total plant flow is increased or a filter is removed from service, thefilters can only pick up the load by changing water level to generate the head neededto accommodate the increased flow. This changing of water level takes time, so thatthe change in filtration occurs slowly and smoothly without mechanical devices.
Slow, smooth changes in filtration rate are also possible in properly designed pro-portional-level mechanical control systems. The rate-of-change of the modulatingcontrol valve position should be proportional to the divergence of the measuredvariable (flow rate or level) from the desired value. The proportional level controlband should be substantial. The drive for the control valve should be an electric
GRANULAR BED AND PRECOAT FILTRATION 8.57

motor rather than a pneumatic or hydraulic valve drive, because the latter two drivetypes are prone to sticking, overshooting, and hunting problems as they age. Noindustry standards for filter control systems are available, so that some systems donot have all of the attributes listed above.
Choice of the Appropriate Control System
With the foregoing information at hand, some generalizations about the five systemsare possible that may affect the choice of a control system to meet a specific utility’sdesired goals and needs. A particular system should be used only when conditionsare appropriate for that system.
If full automation of the plant is desired, proportional-level systems will befavored, although the two nonmechanical systems can be partially automated. If, onthe other hand, minimizing mechanical equipment and instrumentation is desired,nonmechanical systems will be favored. (This will be especially important whenequipment and repair parts must be imported to a developing country with limitedforeign exchange resources.) In small nonautomated plants with four or less filtersand with unskilled operators, the variable-level influent flow-splitting system isideal, because of its simplicity of operation. In larger, nonautomated plants, the variable-level declining-rate method may be favored, because it requires less totalfilter system head to generate equal filter cycle lengths, and because it produces bet-ter filtrate quality in some cases (DiBernardo and Cleasby, 1980). But this is notassured in all cases (Hilmoe and Cleasby, 1986; Cornwell et al., 1991).
In all of the control systems just discussed, there is legitimate concern about thepassage of protozoan cysts during the ripening phase at the beginning of the filtercycle. As discussed elsewhere, provision for a filter-to-waste mode is the best avail-able solution.
The design of variable-level declining-rate filters—including the selection of therequired total filter system head loss, and the prevention of excessive starting filtra-tion rate for a clean declining rate filter—has been presented by Cleasby (1993).
BACKWASHING OF RAPID FILTERS
Effective backwashing of rapid filters is essential to long-term successful service ofthe system. The goal of the backwashing operation is to keep the filter acceptablyclean while avoiding problems such as mudballs and filter cracks (to be discussedlater) in the filter medium.
Alternative Methods of Backwashing
The backwashing system is the most frequent source of filter failure.Therefore, select-ing the type of backwashing system and ensuring the proper design, construction, andoperation of that system are key elements in the success of a water treatment plant.Two prominent systems of backwashing currently in use are compared in Table 8.8.
Upflow Wash with Full Fluidization. The traditional backwash system in theUnited States uses an upflow water wash with full bed fluidization. Backwash wateris introduced into the bottom of the bed through the underdrain system. It should be
8.58 CHAPTER EIGHT
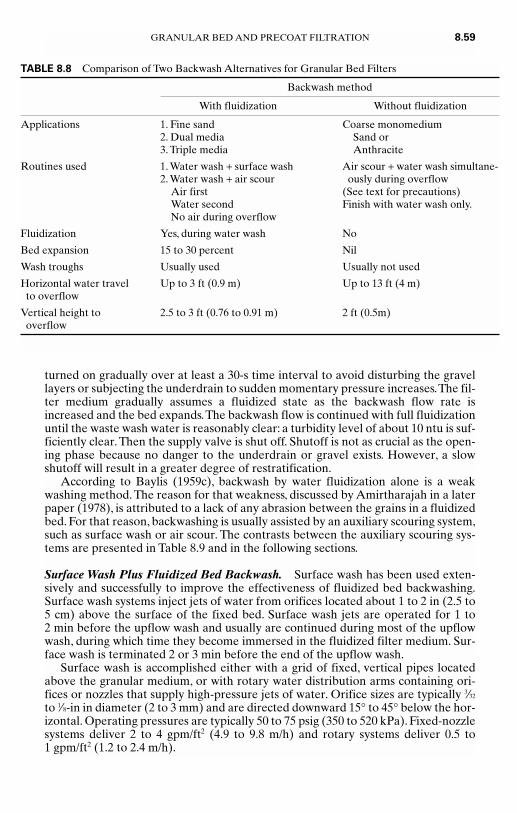
turned on gradually over at least a 30-s time interval to avoid disturbing the gravellayers or subjecting the underdrain to sudden momentary pressure increases.The fil-ter medium gradually assumes a fluidized state as the backwash flow rate isincreased and the bed expands.The backwash flow is continued with full fluidizationuntil the waste wash water is reasonably clear: a turbidity level of about 10 ntu is suf-ficiently clear. Then the supply valve is shut off. Shutoff is not as crucial as the open-ing phase because no danger to the underdrain or gravel exists. However, a slowshutoff will result in a greater degree of restratification.
According to Baylis (1959c), backwash by water fluidization alone is a weakwashing method. The reason for that weakness, discussed by Amirtharajah in a laterpaper (1978), is attributed to a lack of any abrasion between the grains in a fluidizedbed. For that reason, backwashing is usually assisted by an auxiliary scouring system,such as surface wash or air scour. The contrasts between the auxiliary scouring sys-tems are presented in Table 8.9 and in the following sections.
Surface Wash Plus Fluidized Bed Backwash. Surface wash has been used exten-sively and successfully to improve the effectiveness of fluidized bed backwashing.Surface wash systems inject jets of water from orifices located about 1 to 2 in (2.5 to5 cm) above the surface of the fixed bed. Surface wash jets are operated for 1 to 2 min before the upflow wash and usually are continued during most of the upflowwash, during which time they become immersed in the fluidized filter medium. Sur-face wash is terminated 2 or 3 min before the end of the upflow wash.
Surface wash is accomplished either with a grid of fixed, vertical pipes locatedabove the granular medium, or with rotary water distribution arms containing ori-fices or nozzles that supply high-pressure jets of water. Orifice sizes are typically 3⁄32
to 1⁄8-in in diameter (2 to 3 mm) and are directed downward 15° to 45° below the hor-izontal. Operating pressures are typically 50 to 75 psig (350 to 520 kPa). Fixed-nozzlesystems deliver 2 to 4 gpm/ft2 (4.9 to 9.8 m/h) and rotary systems deliver 0.5 to 1 gpm/ft2 (1.2 to 2.4 m/h).
GRANULAR BED AND PRECOAT FILTRATION 8.59
TABLE 8.8 Comparison of Two Backwash Alternatives for Granular Bed Filters
Backwash method
With fluidization Without fluidization
Applications 1. Fine sand Coarse monomedium2. Dual media Sand or3. Triple media Anthracite
Routines used 1. Water wash + surface wash Air scour + water wash simultane-2. Water wash + air scour ously during overflow
Air first (See text for precautions)Water second Finish with water wash only.No air during overflow
Fluidization Yes, during water wash No
Bed expansion 15 to 30 percent Nil
Wash troughs Usually used Usually not used
Horizontal water travel Up to 3 ft (0.9 m) Up to 13 ft (4 m)to overflow
Vertical height to 2.5 to 3 ft (0.76 to 0.91 m) 2 ft (0.5m)overflow
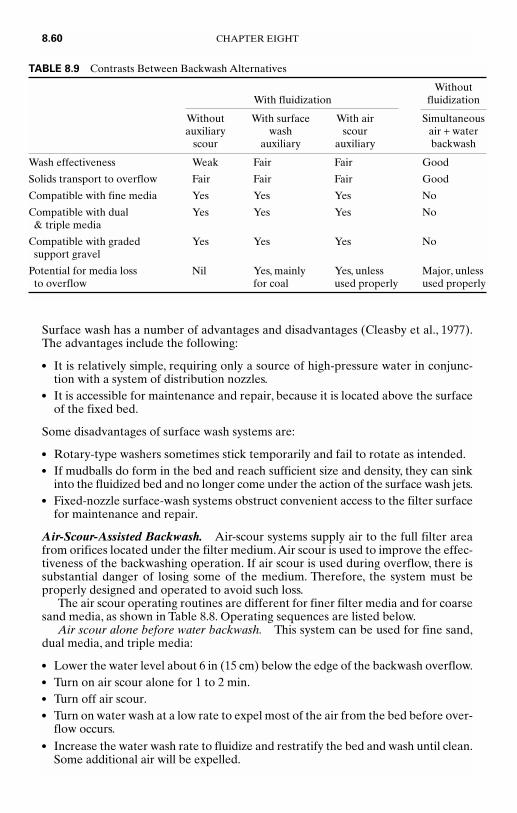
Surface wash has a number of advantages and disadvantages (Cleasby et al., 1977).The advantages include the following:
● It is relatively simple, requiring only a source of high-pressure water in conjunc-tion with a system of distribution nozzles.
● It is accessible for maintenance and repair, because it is located above the surfaceof the fixed bed.
Some disadvantages of surface wash systems are:
● Rotary-type washers sometimes stick temporarily and fail to rotate as intended.● If mudballs do form in the bed and reach sufficient size and density, they can sink
into the fluidized bed and no longer come under the action of the surface wash jets.● Fixed-nozzle surface-wash systems obstruct convenient access to the filter surface
for maintenance and repair.
Air-Scour-Assisted Backwash. Air-scour systems supply air to the full filter areafrom orifices located under the filter medium.Air scour is used to improve the effec-tiveness of the backwashing operation. If air scour is used during overflow, there issubstantial danger of losing some of the medium. Therefore, the system must beproperly designed and operated to avoid such loss.
The air scour operating routines are different for finer filter media and for coarsesand media, as shown in Table 8.8. Operating sequences are listed below.
Air scour alone before water backwash. This system can be used for fine sand,dual media, and triple media:
● Lower the water level about 6 in (15 cm) below the edge of the backwash overflow.● Turn on air scour alone for 1 to 2 min.● Turn off air scour.● Turn on water wash at a low rate to expel most of the air from the bed before over-
flow occurs.● Increase the water wash rate to fluidize and restratify the bed and wash until clean.
Some additional air will be expelled.
8.60 CHAPTER EIGHT
TABLE 8.9 Contrasts Between Backwash Alternatives
Without With fluidization fluidization
Without With surface With air Simultaneous auxiliary wash scour air + water
scour auxiliary auxiliary backwash
Wash effectiveness Weak Fair Fair Good
Solids transport to overflow Fair Fair Fair Good
Compatible with fine media Yes Yes Yes No
Compatible with dual Yes Yes Yes No& triple media
Compatible with graded Yes Yes Yes Nosupport gravel
Potential for media loss Nil Yes, mainly Yes, unless Major, unless to overflow for coal used properly used properly

Simultaneous air scour and water backwash during rising level but before over-flow. This system can be used for fine sand, dual media, triple media, and coarsemonomedium anthracite:
● Lower the water level to just above the surface of the filter medium.● Turn on air scour for 1 to 2 minutes.● Add low-rate water wash at below half the minimum fluidization velocity as water
level rises.● Shut off air scour about 6 in (15 cm) below overflow level while water wash con-
tinues. Most air will be expelled before overflow.● After overflow occurs, increase the water wash rate to fluidize and restratify the
bed, and wash until clean. Some additional air will be expelled.
Simultaneous air scour and water backwash during overflow. This system can beused for coarse (1.0 mm ES or larger) monomedium sand or anthracite. However,for anthracite, special baffled overflow troughs are essential to prevent loss ofanthracite.
● Turn on air scour.● Add water wash at below half the minimum fluidization velocity and wash with
simultaneous air and water for about 10 minutes during overflow.● Turn off air scour and continue water wash until overflow is clean.The water wash
rate is sometimes increased to hasten the cleanup but is usually kept below flu-idization velocity.
For the simultaneous wash routine just outlined, the wash is very effective eventhough the bed is never fluidized. A slow transport of the grains occurs, caused bythe simultaneous air and water flow that causes abrasion between the grains. Thisabrasion, plus high interstitial water velocities, results in an effective backwash.
Several precautions must be taken to prevent the loss of sand or anthracite whenusing simultaneous air and water wash during overflow. The water and airflow ratesare varied appropriately for the size of the filter medium. For coarse sand, backwashtroughs are not generally used, and the dirty washwater exits over a horizontal con-crete wall or central gullet, with the vertical distance from the surface of the sand tothe washwater overflow being at least 1.6 ft (0.5 m). The top edge of the overflowwall(s) is sloped downward 45° toward the filter bed, so that any sand grains that fallon the sloping wall during backwashing will reenter the filter bed (Degremont1973). Alternatively, if backwash troughs are used, specially shaped baffles can belocated around each trough to prevent the loss of filter medium (Dehab and Young,1977). Such baffled troughs are especially important when using anthracite medium.
Air-Scour Delivery Systems. Air scour may be introduced to the filter through apipe system that is completely separate from the backwash water system, or it maybe through the use of a common system of nozzles (strainers) that distribute boththe air and water, either sequentially or simultaneously. In either method of distri-bution, if the air is introduced below graded support gravel, concern exists over themovement of the finer gravel by the air—especially by air and water used concur-rently by intention or accident. This concern has led to the use of media-retainingstrainers (Figure 8.9) in some filters that eliminate the need for graded supportgravel in the filter.
Backwash Water and Air-Scour Flow Rates. Typical flow rates used in backwashpractice are summarized in Table 8.10. Hewitt and Amirtharajah (1984) did an
GRANULAR BED AND PRECOAT FILTRATION 8.61
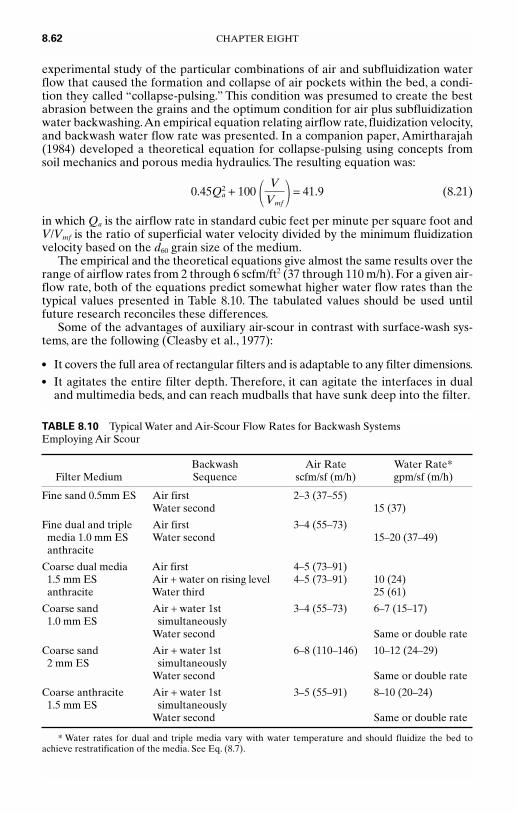
experimental study of the particular combinations of air and subfluidization waterflow that caused the formation and collapse of air pockets within the bed, a condi-tion they called “collapse-pulsing.” This condition was presumed to create the bestabrasion between the grains and the optimum condition for air plus subfluidizationwater backwashing.An empirical equation relating airflow rate, fluidization velocity,and backwash water flow rate was presented. In a companion paper, Amirtharajah(1984) developed a theoretical equation for collapse-pulsing using concepts fromsoil mechanics and porous media hydraulics. The resulting equation was:
0.45Qa2 + 100 � � = 41.9 (8.21)
in which Qa is the airflow rate in standard cubic feet per minute per square foot andV/Vmf is the ratio of superficial water velocity divided by the minimum fluidizationvelocity based on the d60 grain size of the medium.
The empirical and the theoretical equations give almost the same results over therange of airflow rates from 2 through 6 scfm/ft2 (37 through 110 m/h). For a given air-flow rate, both of the equations predict somewhat higher water flow rates than thetypical values presented in Table 8.10. The tabulated values should be used untilfuture research reconciles these differences.
Some of the advantages of auxiliary air-scour in contrast with surface-wash sys-tems, are the following (Cleasby et al., 1977):
● It covers the full area of rectangular filters and is adaptable to any filter dimensions.● It agitates the entire filter depth. Therefore, it can agitate the interfaces in dual
and multimedia beds, and can reach mudballs that have sunk deep into the filter.
V�Vmf
8.62 CHAPTER EIGHT
TABLE 8.10 Typical Water and Air-Scour Flow Rates for Backwash Systems Employing Air Scour
Backwash Air Rate Water Rate* Filter Medium Sequence scfm/sf (m/h) gpm/sf (m/h)
Fine sand 0.5mm ES Air first 2–3 (37–55)Water second 15 (37)
Fine dual and triple Air first 3–4 (55–73)media 1.0 mm ES Water second 15–20 (37–49)anthracite
Coarse dual media Air first 4–5 (73–91)1.5 mm ES Air + water on rising level 4–5 (73–91) 10 (24) anthracite Water third 25 (61)
Coarse sand Air + water 1st 3–4 (55–73) 6–7 (15–17) 1.0 mm ES simultaneously
Water second Same or double rate
Coarse sand Air + water 1st 6–8 (110–146) 10–12 (24–29) 2 mm ES simultaneously
Water second Same or double rate
Coarse anthracite Air + water 1st 3–5 (55–91) 8–10 (20–24) 1.5 mm ES simultaneously
Water second Same or double rate
* Water rates for dual and triple media vary with water temperature and should fluidize the bed toachieve restratification of the media. See Eq. (8.7).
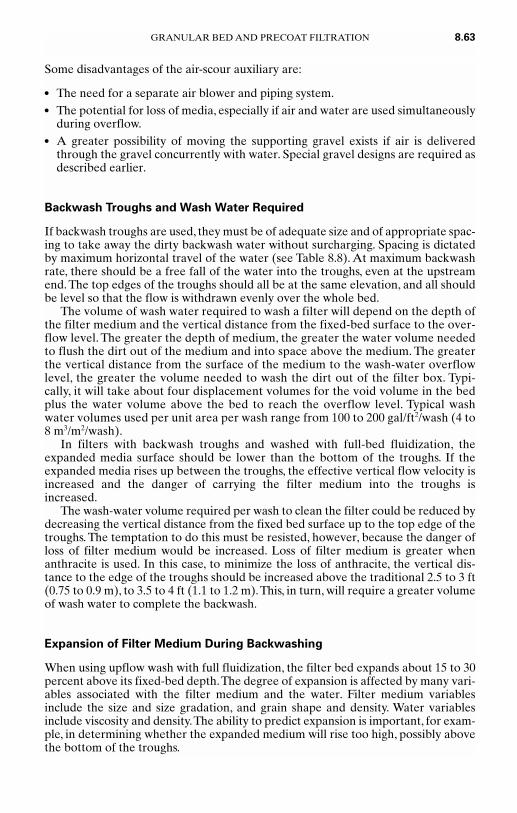
Some disadvantages of the air-scour auxiliary are:
● The need for a separate air blower and piping system.● The potential for loss of media, especially if air and water are used simultaneously
during overflow.● A greater possibility of moving the supporting gravel exists if air is delivered
through the gravel concurrently with water. Special gravel designs are required asdescribed earlier.
Backwash Troughs and Wash Water Required
If backwash troughs are used, they must be of adequate size and of appropriate spac-ing to take away the dirty backwash water without surcharging. Spacing is dictatedby maximum horizontal travel of the water (see Table 8.8). At maximum backwashrate, there should be a free fall of the water into the troughs, even at the upstreamend. The top edges of the troughs should all be at the same elevation, and all shouldbe level so that the flow is withdrawn evenly over the whole bed.
The volume of wash water required to wash a filter will depend on the depth ofthe filter medium and the vertical distance from the fixed-bed surface to the over-flow level. The greater the depth of medium, the greater the water volume neededto flush the dirt out of the medium and into space above the medium. The greaterthe vertical distance from the surface of the medium to the wash-water overflowlevel, the greater the volume needed to wash the dirt out of the filter box. Typi-cally, it will take about four displacement volumes for the void volume in the bedplus the water volume above the bed to reach the overflow level. Typical washwater volumes used per unit area per wash range from 100 to 200 gal/ft2/wash (4 to 8 m3/m2/wash).
In filters with backwash troughs and washed with full-bed fluidization, theexpanded media surface should be lower than the bottom of the troughs. If theexpanded media rises up between the troughs, the effective vertical flow velocity isincreased and the danger of carrying the filter medium into the troughs isincreased.
The wash-water volume required per wash to clean the filter could be reduced bydecreasing the vertical distance from the fixed bed surface up to the top edge of thetroughs. The temptation to do this must be resisted, however, because the danger ofloss of filter medium would be increased. Loss of filter medium is greater whenanthracite is used. In this case, to minimize the loss of anthracite, the vertical dis-tance to the edge of the troughs should be increased above the traditional 2.5 to 3 ft(0.75 to 0.9 m), to 3.5 to 4 ft (1.1 to 1.2 m).This, in turn, will require a greater volumeof wash water to complete the backwash.
Expansion of Filter Medium During Backwashing
When using upflow wash with full fluidization, the filter bed expands about 15 to 30percent above its fixed-bed depth.The degree of expansion is affected by many vari-ables associated with the filter medium and the water. Filter medium variablesinclude the size and size gradation, and grain shape and density. Water variablesinclude viscosity and density.The ability to predict expansion is important, for exam-ple, in determining whether the expanded medium will rise too high, possibly abovethe bottom of the troughs.
GRANULAR BED AND PRECOAT FILTRATION 8.63

The following model for predicting expanded bed porosity during backwashingwas developed by extending a Reynolds number versus porosity function that hadbeen used for fixed beds into the expanded bed region (Dharmarajah and Cleasby,1986). The modified Reynolds number Re1 uses interstitial velocity V/ε for the char-acteristic velocity and a term approximating the mean hydraulic radius of the flowchannel, ε/[Sv(1 − ε)], for the characteristic length.
Re1 = ⋅ = (8.22)
where Sv = specific surface of the grains (6/d for spheres and 6/ψdeq for non-spheres).The porosity function used previously to correlate fixed-bed pressure drop data toRe1 was modified by combining it with the constant head-loss equation for a flu-idized bed (Equation 8.6) resulting in a new dimensionless porosity function for flu-idized beds (A1):
A1 = ⋅ (8.23)
Using the data for many different sizes and types of filter media, log A1 was corre-lated with log Re1 using a stepwise regression analysis and resulting in the followingexpansion correlation (Dharmarajah and Cleasby, 1986):
log A1 = 0.56543 + 1.09348 log Re1 + 0.17971 (log Re1)2
−0.00392 (log Re1)4 − 1.5 (log ψ)2 (8.24)
The equation can be used to predict the expanded porosity (ε) of a filter medium ofany uniform size (i.e., Sv = specific surface) at any desired backwash rate (V).Because both A1 and Re1 are functions of ε, the solution is trial and error and is bestsolved by computer. When applying the equation to a real filter medium with sizegradations, the bed must be divided into several segments of approximately uniformsize using the sieve analysis data, and the expanded porosity of each size segmentmust be calculated. The expanded depth of each segment then can be calculatedfrom the following equation that is based on the total grain volume remainingunchanged as the bed expands (Cleasby and Fan, 1981):
= (8.25)
in which L/Lo is the ratio of expanded depth (L) to fixed-bed depth Lo, ε is theexpanded porosity, and εo is the fixed loose bed porosity. Typical values of εo werepresented earlier in Table 8.2.
EXAMPLE 8.3 Calculate the expansion for the d50 size anthracite shown in Figure 8.3at 20°C and at the backwash rate of 32.8 gpm/ft2 calculated in Example Problem No.2. Use a sphericity of 0.55 and a density of 1.6 estimated from Table 8.1.
SOLUTION IN SI UNITS
Re1 = (8.22)
V = 32.8 gpm/ft2 = 0.0223 m/s as beforeρ = 998.207 kg/m3
µ = 1.002Ε − 3 Ns/m2
Vρ��Sv (1 − ε)µ
1 − εo�1 − ε
L�Lo
ρ(ρs − ρ)g��
Sv3µ2
ε3
�(1 − ε)2
V ρ��Sv(1 − ε)µ
ρ�µ
ε�Sv(1 − ε)
V�ε
8.64 CHAPTER EIGHT

µ/ρ = υ = 1.004Ε − 6 m2/sd50 = 2.0Ε − 3 mSv = 6/ψd = 6/0.55 ⋅ 2.0Ε − 3 = 5454 m-1
Re1 = = (dimensionless)
ε is the desired expanded porosity
A1 = (dimensionless) (8.23)
= ⋅ =
Insert these Re1 and A1 values into Equation 8.24 as follows:
log �36.184 � = 0.56543 + 1.09348 log +
0.17971 �log �2
− 0.00392�log �4
− 1.5 (log 0.55)2
Note that the only unknown in the foregoing equation is ε, but it appears on bothsides of the equation. A trial and error solution is necessary.
Equation 8.24 solution yields ε = 0.616.The expansion of this size anthracite can be calculated from Equation 8.25,
assuming an initial porosity of 0.56 from Table 8.2.
= (8.25)
= = 1.15
Therefore, this mid-size material would be expanded 15 percent. To obtain theexpansion of the entire bed, the bed must be divided into about five sizes and theexpanded depth of each layer calculated and totaled. To obtain the expansion ofdual or triple media beds, the expansion of each layer is calculated and totalled with-out regard to any intermixing at the interfaces between layers.
Stratification and Intermixing During Backwashing
The related phenomena of stratification and intermixing are important issues in filterconstruction and backwashing. These will be discussed in the following subsections:
Stratification and Skimming. In the case of a single-medium filter such as a sandfilter, during backwash with fluidization the grains tend to stratify by size, with thefiner grains resting on top and the coarser grains setting on the bottom. The ten-dency to stratify at a given backwash rate (above fluidization velocity) is driven bybulk density differences between the fluidized grains of different sizes. Smallergrains expand more and have a lower bulk density (grains plus fluidizing water) andthus rise to the top of the bed.The concept of bulk density is discussed further in the
1 − 0.56��1 − 0.616
L�Lo
1 − εo�1 − ε
L�Lo
4.073�(1 − ε)
4.073�(1 − ε)
4.073�(1 −ε)
ε3
�(1 − ε)2
36.184ε3
�(1 − ε)2
998(1600 − 998)9.81���(5454)3(1.002E − 3)2
ε3
�(1 − ε)2
ρ(ρs − ρ)g��
(Sv)3µ2
ε3
�(1 − ε)2
4.073�(1 − ε)
0.0223���5454 (1 − ε) 1.004Ε − 6
GRANULAR BED AND PRECOAT FILTRATION 8.65
next section, “Intermixing of Adjacent Layers.” This stratification is upset to a vary-ing extent by nonuniform upflow of the backwash water that creates localizedregions of above-average upflow velocity. Larger grains are transported upwardrapidly into the upper bed, while in adjacent regions the sand will be moving down-ward carrying finer grains down into the bed. These regions of excessive upflow arereferred to as sand boils, or jet action in water filtration literature, and as gulf stream-ing in some fluidization literature.
The tendency to stratify is used beneficially during construction of a filter toremove unwanted fine grains from the bed. The filter is washed above fluidizationvelocity and the fine grains accumulate at the upper surface. After the backwash iscompleted, the fine grains are skimmed from the surface to avoid leaving a blindinglayer of fines on top.
Better stratification is achieved at lower upflow rates, just barely above the min-imum fluidization velocity of the bed. So in preparing for skimming, the bed shouldfirst be fully fluidized and then the upflow wash rate slowly reduced over severalminutes to bring to the surface as many of the fine grains as possible. The fluidiza-tion and skimming process may be repeated two or three times for maximum effec-tiveness.
During the installation of dual- or triple-media filter beds, skimming each layer asit is completed is common. The same concepts and procedures just described areequally appropriate for each layer. If the very fine grains are not removed from thelower layers, they may rise high in the next upper layer, partially negating thedesired benefit of the coarse upper layer (Cleasby et al., 1984).
Intermixing of Adjacent Layers. Intermixing will tend to occur between adjacentlayers of dual- and triple-media filters. For example, the upper finer sand grains of adual media bed move up into the lower coarser grains of the anthracite bed that liesabove.
The tendency to intermix between two adjacent layers of filter media can be esti-mated by comparing the bulk density of the two media calculated independently atany particular backwash flow rate and temperature.The bulk density is the mixed den-sity of the grains and fluidizing water calculated as follows (Cleasby and Woods, 1975):
ρb = (1 − ε) ρs + ρε (8.20)
in which ρb is the bulk density. The first term on the right-hand side is the densitycontributed by the solid fraction, and the second term is the density contributed bythe water fraction.
The tendency to intermix increases with the backwash flow rate because the bulkdensities tend to converge at higher flow rates. Intermixing actually begins beforethe bulk densities become equal because of uneven flow distribution and mixing andcirculation patterns that exist in the fluidized layers. Mixing was observed to occurwhen the bulk densities converged to within 3 to 8 lb/ft3 (50 to 130 kg/m3) (Cleasbyand Woods, 1975). Similarly, as the backwash rate is decreased slowly, the bulk den-sities of the adjacent layers diverge, and intermixing decreases.
The bulk density model would predict that inversion of layers should occur atvery high wash rates, and such inversion was observed experimentally (Cleasby andWoods, 1975). Wash rates were, however, far higher than rates used in practice.
The tendency for sand and anthracite to intermix during backwashing is muchless than for silica and garnet sand in the usual backwash flow range. This is becausethe differences in bulk density are greater for the usual sand and anthracite sizesused in current practice.
8.66 CHAPTER EIGHT

Backwash of GAC Filter-Adsorbers
The properties of GAC are sufficiently different from conventional anthracite orsand media to require some special precautions when backwashing GAC filter-adsorbers (Graese, Snoeyink, and Lee, 1987). The lower density of GAC meanslower backwash rates are required to fluidize the common size gradations currentlybeing used. Lower wash rates mean lower hydraulic shear and less effective upflowwash. Mudballs have been a common problem in GAC filter-adsorbers. Therefore,surface wash or auxiliary air scour are essential for GAC backwashing.
The higher UC of typical gradations of GAC being used results in a greater per-cent expansion and better size stratification if the full bed is fluidized. There isgreater potential for loss of GAC into the backwash troughs. In retrofitting existingfilters into GAC filter-adsorbers, raising the backwash troughs may be necessary toreduce the loss of GAC.
Granular activated carbon is abrasive and corrosive to many metals. Therefore,all metals in contact with GAC should be resistant to abrasion and corrosion. Met-als can be coated with corrosion-resistant substances.
Special precautions are important when preparing a new GAC filter-adsorber forservice. The filter box should be disinfected before installing the GAC. After instal-lation of the GAC, it must be submerged and soaked for at least a day to allow waterto penetrate the pores of the GAC. Initial backwashing must be done at a very lowrate to be sure that all air is out of the bed to avoid loss of GAC. After all air hasbeen removed, the backwash rate can be increased to wash out undesirable finesfrom the bed. Release of additional air and fines may be observed during the firstweek of normal backwashing operation. See Chapter 13 for further information onthe backwashing of GAC adsorbers.
Backwash Water Recovery
Recovery of dirty backwash water has been very common for a number of reasons.It represents a rather large volume of water with low solids content. Typically, thevolume is 1 to 5 percent of total plant production. Therefore, its recovery representsa savings in water resources and in the chemicals that were expended to treat it ini-tially. Discharge of water plant wastes is usually prohibited under current pollutionregulations, although some agencies are relaxing requirements for economic reasonsand in recognition of the minimal environmental impact of these wastes (Vicory andWeaver, 1984).
However, most regulatory agencies require proper handling of wastes in newtreatment plants and in plants being enlarged or upgraded. Further discussion onthis subject is presented in Chapter 16.
The concern about possible recycling of Giardia cysts and Cryptosporidiumoocysts led to a plant-scale study of the impact of waste stream recycling on filteredwater quality (Cornwell and Lee, 1994). The authors concluded that proper man-agement of the waste streams can render them acceptable for recycling in many sit-uations. Backwash water and sedimentation basin sludge should be subjected tofurther sedimentation at a low overflow rate or by adding a polymer to removecysts before recycling the supernatant. Recycled streams should be equalized andblended over the full 24-hour operating period, or the plants operating period if itis less than 24 hours. Recycle streams should be regularly monitored for cysts or byparticle counting to judge the effectiveness of removing cysts from the wastestream prior to recycle.
GRANULAR BED AND PRECOAT FILTRATION 8.67

PROBLEMS IN RAPID FILTERS
Dirty Filter Media and Mineral Deposits
Dirty filters result from inadequate backwashing of the filter, including the absenceor improper operation of auxiliary scour systems. Typical manifestations of inade-quate backwashing include filter cracks and mudballs. Inadequate cleaning leaves athin layer of compressible matter around each grain of the medium. As pressuredrop across the filter medium increases during the subsequent filter run, the grainsare squeezed together and cracks form in the surface of the medium, usually alongthe walls first. In severe cases, cracks may develop at other locations as well.
The heavier deposits of solids near the top surface of the medium break into piecesduring backwashing, resulting in spherical-shaped accretions referred to as mudballs.Mudballs are composed of the filter grains and the solids removed by the filter andrange from pea size to 1 to 2 in (2.5 to 5 cm) or more. The formation of mudballs isaccentuated by the use of polymers as coagulant aids or as filter aids that formstronger attachments between the filter grains and the removed solids. If the mudballsare small and of low density, they may float on the surface of the fluidized medium.Larger or heavier ones may sink into the filter, to the bottom, or in dual-media filters,to the coal-sand interface. Subsurface accumulations can lead to solidified inactiveregions of the filter bed that are not remedied in normal backwashing. This, in turn,increases the filtration rate through the remaining active portions of the bed, withpotential detriment to the quality of the filtrate as well as shorter filter cycles.
Surface mudballs can be removed manually by (1) lifting them from the surfacewith a large strainer while the backwash water is running at a low rate; (2) breakingthem up with rakes; or (3) breaking them up with a high-pressure hose jet. Subsur-face mudballs and agglomerations can be reduced by (1) probing the bed with lancesdelivering jets of high-pressure water; (2) pumping the medium through an ejector;(3) washing the filter and using chemical additions described below; or (4) diggingout the hard spots and removing, cleaning, or replacing the medium.
Mineral deposits can develop on the grains of the filter medium, causing them tochange in size, shape, and density. Calcium carbonate deposits are common in manylime-soda ash softening plants if recarbonation is not sufficient to deliver a stablewater to the filters. Such deposits also may occur in surface water plants if lime isadded ahead of filtration for corrosion control.The deposition of calcium carbonatecan be minimized by adding a low dosage of polyphosphate ahead of the filters. Ironoxides and manganese oxides are common deposits on the filter medium of iron andmanganese removal plants.Aluminum oxide or iron oxide deposits can occur in sur-face water plants that use alum or iron salts for coagulation.
All of these mineral deposits are subject to later leaching into the filtered water,if the pH is changed in a direction to increase solubility. The increased size of thegrains caused by mineral deposits results in an increase in the bed depth and canimpair filtration efficiency. Thus, cleaning the deposits from the grains or replacingthe medium may become necessary.
Dirty filters can usually be corrected by proper use of auxiliary scour devicessuch as surface washers or air scour. Where auxiliary scour is not successful, use ofchemicals may in some cases be necessary to attempt to clean the filter medium inplace. Various chemicals have been used, including chlorine, copper sulfate, acids,and alkalies (Babbitt, Doland, and Cleasby, 1962). Chlorine may be used where thematerial to be removed includes living and dead organisms or their metabolites.Copper sulfate is effective in killing algae growing on filter walls or medium. Carry-ing a chlorine residual in the filter influent aids in control of microorganisms in the
8.68 CHAPTER EIGHT

filter. Acidifying the water to a pH of about 4 aids in dissolving deposits of calciumcarbonate and the oxides of iron, aluminum, and manganese. Sulfuric acid andhydrochloric acid have been used, but care must be taken to prevent high local con-centrations from damaging concrete filter walls. Citric acid has been used in theSaint Louis, Missouri, softening plant, and diluted, food-grade, glacial acetic acid atthe lime softening plant at Decatur, Illinois (Mayhugh et al., 1996). These organicacids are less dangerous to handle and may offer public relations advantages. Caus-tic soda has been used for removing deposits resulting from the use of alum and fordeposits of organic material. It is used at the rate of 1 to 3 lb/ft2 (5 to 15 kg/m2).Chemical solutions are generally left in contact with the filter medium for 1 to 2days, and the filter is then thoroughly washed and returned to service.
If a filter can be removed from service for an extended period, deposits of cal-cium carbonate can be removed by feeding, at a low flow rate, a water acidified withcarbon dioxide. The flow rate is selected so that the water leaves the filter with theCO2 fully consumed at a pH of about 8.
Movement of Gravel During Backwashing
Many filters have layers of graded gravel to support the filter medium. The conven-tional gravel layers are graded from coarse on the bottom to fine at the top, accord-ing to appropriate size guidelines presented earlier. With this conventional gravelarrangement, some cases of mounding of the gravel caused by lateral movement ofthe fine gravel have been reported. In severe cases, the finest gravel layer may becompletely removed from some areas of the filter bed. This can lead to leakage ofthe filter medium into the underdrain system, and ultimately to the need to clean theunderdrain and rebuild the filter gravel and medium. Mechanisms contributing tomovement of gravel have been exhaustively discussed by Baylis (American WaterWorks Association, 1971; Baylis, 1959a) and those discussions related to fluidizedbed backwashing of sand beds are summarized here.
As backwashing begins, sand grains do not move apart quickly and uniformlythroughout the bed. Time is required for the sand to equilibrate at its expandedspacing in the upward flow of wash water. If the backwash is turned on suddenly, itlifts the sand bed bodily above the gravel layer, forming an open space between thesand and gravel.The sand bed then breaks at one or more points, as shown in Figure8.29, causing sand boils and subsequent upsetting of the supporting gravel layers.This then requires frequent rebuilding of the graded gravel.
Opening the backwash valve slowly is essential. The time from start to full back-wash flow should be at least 30 s and perhaps longer, and should be restricted bydevices built into the plant.The most destructive filter-washing blunder is to turn thebackwash water on quickly when the bed has been drained. Gross disturbance of thegravel results, and rupture of the filter underdrain system has resulted in many cases.
The upward flow from the gravel is never completely uniform. As a result, insome parts of the expanded sand bed the water and sand travel upward at rateshigher than the average backwash velocity, and at other places the sand actuallytravels downward. This leads to jet action at the sand-gravel junction, as illustratedin Figure 8.30. In some cases the jet velocity is so great that it will move grains ofsmall gravel several diameters larger than the sand grains adjacent to the gravel.Theproblem of gravel movement is greater at wash rates above 15 gpm/ft2 (37 m/h).
The importance of sand in generating the movement of gravel is illustrated by theobservation that an upward flow through a graded gravel bed at backwash ratesexceeding 25 gpm/ft2 (61 m/h) will not move any of the gravel particles unless sand
GRANULAR BED AND PRECOAT FILTRATION 8.69

is present on top of the gravel (Baylis, 1959a). The presence of the sand greatlyincreases the mobility of the gravel.
Movement of the gravel can also occur when air scour and water backwash areused simultaneously. Provisions being used to avoid movement of gravel are the useof double reverse graded gravel, or the use of media-retaining nozzle underdrainsthat require no gravel, as discussed earlier.
Three methods are used to determine whether the upper surface of the gravel hasmoved: (1) pushing a 1⁄4-in metal rod gently down to the gravel surface of a newlybackwashed filter while the filter is at rest; (2) lowering a probe with a flat plate onthe end through the expanded filter medium during the fluidized bed backwash; or(3) draining the filter to the gravel, inserting a thin-walled pipe of about 1 in (2.5 cm)
8.70 CHAPTER EIGHT
FIGURE 8.30 Jet action at the sand-gravel interface.
FIGURE 8.29 Sand boil at beginning of wash.

diameter into the medium, and removing the media in segments until the top layerof gravel is reached in successive probings. Each method has advantages and disad-vantages. The first is quick, but distinguishing the fine gravel from the bottom filtermedium is difficult. The second method requires a long period of fluidized back-wash. The third method is the most positive but also the most time-consuming andlabor-intensive. Numerous measurements made on a gridiron pattern will reveal thecontour of the top surface of the gravel.
Underdrain Failures
The filter underdrain is a vitally important component of the rapid filter. It serves tocollect the filtered water, support the filter gravel (if used) and filter medium, and todistribute backwash water.
The most serious failures of rapid filters are usually related to problems with theunderdrain. Proper design and construction of the underdrain are essential. Anyunderdrain system, if designed improperly, can lead to uneven distribution of thebackwash water. This, in turn, can lead to problems such as dirty areas in the filterand migration of gravel, if gravel is used to support the medium.
False-floor underdrains with nozzles have failed for several reasons. If the nozzleshave fine openings to retain the fine filter medium, the openings may becomeclogged with debris from construction of the underdrain or from solids in the back-wash water, or because of mineral deposits. If steel filter vessels are allowed to cor-rode, the rust can clog backwash nozzles. If the clogging becomes excessive, thebackwash flow rate may be diminished and the pressure drop across the floor causesuplift during backwashing that may become excessive. The problem can be repairedby removing the filter medium and cleaning the nozzles. If not corrected, excessivepressure drop can result in an uplift structural failure of the false floor. An openpressure-relief pipe is often provided that projects an appropriate length abovebackwashing water level. Excessive pressure in the underdrain is evident when thispipe starts to flow during the backwash operation.
Some modern plastic nozzles are not strong enough to accept the abuse of con-struction, during or after installation. They may be weakened during construction,and the nozzle heads may break off during future backwashing operations. Theresult is leakage of medium into the underdrain plenum.
The manifold and lateral type of underdrain is not subject to uplift failure. It canfail to function properly, however, if the distribution orifices are reduced in sizebecause of mineral deposits, or enlarged in size because of corrosion or erosion.
Vitrified clay block underdrains have proven quite successful when properlyinstalled and if precautions are taken to prevent air from entering the backwash sys-tem.The manufacturer’s recommendations for installation and grouting must be fol-lowed explicitly to obtain a good installation. Careless workmanship can lead togrout in the water-carrying channels. This can lead to maldistribution of washwater,and in severe cases, to excessive backwash pressures and uplift failure. Some plasticblock underdrains eliminate the danger of grout intrusion by the use of o-ring gas-kets or other positive exclusion systems.
PRESSURE GRANULAR BED FILTERS
Pressure filters are sometimes used for rapid filtration. The filter medium is con-tained in a steel pressure vessel.The water to be filtered enters the filter under pres-
GRANULAR BED AND PRECOAT FILTRATION 8.71

8.72 CHAPTER EIGHT
FIGURE 8.31 Cross section of typical pressure filter.
sure and leaves at slightly reduced pressure because of the head loss encountered inthe filter medium, underdrain, and piping connections.
Description of Pressure Filters
The pressure vessel may be a cylindrical tank with a vertical axis such as shown inFigure 8.31, or it may be a horizontal-axis cylindrical tank.The horizontal cylindricalconfiguration has the disadvantage that the width of the filter medium is not con-stant from top to bottom, usually being wider at the top.This leaves dead areas alongthe walls that do not receive adequate fluidization during backwashing and there-fore, may not be washed effectively.
In some horizontal-axis cylindrical tanks, the filter is divided into multiple (fouror five) cells by vertical bulkheads. Cost advantages are gained by this configurationbecause only a single pressure vessel is needed. One filter cell can be backwashed bythe production of the other cells that remain in service.This requires a filtration ratesufficiently high so that the total production of the operating cells is sufficient to flu-idize the medium of the single cell being backwashed.
Comparison of Pressure and Gravity Filtration
While the outward appearance of pressure and gravity filters are quite different, thefiltration process is the same.The same mechanisms for capturing particles are func-tioning in both. The same filter medium, the same filtration rates, and the same ter-minal head loss should be utilized if comparable filtrate quality is desired.
The use of higher filtration rates and high terminal head loss in a pressure filteris tempting because the influent is under pressure and more potential head loss isavailable. This temptation should be resisted, however, unless no detriment to thequality of the filtrate can be demonstrated on a case-by-case basis.
One advantage gained by pressure filtration is that water leaves the filter undera positive gauge pressure, and therefore no negative pressure can ever exist in the
filter medium. The potential problems associated with negative pressure discussedearlier are therefore avoided.
Operation of Pressure Filters
Because of the similarities between pressure and gravity filters, the operating princi-ples are identical. For example, appropriate pretreatment is equally important topressure and gravity filters; patterns of filtrate quality will be the same; the impact ofsudden rate increases will be just as detrimental; and the importance of properbackwashing is equally important.
The operation of a pressure filter is similar in most respects to the operation of agravity filter. Proper backwashing of a pressure filter is more difficult, however,because the filter medium is not conveniently visible to the operator during thebackwash operation. The various analyses that can be conveniently made by visualobservation for gravity filters are difficult or impossible to perform with pressure fil-ters. These include:
1. Presence of filter cracks before the backwash, or mudballs after the backwash2. Uniformity of backwash water distribution3. Uniformity of rate of cleanup of the wash water over the full filter areas4. Proper functioning of the auxiliary scour device such as surface wash or air scour5. Elevation and appearance of the top surface of the filter medium after the back-
wash6. Whether the medium is fully fluidized during the backwash (if that is the
intended washing method), and the extent of expansion of the filter medium7. Extent of loss of the filter medium
Because of these difficulties, pressure filters have been implicated in waterborne dis-ease outbreaks that can be partially attributed to poor condition of the filtermedium. (Kirner, Littler, and Angelo, 1978; Lippy, 1978). Prior concerns about thereliability of pressure filters and other concerns have caused some state regulatoryagencies to exclude the use of pressure filters in the treatment of surface waters orother polluted source waters and lime softened waters (Great Lakes Upper Missis-sippi River Board of State Sanitary Engineers, 1992).
Rate Control for Pressure Filters
Rate control for pressure filters is equally as important as it is for gravity filtersbecause the same filtration mechanisms are functioning in both cases. Fewer optionsare available for pressure filters, however, because the pressure filter operates full ofwater under pressure. As a result, options involving changing water levels are notavailable, and influent gravity flow splitting is not available. Therefore, the benefitsof slow rate changes by allowing water levels to change are not available to pressurefilters.
The usual arrangement for a bank of pressure filters is based on the assumptionthat flow through the system will self-equalize.The total filter area of the filter bankis sized appropriately to meet local regulatory requirements based on feed pumpcapacity. Individual filter flow controllers and flow meters are not provided.The sys-
GRANULAR BED AND PRECOAT FILTRATION 8.73
tem is designed symmetrically so that flow is distributed equally to each filter in thebank.Thus, after backwashing all of the filters in short succession, if one filter is pass-ing more flow than it should, it is assumed that that filter will clog more quickly thanthe other filters, and that the flow will be reduced because of the clogging resistance.Thus, the system is considered self-equalizing during operation. However, if the mul-tiple filters are backwashed at random intervals during a filter cycle, the cleanest fil-ter will provide the highest flow and the dirtiest filter the lowest flow. The extent ofthese differences will not be known if individual flow meters are not provided.
In spite of the common practice just described, it is desirable to have a flow meteron each pressure filter in a bank of several filters. Flow metering is useful to the plantoperators for diagnostic purposes to observe if something is wrong with one filter,causing the flows to not be equally split.This could happen if one filter is not cleaningup properly during backwashing, perhaps due to a clogged underdrain. Or, one filtermay flow at an excessive rate due to the loss of some or all of its filtering medium.
Applications of Pressure Filters
Pressure filters tend to be used in small water systems. Many pressure filters are usedin industrial water and wastewater filtration applications. They also are used widelyin swimming pool filtration.
Advantages of pressure filters over gravity filters include the following:
● The filtrate, which is under pressure, can be delivered to the point of use withoutrepumping. In some treatment plants, source water can be pumped from thesource through the treatment plant and directly to the point of use by the sourcewater pumps.
● A treatment plant equipped with pressure filters is somewhat easier to automate.● Some groundwaters containing iron can be treated by pressure aeration and/or
chemical oxidation and then filtered directly on pressure filters.This approach hasreceived considerable application for small communities. (Not all iron-bearingwaters respond successfully to this method of treatment, however, and prior pilottesting is usually required.)
SLOW SAND FILTERS
Description and History
The slow sand filter is a sand filter operated at very low filtration rates without theuse of coagulation in pretreatment. The grain size of the sand is somewhat smallerthan that used in a rapid filter, and this, plus the low filtration rate, results in thesolids being removed almost entirely in a thin layer on the top of the sand bed. Thislayer, composed of dirt and living and dead micro- and macroorganisms from thewater (i.e., the schmutzdecke or dirty skin), becomes the dominant filter medium asthe filter cycle progresses. When the head loss becomes excessive, the filter iscleaned by draining it below the sand surface and then physically removing the dirtylayer along with 1⁄2 to 2 in (13 to 50 cm) of sand. Typical cycle lengths may vary from1 to 6 months (or longer) depending on source water quality and the filtration rate.
The slow sand filter was developed in England in the early nineteenth century andcontinues to be used successfully there, notably on River Thames water, which serves
8.74 CHAPTER EIGHT
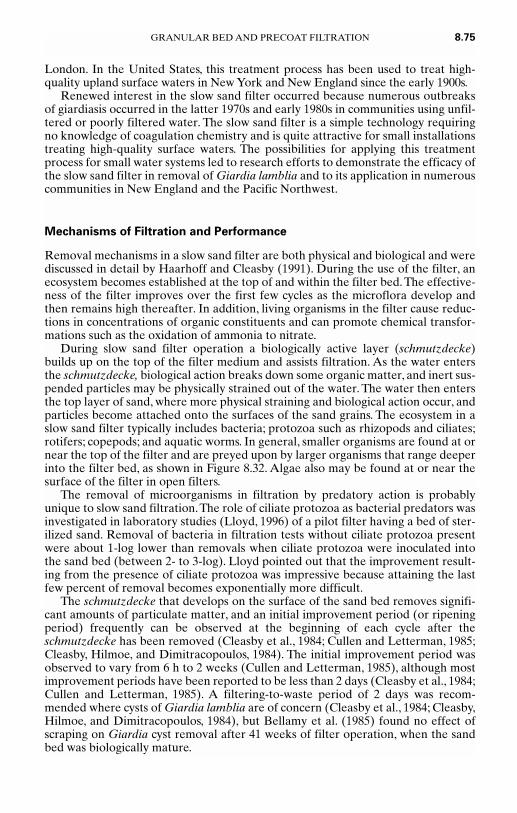
London. In the United States, this treatment process has been used to treat high-quality upland surface waters in New York and New England since the early 1900s.
Renewed interest in the slow sand filter occurred because numerous outbreaksof giardiasis occurred in the latter 1970s and early 1980s in communities using unfil-tered or poorly filtered water. The slow sand filter is a simple technology requiringno knowledge of coagulation chemistry and is quite attractive for small installationstreating high-quality surface waters. The possibilities for applying this treatmentprocess for small water systems led to research efforts to demonstrate the efficacy ofthe slow sand filter in removal of Giardia lamblia and to its application in numerouscommunities in New England and the Pacific Northwest.
Mechanisms of Filtration and Performance
Removal mechanisms in a slow sand filter are both physical and biological and werediscussed in detail by Haarhoff and Cleasby (1991). During the use of the filter, anecosystem becomes established at the top of and within the filter bed. The effective-ness of the filter improves over the first few cycles as the microflora develop andthen remains high thereafter. In addition, living organisms in the filter cause reduc-tions in concentrations of organic constituents and can promote chemical transfor-mations such as the oxidation of ammonia to nitrate.
During slow sand filter operation a biologically active layer (schmutzdecke)builds up on the top of the filter medium and assists filtration. As the water entersthe schmutzdecke, biological action breaks down some organic matter, and inert sus-pended particles may be physically strained out of the water. The water then entersthe top layer of sand, where more physical straining and biological action occur, andparticles become attached onto the surfaces of the sand grains. The ecosystem in aslow sand filter typically includes bacteria; protozoa such as rhizopods and ciliates;rotifers; copepods; and aquatic worms. In general, smaller organisms are found at ornear the top of the filter and are preyed upon by larger organisms that range deeperinto the filter bed, as shown in Figure 8.32. Algae also may be found at or near thesurface of the filter in open filters.
The removal of microorganisms in filtration by predatory action is probablyunique to slow sand filtration.The role of ciliate protozoa as bacterial predators wasinvestigated in laboratory studies (Lloyd, 1996) of a pilot filter having a bed of ster-ilized sand. Removal of bacteria in filtration tests without ciliate protozoa presentwere about 1-log lower than removals when ciliate protozoa were inoculated intothe sand bed (between 2- to 3-log). Lloyd pointed out that the improvement result-ing from the presence of ciliate protozoa was impressive because attaining the lastfew percent of removal becomes exponentially more difficult.
The schmutzdecke that develops on the surface of the sand bed removes signifi-cant amounts of particulate matter, and an initial improvement period (or ripeningperiod) frequently can be observed at the beginning of each cycle after theschmutzdecke has been removed (Cleasby et al., 1984; Cullen and Letterman, 1985;Cleasby, Hilmoe, and Dimitracopoulos, 1984). The initial improvement period wasobserved to vary from 6 h to 2 weeks (Cullen and Letterman, 1985), although mostimprovement periods have been reported to be less than 2 days (Cleasby et al., 1984;Cullen and Letterman, 1985). A filtering-to-waste period of 2 days was recom-mended where cysts of Giardia lamblia are of concern (Cleasby et al., 1984; Cleasby,Hilmoe, and Dimitracopoulos, 1984), but Bellamy et al. (1985) found no effect ofscraping on Giardia cyst removal after 41 weeks of filter operation, when the sandbed was biologically mature.
GRANULAR BED AND PRECOAT FILTRATION 8.75
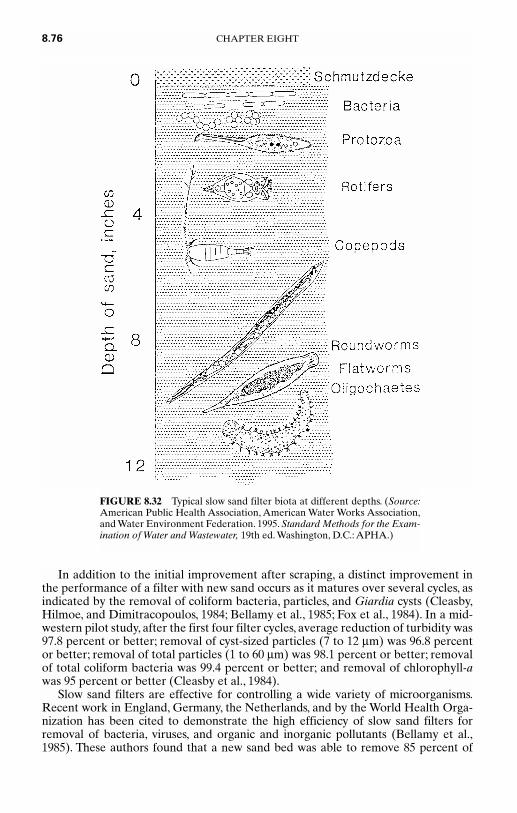
In addition to the initial improvement after scraping, a distinct improvement inthe performance of a filter with new sand occurs as it matures over several cycles, asindicated by the removal of coliform bacteria, particles, and Giardia cysts (Cleasby,Hilmoe, and Dimitracopoulos, 1984; Bellamy et al., 1985; Fox et al., 1984). In a mid-western pilot study, after the first four filter cycles, average reduction of turbidity was97.8 percent or better; removal of cyst-sized particles (7 to 12 µm) was 96.8 percentor better; removal of total particles (1 to 60 µm) was 98.1 percent or better; removalof total coliform bacteria was 99.4 percent or better; and removal of chlorophyll-awas 95 percent or better (Cleasby et al., 1984).
Slow sand filters are effective for controlling a wide variety of microorganisms.Recent work in England, Germany, the Netherlands, and by the World Health Orga-nization has been cited to demonstrate the high efficiency of slow sand filters forremoval of bacteria, viruses, and organic and inorganic pollutants (Bellamy et al.,1985). These authors found that a new sand bed was able to remove 85 percent of
8.76 CHAPTER EIGHT
FIGURE 8.32 Typical slow sand filter biota at different depths. (Source:American Public Health Association, American Water Works Association,and Water Environment Federation. 1995. Standard Methods for the Exam-ination of Water and Wastewater, 19th ed. Washington, D.C.: APHA.)

source water coliform bacteria and 98 percent of Giardia cysts. As the sand bedmatured biologically, removal of coliform bacteria exceeded 99 percent and removalof Giardia was virtually 100 percent. Pyper (1985) evaluated a small municipal slowsand filter (area 37 m2) that was not being used to produce drinking water, and spikedthe influent water with Giardia cysts and total coliform bacteria. This full-scale filter,operated at 0.03 gpm/ft2 (0.08 m/hr), resulted in 3.7- to 4.0-log removal of Giardiaat temperatures of 7.5 to 21°C, but at temperatures below 1°C, removals ranged from1.2- to 3-log. Removal of Cryptosporidium by slow sand filtration was studied bySchuler, Ghosh, and coworkers at Pennsylvania State University. The pilot slow sandfilter achieved log removals of 3.7 or higher when the filter was operated at 0.11gpm/ft2 (0.26 m/hr), using 0.27-mm ES sand (Schuler, Ghosh, and Boutros, 1988).Theirfiltration testing was conducted at ambient temperatures for Shingletown Reservoirwater, which ranged from 4.5 to 16.5°C (Ghosh, Schuler, and Gopalan, 1989).
Removal of turbidity often parallels removal of other particulates and is gener-ally excellent, with filtrate turbidity at full-scale plants usually below 0.5 ntu (Cullenand Letterman, 1985), but exceptions have been noted. A low percentage of turbid-ity was removed in one pilot study of a lake water containing a very fine clay frommountain runoff, and 1 ntu filtered water was seldom produced (Bellamy et al., 1985;Bellamy, Hendricks, and Logsdon, 1985).
Because the slow sand filter is partially a biological process, prechlorinationmight be expected to hinder performance, but conflicting results have beenreported. No detrimental effect of prechlorination was seen in a comparison of threefull-scale plants with prechlorination, when compared to four plants withoutprechlorination (Cullen and Letterman, 1985). In one pilot-scale study, a slow sandfilter that received superchlorinated water with about 6 to 12 mg/L free chlorine andwith free chlorine in the filtrate performed better than a filter without prechlorina-tion in removal of bacteria and in filter run length (Baumann, Willrich, and Ludwig,1963). On the other hand, Bellamy, Hendricks, and Logsdon (1985) reported thatheavy chlorination of a slow sand filter was quite detrimental to filter performance.
Appropriate Waters and Pretreatment for Slow Sand Filters
Slow sand filters are not successful in treating clay-bearing river waters typical ofmost of the United States, because the clay penetrates too deeply into the filter andcannot be removed in the normal surface scraping operation. In addition, they arenot very effective for removing color, typically achieving only 25 percent removal.Early references suggested that appropriate waters should have less than 30 ppmturbidity and 20 ppm color (Cleasby et al., 1984). The units for these measures havechanged since those early reports, and therefore, translating those values to currentunits is difficult.
A 1984 survey of 27 existing full-scale slow sand filter plants in the United Statesfound 74 percent using lakes or reservoirs as their source water, 22 percent usingrivers or streams, and 4 percent using groundwater.The mean turbidity of the sourcewater was about 2 ntu, with the peak about 10 ntu (Slezak and Sims, 1984). Meanlengths of filter runs varied from 42 days in the spring to 60 days in the winter. Widevariations were reported, with two reports of cycles up to one year.
A survey of 7 New York plants (Cullen and Letterman, 1985) including 3 of theplants in the prior reference (Slezak and Sims, 1984) revealed source waters withgenerally less than 3 ntu turbidity. One plant with 6 to 11 ntu was not meeting theexisting (1984) 1-ntu finished water turbidity maximum contaminant level (MCL).Average run lengths varied from 1 to 6 months.
GRANULAR BED AND PRECOAT FILTRATION 8.77
Waters with periodic algal blooms may have short filter runs during such periods.Some measure of plankton should be included in source water guidelines. Cleasby etal. (1984) suggested that acceptable source waters should have turbidity less than 5ntu and chlorophyll-a less than 5 mg/m3 (µg/L).
In northern climates where freezing will occur on uncovered filters, the runlength is of crucial importance. If the filter run terminates in midwinter, the layer ofice will prevent a normal scraping operation. Therefore, if any possibility of runsshorter than the period of ice cover on the filter exists, the filter must be covered.
There is considerable worldwide interest in the use of pretreatment systems toextend the application of slow sand filters to somewhat poorer quality source waters.Various upflow, downflow, and horizontal flow roughing filters have been studied forthis purpose (Logsdon, 1991). It is hoped that such devices will make slow sand fil-tration more widely useful, especially in developing countries where simple technol-ogy is of utmost importance.
Preozonation has been evaluated for enhancement of color removal becauseslow sand filters are not very effective for removal of color and trihalomethane for-mation potential (THMFP) precursors. Yordanov et al. (1996) reported that pre-ozonation and slow sand filtration reduced color an average of 58 percent at the 16mgd (60 ML/d) Invercannie Water Treatment Works in Scotland. Color in the sourcewater ranged between 9 and 74 Hazen units and averaged 35 Hazen units. (Hazenunits are based on the platinum-cobalt standard and are the same as Pt-Co colorunits.) The raw water total organic carbon (TOC) concentration, which averaged 5mg/L, was reduced 28 percent by preozonation and slow sand filtration.The filters atthis plant operated at a rate of 0.04 gpm/ft2 (0.1 m/hr), and ozone was applied at anozone/TOC dose ratio that generally was less than 0.5.
Preozonation facilities were added to North West Water’s Oswestry TreatmentWorks, a 54-mgd (205 ML/d) slow sand filter plant treating colored upland water inthe United Kingdom in 1994 (Cable and Jones, 1996).This plant had one bank of fil-ters receiving water not treated by ozone, while three banks of filters receivedozonated water, so a full-scale comparison of the effects of preozonation was possi-ble. Trihalomethane formation potential was reduced an average of 28 percent byslow sand filtration alone, while reduction by preozonation and slow sand filtrationaveraged 50 percent.The raw water had low pH (about 6), and color typically rangedfrom 10 to 35 Hazen units. Removal of color averaged 19 percent without ozone and52 percent with ozone.
In response to the need to effectively treat water for removal of trace levels of pes-ticides, Thames Water Utilities, Ltd., which serves the London metropolitan area andthe River Thames watershed, has developed a slow sand filter incorporating a layer ofGAC at mid-depth. The GAC Sandwich (Bauer et al., 1996) filter was piloted andthen tested in a full-scale filter at the Ashford Common Works.The 33,600 sf (3121 m2)test filter consisted of a bottom layer of 12 in (300 mm) of filter sand, 6 in (150 mm) ofChemViron (Calgon) F400 GAC, and finally a top layer of 18 in (450 mm) of sand. Acontrol filter of the same size was emptied and resanded with 36 in (900 mm) of cleansand. Both filters were put into service in July 1991 and operated at 0.04 to 0.12 gpm/ft2
(0.1 to 0.3 m/hr). Long-term testing has shown no difference between the two filtersfor turbidity and particle removal (Bauer et al., 1996).
The 209-mgd (790 ML/d) Hampton Water Treatment Works was converted toGAC Sandwich filters in 19 of 25 beds, which resulted in compliance with Euro-pean Community standards for pesticides, whereas compliance had not beenattained in the prior year without the GAC Sandwich filters.At Hampton, removalof THMFP averaged 3.6 percent in May 1995 in sand filters, versus 28 to 42 percentfor GAC Sandwich filters. Chlorine demand was reduced 12 percent in a control
8.78 CHAPTER EIGHT

slow sand filter, whereas the filters containing both sand and GAC reduced chlorinedemand 33 to 44 percent. Bauer et al. (1996) reported that after two years of use andtreatment of more than 36,000 bed volumes, the GAC Sandwich filters were stillable to produce water of significantly higher quality than conventional slow sand fil-ters, with respect to chlorine demand, THMFP, and TOC.
Physical Details
Early slow sand filter practice has been summarized by Cleasby et al. (1984). Sandeffective sizes ranged from 0.15 to 0.40 mm (0.3 mm most common), sand uniformitycoefficients from 1.5 to 3.6 (2 most common), and initial bed depths from 1.5 to 5.0 ft (0.46 to 1.52 m), with 3 ft (0.9 m) most common. The sand was supported ongraded gravel 6 to 36 in deep (0.15 to 0.91 m), with 18 to 24 in (0.45 to 0.60 m) thecommon range.
Filtration rates ranged from 0.016 to 0.16 gpm/ft2 (0.04 to 0.40 m/h), with 0.03 to0.05 gpm/ft2 (0.07 to 0.12 m/h) most common on source waters that received no priorpretreatment. Flow rates higher than 0.12 gpm/ft2 (0.29 m/h) were used only follow-ing some pretreatment step to lengthen the filter cycle, such as sedimentation orplain rapid filtration without coagulants.
The available head loss for operating the filter ranged from 2.5 to 14 ft (0.76 to 4.3 m) but was most commonly from 3 to 5 ft (0.9 to 1.5 m).A survey of slow sand fil-tration plants in operation in the United States in 1984 indicated that the effectivesize and bed depth of the sand and the filtration rates fell within the ranges justnoted (Slezak and Sims, 1984). An experimental filter that was intentionallyequipped with an unsieved local sand with an ES of 0.18 mm and a UC of 4.4 per-formed satisfactorily, indicating the possibility of reducing costs by using less rigidspecifications (Slezak and Sims, 1984).
Pyper and Logsdon (1991) reviewed slow sand filter design criteria recom-mended in Ten State Standards; criteria recommended for European filters; and cri-teria recommended by Visscher (1990) for filters in developing countries. Thisreview considered Visscher’s recommendations to be more pragmatic and appropri-ate for small water systems in the United States. Visscher recommended filtrationrates of 0.04 to 0.08 gpm/ft2 (0.1 to 0.2 m/hr), sand effective size of 0.15 to 0.30 mm,uniformity coefficient less than 5 but less than 3 preferred, and initial bed depth of31 to 35 inches (0.8 to 0.9 m), with 12 to 20 inches (0.3 to 0.5 m) of support mediabeneath the sand.
With the interest in slow sand filtration, the AWWA Research Foundation spon-sored development of a design manual for slow sand filters (Hendricks et al., 1991)because this material was generally not covered in university civil engineering cur-ricula.The manual is intended to provide design guidance for engineers who recom-mend and design slow sand filters for small communities.
Operation and Cleaning of Slow Sand Filters
Slow sand filters are cleaned by removing the schmutzdecke along with a smallamount of sand, an operation known as scraping. The sand that is removed is usuallycleaned hydraulically and stockpiled for later replacement in the filter.The scrapingoperation can be repeated several times until the depth of the filter bed hasdecreased to about 16 to 20 in (0.4 to 0.5 m), at which time the depth should bereplenished—an operation referred to as resanding the filter.
GRANULAR BED AND PRECOAT FILTRATION 8.79
The sand in small plants is usually skimmed by hand using broad shovels. Scrap-ing and resanding are labor-intensive operations, and consideration should be givento reducing the manual labor involved. A 1985 survey of seven full-scale plants byCullen and Letterman reported labor requirements ranging from 4 to 42 h/1000 ft2
(4 to 46 h/100 m2) of filter area for one scraping. By the use of efficient motorizedbuggies or hydraulic transport, and by limiting removal to a 1 in. (2.5 cm) depth,5 h/1000 ft2 (5.4 h/100 m2) was considered adequate (Cullen and Letterman, 1985).Resanding with 6 to 12 in. (15 to 30 cm) of sand requires approximately 50 h/1000 ft2
(54 h/100 m2).One small plant reported use of asphalt rakes to scrape the dirty surface into
windrows that were then shoveled into buckets for transport (Seelaus, Hendricks,and Janonis, 1986). Using this technique, only about 0.2 in. (5 mm) was scraped fromthe filter. This was accomplished by two workers in about 30 min for an 825 ft2
(77 m2) filter, about 1.2 h/1000 ft2 (1.3 h/100 m2).Scraping operations for the large slow sand filters serving Salem, Oregon, are con-
ducted mechanically with a minimum of manual shoveling.A self-propelled scrapingmachine picks up the sand and delivers it by a system of belt conveyors to a truck thatis driven alongside the scraper. The truck carries the sand out of the filter to a usedsand stockpile. Thus labor is limited mainly to the drivers of the machines.
The longer a filter is drained for the scraping operation, the longer will be the ini-tial improvement period during the subsequent run (Cullen and Letterman, 1985).Therefore, cleaning should be accomplished quickly.
Some plants try to extend the periods between scrapings by raking the surfaceone to five times between each scraping. The run time gained with each successiveraking diminishes, however, and when the scraping is finally required, up to 6 in (15cm) of sand must be removed to reach clean sand (Cleasby et al., 1984).
An innovative filter-cleaning technique has been developed by the operators ofthe slow sand filtration plant at West Hartford, Connecticut (Collins, Eighmy, andMalley, 1991). When terminal head loss is reached, the supernatant water is draineddown to a depth of about 12 in. (30 cm) over the sand. A rubber-tired tractorequipped with a comb-tooth harrow is then used to stir the top 12 in. (30 cm) of thesand bed. At the same time, supernatant water is drawn off at one side of the filterbed, creating a horizontal flow across the surface of the bed. This flow carries awaythe dirt and schmutzdecke to waste. When the supernatant water level drops toabout 3 in. (8 cm), harrowing is stopped and the filter is backfilled to return thesupernatant water level to about 12 in. (30 cm). Harrowing is again resumed. Thiscycle of harrowing and backfilling is continued until the entire filter bed has beencleaned. The authors reported that the run lengths typically were 4 to 8 weeks andthat sand has been removed from the filter beds for cleaning at about 8- to 10-yearintervals.
Application to Small Systems
Slow sand filters are especially well-adapted for use by small systems because oftheir simplicity of operation. These filters are quite suitable for the part-time opera-tion affordable at many small systems because coagulation chemistry is notinvolved. Duties for an operator would include checking head loss, checking andadjusting filter production to provide for system demand, and measuring andrecording filtered water turbidity and disinfectant residual.
Tanner and Ongerth (1990) reviewed the performance of slow sand filters oper-ated by small water systems in northern Idaho. During their one-year study, the
8.80 CHAPTER EIGHT

plants were sampled weekly for measurement of turbidity, total coliforms, fecal col-iforms, and heterotrophic plate count bacteria. The authors concluded that if a slowsand filter is designed and operated according to accepted standards, it should pro-vide effective water treatment on a consistent basis. Of special relevance to smallsystems, they noted that plant operators should be educated about proper operatingtechniques for slow sand filters. They indicated that drinking water regulatory per-sonnel should provide training to operators and perform sanitary surveys to helpassure that slow sand filters are operated and maintained acceptably.
Leland and Damewood (1990) presented the case study of a slow sand filter proj-ect in Westfir, Oregon (population 310), from pilot testing through design, construc-tion, and initial operations for almost two years. The authors presented diagrams ofa readily constructed, modestly priced slow sand pilot filter, as well as a recom-mended schedule for collecting data during pilot testing of a filter. The relationshipof raw and filtered water turbidity during the first year of full-scale operation wasquite different from that for raw and filtered water total coliform bacteria. Whereascoliform removal rapidly improved, and nearly all total coliform samples were lessthan 1/100 mL after the first couple of months, filtered water turbidity exceeded rawwater turbidity for nearly a year. This was attributed to a higher-than-expected con-tent of fines in the filter sand, which points out the potential for water quality prob-lems caused by using inadequately cleaned local sand as the filter medium. Eventhough a temporary turbidity problem was encountered, this project was a success.
An interesting development for small systems is the use of precast concrete filterboxes (Riesenberg et al., 1995) rather than constructed-in-place concrete filterboxes.The precast boxes were reported to provide better quality control during fab-rication at a reduced cost, as compared to filters constructed in place. This type ofconstruction would lend itself well to a concept of modular slow sand filter units andmight decrease the time needed for constructing the plant.
Use of slow sand filters by small systems with good quality source waters isexpected to increase in the future.
PRECOAT FILTRATION
Precoat filtration is a U.S. Environmental Protection Agency accepted filtrationtechnique for potable water treatment. When the Surface Water Treatment Rulewent into effect in 1989, it provoked a renewed interest in this filtration process. Pre-coat filters use a thin layer of very fine material such as diatomaceous earth as a fil-ter medium. In precoat filtration, the water to be filtered is passed through a uniformlayer of the filter medium that has been deposited (precoated) on a septum, a per-meable material that supports the filter medium. The septum is supported by a rigidstructure termed a filter element. As the water passes through the filter medium andseptum, suspended particles about 2 µm and larger are captured and removed(American Water Works Association, 1995a). The majority of particles removed bythe filter are strained (i.e., trapped) at the surface of the layer of filter medium, withsome being trapped within the layer. As the filter cycle proceeds, additional filtermedium, called body feed, is regularly metered into the influent water flow in pro-portion to the solids being removed. Without the regular addition of body feed, thehead loss across the precoat layer would increase rapidly. Instead, the dirt particlesintermingle with the body feed particles so that permeability of the cake is main-tained as the thickness of the cake gradually increases. By maintaining permeabilityof the cake in this way, the length of the filter cycle is extended.
GRANULAR BED AND PRECOAT FILTRATION 8.81

8.82 CHAPTER EIGHT
FIGURE 8.33 Typical precoat filtration system. (Courtesy of ManvilleFiltration & Minerals Division.)
Ultimately, a gradually increasing pressure drop through the filter system reachesa point where continued filtration is impractical. The forward filtration process isstopped; the filter medium and collected dirt are washed off the septum; a new pre-coat of filter medium is applied; and filtration continues. A typical flow schematicdiagram is shown in Figure 8.33.
Precoat filters accomplish particle removal by physically straining the solids outof the water. The thickness of the initial layer of precoat filter medium is normallyabout 1⁄8 in. (3 mm), and the water passageways through this layer are so small andnumerous that even very fine particles are retained.
Five or six grades of filter medium (sometimes called filter aid) are commonlyused in potable water treatment. They offer a range of performance with respect toclarity and flow characteristics. With an appropriate selection from among thesegrades, particles as small as 1 µm can be removed by the precoat filter cake. Thisincludes most surface water impurities. Where colloidal matter or other finely dis-persed particles are present, however, filtration alone may not be adequate to pro-duce 1 ntu water as required by the Surface Water Treatment Rule based on earlierresults obtained by Logsdon et al. (1981).
Applications and Performance
Precoat filters are widely used in industrial filtration applications and in swimmingpool filtration. They also have also been used in municipal potable water treatment,primarily in the direct, in-line filtration of high-quality surface waters (turbidity 10 ntu or less and acceptable color), and in the filtration of iron and manganese fromgroundwaters after appropriate pretreatment to precipitate these contaminants.
Since 1949, more than 170 potable water treatment plants utilizing precoat filtra-tion with diatomaceous earth or other filter media have been designed, constructed,and operated in the United States (American Water Works Association, 1995a).About 90 percent utilize surface water supplies and 10 percent groundwater sup-plies.The largest existing plant is a 20-mgd system in San Gabriel, California.A pro-posed 450-mgd (1700 ML/d) precoat filtration plant for the Croton supply of NewYork City has been studied on a pilot scale and on a 3-mgd (11.3 ML/d) prototypescale (Principe et al., 1994). The proposed process would utilize preozone, BAC, anddiatomaceous earth filtration at 3 gpm/ft2 (7.3 m/h). Diatomaceous earth would berecovered and reused for body feed application.

Where the source water and other conditions are suitable, precoat filtration canoffer a number of benefits to the user, including the following:
1. Capital cost savings may be possible because of smaller land and plant buildingrequirements.
2. Treatment costs may be slightly less than conventional coagulation/sedimenta-tion/granular media filtration when filterable solids are low (AWWA, 1995a;Bryant and Yapijakis, 1977; Ris, Cooper, and Goodard, 1984), although sedimen-tation would not usually be needed for such high-quality source waters.
3. The process is entirely a physical/mechanical operation and can attain high logremovals of Giardia cysts and Cryptosporidium oocysts (as described in theIntroduction section of this chapter) without operator expertise in water chem-istry relating to coagulation.
4. The waste residuals are easily dewatered and in some cases may be reclaimed forother uses, including soil conditioning and land reclamation. Research is underway to determine the feasibility of reusing filter medium as body feed.
5. Acceptable finished water clarity is achieved as soon as precoating is completeand filtration starts. A filter-to-waste period is generally not necessary to bringturbidity of the finished water within acceptable limits.
6. Terminal turbidity breakthrough is not generally observed because precoat fil-tration is dominantly a surface filtration process.
The disadvantages of precoat filtration are:
1. A continued cost is associated with purchase and disposal of the filter medium,which is usually discarded at the end of each filter cycle.
2. Precoat filtration is less cost-effective for waters that require pretreatment foralgae, color, and taste and odor problems or DBP precursor removal.Waters con-taining only larger plankton such as diatoms can sometimes be treated economi-cally by microstraining prior to the precoat filtration.
3. Proper design, construction, and operation are absolutely essential to prevent thefilter cake from dropping off of the septa or cracking during operation, whichcould result in the system failing to remove the target particulates.
Precoat filtration has been shown to be very effective in the removal of Giardia cystsover a broad range of operating conditions typical of potable water filtration (Logs-don et al., 1981; Lange et al., 1986). The need for proper operation and maintenanceis emphasized, however, and a precoat rate of 0.2 lb/ft2 (1 kg/m2) is recommended.Other information on removal of cysts was presented earlier in the Introduction sec-tion of this chapter.
The capability of precoat filteration to remove cysts and the fact that chemicalcoagulation is not required makes this option attractive to very small communitiesfacing filtration because of concern about cysts in source waters. Operators skilled incoagulation are less likely to be available in small installations, but operators pos-sessing mechanical skills are required.
The removal of small particulates such as bacteria and viruses depends on thegrade of filter aid used and other operating conditions (Lange et al., 1986). Captureof smaller particles such as bacteria, viruses, and asbestos fibers can be enhanced byusing aluminum or iron coagulants or cationic polymers to coat the filter medium(Lange et al., 1986; Brown, Malina, and Moore, 1974; Baumann, 1975; Burns, Bau-mann, and Oulman, 1970).
GRANULAR BED AND PRECOAT FILTRATION 8.83

The Filter Element and Septum
The filter element is a vital element of a precoat filter because it supports the sep-tum and the filter medium. The attributes of good filter elements and septa aredetailed in the AWWA Precoat Filtration Manual (American Water Works Associa-tion, 1995a). Filter elements may be either flat or tubular (Figures 8.34 and 8.35).Flat elements, often referred to as leaves, may be rectangular, or round.Tubular ele-ments are available in several different cross-sectional shapes, but are generallyround.
Overlaying the filter element is the septum material, consisting of either tightlywoven stainless steel wire mesh or a tightly fitted synthetic cloth bag, usually madefrom monofilament polypropylene weave. The precoat layer forms on and is sup-ported by the septum. For this to occur, the size of the clear openings in the septummust be small enough for the filter medium particles to form and maintain stablebridges across the openings. Generally, a clear opening of 0.005 in (about 125 µm) orless in one direction is desirable.
The septum must be firmly supported so that it does not yield, flex, or becomedistorted as the differential pressure drop increases during the filter cycle, whichcould result in temporary cracks in the filter medium.
The Filter Vessel
Two basic types of precoat filter vessels that contain multiple filter elements andsepta are available. They are the vacuum filter and the pressure filter.
Vacuum Filters. The vessel containing vacuum filter elements and their septa is anopen tank at atmospheric pressure. A filter discharge pump or a vacuum dischargeleg downstream of the filter creates a suction. This suction enables the availableatmospheric pressure to move water through the precoat and filter medium cake asthe cake builds up. The open filter tanks permit easy observation of the condition ofthe septa and elements and general condition of the filter during filtration and clean-ing.
The maximum available differential pressure across the vacuum filter is limitedto the net positive suction head of the filter pump or the vacuum leg. This limitationinfluences the length of filter cycles.
The effect of any entrained air or dissolved gases coming out of solution becauseof the decrease in pressure also must be considered with vacuum filters. Gas willhave an adverse effect on the filter cake, tending to disrupt the integrity of the filtermedium on the septum. One advantage of the vacuum filter is that the condition ofthe cake can be easily observed at the open water surface. This is not possible in apressure filter.
Pressure Filters. A filter feed pump or influent gravity flow produces higher thanatmospheric pressure on the inlet (upstream) side of a pressure filter, forcing liquidthrough the filter medium cake (Figures 8.2 and 8.35). Large pressure drops acrossthe filter are theoretically possible (limited only by the strength of the filter shell andthe filter elements and septa), but the maximum economical differential pressuredrop is generally limited to 30 to 40 psi (206 to 276 kPa). Typically, a higher pressuredrop across a pressure filter will yield longer cycles than with vacuum filters, whichin turn will yield greater removal of suspended solids per pound of filter medium.However, increased pumping costs for differential pressures much over 30 to 40 psi(206 to 276 kPa) usually offset savings in costs of filter medium.
8.84 CHAPTER EIGHT
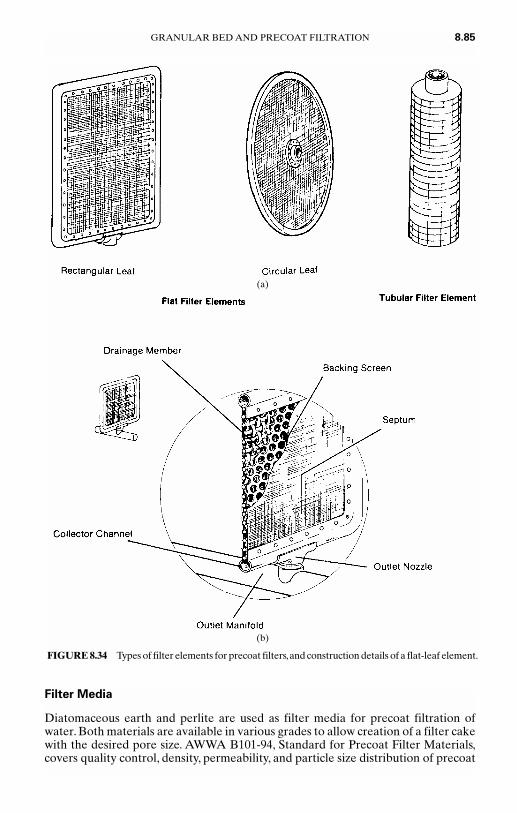
Filter Media
Diatomaceous earth and perlite are used as filter media for precoat filtration ofwater. Both materials are available in various grades to allow creation of a filter cakewith the desired pore size. AWWA B101-94, Standard for Precoat Filter Materials,covers quality control, density, permeability, and particle size distribution of precoat
GRANULAR BED AND PRECOAT FILTRATION 8.85
FIGURE 8.34 Types of filter elements for precoat filters,and construction details of a flat-leaf element.
(b)
(a)

filter media (American Water Works Association, 1995b). Pilot testing can deter-mine the two or three most suitable grades of filter medium that will produce thedesired clarity, simplifying the task of optimizing a final selection when working witha full-scale plant.
Filter Operation
Precoating. Successful precoating requires the uniform application of precoat fil-ter aid to the entire surface of the clean septa. This is accomplished by recirculatinga concentrated slurry of clean water and filter medium (generally 12 percent orgreater) through the filter at 1.0 to 1.5 gpm/ft2 (2.4 to 3.7 m/h) until most of themedium has been deposited on the septa and the recirculating water turbidity is low-ered to the desired treated water quality.
Because particles of the medium are much smaller than the clear openings in theseptum, their retention and the formation of a stable precoat take place as a resultof bridging.As the particles crowd together when passing through the openings, theyjam and interlock, forming bridges over the openings (Figure 8.36).As bridges form,additional particles are caught and the filter septum is coated. A typical precoatingsystem is shown in Figure 8.33. The thickness of the precoat layer is typically 1⁄16 to 1⁄8 in. (1.5 to 3 mm).
Body-feeding. The amount of body feed to be added to the source water is deter-mined by the nature and amount of the solids to be removed. Pilot testing duringrepresentative source water quality periods will generally indicate the type andrange of solids that will be encountered and the amount and type of body feedneeded to provide an incompressible and permeable cake.
Typical body feed ratios of 1 to 10 mg/L of diatomite for each 1 mg/L of sus-pended solids are required, depending on the type of solids being filtered. Details ofselecting the appropriate ratio will be presented later. Compressible solids such asalum or iron coagulation solids require the highest ratios. Proper control of the body
8.86 CHAPTER EIGHT
FIGURE 8.35 Typical pressure tubular filter and leaf filter for precoat filtration.
(a) (b)

feed dosage is the most important factorcontributing to economical operation ofa precoat filtration plant.
Body feed equipment can be classifiedas dry or wet systems. The wet, or slurry,feeders are the most common type. Theattributes of good precoat and body feedequipment have been presented in theAWWA Precoat Filtration Manual (Amer-ican Water Works Association, 1995a).
Spent Cake Removal. At the end ofeach filter cycle, the spent filter cake isremoved from the filter in preparationfor the precoat that will begin the nextcycle. If spent solids are not fullyremoved from the filter vessel, the mate-rial could be resuspended and depositedon the filter septa. The resuspended dirtymaterial could foul the septa, althoughthe effect would usually develop gradu-ally so that the operator would becomeaware of it only after a number of cycles.
The most reliable means of determin-ing the cleanliness of the septa involvesvisual observation of the bare septa, fol-lowed by observation of the uniformity
and completeness of precoat. When the septa cannot be fully inspected, a higherthan normal differential pressure immediately after precoating (at the start of thefiltration cycle) would suggest that the septa are becoming fouled.
Techniques for removing the spent cake vary with the different kinds of filter ves-sels and filter elements. Spent cake removed from a precoat filter is a mixture of fil-ter medium and the materials removed from the source water. This waste matter isusually removed from the filter in slurry form. Although some systems may be ableto dispose of the slurry into a sanitary sewer system, most plants must dewater thewaste material and make separate provisions for the solids and liquid wastes. Meth-ods of handling wastes are covered further in Chapter 16, Water Treatment PlantWaste Management.
Theoretical Aspects of Precoat Filtration
Understanding the probable effect of flow rate, terminal head loss, and body feedrate on the operation of the filter is necessary to obtain maximum economy in thedesign and operation of a precoat filter. The most important of these items affectingfilter operation is the prudent use of body feed during a filter run.
Effect of Concentration of Body Feed. The results of a typical series of filter runsconducted at a constant rate of filtration and to a constant terminal pressure drop,but with varying amounts of body feed, are shown in Figure 8.37. The total volumeof filtrate is plotted against the total head loss in feet of water. The initial head lossis caused by the clean precoat layer, septum, and filter element. With no body feed
GRANULAR BED AND PRECOAT FILTRATION 8.87
FIGURE 8.36 Illustration of precoat forma-tion, with bridges of precoat between the ele-ments of the septum material. (Source:Courtesy of Manville Filtration & MineralsDivision.)

8.88 CHAPTER EIGHT
FIGURE 8.37 Effect of varying the concentration of body feed CD
on the relationship of head loss to volume of filtrate for flat septa.
or insufficient amounts of body feed, the head loss will increase more rapidly as therun continues. This is because suspended solids that are removed on the surface ofthe precoat layer soon form a compressible, impermeable layer of solids that will notreadily permit the passage of water.
With increased amounts of body feed, the mixture of body feed and solidsremoved from the water will be less compressible and of higher porosity and per-meability.As a result, the head loss will develop more slowly (e.g., CD = 5 units in Fig-ure 8.37). With sufficient body feed, the cake will be incompressible, and head losswill develop in a linear manner when using flat septa (e.g., CD = 10 units in Figure8.37). With still higher rates of body feed, the slope of the straight-line plot will getflatter.The most economical use of body feed generally occurs at the lowest concen-tration that generates a linear head loss curve when using flat septa.
The linear head loss curves shown in Figure 8.37 for higher body feed concentra-tions only occur with flat septa at constant total flow rates.With tubular septa, as thebody feed layer gets thicker, the area of filtration increases and the effective filtra-tion rate decreases for the outer layers of the cake. This causes head loss to increasemore slowly as the cycle progresses (Dillingham, Cleasby, and Baumann, 1967a).
Effect of Filtration Rate. Consider the linear head loss curve for a flat septa at aconstant flow rate and with adequate body feed as shown in Figure 8.37. The totalhead loss at any time is the sum of the initial head loss (caused by precoat layer, fil-ter element, and septum) plus the head loss of the body feed layer.The flow throughthe entire filter cake at the usual filtration velocities is laminar. Therefore, the fol-lowing can be stated with regard to head loss development.
1. Head loss for a particular instant (i.e., cake thickness) is proportional to the fil-tration rate Q because of laminar flow conditions.
2. Head loss across the body feed layer is proportional to the thickness of the layer.This, in turn, is proportional to the volume of filtrate V ′ = filtration rate Q timesrunning time t at constant body feed concentration.
3. Thus, combining 1 and 2 above, the head loss in the body feed layer at any instantis proportional to Q2t.
Using the above concepts, the rate of head loss development at two different filtra-tion rates Q1 and Q2 can be compared:
h1 ∝ Q12t1 and h2 ∝ Q2
2t2 (8.26)

Dividing these two expressions and for the case of the same terminal head loss, h1 = h2:
= (8.27)
Similarly,
V1′ = Q1t1 and V2′ = Q2t2 (8.28)
Dividing these two equations and inserting the previous relation for t1/t2:
(8.29)
According to these expressions, for a given terminal head loss, the length of filter runis inversely proportional to the square of the filtration rate, and the filtrate volumeis inversely proportional to the filtration rate. (These relationships are approximatebecause the impact of the precoat head loss has been ignored because it is usuallytrivial compared to the body feed head loss.) Equations 8.27 and 8.29 help explainwhy the most economical operation of precoat filters usually occurs at fairly low fil-tration rates, 1 gpm/ft2 (2.4 m/h) being most common, but with 0.5 to 3 gpm/ft2
(1.2 to 7.3 m/h) used in some plants.
Mathematical Model for Precoat Filtration. A rigorous mathematical model hasbeen presented for head loss development for a precoat filter operating at constanttotal flow rate. The model describes the head loss for either flat or tubular septaoperating with adequate body feed to achieve an incompressible cake (Dillingham,Cleasby, and Baumann, 1967a; Weber, 1972). To use the model, empirical filter cakeresistance indices must be determined for the precoat and the body feed layers bypilot filter operation. The body feed resistance index can be correlated empiricallyto the ratio of source water suspended solids concentration to the body feed con-centration (Dillingham, Cleasby, and Baumann, 1967b).The model can be used in anoptimization program to select the particular combination of filtration rate, terminalhead loss, and body feed concentration for best overall economy (Dillingham,Cleasby, and Baumann, 1966).
OTHER FILTERS
A variety of proprietary filtration systems have been developed by manufacturers.Several examples of such filters are described in the following subsections. In somecases, the patents for these filters have expired, and more than one manufacturermay now be producing similar products.
Low-Head Continuous Backwash Filters
The low-head, continuous backwash filter has been used on some supplies (Medlar,1974). Several manufacturers now offer this type of filter. The filter usually consistsof a shallow bed of sand about 1 ft (0.3 m) deep, with an ES of 0.4 to 0.5 mm.The bedis divided into multiple compartments, with the filtrate flowing to a common efflu-ent channel. A traveling-bridge backwash system, equipped with a backwash pumpand a backwash collection system, washes each cell of the filter in succession as it
Q2�Q1
V1′�V2′
Q22
�Q1
2
t1�t2
GRANULAR BED AND PRECOAT FILTRATION 8.89

traverses the length of the filter.The backwash system is capable of traversing the fil-ter intermittently or continuously.
Because the filter is washed frequently at low head loss, the solids are removedprimarily near the top surface of the fine sand. This facilitates removal of the solidsduring the short backwash period, which lasts only about 15 s for each cell.
A primary advantage of this filter is that it is backwashed frequently at low headloss and therefore does not require as deep a filter box as a conventional gravity fil-ter. This type of filter also eliminates the need for a filter gallery, a large backwashpump, and the associated large backwash piping. Thus the capital cost is lower thanfor a conventional gravity filter plant.
Some concerns regarding the low-head continuous backwash system deserveconsideration, however. The backwash is very brief and is unassisted by auxiliaryscour. Therefore, if the filter is blinded by a short-term influent flow containing highlevels of solids, cleanup of the filter by the normal backwash routine may be difficult.The flow rate and filtrate quality from individual cells are not monitored. During thebackwashing operation, the cells that are washed first immediately return to servicewhile the traveling bridge continues to backwash the remaining cells. Therefore, thecells backwashed first operate at higher rates of filtration for a brief period preced-ing completion of the entire filter wash—leading to concern over the passage ofsolids through the newly cleaned cells during this period of higher filtration rate.Theimpact of the initial improvement period on the filtrate quality is also of concernbecause the backwashes occur more frequently. Therefore, a greater portion of thetotal operating time occurs during the initial improvement period.
In response to these concerns, this type of filter is now being marketed withoptions for deeper medium and with filter-to-waste capability. It is also being pre-ceded by coagulation and sedimentation to enhance its range of application and reli-ability.
Two-Stage Filtration Systems
Two-stage filtration systems were introduced to extend the application of direct fil-tration to somewhat poorer quality surface waters.These systems have received con-siderable use in package plant installations for smaller systems, but they are notlimited to small systems. Multiple modules can be utilized in larger systems.
These systems generally utilize a first-stage coarse-medium bed ahead of a con-ventional multimedia downflow filter. Coagulating chemicals are added ahead ofthe coarse-medium bed, which serves both as a contact flocculator and as a roughingfilter or clarifier to prepare the water for the multimedia filter. Additional coagu-lants or filter-aiding polymers may be added ahead of the second-stage filter.
In one system of this type, the first stage consists of a bed of plastic chips withdensity less than water, which float up against a retaining screen in an open tank(Benjes, Edlund, and Gilbert, 1985). Flow is upward through this bed, and it is back-washed periodically with simultaneous air and water. The lower density of the air-water mixture results in the plastic sinking away from the screen so it can be washedmore effectively in a semifluidized state. Another system uses a deep bed of coarsesand as the first-stage contact “clarifier,” which is operated downflow in a pressuretank and washed periodically upflow using air and water (MacNeill and MacNeill,1985). Each of these and similar systems coming on the market possesses possibleadvantages and liabilities. Some systems use a first-stage upflow roughing filter, butthere is danger of the medium being lifted as head loss develops. As new systemscome on the market, state regulatory agencies usually require demonstation testing
8.90 CHAPTER EIGHT
before granting approval for full-scale installations.A careful evaluation of the trackrecord of any new system is a prudent precaution before adoption.
Bag and Cartridge Filters
Bag filters and cartridge filters are technology developed for small to very small sys-tems and for point-of-use filtration applications. These filters are basically pressurevessels containing a woven bag or a cartridge with a wound-filament filter. Waterpasses through the bag or the wound-filament cartridge, and particles large enoughto be trapped in the pores of the bag or cartridge are removed.
Bag filters and cartridge filters should be applied only for treatment of high-qualitysource waters. Chemical coagulation is not employed, and these filters do not removedissolved substances such as true color or soluble contaminants. Viruses and bacteriacan pass through most of these filters. Source waters should have little virus or bacte-ria contamination, as disinfection will be relied upon to control these microorganisms.High turbidity can clog these filters prematurely, or excessive turbidity can passthrough.Algae also can clog bag filters or cartridge filters prematurely.
Cartridge filters are usually rated by their manufacturers as to the nominal parti-cle size to be retained, with the smallest being about 0.2 µm and the largest going upto about 10 µm. Some pore sizes may be smaller or larger than the nominal size, socare must be used in the selection of these filters for removal of Giardia cysts andCryptosporidium oocysts. The importance of selecting a proper pore size is compli-cated by the capability of cysts and oocysts to deform somewhat and to squeezethrough pores seemingly small enough to prevent their passage.
As water is filtered through a bag or cartridge filter, eventually the pressure dropbecomes so great that terminating the filter run is necessary. When this is done, thefilter is not backwashed, but rather the bag or cartridge is thrown away and replacedby a clean one. Filter run length has an important influence on bag filtration and car-tridge filtration economics, as frequent bag or cartridge replacement will drive upoperating costs.
Monitoring and operating requirements for bag filters and cartridge filters areuncomplicated. Turbidity of filtered water should be monitored daily, and the oper-ator should monitor head loss through the filter and total gallons of water filtered soas to be able to estimate when replacement of the existing bag or cartridge is neces-sary. Operators need to exercise care in changing filter bags or cartridges when theyhave become clogged and terminal head loss is attained.The manufacturer’s instruc-tions should be followed carefully so that the clean cartridges or bags are not dam-aged during installation.
Disinfection is an essential process in a treatment train involving a bag or car-tridge filter, so extra care is needed for this process. The entire SWTR requirementfor virus removal and inactivation needs to be met by disinfection. With the use offree chlorine, this would not be difficult, in most situations. The very short residencetime of disinfectants in the filters, though, means that disinfectant contact time maybe needed in storage after filtration.
EMERGING TECHNOLOGY
The desire to reduce overall costs or to treat some waters more effectively is drivingthe development of new technologies involving filtration.
GRANULAR BED AND PRECOAT FILTRATION 8.91

The poor settleability of algal-laden or colored surface waters after coagulationand flocculation has led to the development of proprietary systems incorporatingflotation and filtration in the same tank. (See Chapter 7, Sedimentation and Flota-tion, for further details.)
There is growing use of membrane filters in place of or in addition to granularbed filters. Membrane filters are discussed in Chapter 11.
Various granular filters that use moving media during the filtration process arealso on the market. Their primary application is in wastewater filtration, but someconsideration is being given to potable water applications.
WASTE DISPOSAL
Wastes generated in the filtering operations covered in this chapter include wastebackwash water from rapid filters and precoat filters, and dirty sand from scrapingof slow sand filters.
Backwash water in rapid filtration plants is often recovered and recycled throughthe plant, as discussed earlier. In conventional plants, it may be recycled without sed-imentation, in which case the backwash solids end up in the sedimentation tankwaste solids. In direct and in-line filtration plants, the solids must be separatedbefore recycle because this is the only waste solids discharge from the plant.The sep-arated solids may be generated in a slurry that must be handled as a waste stream.
Spent cake removed from precoat filters at the end of each filter cycle is a mix-ture of filter media and organic and inorganic solids removed from the source water.It is usually transported as a slurry to a solids separation step.After separation of thesolids from the slurry, the water may be recycled or wasted. The solids are quitedewaterable because of the high content of body feed and precoat media, and maybe further dewatered for land disposal.
Dirty sand removed from slow sand filters is a mixture of sand, biological organ-isms from the schmutzdecke, and other organic and inorganic solids captured from thesource water. The dirty sand is usually cleaned hydraulically and stockpiled for laterreplacement in the filter.The hydraulic cleaning generates a slurry of all solids exceptthe sand. This slurry must be handled as a waste stream. If the sand is not recovered,the dirty sand can be disposed of as a solid waste. It is preferable to clean and reuse thesand because it meets the desired size specification and is free of dust after washing.
Methods of handling the waste streams or solids from water plants are coveredfurther in Chapter 16, Water Treatment Plant Waste Management.
BIBLIOGRAPHY
Adin, A., and M. Rebhun. “A Model to Predict Concentration and Head Loss Profiles in Fil-tration.” Journal AWWA, 69(8), August 1977: 444.
Al-Ani, M. Y., D. W. Hendricks, G. S. Logsdon, and C. P. Hibler. “Removing Giardia Cysts fromLow Turbidity Waters by Rapid Rate Filtration.” Journal AWWA, 78(5), 1986: 66–73.
American Public Health Association,American Water Works Association, and Water Environ-ment Foundation. Standard Methods for the Examination of Water and Wastewater, 19th ed.Washington, DC: APHA, 1995.
American Society for Testing and Materials. Concrete and Aggregates, 1993 Annual Book ofASTM Standards, Vol. 04.02. Philadelphia, Pennsylvania: ASTM, 1993.
8.92 CHAPTER EIGHT

American Water Works Association. Water Quality and Treatment, 3rd ed. New York: McGrawHill 1971.
American Water Works Association. AWWA Standard for Filtering Material, Standard B100-96.Denver, Colorado: AWWA, 1996.
American Water Works Association. AWWA Standard for Granular Activated Carbon, Stan-dard B604-90. Denver, Colorado: AWWA, 1991.
American Water Works Association. Precoat Filtration, Manual M30. Denver, Colorado:AWWA, 1995a.
American Water Works Association. AWWA Standard for Precoat Filter Materials, StandardB101-94. Denver, Colorado: AWWA, 1995b.
Amirtharajah, A. “Optimum Backwashing of Sand Filters.” Jour. Envir. Engr. Div.—ASCE,104(EE5), October 1978: 917.
Amirtharajah, A. “Fundamentals and Theory of Air Scour.” Jour. Envir. Engr. Div.—ASCE,110(3), June 1984: 573.
Amirtharajah, A., and D. P. Wetstein. “Initial Degradation of Effluent Quality During Filtra-tion.” Journal AWWA, 72(9), September 1980: 518.
Arboleda, J. V. “Hydraulic Control Systems of Constant and Declining Flow Rate in Filtra-tion.” Journal AWWA, 66(2), February 1974: 87.
Arboleda-Valencia, J. “Hydraulic Behavior of Declining-Rate Filtration.” Journal AWWA,77(12), December 1985: 67.
Aultman, W. W. “Valve Operating Devices and Rate-of-Flow Controllers.” Journal AWWA,51(11), November 1959: 1467.
Babbitt, H. E., J. J. Doland, and J. L. Cleasby. Water Supply Engineering, 6th ed. New York:McGraw-Hill, 1962.
Bauer, M. J., J. S. Colbourne, D. M. Foster, N. V. Goodman, and A. J. Rachwal. “GAC EnhancedSlow Sand Filtration (GAC Sandwich).” In: Advances in Slow Sand And Alternative Biolog-ical Filtration, N. Graham and R. Collins, ed., 223–232. New York: John Wiley & Sons, 1996.
Baumann, E. R.,T.Willrich, and D. D. Ludwig.“For Purer Water Supply, Consider Prechlorina-tion.” Agricultural Engineering, 44(3), 1963: 138. (The above is a condensation of: “Effect ofPrechlorination on Filtration and Disinfection.” Paper No. 62–208, 7 pp., Amer. Soc. of Agr.Engrs., June 19, 1962.)
Baumann, E. R. “Diatomite Filters for Removal of Asbestos Fibers.” In Proc. AWWA Ann.Conf., Minneapolis, Minnesota, 1975.
Baylis, J. R. “Seven Years of High-Rate Filtration.” Journal AWWA, 48(5), May 1956: 585.Baylis, J. R. “Nature and Effect of Filter Backwashing.” Journal AWWA, 51(1), January 1959a:131.
Baylis, J. R. “Variable Rate Filtration.” Pure Water, May 1959b.Baylis, J. R. “Review of Filter Design and Methods of Washing.” Journal AWWA, 51(11),November 1959c: 1433.
Baylis, J. R. “Discussion of Conley and Pitman.” Journal AWWA, 52(2) February 1960: 214.Bellamy,W. D., J. L. Cleasby, G. S. Logsdon, and M. J.Allen.“Assessing Treatment Plant Perfor-mance.” Journal AWWA, 85(12), December 1993, 34–58.
Bellamy, W. D., D. W. Hendricks, and G. S. Logsdon. “Slow Sand Filtration: Influences ofSelected Process Variables.” Journal AWWA, 77(12), December 1985: 62–66.
Bellamy, W. D., G. P. Silverman, D. W. Hendricks, and G. S. Logsdon. “Removing Giardia cystswith Slow Sand Filtration.” Journal AWWA, 77(2), February 1985: 52–60.
Benjes, H. H., C. E. Edlund, and P.T. Gilbert.“Adsorption Clarifier Applied to Low TurbiditySurface Supplies.” In Proc. AWWA Ann. Conf., Washington, D.C., June 1985.
Bowers, D.A.,A. E. Bowers, and D. D. Newkirk.“Development and Evaluation of a CoagulantControl Test Apparatus for Direct Filtration.” In Proc. AWWA Water Qual. Tech. Conf.,Nashville, Tennessee, 1982.
GRANULAR BED AND PRECOAT FILTRATION 8.93
Brown, W. G. “High-rate filtration experience at Durham, N.C.” Journal AWWA, 47(3), March1955: 243.
Brown, T. S., J. F. Malina, Jr., and B. D. Moore. “Virus Removal by Diatomaceous Earth Filtra-tion” (Part 2). Journal AWWA, 66(12), December 1974: 735.
Browning, R. C. “New Method and Revised Nomenclature for Granular Filter Flow Control.”Proc. Australian Water and Wastewater Association (pp. 202–209), Adelaide, Australia, March23–27, 1987.
Bryant, A., and C. Yapijakis. “Ozonation-Diatomite Filtration Removes Color and Turbidity.”Water and Sewage Works (October 1977) Part 1, 124:96; Part 2, 124:94.
Burns, D. E., E. R. Baumann, and C. S. Oulman.“Particulate Removal on Coated Filter Media.”Journal AWWA, 62(2), February 1970: 121.
Cable, C. J., and R. G. Jones.“Assessing the Effectiveness of Ozonation Followed by Slow SandFiltration in Removing THM Precursor Material from an Upland Water.” In: Advances inSlow Sand And Alternative Biological Filtration, N. Graham and R. Collins, ed., pp. 29–38. NewYork: John Wiley & Sons, 1996.
Camp, T. R. “Discussion of Conley—Experiences with Anthracite Filters.” Journal AWWA,53(12), December 1961: 1478.
Camp, T. R. “Theory of Water Filtration.” Journal San. Eng. Div.—ASCE, 90(SA4), 1964:1.Cleasby, J. L. “Filter Rate Control Without Rate Controllers.” Journal AWWA, 61(4), April1969a: 181.
Cleasby, J. L. “Approaches to a Filterability Index for Granular Filters.” Journal AWWA, 61(8),August 1969b: 372.
Cleasby, J. L. September 1981. “Declining Rate Filtration.” Journal AWWA, 73(9), September1981: 484.
Cleasby, J. L. “Status of Declining Rate Filtration Design.” Water Science Technology, 27(10),1993: 151.
Cleasby, J. L., A. Arboleda, D. E. Burns, P. W. Prendiville, and E. S. Savage. “Backwashing ofGranular Filters.” (AWWA Filtration Subcommittee Report). Journal AWWA, 69(2), Febru-ary 1977: 115.
Cleasby, J. L., and E. R. Baumann. “Selection of Sand Filtration Rates.” Journal AWWA, 54(5),May 1962: 579.
Cleasby, J. L., A. H. Dharmarajah, G. L. Sindt, and E. R. Baumann. Design and OperationGuidelines for Optimization of the High-Rate Filtration Process: Plant Survey Results. Denver,Colorado: AWWA Research Foundation, 1989.
Cleasby, J. L., and L. DiBernardo. “Hydraulic Considerations in Declining-Rate FiltrationPlants.” Journal Envir. Engr. Div.—ASCE, 106(EE6), December 1980: 1043.
Cleasby, J. L., and K. S. Fan. “Predicting Fluidization and Expansion of Filter Media.” JournalEnvir. Engrg. Div.—ASCE, 107(EE3), June 1981: 455.
Cleasby, J. L., D. J. Hilmoe, C. J. Dimitracopoulos, and L. M. Diaz-Bossio. “Effective FiltrationMethods for Small Water Supplies.” Final Report: USEPA Cooperative Agreement CR808837-01-0, NTIS No. PB84-187-905, 1984.
Cleasby, J. L., D. J. Hilmoe, and C. J. Dimitracopoulos.“Slow Sand and Direct In-Line Filtrationof a Surface Water.” Journal AWWA, 76(12), December 1984: 44.
Cleasby, J. L., G. L. Sindt, D. A. Watson, and E. R. Baumann. Design and Operation Guidelinesfor Optimization of the High-Rate Filtration Process: Plant Demonstration Studies. Denver,Colorado: AWWA Research Foundation, 1992.
Cleasby, J. L., M. M. Williamson, and E. R. Baumann. “Effect of Rate Changes on FilteredWater Quality.” Journal AWWA, 55(7), July 1963: 869.
Cleasby, J. L., and C. W. Woods. “Intermixing of dual and multi-media granular filters.” JournalAWWA, 67(4), April 1975: 197.
Clough, G., and K. J. Ives.“Deep Bed Filtration Mechanisms Observed with Fiber Optic Endo-scopes and CCTV.” In: Proceedings 4th World Filtration Congress, Part II, Ostend, Belgium,1986. Published by The Royal Flemish Society of Engineers, K.VIV, Jan van Rijswijcklaan 58,B-2018 Antwerpen (Belgium).
8.94 CHAPTER EIGHT

Collins, M. R.,T.T. Eighmy, and J. P. Malley, Jr.“Evaluating Modifications to Slow Sand Filters,”Journal AWWA, 83(9), 1991, 62–70.
Committee Report. “The Status of Direct Filtration.” Journal AWWA, 72(7), July 1980: 405.Committee Report. “Comparison of Alternative Systems for Controlling Flow through Fil-ters.” Journal AWWA, 76(1), January 1984: 91.
Conley, W. R. “Experiences with Anthracite Sand Filters.” Journal AWWA, 53(12), December1961: 1473.
Conley, W. R. “Integration of the Clarification Process.” Journal AWWA, 57(10), October 1965:1333.
Conley, W. R. “High Rate Filtration.” Journal AWWA, 64(3), March 1972: 203.Conley, W. R., and K. Y. Hsuing. “Design and Application of Multimedia Filters.” JournalAWWA, 61(2), February 1969: 97.
Conley, W. R., and R. W. Pitman. “Test Program for Filter Evaluation at Hanford.” JournalAWWA, 52(2), February 1960a: 205.
Conley, W. R., and R. W. Pitman. “Innovations in Water Clarification.” Journal AWWA, 52(10),October 1960b: 1319.
Cornwell, D.A., M. M. Bishop,T. R. Bishop, and N. E. McTigue. Full scale Evaluation of Declin-ing and Constant Rate Filtration. Denver, Colorado: AWWA Research Foundation, 1991.
Cornwell, D. A. and R. G. Lee. “Waste Stream Recycling: Its Effect on Water Quality.” JournalAWWA, 86(11), November 1994: 50.
Cullen, T. R., and R. D. Letterman. “The Effect of Slow Sand Filter Maintenance on WaterQuality.” Journal AWWA, 77(12), December 1985: 48.
Culp, R. L. “Direct Filtration.” Journal AWWA, 68(6), July 1977: 375.Degremont, G. Water Treatment Handbook. Caxton Hill, Hertford, England: Stephen Austin &Sons Ltd., 1973.
Dehab, M. F., and J. C. Young. “Unstratified-Bed Filtration of Wastewater.” Jour. Envir. Engr.Div.—ASCE, 103(1), February 1977: 21.
Dharmarajah, A. H., and J. L. Cleasby. “Predicting the Expansion of Filter Media.” JournalAWWA, 78(12), December 1986: 66.
Diaper, E. W. J., and K. J. Ives. “Filtration Through Size-Graded Media.” Jour. San. Eng. Div.—ASCE, 91(SA3), June 1965: 89.
DiBernardo, L., and J. L. Cleasby.“Declining Rate Versus Constant Rate Filtration.” Journal ofEnvironmental Engineering, 106(6), 1980: 1023.
Dillingham, J. H., J. L. Cleasby, and E. R. Baumann. “Optimum Design and Operation ofDiatomite Filtration Plants.” Journal AWWA, 58(6), June 1966: 657.
Dillingham, J. H., J. L. Cleasby, and E. R. Baumann. “Diatomite Filtration Equations for Vari-ous Septa.” Jour. San. Engr. Div.—ASCE, 93(SA1), February 1967a: 41.
Dillingham, J. H., J. L. Cleasby, and E. R. Baumann.“Prediction of Diatomite Filter Cake Resis-tance.” Jour. San. Engr. Div.—ASCE, 93(SA1), February 1967b: 57.
Eliassen, R. “Clogging of Rapid Sand Filters.” Journal AWWA, 33(5), May 1941: 926.Elimelech, M., J. Gregory, X. Jia, and R.A.Williams. Particle Deposition and Aggregation, Mea-surement, Modelling and Simulation. Oxford, UK: Butterworth- Heinemann, Ltd., 1995.
Ergun, S. “Fluid Flow Through Packed Columns.” Chemical Engineering Progress, 48(2),February 1952a: 89.
Ergun, S. “Determination of geometric surface area of crushed porous solids.” AnalyticalChemistry, 24, 1952b: 388.
Fair, G. M., J. C. Geyer, and D. A. Okun. Water and Wastewater Engineering (Vol. 2). New York:John Wiley & Sons, Inc., 1968.
Fox, K. R., R. J. Miltner, G. S. Logsdon, D. L. Dicks, and L. F. Drolet. “Pilot Plant Studies ofSlow-Rate Filtration.” Journal AWWA, 76(12), December 1984: 62.
Fuller, G.W. The Purification of the Ohio River Water at Louisville, Kentucky. New York: D.VanNostrand Co., 1898.
GRANULAR BED AND PRECOAT FILTRATION 8.95

Gainey, P. L., and T. H. Lord. Microbiology of Water and Sewage. Englewood Cliffs, New Jersey:Prentice-Hall, Inc. 1952.
Ginn Jr., T. M., A. Amirtharajah, and P. R. Karr. “Effects of Particle Detachment in Granular-Media Filtration.” Journal AWWA, 84(2), 1992: 66–76.
Ghosh, M. M., P. F. Schuler, and P. Gopalan. “Field Study of Giardia and CryptosporidiumRemoval from Pennsylvania Surface Waters by Slow Sand and Diatomaceous Earth Filtra-tion”. Final Report for Department of Environmental Resources, Commonwealth of Penn-sylvania. University Park, Pennsylvania: Environmental Resources Research Institute,Pennsylvania State University, 1989.
Graese, S. L., V. L. Snoeyink, and R. G. Lee. GAC Filter-Adsorbers. Denver, Colorado: Ameri-can Water Works Association Research Foundation, 1987.
Great Lakes Upper Mississippi River Board of State Public Health and Environmental Man-agers. Recommended Standards for Water Works (1992 edition). Published by Health Educa-tion Service, P.O. Box 7283, Albany, New York 12224.
Haarhoff, J., and J. L. Cleasby. “Biological and Physical Mechanisms in Slow Sand Filtration.”In: Slow Sand Filtration. G. S. Logsdon, ed., pp. 69–100. New York, NY: Task Committee onSlow Sand Filtration, American Society of Civil Engineers, 1991.
Harris, W. L. “High-Rate Filter Efficiency.” Journal AWWA, 62(8), August 1970: 515.Heertges, P. M. and C. E. Lerk. “The Functioning of Deep Filters: Part I, The Filtration of Floc-culated Suspensions.” Trans. Instn. of Chem. Eng., 45(T138), 1967.
Hendricks, D., J. M. Barrett, J. Bryck, M. R. Collins, B. A. Janonis, and G. S. Logsdon. Manual ofDesign for Slow Sand Filtration. Denver, Colorado: AWWA Research Foundation, 1991.
Herzig, J. P., D. M. LeClerc, and P. LeGoff. “Flow of Suspensions Through Porous Media.”Industrial & Engineering Chemistry, 62(5), May 1970: 8.
Hewitt, S. R., and A. Amirtharajah. “Air Dynamics Through Filter Media During Air Scour.”Jour. Envir. Engr. Div.—ASCE, 110(3), June 1984: 591.
Hibler, C. P., C. M. Hancock, L. M. Perger, J. G. Wegrzyn, and K. D. Swabby. Inactivation of Giardia Cysts with Chlorine at 0.5°C to 5°C. Denver, Colorado: American Water Works Asso-ciation Research Foundation, 1987.
Hilmoe, D. J., and J. L. Cleasby. “Comparing Constant Rate and Declining Rate Filtration of aSurface Water.” Journal AWWA, 78(12), December 1986: 26.
Hsiung, K. Y., and J. L. Cleasby. “Prediction of Filter Performance.” Jour. San. Engrg. Div.—ASCE, 94(SA6), December 1968: 1043.
Hudson, H. E., Jr. “Filter Design—Declining Rate Filtration.” Journal AWWA, 51(11), Novem-ber 1959: 1455.
Hudson, H. E., Jr.“High Quality Water Production and Viral Disease.” Journal AWWA, 54(10),October 1962: 1265.
Huisman, L. Rapid Filtration (Part 1), Delft, The Netherlands: Delft University of Technology,1974.
Hutchison, W. R. “High-Rate Direct Filtration.” Journal AWWA, 68(6), June 1976: 292.Iwasaki, T. “Some Notes on Sand Filtration.” Journal AWWA, 29(10), December 1937:1591–1602.
Ives, K. J., and I. Sholji. “Research on Variables Affecting Filtration.” Jour. San. Engrg. Div.—ASCE, 91(SA4), August 1965: 1.
Ives, K. J. Private communication. 1997.Kawamura, S. Integrated Design of Water Treatment Facilities. New York: John Wiley and Sons,1991.
King, P. H., R. L. Johnson, C. W. Randall, and G. W. Rehberger. “High-Rate Water Treatment:The State of the Art.” Journal Envir. Engr. Div.—ASCE, 101(EE4), August 1975: 479.
Kirmeyer, G. J. Seattle Tolt Water Supply Mixed Asbestiform Removal Study. EPA 600/2-79-125(August 1979).
Kirner, J. C., J. D. Littler, and L. A. Angelo. “A Waterborne Outbreak of Giardiasis in Camus,Wash.” Journal AWWA, 70(1), January 1978: 41.
8.96 CHAPTER EIGHT
Kramer, M. H., B. L. Herwaldt, G. F. Craun, R. L. Calderon, and D. D. Juranek. “WaterborneDiseases 1993 and 1994.” Journal AWWA, 88(3), March 1996: 66–80.
Kreissl, J. F., G. G. Robeck, and G. A. Sommerville. “Use of Pilot Filters to Predict OptimumChemical Feeds.” Journal AWWA, 60(3), March 1968: 299.
Krumbein, W. C. “Measurement and Geological Significance of Shape and Roundness of Sed-imentary Particles.” Journal Sedimentary Petrology, 11(2), August 1941: 64.
Lange, K. P., W. D. Bellamy, D. W. Hendricks, and G. S. Logsdon. “Diatomaceous Earth Filtra-tion of Giardia Cysts and Other Substances.” Journal AWWA, 78(1), January 1986: 76–84.
LeChevallier, M. W., W. D. Norton, R. G. Lee, and J. B. Rose. Giardia and Cryptosporidium inWater Supplies. Denver, Colorado: AWWA Research Foundation and AWWA, 1991.
Leland, D. E., and M. Damewood III.“Slow Sand Filtration in Small Systems in Oregon.” Jour-nal AWWA, 82(6), 1990: 50–59.
Letterman, R. D., and G. S. Logsdon. “Survey of Direct Filtration Practice.” In Proc. AWWAAnn. Conf., New Orleans, Louisiana, June 1976.
Ling, J.T.“A Study of Filtration Through Uniform Sand Filters.” In Proc.ASCE San. Engr. Div.(Paper 751), 1955.
Lippy, E. C.“Tracing a Giardiasis Outbreak at Berlin, N. H.” Journal AWWA, 70(9), September1978: 512.
Lloyd, B. J. “The Significance of Protozoal Predation and Adsorption for the Removal of Bac-teria by Slow Sand Filtration.” In: Advances in Slow Sand And Alternative Biological Filtra-tion, N. Graham and R. Collins, eds., pp. 129–138. New York: John Wiley & Sons, 1996.
Logsdon, G. S. (ed.). Slow Sand Filtration. A Report of the Task Committee on Slow Sand Fil-tration. New York: American Society of Civil Engineers, 1991.
Logsdon, G. S. Water Filtration for Asbestos Fiber Removal. EPA 600/2-79-206, December 1979.Logsdon, G. S., L. Mason, and J. B. Stanley, Jr. “Troubleshooting an Existing Treatment Plant.”Journal of New England Water Works Association, 104(1), March 1990: 43–56.
Logsdon, G. S. and J. M. Symons.“Removal of Asbestiform Fibers by Water Filtration.” JournalAWWA, 69(9), September 1977: 499.
Logsdon, G. S., J. M. Symons, and T. J. Sorg. “Monitoring Water Filters for Asbestos Removal.”Jour. Envir. Engrg. Div.—ASCE, 107(6), December 1981: 1297.
Logsdon, G. S., J. M. Symons, R. L. Hoye, Jr., and M. M. Arozarena. “Removal of Giardia Cystsand Cyst Models by Filtration.” Journal AWWA, 73(2), February 1981: 111.
Logsdon, G. S.,V. C.Thurman, E. S. Frindt, and J. G. Stoecker.“Evaluating Sedimentation and Var-ious Filter Media for Removal of Giardia Cysts.” Journal AWWA, 77(2), February 1985: 61–66.
MacNeill, J. S., Jr., and A. MacNeill. Feasibility Study of Alternative Technology for Small Com-munity Water Supply. Project Summary EPA-600/S2-84-191. Cincinnati, Ohio: USEPA WaterEngineering Research Laboratory, March 1985.
Mayhugh, J. R., Sr., J. A. Smith, D. B. Elder, and G. S. Logsdon. “Filter Media Rehabilitation ata Lime-Softening Plant.” Journal AWWA, 88(8), August 1996: 64–69.
McBride, D. G., R. C. Siemak, C. H.Tate, and R. R.Trussell.“Pilot Plant Investigations for Treat-ment of Owens River Water.” In Proc. AWWA Ann. Conf., Anaheim, California, June 1977.
McBride, D. G., and G. F. Stolarik. “Pilot to Full-Scale: Ozone and Deep Bed Filtration at theLos Angeles Aqueduct Filtration Plant.” AWWA Seminar Proceedings, Coagulation and Fil-tration: Pilot to Full Scale. No. 20017.Annual Conference, Kansas City, Missouri, June 14, 1987.
McCabe, W. L., and J. C. Smith. Unit Operations of Chemical Engineering, (3rd ed.). New York:McGraw Hill, 1976.
Medlar, S. “This Filter Cleans Itself.” The American City, 89(6), June 1974: 63.Mohanka, S. S. “Multilayer Filtration.” Journal AWWA, 61(10), October 1969: 504.Monscvitz, J. T., D. J. Rexing, R. G. Williams, and J. Heckler. “Some Practical Experience inDirect Filtration.” Journal AWWA, 70(10), October 1978: 584.
Montgomery, James M. Consulting Engineers. Water Treatment Principles and Design. NewYork: John Wiley & Sons, 1985.
GRANULAR BED AND PRECOAT FILTRATION 8.97
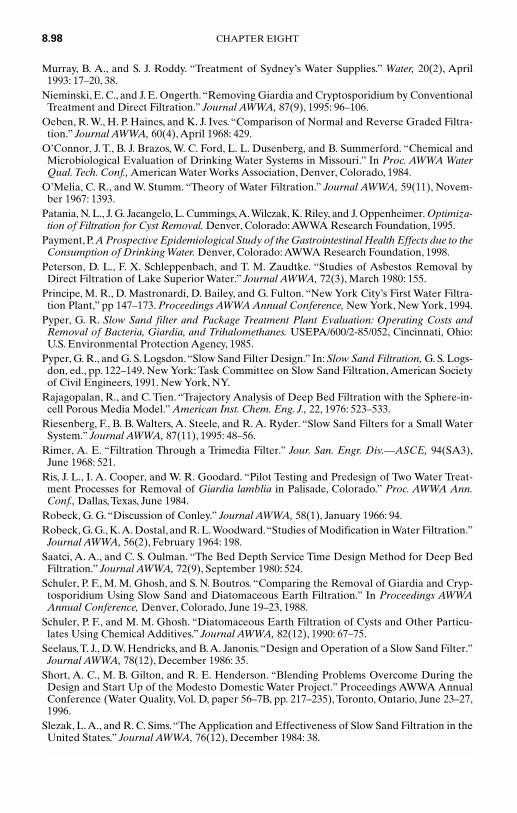
Murray, B. A., and S. J. Roddy. “Treatment of Sydney’s Water Supplies.” Water, 20(2), April1993: 17–20, 38.
Nieminski, E. C., and J. E. Ongerth.“Removing Giardia and Cryptosporidium by ConventionalTreatment and Direct Filtration.” Journal AWWA, 87(9), 1995: 96–106.
Oeben, R. W., H. P. Haines, and K. J. Ives. “Comparison of Normal and Reverse Graded Filtra-tion.” Journal AWWA, 60(4), April 1968: 429.
O’Connor, J. T., B. J. Brazos, W. C. Ford, L. L. Dusenberg, and B. Summerford. “Chemical andMicrobiological Evaluation of Drinking Water Systems in Missouri.” In Proc. AWWA WaterQual. Tech. Conf., American Water Works Association, Denver, Colorado, 1984.
O’Melia, C. R., and W. Stumm. “Theory of Water Filtration.” Journal AWWA, 59(11), Novem-ber 1967: 1393.
Patania, N. L., J. G. Jacangelo, L. Cummings,A.Wilczak, K. Riley, and J. Oppenheimer. Optimiza-tion of Filtration for Cyst Removal. Denver, Colorado:AWWA Research Foundation, 1995.
Payment, P. A Prospective Epidemiological Study of the Gastrointestinal Health Effects due to theConsumption of Drinking Water. Denver, Colorado: AWWA Research Foundation, 1998.
Peterson, D. L., F. X. Schleppenbach, and T. M. Zaudtke. “Studies of Asbestos Removal byDirect Filtration of Lake Superior Water.” Journal AWWA, 72(3), March 1980: 155.
Principe, M. R., D. Mastronardi, D. Bailey, and G. Fulton. “New York City’s First Water Filtra-tion Plant,” pp 147–173. Proceedings AWWA Annual Conference, New York, New York, 1994.
Pyper, G. R. Slow Sand filter and Package Treatment Plant Evaluation: Operating Costs andRemoval of Bacteria, Giardia, and Trihalomethanes. USEPA/600/2-85/052, Cincinnati, Ohio:U.S. Environmental Protection Agency, 1985.
Pyper, G. R., and G. S. Logsdon.“Slow Sand Filter Design.” In: Slow Sand Filtration, G. S. Logs-don, ed., pp. 122–149. New York: Task Committee on Slow Sand Filtration, American Societyof Civil Engineers, 1991. New York, NY.
Rajagopalan, R., and C. Tien. “Trajectory Analysis of Deep Bed Filtration with the Sphere-in-cell Porous Media Model.” American Inst. Chem. Eng. J., 22, 1976: 523–533.
Riesenberg, F., B. B. Walters, A. Steele, and R. A. Ryder. “Slow Sand Filters for a Small WaterSystem.” Journal AWWA, 87(11), 1995: 48–56.
Rimer, A. E. “Filtration Through a Trimedia Filter.” Jour. San. Engr. Div.—ASCE, 94(SA3),June 1968: 521.
Ris, J. L., I. A. Cooper, and W. R. Goodard. “Pilot Testing and Predesign of Two Water Treat-ment Processes for Removal of Giardia lamblia in Palisade, Colorado.” Proc. AWWA Ann.Conf., Dallas, Texas, June 1984.
Robeck, G. G. “Discussion of Conley.” Journal AWWA, 58(1), January 1966: 94.Robeck, G. G., K.A. Dostal, and R. L.Woodward.“Studies of Modification in Water Filtration.”Journal AWWA, 56(2), February 1964: 198.
Saatci, A. A., and C. S. Oulman. “The Bed Depth Service Time Design Method for Deep BedFiltration.” Journal AWWA, 72(9), September 1980: 524.
Schuler, P. F., M. M. Ghosh, and S. N. Boutros. “Comparing the Removal of Giardia and Cryp-tosporidium Using Slow Sand and Diatomaceous Earth Filtration.” In Proceedings AWWAAnnual Conference, Denver, Colorado, June 19–23, 1988.
Schuler, P. F., and M. M. Ghosh. “Diatomaceous Earth Filtration of Cysts and Other Particu-lates Using Chemical Additives.” Journal AWWA, 82(12), 1990: 67–75.
Seelaus,T. J., D.W. Hendricks, and B.A. Janonis.“Design and Operation of a Slow Sand Filter.”Journal AWWA, 78(12), December 1986: 35.
Short, A. C., M. B. Gilton, and R. E. Henderson. “Blending Problems Overcome During theDesign and Start Up of the Modesto Domestic Water Project.” Proceedings AWWA AnnualConference (Water Quality, Vol. D, paper 56–7B, pp. 217–235), Toronto, Ontario, June 23–27,1996.
Slezak, L.A., and R. C. Sims.“The Application and Effectiveness of Slow Sand Filtration in theUnited States.” Journal AWWA, 76(12), December 1984: 38.
8.98 CHAPTER EIGHT

Stanley, D. R.“Sand Filtration Studies with Radio-Tracers.” Proc.Amer. Soc. Civ. Eng., 81, 1955:592.
Tanner, S.A., and J. E. Ongerth.“Evaluating the Performance of Slow Sand Filters in NorthernIdaho.” Journal AWWA, 82(12), 1990: 51–61.
Tate, C. H., J. S. Lang, and H. L. Hutchinson. “Pilot Plant Tests of Direct Filtration.” JournalAWWA, 69(7), July 1977: 379.
Tate, C. H., and R. R.Trussell. “Use of Particle Counting in Developing Plant Design Criteria.”Journal AWWA, 70(12), December 1978: 691.
Tien, C. Granular Filtration of Aerosols and Hydrosols. Stoneham, Massachusetts: ButterworthPublishers, 1989.
Trefethen, J. M. Geology for Engineers, 2nd ed. Princeton, New Jersey: D.Van Nostrand Co., 1959.Trussell, R. R.,A. R.Trussell, J. S. Lang, and C. H.Tate.“Recent Development in Filtration Sys-tem Design.” Journal AWWA, 72(12), December 1980: 705.
Tuepker, J. L., and C. A. Buescher, Jr. “Operation and Maintenance of Rapid Sand Mixed-Media Filters in a Lime Softening Plant.” Journal AWWA, 60(12), December 1968: 1377.
Vicory, A. H., and L. Weaver. “Controlling Discharges of Water Plant Wastes to the OhioRiver.” Journal AWWA, 76(4), April 1984: 122.
Visscher, J. T. “Slow Sand Filtration: Design, Operation, and Maintenance.” Journal AWWA,82(6), 1990: 67–71.
Wagner, E. G., and H. E. Hudson.“Low-Dosage, High-Rate Direct Filtration.” Journal AWWA,74(5), May 1982: 256.
Weber, W. J. Physicochemical Processes for Water Quality Control. New York: Wiley-Interscience, 1972.
Wen, C. Y., and Y. H. Yu. “Mechanics of Fluidization.” Chemical Engineering Progress Sympo-sium Series 62, vol. 62, New York, 1966.
Yao, K. M., M. T. Habibian, and C. O’Melia. “Water and Waste Water Filtration: Concepts andApplications.” Environmental Science & Technology, 5(11), November 1971: 1105.
Yordanov, R.V.,A. J. Lamb, M.A. L. Melvin, and J. Littlejohn.“Biomass Characteristics of SlowSand Filters Receiving Ozonated Water.” In: Advances in Slow Sand And Alternative Biologi-cal Filtration, N. Graham and R. Collins, eds., pp. 107–118. New York: John Wiley & Sons, 1996.
GRANULAR BED AND PRECOAT FILTRATION 8.99