
WATER DEMAND MANAGEMENT IN MALAYSIA … download images...WATER DEMAND MANAGEMENT IN MALAYSIA THE...
33
WATER DEMAND MANAGEMENT IN MALAYSIA THE BIG PICTURE by DATO’ TEO YEN HUA Chief Execu?ve Officer Na?onal Water Services Commission (SPAN) 19 October 2009 Colloquium On Water Demand Management Putra World Trade Centre, Kuala Lumpur
Transcript of WATER DEMAND MANAGEMENT IN MALAYSIA … download images...WATER DEMAND MANAGEMENT IN MALAYSIA THE...

WATERDEMANDMANAGEMENTINMALAYSIA
THEBIGPICTURE
byDATO’TEOYENHUAChiefExecu?veOfficer
Na?onalWaterServicesCommission(SPAN)
19October2009
ColloquiumOnWaterDemandManagementPutraWorldTradeCentre,KualaLumpur

1. WhatIsDemandManagement?
2. PurposeOfWaterDemandStrategy(WDS)
3. ConsequencesOfNotHavingWDS
4. Demand‐SupplyGap
5. ManagingNonRevenueWaterLosses
7. OtherWaterDemandManagementStrategies
8. Conclusion
2
CONTENT

Purposefulandbeneficialmanipula4onofthe4mingandlevelofusage
Improvements to economic efficiencies areachieved when total benefits outweigh thetotalcostofimplementa4on
Evolved in the context of least‐cost orintegratedresourceplanning
3
1. WHATISDEMANDMANAGEMENT?

To ensure long term balance betweenavailablewaterresourcesandwaterdemand
to postpone the need for expensive capitalinfrastructure projects for as long as it iseconomicallyviable
to reduce water wastage and increase useefficiency
Improve financial health of operators andkeepingtariffsataffordablelevels
2. PURPOSEOFWATERDEMANDSTRATEGY

Risk of total demand exceeding availablesupply that may require long term waterrestric4on
Premature development of dams andtreatmentplantsatsignificantcosts
Lossofincome
Directcostofdistribu4onlosseswillcon4nuetoincrease
5
3. CONSEQUENCESOFNOTHAVINGWDS

SELANGOR–DEMAND&SUPPLYPROJECTION
3,600
3,800
4,000
4,200
4,400
4,600
4,800
5,000
5,200
5,400
5,600
2008 2009 2010 2011 2012 2013 2014 2016 2018
mld
AvailableCapacity
ForecastDemand
PlanningDemand
4. DEMAND–SUPPLYGAP(1)
Datasource:SYABASprojec4on

Demandandsupplygapmainlydueto:
Naturalincreaseindemandduetopopula4ongrowth,urbaniza4onandindustrializa4on
LossofWater
• Physicalloss• Commercialloss
Infrastructure built‐up that lags behinddemand
4. DEMAND–SUPPLYGAP(2)

PERCAPITAUSAGEBETWEEN1998‐2008
Water Supply Entities
Year ( I/cap/d)
1998 1999 2000 2001 2002 2003 2004 2005 2006 2007 2008
Johor 176 185 310 293 187 191 199 201 204 206 207
Kedah 192 184 281 305 238 323 232 232 234 244 236
Kelantan 118 113 175 151 106 109 111 111 112 144 142
Labuan 225 176 367 289 192 202 194 230 214 213 225
Melaka NA 172 372 389 194 225 205 210 213 265 268
N.Sembilan 175 107 329 327 198 202 197 362 379 237 239
Pulau Pinang 226 265 466 469 287 266 270 273 274 281 285
Pahang 198 201 273 268 155 162 162 169 173 224 228
Perak 188 191 251 266 210 213 216 216 216 217 218
Perlis 211 166 243 261 223 215 228 224 226 215 229
Sabah 134 207 110 137 78 77 103 124 135 126 106
Sarawak NA 284 218 220 160 145 155 161 163 130 129
Selangor 228 235 319 323 217 194 208 244 212 232 234
Terengganu 144 174 288 317 177 180 184 183 187 195 189
NATIONAL AVERAGE
185 190 282 287 187 184 171 172 172 206 205
Data Source JBA, KeTTHA MWIG 2003 MWIG 2005 MWIG 2006 MWIG 2007 MWIG 2009
MWIG–MALAYSIAWATERINDUSTRIALGUIDE

0.22
0.40 0.420.55 0.55
0.370.30
0.40 0.40
0.57
0.90
0.42
0.70 0.65
0.85 0.85 0.790.70 0.70 0.75
1.03
0.52
0.900.90
1.331.40
0.99 1.031.10 1.05
2.00
0.90
1.101.00
1.00
0.00
0.20
0.40
0.60
0.80
1.00
1.20
1.40
1.60
1.80
2.00
2.20
P.Pinang Kedah T'ganu Melaka N.S Pahang Perak Perlis K'tan S'ngor Labuan
TariffRM
Band1 Band2 Band3 Band4 Band5
9
TARIFFSTRUCTUREDOMESTICTARIFFRATE2008(RM/m³)
P.Pinang Kedah T'ganu Melaka N.S Pahang Perak Perlis K'tan S'ngor Labuan
Band1(m3) 0‐20 0‐20 0‐20 0‐15 0‐20 0‐18 0‐10 0‐15 0‐20 0‐20 Everym3
Band2(m3) 20‐40 15‐40 21‐35 18‐45 11‐20 15‐40 20‐40 21‐35
Band3(m3) 40‐60 40‐60 40‐60 >40 >35 >45 >20 >40 >40 >35
Band4(m3) 60‐200 >60 >60
Band5(m3) >200
Band1Avg–RM0.46
Band3Avg–RM1.12 Band2Avg–RM0.74
Band4
Band5

PulauPinang
MelakaN.
SembilanKedah Selangor Perlis Pahang Labuan Perak Johor T'ganu Kelantan
PercapitaUsage(l/c/d) 285 268 239 236 234 229 228 225 218 207 189 142
AvgTariffforFirst35m3(RM/m3) 0.31 0.72 0.68 0.53 0.77 0.57 0.57 0.90 0.73 0.98 0.52 0.55
0.00
0.20
0.40
0.60
0.80
1.00
1.20
0
50
100
150
200
250
300
AverageTariffforFirst35m3(RM/m3)
PerCapitaUsage(l/c/d)
AVERAGETARIFF(RM/m3)AGAINSTPERCAPITAUSAGE(l/c/d)FOR2008

NRW%PENINSULARMALAYSIAANDFTOFLABUANBETWEEN2003AND2008
2003 2004 2005 2006 2007 2008
Produc?onMLY 3,510 3,650 3,677 3,908 4,057 4,197
Consump?onMLY 2,225 2,275 2,400 2,529 2,584 2,672
2,000
2,500
3,000
3,500
4,000
4,500
MLY
36.6%37.7%
34.7%
35.3%36.3%
36.3%
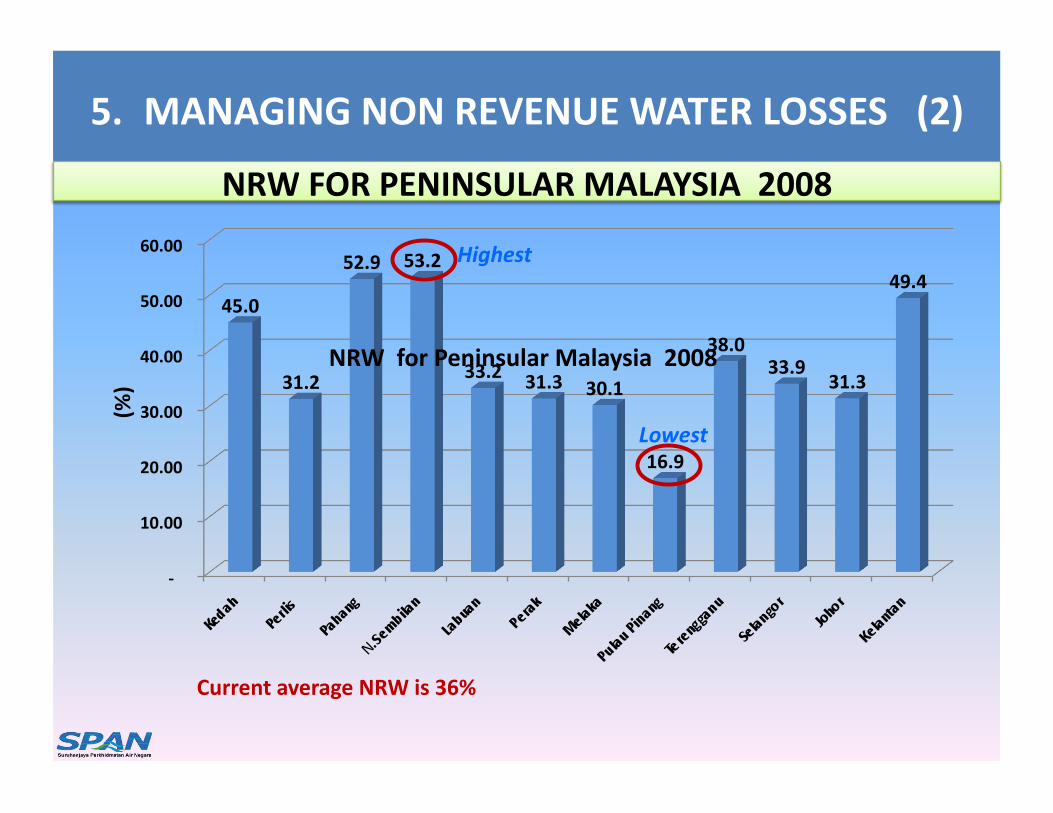
5. MANAGINGNONREVENUEWATERLOSSES(1)
‐
10.00
20.00
30.00
40.00
50.00
60.00
45.0
31.2
52.9 53.2
33.2 31.3 30.1
16.9
38.033.9
31.3
49.4
(%)
NRWforPeninsularMalaysia2008
CurrentaverageNRWis36%
Highest
Lowest
5. MANAGINGNONREVENUEWATERLOSSES(2)
NRWFORPENINSULARMALAYSIA2008

NRW%FORSELANGORBETWEEN2003AND2008
2003 2004 2005 2006 2007 2008
Produc4on 1,291 1,364 1,361 1,378 1,392 1,423
MeteredConsump4on 724 791 838 873 908 940
NRW% 43.9 42.7 38.4 36.6 34.7 33.9
43.9 42.7
38.4 36.634.7 33.9
‐
200
400
600
800
1,000
1,200
1,400
1,600
MLY
5. MANAGINGNONREVENUEWATERLOSSES(3)

Under the 9th Malaysian Plan it is targeted toreduceNRWto25%by2015
TheNRWisinfluencedby
• Deteriora4onofpipenetwork• Systempressure
• Meteringinaccuracies&billinginefficiencies
• Illegalconnec4ons
AswaterresourcesgetmorelimitedweneedtoemphasizeonreducingNRWvolumes
5. MANAGINGNONREVENUEWATERLOSSES(4)

Basedontotalvolumeofwaterproducedinyear2008at4,196,000MLY and a na4onal average NRW of 36.3%,thetotalvolumeofwaterthatdoesnotbringinrevenueis1,524,000MLY
Lossofrevenueasaresultofleakages:• For physical losses (1,220,000MLY) ‐ based on unit
produc4oncostsoftherespec4vestatesorthebulksupplyratewhicheverisapplicable,theapproximateloss in addi4onal opera4ng expenditure is RM434million
• For commercial losses (304,000 MLY) – based onaverage tariff* of the respec4ve states, theapproximatelossinrevenueisRM325million
15
5. MANAGINGNONREVENUEWATERLOSSES(5)
*basedonfirst35m3fordomes4cfirst500m3forcommercial

WHATISTHESAVINGINACHIEVINGTHENATIONALAVERAGENRWOF25%by2015?
To reduce the na4onal average NRW of 36% to 25%wouldputbackatotalof475,000*MLYintothesystemfor consump4on and giving an extra revenue ofapproximatelyRM488million
• For physical losses (380,000 MLY) ‐ the approximaterevenueputbackintothesystemisRM390million
• Forcommerciallosses(95,000MLY)‐theapproximateaddi4onalgaininrevenueisRM98million
From the reduc4on ofNRW, it is es4mated that aboutRM1.67billionwouldbe saved fromCAPEXworks forwatertreatmentplants
16*Basedon2008produc4on

Over the years NRW levels in various states are becomingamaierofconcern,andaneedtoiden4fylevelofleakage/NRWthrough theuseofwateraudit/waterbalance.Somestrategiestoaddresstheproblemare:
Meterreplacementprogram–needtobedevelopedinearlystages,par4cularlyforlargeindustrialuserswhereoldmechanicalmetersunder‐recordstovaryingdegreestypically3to15%
Based on age profile of the 6.0 million meters in thecountry,1.5millionmetersareabove7yearsandneedtobechanged
It is es4mated that about RM75 million need to bespentonmeterchangeprogramintheimmediateterm
17
5. MANAGINGNONREVENUEWATERLOSSES(6)
STRATEGIESTOADDRESSNRW

Understand the importance ofwater losses and itsmul4‐dimensionalissues
EstablishcommonNRWdefini4onandcomputa4on
SekngKPIforNRWreduc4on Link asset replacement program to the leakagecontrolstrategy
GISfordistribu4onmappingandconsumersprofile
5. MANAGINGNONREVENUEWATERLOSSES(7)
STRATEGIESTOADDRESSNRW

EstablishDMZ
• Measuringflowandverifyconsump4on
• Leakdetec4onandrepair• pressuremanagement
UseofSCADAandtelemetrysystematreservoirsinmonitoringreservoirslevels
Systemsmaintenance
• meteraccuracytes4ng
• valveservicingprogram
5. MANAGINGNONREVENUEWATERLOSSES(8)
STRATEGIESTOADDRESSNRW

Differenttariffrateandstructureindifferentstates
Somestateshavetariffstructuresthatbeginwith 0‐15m³,0‐20m³etc
Subsidyforhardcorepooratlifelineband
Puni4ve tariff structure for high users where tariff forlifelineband istobekept lowandthereanerpuni4veratesbeimposedtoencouragewaterconserva4on
Tariff increase as an economic tool to achieveul4mate fullcostrecovery
6. OTHERWATERDEMANDMANAGEMENTSTRATEGIES(1)
WATERPRICINGANDTARIF

NEWWATERSUPPLYRULES UnderWSIA2006‐Sec4on180,SPANareempoweredtomakenew
watersupplyrules
SPANisdraningnewWaterSupplyRulestoreplaceexis4ngStateWaterSupplyRules
The Water Supply Rule will prescribe the minimum engineeringstandards, specifica4ons and level of service to be applied to allstakeholders, developers, contractors, consultants, plumbers andothers in the planning, design, construc4on, opera4on andmaintenanceofwaterdistribu4onandinternalplumbingsystems.
Scheduledtobegazeiedearly2010 NewWaterSupplyRulesalsoaddresseswaterconserva4onmeasures
whichincludes:• Mandatoryinstalla4onofdual‐flushWCcistern
• Plumbingrequirementsforrainwaterharves4ng
6. OTHERWATERDEMANDMANAGEMENTSTRATEGIES(2)

REVISIONOFWATERSUPPLYRULES
Water Supply Rules can be reviewed from 4me to4me to include other water conserva4on/demandmanagementprac4ces:• Installa4onsofwaterefficientfikngs (e.g. taps, showerheads,
urinals)
• Installa4ons of water saving devices (e.g. water saving bags,constantflowregulators,thimbles)
• Useofwaterefficientwashingmachines
• Introduc4onofwaterefficiencylabellingscheme
• registra4onofwaterefficientproducts Asprac4sedbydevelopedcountriese.g.Singapore
6. OTHERWATERDEMANDMANAGEMENTSTRATEGIES(3)

WaterEfficiencyPlan
• Promote non‐domes4c high volume user to develop andimplementWaterEfficiencyPlan– Industries,Governmentbuildings,Hospitals,Mosques
– Universi4es, School, Hotels, Commercial buildings (e.g.Shoppingcomplexes)
6. OTHERWATERDEMANDMANAGEMENTSTRATEGIES(4)
WaterReuseandRecycle• Wastewatercanbereusedfornon‐domes4cpurposessuch
aslandscapeirriga4onandIndustrial
• IWKiscarryingoutR&Donreuseofwastewaterfrombigseweragetreatmentplants

Awarenessprogram
• Publiccampaigntoeducateconsumers inreducingwaterwastage
• Water ForumestablishedunderWSIA in July2008plays prominent role in promo4ng publicawarenessinwaterconserva4on
• Mass media par4cipa4on as a communica4onplasorm in dissemina4ng informa4on to thepublic and encourage changes in consumerbehavioronwaterusage
6. OTHERWATERDEMANDMANAGEMENTSTRATEGIES(5)

Goodwaterdemandmanagementcan
ensure appropriate and 4mely financia ldeploymentforwaterinfra‐structuredevelopment
achieve efficient use of water resources bymanaging balance between supply and waterdemand
increase in resource use efficiency that couldconserve and increase the sustainability of longtermresourceavailability
7. CONCLUSION

26
WWW.SPAN.GOV.MY

Water Restructuring Progress State Licence
issuedCorpora?za?on TransferofAssetsandLiabili?es
Completed On‐goingnego?a?ons
Melaka Tobeissued √(beforeWSIA) √
N.Sembilan √ √ √
Johor √ Priva4zed √
Selangor Priva4zed √
Pahang ApprovedbyFederalGovernmentbutnotimplemented
√
Perlis IntheprocessofgekngFederalGovernment’sapproval
√
Kedah IntheprocessofgekngFederalGovernment’sapproval
√
Perak Intheprocess √
Terengganu √(beforeWSIA)
Kelantan Tobeissued Priva4zed √
PulauPinang √(beforeWSIA) √
Labuan Intheprocess

28
PUBSINGAPORE’S“WATEREFFICIENCYLABELLINGSCHEME”
PRODUCTS/FITTINGSFLOWRATE/
FLUSHCAPACITYREQUIREMENTSUnderMandatory
WELSZeroTick
Good#
VeryGood
Excellent
ShowerTaps&Mixers(PressureRangefrom0.5to5.5bar)
>9litres/min >7to9litres/min >5to7litres/min 5litres/minorless
BasinTaps&Mixers(PressureRangefrom0.5to5.5bars)
>6litres/min >4to6litres/min >2to4litres/min 2litres/minorless
Sink/BibTaps&Mixers(PressureRangefrom0.5to5.5bars)
>8litres/min >6to8litres/min >4to6litres/min 4litres/minorless
FlushingCisterns(PerFlush) NA
DualFlush>4to4.5litres(fullflush)
>2.5to3litres(reducedflush)
DualFlush>3.5to4.0litres
(fullflush)
>2.5to3litres(reducedflush)
DualFlush3.5litresorless(++)
(fullflush)
2.5litresorless(reducedflush)
Urinals&UrinalFlushValve(PerFlush) NA >1to1.5litres >0.5to1litres
0.5litresorless(++)orwaterlessurinals
UnderVoluntaryWELSZeroTick
Good
VeryGood
Excellent
Showerheads(PressureRangefrom0.5to5.5bars)
NA >7to9litres/min >5to7litres/min 5litres/minorless
ClothesWashingMachines(PerWashload) NA >12to15litres/kg >9to12litres/kg 9litres/kgorless
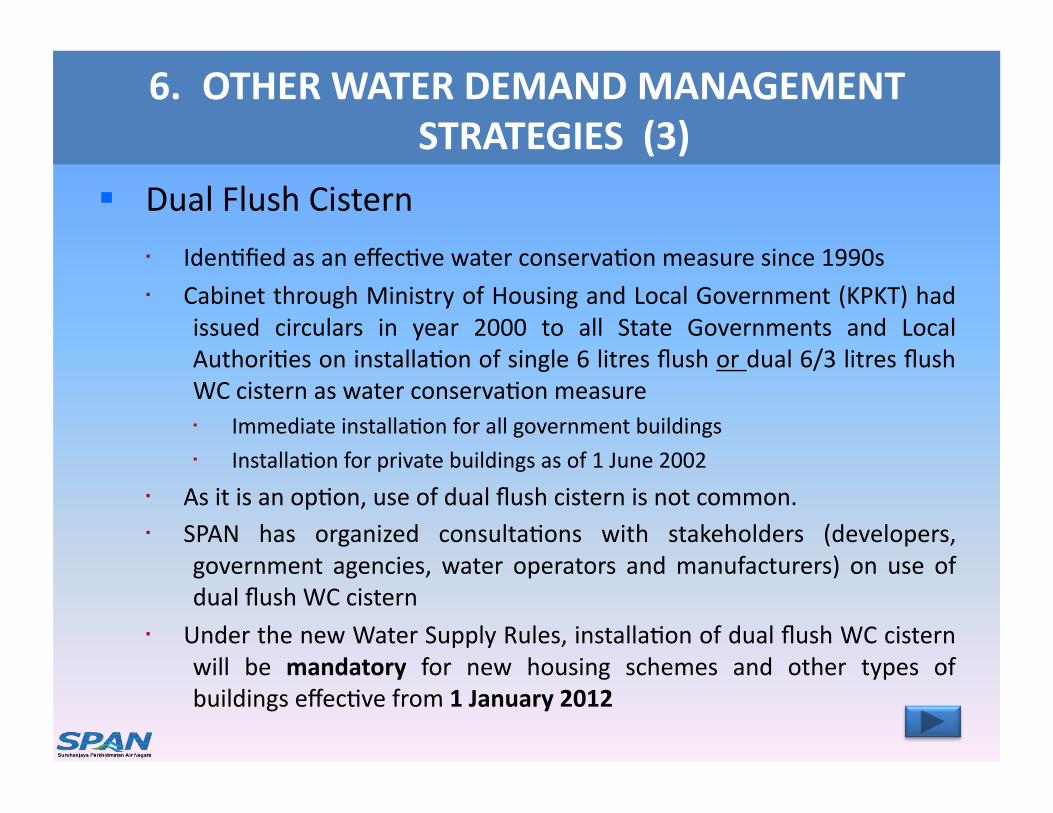
DualFlushCistern
• Iden4fiedasaneffec4vewaterconserva4onmeasuresince1990s
• CabinetthroughMinistryofHousingandLocalGovernment(KPKT)hadissued circulars in year 2000 to all State Governments and LocalAuthori4esoninstalla4onofsingle6litresflushordual6/3litresflushWCcisternaswaterconserva4onmeasure• Immediateinstalla4onforallgovernmentbuildings
• Installa4onforprivatebuildingsasof1June2002
• Asitisanop4on,useofdualflushcisternisnotcommon.• SPAN has organized consulta4ons with stakeholders (developers,
government agencies,water operators andmanufacturers) on use ofdualflushWCcistern
• UnderthenewWaterSupplyRules,installa4onofdualflushWCcisternwill be mandatory for new housing schemes and other types ofbuildingseffec4vefrom1January2012
6. OTHERWATERDEMANDMANAGEMENTSTRATEGIES(3)

DualFlushCistern(Contd..)
• Es4mateofaveragedailydomes4cuse– Toilet 30%– Bath/Shower 28%– ClothesWashing 20%– Cleaning 15%– Cooking/Drinking 4%– Leaks 2%
• Es4matedsavingsifdual‐flushcistern(6/3litres)istobeused– SingleFlush6litres 5x6lit =30lit– DualFlush6/3litres 1x6lit(FullFlush) =6lit 4x3lit(ReducedFlush) =12lit Total=18lit(Savingsof12litresor12%ofaveragedailyconsump4on)
• Es4matedsavingsinconsump4on(2008figures)– Domes4cConsump4on =12%of5,481MLD =658MLD orOverallConsump4on =658/8,362MLD =7.8%
6. OTHERWATERDEMANDMANAGEMENTSTRATEGIES(3)

DualFlushCistern(Contd..)
• Another direct benefit of installing dual–flush cistern islower volume of wastewater which results in lowerpumpingcostintheopera4onofseweragesystem.
6. OTHERWATERDEMANDMANAGEMENTSTRATEGIES(3)

32
TARIFFSTRUCTURE
DOMESTICTARIFFRATE2008(RM/m³)

33
TARIFFSTRUCTURE
COMMERCIALTARIFFRATE2008(RM/m³)