Water Control Tunneling Publication
86
7 1 INTRODUCTION AND BACKGROUND Norway extends some 2100 km from its southern tip to the far north-east corner. Mountains and valleys, deep fjords in the west, and a widely spread population pre- sent numerous challenges for infrastructure constructi- on. It has been important to establish a tunnelling tech- nology that enabled the development of a modern infra- structure with such extremes to be overcome. On the other hand, our climate and topography provides a great potential for hydropower development. The hydropower construction required an extensive use of tunnels and underground caverns and contributed to the develop- ment of this tunnelling concept. In the 1970’es the oil and gas era in Norway began, and underground faciliti- es were used for transport and storage of hydrocarbon products. Norwegian tunnelling can be characterised by cost effectiveness, flexibility to adapt to changing ground conditions, safe internal environment for the users, and preservation of the external environment. The following elements have been important for this development: • pre-grouting of the rock mass to achieve water control, • utilising the self-supporting capacity of the rock mass, • establishing drained support structures. The rock mass itself is often an excellent barrier, having a significant capacity with regard to its tightness cha- racteristics, but owing to its nature, it is not homogenous and its characteristics can vary greatly. The allowable amount of water inflow to a tunnel is in some cases governed by practical limitations related to the excavation process and pumping capacity, which may result in a draw down of the groundwater level. A commonly used figure in Norwegian sub-sea road tun- nels (where the water supply is infinite!) is a maximum inflow to the tunnel of 30 litres per minute and 100 meter, see Blindheim et al. (2001b). 1 INTRODUCTION TO WATER CONTROL IN NORWEGIAN TUNNELLING Eivind Grøv O. T. Blindheim AS ABSTRACT: The rock mass is a significant barrier in itself. However, it is a discontinuous media, and its hydraulic characteristics may vary widely, from impervious sound rocks to highly conductive zones. Based on environmental sensitivity analysis, water control should be applied to avoid negative impacts caused by tunnelling. A standard procedure in Norwegian tunnelling is to perform pre-grouting of the rock mass to obtain the required tightness. This procedure has been developed from the early metro tunnels in the city of Oslo, through unlined, high pressure water tunnels for hydro power projects, underground oil and gas storage and sub-sea rock tunnels, to the current urban tunnelling. This introduction lists the various reasons for such water control, and provides an overview over the cost effective tunnelling developed in Norway during the last decades. The other articles in this publi- cation will further detail these aspects.
description
water control
Transcript of Water Control Tunneling Publication

7
1 INTRODUCTION AND BACKGROUND
Norway extends some 2100 km from its southern tip tothe far north-east corner. Mountains and valleys, deepfjords in the west, and a widely spread population pre-sent numerous challenges for infrastructure constructi-on. It has been important to establish a tunnelling tech-nology that enabled the development of a modern infra-structure with such extremes to be overcome. On theother hand, our climate and topography provides a greatpotential for hydropower development. The hydropowerconstruction required an extensive use of tunnels andunderground caverns and contributed to the develop-ment of this tunnelling concept. In the 1970’es the oiland gas era in Norway began, and underground faciliti-es were used for transport and storage of hydrocarbonproducts. Norwegian tunnelling can be characterised bycost effectiveness, flexibility to adapt to changingground conditions, safe internal environment for theusers, and preservation of the external environment.
The following elements have been important for thisdevelopment:
• pre-grouting of the rock mass to achieve water control,• utilising the self-supporting capacity of the rock mass,• establishing drained support structures.
The rock mass itself is often an excellent barrier, havinga significant capacity with regard to its tightness cha-racteristics, but owing to its nature, it is not homogenousand its characteristics can vary greatly.
The allowable amount of water inflow to a tunnel is insome cases governed by practical limitations related tothe excavation process and pumping capacity, whichmay result in a draw down of the groundwater level. Acommonly used figure in Norwegian sub-sea road tun-nels (where the water supply is infinite!) is a maximuminflow to the tunnel of 30 litres per minute and 100meter, see Blindheim et al. (2001b).
1 INTRODUCTION TO WATER CONTROL IN NORWEGIAN TUNNELLING
Eivind GrøvO. T. Blindheim AS
ABSTRACT: The rock mass is a significant barrier in itself. However, it is a discontinuous media, andits hydraulic characteristics may vary widely, from impervious sound rocks to highly conductive zones.Based on environmental sensitivity analysis, water control should be applied to avoid negative impactscaused by tunnelling. A standard procedure in Norwegian tunnelling is to perform pre-grouting of therock mass to obtain the required tightness. This procedure has been developed from the early metrotunnels in the city of Oslo, through unlined, high pressure water tunnels for hydro power projects,underground oil and gas storage and sub-sea rock tunnels, to the current urban tunnelling.
This introduction lists the various reasons for such water control, and provides an overview over thecost effective tunnelling developed in Norway during the last decades. The other articles in this publi-cation will further detail these aspects.

NORWEGIAN TUNNELING SOCIET Y PUBLICATION NO. 12
8
Requirements to the surrounding environment mayrestrict a draw down to take place. This is applicable inurban areas to avoid settlement of buildings, and whererestrictions on groundwater impacts due to environmen-tal protection are required. Projects have been realisedwhere the allowable inflow was in the range of 2-10litres per minute and 100 meter, see Davik et al. (2001).The primary objective is to employ methods that aim atmaking the tunnel tight enough for its purpose.
Another aspect, which is typical in Norwegian tunnel-ling, is that of decision making close to the tunnellingactivity, and to include the competence of the tunnellingcrew in this process. A trustful co-operation between thecontractor and the owner is needed, see Blindheim et al.(2001a). Based on predefined procedures for rock sup-port and rock mass grouting, the tunnelling crew is aut-horised to implement the design according to the rockmass conditions encountered. Contract practice inNorway has mainly been based on risk sharing throughan extensive use of unit rates for different materials andactivities.
2 PURPOSE OF GROUNDWATERCONTROL IN TUNNELLING
Why make the tunnel or the underground opening a dryone? The answer may be threefold:* Prevent an adverse internal environment. For various
reasons tunnels and underground openings are subjectto - strict requirements to obtain a safe and dry inter-nal environment. In many cases such requirements donot allow water appearing on internal walls or the roofin the tunnel.
* Prevent unacceptable impact on the external, surroun-ding environment. Tunnelling introduces the risk ofimposing adverse impacts to the surrounding environ-ment by lowering the groundwater table, which maycause settlements of buildings and other surface struc-tures in urban areas and disturb the bio-types, naturallakes and ponds in recreational areas.
* Maintain hydrodynamic containment. The concept ofunlined underground openings is used for such purpo-ses as oil and gas storage, cold storage, tunnels andcaverns for pressurised air, nuclear waste repository,and other industrialised disposals. “Watertight tunnel-ling” in this context is to provide a containment to pre-vent leakage of stored products.
3 NORWEGIAN HYDROGEOLOG-ICAL CONDITIONS
In Norway the hydrogeological situation is dominatedby a high groundwater level. An advantage of this is thatit provides a natural hydraulic gradient acting towardsunderground openings. This allows for the utilisation of
unlined underground storage facilities. A disadvantageis the risk that tunnelling activities may disturb thegroundwater situation, thus imposing the potential ofadverse impact on surface structures and bio-types.Norwegian rocks are in practical terms impervious withpermeability (k) in the range of 10-11 or 10-12 m/sec.Individual joints may have a permeability (k) in therange of 10-5 to 10-6 m/sec. The rock mass is conse-quently a typical jointed aquifer where water moves inthe most permeable discontinuities or in channels alongthem. The permeability of such rock mass consisting ofcompetent rock and joints may typically be in the rangeof 10-8 m/sec. This implies that the most conductivezones in the rock mass must be identified and treated.An appropriate solution must be determined to deal withsuch zones to prevent the tunnel from causing a loweredgroundwater table.
4 BRIEF DESCRIPTION OF THE TUNNELLING
4.1 Groundwater controlDuring recent years, analyses aiming at identifying thevulnerability and sensitivity of the surroundings havebeen introduced, particularly focusing on local bio-types in combination with water balance studies, seeGrepstad (2001), and also Kveldsvik et al. (2001).Johansen (2001) reports that numerical modelling ofgroundwater fluctuations has become a valuable tool forsuch analysis together with traditional empirical formu-las. Empirical formulas for analysis of ground settle-
CONTROL OF GROUT MIX.
PUBLICATION NO. 12 NORWEGIAN TUNNELING SOCIET Y
9
ments and potential damage on surface structures arealso available, according to Karlsrud (2001). These areall important aspects to be considered for the determi-nation of the maximum acceptable level of water inflowto the tunnel.
Water control can be achieved by the use of probe-dril-ling ahead of the face followed by pre-grouting of therock mass, see Garshol (2001). The primary purpose ofa pre-grouting scheme is to establish an imperviouszone around the tunnel periphery by reducing the per-meability of the most conductive features in the rockmass. The impervious zone ensures that the full hydro-static pressure is distanced from the tunnel periphery tothe outskirts of the pre-grouted zone. The water pressu-re is gradually reduced through the grouted zone, andthe water pressure acting on the tunnel contour and thetunnel lining can be close to nil. In addition, pre-grou-ting will have the effect of improving the stability situ-ation in the grouted zone, also an important momentum,see Roald et al. (2001).
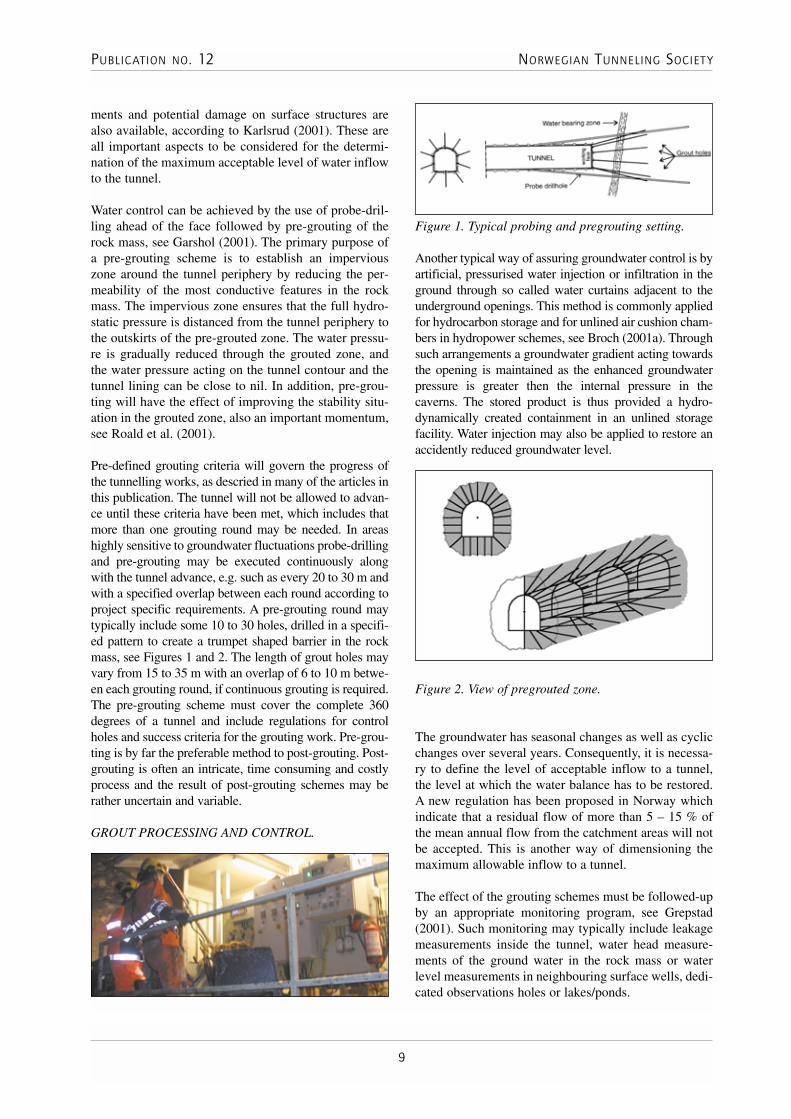
Pre-defined grouting criteria will govern the progress ofthe tunnelling works, as descried in many of the articles inthis publication. The tunnel will not be allowed to advan-ce until these criteria have been met, which includes thatmore than one grouting round may be needed. In areashighly sensitive to groundwater fluctuations probe-drillingand pre-grouting may be executed continuously alongwith the tunnel advance, e.g. such as every 20 to 30 m andwith a specified overlap between each round according toproject specific requirements. A pre-grouting round maytypically include some 10 to 30 holes, drilled in a specifi-ed pattern to create a trumpet shaped barrier in the rockmass, see Figures 1 and 2. The length of grout holes mayvary from 15 to 35 m with an overlap of 6 to 10 m betwe-en each grouting round, if continuous grouting is required.The pre-grouting scheme must cover the complete 360degrees of a tunnel and include regulations for controlholes and success criteria for the grouting work. Pre-grou-ting is by far the preferable method to post-grouting. Post-grouting is often an intricate, time consuming and costlyprocess and the result of post-grouting schemes may berather uncertain and variable.
Another typical way of assuring groundwater control is byartificial, pressurised water injection or infiltration in theground through so called water curtains adjacent to theunderground openings. This method is commonly appliedfor hydrocarbon storage and for unlined air cushion cham-bers in hydropower schemes, see Broch (2001a). Throughsuch arrangements a groundwater gradient acting towardsthe opening is maintained as the enhanced groundwaterpressure is greater then the internal pressure in thecaverns. The stored product is thus provided a hydro-dynamically created containment in an unlined storagefacility. Water injection may also be applied to restore anaccidently reduced groundwater level.
The groundwater has seasonal changes as well as cyclicchanges over several years. Consequently, it is necessa-ry to define the level of acceptable inflow to a tunnel,the level at which the water balance has to be restored.A new regulation has been proposed in Norway whichindicate that a residual flow of more than 5 – 15 % ofthe mean annual flow from the catchment areas will notbe accepted. This is another way of dimensioning themaximum allowable inflow to a tunnel.
The effect of the grouting schemes must be followed-upby an appropriate monitoring program, see Grepstad(2001). Such monitoring may typically include leakagemeasurements inside the tunnel, water head measure-ments of the ground water in the rock mass or waterlevel measurements in neighbouring surface wells, dedi-cated observations holes or lakes/ponds.
Figure 1. Typical probing and pregrouting setting.
Figure 2. View of pregrouted zone.
GROUT PROCESSING AND CONTROL.

NORWEGIAN TUNNELING SOCIET Y PUBLICATION NO. 12
10
4.2 Self-supporting capacity of the rock massMost rock mass has a certain self-supporting capacity, alt-hough this capacity may vary within a wide range. Thefact that there is some “stand-up” time implies that therock mass for a certain time period is not a dead load, thusit shall not be treated as if it was. An appropriate engine-ering approach is to take this capacity into account whendesigning permanent support. Rock strengthening may,however, be needed to secure certain properties/specifiedcapacities, in the same way as is the case for any otherconstruction material. In Norway, permanent rock sup-port consists typically of rock bolts and sprayed concrete.Further descriptions can be found in Grøv (2001).
4.3 Drained tunnel structureIn our tunnelling, the rock mass in combination with therock support constitutes a drained structure. This meansthat the support measure installed has not been designedor constructed to take external water pressure. Excessivewater must therefore not be allowed to build up behindthe rock support measure.
However, even in a tunnel that has been subject to exten-sive pre-grouting, some seepage may occur. A dry envi-ronment, where the surface is free from all visible seepa-ge and damp patches, can be achieved by installing awater protection and drainage system, either locally at wetspots, in larger sections of the tunnel or as a full coverage.A controlled handling of excess water at the tunnel perip-hery and behind the sprayed concrete lining is required.Excess water is either piped to the water collection systemin the tunnel or taken care of by a water protection system.Drainage can be achieved by installing, for example, localcollection devices to confine the water and transfer thewater via pipes to the drainage system in the tunnel. Anumber of different solutions have been tested in Norway,Broch (2001b), some are related to tunnels with low traf-fic volumes, whilst others are applicable for high trafficvolumes. Common for these methods is that they do notinteract with the rock mass support measures.
Sprayable membranes have also been launched toenable the building of a water drainage structure at therock surface, or as an interlayer between two subsequentlayers of sprayed concrete.
5 COST ASPECTSTaking standard cost into account, cost comparison figu-res are available in published articles. According toGarshol (1997), the cost ratio between a concrete linedtunnel and one with fibre reinforced sprayed concrete isapproximately 500:225 (excavation costs are 100).
Another article, Aagaard et. al. (1997), demonstrates thecost variations as a function of the actual rock mass con-ditions. Depending on the rock mass class the cost ratio
between concrete lining and sprayed concrete + rockbolts + reinforced ribs varies from 4:1 in poor rock massto 4:3 in exceptionally poor rock mass conditions.Figure 3 shows the cost comparison for unlined vs. cast-in-place concrete lining. (1 USD is equal to 9 NOK). Inadverse rock mass conditions it seems as if the two alter-natives are more or less equal from a cost comparisonpoint of view.
For an exemplified situation the cost aspect can be esti-mated. For a tunnel size of 60 m2 and in normal rockmass conditions the following cost figures can be deri-ved. The excavation costs are set to 100.
Applying the above cost approximations, the alternativeconcept with sprayed concrete and pre-grouting is in therange of 60 to 80 % of the cost of a concept with cast-in-place concrete.
Applied support elements Cast-in-placeconcrete lining
Norwegiantunnelling
Temp. rock support* 30 – 80 NARock mass probing/grouting 50 – 150 100 – 250Perm. rock support at face** NA 80 – 200
Watertight membrane 20 – 30 NAConcrete lining (400 mm) *** 180 – 330 NATOTAL CONCEPT COST 280 – 590 180 – 450
Figure 3. Cost comparsion of applicable method.
Table 1. Cost comparison (excavation costs are set to 100)
Notes: * spot bolting and plain concrete sprayed in the arch. **
systematic rock bolting and fibre-reinforced sprayed concrete. *** the
cast-in-place concrete liner is applied behind the face.
LASER FOR DIRECTION CONTROL.

PUBLICATION NO. 12 NORWEGIAN TUNNELING SOCIET Y
11
For a two-shift arrangement, working 10 hours per shiftand 5.5 days per week a typical tunnelling progress fora 60 m2 cross section would be in the range of 50 to 60m per week, including all permanent rock support.Severe grout takes may hamper the progress, although asystematic probing/grouting schedule is normally inclu-ded in the tunnelling procedure in such a way as to mini-mise the delay and maintain the high tunnelling advan-ce rate.
REFERENCESAagaard, B., Blindheim, O. T., Grøv, E. (1997):“Sprayed concrete as part of rock support systems foradverse rock mass conditions.” Intl. Symp. RockSupport. Norwegian Society of Chartered Engineers.
Beitnes, A. (2001) “Lessons learned in long railway tun-nels.” NFF Publication No. 12.
Berge, K. O. (2001) “Water control, reasonable sharingof risks” NFF Publication No. 12.
Blindheim, O. T., Skeide, S. (2001a): “Determinationand co-operation is crucial for rock mass grouting inorder to satisfy strict environmental requirements.” NFFPublication No. 12.
Blindheim, O. T., Øvstedal, E. (2001b): “Design princi-ples and construction methods for water control in sub-sea road tunnels in rock.” NFF Publication No. 12.
Broch, E. (2001a): “Inner lining in Norwegian road tun-nels.” Intl. Symp. Application of GeosystemEngineering for Optimal Design of UndergroundDevelopment and Environment in 21st Century. SeoulOct. 18-19,2001 Korea, pp 3-13.
Broch, E. (2001b): “Unlined high pressure tunnels andcaverns.” NFF Publication no. 12.
Davik, K. I., Andersson, H. (2001): “Urban road tun-nels, a subsurface solution to a surface problem.” NFFPublication No. 12.
Garshol, K. (1997): “Single shell sprayed concretelinings, why and how.” Intl. Symp. Rock Support.Norway. Norwegian Society of Chartered Engineers.
Garshol, K. (2001): “Modern grouting techniques –methods and measures.” NFF Publication No. 12.
Grepstad, G. K. (2001): “Water balance – definition andmonitoring.” NFF Publication No. 12.
Grøv, E. (2001): “Active design in civil tunnelling usingsprayed concrete as permanent rock support.” Int. Conf.Sprayed Concrete. Tasmania. Balkema.
Johansen, P. M. (2001): “Inflow criteria for a railwaytunnel in the greater Oslo area.” NFF Publication No.12.
Karlsrud, K. (2001): “Control of water leakage whentunnelling under urban areas in the Oslo region.” NFFPublication No. 12.
Kveldsvik, V., Holm, T., Erikstad, L., Enander, L.(2001): “Planning of a 25 km long water supply tunnelin an environmentally sensitive area.” NFF PublicationNo. 12.
Roald, S., Barton, N., Nomeland, T. (2001): “Grouting –the third leg of underground construction.” NFFPublication No. 12.
Anon. (2001): “Closing the ring in Oslo.” Tunnels &Tunnelling, July 2001.
PREPARE FOR EMULSION PUMPING.

13
1 INTRODUCTIONTopographical conditions in Norway are especiallyfavourable for the development of hydroelectric energy.More than 99% of a total annual production of 120 TWhof electric energy is generated from hydropower. It isinteresting to note that, since 1950, underground power-houses are predominant. In fact, of the world’s 500underground powerhouses almost one-half, i.e. 200, arelocated in Norway. Another proof that the Norwegianelectricity industry is an “underground industry” is thatit today has more than 4000 km of tunnels. During theyears 1960 - 90 an average of 100 km of tunnels wasexcavated every year.
Through the design, construction, and operation of allthese tunnels and underground powerhouses, valuableexperience has been gained. Also, special techniquesand design concepts have been developed. One suchNorwegian speciality is unlined, high-pressure tunnelsand shafts. Another is the so-called air cushion surgechamber which replaces the conventional vented surgechamber. Both concepts utilise the in-situ stresses andthe groundwater pressure in the rock masses for confi-nement. Oil and gas storage in unlined caverns is basedon the same concept.
It should be mentioned as a preliminary matter that therock of Norway is of Precambrian and Paleozoic age.Although there is a wide variety of rock types, highlymetamorphic rocks predominate. From an engineeringpoint of view they may in general be classified as typi-cal hard rocks.
2 DEVELOPMENT OF THE GENERALPLANT LAYOUT
During and shortly after the First World War there was ashortage of steel leading to uncertain delivery and veryhigh prices. As a result, four Norwegian hydropowerstations with unlined pressure shafts were put into ope-ration during the years 1919-21. The water heads vari-ed from 72 to 152 . Although three out of these fourpressure shafts were operating without problems aftersome initial problems had been solved, it took almost 40years for the record of 152 m to be beaten. Before 1950the above-ground powerhouse with penstock was theconventional layout for hydropower plants as demon-strated in Figure 1. When the hydropower industry forsafety reasons went underground in the early 1950’s,they brought the steel pipes with them. Thus, for a deca-de or so most pressure shafts were steel-lined.
2 UNLINED HIGH PRESSURE TUNNELS AND CAVERNS
Einar BrochNorwegian University of Science & Technology
ABSTRACT: More than 80 unlined pressureshafts and tunnels with maximum water headsvarying between 150 and 1000 m are today in ope-ration in Norway. The majority of these wereconstructed during the years 1960 - 90. Theoldest ones have, however, been in operation for80 years. The development of the general layoutfor hydropower plants as well as the differentdesign criteria for unlined pressure tunnels aredescribed. Experience from the operation is dis-cussed. Operational experience from ten unlinedair cushion surge chambers have been examinedwith respect to air leakage. Internal air pressurevaries from 19 to 78 bars and chamber volumesfrom 2.000 to 120.000 m3. HEAVY DRILLING AT FACE.

NORWEGIAN TUNNELING SOCIET Y PUBLICATION NO. 12
14
The new record shaft of 286 m at Tafjord K3, which wasput into operation in 1958, gave the industry new confi-dence in unlined shafts. As Figure 2 shows, new unli-ned shafts were constructed in the early 1960’s andsince 1965 unlined pressure shafts have been the con-ventional solution. Today more than 80 unlined high-pressure shafts or tunnels with water heads above 150 mare successfully operating in Norway, the highest headbeing almost 1000 m. Figure 2 clearly demonstratesthat increasing water heads reflect an increasing confi-dence in unlined pressure shafts.
The confidence in the tightness of unlined rock massesincreased in 1973 when the first closed, unlined surgechamber with an air cushion was successfully put intoservice at the Driva hydroelectric power plant, Rathe(1975). Figure 1 shows how the new design influencesthe general layout of a hydropower plant. The steeplyinclined pressure shaft, normally at 45°, is replaced by aslightly inclined tunnel, 1:10 - 1:15. Instead of the con-ventional vented surge chamber near the top of the pres-sure shaft a closed chamber is excavated somewherealong the high-pressure tunnel, preferably not too farfrom the powerhouse. After the tunnel system is filledwith water, compressed air is pumped into the surgechamber. This compressed air acts as a cushion to redu-ce the water hammer effect on the hydraulic machineryand the waterways, and also ensures the stability of thehydraulic system.
3 DESIGN CHARTS BASED ON FINI-TE ELEMENT MODELS
In the years before 1970 different “rule of thumbs”were used for the planning and design of unlined pres-sure shafts in Norway. With new and stronger compu-ters a new design tool was taken into use in 1971-72.This as well as the “rule of thumbs” are described indetail by Selmer-Olsen (1974) and Broch (1982). It isbased on the use of computerised Finite Element
Figure 1. The development of the general layout ofhydroelectric plants in Norway.
Figure 2. The development of unlined pressure shaftsand tunnels in Norway.
Impression from tunnel face.

PUBLICATION NO. 12 NORWEGIAN TUNNELING SOCIET Y
15
Models (FEM) and the concept that nowhere along anunlined pressure shaft or tunnel should the internalwater pressure exceed the minor principal stress in thesurrounding rock mass.
Very briefly, the FEM models are based on plain strainanalysis. Horizontal stresses (tectonic plus gravitatio-nal) increasing linearly with depth, are applied.Bending forces in the model are avoided by making thevalley small in relation to the whole model. If required,clay gouges (crushed zones containing clay) may beintroduced.
In addition to real cases, a number of idealised but typi-cal valley sides have been analysed. One example of anidealised model is shown in Figure 3.To make the model dimensionless, the static water pres-sure is expressed as the ratio H/d, where the water headis expressed as a height in the same units as the valleydepth (e.g., in meters). The curved lines run throughpoints where the internal water pressure in a shaft equalsthe minor principal stresses in the surrounding rockmass (�3 = H).
The use of the design charts can be illustrated by anexample. Let the bottom of the valley, where the powerstation is located, be situated 100 m.a.s.l. and the top ofthe valley side 600 m.a.s.l. This makes d = 500 m. Themaximum water level in the intake reservoir is390m.a.s.l. This makes H = 290 and the H/d ratio =0.58. At all points inside or below the 0.58 line theminor principal stress in the rock mass exceeds thewater pressure in an unlined shaft; hence, no hydraulicsplitting should occur. If a factor of safety of 1.2 isintroduced, the critical line will be the 1.2 x 0.58 = 0.7line. As a demonstration, a 45° inclined shaft is placedin this position in Figure 3. A further discussion of howthe input data may influence the results is given inBroch (1982).
4 EVALUATION OF THE TOPOGRAPHY
Whichever method is chosen, a careful evaluation of thetopography in the vicinity of the pressure tunnel or shaftis necessary. This is particularly important in non-gla-ciated, mountainous areas, where streams and creekshave eroded deep and irregular gullies and ravines in thevalley sides. The remaining ridges, or so-called noses,between such deep ravines will, to a large extent, bestress relieved. They should therefore be neglectedwhen the necessary overburden for unlined pressureshafts or tunnels is measured. This does not mean thatpressure tunnels should not be running under ridges ornoses - only that the extra overburden this may giveshould not be accounted for in the design, unless thestress field is verified through in-situ measurements, seeBroch (1984) for further details.
5 GEOLOGICAL RESTRICTIONSThe FEM-developed design charts are based on theassumption that the rock mass is homogeneous andcontinuous, an assumption which cannot be absolutelycorrect even for crystalline rocks like granites andgneisses. However, observations and investigations ofstress-induced stability problems such as strain bursts ina large number of tunnels in valley sides clearly indica-te that the natural jointing for rock masses has onlyminor influence on the distribution of the virgin stresses.More important for the stress distribution can faults andweakness zones be as they may cause local redistributi-on of the stresses, Broch (1982 B).
In rock masses with alternating layers or beds of rockswith different stiffness, the stress situation may be verydifferent from what the idealised FEM models willshow. In such cases new models should be establishedin which the input data for the different types of rock arecarefully selected. It is important to keep in mind thatin a situation where there is a combination of rocks withvarying stiffness, the softer rocks will take less stressthan the stiffer. When a high-pressure tunnel passesthrough such zones of low stress rock masses, they canlocally be over-stressed which may result in the ope-ning of joints. This may lead to severe leakage.
As the permeability of the rock itself normally is negli-gible, it is the jointing and the faulting of the rock mass,and in particular the type and amount of joint infillingmaterial, that is of importance when an area is beingevaluated. Calcite is easily dissolved by cold, acidwater, and gouge material like silt and swelling clay areeasily eroded. Crossing crushed zones or faults contai-ning these materials should preferably be avoided. Ifthis is not possible, a careful sealing and grouting shouldbe carried out. The grouting is the more important thecloser leaking joints are to the powerhouse and access
Figure 3. Design chart for unlined pressure shafts based ona finite element model. the curves run through points wherethe internal water pressure in the shaft equals the minorprinciple stress in the surrounding rock mass, H = �3

NORWEGIAN TUNNELING SOCIET Y PUBLICATION NO. 12
16
tunnels and the more their directions point towardsthese. The same is also valid for zones or layers ofporous rock or rock that is heavily jointed or broken. Acareful mapping of all types of discontinuities in therock mass is therefore an important part of the planningand design of unlined pressure shafts and tunnels.
6 HYDRAULIC JACKING TESTSHydraulic jacking tests are routinely carried out for unli-ned high-pressure shafts and tunnels. Such tests are par-ticularly important in rock masses where the generalknowledge of the stress situation is not well known ordifficult to interpret based on the topographical conditi-ons alone. The tests are normally carried out during theconstruction of the access tunnel to the powerhouse atthe point just before the tunnel is planned to branch offto other parts of the plant, like for instance to the tail-water tunnel or to the tunnel to the bottom part of thepressure shaft, see Figure 4.
To make sure that all possible joint sets are tested, holesare normally drilled in three different directions. By theuse of either pre-existing or specially designed FiniteElement Models the rock stress situation in the testingarea as well as at the bottom of the unlined shaft are esti-mated. At this stage the relative values of the stresses atthe two points are more important than the actual valu-es. During the testing the water pressure in the holes israised to a level which is 20 to 30 % higher than thewater head just upstream of the steel-lining, accountingfor the reduced stress level at the testing point. There isno need to carry out a complete hydraulic fracturing test.The crucial question is whether or not the water pres-sure in the unlined part of the shaft or tunnel is able to
open or jack the already existing joints. Hence theimportance for making sure that all possible joint setsare tested.
If the testing shows that jacking of joints may occur, theunlined part of the waterway will have to be put furtherinto the rock. This will normally mean that the wholepowerhouse complex is moved further in. A flexiblecontract which allows for such changes is therefore ofvital importance when unlined high pressure shafts andtunnels are planned. Putting the powerhouse complexdeeper into the rock adds length to the access tunnel, butnot to the waterway.
7 UNDERGROUND HYDROPOWERPLANTS WITH UNLINED WATER-WAYS
To demonstrate the design approach an example of anunderground hydropower plant will be shown and brie-fly described. Figure 4 shows the simplified plan andcross section of a small hydropower plant with only oneturbine. No dimensions are given, as the intention is toshow a system rather than give details. Similar layoutscan be found for Norwegian plants with water heads inthe range of 200 - 600 m.
Figure 4. Plan and cross section of an undergroundhydropower plant with unlined waterways.
QUALITY CONTROL.

PUBLICATION NO. 12 NORWEGIAN TUNNELING SOCIET Y
17
The figure is to some extent self-explanatory. It shouldbe pointed out, however, that when the design charts areused, the dimensioning or critical point for inclinedshafts will normally be where the unlined pressure shaftends and the steel lining starts. This is where the selec-ted �3 = H line should intersect the waterway. The elev-ation of this point and the length of the steel-lined secti-on will vary with the water head, the size and orientati-on of the powerhouse, and the geological conditions, inparticular the character and orientation of joints and fis-sures. Steel lengths in the range of 30- 80 m are fairlycommon. For vertical shafts the critical point will nor-mally the upper elbow.
The access tunnel to the foot of the unlined pressureshaft is finally plugged with concrete and a steel tubewith a hatch cover. The length of this plug is normally10 - 40 m, depending on the water head and geologicalconditions. As a rough rule of thumb the length of theconcrete plug is made 4% of the water head on the plug,which theoretically gives a maximum hydraulic gradientof 25. Around the concrete plug and the upper part ofthe steel-lined shaft a thorough high-pressure grouting iscarried out. This avoids leakage into the powerhouseand the access tunnel. Further details about the design ofhigh-pressure concrete plugs can be found in Dahlø etal.(1992) or Broch (1999).
8 OPERATIONAL EXPERIENCEFROM UNLINED PRESSURESHAFTS AND TUNNELS.
The oldest unlined pressure shafts have now been inoperation for 80 years. None of the 60 pressure shaftsand tunnels with water heads varying between 150 and1000 m which have been constructed in Norway since1970, has shown unacceptable leakage. It is thus fair toconclude that the design and construction of unlinedhigh-pressure tunnels and shafts is a well proven tech-nology.
The first filling of a pressure shaft or tunnel should bedone in a controlled way. The reason is that during andafter the excavation of the tunnel the surrounding rockmass has gradually been drained and may even havebeen emptied for water. This is shown by the greatreduction in the groundwater leakage into tunnels whichare commonly observed over time. When the tunnel islater filled with water, the emptied joints and pores arefilled too. By carrying out leakage measurementsduring filling, unforeseen leakage can be detected.It is normal procedure to fill a shaft in steps or intervalsof 10 - 30 hours. During the intervals the water level inthe shaft is continuously and accurately monitored by anextra-sensitive manometer. By deducting for the inflowof natural groundwater and the measured leakagethrough the concrete plug, it is possible to calculate thenet leakage out from the unlined pressure tunnel or shaftto the surrounding rock masses. Some typical leakagecurves are shown in Figure 5. The leakage from a tun-nel is large during the first hours, but decreases rapidlyand tend to reach a steady state after 12 to 24 hours,depending on the joint volume that has to be filled.
Figure 5. Measured net water leakage out from variousunlined high pressure shafts and tunnels, fromPalmstrøm (1987)GROUT PROCESSING AND CONTROL.

NORWEGIAN TUNNELING SOCIET Y PUBLICATION NO. 12
18
From some of the pressure tunnels and shafts where lea-kage measurements have been carried out, an averagepermeability coefficient of 1 - 10 x 10-9 m/s has been cal-culated. With this very low permeability a leakage of0.5 - 5 l/s per km has been measured, Palmstrøm (1987).
9 OPERATIONAL EXPERIENCEFROM THE AIR CUSHION SURGECHAMBERS
As part of a research programme on the air and gastightness of rock masses, all ten air cushions in Norwayhave been carefully studied. The results are presentedin papers like for instance Goodall et al.(1988), Kjørholtand Broch(1992) and Kjørholt et al.(1992).
Air cushion surge chambers are used as an economicalalternative to the traditional open surge shaft for dam-ping of headrace tunnel transients from changes inpower plant loading. As illustrated in Figure 6, the aircushion surge chamber is a rock cavern excavated adja-cent to the headrace tunnel, in which an air pocket istrapped. The surge chamber is hydraulically connectedto the headrace tunnel by a short (<100m) tunnel. Thissolution gives substantial freedom in the lay-out of thetunnel-system and the siting of the plant. Schemeswhich have used air cushions have tended to slope theheadrace tunnel directly from the reservoir towards thepower station as indicated in Figure 2. Air cushions arealso favoured where the hydraulic head of the headraceis above ground surface . In such cases, construction ofan open surge shaft would require erection of a surgetower.
Some basic data about the air cushion surge chambersare given in Table 1. Different gneisses are the domina-ting type of rock. Jointing is in general low to modera-te and the estimated permeability is low, not to say verylow. It should, however, be kept in mind that the placesfor these air cushion surge chambers are carefully selec-ted to give as favourable rock mass conditions as pos-sible. Hydraulic jacking tests or rock stress measure-ments are used when deemed appropriate to verify thatthe stress conditions are favourable to the concept.
Of all the surge chambers, OSA is situated at the shallo-west depth (145 m). The surge chamber was the prefer-red alternative to a 40 m high surge tower at surface.The Osa site is the first case where excessive air losswas observed. Shortly after commissioning, an air lea-kage of about 900 Nm3/h developed. Grouting wasundertaken at pressures as high as 4.0 MPa. A total of 36tons of cement and 5500 l of chemical grout were injec-ted. This grouting program focused on areas where lea-kage was indicated by water inflow. As a result of thegrouting, air loss from the cavern was dramaticallyreduced from 900 Nm3/h to 100 Nm3/h initially and to70 Nm3/h in the long term, which is comfortably mana-ged by the compressor plant.
At KVILLDAL air loss from the air cushion surgechamber in the first year of operation was 250 Nm3/h,but without evidence of concentrated leakage at surface.Because such a loss tested compressor capacity, a watercurtain was for the first time installed in connection withan air cushion surge chamber. The water curtain consi-sted of a fan of about forty-five 50 mm diameter boreholes with a total length of about 2.500 m and a distan-ce between the water curtain and the chamber varyingfrom about 10 to 20 m.
The maximum water pressure used in the water curtainis 5.1 MPa which is 1 MPa above the pressure in thechamber. At this pressure the average water flow to thecurtain is 32 l/min. Air loss since installation of thewater curtain has decreased by more than an order ofmagnitude and is today practically eliminated.
The TAFJORD air cushion was first commissioned wit-hout any leakage preventing measures undertaken. But,even though the leakage at this site was somewhat lessthan at Kvilldal, the compressors did not have the suffi-cient capacity. An attempt to grout a major fractureintersecting the cavern did not improve the leakage con-dition. Fortunately, the Tafjord air cushion is not cruci-al to the operation of the Pelton system to which it isconnected. The power-plant has consequently been ableto operate without a surge facility.
Figure 6. Plan and profile of the Ulset air cushion surgechamber.

PUBLICATION NO. 12 NORWEGIAN TUNNELING SOCIET Y
19
A water curtain was installed at Tafjord in 1990, partlyas a research project. The curtain consists of 16 drillholes (diameter 56 mm) which covers both the roof andthe upper part of the cavern walls. Also at this site theair leakage disappeared when the water curtain was putin operation at the deign pressure ( 0.3 MPa above theair cushion pressure).
The TORPA air cushion is the only one where a watercurtain was included in the original design. The watercurtain consists of 36 bore holes (64 mm diameter), dril-led from an excavated gallery 10 m above the cavernroof, see Figure 7. In addition to the water curtain ,grouting was undertaken during construction to improvethe rock condition.
As for the two other water curtains, no air leakage hasbeen registered from the air cushion when the water cur-tain is in operation at design pressure (0.3 MPa abovethe air cushion pressure). To get an idea if the air leaka-ge potential at Torpa, the water curtain was turned offfor two days. This resulted in an “immediate” leakagerate of 400 Nm3/h. The leakage ceased as soon as thewater curtain again was put in operation. The measuredleakage rate corresponds very well with results fromtheoretical calculations.
Air leakage through the rock masses are tabulated inTable 1. Also indicated for each site is the ratio of theair cushion pressure and the natural ground water pres-sure.
Six of the air cushions have a natural air leakage ratethat is acceptable. Three air cushions have no air leaka-ge at all through the rock mass. At four air cushions(Osa, Kvilldal, Tafjord and Torpa),the natural leakagerate was too high for a comfortable or economic opera-tion, and remedial work was carried out. These four sitesare located in the most permeable rock masses of all tencushions, and also have ratios between air cushion pres-sure and natural ground water pressure above 1.0.
---------------------------------------------------------------------------------------------------------------------------PROJECT CAPACITY YEAR AIR CUSHION PERMEABILITY AIR LOSS MW volume , m3 pressure, MPa m2 Nm3/h------------------------------------------------------------------------------------------------------------------------Driva 140 1973 7,350 4.0 - 4.2 no data 0Jukla 35 1974 6,050 0.6 - 2.4 1 x 10-17 0Oksla 206 1980 18,000 3.5 - 4.4 3 x 10-18 5Sima 500 1980 9,500 3.4 - 4.8 3 x 10-18 2Osa 90 1981 12,500 1.8 - 1.9 5 x 10-15 900/70 *Kvilldal 1240 1981 110,000 3.7 - 4.1 2 x 10-16 250/0 **Tafjord 82 1982 1,950 6.5 - 7.7 3 x 10-16 150/0 **Brattset 80 1982 8,900 2.3 - 2.5 2 x 10-17 11Ulset 37 1985 4,900 2.3 - 2.8 no data 0Torpa 150 1989 12,000 3.8 - 4.4 5 x 10-16 400/0 **--------------------------------------------------------------------------------------------------------------* Before/after grouting ** With/without water curtain in operation
Table 1. Air cushion surge chamber data
Figure 7. Geometry of Torpa air cushion surge cham-ber with water curtain.
CONTROL OF GROUT MIX.

10 CONCLUDING REMARKSExperience from a considerable number of pressure tun-nels and shafts have been gathered over a long period oftime in Norway. These show that, providing certaindesign rules are followed and certain geological andtopographical conditions avoided, unlined rock massesare able to contain water pressures up to at least 100bars, equaling 1000 m water head.
Air cushions have proven to be an economic alternativeto the traditional open surge shaft for a number ofhydropower plants. Experience shows that the hydraulicdesign should follow the same principles as for an opensurge shaft. The geotechnical design of the air cushioncavern should follow the same basic rules as for otherrock caverns.
Air leakage through the rock masses is the major chal-lenge when designing and constructing an air cushion. Acertain leakage may for economical reasons be accep-ted. If, however, the leakage exceeds a given limit,both grouting and the use of water curtains are possibleactions. Experience has shown that grouting will reducethe leakage to a certain extent, while a water curtain isable to eliminate the leakage through the rock.
In the future this experience may also be important out-side the hydropower industry, for instance in the con-struction of cheap, unlined storage facilities for differenttypes of gas or liquid under pressure.
REFERENCESBroch, E. (1982): “The development of unlined pressu-re shafts and tunnels in Norway.” Rock mechanics:Caverns and pressure shafts (Wittke, editor). Rotter-dam, The Netherlands, A.A. Balkema, pp. 545 - 554.Also in Underground Space No. 3, 1984.
Broch, E. (1982 B): “Designing and excavating under-ground powerplants.” Water Power and DamConstruction 34:4, 19 - 25.
Broch, E. (1984): “Design of unlined or concrete linedhigh pressure tunnels in topographical complicatedareas.” Water Power and Dam Construction 36:11.
Broch, E.(1999): “Sharing Experience with ConcretePlugs in High-Pressure Tunnels.” Hydro ReviewWorldwide, Vol. 7, No. 4, pp. 30-33
Dahlø,T.S., Bergh-Christensen,J. and Broch,E.(1992):“A review of Norwegian high-pressure concrete plugs.”Hydropower -92.(Broch and Lysne, ed.). Balkema,Rotterdam, pp 61 -68.
Goodall,D.C.,Kjørholt,H.,Tekle,T. and Broch,E.(1988):“Air cushion surge chambers for underground powerplants.” Water Power & Dam Constr.,Nov. pp29 - 34.
Kjørholt,H. and Broch,E.(1992): “The water curtain - asuccessful means of preventing gas leakage from high-pressure, unlined rock caverns.” Tunnelling andUnderground Space Technology. vol. 7, pp 127 -132.
Kjørholt,H.,Broch,E. and Dahlø,T.S.(1992):“Geotechnical design of air cushion surge chambers.”Hydropower -92. (Broch and Lysne, ed.) Balkema,Rotterdam, pp 129 -135.
Palmstrøm, A. (1987): “Norwegian design and con-struction experience of unlined pressure shafts and tun-nels.” Underground Hydropower Plants (Broch andLysne, ed.), Trondheim, Tapir, pp. 87 - 99.
Rathe, L. (1975). An innovation in surge chamberdesign. Water Power No. 27, pp. 244 - 248.
Selmer-Olsen, R. (1974). Underground openings filledwith high-pressure water or air. Bull. Int. Ass.Engineering Geology 9, pp. 91 - 95.
NORWEGIAN TUNNELING SOCIET Y PUBLICATION NO. 12
20
Heavy equipment is good for water control in tunneling.

21
1 INTRODUCTION“The water balance should not be affected” is a phrasefrequently used when the success criteria related to rockmass grouting are mentioned. What does this phrasemean? How is it possible to prove that the goal has beenreached and does it really matter?
In sensitive areas leakage monitoring and measurementsare important parts of construction supervision. Thedemand for documentation of adherence to rules andspecifications are ever increasing. If strict leakagelimits have been set, uncertainties regarding leakagevolumes could cause damage to infrastructure or envi-ronment above the tunnel or costly delays due to exces-sive grouting. Though the latter has seldom been thecase up to now.
The influence area without mitigation measures,depends on the leakage to the tunnel, the porosity of therock mass and the sediments, and the availability ofwater.
The water balance has seasonal changes and also variesfrom one year to the next. Further the water balance isaltered as a consequence of any inflow to the tunnel.Hence “The Water Balance” is just a conception thatimplies that the water and groundwater level in thecatchment area is within the natural range of variation.
What is important is to prevent damage to the naturalenvironment. Upon deciding where to concentrate thegrouting efforts a through knowledge is required of: (1)the value, uniqueness and sensitivity of the vegetation in
3 THE WATER BALANCE – DEFINITION AND MONITORING
Gisle Kvaal GrepstadNVK Vandbygningskontoret AS (partner in NORPLAN)
ABSTRACT: The phrase “The Water Balance” means that the difference between the precipitation andthe combined run off, evapotranspiration and leakage to the tunnel, is the change in the groundwaterand surface water storage in the catchment area. The difficult task is to assess how large the leakagevolume can be before the area is negatively affected. It is possible to calculate the variations in waterstorage within the catchment area if reliable run off data exists. The accuracy of the model depends onthe data quality and how complex the catchment area is with respect to groundwater storage volume anddelayed run off.
The most important parameter used in analytical formulas and models to predict leakage, besides thedepth of the tunnel below the groundwater table, is the hydraulic conductivity of the superficial soil andsediments and the deeper rock formations.
An environmental impact assessment should focus on the areas with rich biodiversity important to pre-serve, as well as indicating areas where rock mass grouting is not essential from an environmental con-servation point of view.
It is difficult to predict in detail the influence area of a tunnel. Hence, it is important to closely moni-tor the leakage from the surrounding rock mass into the tunnel during and after construction, as wellas the pore pressure and water levels in lakes and aquifers in vulnerable areas above the tunnel prior toand during construction.

NORWEGIAN TUNNELING SOCIET Y PUBLICATION NO. 12
22
the area in a local, regional and national context, (2)how drought resistant the vegetation is, and (3) the con-sequences if inflow to the tunnel occurs.
This article aims at explaining the abovementionedphrase, further describe the various parameters includedin the water balance equation and discuss how the para-meters vary. Further the article discuss briefly what,how and where to monitor to keep control with the lea-kage and prevent damage to the natural environment.
2 DEFINITION OF THE TERM “THE WATER BALANCE”
The water balance for longer periods (years) in a defi-ned catchment area is described by the following equa-tion:
Where P is precipitation, Q is run off and E is evapo-transpiration. For shorter periods one more term is nee-ded, thus developing the equation:
�R is the difference in groundwater and surface waterstorage at the beginning and the end of a given period,Otnes et al. (1978). The above equation can be expres-sed as follows when there is a leakage L to a tunnelbeneath the catchment area:
The phrase “The Water Balance” means that the diffe-rence between the precipitation and the combined runoff, evapotranspiration and leakage to the tunnel, is thechange in the groundwater and surface water storage inthe catchment area. The above equation shows that anyleakage to the tunnel will affect the water balance in thecatchment. Leakage will affect both the run off from the
catchment and the water storage in the catchment in theshort or long term depending on the leakage volume.The difficult task is to assess how large the leakagevolume can be before the area is negatively affected.
To be able to do this assessment the parameters in theequation (3) must be properly measured (or estimated).Further the kind of impact drainage to the tunnel willhave on the natural environment (especially the vegeta-tion) above the tunnel and how drainage will affect thefoundation of buildings and other kind of infrastructuremust be known. The latter topic has been described byKarlsrud (2001).
3 THE PARAMETERS IN THE WATERBALANCE EQUATION
3.1 The catchment areaTo delineate the catchment area is fairly simple. Theuncertainty is related to the fact that a deep tunnel canalso affect areas outside the catchment area just abovethe tunnel, if located close to a catchment boundary or ifthe fracture zones have a gentle dip angle. Hence it isimportant to have an idea about the actual size of thecatchment area or the influence area of the tunnel andthe dip angle of the fracture - and fault zones, whenestimating the effective catchment area above the tun-nel.
3.2 Climatic data (P and E)Precipitation data (P) is usually available from the nati-onal meteorological department in most countries. InNorway precipitation has been recorded for more than100 years on a daily basis throughout the country.Precipitation varies both throughout the year and fromone year to the next. Precipitation data is used to esti-mate magnitude and variation in anticipated run offwhere run off measurements are not available.
The evapotranspiration (E) within the catchment areadepends on a number of factors like; topography, vege-tation, size of lakes, elevation, temperature, humidityand dominant wind direction. The evapotranspirationvaries troughout the year and from one year to anotherjust like temperature and precipitation. Evaporationmeasurements are conducted at approximately 50 cli-matic stations in Norway. One of many empirical for-mulas developed for use in areas far from relevant stati-ons is presented below (Turc’s formulae):
Where ET is annual evapotranspiration in mm, N isannual precipitation in mm and It=300+25t+0,05t3
where t is annual average temperature in centigrade,Hauger (1978).
Figure 1. The Water Balance Equation included leaka-ge (L) to the tunnel
ET = N / [0,90 + (N/It)2]1/2 (4)

PUBLICATION NO. 12 NORWEGIAN TUNNELING SOCIET Y
23
3.3 Run off (Q)In Norway the Norwegian Water Resources and EnergyAdministration (NVE) publish run off maps for thewhole country. These maps show the annual averagerun off in l/s/km2. The annual average run off is impor-tant for water balance estimations, but even more impor-tant is the run off variation trough the year and from oneyear to the next. The run off in dry years and during dryperiods of the year is essential for assessments of howthe leakage will affect the natural environment. A pos-sible solution for catchments where run off measure-ments are not available, is to find a similar catchmentwith respect to climatic zone, precipitation pattern, size,topography and vegetation where measurements takeplace. Looking at the run off distribution trough theyear in percentage of the annual run off in this catch-ment will give a fair indication about the run off distri-bution in the catchment that will be affected by the tun-nel. The run off distribution from a catchment area inSouthern Norway west of the Oslo Fjord is presentedbelow.
Figure 2 shows that the run off is concentrated to twoperiods; 1) from the beginning of April to the end ofMay due to the snow melting period, and from thebeginning of October to the end of November. Duringthe period from June to September, the run off is closeto 20 % of the mean as shown in figure 2. This periodis the critical period of the year when the vegetation isin need of water. The diagram indicates further thatalmost no run off takes place from mid June to midSeptember approximately every 10th year, as indicatedby the 10% percentile.
3.4 Difference in water storage (�R)It is possible to calculate the variations in water storagewithin the catchment area if reliable run off data exists.The accuracy of the model depends on the data qualityand how complex the catchment area is with respect togroundwater storage volume and delayed run off. In a
spreadsheet based water balance model, the differencein impact between wet and dry years can be calculated.The model can estimate how much leakage the catch-ment can accept before it permanently affects the waterlevel in lakes and the groundwater level.
To estimate the size and storage volume of the ground-water reservoirs is quite difficult and is seldom doneprior to any tunnelling works commences. Informationabout groundwater level, depth to bedrock and the soildistribution are also seldom available at an early stage.The storage volume depends on the thickness and poro-sity of the soil. The porosity of the fracture zone is ofminor importance when it comes to storage volumeassessments. Further to estimate storage variations isdifficult when neither knowing the water level variati-ons nor the porosity or soil thickness. Anyhow, eveninaccurate estimates of storage volumes give a fair ideaabout how draught prone an area will be. Even a roughqualitative assessment of the presence or lack ofgroundwater storage is valuable. Total porosity andeffective porosity (i.a storage volume available for drai-nage) for some common soils and crystalline rock ispresented in table 1. Most rock types in Norway arecrystalline rocks, hence the porosity for all practical pur-poses, is nil outside fracture zones.
3.5 Leakage (L)There are various ways to measure the inflow to a tun-nel, but unfortunately such measurements can only takeplace after the tunnel construction commences. Duringthe design phase the likely leakage values have to bebased on analytical formulas and computer models, likethe formulae presented by Karlsrud (2001) and themodel presented by Johansen (2001).These models andformulas assist in the assessments of the likely leakagevalue and area of influence before any mitigation mea-sures takes place, and they can further help to indicatethe effect of the planned mitigation measures. One ofthe most important parameters in analytical formulasand models besides the depth of the tunnel below thegroundwater table, is the hydraulic conductivity of thesuperficial soil and sediments and the deeper rock for-mations. The leakage to a tunnel is proportional to thehydraulic conductivity. In table 1 the porosity of some
Hydrograph
- VM 12.192 Sundbyfoss (1977-99), weekly mean values
0 %
50 %
100 %
150 %
200 %
250 %
300 %
350 %
400 %
jan
feb
ma
r
apr
ma
i
jun jul
aug
sep
okt
nov
des
Flo
w Q
/Qm
ean
Percentile 90 %
Mean
Percentile 50 %
Percentile 10 %
Figure 2. Run off distribution from a catchment area inSouthern Norway.
Material Total Porosity[%]
Effective Porosity[%]
Clay 45 – 55 1 – 10Silt 35 – 50 2 – 20
Sand 25 – 40 10 – 30Gravel 25 – 40 15 – 30
Mixed Sand and Gravel 20 – 35 15 – 25Moraine 10 – 25 2 – 20
Crystalline Rock with few fissures < 1Fractured Crystalline Roc < 1 – 10
(Modified from Driscoll, 1986 and Fetter, 1994)
Table 1. Total and effective Porosity for some commonsoils and crystalline rock
<< 1
<< 1–10

NORWEGIAN TUNNELING SOCIET Y PUBLICATION NO. 12
24
soils and crystalline rock was presented. The hydraulicconductivity for the same materials is presented in table2.
The hydraulic conductivity has a wide range for mostmaterials as of a rock mass, it usually changes with amagnitude of 100 to more than 1000 over short distan-ces. The rock mass is a typical jointed aquifer, andhence as shown in table 2, groundwater flow in rock isconfined to fissures, fracture – and fault zones for allpractical purposes. The following parameters are essen-tial for the hydraulic conductivity for rock mass; rocktype, degree of fracturing, the orientation and the cont-inuity of the fractures, the interception between set frac-tures and rock tension. Hydraulic Conductivity is usu-ally estimated based on water pressure measurements indrilled holes or pumping tests in water wells. The num-ber of tests performed and the homogeneity of the rockmass decides how accurate the formulas and models canpredict the leakage volume.
3.6 Influence areaThe influence area without mitigation measures,depends on the leakage to the tunnel (mentioned above),the porosity of the rock mass and the sediments and theavailability of water. (When it comes to damage onbuildings and infrastructure caused by settlement evensmall leakage’s can cause a large area of influence, asdescribed by Karlsrud (2001)).
The hydraulic conductivity is the main geological factorwhen assessing the influence area and the possible nega-tive impacts on the natural environment caused by a tun-nel.
Overlooking damage due to settlements, table 2 showsthat the largest area of influence with respect to draina-ge, is where sand and gravel is underlain by fracturedrock. The consequences for the natural environment isnot necessarily negative, due to the fact that the vegeta-tion types thriving on sandy soils are often more droughtresistant than for the example the vegetation found onbogs.
The reason why tunnels below the highest shorelinehave a smaller influence area than tunnels above, is due
to the low hydraulic conductivity of marine clay.Groundwater flow in clay is usually lower than in frac-tured rock, as can be seen in table 2.
4 RESTORED WATER BALANCE The previous chapters show that the water balance hasseasonal changes and also varies from one year to thenext. Further equation 3 shows that the water balance isaltered as a consequence of any inflow to the tunnel.Hence “The Water Balance” is just a conception thatimplies that the water and groundwater level in thecatchment area is within the natural range of variation.
Consequently it is necessary to define the “acceptable”level of leakage to the tunnel, the level at which “TheWater Balance” is restored. There is no uniform acceptlevel for the water balance. The NVE has in a proposedregulation attached to the new Water Resource Law,indicated that they will not accept a residual flow of lessthan 5 - 15 % of the mean annual flow from the catch-ment area. The discussion regarding what is “accep-table” flow or not, is not yet finalised. The flow returnperiod and the maximum allowable number of days wit-hout run off from the catchment will probably be thedeciding factors.
5 VEGETATION MAPPING What is probably more important than to ensure that“The Water Balance is not affected” is to prevent dama-ge to the natural environment. The parameters in thewater balance equation could assist in assessing theamount of water available within a catchment area. Thenext step is to map the terrestrial (and if applicable theaquatic) vegetation. Upon deciding where to concentra-te the grouting efforts a through knowledge of the follo-wing is required: (1) the value, uniqueness and sensiti-vity of the vegetation in the area in a local, regional andnational context, (2) how drought resistant the vegetati-on is, and (3) the consequences if inflow to the tunneloccurs. Drought prone locations are for examplesprings, bogs and valley bottoms where biotas depen-dent on a high groundwater table are found. Howeverbeing dependent on a continuous supply of water, doesnot necessarily imply that the biota is a rare one and ofhigh value. Valley bottoms usually coincides with line-aments and fracture zones, hence the co-operation bet-ween the geologist and the botanist or naturalist isessential in the environmental impact assessment.
An environmental impact assessment should focus onthe areas with rich biodiversity important to preserve,as well as indicating areas where rock mass grouting isnot essential from an environmental conservation pointof view.
Material Hydraulic Conductivity[m/s]
Clay 10-8 – 10-11
Silt 10-6 – 10-8
Homogenous Sand 10-3– 10-5
Homogenous Gravel 10-2– 10-4
Moraine 10-3– 10-11
Fractured Crystalline Roc 10-4 10-8
Crystalline Rock with few fissures < 10-11
(Modified from Driscoll, 1986 and Fetter, 1994)
Table 2. Anticipated Hydraulic Conductivity Values forsome common soils and crystalline rock

PUBLICATION NO. 12 NORWEGIAN TUNNELING SOCIET Y
25
6 MONITORING
The great span in the hydraulic conductivity for geolo-gical materials and in the factors affecting the waterbalance indicates that it is difficult to predict in detailthe influence area of a tunnel. Hence, it is important toclosely monitor the leakage from the surrounding rockmass into the tunnel during and after construction, aswell as the pore pressure and water levels in lakes andaquifers in vulnerable areas above the tunnel prior toand during construction.
6.1 Monitoring inside the tunnelThe acceptable leakage requirement will seldom be thesame throughout the tunnel, but may vary from one sec-tion to the next, based on the sensitivity and vulnerabi-lity of the surface infrastructure and the nature. Hence,leakage monitoring and measurements in the tunnel isimportant also within defined sections. The demand fordocumentation of adherence to rules and specificationsare ever increasing. If strict leakage limitations havebeen set, uncertainties regarding leakage volumes couldcause damage to infrastructure or environment abovethe tunnel or costly delays due to excessive rock massgrouting.
It is important to keep control with the total amount ofwater flowing into and out of the tunnel. Water flowinginto the tunnel comes from leakage (L) and water usedfor drilling, washing, etc. (Qin). The flow out of the tun-nel (Qout) is measured at the tunnel entrance or the tun-nel working face, depending on the inclination. Hence asimplified water budget for the tunnel is:
Usually leakage measurements are performed duringweekends and holidays, when the tunnelling activitiesand the water use in the tunnel is insignificant (Qin = 0).The measured value at the entrance (alternatively wor-king face) (Qout) is thus a relevant inflow value. Thissystem is simple and reliable as long as no activitiesusing or adding water take place shortly prior to or
during the measuring period. Regular measurements,like every weekend, during the construction period givefairly reliable time series and enable a differentiation ofthe inflow values section by section.
Water leaving the tunnel in addition to the drainagewater is moist in the ventilation system and in the bla-sted rock. These water volumes are usually small andoften insignificant compared to the leakage water, butshould not be completely forgotten if the leakage limitsare very strict. Drill holes not yet grouted is a significanterror source.
Pre-grouting of the rock mass as a measure to reducethe inflow to a tunnel, is more efficient and cost effecti-ve than grouting after excavation has taken place.Hence, leakage monitoring at the tunnel working face isimportant. Probe drilling is often carried out to obtaininformation of the rock mass condition ahead of the tun-nel face, such as leakage, rock mass quality and weak-ness- and fault zones. Decisions concerning groutingare often based on measurements or tests in these probeholes, like:
• Water pressure tests (Lugeon tests)• Measurements of the volume leakage water from the
exploratory whole(s).
Grouting is then carried out if the Lugeon or leakagevalue exceeds a predefined limit. If strict leakage limitshave been established, exploratory drilling followed bywater pressure tests or leakage measurements are alsoperformed after the grouting to ensure that the valuesnow are within the predefined limits.
To verify that leakage limits have been reached is impos-sible based on the measurements in the probe drillingholes due to the heterogeneity of the rock mass. The mea-surements at the entrance give an idea during the excava-tion, but it is also necessary to perform leakage monitoringat regular intervals in the tunnel. In the past these measu-rements, if performed, have been taken at barriers locatedat fixed intervals in the drainage ditch where the side
Qout = Qin + L (5)
Figure 3. Permanent drainage arrangement with barrier, silt trap, side drain and main drain (NSB Gardermobanen)

NORWEGIAN TUNNELING SOCIET Y PUBLICATION NO. 12
26
drains enter the main drain. Figure 3 shows the principlefor the permanent drainage arrangement with barrier, silttrap, side drain and main drain. When this arrangement isin place measurements are fairly easy.
The distance between these measuring locations shouldbe governed by the specific leakage requirement.Sections with strict limits should have shorter distancebetween the measuring locations than sections with hig-her limits. Measuring locations should also be establis-hed at section boundaries to validate that the leakagelimit has been reached within each section.
Measurements at barriers are difficult to perform duringthe initial tunnel construction period. Barriers are usu-ally established late in the completion phase, when thepermanent drainage system is installed. Hence, measu-rements at the barriers start too late to influence the rockmass (pre) grouting program. Having leakage limitboundaries in mind when locating niches needed forother purposes, like temporary silt traps, etc., increasesthe possibilities of starting “mid-tunnel” measurementsat an early stage.
6.2 Monitoring above the tunnelMonitoring above the tunnel comprises monitoring ofwater level fluctuations in lakes and groundwater aquifers,pore water pressure in clay formations and if applicable,flow monitoring in rivers and streams. It is important thatthe water level monitoring above the tunnel commence atan early stage, to ensure that seasonal and annual variati-ons are known prior to the construction phase.
Installations of piezometers for pore pressure measure-ments in settlement prone areas have been standard pro-cedure in tunnelling projects for years. Groundwaterlevel measurements in rock aquifers and water levelmeasurements in lakes have only lately become part ofthe standard monitoring procedure in Norway.
Because crystalline rock aquifers are confined to fissu-res, fractures and fault zones (as shown in table 1), themonitoring wells must communicate / cross these linea-
ments. The same lineaments are usually the target forthe engineering geological investigations like refractionseismic, core drilling or detailed mapping. Hence, theneed for groundwater observation locations can becombined with core drilling holes or holes needed forrock mass assessment using radar-, photo- or othercommon geophysical borehole logging instruments.
Groundwater level monitoring in soil deposits above thetunnel is usually restricted to bogs and other locationswere drainage is likely to cause damage or were rare andvaluable vegetation is found.
Electrical piezometers and pressure transducers with dataloggers monitored via radio or telephone, ensure an instantmonitoring and also an effective monitoring procedureincluding early warning protocols. The Client, theContractor and if desirable, the public, are then able followthe water level and pore pressure variations on-line.
7 CONCLUSIONEither the main Contractor or the Client has up to nowcarried out the monitoring in the tunnel, and one or moreConsultants have done the above tunnel measurements.May be a separate team should be responsible for all theneeded monitoring inside and outside the tunnel. This“external” Environment Consultant should then beresponsible for monitoring emission to air and water,vibration, noise, water levels, pore pressure and leakage.The Environmental Consultant would also be the mostappropriate neighbourhood contact and the one respon-sible for reporting to the environmental authorities.
REFERENCESDriscoll F. G., 1986. Groundwater and Wells.Second Edition. Johnson Filtration System Inc. St. Paul1986. ISBN 0-9616456-0-1
Fetter C. W., 1994. Applied Hydrogeology.Third Edition. Macmillan College Publishing CompanyInc. New York 1994. ISBN 0-02-336490-4
Hauger T., 1979. Groundwater as supply source. Tapirforlag Trondheim 1979. ISBN 82-519-0296-7 (InNorwegian)
Karlsrud, K. (2001). Control of water leakagewhen tunnelling under urban areas in the Oslo region.NFF Publication no. 12.
Johansen, P.M. (2001).Inflow criteria for a railway tun-nel in the greater Oslo area. NFF Publication no. 12.
Otnes J. and Restad E. eds., 1978. Practical hydrology.Ingeniørforlaget, Oslo 1978. ISBN 82 524 0036 1 (InNorwegian)
Figure 4. Permanent side drain entering the main drain(NSB Gardermobanen).

27
1 INTRODUCTIONConstruction of rock tunnels through urban areas in theOslo region represent a special challenge due to the fre-quent presence of soft marine clay deposits abovebedrock. Even a relatively small groundwater leakageinto a rock tunnel underlying, or close to, such soft claydeposits will very rapidly reduce the pore pressure at theclay/rock interface. This will then initiate a consolidati-on process in the clay deposit gradually progressingupwards through the deposit as illustrated in Figure1.Such a consolidation process can lead to large settle-ments of the ground surface and severe damage to buil-dings, structures and utilities that are not founded direct-ly on bedrock.
The nature of this problem was realised as early as in1912-16 when the first subway tunnel through down-town Oslo (Holmenkollbanen) was excavated. This 2km long tunnel caused settlements of up to 30-40 cm ofapartment and office buildings along the tunnels, andsettlements were observed as far as 500m from the tun-nel alignment Holmsen(1953), Karlsrud et. al. (1978)and Kveldsvik et. al (1995).
Although the problem and mechanisms of such leakage-induced settlements (often referred to as subsidence)have been well understood, it has been a long process tofind the most viable method for leakage control in suchcircumstances.
In connection with newer tunnels in the Oslo region onehas collected data on leakage into the tunnels, pore pres-sures at the clay/rock interface, and settlements thathave been induced. Combined with data and experien-ces from grouting and lining of the tunnels, this hasgiven a very valuable contribution to the developmentof procedures for dealing with this tunnelling challenge.
2 TUNNEL PROJECTS AND MEASURES TO CONTROL LEAKAGE
2.1 General descriptionTable 1 gives an overview of most rock tunnels in theurban Oslo region which have had potential for causingleakage and settlement problems as dealt with herein.This amounts to a total of about 28 km of traffic tunnels
4 CONTROL OF WATER LEAKAGE WHEN TUNNELLING UNDERURBAN AREAS IN THE OSLO REGION
Kjell Karlsrud The Norwegian Geotechnical Institute
ABSTRACT: In urban areas where there are softclay deposits above bedrock, ground water leaka-ge into rock tunnels can cause severe subsidenceand damage to structures. Such conditions arefrequently encountered in the Oslo region. Thepaper describes semi-empirical procedures thathave been developed for assessing the consequen-ces of a given leakage level on pore pressures andsettlements in clay deposits above bedrock, andhow to assess minimum leakage level that can beachieved with present pre-grouting technology.The use of permanent lining and ground waterre-charging as means of reducing the potentialconsequences of water leakage is also discussed.

NORWEGIAN TUNNELING SOCIET Y PUBLICATION NO. 12
28
(subways, railways and roads) with cross section rang-ing from about 40 to 100 m2, and 36 km of seweragetunnels with cross section of 10-15 m2.
All the sewerage tunnels were excavated with pre-grou-ting as the only means of water control. That also appli-es to about half of the traffic tunnels. The other half ofthe traffic tunnels were equipped with a concrete lining.Some tunnels or sections of the tunnels have been exca-vated even without any pre-grouting.
The tunnels are generally fairly shallow (20 to 50 mbelow ground). Most of the tunnels were constructedaccording to conventional drill and blast techniquesthrough predominately sedimentary rocks includingclay shales and nodular limestones and in a few casesalun shale. Within these sedimentary rocks one oftenfinds igneous dikes and intrusions which are generallyhighly water bearing compared to the base rocks.
The 23 km long VEAS tunnel is the only tunnel in Table1 which was excavated by tunnel boring machines. Inthe 1980’ies it was a great challenge to arrange for pre-grouting through the head of the tunnel boring machinesused on that project, but it was eventually solved.
2.2 Experience with pre-grouting and observed lea-kage
For non-grouted tunnels or portions there off, the mea-sured leakage has ranged from about 15 to 80 l/min pr100m tunnel. Visual observations of leakage in thesenon-grouted tunnels have shown that the leakage ingeneral is concentrated in fracture zones, fault zonesand/or zones of igneous dikes/intrusions in the sedimen-tary rocks. The inflow can be quite channelled in theworst zones, and appears as a concentrated flow ofwater like that out of a small hose. Such concentratedleaks have been measured to yield up to 60-80 litrepr.min. for tunnels at moderate depth Karlsrud et. al(1978). In other leakage zones more regular drippingfeatures can be observed.
For the most successfully and systematically pre-grou-ted tunnels, the measured leakage has been down to 2,5l/min pr. 100 m for the sewerage tunnels and 6 l/min pr.100 m for traffic tunnels. There are however, fairlyrecent examples of larger leakage, actually almostapproaching that of non-grouted tunnels.
The leakage (inflow of groundwater) into a rock tunnelcan be calculated according to formulae (1) using therather simplifying assumptions that:• The tunnel lies in a homogenous media with constant
permeability in all directions• The tunnel is deeply embedded (h/r≥3-4) • The groundwater table is not influenced by the leaka-
ge:
where, k = hydraulic conductivity (permeabilty) of rock
h = depth below water tabler = equivalent radius of tunnel
If the hydraulic conductivity of the rock closest to thetunnel face has been reduced to a value which is morethan factor of about 10 lower than that of the non-grou-ted rock, the leakage pr unit length of tunnel can bedetermined from equation (2)
where, ki = hydraulic conductivity of the grouted rock zone
h = depth below water tablere = equivalent radius of the tunnelt = thickness of grouted zone = ri - r
Formula (1) and (2) have been used to back calculate theequivalent average hydraulic conductivity of the rockmass with and without grouting. The results are presen-ted in Figures 3 and 4 where the back-calculatedhydraulic conductivities are presented in relation torespectively the average normalised grout hole lengthand the average normalised grout take. These normali-sed values have been found by dividing the total lengthof grout holes or total amount of grout used by the inter-nal surface area of the tunnel over the length in questi-on. Note in relation to grout take that one has assumedthat 1 kg of cement grout used is equivalent to 1 litre ofchemical grout.
Tunnel Year excavated Tunnel length(km)
Holmenkollbanen 1912-161926-27
1,4
OTB-transport tunnel to Stortinget subway station 1968-70 0,3OTB- subway tunnels Domkirken-Stortinget andStortinget station
1972-75 0,9
NSB- railway tunnel Jernbanetorget-Stortinget 1973-75 0,5NSB-railway tunnel Abelhaugen- O.K.plass 1973-79 2,0VEAS sewerage tunnels 1976-82 23OVK sewerage tunnels 1975-85 13OTB- subway exchange loop, Stortinget station 1982-85 1,1E18- road tunnel Festningen 1987-89 1,4Rv 160 road tunnel Granfosslinjen 1990-92 2,0Rv 160 road tunnel Bekkestua 1993-94 0,7E18 Vestbanen intersection road tunnels 1992-94 0,4Rælingen road tunnel 1995-96 1,4New National theatre railway station 1996-97 0,8Rail tunnel Romeriksporten 1995-97 14Road tunnel Tåsen 1997-98 0,9
Table 1- Overview of tunnels in the Oslo region
)12ln(
2
−=
r
hkhQ π (1)
)r
)tr(ln(
2hkQ
e
ei +
π= (2)

PUBLICATION NO. 12 NORWEGIAN TUNNELING SOCIET Y
29
For the tunnel stretches where little or no grouting hasbeen undertaken it can see from figures 3 and 4 that theback calculated average hydraulic conductivity of therock mass typically lies in the range of:
k = 0.8 x 10⁻⁶ to 2.0 x 10⁻⁵ cm/sec.
Thus, it is clear that there is a significant variability inexpected leakage into non-grouted tunnels depending onthe nature of the rocks.
The lowest back-calculated hydraulic conductivity ofthe grouted rock achieved so far lie in the range:
ki = 2 to 6 x 10⁻⁷ cm/sec.
This is a factor of 1/25 to 1/100 times the back-calcula-ted permeability of non-grouted rock as given above.
Figures 3 and 4 show that the amount of grout holes dril-led, and the amount of grout used have a significantimpact on the achieved reduction in permeability of thegrouted rock. Some additional qualitative observationsregarding the effectiveness of the grouting are as fol-lows:
• It is a general observation that only 10-15 % of thegrout holes drilled show leakage and any significantamount of grout take. This confirms the generalimpression from observed leakage features in the tun-nels referred to earlier that most leakage in rock is con-centrated in local channel-like veins. Such channel-like veins may be found at the intersection betweenjoint or fracture systems in the rock, or be a result ofjoint roughness and relative displacements on thejoints/fractures. In addition it may be the result of localerosion or chemical solution of joint filling materialssuch as calcite, which is frequently found on the jointsin the sedimentary rocks in question. To intersect suchwater-bearing channels with grout holes requires avery dense drilling pattern. As an illustration, there areexamples where about 100 grout holes were drilledover a surface area of about 10 m2 before one hit thewater-bearing vein.
Fig.1 Influence of tunnel leakage on pore pressure inclay deposit
Fig.2 Principle of trumpet pre-grouting
0
20
40
60
80
100
1,E-07 1,E-06 1,E-05 1,E-04
Back-calculated permeability (cm/sec)
Norm
aliz
ed g
rout
co
nsum
ptio
n, (k
g+lit
re)/m
2
Sewerage tunnels
Traffic tunnels
Fig.3 Back-calculated permeability in relation to nor-malised borehole length
Fig.4 Back-calculated permeability in relation to nor-malised grout consumption
0
1
2
3
4
5
1,E-07 1,E-06 1,E-05 1,E-04Back-calculated permeability,ki (cm/sek)
Norm
aliz
ed b
oreh
ole
leng
th (m
/m2)
Traffic tunnels
Sewerage tunnels

NORWEGIAN TUNNELING SOCIET Y PUBLICATION NO. 12
30
• It is also a general observation that use of high grou-ting pressures (at least 30-40 bars) enhances the grouttake and the achieved reduction in permeability. Thereason is that use of high grout pressures will causehydraulic fracturing and thus, give easier contact withthe most water-bearing channels even if a grout hole isnot in direct contact with such channels. Use of highgrout pressures may therefore to some extent allowfewer grout holes to achieve the same result than whenmore moderate grout pressures (10-30 bars) are used.Use of high grouting pressures involves a potential forthe grout to travel very long distances. There are seve-ral examples where the grout has reached up to theground surface and entered into basements, sewerageand water collection pipes. Therefore, one must keepcontrol, and set a limit on, the grout take in each hole.
• Another potential benefit of the use of high grout pres-sures is that it will improve the “pre-stressing” effectof the grouting on the rock mass and thus, improve thestability of the tunnel and reduce relative joint displa-cements and tendencies for joints to open up when thetunnel is driven.
• A number of different grout types are available in themarket. The type of grout mix most suited must beevaluated on basis of the bedrock conditions andacceptable leakage level. This is of course also a costissue. The cost of Micro-cements may typically be 3-4times higher than Standard Portland cements, and thechemical grouts with best properties in terms of con-trol with setting time, penetration, gel strength andsynereses (Acrylamid based grouts) may be a factor of10 times higher than Standard Portland cements.
• There is little doubt that the use of high grouting pres-sures has enhanced the achieved results with StandardPortland and Micro-cements and thus, reduced theneeds for high-permeation chemical grouts. In a tunnelpresently under construction a mixture of StandardPortland cement and silica powder has been introdu-ced. This seems to increase the penetration of the groutand give results that may approach what can be achie-ved with Micro-cements. Note also that both inNorway and Sweden the use of chemical grouts hasbeen more or less banned by public health officials dueto the potential health risks.
3 RELATIONSHIP BETWEEN TUN-NEL LEAKAGE AND PORE PRESSU-RES IN CLAY-FILLED DEPRESSIONS
Figure 5 presents a summary plot of maximum porepressure reduction observed at the clay/rock interface,�uR , right above the tunnel axis for all the tunnel pro-jects in Table 1. There is as expected a clear correlation
between pore pressure reduction and leakage level. Thescatter in the data can be explained by several factorssuch as:
1) Differences in the local hydrogeological conditions.The most important factors in this context are:
• Variations in the natural hydraulic conductivity of therock (before any grouting) and especially extent ofhigh conductivity structures and their orientationrelative to the tunnel axis and the clay-filled depres-sions.
• If or to what extent there are coarser sediments (gla-cio-fluvial sands) in the transition between clay andbedrock.
• The depth and lateral extent of the clay-filled depres-sion
• Topography and other special features that may influ-ence the natural infiltration of groundwater.
2) To what extent the leakage measurements are repre-sentative
• There are many practical problems in measuring accu-rately the amount of groundwater that leaks into a tun-nel under construction. It is for instance, necessary todetermine the amount of water used for drilling sepa-rately.
Fig.5 Measured pore pressure reduction at clay/rockinterface right above tunnel in relation to leakage

PUBLICATION NO. 12 NORWEGIAN TUNNELING SOCIET Y
31
• For the tunnels in question the leakage has been mea-sured over distances ranging from lengths of typically200 m to 2 km. The amount of leakage has been ave-raged over the measured distances, but all visualobservations of leakage shows that the leakage variesconsiderably locally. For instance, it often seems like80 % or more of the leakage over a tunnel length ofseveral hundred meters is concentrated to a few zonesof a few meters length. This means that the averagedleakage over several hundred meters may not be repre-sentative, especially if there is close hydraulic contactbetween a pore pressure measuring point and a localhigh leakage zone.
The data in Figure 5 shows that for the purpose of avo-iding any influence on the pore pressure in clay-filleddepressions the leakage must be less than about 2 to 5l/min pr. 100 m tunnel.
Figure 6 shows the maximum observed pore pressurereduction in relation to distance from the tunnel axis. Asexpected, the reduction decreases with distance from thetunnel. The influence zone has been up to 5-600 m forthe largest leakage levels experienced so far. A moredetailed study of the data in Figure 6 has shown that thedecrease in ∆uR with distance is fairly independent ofthe leakage level, and corresponds to about 2m pr. 100m distance. When this is combined with the data inFigure 5 one finds that the influence distance decreasewith leakage level such as typically shown in Figure 7.
4 DETERMINATION OF SETTLEMENT POTENTIAL
For a given pore pressure reduction at the bedrock level,DuR, the upward pore pressure reduction and theaccompanying consolidation strains or settlements inthe clay deposit can be calculated by rather conventio-nal consolidation theory. The required input is the pre-consolidation pressure, compressibility and coefficientof consolidation of the clay as determined form soilsampling and odometer tests on good quality samples.The final equilibrium pore pressure reduction (at time t= ∞ ) must be defined.
All experiences so far show that the upper naturalground water table in these clay deposits will not beinfluenced even by very large leakage unless the claydeposits are very shallow or of very limited lateralextent. The reason is that the actual flux of waterthrough the clay deposit even under a large seepage gra-dient is far less than the natural infiltration from preci-pitation. The final equilibrium condition will thereforebe given by a steady state downward seepage solution.If the permeability of the clay is constant with depth,this means that the equilibrium pore pressure distributi-on will be linear as depicted in Figure 1.
Figure 8 shows typical final consolidation settlementsfor Oslo clay condition in relation to ∆uR and the thick-ness of the clay deposit if the clay is more or less nor-mally consolidated. The clay deposit may however, insome areas be somewhat overconsolidated which cansignificantly reduce expected settlements.
Fig.6 Observed pore pressure reduction in relation tohorizontal distance from tunnel
Fig.7 Typical relationship between influence distanceand leakage level

NORWEGIAN TUNNELING SOCIET Y PUBLICATION NO. 12
32
5 EXPERIENCES WITH TUNNELLINING FOR WATER CONTROL
Some of the traffic tunnels in table 1 have been designedwith a permanent watertight concrete lining. A concretelining is in itself not watertight even if it is equippedwith waterstops in the joints. The primary reason isshrinkage cracks and cracks generated by large tempe-rature changes between summer and winter as mayoccur in Oslo (the extreme difference in temperaturebetween winter and summer may be up to about 300 Cin a tunnel).
Observed leakage through concrete linings without anyspecial measures other than waterstops in the joints, hasranged from about 10 to 40 l/min pr. 100 m tunnel. Thatmeans, the lining has practically no effects at all on theleakage level.
In the Oslo railway and subway tunnels in Table 1 it wasused a reinforced concrete lining. Systematic contactgrouting was introduced followed by relatively highpressure grouting in the interface between the lining andthe rock to reduce the leakage through the liningKarlsrud et. al (1978). This turned out to be quite suc-cessful, and leakage in these tunnels have been measu-red to less than 1 l/min pr. 100 m tunnel. That is signifi-cantly less than what has so far been achieved in onlypre-grouted tunnels. Pore pressure measurements sho-wed that with this leakage level the natural pore pressu-re conditions in the surrounding areas was restored.
In the Festningen road tunnel an un-reinforced concretelining was chosen with local grouting/sealing ofcracks/leaks where and when they would appear. It tur-ned out to be extremely difficult to stop the leakage inthis case, primarily because of the continuos cycles oftemperature changes causing grouted cracks/joints toreopen or new ones to appear over time. In theFestningen tunnel it has therefore, been necessary to re-grout old and new cracks many times over the years thetunnel has been in operation. Furthermore, the leakagestill corresponds to about 6 l/min pr 100 m of this twintunnel.
In the Vestbanen intersection tunnels constructed afterthe Festningen tunnel, and connecting into it, the appro-ach of a watertight PVC membrane in between an innerand outer concrete lining, such as commonly used on thecontinent in Europe was adopted. This gave fairly satis-factory results, but it did not completely prevent leaka-ge. The problem with such a membrane solution is toavoid that it is punctured, and that requires extremecare, control and careful inspection throughout theworks. It is also a more expensive solution than a sing-le reinforced lining.
Construction of a conventional concrete lining takesconsiderable time and interferes considerably with pro-gress of blasting and excavation works if it is carried outclose to the tunnel face. In practice, the lining will oftentrail 100 m or more behind the tunnel face. It must alsobe taken into account that a tunnel may cause pore pres-sure reduction in clay-filled depressions within 5-600mdistance from such clay-filled depressions. This impliesthat before a complete watertight tunnel has been esta-blished along a stretch of tunnel influencing a specificclay-filled depression, 6 months to a year may elapse.Within such a time period significant pore pressurereduction and subsidence can occur. Thus, also for linedtunnels it is necessary to do pre-grouting and /or combi-ne that with re-charging of groundwater as discussed inthe following.
6 USE OF GROUND WATERRECHARGING TO COMPENSATEFOR LEAKAGE
In connection with many of the tunnel projects in Table1 it has been carried out recharging of groundwater tocompensate for the leakage (when the leakage has beenabove the acceptable level). Recharging by drillingwells directly into the anticipated most water-bearingzones in the bedrock has proved to be the by far mosteffective way Karlsrud et. al (1978). Re-charging wellshave been drilled both from the tunnel and from ground-surface. Experiences show that the re-charging shouldtake place at a distance of at least 20-30 m from the tun-
Fig.8 Correlation between settlement, soil thickness andpore pressure reduction for typical Oslo clay

PUBLICATION NO. 12 NORWEGIAN TUNNELING SOCIET Y
33
nel face to limit the possibility for the water to flowmore or less directly back into the tunnel. The chancesthat re-charging is successful also increase if pre-grou-ting has been carried out and at least to some extentstopped the most extreme leakage.
Re-charging has been planned for and used more or lesssystematically as a temporary measure for most of thelined tunnels. For some of the non-lined tunnels in Table1 where sufficiently small permanent leakage has notbeen achieved by pre-grouting or post-grouting, re-char-ging has also been applied as a permanent solution. Withappropriate construction and maintenance proceduresto avoid clogging of the wells, this concept has workedrather well, and some wells have been in operation forup to about 20 years now.
7 CONCLUDING COMMENTSSeveral decades of experiences have given a sound basisfor handling the challenging water leakage and subsi-dence problems associated with excavation of rock tun-nels close to areas with soft and compressible clay sedi-ments as commonly found in the Oslo region.
Without measures to reduce leakage, a tunnel may causepore pressure reduction and subsidence in clay-filleddepressions up to a distance of 5-600 m from the tunnel.
The leakage requirements can be set fairly preciselywhen the compressibility characteristics and settlementpotential typically range from about 2 l/min to about 10l/min pr. 100 m tunnel.
Pre-grouting carried out with maximum efforts can inmany cases give an acceptable leakage level. It is howe-ver, a continuos challenge to ensure that the owner andcontractor maintain the necessary focus on the pre-grou-ting operations, and do not take short cuts. This meansfor-instance, to implement a systematic trumpet pre-grouting scheme with a sufficient number of grout holes
irrespective of conditions met along the tunnel. It is cle-arly beneficial to use relatively high grouting pressures,but it is also important to consider what is the best groutto use under the prevailing bedrock conditions. Onemust also show stamina, and keep on grouting until nowater is observed coming out at the tunnel face, alsoafter drilling the holes in the face for the next blastround. In extreme cases this may take several groutingrounds and several weeks time.
Experiences from Oslo show that the cost of systematicpre-grouting a tunnel typically adds 50 –70% to theexcavation cost (without any grouting). This cost is stillfar lower than establishing a permanent watertightlining, which may add another 100-150 % to the exca-vation cost.
Note also, that even if a cast-in-place watertight lining isplanned for, it will not eliminate the need for grouting,as it can easily take 6-12 months for such a lining to bein place, and significant settlements will occur in such atime period. Thus, a lining will always have to be comb-ined with pre-grouting, and possibly also combined withgroundwater recharging wells until the lining is in placeand have been made sufficiently watertight.
In recent tunnelling projects where there has beenuncertainty about the effects of grouting, the tunnelcross-section has been increased to give sufficient roomfor later lining of the tunnel if that should be foundrequired. This is a reasonable risk reduction approach.
With bored tunnels and a pre-cast segmental lining sys-tem one has the potential for a significant reduction inthe time laps between driving of the tunnel and when thewatertight lining is in place (maybe down to 1-2 weeks).For such tunnels it may be possible to eliminate the needfor pre-grouting. Further cost-benefit and technicalassessments are planned to see if this is a viable appro-ach to some of the future tunnelling projects in the Osloregion.
REFERENCESHolmsen. G (1953). Regional settlements caused by asubway tunnel in Oslo. 3rd ICSMFE , Proceedings Vol.1, pp. 381-383.
Karlsrud.K and Sander.L (1978). Proceedings Int. Conf.on Evaluation and Prediction of Subsidence, PensacolaBeach 1978. Also printed in Norwegian GeotechnicalInstitute Publ. No. 123.
Kveldsvik.V and Karlsrud.K (1995). Support and watercontrol in Oslo. World Tunnelling Vol. 8 May 1995, pp.167-171.
Pumping is always a part of the game.

35
1 INTRODUCTIONThe Norwegian transport system includes approximate-ly 700 km of road tunnels, 250 km of railway tunnels,and 40 km of metro tunnels. In the late 90’s severe pro-blems were encountered during the construction of theRomeriksporten railway tunnel, particularly withrespect to ground water control. The question was rai-sed how to plan and construct tunnels in urban areastaking care of the surrounding environment. A compre-hensive research and development programme was the-refore initiated in 1998-99 financed by Norwegianowners, contractors, consultants and the ResearchCouncil of Norway. In short, the aim is to develop andimprove Norwegian tunnel technology, to make trans-port tunnels more cost efficient and to minimise theenvironmental consequences. After a preliminary inve-stigation to establish what areas were needed to be fur-ther studied, the main project was sub-divided as fol-lows:
• Sub project A “Pre-investigations” – different investi-gation methods are tried out for several projects andthe optimal extent of preliminary investigations issought
• Sub project B “Environmental concerns” – the corre-lations between tunnel leakage / change of pore pres-sure / damages are studied, and classifications ofaccepted limits for tunnel leakage and vulnerability ofvegetation / water sources are assembled
• Sub project C “ Techniques for ground water control”– cements and procedures used for grouting are studi-ed, both for normal conditions and adapted to difficultconditions and strict sealing demands, as well as natu-ral sealing processes and water infiltration
More information about the objectives and the status forthe different activities within each sub project can befound on our web-site www.tunnel.no or in an internalreport from the Norwegian Public RoadsAdministration.
5 URBAN ROAD TUNNELS, – A SUBSURFACE SOLUTION TO A SURFACE PROBLEM
Kjell Inge DavikNorwegian Public Roads AdministrationHelen AnderssonGeoteknisk Spiss-Teknikk AS
ABSTRACT : Planning and constructing tunnels in urban areas requires an environmentally friendlyapproach. This challenge is the focus of a comprehensive research and development programme, initi-ated in 1998-99 by the Research Council of Norway. The project “Tunnels for the citizen” includes pre-investigations, environmental concerns and water control techniques. In short, the aim is to maketransport tunnels more cost efficient and to minimise the environmental consequences. One activity,called “Grouting strategy for pre-grouting of tunnels”, has involved the compilation of grouting expe-riences from a selection of tunnel projects. Several tunnels constructed between 1995-2001 were studi-ed, all but one in Norway. The selected tunnel projects provided a wide spectre of water control situati-ons in varying conditions. This article presents an update of data and results sustained from these tun-nels, as well as some of the conclusions drawn from the study. The aim is to present the challenges andthe state-of- the art for tunnelling in urban areas focusing on ground water control. The article will payspecial attention to the environmental requirements and subsequently how these have been solved bymeans of grouting during tunnelling.

NORWEGIAN TUNNELING SOCIET Y PUBLICATION NO. 12
36
2 STRATEGY FOR PRE-GROUTINGOF TUNNELS
Two of the proposed activities within the sub project Cwere joined, forming a study focusing on ”Groutingstrategy for pre-grouting of tunnels”. This aims to deve-lop grouting procedures both for routine grouting andfor grouting adapted to difficult conditions where theroutine grouting is inadequate. The objectives for thetwo activities are described below:Standard grouting procedure for time efficiency: • compile experience of both satisfactory and unsatis-
factory results from grouting of tunnels under normalconditions (including moderate requirements forground water control, where a routine time efficientpre-grouting has been used).
• develop a grouting procedure for optimisation of timeand quality; i.e. fast progress combined with sealedrock, preferably after only one round of grouting.Methods based on conventional as well as innovativetechniques (concerning procedure / grout materials /equipment / organisation etc.) should be studied.
Grouting procedure adapted to difficult conditions and ≤strict water inflow requirements:• compile experience of both satisfactory and unsatis-
factory results from grouting of tunnels under difficultconditions (including strict sealing demands combinedwith limited rock cover, poor rock quality and / orcomplicated tunnel design).
• develop sealing methods that are efficient for such dif-ficult conditions. Methods based on conventional aswell as innovative techniques (concerning procedure /grout materials / organisational structure etc.) shouldbe studied.
The following scenarios were focused:• High permeable rock mass and strict water inflow
requirements for parts of the tunnel. • Low permeable rock mass and strict water inflow
requirements for parts of the tunnel. • Zones with varying permeability and possibly
demands on critical stability. • Limited rock cover, possibly with overlying material
sensitive to settlements. • Two parallel tunnels or crossing over / under / close to
other rock facilities.
The initial phase of the study thus involved compilationof experience from a selection of tunnel projects. Theselection of tunnels was made according to the follo-wing criteria:• Representative modern grouting strategy and range of
methods. • Grouting operations and results well accounted for. • Relatively strict water inflow requirements. • Extensive efforts for ground water control.
The tunnel projects that were selected were all road tun-nels, excavated in or close to urban areas, and often withlimited soil and rock cover or other difficult ground con-ditions. The projects were carried out between 1995-2001, when the focus on the consequences of possiblelowering of the groundwater table, was increasing.Finally, the selected tunnels had a high level of docu-mentation, and it was possible to find data as well asmeet with representatives from the involved parties forsupplementary information.
In short, the compilation of experience was performedaccording to the following:• Existing data and reports for selected tunnel projects
were assembled and studied. • Owner / contractor / consultant were interviewed to
get complementary data. • Preliminary report was compiled and distributed for
double-check. • Final report with concluding discussion was comple-
ted.
In the following, data and results for the selected tunnelswill be presented. Further details can be found in areport from the Norwegian Public RoadsAdministration.
2.1 The Tåsen tunnel, OsloThe two Tåsen tunnels in Oslo are examples of tunnelswith limited rock cover and a varying, sometimes high-ly permeable rock mass. Mainly sedimentary rocksoccur such as clay shale and limestone, interfaced byigneous dykes (e.g. syenite porphyry and dolerite). Themaximum water inflow to the tunnel was moderate, 10-20 l/min/100m per tube. In parts of the tunnel, groutingwas performed based on the water leakage measure-ments in probe holes, but in the vicinity of the highlyfractured syenite the grouting was systematic. The docu-
Fig. 1. Grouting equipment in the Metro ring tunnel(photo: Knut Boge)

PUBLICATION NO. 12 NORWEGIAN TUNNELING SOCIET Y
37
mentation of the project was good, including for exam-ple a M. Sc. thesis on grouting. A NGI report concerningthe pre-grouting scheme, with emphasis on the porepressure situation and settlements, concluded that syste-matic pre-grouting was required for a total of 800 m inthe two Tåsen tunnels. In some places, however, a sub-stantial decrease of the pore pressure level over the tun-nel was observed, - at the most 7m. Permanent waterinfiltration from wells in the tunnel was chosen to main-tain the pore pressure. Key data for the Tåsen tunnel isgiven in the table below.
The water inflow requirements were met in the less dif-ficult areas where a certain leakage from probe holesinitiated grouting. In the highly fractured syenite, severeproblems were experienced; e.g. drilling difficulties,large grout outflow in the tunnel, limited grout penetra-tion in the rock, and, finally, problems with rock sup-port. During the construction period the systematicgrouting programme was modified to include the follo-wing: • leakage from probe holes was chosen instead of water
loss measurements as criterion• the grouting criterion was maintained despite dramatic
leakage and pore pressure decrease• reduced length of grout fan, from 24m (outer) to 10-
18m (inner) in difficult areas • grouting of the face through 10 m holes when large
outflow of grout in the tunnel• an initial grouting pressure of 20-25 bar, was increased
to max. 35(-45) bar when low grout take • larger drill bit diameter (64mm) to reduce drilling pro-
blems• micro cement was tried, but no clear conclusions on
the result• post-grouting with polyurethane reduced the leakage
somewhat
2.2 The Svartdal tunnel, OsloThe Svartdal tunnel in Oslo was included in the studydue to the complex tunnel design, limited rock cover(down to 2,5 m) and difficult geological conditionsthrough the Ekeberg fault. The rock mass quality waspoor; to the west highly fractured clay shale, then alumshale of very poor quality – ”fragmented rock”. The
rate of excavation was very low in these areas, as aresult of the need for substantial rock support. Afterhaving passed the zone of alum shale, there was gneissof relatively good quality. Ironically, this is where grou-ting was required due to much water and uncertaintyconcerning the foundations of the buildings located overthe tunnel.
The sealing demand that was placed on the tunnel by theowner in sensitive areas was very strict, 5 l/min/100 m.The principle for grouting was based on measuring theleakage from probe holes. In the two Svartdal tunnels,systematic pre-grouting was performed for a total ofonly 260m and the data was evaluated from the origi-nal grouting protocols. Key data for the Svartdal tunnelis given in the table.
The final total inflow measured for the Svartdal tunnel,including the critical passage of the Ekeberg fault, sho-wed that the water inflow requirements was fulfilled.Since the leakage was not measured for sections of thetunnel, the location of the leakage is unknown and hencethe grouting results cannot be correctly evaluated. Thesystematic grouting programme was modified to adaptto the local conditions, particularly to very limited rockcover and very poor rock mass quality. The main chang-es involved the direction and length of the grout holesdue to the steep dip of joints and weak zones. Someother factors of interest were: • leakage from probe holes initiate grouting, but the mea-
surement of leakage from holes in the invert is difficultand may have led to underestimation of grouting need
• blast holes served as control holes to check the resultsof the ground water control efforts
• drilling difficulties necessitated shorter grout holesthan the planned 21 m
2.3 The Storhaug tunnel, StavangerStavanger is located in southwest of Norway, a port onthe Atlantic Ocean, and a modern town of (1999 estima-te) 112.000 inhabitants. To solve the environmentalproblems caused by surface road traffic, a 1260 m longtunnel under the city area of Storhaug was constructed.The tunnel is bidirectional and has two lanes and a the-oretical cross-section of 50 m2, according to a T9 profi-le from the Norwegian Guidelines.
y f
Tunnel length 933 m (east tube) – 937 m (west tube)
Tunnel design Two parallel tunnels and several ramps, cross-sectionbetween 65-80 m2
Excavated 1997-1998
Total inflow 13 l/min/100 m (average in each tube)
Max. allowable inflow When systematic grouting 10 l/min/100 m, or else 15-20 l/min/100 m
Average cementconsumption
478 kg/hole – 24 kg/m hole – 802 kg/m grouted tunnel–26 kg/m2 grouted tunnel – 870 kg/time
Table 1. Key data from the Tåsen tunnel in Oslo
Tunnel length 1700m(northern tube) – 1450m (southern tube)
Tunnel design Two parallel tunnels with adjoining ramps,cross-section 65m2
Excavated 1998-2000
Total inflow measured 150 l/min, i.e. 4,3 l/min/100m per tube
Max. allowable inflow 5 l/min/100m
Average cementconsumption
1358 kg/hole – 80 kg/m hole – 1719 kg/mgrouted tunnel – 50 kg/m2 grouted tunnel –978 kg/time
Table 2. Key data from the Svartdal tunnel in Oslo

NORWEGIAN TUNNELING SOCIET Y PUBLICATION NO. 12
38
The gradient and the two point of road connection oneach side have, in addition to the geology and the soilconditions, been decisive for the choice of horizontal-and vertical curvatur. This has led to an extremely limi-ted rock cover, with a minimum of 4-6 metres betweenthe tunnel roof and the surface.
The tunnel is passing under an old part of the city withbuildings from the period from 1900 to 1950. Those aremostly wooden houses on rock and concrete foundati-ons of varying quality. Several of these houses are foun-ded in peat moor area by means of traditional woodenpiles whilst some are “floating”. The tunnel construc-tion commenced in the beginning of 1999 and it wasopened for traffic in May 2001.
The Storhaug tunnel was excavated in a rock mass thatconsists of different types of phyllites with very low per-meability. The leakage restriction was set to 3-10l/min/100m; the lower value was specified under a peatmoor area. In that area, systematic grouting was perfor-med for approximately 165m of the tunnel. A significantproject documentation has been made and some keydata is given in the table below
Leakage measurements in the tunnel in the summer ’99showed an average leakage of 1,6 l/min/100m under thepeat moor. The satisfactory result was obtained by useof the systematic grouting programme, which involvedthe following elements:
• water leakage from probe holes and water loss measu-rements, later water loss measurements left out due tolack of consistent information
• optimal number of grout holes was found to be 62(including 12 holes in the face) for the 85 m2 tunneland the hole length was 14m, with two 3m blastingrounds this resulted in a double cover and a substanti-al quantity of drilled meters
• micro cement (U12), Grout Aid and SP, low w/c ratio(1,1-0,4, usually 0,9-0,7), grouting pressure varyingbetween 30-50 bar, maximum 70 bar in the sole
2.4 The Bragernes tunnel, DrammenDrammen is a town situated 30 km south west of Oslo.The Bragernes tunnel in Drammen was excavatedthrough volcanic rock mass, such as basalt and porphy-ry. The rock cover varied from 10 to 150m, but was onaverage 100m. The rock mass was regarded as highlypermeable and the tunnel was located close to existingunderground facilities. The maximum inflow wasrecommended to 120 l/min over 1200m (10 l/min/100m), and the water inflow requirements were differentia-ted over the tunnel between 10-30 l/min/100m.Systematic grouting was performed for more or less thewhole tunnel and the objective was to achieve an accep-table sealing result after one grouting round. The grou-ting work was well documented and data was also eva-luated from the original protocols. Key data for theBragernes tunnel is given in Table 4.
The systematic pre-grouting gave an adequate groundwater control above the tunnel, the water leakage wasmeasured to 8 l/min/100m in the critical areas where thecriterion was 10 l/min/100m. Active design was usedthroughout the project, which led to several changes ofthe grouting programme mostly based on geologicalfactors. For a start, 21 holes with a length of 22m andtwo 2-3m blasting rounds between each grouting round,changed to only 7 holes of 27m for the same cross-sec-tion (72-83 m2) and 4 blasting rounds of 5m between.The grout take was extreme and the high pressure andvolume capacity of the grout pumps were utilised totheir full capacity. This facilitated the grouting to be per-
Tunnel length 1260m
Tunnel design One tunnel, cross-section 85m2
Excavated 1998-2001
Total inflow measured 1,6 l/min/100m
Max. allowable inflow 1250-1550: 3 l/min/100m, 750-900: 10l/min/100m
Average cementconsumption
112 kg/hole – 8 kg/m hole – 1014 kg/m groutedtunnel – 26 kg/m2 grouted tunnel – 273 kg/time
Table 3. Key data from the Storhaug tunnel in Stavanger
Tunnel length 2310 m
Tunnel design One tunnel, ventilation and escape tunnels,cross-section: 72-83m2
Excavated 1999-2001
Total inflow measured 10,1 l/min/100m, i.e. 240-1730: 8 l/min/100mand 1730-2540: 25 l/min/100 m
Max. allowable inflow 400-800 and 1700-1900: 30 l/min/100m,800-1700 and ventilation tunnel: 10l/min/100m
Average cementconsumption
2257 kg/hole – 68 kg/m hole – 1125 kg/mgrouted tunnel – 38 kg/m2 grouted tunnel –2774 kg/time
Table 4. Key data from the Bragernes tunnel inDrammen
Fig. 2. Grouting works in the Storhaug tunnel

PUBLICATION NO. 12 NORWEGIAN TUNNELING SOCIET Y
39
formed in a highly standardised manner, which resultedin time efficiency. The grouting programme was charac-terized by:• water leakage from probe holes was described as cri-
terion for grouting, 5 l/min from 1-6 holes, but grou-ting was performed for more or less the whole tunnel
• notice was to be given if the grout take in a single holeexceeded 1000 kg, later changed to 5000 kg, and after3000 kg the W/C ratio should be reduced to 0,5.
• amount of grout holes was down to 7 for the 72-83 m2
tunnel, but in the last part of the tunnel (permeable withlow overburden) the amount of holes was increased
• grouting cement (Rapid) and HP, low w/c ratio (1,0-0,5),high grouting pressure (80-90 bar where there was suffi-cient overburden, 20 bar in the last part of the tunnel)
Crossing the Bjerringdal fault, with highly fractured andpermeable rock, necessitated several grouting roundsfrom the same face and only 1-2 blasting rounds couldbe executed before the next grouting round. The grou-ting efforts also included longer holes in the first roundin order to block off the water and 90 bar grouting pres-sure. In this zone, the grout take amounted to at most 60ton in one grouting round.
2.5 The Baneheia tunnel, KristiansandKristiansand is a city in the southern part of Norway witha population of approximately 65 000 inhabitants (1996).
In order to solve the traffic problems on the main road(E18) through Kristiansand, it was decided to build twonew tunnels to lead the traffic outside the central cityarea. The tunnels are both 750 meters long also contai-ning two crossings (see fig 2). In the cross area the dis-tance between the passing tunnels has been 1 to 2 metersmaking it necessary first to construct the tunnel on topand strengthen the rock in between, before construcingthe lower tunnel. The tunnels are also constructedbelow existing rock caverns at a minimum distance ofonly 2 meters. The cross sections vary from 30 to 70 m2.In the cross areas the tunnel span could reach 30 metersand the combination of this and low rock cover lead toa concern for unstable rock.
The system of Baneheia tunnels for the E18 inKristiansand was excavated in a rock mass consisting oflow permeable gneiss with dykes of pegmatite. The rockcover is 10-40m, and the tunnel with a very complexdesign passes only 19m below a very popular recreatio-nal area with three small lakes (1.-3. Stampe, see Fig 3).The project attained large interest in media and extrafocus was placed on the ground water control of the tun-nels, including pre-investigations. The allowable inflowwas set to a total of 60 l/min (i.e. 2 l/min/100m) belowthe lakes with either 6 l/min/100m for a 500m stretch or12 l/min/100m for a single stretch of 100m. Initially, the grouting was performed based on resultsfrom both water leakage observations in probe holesand from water loss measurements. The water loss mea-surements were left out due to inconsistent information,and early on, systematic pre-grouting was performed.The documentation of the project was available and thedata had been studied in two master theses on grouting.Key data for the Baneheia tunnels is given in Table 5.
The total inflow measured for the Baneheia tunnels, 1,7l/min/100m, indicated that the sealing demand was ful-filled. The leakage was however not measured for secti-ons of the tunnel since the excavation was descending.Sporadic grouting was found to be insufficient and sys-tematic grouting was performed for 95% of the totallength. This led to a standardised grouting procedurewith high capacity, well incorporated in the excavationcycle. Following elements in the grouting programmecan be highlighted: • optimal amount of grout holes was found to be 30
(including 4-7 holes in the face) for the 50-80m? tun-nel, the hole length was 21-24m, with three 5m blas-ting rounds this resulted in an overlap of 9m and alarge quantity of drilled meters
• objective was to achieve an acceptable sealing resultafter one grouting round, and the overlap made it pos-sible to blast one round before drilling control holes
• micro cement (U12), Grout Aid and SP, low w/c ratio(0,9-0,7), varying grouting pressure, 50-80 bar maxi-mum, lower close to the Stampene lakes
In a few zones with highly permeable rock, severalgrouting rounds were necessary from the same face andonly 1-2 blasting rounds could be executed before the
Tunnel length 3000 m in total
Tunnel design Two parallel tunnels and several adjoiningramps, cross-section: 44-87 m2
Excavated 1999-2001
Total inflow measured 1,7 l/min/100m
Max. allowable inflow 60 l/min in total,6-12 l/min/100m near the lakes Stampene
Average cementconsumption
256 kg/hole – 15 kg/m hole – 514 kg/mgrouted tunnel – 14 kg/m2 grouted tunnel –755 kg/time
Table 5. Key data from the Baneheia tunnel inKristiansand
Fig 3. An overview of the Baneheia tunnel system
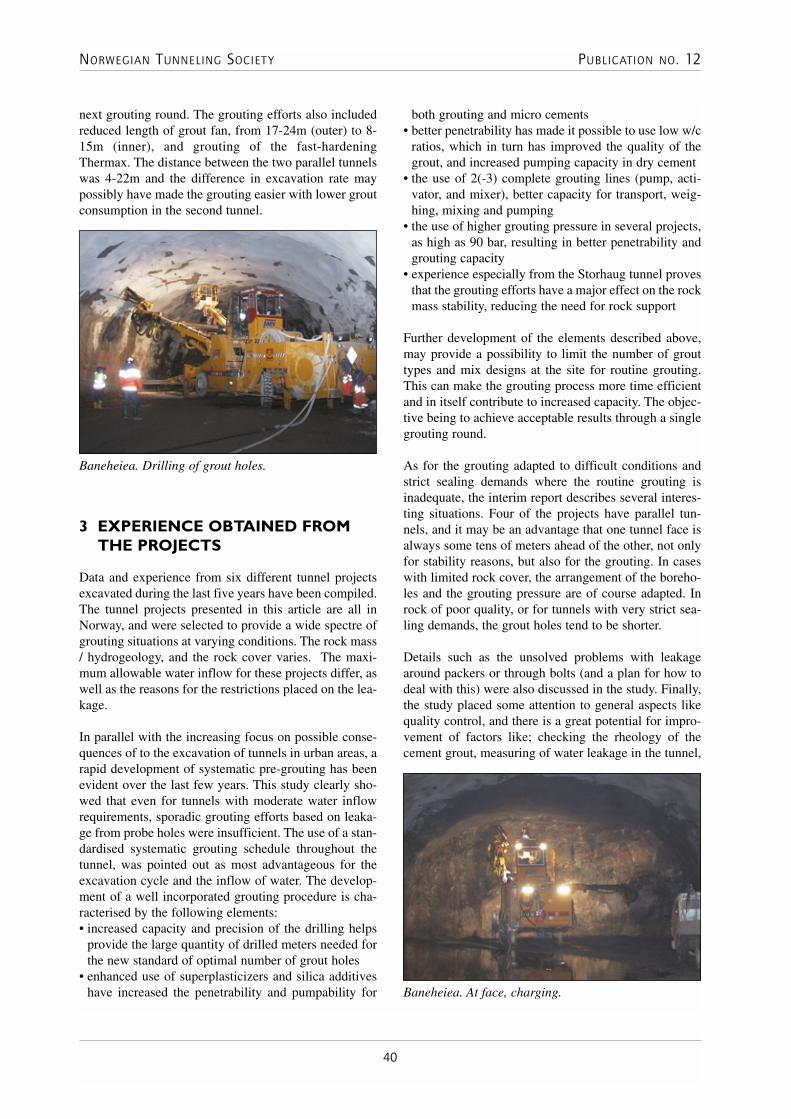
NORWEGIAN TUNNELING SOCIET Y PUBLICATION NO. 12
40
next grouting round. The grouting efforts also includedreduced length of grout fan, from 17-24m (outer) to 8-15m (inner), and grouting of the fast-hardeningThermax. The distance between the two parallel tunnelswas 4-22m and the difference in excavation rate maypossibly have made the grouting easier with lower groutconsumption in the second tunnel.
3 EXPERIENCE OBTAINED FROMTHE PROJECTS
Data and experience from six different tunnel projectsexcavated during the last five years have been compiled.The tunnel projects presented in this article are all inNorway, and were selected to provide a wide spectre ofgrouting situations at varying conditions. The rock mass/ hydrogeology, and the rock cover varies. The maxi-mum allowable water inflow for these projects differ, aswell as the reasons for the restrictions placed on the lea-kage.
In parallel with the increasing focus on possible conse-quences of to the excavation of tunnels in urban areas, arapid development of systematic pre-grouting has beenevident over the last few years. This study clearly sho-wed that even for tunnels with moderate water inflowrequirements, sporadic grouting efforts based on leaka-ge from probe holes were insufficient. The use of a stan-dardised systematic grouting schedule throughout thetunnel, was pointed out as most advantageous for theexcavation cycle and the inflow of water. The develop-ment of a well incorporated grouting procedure is cha-racterised by the following elements:• increased capacity and precision of the drilling helps
provide the large quantity of drilled meters needed forthe new standard of optimal number of grout holes
• enhanced use of superplasticizers and silica additiveshave increased the penetrability and pumpability for
both grouting and micro cements• better penetrability has made it possible to use low w/c
ratios, which in turn has improved the quality of thegrout, and increased pumping capacity in dry cement
• the use of 2(-3) complete grouting lines (pump, acti-vator, and mixer), better capacity for transport, weig-hing, mixing and pumping
• the use of higher grouting pressure in several projects,as high as 90 bar, resulting in better penetrability andgrouting capacity
• experience especially from the Storhaug tunnel provesthat the grouting efforts have a major effect on the rockmass stability, reducing the need for rock support
Further development of the elements described above,may provide a possibility to limit the number of grouttypes and mix designs at the site for routine grouting.This can make the grouting process more time efficientand in itself contribute to increased capacity. The objec-tive being to achieve acceptable results through a singlegrouting round.
As for the grouting adapted to difficult conditions andstrict sealing demands where the routine grouting isinadequate, the interim report describes several interes-ting situations. Four of the projects have parallel tun-nels, and it may be an advantage that one tunnel face isalways some tens of meters ahead of the other, not onlyfor stability reasons, but also for the grouting. In caseswith limited rock cover, the arrangement of the boreho-les and the grouting pressure are of course adapted. Inrock of poor quality, or for tunnels with very strict sea-ling demands, the grout holes tend to be shorter.
Details such as the unsolved problems with leakagearound packers or through bolts (and a plan for how todeal with this) were also discussed in the study. Finally,the study placed some attention to general aspects likequality control, and there is a great potential for impro-vement of factors like; checking the rheology of thecement grout, measuring of water leakage in the tunnel,
Baneheiea. Drilling of grout holes.
Baneheiea. At face, charging.

PUBLICATION NO. 12 NORWEGIAN TUNNELING SOCIET Y
41
and evaluating the final water inflow results as well asthe demands.
4 CONCLUSIONSThe experience gained during the construction of theRomeriksporten railway tunnel which included a signi-ficant draw-down of the ground water in the area, initi-ated a strict focus on the use of systematic pre-grouting.This study has shown that during the last 5 years a num-ber of road tunnels have been constructed with a suc-cessful use of such grouting techniques.
The project “Tunnels for the citizen” will be completedby the end of 2003. In view of the increased focus onthe need for watertight tunnels in urban areas and envi-ronmentally friendly tunnelling concepts, the timing forperforming this study was appropriate. The groundwater control strategies and range of methods formodern pre-grouting of tunnels have been established.Now, some of these experiences are being verified in theMetro Ring tunnel in Oslo and the results of this will beuseful in future projects, Tunnels & Tunnelling (2001)
REFERENCESAndersson, H., Davik, K.I & Åndal, T. (2001):”Tunnels for the citizen- a Norwegian R & D project”.Rock Grouting Seminar, Stockholm, 8th Nov. 2001.
Davik, K.I., (2000): ”Miljø- og samfunnstjenlige tunne-ler” – statusrapport fra bransjeprosjektet.Fjellsprengningskonferansen 2000 (in Norwegian).
Anon.(2001):”Closing the ring in Oslo” Tunnels andTunnelling July 2001.
Baneheiea. Ready for grouting.

43
1 INTRODUCTION
1.1 Characteristics of water problems and controlThe proverb “Prevention is better than cure” fits verywell on water control in tunnels, and especially so forsubsea tunnels. Despite the recent developments in siteinvestigation techniques, it is very difficult to predict thelocation and extent of water problems. In all phases ofplanning, design, tendering and construction of subseatunnels this must be taken into account.
Although it is fully possible to reduce the amount ofwater seepage to a target level by pre-grouting, the bud-get, time schedule and contract must account for thepotentially large variations in the amount of work nee-ded to control the water during construction.
The seepage of salt water represents a challenge withrespect to durability of materials and structures.However, the experience from the 22 subsea road tun-nels built in Norway over the last 20 years proves thatthese problems can be solved.
1.2 Completed tunnelsThe experience base from the planning, design and con-struction of these tunnels is extensive. As Table 1demonstrates, the experience includes both deep andlong tunnels; reaching as deep as 264m below sea leveland with length up to 7.9km. The lessons learned, bothpositive and negative, have been communicated throug-hout the tunnelling community in Norway. TheConstruction Division in the Public RoadsAdministration authorises all plans and checks all tenderdocuments, in order to ensure consistent quality and costeffective solutions, and to promote a steady develop-ment of the employed methods. Typical constructiontime is 2-3 years or less.
6 DESIGN PRINCIPLES AND CONSTRUCTION METHODS FORWATER CONTROL IN SUBSEA ROAD TUNNELS IN ROCK
Olav Torgeir BlindheimO. T. Blindheim ASEirik ØvstedalNorwegian Public Roads Administration
ABSTRACT: This paper describes the control of water in subsea road tunnels in rock in Norway. Theoccurrence of water is difficult to predict accurately, so it is important to be prepared for large variati-ons, both with respect to location and volume. Probe drilling ahead of the face is mandatory. The nee-ded tightness can be achieved by pre-grouting. All structures, also concrete lining, are drained. As nowater is allowed to drip on the driveway, shielding by frost insulated drip protection is installed in allsections with remaining seepage. The drainage water is collected in a drainage sump at the lowest pointand pumped out. Experience shows that in most tunnels the seepage is decreasing with time.
Fig. 1. The completed Oslofjord tunnel with artistic lighteffects for driver’s comfort. No water seepage visibledue to cost-effective pre-grouting and water shielding.

NORWEGIAN TUNNELING SOCIET Y PUBLICATION NO. 12
44
The construction of subsea road tunnels dates back tothe early 1980-ies. Actually, the first subsea tunnelswere two tunnels completed in 1976 and 1977, the firstfor a gas pipeline with a deepest point of 253m belowsea level, the second for water transfer. From 1983 to1995, eight subsea tunnels for oil/gas pipelines werecompleted with lengths from 0.4 to 4.7km, cross secti-ons 20- 66m2, and deepest point from 93-260m belowsea level, Palmstrøm & Naas, (1993). The experiencefrom these tunnels contributed significantly to the deve-lopment of the design principles and construction met-hods.
2 DESIGN PRINCIPLES
2.1 Requirements to water tightnessThe Public Roads Administration’s Handbook No. 021on Road Tunnels (1992) does not set a specific require-ment to water tightness in subsea road tunnels.However, according to practise, the basic target forwater tightness is that the overall remaining seepageshall be no more than 300 litres/min/km. This level ischosen based on an optimisation of the cost of groutingversus the cost of pumping facilities, i.e. pumping capa-city, pumping energy, the size of the safety buffer reser-voir etc.
Experience demonstrates that this target in most casescan be reached with a reasonable effort of pre-grouting.Lower water seepage can also be achieved, but this isnormally not economical due to increase of groutingcosts. It is emphasised that this design philosophy shar-ply contrasts designs for which minimisation of waterseepage is the target, with resulting large costs. On onehand the sea provides an unlimited supply of water,which may be a hazard, on the other hand one does not
have to prevent minute seepage, as may be the case e.g.below settlement sensitive soils under cities.
From the user’s point of view, the tunnels appear water-tight. As will be described, this is achieved by installati-on of water shielding systems. The requirement of notallowing any dripping on the final roadway gives com-fortable and safe driving conditions. From the owner’spoint of view, it reduces driveway maintenance.
2.2 Drained structuresThe tunnels are designed as drained structures. Wherethe natural seepage is low, the rock mass is left untrea-ted. Where the seepage is too high to be acceptable forthe overall requirement, grouting of the rock mass allaround the tunnel contour is done. Accordingly, in thegrouted zone, the water pressure in the joints will begradually reduced until zero pressure at the contour. Seeillustration in Fig. 2.
If a concrete lining is used for stability support in weak-ness zones, it is normally not designed for full waterpressure. If significant water inflow is present in suchsections, it is ensured that the lining is drained by instal-ling flexible drainage channels before casting or by dril-ling holes afterwards. This increases the need for watershielding (see next section) but keeps the cost down.This simple approach has its background in that concre-te lining for stability purposes usually is needed in lessthan 10% of the tunnel, typically for 2-5%.
Rock support by sprayed concrete is also drained eitherby pipes or sprayed-in channels, to avoid or reduce see-page through the concrete, and to prevent pressurebuild-up.
Tunnel Year ofopening
Length,m
Largestdepth,m
Wateringress atopening,l/min⋅km
Grouting,kg/m
Water &frostprotection,m2/m
Vardø 1983 2 892 88 460 25 16Ellingsøy 1987 3 520 140Valderøy 1987 4 222 145
310 10 14
Kvalsund 1988 1 650 56 200 0 9Godøy 1989 3 844 153 300 430 7Flekkerøy 1989 2 327 101 100 50 6Hvaler 1989 3 751 120 100 15 6Nappstraum 1990 1 780 60 200 40 8Fannefjord 1991 2 743 100 140 15 7Maursund 1991 2 122 92 210 5 4Byfjord 1992 5 875 223 100 10 8Mastrafjord 1992 4 424 132 25 5 8Freifjord 1992 5 086 132 75 15 13Hitra 1994 5 645 264 60 20 14Tromsøysund 1994 3 376 101 265 30 18Bjorøy 1996 2 000 85 400 665 13Sløverfjord 1997 3 200 100 150 0 13Nordkapp 1999 6 826 212 65 15 4Oslofjord 2000 7 252 134 250 360 18Frøya 2000 5 305 164 105 200 17Ibestad 2000 3 398 112 110 15 2Bømlafjord 2000 7 900 260 70 30 8
Table 1 Key data for completed road tunnels (afterMelbye & Øvstedal, 2001)
Fig. 2. Zone of grouted rock mass around a tunnel1. Jointed rock mass with full water pressure2. Pre-grouted zone, grout in joints3. Tunnel contour

PUBLICATION NO. 12 NORWEGIAN TUNNELING SOCIET Y
45
2.3 Shielding of remaining seepageThe most used method for drip protection is to installsheets of polyethylene foam (with a layer of mesh rein-forced sprayed concrete for fire protection) in the roof,and concrete segments in the wall, as exemplified inFig. 3. Note that the drip protection has to provide frostinsulation, as in the winter frost may extend long dis-tances into the tunnel from each portal.
The typical consumption of drip protection varies a lot.In the recently completed Oslofjord tunnel, a total of18m2 drip protection was installed per metre tunnel.This constitutes about 80% of the tunnel contour.
2.3 Drainage and pumpingCrushed rock (15-30mm) is used for drainage in thetrenches and below the driveway. One or two 150-200mm PVC pipes are installed in trenches on one orboth sides. At the lowest point the pump station has abuffer reservoir with minimum 24 hours capacity incase of power loss. One stage pumping is applied up to200m lifting height (usually in 160mm PE pipes) to theportal or to a (grouted and re-drilled) hole from the sur-face near the shore.
3 GEOLOGICAL CONDITIONS ANDSITE INVESTIGATIONS
3.1 Rock typesThe Norwegian subsea road tunnels have been built inPrecambrian and Palaeozoic rocks. These includegneiss, greenstone, phyllite, sandstone, shale, intrusivesetc. As below land, it is a common experience that rockslike greenstone or phyllite with darker mineral, e.g.amphibole or biotite, often have less seepage than ligh-
ter coloured rocks, presumably because they are lessbrittle and less prone to develop open joints. There arealways exceptions to such ‘rules’, as the previous expo-sure to tectonic movements has a strong influence on thewater bearing capacity of the rock mass.
3.2 Weakness zonesAs the location of fjords and straits often are defined bymajor faults, a significant portion of a subsea tunnelmust be expected to cross such weakness zones in thebedrock. This is often at the deepest point, where therock cover is lowest and the water pressure highest.
It is a common experience that the central part of aweakness zone may not cause large inflow, as it oftencontains crushed rock and clay gouge. However, theside-rock of the weakness zone may frequently carry alot of water in open joints, especially in joint sets ope-ned by tensional tectonic movements. In such zones, thecombination of poor stability and presence of water pre-sents a high risk of collapse.
The occurrence of high water inflows in tensional jointsets can be pronounced for tunnels in or close to grabensystems, or in tunnels located at the outer part of thecoast, close to the major faulting along the continentalshelf. In such cases, joints with apertures of 2-5cm havebeen encountered and pre-grouted. However, mostjoints have apertures of 1-5mm and require less grou-ting.
3.4 Site investigationsSite investigations for subsea tunnels rely heavily onreflection and refraction seismics. In some cases, hole-to-bottom seismics has been performed and used to pre-
Fig. 3. Shielding of remaining seepage by polyethylenefoam (covered by sprayed concrete) in the roof and pre-cast concrete segments in the walls

NORWEGIAN TUNNELING SOCIET Y PUBLICATION NO. 12
46
pare seismic tomographic profiles. Weakness zones withlow velocities (less than 2500-3000m/s) may carry a lotof water. This is in contrast to velocities of 3500-4500m/s in blocky rock and 5000-6000m/s in moremassive rock. Although the seismic velocity can give anindication about the degree of jointing, and therebyabout potential inflow zones, it is difficult to predictwater inflow from such investigations.
Other geophysical methods have been tried, e.g. geoelec-tric measurements (resistivity and induced polarity) onweakness zones if and where they run ashore. The suc-cess is limited, both due to practical limitations and sincethe observations are difficult to interpret because of saltwater content in the zones below the upper marine level.
Directional core drilling is frequently used for checkingof rock cover at critical points, and may give someinformation if water testing is performed. The reach andefficiency of this method is improving thus increasingits usefulness, but the boreholes normally cover only apart of the tunnel alignment.
Experience from similar geological formations cansometimes be misleading, because the tectonic settingmay be different locally, even if the overall situationappears similar. It is therefore important to be preparedfor large variations, no matter what the site investigati-ons may indicate.
Accordingly, the most important site investigation is theone taking place in front of the tunnel face, in form ofprobe drilling, as will be explained below.
4 CONSTRUCTION METHODS 4.1 Excavation methodsAll the Norwegian subsea tunnels have been excavatedby drilling and blasting. In this connection it is worthmentioning that this is now always done with modernhydraulic drilling jumbos with high capacity drillingmachines for drilling of blast holes. This equipment isalso used for the efficient drilling of probe holes andholes for pre-grouting and control, most often with dia-meter 45-50mm.
4.2 Probe drilling and pre-groutingThe standard pattern for probe drilling developed morethan 15 years ago, and is now used with small variationsonly. Fig. 4 shows a typical example. The length of theprobe holes is typically varied between 24 and 33m, tobest suit the rhythm of blasting rounds. Depending onthe length of the holes, probe drilling takes place each3rd, 4th or 5th round, always with a minimum overlap of8m (two blasting rounds). Longer percussion holes areseldom used, also because deviation increases with thelength of the hole.
The number of probe holes varies from a minimum of 2holes, increasing to 4-6 or more when jointed zones orlow cover is expected.
The extent of probe drilling varies between projects;typical total average is 2-7 metres of percussion holesper metre tunnel. In addition, core drilling is done fromthe face (usually in weekends) when weakness zones areexpected from the refraction seismic profiles. As anexample of extensive use of percussion probe drilling, inthe 7.2km Oslofjord tunnel it was probe drilled 6.9m/mtunnel in total, and core drilling ahead of the face con-stituted 0.7m/m tunnel on the 2.1km subsea section,Aagaard & Blindheim (1999).
The water inflow into the probe holes is measured, andthe criteria to trigger pre-grouting is typically 5-6litres/min. Water inflow in blast holes will also triggergrouting. Control holes are drilled after each groutinground to check the result.
The grouting is invariably done as pre-grouting. This isthe only way to ensure full control and to meet the tight-ness requirement.
The grouting is predominantly performed with cementi-tious material, and includes standard industrial cement,rapid setting cement and micro-cements of differentfineness grade. When open joints with significant see-page is detected, the grouting is performed directly withhigh pressure (e.g. with cut-off pressure up to 60 bar)and relatively thick mix, without the traditional timeconsuming trying out of gradually thicker mixes startingfrom w/c = 2. A typical drill pattern is shown in Fig. 5.If necessary to achieve sufficient tightness, overlappingrounds are performed.
Fig. 4. Typical percussion probe drilling pattern fortwo-lane road tunnel1. Probe holes at all sections2. Additional holes in expected weakness zones3. Alternative upper holes in sections with low rockcover4. Overlapping of holes (min 8m) for each 5th blastinground

PUBLICATION NO. 12 NORWEGIAN TUNNELING SOCIET Y
47
According to the standard contract practise, the decisi-ons regarding grouting are taken by the owner, in con-sultation with the contractor about practical performan-ce. The contractor gets paid according to the actual per-formed work (metres drilled and applied grouting mate-rial) and for standstill of tunnelling equipment accor-ding to tendered prices. This applies also for the probeand control holes.
The consumption of grouting materials has varied fromproject to project. For most tunnels, it has been below50kg/m tunnel in total, Melby & Øvstedal (2001). Forthe Godøy and Frøya tunnels, both tunnels leading toislands close to the continental shelf, the consumptionwas 430 and 200kg/m respectively. For the Bjorøy andOslofjord tunnels the consumption was 665 and360kg/m respectively, but this was due to exceptionalconditions, as will be explained below
Typical consumption per grouting round may vary from1 to 50 tons and the total time per round from 2.5 to 48hours. Procedures are adapted to reduce the need forfully overlapping rounds.
4.3 Contractual aspectsAs mentioned above, the whole process of probing andgrouting for the purpose of water control is basicallyowner controlled in the normal unit price contract. Insome cases the owner’s representatives will decide alldetails for all grouting rounds. However, the standardcontract does not prevent the owner from utilising thepractical experience of the contractor by allowing himto adapt to the conditions. As long as an agreed fram-ework procedure is followed, and the overall tightnessrequirement is met, the contractor may select the sui-table type of cement, length and number of grout holesetc, Blindheim & Skeide (2001).
As the whole process of grouting is rather complex withmany variables, and the natural variation in the rockmass cannot be ‘controlled’, it is usually beneficial forthe outcome if a constructive co-operation is establishedbetween the parties.
4.4 Special situationsContingencies for emergencies are included in the con-tracts. For water problems alone, this relates to normaland extra pumping capacity. For example, for the 7.2kmOslofjord tunnel, the contractor was required to pumpup to 350 litres/min/km and to mobilise pumping capa-city for unforeseen inflows of 1000 litres per minute foreach tunnel face.
For combined water and stability problems, as can befound in fault zones and weakness zones, it is requiredthat movable concrete casting lining shields, with thepossibility of face closure, shall be mobilised before thetunnel face moves out below the sea.
Extreme conditions may sometimes be found. Forexample, a down-faulted zone of loose or poorly conso-lidated sandstone created an extreme situation in theBjorøy tunnel. It took very extensive grouting before itcould be passed after several months of delay, Holter etal. (1996).
Another extreme situation occurred at the recently com-pleted Oslofjord tunnel, where a glacially eroded chan-nel along a known fault zone proved to be much deeperthan expected, resulting in no rock cover. The channel,which had been in-filled with loose sediments, wasdetected at safe distance with probe drilling from thetunnel face. A by-pass transport tunnel was driventhrough the fault zone at a deeper level and allowedcontinued tunnelling under the fjord, while the loosedeposits under 120m water pressure were frozen andtunnelled through, Blindheim & Backer (1999).
Fig. 5. Typical drill pattern for pre-grouting for two-lane road tunnel1. Full cone of 45mmm holes. 18m length2. Blasting rounds 4m3. Typical overlap between cones

NORWEGIAN TUNNELING SOCIET Y PUBLICATION NO. 12
48
5 OPERATION5.1 Seepage development with timeAlthough one may expect that water seepage may incre-ase with time due to dissolution of minerals etc, experi-ence shows that in almost all cases, the seepage is con-stant or reduces with time, Melby & Øvstedal (2001).This is likely due to that particles in the joints move andcreate natural filters and that some minerals swell andclose the openings.
5.2 Durability of materials and structures In order to ensure durability of rock support measures,strict requirements are implemented. Rock bolts havedouble corrosion protection, with hot-dip galvanisingand epoxy coating. I addition, full cement grouting isnormally employed. These measures appear so far togive sufficient protection, as no serious corrosion dama-ge has been observed.
Sprayed concrete is specified to a minimum 45 MPauniaxial compressive strength to provide low permeabi-lity. Experience shows that poorly performed shotcrete,applied in thin layers (less than 3cm) or of less than 30-35 MPa strength, will leach in wet areas and loosestrength due to salt water seepage. Black steel fibre rein-forcement does not corrode inside sprayed concrete oflow permeability and a minimum thickness of 7cm,Davik (1996)
For the pumps and pumping pipes strict requirementsare implemented, as the combination of salt water andpollution from the traffic provides a very aggressiveenvironment. Polyethylene is used for the piping, ifpressure allows, otherwise corrosion resistant steelqualities are used.
5.3 Operation and maintenance costs The dominant operation and maintenance costs in theroad tunnels are for lighting and ventilation. Pumpingcosts are relatively low. If the buffer reservoir has amplecapacity, the pumping time is low and pumps can runduring night when electricity may be cheaper. In sometunnels, pumping has been hampered by algae growth,which tend to vary cyclically with time. Chemicals havebeen tried to limit the algae growth, but this has provennot to be necessary. As a precaution, the drainage sys-tems are now over-dimensioned.
Electrical equipment, pumps and piping have had to bereplaced in some tunnels because of corrosion.Corrosion has also damaged the inner shielding or liningfor drip protection made of aluminium. This has resul-ted in the need for replacement work to start in two tun-nels so far. Thus re-investment costs can be significant.See Melby & Øvstedal (2001) for details.
6 CONCLUDING REMARKS 6.1 Ongoing developments
The ongoing development of site investigation methodswill improve the possibility of predicting water pro-blems ahead of construction, not at least connected tothe use of efficient refraction seismics and new interpre-tation methods (Lecomte et al. 2000) and directionalcore drilling, Dowdell et al. (1999)
Fig. 6. Freezing of in-filled erosion channel along afault zone under 120m water pressure.1. Longitudinal section of tunnel with indicated probedrilling towards the zone (Saltvann = salt water,Grus/leire = gravel/clay)2. Plan view of by-pass tunnel through the fault zone ata lower elevation3. Perspective sketch of by-pass and indicated zone forfreezing

PUBLICATION NO. 12 NORWEGIAN TUNNELING SOCIET Y
49
A newly developed drill hole deviation survey tool maynow be used as part of the work rhythm for drilling ofprobe and grout holes, Tokle (2001). This will improvethe reliability of the information gained from the holesand may reduce the number of overlapping groutingrounds needed to reach the tightness requirement, assupplementary holes can be placed as needed at once.
Still, construction methods and contracts will alwayshave to count on large variations, and also in these fieldsit is possible to develop more effective systems and con-tracts. A co-operative approach, to utilise the experienceof both the owner and the contractor, is favourable
Especially for the installations, it is necessary to deve-lop further the requirements and selection criteria formore corrosion resistant materials and solutions in orderto reduce maintenance and re-investment costs.
6.2 Applicability of principlesIt is believed that the principles described can find amuch wider use world wide than today, also in tunnelswith significant traffic load and in other geological for-mations. Some adaptation will of course be necessary,but the potential reward is reliable and safe tunnels atreasonable costs.
REFERENCESAagaard, B. & Blindheim, O. T. (1999): “Crossing ofexceptionally poor weakness zones in three subsea tun-nels, Norway”, in Alten (ed.): Challenges for the 21stCentury. Proc. World Tunnel Congress ’99, Oslo,Norway: 457-466. Balkema.
Blindheim, O. T. & Backer, L. (1999): “ The Oslofjordsubsea road tunnel. Crossing of a weakness zone underhigh water pressure by freezing”, in Alten (ed.):Challenges for the 21st Century. Proc. World TunnelCongress ’99, Oslo, Norway: 309-316. Balkema. Alsopublished as: Oslofjord challenge, Tunnels &Tunnelling International, December 1999, pp 39-42.
Blindheim, O. T. & Nilsen, B. (2001): “Rock coverrequirements for subsea road tunnels”, 4th Symposiumon Strait Crossings, Bergen, Norway, 10 p.
Blindheim, O. T. & Øvstedal, E. (1990): “Water controlin subsea road tunnels in rock”, 2nd Symposium onStrait Crossings, Trondheim, Norway, 8 p. Also publis-hed in Norwegian Subsea Tunnelling, Publication No. 8,Norwegian Tunnelling Society (1992), 35-42.
Blindheim, O. T. & Øvstedal, E. (1989): “Subsea roadtunnels in rock. The flexible Norwegian method for lowcost tunnelling”, 11th IRF World Meeting, Seoul,
Korea, 12 p.
Blindheim, O. T. & Skeide, S. (2001): “Determinationand co-operation is crucial for rock mass grouting tosatisfy strict environmental requirements”, WaterControl in Norwegian Tunnels, Publication No. 12,Norwegian Tunnelling Society, (This publication).
Davik, K. I. (1996): “Durability of sprayed concreterock support in subsea road tunnels” 2nd Int. Symp. onSprayed Concrete – Modern Use of Wet Mix SprayedConcrete for Underground Support, NorwegianTunnelling Society, Gol, Norway, pp 333-344.
Dowdell, R., Kaplin, J. & Tokle, V. (1999): “Directionalcore drilling used to explore rock conditions for a watersupply tunnel”, in Alten (ed.): Challenges for the 21stCentury. Proc. World Tunnel Congress ’99, Oslo,Norway: 57-59. Balkema.
Norwegian Public Roads Administration, (1992): RoadTunnels. Handbook No. 021. Directorate of PublicRoads, Oslo, 129 p.
Holter, K. G., Johansen, E. D. & Hegrenæs, A. (1996):“Tunnelling through a sandzone: Ground treatmentexperiences from the Bjorøy Subsea Road Tunnel”,Proc. North American Tunneling ’96, Washington,USA, Ozdemir (ed.), Balkema, pp 249-256.
Lecomte, I., Gjøystdal, H., Dahle, A. & Pedersen, O. C.(2000): “Improving modelling and inversion in refracti-on seismics with a first order Eikonal solver”,Geophysical Prospecting, 2000, Vol. 48, pp. 437-454.
Melby, K. & Øvstedal, E. (2001): “Subsea tunnels inNorway”, 4th Symposium on Strait Crossings, Bergen,Norway, 6 p.
Palmstrøm, A, & Naas, R. (1993): “Norwegian subseatunnelling – Rock excavation and support techniques”,Int. Symp. on Technology of Bored Tunnels under DeepWaterways, ITA and DTU, Copenhagen, pp. 201-225.
Tokle, V. (2001): Personal communication. (alsowww.devico.no).

51
1 INTRODUCTIONGroundwater control is a primary environmental con-cern while tunnelling. This has become one of the realchallenges to the civil engineering community duringthe latest years. A number of coincidental factors havecontributed to this fact:• Earlier negligence have led to damage and law-suits, as
well as a bad reputation of the tunnelling industry,• Growing awareness of the groundwater’s importance
and its vulnerability,• Longer and deeper tunnels with increasing hydraulic
pressure, larger potential inflow and wider influencezone,
• Tunnelling through areas with increased public awa-reness and attention,
• Gradually less tolerance towards negative effects of evenimportant infrastructure development,
• Ban on effective, but potentially toxic resin grouts, and• High demands on construction time schedules and bud-
get control.
A Norwegian railway tunnel named “Romeriksporten”,completed in 1999, may be an illustrative example ofmany of these factors. The lessons learned from it shallbe briefly discussed in this paper. Another railway tun-nel, the Lieråsen tunnel, is referred to for comparison tothe situation 30 years earlier.
2 SHORT PROJECTS DESCRIPTIONS Romeriksporten is a part of the 42 km long high-speedlink from the City of Oslo to its new airport, runningparallel to the old railway towards the north. Lieråsentunnel was built to shorten and to strengthen the impor-tant line between Oslo and the south-east part ofNorway.
7 LESSONS TO BE LEARNED FROM LONG RAILWAY TUNNELS
Anders BeitnesSINTEF
ABSTRACT Today’s tunnelling, often taking place in urban or valuable recreational areas have to facean increased focus on protection of the groundwater. The paper describes the challenges inRomeriksporten, a 13,8 km long railway tunnel through gneissic rocks completed in 1999. Despite amajor pre-grouting effort, the requirements were far from being met on a certain section, much due toa difficult geological situation and high water pressure. The consequence was leakage that led to sub-sidence in clay in an urban area and damage on forest ground. A huge post excavation tightening tasktook place within a 2,2 km long section of the tunnel, mainly by grouting the rock mass 4 – 10 m outsi-de the periphery. This effort alone lasted for more than one year, imposing a major delay on the ope-ning of the railway. The problems caught great attention in media, among politicians and also amongthe public. The experiences have had substantial impact on new projects, boosting both improved plan-ning and new research for more efficient pre-grouting methods.
Romeriksporten LieråsenLength (in bedrock) 13,8 km 10,7 kmFunction Twin line, single tube Twin line, single tubeTypical net section 102 m2 68 m2Excavation method Drill and blast, drained rock
peripheryDrill and blast, drained rockperiphery
Support methods Extensive use of wet shotcrete+ rockbolts, 5% cast in placeconcrete lining
Some dry shotcrete + bolts, 30%full lining, both precast and castin place
Construction period 1995 – 1999 1965 - 1973Geology Precambrian gneiss, some
limestone and shale; influencefrom nearby large fault hasinduced wide zones of jointedrock with some clay fill
Permian granite partly weatheredin wide zones, some sedimentaryrocks and hornfels,
Stress situation 100 – 250m overburden.Large sections with smallminor (horizontal) stress
100 – 200m overburden.Remanent stresses, complexpattern with partly high major(horizontal) stress
Terrain above Partly suburb with housesfounded on soft clay, partlyforest and little soil. Highnatural groundwater level
Partly suburb, some peat, mostlyforest and little soil. High naturalgroundwater level
No. of drives (faces) 5 2Grout types usedduring excavation
Cement, micro-cement,acrylic resin
None
Inner lining 2,5 km precast concrete vault,rest: PE-foam with 6 cmshotcrete in wet sections
Precast concrete in roof (15%)locally: corrugated aluminumcladding
Post excavationgrouting
Enormous effort during 1 yearon a 2,2 km section
None
Table 1. Some characteristic data

NORWEGIAN TUNNELING SOCIET Y PUBLICATION NO. 12
52
3 PRE-INVESTIGATIONS ANDFUNCTIONAL REQUIREMENTS ATROMERIKSPORTEN
3.1 InvestigationsThe investigations in the planning process focused ongeology and faults, weak zones, jointing patterns androck quality. Tunnel routing was more or less givenbased on fixed points at the ends and limitations in sec-tions with minimum rock cover. No core drilling orpumping tests was performed to map the geo-hydraulicsystems. Intensive pre-grouting was foreseen however,mainly connected to faults.
3.2 General requirementsIn the planning stage for Romeriksporten, partly withoutexpressive statements, it has been foreseen to keep theinflow below 20 - 30 litres/min/100m in forest areas.That level was based on a record of low-level damagefrom other tunnelling projects in the Oslo area. For thesection passing under the urban areas, the requirementwas not to lower the pore pressure in clay more thansome 2m, by close follow-up of piezometers. It wasexpected to fulfil this requirement by keeping the inflowbelow 10 - 15 litres/min/100m.
3.3 Contract requirements to control water leakageAs customary for Norwegian tunnels, the requirementsfor in-leakage were not reflected in the contract, as the
Client was supposed to have “hands on” and the powerto decide the pre-grouting effort and procedures. Thecontract did, however, have a set of items and require-ments to detect and to prevent excess water leakage. Asthis was a unit prize regulated contract, no major riskrested on the contractor unless he had evaluated his pri-ces falsely.
The tunnelling contract describes investigation holes, orprobe holes, to detect possible leakage structures. Pre-grouting was to be decided on basis of recorded in-lea-kage from those drillholes. Normal probe drilling pat-tern included 3 – 6 holes, each typically 23m long, allthe way through the tunnel. Further, capability should beat hand at all times during excavation for grouting byuse of single packers. Grout was to be mixed by stan-dard mixers and pumped by a pressure capacity of mini-mum 50 bar. Materials specified were standard cement,rapid cement, fine-grained micro-cement (supplier spe-cified by contractor), as well as a resin grout with mini-mum viscosity (supplier specified by contractor). Also aquick setting grout was specified.
4 TUNNELLING EXPERIENCESROMERIKSPORTEN
4.1 Conditions encountered during constructionTunnelling in both the granitic and shistous gneissessouth of the Oslo graben, revealed a lot more diffuse and
Longitudal sectionProfile no.
M abovesealevel
CambrianCilurian
Eyegneiss
Biotitegneiss
Supercrystal - gneiss
weak zones
Granitegeology changes
Figure 1. Longitudinal section of Romeriksporten

PUBLICATION NO. 12 NORWEGIAN TUNNELING SOCIET Y
53
evenly distributed leakage than expected. Systematicpre-grouting had to be used in various sections, likeunder the populated, urban area of Godlia – Hellerud.Decisions regarding grouting were made on the base ofprobe drilling, using a criterion of 5 l/min leakage fromall investigation drillholes. Lugeon tests (water pressuretesting) were not performed. Grouting consisted of oneor two rounds with typically 30 holes of 23m and 8moverlap. The advance was slowed down considerably, aseach round took some 10 – 18 hours.
Upon entering under the forests of Lutvann, it wasexpected that less grouting effort was needed due to ahigher level of acceptable leakage. It turned out, howe-ver, that it became even more difficult and time consu-ming to comply with the “target” leakage. This waspartly due to higher hydraulic head and partly becauseof more complex and extensive jointing in faults andtension zones. Up to 4 rounds were grouted before con-trol drilling gave acceptable inflow. Finer cement wasused frequently, and as poor results came out, even alarge amount of acrylic resin (Siprogel) was graduallyintroduced. At a few occasions, further advance wasdecided even with excessive inflow in control drillings.Along with the water problems, a contractual disputearose on the question of time schedule. Slow advancefor other reasons on the encountering tunnel face contri-buted to that.
In all, 37% of the total tunnel length ended up being pre-grouted. The effort included 275 km of drillholes, 5 400tons of cement, 1 300 tons of micro cement and 340 tonsof resin grout.
Despite the large pre-grouting effort, the requirementswere far from being met in certain sections. Damagesstarted to develop, and the situation became a big newsissue. The headlines were boosted by health and envi-ronmental issues connected to the use of acrylamide-containing Siprogel (later: Rocha-Gil) both in Swedenand in this project. In the national perspective,Romeriksporten became a “tunnelling scandal” amongstthe public.
4.2 Monitored effects on groundwaterIn a particular section at Hellerud, substantial pore pres-sure lowering developed and houses built on clay gra-dually began to subside. During excavation, controlmeasurements in drillholes after pre-grouting seemedfine. But flow records in the drainage ditch later showedthat some sections of the tunnel had 3 - 4 times the pre-defined, acceptable inflow of 10 l/min/100 m.Consequent detailed investigations of the overburdenrevealed a steeply undulating bedrock surface probablyconnecting with local fissure systems. Therefore, thereal tolerance may have been an even smaller inflowrate. As a remedy, 25 infiltration wells have been instal-
Fig. 2 Artist’s impression of tunnel through Lutvann forest. Governmental groundwater inflow limits shown for 3 dif-ferent sections.

NORWEGIAN TUNNELING SOCIET Y PUBLICATION NO. 12
54
led in order to re-establish the pore pressure. All house-owners were promised full compensation for their lossand inconvenience, and a repair campaign was launc-hed.
The phenomenon that attracted most public awareness,however, happened in the forest area used for recreati-on. A particular pond in a swampy depression in theforest above the tunnel suddenly sank a few meters.Later, the water level in the 2 km2 lake Lutvann beganto sink too, a small creek dried out and subsidence deve-loped in narrow valleys with visual effect on large trees.Unfortunately, the groundwater drainage coincided withtwo consecutive years of low rainfall. A section of 2,2km of the tunnel became subject to special concern. Aninflow of more than 2 500 l/min was recorded afterexcavation was completed in autumn -97. By then areduction of approximately 300 l/min already had beenobtained by supplementary grouting.
An extensive monitoring program was established withsome 30 observation wells and detailed flow measure-ment in the tunnel. A pump-line was established forrefilling/irrigation of the most affected forest area. Atthe same time, a specialist group was employed in orderto develop the best strategy for correction works in thetunnel.
4.3 Post excavation remedies to reduce leakage At the end of the tunnel excavation, it was recognisedthat the impact on the groundwater inevitably wouldbecome quite substantial, even if measures were takento reduce the effect considerably. Public scrutiny of theproject led to the establishment of a formal provision,which implied that the owner had to apply for govern-mental approval for groundwater impact. This was anew arrangement in Norway. Under the strain of publicinterest, a rather long process ended up with detailedinflow limits in certain sections, supported by studies ofbiotypes and hydrogeology. Accepted inflow equalledsome 25 – 30 l/min/100m, i.e. the same level as antici-pated as acceptable in the plans.
Advised by the experts, a major effort was initiated interms of post-excavation grouting. The tunnelling con-tractor was employed on a cost reimbursement basis ina separate contract to carry out the work. As a principle,extra grouting fans c/c 5 m were introduced to create anew tightened zone 4 to 10m outside the tunnel allaround the periphery in all sections with recordedinflow above the criteria.
The work became much more difficult and less rewar-ding than anticipated. Up to 6 crews for drilling andgrouting worked in the tunnel at the same time. The big-gest problems arose with the floor section. Drilling
downwards required special drill-rigs, a concrete slabhad to be poured for logistic reasons, and all sorts ofproblems were encountered, such as hole stability, pac-ker failure and back-flow of grout materials. The workalso revealed that the major part of excessive leakagecame through the floor section, much due to a thin orinsufficient pre-grouting fan and later blasting for thedrain ditch. Apart from that, back-calculation of leakagevs. hydraulic head has shown that the permeabilityreduction in densely jointed rock has been as good asever was obtained in earlier tunnels by use of cementgrout, i.e. in the size order of k = 10-7 m/sec.
A lot of useful experience was gained throughout thepost excavation tightening works. Tests with differentmicro-cements revealed variations in quality and a sub-stantial difference in the effect of rock temperature.
Between November 1997 and January 1999, a continu-os effort on the 2,2 km, with a cost equal to that of exca-vation of the whole tunnel was performed. Still, therequirements were met only for 2 out of the 3 sections.As a consequence, an installation for re-infiltration byinjecting water back from the tunnel was constructed.Experience so far has shown that it is a reliable and non-disturbing remedy, and that it only has to be run in peri-ods with low rainfall, being automatically controlled bythe water level in observation wells at the surface.

PUBLICATION NO. 12 NORWEGIAN TUNNELING SOCIET Y
55
5 THE LIERÅSEN TUNNELWhen the Lieråsen tunnel was constructed, the majorconcerns with respect to in-leaking water were not tointerrupt the excavation and not to make operationalhindrances for the railway. Also here, the planningstage investigations were aimed at rock cover and weak-ness zones.
Lieråsen tunnel encountered sections with high inflowrates, much the same as in the central part ofRomeriksporten, but no leakage control except localdrainage in the tunnel was introduced. Immediategroundwater lowering dried out small ponds and led tosubsidence in swampy terrain above the tunnel.
There is little record of public concern, though cultiva-ted landscape was affected. It has even been mentionedthat somebody found the drainage helpful, as new hou-sing development was established in the area.
6 LESSONS LEARNED6.1 The inevitable uncertainty in rock tunnellingIn rock tunnelling, no matter the level or amount of pre-investigations, there is inevitably an uncertainty left, orrisk, which has to be appropriately dealt with duringtunnelling. For Romeriksporten, much criticism hasbeen raised against the planning process, since suchunexpected damages have occurred. This is a claim thatmust be taken seriously by the relevant parties. Pre-investigations for tunnels with respect to potentialdamage to the groundwater and the vulnerable environ-ment dependant on it, can certainly be improved. It does
not, however, mean that just multiplying current met-hods and routines will get us much further. In this case,an extensive programme of seismic profiles, detailedmapping from core drillings and even permeabilitytests, would neither have led to substantially change inthe tunnel design or in the tunnelling procedures, norprevented the partly poor sealing result and damageduring construction.
Uncritical follow-up of all suggestions of interesting“nice to know” investigations, put forward by experts,parties and bodies who have their own agenda, will infact act as a threat to a rational use of funds and couldlead to a counter-productive planning process.
New aspects have to be included:• Routine risk analysis, both for guiding targeted inve-
stigations and for realistic uncertainty assessment aspart of the decision making process,
• Detailed vulnerability studies of potentially influencedenvironments, and
• Methods to predict the degree of difficulty and effortneeded in permeability reduction, leading to improveddesign of grouting or other means for water sealing.(This will be more complex than mapping in situ per-meability!)
Still, considerable uncertainty will probably remainconcerning prognosis of leakage treatment in rock tun-nels. The uncertainty of this will always be differentfrom that of excavation costs and rock reinforcement.Even pilot tunnels will be of poor value, as they mayintroduce the damage originally to be prevented, andthey will make the pre-grouting more difficult.
On the other hand, the uncertainty concerning damageto the surroundings must be removed. A best possibleassessment of the geo-hydraulic model and a thoroughmapping of vulnerable biotypes should be standard,consequently leading to well founded and differentiatedrequirements vs. acceptable inflow in separate tunnelsections.
6.2 Improving public relationsWhen a tunnel project, such as Romeriksporten, has thepotential for becoming “front page news”, which mayhave a variety of different reasons, there will always bea hunt for scapegoats. That is OK as long as it targets ina fair way, but informants with different agendas willpop up and “co-operate” more willingly with journaliststhan those who know the realities. The times and condi-tions of Lieråsen tunnel, built 30 years earlier, will neverreturn. A well working democratic society is dependingon critical media, and decision makers must be preparedto stand up and face publicity. But, in fear of that, wemust not aim at 100% proof solutions; that would cost

NORWEGIAN TUNNELING SOCIET Y PUBLICATION NO. 12
56
too much and even prevent socio-economic favourabledevelopments. Some keys to improved public relation insuch cases are:• Do a proper job in first hand, so that uncertainties are
a documented part of the project basis and risks arehandled professionally,
• Communicate uncertainties (before) and difficulties(during) the construction, and
• Demonstrate correction capability based on a set ofvalues broadly accepted in the community.
It goes without saying that most civil engineers have alot to catch up with in this field. Some organisations buytheir way out with help of professional public relationemployees, but that may not work well unless they arevery well informed in the special tunnelling business.
The public interest and awareness of tunnels, boosted byRomeriksporten, have given inspiration for a new seri-ousness in planning and follow-up of tunnelling works.Promising new co-operation relations have emergedbetween engineers, hydro-geologists and experts onbotany and the environment.
6.3 Know-how and decision makingIt is the author’s experience and a clear lesson fromRomeriksporten that the crucial element in successfulpre-grouting is the skill and understanding by thoseinvolved at the tunnel front. The more demanding thetasks are becoming and the more sophisticated the toolswill be, even more important is this aspect going to bein the future. For jobs above a certain degree of chal-lenge, qualified and experienced engineering geologistsshould take part in the daily observations and decisionsrelated to pre-grouting. Investigation drillholes ahead ofthe tunnel may be utilised for much more informationand give improved basis for decisisons, compared tocustomary practice.
In a large scale, it has been shown that pre-grouting,properly performed, is as much as 20 times more cost-effective as post excavation grouting with similar resul-ting permeability. A certain influence of high groundwa-ter pressure has also been observed: Even if pre-grou-ting becomes more challenging, the problems with post-excavation grouting may become even bigger. To post-pone the “last” effort of grouting until later, should the-refor not be an option in serious tunnelling.
A stressed contractual situation will influence negative-ly on the perfection of methods at the tunnel face, whichone need in challenging leakage control. It is an interes-ting issue to further develop the contractual conditionsand the incentives, so that a contractor is inspired to takemore interest in the development of efficient methodsand to optimise the effort towards the requirements. In
the Nordic tunnelling tradition, this will imply a change,and it will only be accepted if the contractor still can beprotected from severe financial risks.
6.4 Need for improved methods and materials in dif-ficult conditions
The new focus on the potential danger to the environ-ment from a range of efficient “chemical” sealingagents, have put on the agenda a strong need for impro-ved performance of cement grouting or equal materials.In Romeriksporten, it has been found that by use ofstable micro-cement grouts, a maximum effort couldbring the average “permeability” (k) in jointed zonesdown towards some 5x10⁻⁸ m/sec, corresponding to a“hydraulic diameter” of the remaining conductive jointsabout 0,1 mm in moderately jointed rock. That mayseem to represent “state of the art year 2000”. This isconfirmed from the experiences with leakage problemsin the challenging railway tunnel Hallandsås in Sweden.For the strongest inflow demands and at high hydraulicheads, it is necessary to obtain permeation of joints halfthat wide, i.e. 0,05 mm. This might be a realistic goal forfurther research and development, e.g. by improving thecements and additives, but probably not by just millingordinary cements even finer. Customary micro-cementsseem to have inconsistent or unstable properties, and aquick formation of clusters is probably starting toobstruct efficient permeation only few minutes after lea-ving the colloidal mixer. Further, the reaction develop-ment is very much dependant on temperature and w/cratio. At 7 – 8°C (as in Nordic bedrock) almost nothinghappens with certain cements. Portland clinker typesseem to work best at such low temperatures.
The means to distribute injected materials sufficientlycomplete into a designed collar around the tunnel needto be varied with the local conditions. A much larger and

more sophisticated range of efforts have to be includedin the “tool box”, including such as:• High pressure (100 bar or above) pumps in several
parallel lines, individually governed to suit any stopcriteria,
• Firmly controlled, locally adjusted drillhole patterns.Challenging conditions may require as much as 100holes per fan, both for efficient access to finer jointsand in situations with lack of counter-pressure (effec-tive minor stress),
• Outer, separately grouted collar in a): weak zones toavoid “break-through after excavation, and b): for pre-liminary sealing of coarser veins and thereby to enableuse of high pressure in the main fan,
• Continuos quality control of mixed grout, related tostrict requirements, e.g. considering filtration stabilityand reactions sensitive to pot time and actual rock tem-perature, and
• Methods for proportionally adding of agents that canaccelerate grout stiffening and occasionally plug largerveins.
6.5 Long term effectsThe unsustainable effects, both on nature and on pro-perties, have become among the most important aspectsin tunnelling. Large efforts must be allowed in any bud-get if needed to avoid damaging impact. Those effectshowever, which cannot be avoided, or only at an incom-parable cost vs. the impact value, have to be declaredthrough a profound decision and concession processopen to the public. Such serious handling of the matterhas now become the standard procedure for new tunnel-
ling projects in Norway.
Both nature and mankind seem, however, to have aremarkable tolerance to groundwater lowering. No oneasks anymore about the rather dramatic lowering ofgroundwater and change in the botany system aboveLieråsen tunnel. Long term effects of that kind are stillto be evaluated at Romeriksporten, but in view of thecorrective works, none but minor changes in naturalhabitat are expected.
If damaging groundwater/pore pressure lowering cannot been avoided, it is shown at Romeriksporten that re-infiltration of sweet water can work on a permanentbasis, provided it is subject to consistent managementand maintenance.
PUBLICATION NO. 12 NORWEGIAN TUNNELING SOCIET Y
57
- a research organisation with more than 1800 dedicated employees, active in literally
all aspects of technology and human-technological interaction, working in close co-operation with the Norwegian University of Science and Technology, NTNU,
- is providing research activities for tunnelling in such fields as fire hazard and risk,
HES, human behaviour, ventilation, rock support, in situ rock stress, numericalmodelling, drillability for TBM, material properties and rock grouting.
Visit us on:
or contact us: SINTEF Civil and Environmental Engineering
Address: NO-7465 Trondheim NORWAYTelephone: +47 73 59 02 00Fax: +47 73 59 02 01e-mail: [email protected]
w ww.sintef.no ,

59
1 INTRODUCTIONDuring the construction of transport tunnels in urbanareas, there have been some recent incidents where lea-kage has caused the drawdown of the phreatic surfaceand, consequently, caused damage to structures due tosettlements and negative effects for the environment.As a consequence, the design of future urban tunnelswith respect to minimizing the water inflow is of utter-most importance. The overall aim of the design will beto choose a strategy for inflow control that will minimi-ze the cost of the society to handle disturbances anddamages due to an unwanted reduction of the phreaticsurface.
During the focusing of what is “acceptable disturbance”of the environment, and, hence, an acceptable inflow ofwater, the tunnel designers will have to address the rele-vant parameters that will be important for the inflowcontrol of urban tunneling works. By investigating theground conditions, both at the elevation of the tunneland within the boundaries of the influencing area above
the tunnel, certain parameters will be decisive in classi-fying the acceptable level of leaking water volumes.
By the use of analytical functions that assume homoge-nous conditions, a rough idea of the drawdown of thephreatic surface can be estimated. But for more complexgeological conditions such estimates may be far fromthe actual results. Norconsult has been using both 2-Dand 3-D model simulations (VisualMODFLOW) in thisproject.
2 Calculations of groundwater drawdown and inflow toA tunnelThe area of influence due to leakages into the tunnel willdepend on many factors:The area of the tunnelThe depth of the tunnelThe original permeability of the rockThe permeability of the grouted zone around the tunnelThe original gradient of flowThe recharge due to precipitation
8 INFLOW CRITERIA FOR A RAILWAY TUNNEL IN THE GREATER OSLO AREA
Per Magnus JohansenNorconsult, AS
ABSTRACT: The paper presents the leakage criteria and tunnel grouting strategy for the projecteddoubled-tracked rail-tunnel Jong-Asker in the Oslo-area. Investigations have focused on the conse-quences of groundwater drawdown, overburden settlement and nature vulnerability. Procedures for eva-luating leakage rates, groundwater drawdown and subsequent groundwater level depression cones arepresented as well as estimates from analytical calculations. Results from a parameter study employinga numerical groundwater model where several tunnel conditions are investigated. This study showsseveral relationships between the permeability of the grouted zone and drawdown that are presented andcompared with empirical data. The analytical calculations show that the groundwater drawdown incre-ases when the difference between the grouted zone permeability and the natural bedrock permeabilitydecreases. It also shows that the groundwater level depression cone is strongly influenced by the geolo-gical structures. Water balance estimates are extremely important in defining the maximum allowedtunnel leakage rate.
NORWEGIAN TUNNELING SOCIET Y PUBLICATION NO. 12
60
By using analytical functions one can get an idea of thedrawdown around a tunnel. The following functionshave been suggested:
Where:q = leakage (m3/m/s)K = hydraulic conductivity or permeability around thetunnel (m/s)h = distance from tunnel to equipotential (m)r = tunnel radius (m)
The above functions do not take into account the thick-ness of the grouted zone around the tunnel. The functi-ons give the inflow depending on an average hydraulicconductivity of the rock. The following function isintroducing the thickness of the grouted zone and itscorresponding hydraulic conductivity.
Wheret = thickness of grouted zone (m) (otherwise as above)
These functions do not take into account any stratifica-tion of the geology or any cross-flow gradient.However, these analytical functions will work well forconditions that can be regarded as homogenous andwhere the cross-flow gradient is small. For some of thechosen cross-sections of the Jong - Asker project thesefunctions gave roughly the same results as the 2-Dmodels.
Lindblom (1999) has pointed out that the important fac-tor or parameter is not the leakage rate, but it is the con-sequences of the leakage that should be the main para-meter for the grouting strategy.
3 TUNNEL SECTIONING OF THEPROJECT
The Jong - Asker project is located just south-east of thecity of Oslo - in a densely populated area. The use oftunnels will shorten the railway alignment, minimize therequisition of land and reduce the nuisance during con-struction and operation of the railway.
The geology of the area is mainly cambrian-siluriansediments; shales, schists, siltstones with calcerous ele-ments and sandstones. These rocks are overlain by per-mian basalts and porphyry and have intrusions of dole-rites (diabase).
The support of the tunnel will be mainly bolts and shot-crete. It is estimated that on average 8 bolts and 4,5 m3of shotcrete will be used per m tunnel. However, thetunnel is sectioned into 5 categories of support measu-res. The poorest rock quality along the line will be amajor weakness zone with Q = 0.03.
The tunnel will encounter a number of different conditi-ons, and thus it is important to section the tunnel andclassify these sections according to the anticipated pro-blems. These are:1. The potential of settlements of structures founded on soft
materials2. The use of groundwater and springs along the future line3. The use of the ground for recreational purposes4. The presence of areas with special biotopes
The classification of the potential areas that could expe-rience settlements was based on the ground investigati-ons carried out, supplemented with soundings down tobedrock. The areas were classified as follows:1A. Areas that could experience settlement of more than
80 mm1B. Areas with a potential settlement of 40 - 80 mm1C. Areas with settlement potential of less than 40 mm
More than 100 households are currently using ground-water from local wells as their primary or secondarysource of fresh water supply. The households using suchgroundwater as their primary source will all be suppliedwith municipal water.
In cooperation with local associations dealing with thepreservation of recreational areas, a list of the areasalong the future railway line were established. Theseareas were classified based on their sensitivity to apotential lowering of the ground water level and theirpopularity as recreational areas. By combining the sen-sitivity for potential damages to the environment anddue to settlements, three classes of allowable leakagerates were established.Class 1. Moderately tunnel leakages, 8 - 16 l/min/100 m
tunnelClass 2. Low leakage rate, 4 - 8 l/min/100 m tunnelClass 3. Extremely low leakage rate; < 4 l/min/100 m
The above numbers were determined usingVisualMODFLOW, and will be referred to in the follo-wing.
(1)
−
+
=
1ln
22
r
h
r
h
hKq
π(Lei, 1999)
(2) [ ]rh
hKq
/2log3,22π= (Freeze & Cherry, 1979)
(3)
−
=12ln
2
rh
hKq
π(Karlsrud/NFF)
(4) ( )
+
=
rtr
hKqln
2π (NFF)

PUBLICATION NO. 12 NORWEGIAN TUNNELING SOCIET Y
61
Figure 1. Classification of leakages and potential drawdown areas for the Asker-Jong project

NORWEGIAN TUNNELING SOCIET Y PUBLICATION NO. 12
62
4 NUMERICAL MODELLINGIf the ground conditions are well known, the geologicalconditions are complex or has a distinct anisotrophy andthe topography will result in a distinct cross-flow, anumerical model should be applied. Numerical mode-ling have been performed on some projects. The railwaytunnel to Oslo International airport, Romeriksporten(Kitterød et.al., 1998) and the railway tunnels,Frodeåsen, Tønsberg and Jong-Asker.
The simplification of the models will have to be done.Zones in the rock having a high permeability will haveto be transformed into porous zones or layers(”Equivalent porous medium” model, Anderson &Woessner (1992), Committee on FractureCharacterization and Fluid Flow (1996). The method ofsimulating permeable joints/zones using porous mediummodels have also been published in international maga-zines, Gburek et al., (1999), Allen & Michel, (1999) andPohll et al., (1999).
For the Jong - Asker project the geology is quite com-plex with volcanic rocks from the Permian age overlay-ing sedimentary rocks (shale, phyllite and calcareousshales). The area has intrusions of near vertical dykes(dolerite), which may in some cases act as a barrier forground water flow and in other cases acts as water bea-ring structures with a higher permeability than that ofthe surrounding rocks.
Initially, the VisualMODFLOW were run using an iso-tropic, homogenous model with three sets of permeabi-lity coefficients of the rock and the grouted zone andthree sets of leakage rates into the tunnel (4, 10 and 24l/min/100 m tunnel).
The model is run using transient flow, which is balan-cing out to a steady state after approximately 3 years.From Table 1 it is seen that using the leakage rate as theonly parameter may give rather large influence radiusand may lower the water table by more than 15 m.
The results of the parameter study show that the draw-down area will increase with the depth of the tunnel, andif the ratio between the permeability of the original rockcompared to the grouted zone is decreased. In otherwords having a “groutable”, rather permeable rock, willincrease the possibility to minimize the drawdown ofthe water table.
5 water balanceTo be able to model the water balance information aboutevotranspiration, run-off and infiltration into the groundmust be included in the input parameters. The permea-bility of the overburden material will of course havesome importance of the infiltration volumes. At the Jong- Asker project some of the overburden materials aremarine clays giving very little infiltration to the ground.On the other hand some sands and gravels are overlay-ing the rock surface and will be acting as an infiltrationlayer were the more permeable soils are infiltrated fromthe higher ground levels. At these conditions the preci-pitation will greatly influence the water balance.
The water balance model can also be used to predict theground water level at observation wells or springs. Thishas been done at another project and where the simula-tions over time could be compared to the observationsof the well.
Table 1. Results of the run with medium permeable rockPermeability of adjacent rock: 5 LUGEON (= 5 10-7 m/s)Depth ≅ 17 m Sim. leak.. = 4,2
U.I. = 3 mD.I. = 2 mWTL = 1,3 mRGP = 0,14 L
Sim. leak. = 10,2U.I. = 652 mD.I. = 336 mWTL = 7,6 mRGP. = 0,45 L
Sim. leak. = 24,2U.I. = 778 mD.I. = 540 mWTL = 17,2 mRGP. = 2,2 L
Depth ≅ 27 m Sim. leak. = 4,2U.I. = 0 mD.I. = 0 mWTL = 1 mRGP = 0,1 L
Sim. leak. = 9,9U.I. = 642 mD.I. = 330 mWTL = 7,1 mRGP = 0,28 L
Sim. leak. = 24,0O.I. = 767 mN.I. = 530 mWTL= 15,7 mRGP. = 0,97 L
Depth ≅ 57 m Sim. leak. = 4,3U.I. = 0 mD.I. = 0 mWTL = 1 mRGP = 0,055 L
Sim. leak. = 10,0O.I. = 641 mD.I. = 334 mWTL = 6,9 mRGP = 0,14 L
Sim. leak. = 24,4O.I. = 775 mD.I. = 539 mWTL = 15,5 mRGP. = 0,4 L
Legend: Sim.leak. (simulated leakage rate, l/min/100 m), U.I. (upstream influence radius), D.I (downstream influence radius), WTL (water table lowering above tunnel ),RGP (required permeability of grouted zone, 1 Lugeon = 1 10-7 m/s)

PUBLICATION NO. 12 NORWEGIAN TUNNELING SOCIET Y
63
6 GROUTING STRATEGY ANDGROUNDWATER MONITORING
For the railway tunnel Jong - Asker the grouting strate-gy will consist of pregrouting the tunnel in sequences of3 or 4 blasting rounds, depending on the classification.The length of each grouting sequence will be 21 - 27 m,and supplementary holes will be drilled depending onthe leakage water into the drillholes. However, the pri-mary parameter for changing the grouting effort will bethe response of the ground water level. To be able torespond quickly to any change in of the ground waterlevel about 60 wells recording the piezometric levels inthe rock and in the overburden are established. The con-tract is emphazising the need for change of the groutingeffort if it is found necessary. The ground water levelsare continuously recorded and will be displayed on theinternet, using a telephone modem, round the clock forthe following up of the grouting effort. Still, water lea-kage rates down to 4 l/min/100 m is a very low figureindeed, and requires grouting efforts using ultrafinemicrocements and high grouting pressures.
Grouting strategies for tunnels in suburban areas shouldbe able to cope with alternating ground conditions andthe aim should be to minimize the environmental effect.The planning of the grouting effort should be done insuch a way that the continuous recording of the groundwater levels and the piezometric readings would be themost important parameter for intensifying the pregrou-ting effort. Measurements of the leakage water in thetunnel are a secondary parameter.
When the overall goal is to minimize the effect of anylowering of the groundwater a pregouting scheme has tobe adopted. The grouting program has to include the useof very fine microcements, cement additives andmodern equipment and using high grouting pressures.
It is recommended that modeling groundwater flow andwater balance calculations are included in the investiga-tion phases. In this way a better understanding of thedifferent parameters importance for the groundwatercontrol that have to be included in the project is achie-ved.
REFERENCESAllen, D.M. & Michel, F.A. (1999): Characterizing afaulted aquifer by field testing and numerical simulati-on, Ground Water, v. 37 (5), p. 718-728.
Anderson, M.P. & Woessner, W.W. (1992): Appliedgroundwater modeling, Simulation of flow and advecti-ve transport. Academic Press, Inc., San Diego, p. 381.
Committee on Fracture Characterization and Fluid Flow(1996): Rock Fractures and Fluid Flow: ContemporaryUnderstanding and Application, National AcademyPress, Washington D.C.,ps. 551.
Freeze, R.A. & Cherry, J.A. (1979): Groundwater,Englewood, New Jersey, Prentice-Hall Inc.
Gburek, W.J., Folmer, G.J. & Urban, J.B. (1999): Fielddata and ground water modeling in a layered fracturedaquifer, Ground Water, v. 37 (2), p. 175-184.
Kitterød, N-O., Colleuille, H., Pedersen, T.S.,Langsholt, E. & Dimakis, P. (1998): Vanntransport ioppsprukket fjell. Numeriske simuleringer av vannlek-kasjer i Romeriksporten. Norges vassdrags- og energidi-rektorat, Document 11, pp. 43 (in Norwegian)
Lei, S. (1999): An analytical solution for steady flowinto a tunnel, Ground Water, v. 37 (1), pp.23-26.
Lindblom, Ulf. (1999): Krav på injektering vid tunnel-byggande. Bergmekanikdagen, Stockholm, pp. 59 - 65(in Swedish).
NFF (Norsk forening for fjellsprengningsteknikk):Fjellinjeksjon; praktisk veiledning i valg av tettestrategiog injeksjonsopplegg, Handbook no. 1, Oslo (inNorwegian).
Pohll, G., Hassan, A.E., Chapman, J.B., Papelis, C. &Andricevic, R. (1999): Modeling ground water flow andradioactive transport in a fractured aquifer, GroundWater, v. 37 (5), p. 770-784.
Grouting Metro Ring Oslo.

65
ABSTRACT: For a major project to provide future water supply for the city of Oslo, a new tunnel isunder planning from the Holsfjorden to the water treatment plant at Oset, Oslo. The tunnel will be 25km long and it will pass a number of environmentally sensitive areas along its route. To improve the pre-dictability and make better prognosis for the consequences of the tunnel on the external environment,a thorough planning process has been performed. This included geological pre-investigations and alsoa comprehensive study of the hydrogeological conditions. Based on the geological data and hydrogeo-logical study detailed criteria for the rock mass grouting and tunnel lining could be established.
1 INTRODUCTIONDuring long periods of dry climatic conditions today’swater supply capacity in Oslo may be scarce. Therefore,feasibility studies for supplementary water supply toOslo have been undertaken. These studies conclude thatsupply of water from Holsfjorden is the best solution.Holsfjorden is located about 25 km west of Oslo, seeFigure 1 (Holsfjorden to the west, Oslo to the east).
There are lots of lakes around Oslo, however, due totheir importance for recreational purpose, their use arerestricted. In Holsfjorden, a branch of Tyrifjorden thefourth largest lake in Norway, there will hardly be anyeffect of the water outtake in question, 4.5 m3/sec atmaximum. The water quality in Holsfjorden is also ofpremium quality, especially 50 - 100m below the watersurface.
9 PLANNING OF A 25 KM LONG WATER SUPPLY TUNNEL INAN ENVIRONMENTALLY SENSITIVE AREA
Vidar KveldsvikNorwegian Geotechnical InstituteThomas HolmVBB VIAK
Lars ErikstadNorwegian Institute for Nature ResearchLars EnanderVBB Samfunnsteknikk
Figure 1. Overview map - geology
NORWEGIAN TUNNELING SOCIET Y PUBLICATION NO. 12
66
Due to hilly landscape between Oslo and Holsfjorden, itis clear that the only alternative for transportation ofwater from Holsfjorden to Oslo is by use of a tunnel.The tunnel will be designed with a cross-section ofabout 22 m2 if excavated by drill and blast, about 13 m2if excavated by tunnel boring machines. A major con-cern about this water tunnel, which could be routed invarious ways mainly dependent on where to start inHolsfjorden and where to end in Oslo, was that it had togo through areas where the surroundings were presumedsensitive to groundwater leakage to the tunnel. Twomajor groundwater concerns were obvious due to theextensive experience from tunnelling in the Oslo region:• Pore pressure reduction at the interface rock-soil cau-
sing consolidation settlements in marine clays, againcausing damage to buildings founded on soil, seeKarlsrud (2001).
• Damage to the natural areas in terms of reduced waterlevel/flow rates in lakes/rivers, drainage of bogs, drai-nage of springs and damage on vegetation.
This article aims at describing the various steps in theprocess of planning the tunnel, focusing on the environ-mental aspects.
2 OVERVIEW OF PLANNING PROCESS
The planning of the water supply tunnel described inthis article took about one year and included three mainphases:• System studies, including concept for water intake,
how to get the water through the tunnel, water treat-ment concept, etc.
• Location studies; including where to place the waterintake, location of the water tunnel and the access tun-nels, location of the water treatment facilities and howto get the “ready-for-use” water to the customerstaking advantage of the existing infrastructure supple-mented with possible new routes for transportation ofthe water.
• Preliminary design for the chosen alternative.
One main topic during the system studies was if thewater was to be pumped from Holsfjorden at 63m abovesea level to the water treatment facility in Oslo at eitherabout 80m or 150m above sea level. The conclusion wasto transport the water by means of water pressure diffe-rence and that all pumping shall take place in Oslo fromabout 55m above sea level to the water treatment facili-ty.
The location studies included four possible intake alter-natives at Holsfjorden, three possible locations of thewater treatment facilities, and three main routes for thetunnel between Holsfjorden and Oslo; a southern route,
a northern route and a middle route, and various tunnelroutes for transportation of the water to the customer.The most important aspects for the tunnel route betwe-en Holsfjorden and Oslo were geological and hydrogeological conditions and the environmental concerns.Through the study the choice of alternative became pret-ty obvious since most subjects analysed pointed infavour of a almost straight west-east connection betwe-en Holsfjorden and Oslo.
2 GEOLOGICAL PRE-INVESTI-GATIONS
The basis for the engineering geological pre-investigati-ons has been existing studies of the Permian geology inthe Oslo field. These studies include detailed mappingof rock types and structures such as faults, fracturezones and igneous intrusions. As a part of planning of anew railway in partly the same area as the Holsfjorden-Oslo water tunnel, NGI carried out rock mass classifica-tion of numerous locations . During the project periodfor the water tunnel some additional field mapping wascarried out. More extensive, though, were the site inve-stigations in form of drillings and geophysical surveys.These were for the water tunnel: • Refraction seismic survey: 7.0 km• Inclined core drillings with water pressure testing: 9
bore holes of altogether 1040m• Very low frequency (VLF) survey: 6km• Inclined percussion drillings with water inflow tests:
11 bore holes of altogether 2200m• Rotary soundings: 25 bore holes• Shafts and drillings for polluted soil samples
3 GEOLOGY
4.1 Rock types and weakness zonesThe bedrock consists mainly of volcanic rock typesfrom early Permian, about 13.2 km, and plutonic rocktypes from late Permian, about 10.6 km, see Figure 2.About 1.5 km of older sedimentary rock is also found inform of hornfels due to its vicinity to the younger pluto-nic rock. The distribution of rock types along the 25,4km long tunnel is shown in Table 1. Table 1 also givesthe number of presumed weakness zones in the varioustunnel sections, that is faults and fracture zones, perhapsaccompanied by igneous rock intrusions.
4.2 TectonicsIn early Permian the crust in the Oslo field was exposedto large tensile stresses. Deep cracks and faults develo-ped and opened up for magma from the deep. These lavaflows accumulated to a total thickness of 1000-2000m.In late Permian large magmas rose to shallow depths inthe crust, and solidified as large plutonic bodies of gra-nites, syenites and monzonites. This latest event defor-

PUBLICATION NO. 12 NORWEGIAN TUNNELING SOCIET Y
67
med the sedimentary rocks of Cambro-Silurian age andlifted and tilted the overlying lava flows. Caldera subsi-dence also took place, with up to 740m subsidence. Thestructural results of these major geological events aretoday seen as numerous faults and fracture zones. Themost frequent strike direction of the major faults is N-Sto NNW-SSE and vertical to sub-vertical dip. Somefaults have been cemented by calcite and appear todayas calcite breccias. Others are found as up to some tensof metres wide zones with clay, crushed rock and densejointed rock.
The rock mass, outside of the weakness zones, usuallyhave two joint sets plus sporadic joints to three jointsets, making up about 75% of the observations .Typically, a N-S joint set with vertical to sub-verticaldip, another sub-vertical joint set and perhaps one sub-horizontal joint set, are found. Joint spacing may varyfrom a few decimetres to two to three metres.
4.3 Rock mass qualityBased on the pre-investigations, the distribution of rockmass qualities has been estimated, see Figure 3. The Q-method has been used for rock mass classification,Grimstad et al. 1993).
Figure 3 shows that the rock mass quality in general isfavourable for tunnelling. When the Q-value is largerthan ten, which is predominant, rock support are gene-rally considered not necessary. In the poorest rock massreinforced ribs of shotcrete or cast concrete lining isnecessary. A tunnel from Holsfjorden to Oslo will,regardless of route, come across major faults due to theirN-S orientation, see Section 4.2. The only way to avoidmajor faults is to stop the tunnel, which in fact has beendone for the most easterly area by the lakeMaridalsvann. Refraction seismic lines in the lake andsouth of the lake, indicated extremely poor rock condi-tions over long sections, therefore it was decided to usepipelines at the seabed instead of a tunnel.
4.4 Rock coverThe most shallow tunnel depths are around 100m with70m as minimum. Maximum rock cover is around350m. About 6500m (26 %) of the tunnel has more than250m of rock cover.
Figure 2. Part of geological section
Chainage Length Rock type Presumedweaknesszones (Nos.)
0-8940 8940 Rhombusporphyry
17
8940-9140 200 Syenite porphyry 29140-11900 2760 Basalt (B3) 911900-14170 2270 Plutonic rock 714170-14530 360 Basalt (B3) 214530-15640 1110 Plutonic rock 515640-16810 1170 Basalt (B3) 216810-21680 4870 Plutonic rock 1621680-23220 1540 Hornfels 1023220-25400 2180 Plutonic rock 5
Table 1 Distribution of rock types along the tunnel
0
10
20
30
40
50
60
70
<0,005 0,005-0,01
0,01-0,04 0,04-0,1 0,1-0,4 0,4-1 1-4 4-10 >10
Q-value
%
Rhombus porphyryBasaltSyenite porphyryPlutonic rockHornfels
Figure 3. Distribution of Q-values in various rock types

NORWEGIAN TUNNELING SOCIET Y PUBLICATION NO. 12
68
5 IDENTIFICATION OF NATURALAREAS WITH varying SENSITIVITYTO GROUND WATER DRAINAGE
Since pore pressure reduction and settlement in marineclays is a rather limited problem for the water tunnelroute chosen for preliminary design, the following willfocuse on the possible damage to the natural areas interms of reduced water level/flow rates in lakes/rivers,drainage of bogs, drainage of springs and damage onvegetation.
5.1 Natural areas and principle for affect ongroundwater
The possible vulnerability of the following type of natu-ral areas were emphasised:• Lakes and ponds• Bogs of all types• Swamps• Influent springs and streams
The groundwater level in an area depends on the waterbalance, which can be described by:• Inflow• Outflow• Storage changes
If a tunnel causes groundwater drainage this will affectthe water balance of the area and consequently thegroundwater level. This implies that an area with a smallinflow will be more sensitive to a given tunnel leakagethan an area with a larger inflow. This also implies thatecological consequences of a given tunnel leakage pro-bably will be larger when the inflow is small. The vul-nerability of an area is therefore related to the area’sinflow and, therefore, the size of the catchment area.
5.4 Methodology The basis for the analysis was digital maps of land coverby which groundwater dependent type of natural areascould be identified and isolated. The vulnerability of thevarious types of natural areas was then classified by thesize of the actual catchment area.
The size of the catchment area was calculated from adigital elevation model (DEM) with a resolution of 10m¥ 10m and contour interval of 5m. This was done by cal-culation of the area that drains to the single points. In thefirst place the part of the catchment area to the singlelocations of lakes, ponds, bogs, etc. was calculated.After that the total catchment area to the single locationswas calculated by adding all parts of the catchment areaupstream of the actual locations. Figure 4 shows thedigital elevation model as a so-called ”hillshade model”.Figure 5 shows the catchment areas and specific run-offs.
The vulnerability based on the size of the catchmentareas was classified in the following way, with Class 1as the most vulnerable:Class 1: Bogs and lakes/ponds with catchment area less
than 0.5km2
Class 2: Bogs and lakes/ponds with catchment area bet-ween 0.5km2 and 1.0km2
Class 3: Bogs and lakes/ponds with catchment area bet-ween 1.0km2 and 2.0km2
Class 4: Bogs and lakes/ponds with catchment area bet-ween 2.0km2 and 5.0km2
Class 5: Lakes that belong to river systems that runthrough the model area: large catchment areaand little vulnerability.
Figure 4. The digital elevation model shown as hillshade

PUBLICATION NO. 12 NORWEGIAN TUNNELING SOCIET Y
69
Since it is not given that the selected areas from the digi-tal maps of land covers include all the areas with vari-ous types of natural areas dependent on groundwater, anadditional concavity model was used. The purpose ofthis model was to identify areas with possible near sur-face groundwater level, and these areas were describedas “potential vulnerable” areas. The various steps in themethod are described below:1. Each point (10m x 10m) in the elevation model has an
elevation, z. For each point the mean elevation, zm,inside a circle with diameter 250m was calculated.
2. The difference between z and zm, was calculated.3. Points with z - zm < -1m were recorded in the data set.4. Points in slopes steeper than 15° were removed from
the data set since these areas probably only are depen-dent on seepage water.
5. The remaining points in the data set were checked towhat degree they resulted in continuous areas. Areasthat only included one or two points were removedfrom the data set.
The resulting classification of vulnerability for a part ofthe total planning area is shown in Figure 6.
The last step of the vulnerability analysis was to checksome of the “wet” locations near the tunnel route. Byfield mapping the (immaterial) value of the nature couldbe estimated at specific locations, and it was possible to
0 1 2 3 4 5 kilometer
N
ÖV
S
Delavrinningsområden
Våta områden enligt NINAVatten
Specifik avrinning
Delavrinningsområde, nummer på beräknat område
��������������������58
TRASÉ 2
TRASÉ 3
TRASÉ 4
TRASÉ 5
TRASÉ 6
TRASÉ 1
14 l/
s km
2
16 l/
s km
2
20
l/s
km2
18
l/s
km2
16
l/s
km2
14
l/s
km2
����������������70
�����61
�������4
������������109��������
366
��������
106
������������
96��������
97
����58
��������������58
������������
58
��������������������73
��������62������
������81
���������349
��������
92
����52����
58
����60
��������71
����������348
��������309
��������
309������
204
��������������213������
������329
���������309
��������������339
��������206
����������������335
������������192
������������
333�������
328
������������326����
347
��������������
121
��������������
343
��������105
������93
����������318
����������100
����104
����������
91
����90
��������������
22
����88
����������
87
������58
�������83
����82
�����79
������103
����348
����309
��������339
�������202
�������201
������338
������327
�������326
������������������347��������
��������297
������������������
121������������������343
W E
LakesWet areas
Catchment areas
Specific run-off
Figure 5. Catchment areas and specific run-offs
Figure 6. Classification of vulnerability based on a catch-ment area model and a concavity model, section of map

NORWEGIAN TUNNELING SOCIET Y PUBLICATION NO. 12
70
classify the locations on a scale from “limited/small” to“high local value”. Further, the sensitivity with respectto reduced groundwater table could be classified. Thefield mapping also revealed that the “potential vulne-rable” areas found by the analysis described above,actually include smaller bogs, swamps, etc. However,the actual vulnerable areas tended to be smaller thanfound by the analysis.
6 RESTRICTIONS ON GROUNDWA-TER DRAINAGE TO THE TUNNEL
6.1 GeneralRestrictions on groundwater drainage to the tunnel wereevaluated with respect to the following:1. Vulnerability of natural areas to groundwater leakage2. Risk for settlements on buildings, see Karlsrud (2001). 3. Total groundwater leakage for the tunnel system (water
tunnel and access tunnels) must not exceed 7500 litreper minute, corresponding to 27 litre/minute per 100mtunnel. This amount of water corresponds to 20%groundwater in the water tunnel when the flow is atminimum.
4. Leakage of polluted groundwater is not allowed.5. The quality of natural groundwater: The blend of
Holsfjorden water and groundwater shall not containconcentrations of elements that do not satisfy therequirements to drinking water, and to raw water befo-re processed in a water treatment facility.
6.2 Polluted groundwaterDuring the design period locations were identified wherepolluted groundwater was considered being a major con-cern. For the chosen tunnel route the following main pos-sible sources for pollution were identified):• CCA (Copper, Chrome and Arsenic) from a closed
down impregnation facility • BTEX (Benzene, Toluene, Ethyl benzene and Xylene)
from leaky buried tanks • BV (Bacteria and Virus) from sewer pipes
For the possible CCA pollution a rather extensive inve-stigation program was conducted. Due to the moderateconcentrations of CCA found in soil and groundwater incombination with the hydro geological conditions at thelocation, it was concluded that the risk for getting CCAin detectable concentrations in the water tunnel could beneglected. Therefore CCA pollution did not influence onthe groundwater leakage restriction in that area.
Possible transportation of BTEX and BV to the tunnelby groundwater was analysed by numerical modelling.“Worst case” scenarios were used in the modellingwork, and the conclusion was that either BTEX or BVwould cause any problems for the raw water quality.Therefore it did not influence on the groundwater leaka-
ge restriction in areas where sewer pipes exist and leakyburied tanks may exist.
6.3 Quality of natural groundwaterGroundwater samples were collected from 19 boreholesalong the tunnel route. From eight of the bore holessamples were collected from two different depths.Analysis of the samples showed that the concentrationof manganese (Mn) could be a problem. However, theMn-concentrations varied from very low to very high. Inaddition, data were available from a water tunnel inrhombus porphyry and basalt south of the western partof the Holsfjord tunnel. Mn-concentrations in samplestaken from groundwater actually leaking into this exis-ting tunnel, were generally very low.
An adequate explanation of the very high Mn-concen-trations that were detected in some samples was notfound. The most likely explanation was that Mn is con-nected to water bearing faults and dense jointed structu-res by Mn-coatings on joints that dissolve in the ground-water under low content of oxygen. Leakage from thesewater bearing structures have to be reduced by groutingand perhaps water tight linings due to environmentalreasons. Based on this some scenarios were estimated,and it was found very likely that the Mn-concentrationin the raw water would be lower than 50�g/l, which isthe maximum allowed concentration in drinking water.
6.4 Vulnerability of nature to groundwater leakageThe effect on the nature based on the rate of groundwa-ter leakage to the tunnel in percentage of the run-off ina catchment area, were classified as follows:• Leakage < 10% of the run-off: no or small effect• Leakage 10 – 20% of the run-off: medium effect • Leakage > 20% of the run-off: large effect
The project has a strict requirement that the effect on thenatural environment shall be no or small. Thus, the cal-culations of tolerated groundwater leakage in the vari-ous catchment areas were restricted to 10% of the run-off. Where catchment areas had not been calculatedbecause these areas did not include land cover by whichgroundwater dependent type of natural areas were iden-tified and isolated (see Section 5.2), the leakage rate hasbeen set to around 30l/min per 100m tunnel. Most ofthese areas contain “potential vulnerable” areas. Due tothe overall restriction of a total leakage rate of7500l/min (27l/min per 100m) for the whole tunnel sys-tem, it was necessary to reduce leakage rates to less than10% of the run-off in some areas. Altogether, the tolera-ted leakage rates for all the 29 tunnel sections used inthe analysis varied from around 5l/min per 100m toaround 40l/min per 100m. Overall, the tolerated leakagerates may be considered on “the safe side” with respectto possible damage to the natural areas.

PUBLICATION NO. 12 NORWEGIAN TUNNELING SOCIET Y
7 HYDROGEOLOGICAL CONDITIONS
7.1 Hydraulic conductivity of the rock massBased on experience from usually shallow bore holesfor water supply, it is known that the volcanic rocks ofthe Oslo field, i.e. rhombus porphyry and basalt, yieldmore water than other rock types in Norway, Morland(1997). The main reason for this is the porous characterof the top of the various sub-horizontal lava flows. Coredrillings to great depths indicate that large water lossesin sub-horizontal layers are found down to about 130m.Deeper down, large water losses are found more spora-dically and generally in connection with steep structuressuch as faults and diabase intrusions along tensionjoints.
In the Oslo area, the smallest horizontal stress is orien-tated E-W, and the main structures orientated about N-Stend to have the largest hydraulic conductivity whichcoincide with major faults and joints.
Several sources for estimation of hydraulic conductivitywere available. These included:• The bedrock well database of the Geological Survey of
Norway• Core drillings with water pressure tests• Percussion drillings with water inflow tests• Leakage rates in existing tunnel in volcanic rocks of
the Oslo area
Information from more than 30,000 wells are available inthe Geological Survey of Norway database. 116 wellsfrom Permian rocks near the tunnel route were included inthe analysis of hydraulic conductivity. For each well,information of depth and yield after drilling was provided.The transmissivity, T, for each well was estimated by:
where Q = yield (m3/s), d = depth of well (m)
Hydraulic conductivity of the bedrock, K (m/s), hasbeen calculated from the transmissivity by T/d.
Figure 7 indicates a good correlation between hydraulicconductivity and depth for wells with depth down to
about 90m. For wells with larger depth, hydraulic con-ductivity seems poorly correlated with depth.
Figure 8 shows that the data fit well to a log-normal dis-tribution, and that the most representative value ofhydraulic conductivity, the median value, is about 5 x10⁻⁷m/s for wells with depth down to 90m.
Figure 9 shows that the data fit fairly well to a log-nor-mal distribution. The median value is about 5 x 10⁻⁸m/sfor wells with depths between 90m and 180m.Water pressure testing measuring water losses by anoverpressure of 1MPa were conducted systematically in
Log10(T) = 1.17 + 1.13 × Log10(Q/d), for d < 50m (1)
Log10(T) = 0.16 + 0.93 × Log10(Q/d), for d > 50m (2)
180
160
140
120
100
80
60
40
20
0
Dju
p (
m)
1E-10 1E-9 1E-8 1E-7 1E-6 1E-5 1E-4 1E-3
Log 10K (m /s)
Dep
th (
m)
Figure 7. Well data. Correlation between hydraulic con-ductivity and well depth
Log10 K
%
-10 -9 -8 -7 -6 -5 -4 -30.1
1
5
20
50
80
95
99
99.9
Figure 8. Well data. Log-normal distribution of hydrau-lic conductivity from wells with depth down to 90m
Log10 K
%
-10 -9 -8 -7 -6 -5 -4 -30.1
1
5
20
50
80
95
99
99.9
Figure 9. Well data. Log-normal distribution of hydrau-lic conductivity from wells with depth between 90m and180m
71

NORWEGIAN TUNNELING SOCIET Y PUBLICATION NO. 12
72
all nine core drilled holes, from depth 5m to 140m.Figure 10 shows that the data fit well to a log-normaldistribution, and that the median value is about 5 x 10⁻⁷m/s. Note that most of the highest K-values arefound from depths smaller than 60m.
11 percussion drillings were bored where water-bearing
structures were expected. The largest vertical depthreached by these drillings was 235m. For each 50minterval of drilling the following procedure were follo-wed for water inflow testing:The hole was air flushed during 30 minutes through thedrill string by use of a compressor.Under the next 30 minutes was the rise of the water levelin the hole measured by means of a manometer.
The maximum water inflow during one minute (out of30 minutes) was taken as the value for estimation oftransmissitivity. The transmissitivity was further estima-ted by Equation 1 and Equation 2.
As the 50m sections of the borehole above the actualtest interval were not hydraulically isolated (open borehole), the net inflow to the actual interval had to be cal-culated. This was done by subtracting the previousobtained inflow values from the sections above, fromthe total inflow to the borehole. In Figure 11 – 13, whichshow log-normal distribution of hydraulic conductivity,these intervals have been named as hypothetical wells.
Figure 11 shows that the data does not completely fit toa log-normal distribution. At least two statistical popu-lations are indicated and K-values higher than about 2 x10⁻⁷m/s seem to make up a population of its own. Theserather high values are presumed caused by structureswith medium to large flow of water encountered in thevarious test sections.
Figure 12 (0 – 100m) and Figure 13 (100 – 250m) showsimilar results as presented in Figure 11, that is the pre-
sence of structures with medium to large flow of water.If these rather high K-values are neglected, the remai-ning K-values might represent the rock mass between
the highly conductive structures. These “rock mass”values are mainly in the range of 5 x 10⁻⁹m/s to 2 x10⁻⁷m/s for depth 0 – 100m and 1 x 10⁻⁸m/s to 1 x 10⁻⁷m/sfor depth 100 – 250m.Log-normal distributions of transmissitivity, T (m2/s),for T-values higher than 1 x 10⁻⁶m2/s (corresponding to a
Log10 K
%
-8 -7.5 -7 -6.5 -6 -5.5 -50.1
1
5
20
50
80
95
99
99.9
Figure 10. Water injection tests in core drilled boreholes. Log-normal distribution of hydraulic conductivi-ty from depth between 5m and 140m
Log10 K
%
-9 -8 -7 -6 -50.1
1
5
20
50
80
95
99
99.9
Figure 11. Water inflow tests. Log-normal distributionof hydraulic conductivity from all 40 hypothetical wells,depth 0 – 250m
Log10 K
%
-9 -8 -7 -6 -50.1
1
5
20
50
80
95
99
99.9
Figure 12. Water inflow tests. Log-normal distributionof hydraulic conductivity from 21 hypothetical wells,depth 0 – 100m
Log10 K
%
-10 -9 -8 -7 -6 -50.1
1
5
20
50
80
95
99
99.9
Figure 13. Water inflow tests. Log-normal distributionof hydraulic conductivity from 19 hypothetical wells,depth 100 – 250m

PUBLICATION NO. 12 NORWEGIAN TUNNELING SOCIET Y
73
K-value of 2 x 10⁻⁸m/s for a 50m long section). i.e.“low-conductivity” sections are left out of the databasis, gave the following result: • At depth 0 – 100m two ranges of transmissitivity were
found: 1 x 10⁻⁶m2/s to 3 x 10⁻⁵m2/s, and 6 x 10⁻⁵m2/s to1 x 10-4m2/s. The latter interval indicates that structureswith large water flow had been encountered.
• At depth 100 – 250m the data were more evenly dis-tributed. The median value is about 1 x 10⁻⁵m2/s, andthe minimum and maximum values are 2 x 10⁻⁶m2/sand 7 x 10⁻⁵m2/s respectively.
The existing 5.45km long Kattås tunnel passes throughvolcanic rocks about 100m below the ground level.Based on back-calculations from measured leakagerates, the conductivity is 7.6 x 10⁻⁷m/s for a 250m longsection, 2.9 x 10⁻⁸m/s for the rest of the tunnel (5200m).
7.2 Conceptual hydrogeological modelBased on the work described in Section 7.1, a conceptu-al hydrogeological model for the tunnel route was esta-blished, see Figure 14. For the rock mass between the“water-bearing” structures the conductivity intervals of5 x 10-9m/s to 1 x 10⁻⁷m/s at depth 0 – 100m and 1 x10⁻⁸m/s to 5 x 10⁻⁸m/s at depth 100 – 250m are assumedto represent the intervals of 80% probability. Themedian K-value of depth 100 – 250m is 3 x 10⁻⁸m/s.Themedium permeable structure of T = 1 x 10⁻⁵m2/s repre-sents the “median water-bearing structure”.
As can be seen from Figure 14, the model does not
include depths larger than 250m. This is due to lack ofdata from these depths. 26% of the tunnel route has rockcover larger than 250m. However, the conceptual hydro-geological model was used also for depths larger than250m for estimation of needs for tunnel sealing.
8 ESTIMATION OF EXTENT OFROCK MASS GROUTING ANDWATERTIGHT TUNNEL LINING
Three prognoses for tunnel sealing were carried outbased on the conceptual hydrogeological model (seeSection 7.2):
• Optimistic prognosis: “little” tunnel sealing. This wasbased on K20 = 1 x 10⁻⁸m/s and T = 1 x 10⁻⁵m2/s.
• Most likely prognosis: “most probable” extent of tun-nel sealing. This was based on K50 = 3 x 10⁻⁸m/s andT = 1 x 10⁻⁵m2/s.
• Pessimistic prognosis: “large” extent of tunnel sealing.This was based on K80 = 5 x 10⁻⁸m/s and T = 1 x10⁻⁵m2/s.
The extent of tunnel sealing was predicted for varioustunnel sections as follows:1. Calculation of maximum allowed leakage (see
Section 6.4).2. Calculation of leakage based on the conceptual
hydrogeological model and K-values as describedabove. All assumed water bearing structures weregiven a T-value of 1 x 10⁻⁵m2/s.
3. If predicted leakage was larger than allowed, grouting(injection) of the rock mass was “modelled”.
4. Firstly, the water bearing structures were grouted. Itwas assumed that grouting will reduce the leakage to10% of the original quantity. It was also assumed thateach structure in average will cause 30m of groutingalong the tunnel.
5. If the leakage was still too large after grouting, thelength of the grouted zone between the structures waspredicted. It was assumed that the K-value of thegrouted zone around the tunnel periphery was redu-ced to 3 x 10⁻⁹m/s, and the thickness of the groutedzone is 7m. A K-value of 3 x 10⁻⁹m/s is based on back-calculations from a large number of tunnels in theOslo region were grouting has been conducted, andleakage rates have been measured. The chosen K-value represents the best results achieved by groutingin these tunnels.
6. If the whole tunnel section length has been groutedand the maximum allowed leakage still is exceeded,the length of a watertight lining was predicted.Firstly, the structures were lined, and leakage elimi-nated from these. If this was not sufficient, the tunnelbetween the structures was lined until the leakage wasreduced to the allowed rate.
Rock mass, depth<100m
5x10 -9 <K< 1x10 -7
m/s
Rock mass, depth
100-250m
1x10⁻⁸ <K<1x10
-8
m/s
T=1x10⁻⁴ m2/s
High permablestructure
T=5x10⁻⁵ m2/s
Med. perm. struc.
T=1x10⁻⁵ m2/s
Figure 14. Conceptual hydrogeological model for therock mass along the tunnel route

NORWEGIAN TUNNELING SOCIET Y PUBLICATION NO. 12
74
For calculation of leakage rates the following equationswere used:
where,K = hydraulic conductivity of the rock massKi = hydraulic conductivity of the injected zone around
the tunnel peripheryT = hydraulic transmissitivity of the water bearing
structuresd = depth below the groundwater levell = tunnel lengthre = the equivalent tunnel radius (= 2.7m)t = thickness of the injected zone (= 7m)
The predictions described above resulted in the progno-sis given in Table 2.
REFERENCESGrimstad, E. and Barton, N., 1993. Updating of the Q-system for NMT. Proceedings from international sym-posium on sprayed concrete – modern use of wet mixsprayed concrete for underground support. NorwegianConcrete Association.
Karlsrud, K. 2001. Control of water leakage when tun-nelling under urban areas in the Oslo region. NFFPublication no. 12. Water control in Norwegian tunnel-ling.
Morland, G., 1997. Petrology, lithology, bedrock struc-tures, glaciation, and sea level. Important factors forgroundwater yield and composition of Norwegianbedrock bore holes? (PhD. thesis).
Q = 2 × π × K × d × l / ln(2 × d / re) (3)
Q = 2 × π × T × d / ln(2 × d / re) (4)
Q = 2 × π × Ki × d × l / ln((re + t) / re) (3)
Category Injection(m)
Injection(%)
Watertightlining(m)
Watertightlining(%)
Optimisticprognosis
5141 18 825 3
Most probableprognosis
17123 61 2246 8
Pessimisticprognosis
22810 82 2246 8
Table 2 Prognoses for tunnel sealing

75
1 INTRODUCTION AND AN IMAGE
The technology involved in underground constructionhas developed considerably during the last decades.Drilling equipment, tunnel boring machines, shotcreteequipment and materials and scaffolding systems haveall been improved. The grouting technology has, howe-ver, not developed at the same rate or to the same level.
Environmental problems due to lowering of the groundwater table, inflows of water stopping or slowing downthe tunnel advance rates or problems with durability ofthe lining systems and installations due to wet conditi-ons in tunnels have been common reading in newspapers and magazines almost all over the world.
Lack of free space in the urban areas and major infra-structure needs in developing countries both requiremore tunnel projects. It is important to have as an over-all philosophy that tunnels should be constructed wit-hout adversely influencing their surroundings. This phi-losophy should also be applied outside urban areasbecause environmental issues are important in areas ofrecreation and rural industry.
The future challenge is to construct environmentally fri-endly tunnels in a cost effective manner yet maintainingkey safety aspects for the worker and the users. Thisimplies the development of improved construction met-hods and techniques to reduce the permeability of therock and provide necessary leakage control.
Images are commonly used to improve both communi-cation and understanding. A three legged chair may beused to illustrate a stable situation. Remove one leg, andthe chair becomes unstable. Add one leg, and it does notmake any difference to the stability. An image closer tothe civil engineering profession is the surveyors tripod.Imagine the surveyors tripod with more or fewer thanthe three legs. It would not work! The surveyors tripodis like a three legged chair made for rough terrain. Forthat reason each leg is made adjustable so it can fitalmost anywhere.
Which leg is predominant is dictated by the actual ter-rain. Sometimes a stable position is achieved with onelong leg and two short legs, other times the surveyorneed three long legs or even three short legs. A minordeficiency in one leg my be corrected by adjusting the
10 GROUTING – THE THIRD LEG OF UNDERGROUND CONSTRUCTION
Steinar RoaldDr S.RoaldNick BartonDr Nick Barton and AssosiatesTarald NomelandElkem Materials
ABSTRACT: During recent years, some projects in Norway have experienced problems with groundwater drainage caused by tunnelling in sensitive areas, and have also suffered hazardous water inflowsduring construction. These events have accelerated the development of grouting technology, which nowoffers improved possibilities for environmentally safe and economic viable underground construction.The aim of this article is to focus on the importance of rock mass grouting as an integral part of the tun-nelling process, where the dual grouting strategies are leakage control and rock improvement.

NORWEGIAN TUNNELING SOCIET Y PUBLICATION NO. 12
two other legs. A major failure in one or more legs willmake it impossible to do the surveying. Finally there isthe fine tuning of the surveying table which only “theexpert” will achieve.
2 THE OBJECTIVES OF ROCK MASSGROUTING
For an underground project a crucial question can be rai-sed: Why perform rock mass grouting? The answer tothis simple but important question also rests on threelegs. The main purposes of grouting are:
To establish the tunnel in an economic and safe way.To prevent environmental impact caused by the tunnel.To improve the internal environment in the tunnelduring operation.
Which one of these “legs” are most important may varyfrom one project to another. In other words, there arethree different grouting criteria that should be evaluatedduring the planning and design phase of an undergroundconstruction project. Thus the governing criteria mayvary according to the circumstances, and hence, thegrouting strategy needed to conduct an appropriate lea-kage control may also vary. Recent developments ingrouting technology may influence all of them in oneway or another.
Prior to establishing a grouting strategy, the above ques-tions must be answered and the objectives of the rockmass grouting must be clarified.
3 CONSTRUCTING THE UNDER-GROUND OPENING
Constructing a tunnel normally involves three main acti-vities. In terms of the image of the tripod, the three legsare:• Excavation, • Rock support • Grouting.
This analogy equally applies to mechanical excavationtechniques such as TBM or roadheader excavation ofhard to soft rock tunnels as well as to the conventionaldrill and blast technique.
Excavation and rock support have both reached a moredeveloped technological level than grouting. The inter-connection between excavation and rock support havebeen studied and developed over many years and is verywell documented, Barton and Grimstad, (1994). Thesetwo activities are therefore recognized as the strong legs
Figure 1. Special need accommodated by the anisotro-pic approach.
Figure 2. A balanced approach may also be good.
Figure 3. The tripod, also an image of tunnelling.
76

PUBLICATION NO. 12 NORWEGIAN TUNNELING SOCIET Y
77
of underground construction whilst the grouting must beconsidered as the weak leg.
The traditional purpose of grouting in connection withtunnel excavation has been to avoid major water inflowsand to reduce the amount of water that has to be pum-ped out of the tunnel system. In many cases, groutinghas only been considered as a contingency measure,used to solve a problem only after a problem of waterinflow has occurred. Some people have also been tal-king about the stabilizing and strengthening of the rockas a result of grouting. These effects are not well descri-bed in a scientific manner.
So far, there has been limitations in the material proper-ties and the grouting technology that have constrainedthe predictability of the rock mass improvement effectfrom grouting. The recent development in groutingmaterials and grouting technology in Norway are incre-asing the possibility to achieve tangible rock improve-ments (impermeability and strengthening) by grouting.The key performances offered by the recent develop-ment in grout materials are:• Grout penetration to achieve a permeability close to
0.1 Lugeon• Stable grout in the liquid phase (<2% water loss)• Little or no shrinkage during hardening. (<1-2% volu-
me loss)• Possibilities to “guide” the low viscosity, controlled-
setting grout into a specified low permeability zonesurrounding the tunnel.
• Environmentally safe and long durability of the groutmaterials..
Some of these properties (volume stability/strength) canbe implied/mirrored in classification systems describingthe rock quality, such as the RMR and the Q-system. Bysuch analyses, the effect of grouting can be described interms of rock quality:
• Rock quality before grouting.• Rock quality after grouting.
If one knows the rock quality before grouting and is ableto predict the rock quality after grouting, it is possible toestimate the time and cost benefits that can be achievedby grouting. In addition, it is possible to describe howgrouting may influence the feasibility of the excavationadvance in bad rock mass conditions. Taking this effectinto account the use of grouting is no longer only a con-tingency measure, but is becoming an active part of theentire tunnelling cycle, thereby changing the concept oftunnelling.
4 HOW GROUTING IS INFLUEN-CING THE ROCK QUALITY
Grouting is traditionally the way to control water inflowto tunnels, both for protection of the environment andfor easing construction. An important by-product of thegrouting is of course the strengthening effect, Barton, etal.(2001).
New grouting products and techniques allow penetrati-on in the rock masses with permeabilities as low as 0.1Lugeon. An interpretation of the physical process invol-ved, has been developed using the Q-system parameters,and using important evidence from 3D permeability tes-ting before and after grouting.
The evidence points to potential increases in the Q-sys-tem parameters RQD, Jr and Jw, and potential reductionin Jn, Ja and SRF. Permeability tensors may swing awayfrom the permeable and least stressed joint set followinggrouting. This is consistent with small individual incre-ases in RQD/ Jn, Jr/Ja and Jw/SRF. Each component maybe small, but the combined result is potentially remar-kable.
This implies that for the Q-system the following effectscan be noted:
• Where there are dry conditions, pre-grouting mayimprove the rock quality with one quality class.
• Where there are wet conditions, pre-grouting mayimprove the rock quality with two or even three quali-ty classes.
The overall result of efficient pre-grouting will be redu-ced rock mass permeability, reduced tunnel displace-ment and rock support requirement when tunnelling,increased deformation modulus and increased seismicvelocity. Similar effects are also known from dam siteinvestigations. Each improvement can be linked in asimple way to Q-value increases.

NORWEGIAN TUNNELING SOCIET Y PUBLICATION NO. 12
78
5 COST AND SCHEDULING IMPACTOF PRE-GROUTING
The cost of excavation is highly dependent on rockquality. The rock quality affects time consumption fordrilling and charging. In addition the rock support workin poor rock conditions is time consuming. Poor rockconditions may not only increase the cycle time, theymay also reduce the length of each round. The time con-sumption per meter driven is therefore increased dispro-portionately.
A calculation of the excavation cost as a function of rockquality was made by a contractor at a 100 m2 transpor-tation tunnel in crystalline rock near Oslo. The relativecost is shown in Figure 4.
Cost analysis indicates that improving the rock qualityis both cost and time saving. As discussed above, grou-ting may improve the rock quality by one to two rockclasses. Expressed in a simplified manner, in the poorrock categories; money spent on grouting is paid backby cheaper excavation and rock support. A prescribedinflow criterion may also be achieved at the same time.
The Public Road Administration in Norway have thesame experience. At the tunnel project Baneheia inKristiansand a customised grouting program was carri-ed out to maintain the ground water table in an environ-mentally sensitive area. The cost saving in rock support,water shields and frost protection compensated for thecost spent on the grouting work and the overall savedtime. At the project Storhaug Road Tunnel in Stavanger,the Public Road Administration experienced similareffects. A projected, full concrete lining was replaced byshotcrete and rock bolts after pre-grouting the poorquality rock zone, Davik and Andersson (2001)
6 GROUTING STRATEGIESIdeally, the grout should be placed to form a low per-meability zone circumferencing the tunnel. Grout that istransported far away from the tunnel is both a waste oftime and a waste of money. Different geological situati-
ons require different grouting strategies. Basically, twomain strategies can be outlined:• Pregrouting in a normal jointed rock mass.• Pregrouting in a heavily jointed rock mass or in weat-
hered/ crushed zones. For both situations, it is important that the grout-fan hasa sufficient no of holes, so that the grouting scheme canbe completed in one round. That also means that thegrouting operation should start from the bottom andmove upwards, see Figure 5.It is important to complete the grouting in one roundboth from a technical and from an economical point ofview. If grouting fails, the next round must be locatedoutside the grouted area because many of the water bea-ring joints may be inaccessible due of the first groutinground. A marginal increase of costs to complete thegrouting in one round will save the cost for the secondround.
Grouting in good rock conditions: In good rock conditi-ons it may be fairly easy to predict how the grout willspread out from each grout hole. Sometimes, it is alsopossible to watch the communication from one hole toanother. The normal sequences of grouting in good rockmasses are shown in Figure 5 If some open structuresare hit in part of the area, these areas can be treated aspoor rock conditions.
Grouting in poor rock conditions: Poor rock conditionsrequire special measures. Before establishing the lowpermeability zone by stabilized grout, the spreading ofthe grout has to be controlled. This can be done by usinga set controlled cement with variable viscosity to esta-blish an outer “blocker” zone. After establishing the“blocker” zone, further grouting of the low permeabili-ty zone inside the blocker zone can take place as indica-ted in Figure 6.
Figure 4. Relative excavation cost in different qualityclasses. Potential, quality dependent increases in rockmass quality and cost reduction, as a result of efficientpre-grouting.
Cross-Section of Grouted Tunnel - Better quality rock
Planned excavated profile
Permanent strengthened, low permeability zone using stable ultrafine/microfine cementitious grout.
Blast-damaged zone
Excavated tunnel profile
Figure 5. Pregrouting – good rock

PUBLICATION NO. 12 NORWEGIAN TUNNELING SOCIET Y
79
Grouting in good rock conditions can be done with veryhigh grouting pressure. Small deformation is likely tooccur, and is desired to help consolidate the rock mass.This means that a grouting pressure well above theminimum principle stress in the rock mass is required.The very high grouting pressure is required in order topenetrate the finest joints. This can be achieved with thefine particle sizes now available.
The poor rock condition generally requires significantlylower injection pressures. Normally, the grout shouldpenetrate the weathered rock masses and consolidate themass. Some times hydraulic fracturing is desirable.However the circumstances should be very carefullyevaluated, especially in cases with low rock cover.
7 MATERIAL REQUIREMENTSFrom a grouting technology viewpoint, the grout mate-rial should flow like water and harden like ice, - andremain like ice in the long term!! Durability and envi-ronmentally safe mean “What you put into the rock,should remain in the rock and be rock like”.
Multigrout is a high performance, high durability grou-ting system, developed by Elkem ASA, a Norwegiancompany operating on a global basis. It is the spin off of25 years of research work in the field of high perfor-mance, high durability concrete.
The Multigrout system rest on three legs:• High performance materials: Elkem provides the
materials. All materials have long term durability.• Grouting technology: The Multigrout team will adopt
best pratice grouting and transfer the technology to theusers of the Multigrout system.
• High performance equipment: The development of thegrouting equipment, including the provision of impro-ved drilling and grouting equipment on TBM´s, willaccelerate to reach a high performance level.
The Multigrout constituents form a tripod too:• Pure Portland Cements: Dispersed OPC, Microcement
or Ultrafine Cement, dependent on the requirements.• GroutAid®: High technology microsilica slurry.
Improves penetration (see fig..) stabilizes the grout(see fig..) and improves the durability (see fig….).
• Thermax™: A mineral based, controlled settingcement, the best tool known to control the flow of thecementitious grout within the rock- a requirement foran engineering cost-/time- and quality controlled grou-ting process.
Outer reduced-permeability zonegrouted using
Permanent strengthened,low permeability zoneusing stableultrafine/microfine
Blast-damaged
Excavated tunnel
“Blocker” grout
zone
Figure 6. Grouting in poor rock conditions using ElkemMultigrout.
Figure 7. The Multigrout- system has three strong com-ponents.
Figure 8. “Multigrout” materials are three-fold too.

The length of the “material legs” is dependent on seve-ral factors. The materials can be used together in diffe-rent portions to suit the specific conditions. Sealing finejoints requires fine cements, open joints requires lessfine cement and special attention to shrinkage problems,backflow into the tunnel ( from small leakages or highvolume water-fighting) or large consumption of groutwithout any pressure build up requires more use of theuniversal, material based grouting tool “Thermax”.
8 ACHIEVEMENTS MADE BY ULTIGROUT
The leakage into a tunnel is mainly determined by thehydraulic conductivity of the rock mass, the head ofwater and to some extent disturbances caused by exca-vation and by the tunnel cross section. In practice, it isnormal to measure the amount of water that leaks into agiven section, e.g 100 meter in a fixed time (i.el/min/100m). This figure is more understandable for thepeople involved in the project, and it can be verifiedmore directly by measurement. The leakage into the tun-nel can also be stipulated as a contract requirement.
As a practical rule of thumb, given ground water pres-sures of about 10-20 bar and medium rock conditions,the leakage into a tunnel is expected to be within the fol-lowing ranges when grouting with:• Rapid cement (100-140 m): 20-50 litres pr 100 meter
and minute.• Micro cement: (<30�): 10-20 litres pr 100 meter and
minute.• Ultrafine cement: (<15�): 2-5 litres pr 100 meter and
minute.
(refer the Romeriksporten, Storhaug, Baneheia tunnels):
REFERENCES
Dr. Nick Barton, Dr. Bjørn Buen, Prof. Steinar Roald.Tunnels and Tunneling (1201 + 102). Grouting morethan Water Control. Strengthening The Case ofGrouting.
NORWEGIAN TUNNELING SOCIET Y PUBLICATION NO. 12
80

85
1 INTRODUCTION
Meråker is located 80 km east of Trondheim. Fivesmall hydropower stations were built in the years 1890to 1915 to provide electric power to the MeraakerSmelter. In 1987 it was decided to upgrade and replacefour of the generating facilities, increasing the annualoutput from 200 GWh to 590 GWh.
Fig. 1 Overview of the Meråker Project
2 TIME SCHEDULE
The construction started in September 1990, and thepower plants, tunnels and dams were commissioned1994. By the end of 1992, all 44 km of tunnels hadbeen completed, approximately nine months ahead ofschedule.
3 CONTRACTS
The client, Nord-Trøndelag Energy, invited bidding,and the civil works were divided into two contracts:The Tevla Power Station contract including 17 km oftunnels and two rock fill dams, was signed with theVSF-Group, a joint venture consisting of A/SVeidekke and Selmer A/S.
The Meråker Power Station contract with 27 km oftunnels, was awarded to Merkraft, a joint venture con-sisting of Eeg-Henriksen Anlegg A/S and A/S Veidekke.
4 GEOLOGY OF THE TBM DRIVE
The rock types expected in the project area consistedmainly of Cambrian and Ordovician metamorphic se-diments with metagabbro intrusions. The metagabbrowas considered extremely hard and massive with un-confined compressive strength up to 300 MPa.
Six different rock types were anticipated along the tunnel.
Fig. 2 Geological Profile.
To obtain the best possible basis for the tender,Merkraft supplemented available geological informa-tion with its own comprehensive survey before and du-ring the tender period. The survey was carried out incooperation with the Norwegian University of Scienceand Technology (NTNU) and the Norwegian StatePower Board (Statkraft).
11 THE MERÅKER PROJECT - 10 KM OF TUNNEL IN 12 MONTHS
Steinar JohannessenScandinavian Rock Group AS
Odd G. AskilsrudAtlas Copco Robbins Inc., Seattle, USA
Amund BrulandThe Norwegian University of Science and Technology NTNU
ABSTRACT: New powerplants, tunnels and dams have been built at Meråker in Central Norway. A total of 44km of tunnels with cross sections varying from 7 m2 to 32 m2 have been excavated in hard rock formations. Tenkilometres were excavated by a High Performance Tunnel Boring Machine (HP TBM). This paper gives specialattention to the TBM drive and equipment selection, including planning, site organisation and performance.

86
The tests from the 10 km Torsbjørka - Dalåa indica-ted that the rock parameters varied from a relativelysoft phyllite with a Drilling Rate Index (DRI) of 60and Fissure Class II+ or more, to a very hard meta-gabbro with DRI=32 and Fissure Class 0+; accordingto the NTNU Classification System of Report 1-88.
The formations of graywacke and sandstone appea-red as mixed face conditions. Hence, the high rockstrength and the wide variation in boreability characte-ristics became important issues in the selection criteriafor a TBM.
5 SELECTING THE TBM
During the 1980's several major projects in Norwaywere completed in hard massive gneiss and granite bythe TBM method. These were all excavated using stateof the art machines, designed with capacities up to 222kN per cutter. Though most projects were successful,technically and financially, actual field tests and stu-dies showed that the projects could have been doneeven faster.
Experience showed that the machines including hy-draulics, electrics, main bearing, cutters and cutterhousings could not sustain the high thrust levels needed in the massive, abrasive and hard rock types. It became obvious that a substantial ROP gain would berealised if machines and cutters were designed to takehigher thrust.
In the softer rock formations several machines alsoshowed torque limitations at a rate of penetration ofabout 5 m/h.
In 1989, Statkraft decided to put into operation anew generation machines for the Svartisen hydro-power project. During the period 1989-1992, threeRobbins HP machines were purchased for boring morethan 30 km of tunnels, with diameters of 4.3, 5.0 and3.5 m respectively.
With the above mentioned experience in mind, thecontractor specified that the TBM should:• Be able to efficiently bore through hard massive
metagabbro, greenstone, graywacke, mixed face conditions as well as the softer phyllite.
• Be able to increase the diameter to 4.2 m without changing the basic HP concept.These requirements lead to a Robbins HP TBM,
designed to bore with an average cutter load of up to 312 kN per cutter using 483 mm cutters.Close co-operation between Statkraft and The Robbins Company lead to further development of the HP concept and ideas, eventually to the final design and manufacture of Model 1215-265.Brief Machine specifications were as follows:
• Maximum recommended cutterhead load: 7,900 kN• Cutterhead power: 1,340 kW (335 kW x 4)• Cutterhead RPM: 13.4• Number of cutters: 25 single discs• Machine weight: approximately 200 tons
6 MACHINE DEVELOPMENT CHANGES
The experience at Svartisen with the 3.5 m diameterHP TBM 1215-257, indicated unusually high cutterwear and cutter bearing seizures in the transition areaof the cutterhead when the average cutter load excee-ded 265 kN per cutter. This clearly limited the practi-cal and effective use of the machine at full thrust, andmeant extra costs and downtime for cutter changing.The cutter profile and cutter spacing for the 1215-265were therefore revised and changed according to Fig.3, to provide a better load distribution and a closerspacing in the critical zone.
Fig. 3 Spacing 1215-257 and 1215-265
The modification turned out very satisfactory, andmade it possible for the first time to bore with a sustai-ned load of 312 kN per cutter.
The Svartisen Project and the Hong Kong CableTunnel Project experiences were transferred, and leadto additional modifications.
7 BORING PERFORMANCE
Fig. 4 shows that the make 111-265 bored 10 metersper hour and more during certain periods. The torquedid not cause any problems and the muck handlingsystem performed well.
ROP turned out to exceed the contractors schedulingprognoses. From the figure 5 one will also see that theROP out-performed the NTNU 1-88 prognoses.
During the first four-week period of boring morethan 1,000 meters tunnel had been achieved. The en-tire tunnel was finished six months ahead of schedule.

87
Fig. 4 Actual ROP over the Tunnel Length
7.1 Advance Rates and UtilisationNorwegian regulations allowed Merkraft to operate100 shift hours per week only. In spite of this limita-tion, the actual advance rates at Meråker averaged 253meters per week, or almost 100 meters more per workweek than ever before achieved in Norway. During thefirst four-week period of boring more than 1,000 me-ters tunnel had been achieved. The entire tunnel wasfinished six months ahead of schedule.
Fig. 5 Weekly Advance Rate
Fig. 6 Machine Utilisation
The TBM utilisation rate, defined herein as actual boring hours in percent of available shift hours, areshown in Fig. 6. The reduced utilisation towards the endwas due to in-sufficient muck transport capacity overthe last four km (two muck trains and one locomotive).
Increased average ROP and thus reduced constructi-on time had been well possible if one additional loco-motive and one California switch had been made avail-able for the phyllite section towards the end of the tunnel.
Fig. 7 Average Machine Utilisation
The results from Meråker can be summarised as follows:
• Best ROP over one single shift: 9.54 m/h• Best shift (10 hours): 69.1 m• Best day (2 x 10 hours shift): 100.3 m• Best week (100 shift hours): 426.8 m• Best month (430 shift hours): 1,358.0 m• Average ROP: 6.4 m/h• Average weekly advance rate: 253.0 m
8 CUTTER WEAR
The greenstone turned out to be the most difficult tobore. It caused the greatest amount of cutter wear anddowntime for changing cutters. The variations of themixed face conditions were also major factors for thehigh cutter consumption.
Fig. 8 Cutter Life

88
The great variation in cutter life was surprising. TheTBM never had a ROP lower than 4 meters per hour.The cutter life varied from about 300 m3 to 30 m3 percutter ring.
The overall downtime due to cutter changes waskept on a reasonably low level. This result was partlydue to the improved load distribution made possible bythe modified cutter profile and spacing. The modifica-tions also meant changing more cutters in series, hencesaving time.
Fig. 9 Cutter Changes
9 MUCK TRANSPORT
The transport arrangement from the heading to the silounloading station consisted of two muck trains, eachwith nine 10 m3 bottom dump mine cars. The twotrains were moved in shuttle service, maintaining anaverage speed of 25 km/h turn-return to the headingsloping 0.2-0.8% uphill. Each train load had a capacityof three boring strokes, equal to 4.5 m tunnel produc-tion. A rail bound back-up with towed Californiaswitch ensured a high production system.
The mine cars dumped the muck into a 300 m3 silo,placed within the mountain. A subcontractor with com-mercial type trucks transported the muck up the 1:8decline access tunnel and to the disposal area approxi-mately 500 m outside the portal.
Due to high penetration rates of more than 10 m/h,the tunnel muck haulage itself lacked adequate trans-port capacity on the last 4 km of the 10 km long drive.However, the cost to install a bypass switch, an extralocomotive and extra personnel was estimated to behigher than the actual cost of waiting. The weekly ad-vance rates were anyway far ahead of schedule, and nospecial bonus was offered by the client for early completion.
10 ASSEMBLY/DISASSEMBLY
The 265 TBM was shipped from Seattle to Norway incomponents not exceeding 87 tons. The shipment arri-ved at the site in August 1991 and the TBM was as-sembled underground. Three and a half weeks later theTBM started boring. Detail planning, experience andstaff training, including extensive training for key per-sonnel at the manufacturer's plant, made such short as-sembly period possible.
Once the tunnel was completed, the cutterhead wasdisassembled and removed through an existing 100 mlong intake tunnel. The rest of the machine and back-up travelled out on the tunnel rails.
11 SITE ORGANISATION AND STAFF
Norway has long been recognised for its cost efficienttunnelling. Some of the main reasons may be the lownumber of staff, crew flexibility and capability, and theuse of modern and well maintained equipment. AtMeråker, 16 men covering three shifts were employed,each working the regular 33.6 hours per work week.
This crew covered all operations including boring,rock support installation, mucking, work shop and cut-ter repairs. Small crews should only be consideredwhen experienced, flexible, dedicated hands are avai-lable. Fair pay and bonuses do the rest.
The crew at the face worked on a rotation systemwork face to improve teamwork. One operator control-led the TBM and the filling of trains from the cabinmounted on the back-up. One mechanic, one electrici-an and one locomotive driver handled all the other duties.
The crew was paid based on actual production. Thismeant that the machine had to be properly maintainedand repaired to prevent downtime.
The TBM site management included five persons.These also supervised the 5 km long 20 m2 Drill &Blast tunnel and the tunnel intake construction.
12 ROCK SUPPORT
The contractor's site investigation during the tenderingperiod indicated only a minor need for rock supportwhen using the TBM method. The amount actually ne-eded ended up even less. Over the 10 km length, only140 bolts and 44 m3 of shotcrete were used for support.The client's original estimate included 900 bolts, 300m3 of shotcrete and 200 m2 of liner plates for the TBMtunnel. On the Drill & Blast tunnels, the bid docu-ments turned out to be nearly accurate with an average

89
of 250 bolts and 33 m3 shotcrete per km. The average production rates for the Drill & Blast
tunnels were approximately 80 meters per week pertunnel heading.
Tunnelling in Norway by tradition utilises the bear-ing capacity of the rock itself, using support only asand when needed. The smooth excavation provided bythe TBM, the small cross section and the rock qualitywere major reasons for the small amount of rock sup-port required at Meråker.
13 SUMMARY
The Meråker Project has demonstrated a new standardin tunnel production. The high advance rates and redu-ced need for ventilation give possibilities for longertunnel drives, reduction of overall construction timeand cost savings.
The production planning, the choice of machine andback-up, and the experienced and dedicated staff werethe main ingredients to successful hard rock tunnel boring performance.
LITERATURE
Johannessen, S. and Askilsrud, O. (1993): MeraakerHydro - Tunnelling the "Norwegian Way".Proceedings RETC 1993.
The University of Trondheim, NTH-Anleggsdrift(1988): Project Report 1-88 HARD ROCK TUNNELBORING.
The University of Trondheim, NTH-Anleggsdrift(1994): Project Report 1-94 HARD ROCK TUNNELBORING.

90

89
1 INTRODUCTION1.1 Project descriptionThe Oslofjord tunnel is a subsea road tunnel with 7.2kmtotal length, which constitutes a key element in theOslofjord Connection, a project which by 26.5km ofroads, bridges and tunnels connects the eastern and wes-tern side of the Oslo fjord about 50km south of Oslo.Different aspects of the project have been described inseveral papers, see e.g. Haug & Øvstedal (1999) andØvstedal (2001) for general description and Blindheim &Backer (1999) about the freezing of a section in soil under120m water pressure. The tunnel was completed on sche-dule in 2000 by the contractor Scandinavian Rock Groupfor the owner Norwegian Public Roads Administration.
The present paper addresses primarily the land section of2.8km length on the eastern side of the fjord. This sectionstarts at a portal in the farming and forest area surroundingthe small township of Drøbak. The tunnel alignment pas-ses below a recreational forest area close to idyllic smalllakes (old water reservoirs), and further under the centre ofthe township. Here, some of the old wooden houses werefounded partly on timber fleets in a poorly refilled ice-cut-ting dam above a fractured zone in the bedrock.
12 DETERMINATION AND CO-OPERATION IS CRUCIAL FORROCK MASS GROUTING IN ORDER TO SATISFY STRICTENVIRONMENTAL REQUIREMENTS
Olav Torgeir BlindheimO. T. Blindheim ASSvein SkeideNorwegian Public Roads Administration
ABSTRACT: This paper describes the successful efforts to make the eastern land section of theOslofjord subsea tunnel sufficiently watertight. Strict requirements had to be satisfied to protect thelakes and connected wetlands in the recreational forest area close to the community of Drøbak, and toprevent settlement damage to houses in the township itself. The efforts included definition of allowableseepage and requirements for probing and pre-grouting, and follow-up measures such as sectional mea-surements of seepage. For this process, which is basically managed by the tunnel owner, it was foundnecessary to enter into a constructive discussion with the contractor on the detailed methods to optimi-se performance without sacrificing quality. During this co-operation, framework procedures were agre-ed and authority to adapt to the varying rock conditions was delegated to the face staff from both parti-es. The resulting tightness met the requirements, no damage to the environment occurred, and cost andtime impacts were minimal.
Fig. 1. Cut-out map of the eastern land section of theOslofjord tunnel (yellow line), passing under a forestarea with small lakes and the township of Drøbak.

NORWEGIAN TUNNELING SOCIET Y PUBLICATION NO. 12
90
The land section of the tunnel is an environmental mea-sure in itself, as it allows the through-traffic to bypassthe township. It would become an unacceptable paradoxif the tunnel should be allowed to drain the ground waterand thereby cause damage to the environment. Otheraspects of the environmental protection and landsca-ping, which had a high priority on the project, arebeyond the scope of this paper.
1.2 Site investigationsDuring the period of planning and design, the site inve-stigations concentrated on the subsea section, where themost serious risks are found. This is covered elsewhere(Aagaard & Blindheim, 1999). However, engineeringgeological pre-investigations based on field inspectionswere performed for the land sections and aimed at iden-tifying the more important problems for the tunnelling.This included stability problems and need for rock sup-port, but addressed also the risk of water inflow to thetunnel and need for ground treatment under residentialareas. In the traditional manner, these aspects were plan-ned to be dealt with during tunnelling. No detailed riskor special environmental assessment for water seepagewas done ahead of construction, as has later becomepractise.
It was known from experience with water supply wellsin the area that the geological formation could show alarge variation in permeability. The main rock type isPrecambrian gneiss with bands of darker and lighterminerals, and frequent pegmatite intrusives. It wasexpected that both small and spread out seepage couldoccur, and that some of the joint sets, opened by tensio-nal tectonic movements in the vicinity of the Oslo gra-ben, could cause large localised inflows. Naturally, for asubsea tunnel the general preparedness for large waterinflow was high.
2 TIGHTNESS CRITERIA
2.1 Requirements in the contractThe tunnel contract was a normal unit price contractaccording to the standard format of the NorwegianPublic Roads Administration. In these contracts theselection of criteria for water tightness and when to per-form grouting is decided by the owner, to some extent inconsultation with the contractor, to adapt to the situati-on and experience gained during tunnelling. The con-tractor gets paid for the actually performed works ofdrilling probe and grout holes by the metres of holes, byconsumed amount of the different type of groutingmaterial, and for standstill of tunnelling equipmentduring grouting, according to the respective tenderedprices. The contract included the normal patterns forprobe drilling and grout hole patterns, which have been
used successfully for more than 20 years, as reported inseveral Norwegian papers.
The only requirement expressed by figures in the con-tract was the target of allowed final seepage, as normalset to 300 litres/min/km in total (corresponding to 30litres/min/100m). This relates mostly to the dimensio-ning of the pumping facilities and has no relevance forthe possible environmental demands of e.g. sensitiveland sections of the tunnel.
At the beginning of the construction period, the detailedrequirements to the pre-grouting criteria were definedby the owner, after advice by his geological engineeringconsultant O. T. Blindheim AS. The basic criteria wasthat a seepage out of one probe hole (or other drill holesin the face) of 3 litre/min would trigger pre-grouting.This applied to all land sections, including below thetownship. This was considered a strict requirement,based on experience from tunnelling through similargeological formations and environments, justified bythe need to avoid draining of the small lakes in the areaand damage to residential and other properties. It invol-ved an assessment of the geological and hydrogeologi-cal conditions, based on normal engineering geologicalpractise and experience.
For the subsea sections 6 litres/min was chosen as a trig-ger level. The criteria also included directions about thenumber of control holes to be applied after grouting etc.
2.2 Environmental assessmentAt the time, it was not yet a requirement for specialenvironmental assessment for risk of water seepage inthe quality assurance manuals of the Public RoadsAdministration. However, the owner’s project manage-ment realised the need for a closer assessment of thesensitivity to effects of tunnelling below the attractiverecreational forest area. This hydrogeological assess-ment was performed by Jordforsk (a specialist hydrolo-gical and hydrogeological advisory company) duringthe early stage of the tunnelling.
The assessment confirmed that the small lakes (or ratherold water reservoirs left unregulated), and the adjacentpeat areas, were likely underlain by clay-rich marinedeposits on top of the bedrock, thus reducing the infil-tration to the bedrock. The risk of rapid drainage by tun-nelling below could still be significant, as the catchmentareas were small. A water seepage into the tunnel of 20litres/min/100m was evaluated as acceptable for thenatural environment, provided there were no large con-centrated seepage. It was recommended to reduce theseepage to 10 litres/min/100m in view of the interest inthe area for recreational use.

PUBLICATION NO. 12 NORWEGIAN TUNNELING SOCIET Y
91
The effect of ‘sealing’ by the marine deposits on top ofthe bedrock could not be assured without extensiveadditional site investigations, which would partly defeatthe purpose of leaving the forest area in peace. It wasdecided not to thrust this effect, and to act as if closeconnections could exist between the joint water in thebedrock and the water regime above.
Based on these assessments, it was believed that thealready chosen grouting criteria would suffice. It wouldbe necessary to ensure a consistent performance of thepre-grouting, i.e. avoid remaining concentrated seepage,and not only to follow up, but also to document theresults.
3 FIRST RESULTS3.1 Increased probing neededOn the first section from the portal only minor seepagewas encountered. On a few locations, small seepageidentified by probe holes or blast holes triggered pre-grouting. After the tunnel had reached 1 km in, the mea-sured seepage was about 20 litres/min/100m on the ave-rage, however, most of this came from one short secti-on. After one concentrated seepage had been passed wit-hout being detected by the probe drilling, it becameclear that the result of the grouting needed to be impro-ved before the more sensitive areas were approached. Itwas decided to step up the probe drilling, which hadbeen performed according to ‘Level 1’ consisting of 2holes of 30m length. The number of holes were increa-sed to ‘Level 2’ with 4 holes of 30m and the direction ofthe holes was adapted to better intersect the joint setsthat appeared to carry most of the seepage. Four controlholes were drilled after each grouting round to check theresult.
3.2 The initial grouting The grouting was initially performed with standardindustrial cement (‘Rapid RP-38’), and in some caseswith fast setting cement (Rescon’s ‘Cemsil’) at locationswith larger seepage. In some locations, where both openand narrow joints occurred, micro-cement (Rescon’s‘Microcem 650’ from Blue Circle) was also taken intouse.
The pattern of grout holes was initially 23 holes of 20mlength, which were drilled with the blast-hole drillingjumbo, as the probe holes. This pattern was increased to28 grout holes to reduce the spacing, and a few holeswere added in the face. The length of the holes wereincreased to 23m to get minimum 8m overlap for 3 blas-ting rounds of 5m between grouting rounds.
In some sections 3-4 overlapping grouting rounds werenecessary, mostly 2 had been sufficient. The pumpingpressure was set at 45 bar initially, and increased to 60
bar after 1km. Occasionally pressure up to 70-80 barwas applied. The stop pressure was held at 30-45 bar,where achievable.
The rock mass conditions varied from one round to thenext. The different joint sets were more or less presentwith a varying persistence. The pegmatitic intrusionswere more jointed, but with irregular discontinuities.Some joints were rather tight or clay filled, and difficultto grout. Thus, the contractor wanted to try a finermicro-cement. As such cement was not priced in thecontract, this was accepted by the owner on a trial basisat first. The results were promising, and Microcem 900or A12 Spinor were taken into use according to availa-bility.
After the first kilometre the grouted length of the tunnelwas 198m, i.e. 19% of the section length of 1058m. Thetotal length of grouting rounds was 467m, giving adegree of overlap of 467/198 = 2.4. The total materialconsumption was 222 ton, which gives an average of1120kg/m on the grouted length and 210kg/m on thetotal section length. The latter figure was slightly lessthan the overall average in the Bill of Quantities, howe-ver, most if this ad been expected to be used on the sub-sea section.
3.3 Need for improvementAs planned, a complete re-evaluation of the situationwas performed by the geological engineering consultantafter the first kilometre of tunnelling. This included anassessment of the assumptions, the experienced rockmass conditions, the characteristics of the jointing, theresults from the grouting, remaining seepage, potentialimpact on the surroundings etc.
It was clear that in spite of the improvements achievedso far, it was necessary to improve further both theresulting tightness and the efficiency of the process. Astrategy to reduce the remaining water seepage wasdeveloped. The technical measures included improvedprobing (6-8 holes for each 3rd blasting round), increa-sed number of grout holes to reduce the distance betwe-en grout holes down to 1m at the inner end, reducedlength of grout holes to reduce deviation, use of highpumping pressure (60 bar with minimum 30 bar stoppressure), types of cement, selection criteria, etc. Theneed for a flexible adaptation to the varying conditionswas emphasised. This required further efforts as will bedescribed below.
4 NEED FOR CO-OPERATION4.1 Decisions on principlesAfter these initial experiences, the owner realised that itwas not going to be easy to satisfy the tightness require-ment. Due to the sensitivity of the subject, a high degree

NORWEGIAN TUNNELING SOCIET Y PUBLICATION NO. 12
92
of assurance to avoid damage to the environment waswanted.
On most of the first kilometre, the grouting was orderedby the owner without detailed discussion with the con-tractor. As the effort was stepped up, both on probe dril-ling and on the grouting, several work meetings tookplace between the representatives of the owner and thecontractor, including also the geological engineeringconsultant. This helped the systematic trying out of dif-ferent types of cement, the criteria for their selection,and details of the stop criteria.
It was however obvious that the total effort of groutingcould potentially impact the time schedule and cost sig-nificantly. Based on the re-evaluation mentioned above,the owner’s project management made the followingcrucial decisions:
The criteria for triggering of grouting should not becompromised in any case;• The use of micro-cements outside the contract would
be allowed, after selection criteria and a negotiatedprice had been agreed;
• The performance should be optimised by co-operationwith the contractor, drawing on his experience onpractical performance.
The determination to achieve the target tightness whate-ver it took, but to minimise the time and cost impact byconstructive co-operation, was conveyed in both organi-sations.
4.2 Co-operation on performanceThis higher level of co-operation than demanded in thecontract resulted in the agreement of a set of ‘fram-ework’ grouting procedures. These aimed at adaptationto the varying conditions to achieve satisfaction of therequirements and at the same time allowing efficientproduction.
In detail, the target was to minimise the number of over-lapping grouting rounds, i.e. to reach the satisfactoryresult faster. It was allowed to use cement outside thetypes priced in the contract, according to specifiedselection criteria (e.g. for holes with more seepage than25 litre/min grouting would start with industrial cement,for less than 25 litre/min with micro-cement grade 650,and for less seepage than 10 litre/min, micro-cementgrade 900 could be used directly). Guidelines were laidout for change of material during grouting, stop criteriawith respect to pressure, supplementary holes etc.
Most important, it was agreed that the procedures couldbe adapted according to the conditions, within the agre-ed framework, after the judgement of the owners shift
controllers (most of them had geological engineeringtraining) and by the contractor’s face crew during exe-cution. It must be realised that the typical Scandinavianface crew consists of experienced and multi-skilled tun-nel workers. This decision delegated authority to adaptthe procedures to the staff from both parties that wereclosest to the performance of the works.
5 FINAL RESULTS5.1 Adaptation to varying conditionsThe detailed performance of the subsequent work provi-des a wealth of detailed experience, which is worth adetailed analysis, but which is beyond the scope of thispaper. However, it can be mentioned that the target ofsatisfying the tightness requirement with fewer overlap-ping grouting rounds was achieved, although the totalconsumption per grouted metre tunnel remained aboutthe same, as will be shown below.
5.2 Tunnelling under Drøbak townshipMost houses in Drøbak are founded on rock, moraine ornot so sensitive marine deposits. However, in the centreof the township, an old ice-cutting dam had been poorlyfilled in, and houses in this area are founded wholly orpartly on timber fleets, and would be extremely sensiti-ve to any lowering of the water pressure or the groundwater level. Four piezometres were installed around thearea, and preparations made for 1-2 water infiltrationwells. The tunnelling passed just below this area, at thesame time crossing a fault zone. The pre-grouting wasdone according to the developed detailed procedures,and no effect of the tunnelling was detected, neither onthe pore pressure, nor on the elevation of the houses.

PUBLICATION NO. 12 NORWEGIAN TUNNELING SOCIET Y
93
5.3 Probing methods and resultsThe systematic use of 6-8 probe holes ahead of the faceproved to be sufficient to identify the potential seepagejoints. The length of 23 or 30m was chosen to best fit thesequence of blast rounds, ensuring a minimum overlapof 8m. Half of the probe holes were typically set in themiddle of the face, aiming at an angle of 30-45° to thetunnel axis in order to cover the complete front of thegrout hole ’cone’. The others were collared in a normalmanner pointing 15° outwards from the tunnel contour.
Although this level of probe drilling gives 2-3 timesmore probe holes than normal, it does not represent asignificant cost or delay to the tunnelling when it beco-mes a routine part of the work cycle. The cost of theprobe drilling on the east land section came to approx. 1million NOK (9 NOK ~ 1 USD) or about 0.25% of thetotal cost of the complete tunnel, or less than 1% for theland section only. This can be seen as an inexpensiveinsurance against not finding and passing through toolarge seepage, which would result in time-consumingand very expensive post-grouting, and delays to otherworks.
The trigger level of 3 litre/min was kept throughout andproved sufficient. The same applied to the selection cri-teria for the grouting materials, depending on the levelof water seepage out of the probe holes.
5.4 Pre-grouting methods and resultsThe total consumption of cementitious grouting materi-als on the complete land section on the east side of thefjord of 2817m was 667 tons. This constitutes an avera-ge of 237kg/m tunnel, which is 10% more than the totalaverage for the whole tunnel in the Bill of Quantities of215kg/m. Distributed on the grouted section of 687monly, which constitutes 25% of the total land section, theconsumption is 970kg/m grouted tunnel. Accordingly,the improved procedures had reduced the consumptionper meter grouted tunnel compared to the first kilome-tre. The need for repeated grouting rounds also decrea-sed, reducing the time impact significantly.
See Table 1, which gives an overview of the differentgrouting materials used on the complete eastern landsection. Note that the ratio between normal and coarsecements to the micro-cements is about 60/40.
5.5 Post-grouting methods and resultsOn the section where a few joints with concentrated see-page had been passed without being detected by theprobe drilling, and for 15-20 rock bolts that had pene-trated the grouted zone around the tunnel contour, alimited post-grouting program was performed. Althoughthe overall seepage on the section with localised seepa-ge satisfied the average requirement of 20 litre/min
100m, it was considered worthwhile to try to treat eachof the seepage points, especially since most of the localseepage was coming from either one joint or a bolt hole.
The post-grouting was done with a separate small crewwithout disturbance to the tunnelling using light drillingequipment and polyurethane, which was available in thecontract. The result was satisfactory as many of the lar-ger concentrated seepage points were stopped or redu-ced significantly. Some were only partly reduced, ormore often, spread out or just ‘chased around’. As theuse of polyurethane material became questioned forhealth reasons, this small post-grouting scheme was dis-continued. However, at this point, the environmentalcriteria were satisfied, and no further post-grouting wasrequired.
It is worth mentioning that not at any stage was post-grouting considered as an equal alternative to pre-grou-ting. The use of systematic post-grouting drill patternswas never considered necessary, due to the determinedemphasis on pre-grouting. The minor post-grouting pro-gram that was performed must be considered as a ‘fine-tuning’ with a minor economic impact, decided by theowner’s project management as a measure to be on thesafe side.
5.6 Resulting tightness A satisfactory water tightness was achieved on thewhole land section. Most sub-sections had no or spreadout minor dripping only. At a few locations water wererunning rather than dripping, but in so small amountsthat it did not constitute a threat to the environmentalcriteria.
The total average remaining seepage was estimated,based on the measurements for the different subsections,to 9 litres/min/100m, which reduced to 8.4litres/min/100m at the end of the construction period.This was not only below Jordforsk’s recommendedrequirement to avoid damage to the environment of 20litres/min/100m, but also below their ‘idealistic target’of 10 litres/min/100m.
Grouting material Consumption, kg
Industrial cement (Rapid) 385 710
Fast setting cement (Cemsil) 9 925
Coarse filter cement (Mauring) 100
Micro-cement, grade 650 124 670
Micro-cement, grade 900 126 775
Micro-cement, A12 12,180
Micro-silica (GroutAid) 7,143
Total cement/silica materials 666 503
Polyurethane (Taccs) 1390 litres
Table 1 Consumption of grouting materials for the eastern land section of the Oslofjord tunnel.

NORWEGIAN TUNNELING SOCIET Y PUBLICATION NO. 12
94
In detail, on one section of 200m only the remainingseepage was 35 litres/min/100m. However, pore pressu-re measurements confirmed that this did not influencethe ground water level. Measurements of pore pressureperformed from holes drilled upwards from the tunnel inthe area adjacent to the lakes confirmed that the groundwater level below rocky outcrops remained less thanapprox. 5 m below ground level, unchanged or increa-sed since the first measurements when the tunnellingreached the area.
The seepage on the section below the township itself,with vulnerable houses with poor foundations in the in-filled ice-cutting dam, was well below the criteria, downto approx. 2-3 litres/min/100m. However, such lowlevels are needed to avoid settlement damage. In thisarea, piezometres installed from the surface detected anormal variation in ground water level of within 0.5m,and no variation related to the tunnelling passing below.Settlement checking of the house did also not detect anyeffect of the tunnelling during the period of constructi-on until 2 years after the passing.
During the whole construction period, water level mea-surements confirmed that the tunnelling did not affectthe small lakes in the area. These measurements actual-ly became one of the rather pleasant tasks of the sitestaff, as the walk through the forest to the undisturbedlakes gave a reward in itself, as Figure 2 illustrates.
To avoid water dripping on the asphalt driveway, normalwater shielding was done by polyethylene foam (fire-protected by sprayed concrete), according to normalprocedures, see illustration in this publication(Blindheim & Øvstedal, 2001).
5.7 Time and cost impactCompared to the contractor’s initial time schedule, thetunnelling through the 25% part of the land section thatneeded extensive grouting caused a delay of approx.
four weeks. This was later recovered, also because thesubsea tunnelling from two faces benefited from theimproved procedures. Accordingly, the break-throughon the subsea section was on schedule.
The cost of the grouting measures (including probe dril-ling) on the east land section came close to 6 millionNOK (9 NOK ~ 1 USD), which constitutes approx.1.5% of the cost of the completed 7.2km tunnel. Assome of this cost anyway was expected passing the builtup areas, the final cost increase became insignificant.
6 THE REST OF THE OSLOFJORDCONNECTION
6.1 Grouting of the other sections Much less grouting was necessary on the land section onthe west side of the fjord, giving an average consumpti-on of only 74kg/m.The total grouting on the whole tunnel of 7.2km avera-ged 360kg/m, almost 30% of which was used in a shortsection in an eroded fault zone with no rock cover, thatwas extensively grouted as preparation for freezing(Blindheim & Backer, 1999).
For the five shorter tunnels under land on both sides ofthe Oslo fjord, no grouting was performed.
6.2 Resulting tightnessThe total remaining seepage on the complete subseasection was at completion 26 litre/min◊100m.
Including the subsea section and the land sections atboth sides, the total seepage for the 7.2km tunnel was 22litres/min/100m, which is well below the target of 30litres/min/100m.
For convenience and safety of the drivers, frost insula-ted drip protection (polyethylene foam with sprayedconcrete as fire protection) was installed in all sectionswith remaining seepage. This amounted to 18 m2/m tun-nel in total, corresponding to approx. 80% of the tunnelcontour.
Fig. 2 Idyllic Øvredam loved by everybody living in thearea, and saved by the successful water control schemeduring tunnelling below.

PUBLICATION NO. 12 NORWEGIAN TUNNELING SOCIET Y
95
7 CONCLUSIONSFrom the experience with the water tightness control forthe eastern land section of the Oslofjord tunnel it can beconcluded:• It is possible to achieve the degree of tightness as
required to protect the environment with respect todrainage of ground water, from the joint water in thebedrock, pore water in soil deposits and surface waterin lakes above.
• Although in this case the target was achieved withoutdetailed analysis ahead of construction, the environ-mental assessment and establishment of specified cri-teria shall preferably be done before tunnelling starts.A complete system of follow-up, flexible proceduresand measurement of resulting tightness must be imple-mented. The evaluation of all factors and results byexperienced specialists in geological engineering andthe timely decisions by the project management arecrucial for the result.
• It is vital that the owner’s project management in adecisive manner secures the constructive co-operationof all involved. Besides the normal support from hisspecialist consultants and follow-up staff, proceduresmust be established and implemented that draw on theexperience of the contractor, including his foremen,shift bosses and face crew.
• If these basic measures are neglected, even the use ofadvanced grouting material technology can not securesatisfactory results.
• The emphasis has to be on pre-grouting, if reasonabletargets with respect to time and cost shall be achieved.Post-grouting must not be allowed to become a substi-tute for pre-grouting.
REFERENCESAagaard, B. & Blindheim, O. T. (1999): “Crossing ofexceptionally poor weakness zones in three subsea tun-nels, Norway”, in Alten (ed.): Challenges for the 21stCentury. Proc. World Tunnel Congress ’99, Oslo,Norway: 457-466. Balkema.
Blindheim, O. T. & Backer, L. (1999): “ The Oslofjordsubsea road tunnel. Crossing of a weakness zone underhigh water pressure by freezing”, in Alten (ed.):Challenges for the 21
stCentury. Proc. World Tunnel
Congress ’99, Oslo, Norway: 309-316. Balkema. Alsopublished as: Oslofjord challenge, Tunnels &Tunnelling International, December 1999, pp 39-42.
Blindheim, O. T. & Øvstedal, E. (2001): “Design prin-ciples and construction methods for water control insubsea road tunnels in rock”, in Water Control inNorwegian Tunnels, Publication No. 12, NorwegianTunnelling Society, Oslo (this publication).
Haug, R. G. & Øvstedal, E. (1999): “The Oslofjord sub-sea crossing. Highlights in ongoing tunnelling”, in Alten(ed.): Challenges for the 21st Century. Proc. WorldTunnel Congress ’99, Oslo, Norway: pp 535-542,Balkema.
Øvstedal, E. (2001): “The Oslofjord Sub-sea Tunnel “,4th Symp. on Strait Crossings, Bergen, Norway,September.
Figure 3. Heavy duty drilling equipment.

97
1. THE NORWEGIAN TUNNELINGCONTRACT SYSTEM
Norwegian Tunnelling contract philosophy is based on asimple principle of survival: “expect the unexpected”.When forming a contract for a tunnel or cavern project,there must be allowance for eventualities. Typically inNorway specifications and unit prices covering the enti-re range of possible rock conditions and configurationsare included in the contract and flexibility is cultivated.Woe betide the contractor who installs an unsuitable anddangerous supporting structure simply because “that’swhat the contract specifies”.
The Achilles heel of any excavation project is not thedrilling and blasting, or boring operation, but the sup-port work needed to stabilise and secure the physicalvoid left in its wake. This is not only crucial for the safe-
ty of the entire installation upon completion, but also forthe safety of the construction workers during constructi-on. The purpose of all support work is to re-establish thestability of the rock as quickly, effectively and cheaplyas possible. This is not something that can be complete-ly planned on paper, years in advance, sitting in a com-fortable office suite with a beautiful view. Decisionshave to be made on the spot, kilometres into the moun-tainside or scores of meters below the ocean floor, withcrumbling, leaking rock masses overhead. The contractmust be flexible enough to apply to almost every even-tuality or occurrence of changing geological conditions.
For more than 20 years, the contract system has proventhat the use of a flexibility results in lower total costs,greater safety in tunnel construction and reduction ofdisputes, arbitration or litigation.
13 WATER CONTROL – REASONABLE SHARING OF RISK
Kjell O. BergeSelmer Skanska AS, Oslo
ABSTRACT: A fair and just contract between the Owner and Contractor is essential when dealing withwater control in rock tunnelling. The Norwegian tunnelling contract system implies that the owner isthe risk-taker for the amount of grouting needed to meet water control requirements. The contractor’srisk is limited to the execution of the work in the best and most effective way, hence the unit price con-tract system is dominating the water control work.
When the quality of the product is of importance, i.e. minimising the impact of tunnelling on the sur-roundings, the owner should take the risk of time used to have the grouting made to his satisfaction. Thefinishing date in the contract should be regulated for used grouting hours compared to a suggestednumber of grouting hours in the tender. This matter is currently subject to discussion whether it may bean even better solution for the owner to pay per hour used for grouting and in addition pay materialsper kilo when the surroundings are of great importance.

NORWEGIAN TUNNELING SOCIET Y PUBLICATION NO. 12
98
The Norwegian Tunnelling Contract System includesthe following main elements for a typical tender docu-ment:
1. Tender papers include geological and geotechnicalreports conducted by experienced geological engin-eers, showing all investigations and surveys thathave been conducted in connection with the project.These give the contractor a general idea of the rockconditions and specify all the facts and assumpti-ons.
2. Based on these reports, the tender papers list thetypes and amounts of rock support and grouting tobe included in the tender sum, the Bill of Quantityrepresenting the expected level of such work. Thetender papers also include alternative unit prices forwork, such as driving pilot headings, probe-drilling,grouting, etc.
The various types of support and grouting worksand their requirements and conditions are clearlydescribed in the tender documents.
The support and grouting work is divided into twomain categories: The work executed at the tunnelface (which delays the progress of the tunnelling)and behind the tunnel face (which does not delaythe progress of the tunnelling). The tender also defi-nes the types and amounts of rigging and equipmentrequired for support work (steel form, shotcrete andinjection equipment, special bolts, etc.) that the con-tractor must have available at the site, on a stand-bybasis. Tender prices are specified for all these speci-al items.
3. Most importantly, the tender documents must inclu-de a number of different measures that shall be deli-verable during construction. This condition allowsthe most suitable grouting technique to be appli-cable at any time dealing with different situations atthe tunnel face.
4. Delays or savings in total construction time due toincreased or decreased amounts of support work isdealt with in the following way:
In the tender, the contractor must specify “the equi-valent time” for each type of support work. Theseare only used as a key for extending or shorteningthe construction time. Theses figures make it easyto calculate the consequences of changes in typesand amounts of support and grouting work at a laterdate.
An important requirement of the Norwegian TunnellingContract System is that both the client and the contrac-tor must have skilled and experienced representativespresent at the site. When problems arise at the tunnelface, the parties must be able to inspect and evaluate thesituation together and find the best solution withoutdelay and dispute. The contractor who has correctly pri-ced various support alternatives will be able to advisewithout being concerned about “ulterior motives”. Thecontract already specifies prices for such work. Therepresentatives at the site or a consultant must have theexpertise and the authority to decide on the best alterna-tive, so that the client pays for the solution that is tech-nically the correct one.
The idea behind the Norwegian Tunnelling ContractSystem is to financially account for all possible eventu-alities at the tender stage. Thus, all parties can work asone team during the construction phase to effectuate theplans and overcome difficulties quickly and efficiently.
2. THE PRINCIPLES OF RISK SHARING
The principles used for sharing the risk in Norwegiantunnelling contracts were introduced in the 1970’s.Earlier contract practices did not provide for enough fle-xibility with regard to the sharing of risk and responsi-bility between owner and contractor when ground con-ditions became adverse and penalty dates where beingoverrun. Still more time was lost during the discussionsthat followed, and in some instances the parties had togo to court.
In a paper by Kleivan (1988) the most significant argu-ments for the introduction of a risk sharing principle intunnel contracts were presented. According to Kleivanthese were:- The ever present uncertainty of what the actual
ground conditions are: Field investigations normal-ly include few, if any, core drillings, and from sur-face observations alone it is limited how accuratelythe conditions at tunnel level can be predicted at thetime when the contract is signed.
- The cost: If the contractor should assume all risk hewould necessarily ask for a high price in order to besafe, a price that in most cases would exceed theactual cost, thus in the end giving the owner lessvalue for his money. Should on the other hand theactual ground conditions be such that the contractorgoes broke during the contract period, also this situ-ation may have an undesirable effect on the owner’seconomy.
- Court proceedings in the wake of a contract arecostly and time-consuming, and may do more goodto lawyers than to the parties involved.

PUBLICATION NO. 12 NORWEGIAN TUNNELING SOCIET Y
99
The main principle of risk-sharing in tunnel contractswhile using time-equivalents is to establish tools forconverting amounts of various items into constructiontime needed. These tools can later handle any conting-ency arising from changed ground conditions. Futurediscussions on regulation of the construction time whereneeded, or on related costs incurred will be easily conc-luded. All such problems are foreseen and the answersare to be found in the contract.
The formula developed to meet this end contains the fol-lowing ingredients:- Contract documents where relevant types of rock
support and grouting measures that may possible beneeded are described. Each one of these activitiesshall be specified in the Bill of Quantities, as a sepa-rate pay-item. The unit price for that item shallmaintain its validity even if the actual quantityshould deviate widely from the one given in thecontract documents.
- Time parameters, quoted in the contract documents,by which any one of those activities expected toinfluence on progress can be converted into timeintervals that reflect the time this activity consumes.Such work will have different impacts on the con-struction time when it is performed at the tunnelface where it interferes directly with the excavationcycle, and when it can be postponed to be installedbehind the face where it interferes only marginallywith the excavation cycle. Therefore two sets oftime parameters must be quoted to cover both situ-ations.
- Provisions in the contract for adjusting the contrac-tual construction time, calculated by means of thework volume presented in the Bill of Quantities (thereference ground conditions) and the time-equiva-lent system described above, to the actual groundconditions encountered during construction.
A great advantage of this “time-equivalent system” isthat the contractors incentive to meet the penalty dead-line will be maintained; changed ground conditions andchanged volumes of rock support may shift the comple-tion date one way or the other, but then strictly in accor-dance with the rules and regulations laid down in thecontract.
The reference ground conditions, reflected in the Bill ofQuantities, should be based on the best judgment of theowner after an evaluation of all geological and geotech-nical documentation from pre-investigation.
3. PROVISIONS FOR REGULATIONOF CONSTRUCTION TIME
In today’s tunnelling projects, strict environmentalrequirements prevail, calling for a high quality groutingto be performed. In such cases it is considered to be thebest solution to incorporate a regulation of time. It iseasy to understand that shifting the full risk on the con-tractor for time used for grouting do not carry sufficientincentive to use a long time on grouting to obtain a firstclass result. As the need for grouting in many cases isrelated to the concern of negative impacts on the neigh-bourhood, it is of greater interest for the owner to deci-de the quality he wants to obtain, than it is for the con-tractor.
Based on these motives, it seems to be the best solutionthat a regulation of the contract period depends on timeused for grouting. This may be regulated in a separate“time-balance” sheet.
Usually the owner put an assumed quantity of hours forgrouting in the tender. This amount of hours is regulatedfor the difference to actual used hours for grouting. Thecontract period is regulated hour by hour.
4. FUTURE CONTRACTUAL EVELOPMENTS FOR ROCK MASSGROUTING
4.1 Focus on the aspect of “time”During recent years an increased number of tunnelshave been constructed in urban areas. This has movedthe focus of the tunnelling industry from the amount ofinflow the tunnel, to the impact of draining of theground water above the tunnel. The quality of the resultof the grouting procedure concerning the surroundingsis in these cases of highest importance. To obtain a morecommon goal for the involved parties concerning thefinal result of the grouting, the Norwegian Standard NS3420 Specification texts for building and construction,will be revised to allow the possibility to compensate forthe actual time used for grouting in addition to the costof the materials.
Figure 1. Risk sharing according to type of contract,and assumed influence on the project cost

NORWEGIAN TUNNELING SOCIET Y PUBLICATION NO. 12
100
By using this contract format the owner will take therisk for the aspect of time and time depending costs forgrouting. The contractor takes the risk as far as havingrelevant equipment at his disposal for the grouting work.This is considered to be a fair share of risk when thedemands for the result of the grouting are special high.The cost and the quality will better match each otherwhen the contract format encourages a correct con-sumption of time and material.
It is also considered as an advantage to keep the risksharing of today with responsibility for consume of timeon the owner, and responsibility for the execution on thecontractor, in situations where the grouting is not criti-cal as far as the environment is concerned.
For the contractors, remuneration based on time, ratherthan quantity, will improve their capability of meetingthe leakage criteria within the first grouting round.Benefiting from an efficient grouting procedure willautomatically draw the attention of all involved partiestowards a development of materials and methods in usefor this kind of work.
Not only materials and methods are expected to deve-lop, improved relations between the owner and the con-tractor are almost as important to obtain a time efficientgrouting procedure.
4.2 Principles of executionIt has been a common procedure to measure leakage ofwater from boreholes as criteria for decision when tostart a grouting procedure. This is still used for groutingof dam foundations.
For tunnels in urban areas, however, the case will usual-ly be to try to obtain a tunnel as water tight as possible,minimizing the drainage effect on the surroundings. Theneed for grouting is decided by the sensitivity to settle-ments of the ground above the tunnel or the sensitivityof existing biotypes to groundwater lowering. When aborehole ahead of face has been made, it should prefe-rably be used for pre-grouting. Test has proven smallconnection between water entry into the bedrock com-pared to the entry of grouting materials, see figure 2.
The common procedure that has developed in areas sen-sitive to ground settlements, is to perform a systematicgrouting in a first round. Further grouting is decided bythe entry of grouting materials and after new combinedtest and grouting holes.
The most used procedure is to establish a grouted trum-pet with 20 – 40 meter long boreholes with a spacing of1 - 2 m between each. The next round is repeated every12 meter. When the amount of grouting materials ishigh, the distance between each trumpet can be shorter.
It is important that everyone who is involved in thegrouting work at the tunnel face is familiar with the aimof the grouting and the principles used for grouting.They then will be able to take the correct decisionswhile executing the grouting work. It is of importance tobe familiar with the maximum allowed grouting pressu-re, and the maximum allowed grout material per hole,before the grouting is terminated in any specific bore-hole, and a new borehole is made for grouting in a laterround.
Growing concern related to the owners and contractorsorganisations of such work has been seen. An efficientprocedure is also very much depending on the construc-tion management; decision at the tunnel face is impor-tant; a trustful co-operation between the involved parti-es; defined requirements of success-criteria.
Figure 2. Measured relationship between Lugeon inliters and used grouting material in kg
Risk sharing and cooperation.

PUBLICATION NO. 12 NORWEGIAN TUNNELING SOCIET Y
101
5. EXPERIENCE In figure 3 the relationship between planned and usedamount of grouting for 4 tunnels in urban areas isdemonstrated. The need of a minimum drainage effecton the ground water above the tunnel has been the focusof decision making.
Further, in figure 3 the same relationship is tested for 3subsea tunnels. In these cases the design criteria is theamount of water that needs to be pumped out of the tun-nel.
The relation between planned and used amount of grou-ting points to the difficulty in predicting the correct esti-mate of such work.
The gained experience leads to the conclusion thatthe contract between the owner and the contractorshould be based on a flexible system available to per-form the optimal quality compared to cost within thecontract.
LITERATUREKleivan, E. (1988) Norwegian Tunneling ContractSystem, Norwegian Soil and Rock EngineeringAssociation, publication nr 5 (Tapir 1988)
Norwegian Trade Council: Shotcrete Technology, TheNorwegian Method of Tunneling (1994)
Figure 3. Planned grouting compared to used groutingfor 4 urban tunnels and 3 subsea tunnels