Water Conservation in the South Platte Basin: Policy … Conservation in the South Platte Basin: ......
60
Water Conservation in the South Platte Basin: Using the City of Fort Collins as a Case Study to Evaluate the Effectiveness of Four Policy Options Hanna Schum Advisor: Robert Fusfeld CBA Advisor: Dr. Andy Sharma April 12
Transcript of Water Conservation in the South Platte Basin: Policy … Conservation in the South Platte Basin: ......

Water Conservation in the South Platte Basin:
Using the City of Fort Collins as a Case Study to Evaluate the Effectiveness of Four
Policy Options
Hanna Schum
Advisor: Robert Fusfeld
CBA Advisor: Dr. Andy Sharma
08 Fall
April 12

TABLE OF CONTENTS
EXECUTIVE SUMMARY ......................................................................................................................................... 1
PROBLEM DEFINITION ......................................................................................................................................... 2
INTRODUCTION ...................................................................................................................................................... 2
METHODS ................................................................................................................................................................. 3
Criteria for a Successful Policy ..................................................................................................................... 6
ISSUE ANALYSIS ...................................................................................................................................................... 7
Water is Scarce in Colorado ........................................................................................................................... 8
Groundwater ....................................................................................................................................................... 9
Increasing Water Supply ................................................................................................................................ 9
Population Growth in Colorado ................................................................................................................ 11
Colorado’s Climate ......................................................................................................................................... 12
South Platte Basin .......................................................................................................................................... 12
Major Water Stakeholders .......................................................................................................................... 12
Background: City of Fort Collins ............................................................................................................... 15
PROPOSED SOLUTIONS ..................................................................................................................................... 16
Policy Option 1: Education and Outreach .............................................................................................. 17
Policy Option 2: Incentives and Rebates ................................................................................................ 19
Policy Option 3: Regulatory Measures ................................................................................................... 22
Policy Option 4: Tiered Rate Structure .................................................................................................. 24
COST-BENEFIT ANALYSIS ................................................................................................................................. 29
Social Discount Rates .................................................................................................................................... 30
Price Elasticity of Water Demand ............................................................................................................. 30
Cost-Benefit Analysis Summary ................................................................................................................ 31

Policy Option 2: Cost-Benefit Analysis.................................................................................................... 33
Policy Option 3: Cost-Benefit Analysis.................................................................................................... 34
Policy Option 4: Cost- Benefit Analysis ................................................................................................... 36
WEAKNESSES AND LIMITATIONS.................................................................................................................. 37
STRATEGIC RECOMMENDATION ................................................................................................................... 38
REFERENCES ......................................................................................................................................................... 41
Appendix A - Policy Option 2: Incentives and Rebates Calculations ............................................ 45
Appendix B – Policy Option 3: Regulatory Measures Calculations ............................................... 50
Appendix C - Policy Option 4: Tiered Rate Structure Calculations ............................................... 52

LIST OF TABLES
Table 1: Brief Explanation of the Four Policy Options in Fort Collins ............................................................... 3
Table 2: Historic and Projected Treated Water Demand in Fort Collins (1960-2035) .............................. 4
Table 3: International and Interstate Documents Affecting Colorado's Water Supply .............................. 8
Table 4: City of Fort Collins Utilities’ 2010 Incentives and Rebates Provided to Customers ................ 20
Table 5: Monthly Residential Single-Family Water Rates (2011) ..................................................................... 25
Table 6: Matrix of the Net Present Value for Each Policy Option ...................................................................... 32
Table 7: Policy Option 2: Incentives and Rebates NPV .......................................................................................... 33
Table 8: Policy Option 2: Summary of Costs and Benefits .................................................................................... 33
Table 9: Policy Option 3: Regulatory Measures NPV .............................................................................................. 34
Table 10: Policy Option 3: Summary of Costs and Benefits ................................................................................. 35
Table 11: Policy Option 4: Tiered Rate Structure NPV........................................................................................... 36
Table 12: Policy Option 2: Incentives and Rebates Costs (Program Year 0) ................................................ 45
Table 13: Policy Option 2: Incentives and Rebates Costs (Program Year 1 -7) ........................................... 46
Table 14: Policy Option 2: Incentives and Rebates Benefits (Program Year 0)........................................... 47
Table 15: Policy Option 2: Incentives and Rebates Benefits (Program Year 1-7) ...................................... 48
Table 16: Policy Option 2: Incentives and Rebates – NPV – SDR 5% ............................................................... 49
Table 17: Policy Option 2: Incentives and Rebates – NPV – SDR 7% ............................................................... 49
Table 18: Policy Option 2: Incentives and Rebates – NPV – SDR 10% ............................................................ 49
Table 19: Policy Option 3: Regulatory Measures - Costs ....................................................................................... 50
Table 20: Policy Option 3: Regulatory Measures - Benefits ................................................................................. 50
Table 21: Policy Option 3: Regulatory Measures – NPV – SDR 5% ................................................................... 51
Table 22: Policy Option 3: Regulatory Measures – NPV – SDR 7% ................................................................... 51
Table 23: Policy Option 3: Regulatory Measures – NPV – SDR 10% ................................................................ 51

Table 24: Policy Option 4: Tiered Rate Structure- Benefits - Price Elasticity of 0.5 .................................. 52
Table 25: Policy Option 4: Tiered Rate Structure- Benefits - Price Elasticity of 1 ...................................... 53
Table 26: Policy Option 4: Tiered Rate Structure- Benefits - Price Elasticity of 2 ...................................... 53
Table 27: Policy Option 4: Tiered Rate Structure- NPV - Price Elasticity of 0.5 .......................................... 54
Table 28: Policy Option 4: Tiered Rate Structure- NPV - Price Elasticity of 1 .............................................. 54
Table 29: Policy Option 4: Tiered Rate Structure- NPV - Price Elasticity of 2 .............................................. 54
LIST OF ACRONYMS
AF acre-foot or acre-feet
AFY acre-feet a year
MG million gallons
CWCB Colorado Water Conservation Board
GPCD gallons per capita per day
GPCY gallons per capita per year
MAF million acre-feet
RSF residential single-family
DBP decreasing block price
IBP increasing block price
HOA homeowners association
SDR social discount rate
NPV net present value
PV present value
Qd quantity demanded
HECW high-efficiency clothes washers
HET high-efficiency toilets
HED high-efficiency dishwashers
SWSI Statewide Water Supply Initiative
TAZ traffic analysis zone
NEPA National Environmental Policy Act

1
EXECUTIVE SUMMARY
This policy memorandum evaluates the effectiveness of water conservation policies utilized in the
South Platte Basin of Colorado. Using the City of Fort Collins as a representative case study, this
analysis examines four different water conservation measures used to reduce demand among residential
single-family (RSF) households, which include: 1) education and outreach; 2) incentives and rebates; 3)
regulatory measures; and 4) a tiered rate structure. Although the conclusions of this analysis are unique to
Fort Collins, they can be used for comparison when evaluating other water policies implemented
throughout the state.
Proper water management and planning in Colorado’s Front Range region will be crucial in the
next few decades to accommodate future population growth. By 2050, Colorado will be subject to an
estimated water shortage in the municipal and industrial sectors of between 32 and 66 percent. The South
Platte Basin, including the subset Metro Basin, will likely see the largest total population growth in
Colorado, and is estimated to reach six million people by 2050. Given the severity of this issue, in
addition to city and state budget constraints, this analysis attempts to evaluate the cost-effectiveness of
each conservation strategy, and its ability to reduce water demand.
Fort Collins Utilities has implemented four general conservation measures to close the city’s
projected water gap by 2020. In order to accomplish this goal, the city must reduce use from 144 to 130
gallons per capita per day (gpcd) by 2020, for a total annual water savings of 277 million gallons (MG).
Each policy option was judged on its ability to meet the gpcd goal, its net present value (NPV), as well as
various qualitative measures, such as equitability and political feasibility.
This analysis concludes that Policy Option 4: Tiered Rate Structure is the optimal policy for Fort
Collins moving forward. This option not only had a positive NPV under all nine scenarios calculated, but
also achieved the city’s goal of reducing RSF water use to less than 130 gpcd. It is recommended that the
city implements a tiered rate structure coupled with basic educational measures, in order to ensure a more
sustainable future for Fort Collins, and the South Platte Basin of Colorado.

2
PROBLEM DEFINITION
Due to a projected water shortage of 32 to 66 percent in Colorado by 2050, effective methods of
reducing per capita residential water use will be necessary in the Front Range, the most populous region
in the state, in order to meet future water demands.1
INTRODUCTION
The demand for residential water in the Front Range region of Colorado is increasing at a rate
that will exceed supply in the near future. In order to cope with probable shortages, proper water
management and planning will be critical in the coming years. The Front Range of Colorado is the most
populous region in the state, with the majority residing in the Arkansas, Metro, and South Platte Basins.
For this reason, predicted water shortages for the municipal and industrial sectors in Colorado are
between 32 and 66 percent by 2050, meaning between 538,000 and 812,000 acre-feet (AF) 2 of additional
water will be needed annually to meet these demands. Agriculture demands are not included in this
estimate, because supply limitations will most likely decrease the number of irrigated acres in the state.
For this reason, demand will be reduced in the agricultural sector.3
The South Platte Basin, including the subset Metro Basin, will see the largest population growth
in the state over the next four decades, with a projected population estimated to reach six million people.4
Because of Colorado’s arid climate and limited access to water, the Front Range will see a serious water
shortage if a proactive approach to reduce demand is not undertaken by water providers.
There are multiple residential water conservation methods used to reduce demand in the South
Platte Basin, and their cost and effectiveness vary. Given the urgency of this issue, in addition to state
and city budget constraints, it is important to examine the efficiency of the various policies. This analysis
will use Fort Collins as a representative city and will examine its water conservation plan for RSF
1 Statewide Water Supply Initiative. Colorado Water Conservation Board. Colorado Department of Natural Resources., "South Platte Basin
Needs Assessment Report," Draft Report (2011), 5-8. 2 One acre-foot is 325,851 gallons (approximately the amount of water 2 to 3 families use in 1 year).
3 Statewide Water Supply Initiative. Colorado Water Conservation Board. Colorado Department of Natural Resources., "South Platte Basin
Needs Assessment Report," Draft Report (2011), 5-8. 4 Ibid., 4-3.
3
customers, which includes four strategies: 1) education and outreach; 2) incentives and rebates; 3)
regulatory measures; and 4) a tiered rate structure.
This policy memorandum is intended to evaluate four policy options separately, even though in
practice, they are nonexclusive. Given the magnitude of the projected water gap in the state, it is
important that each individual policy option is effective at reducing water demand. The next section,
Methods, will define the criteria for a successful policy.
METHODS
In this report, Fort Collins is used as the representative city because it is one of the largest cities
in the South Platte Basin and the utility is publicly owned.5 Fort Collins has also been actively pursuing
water conservation since 2003, leading to the accumulation of a large body of data with which to inform
the final recommendation. Although conclusions drawn from this analysis will be unique to Fort Collins,
they can be used for comparison when evaluating other water conservation policies throughout the state,
because many other water providers use similar tactics.
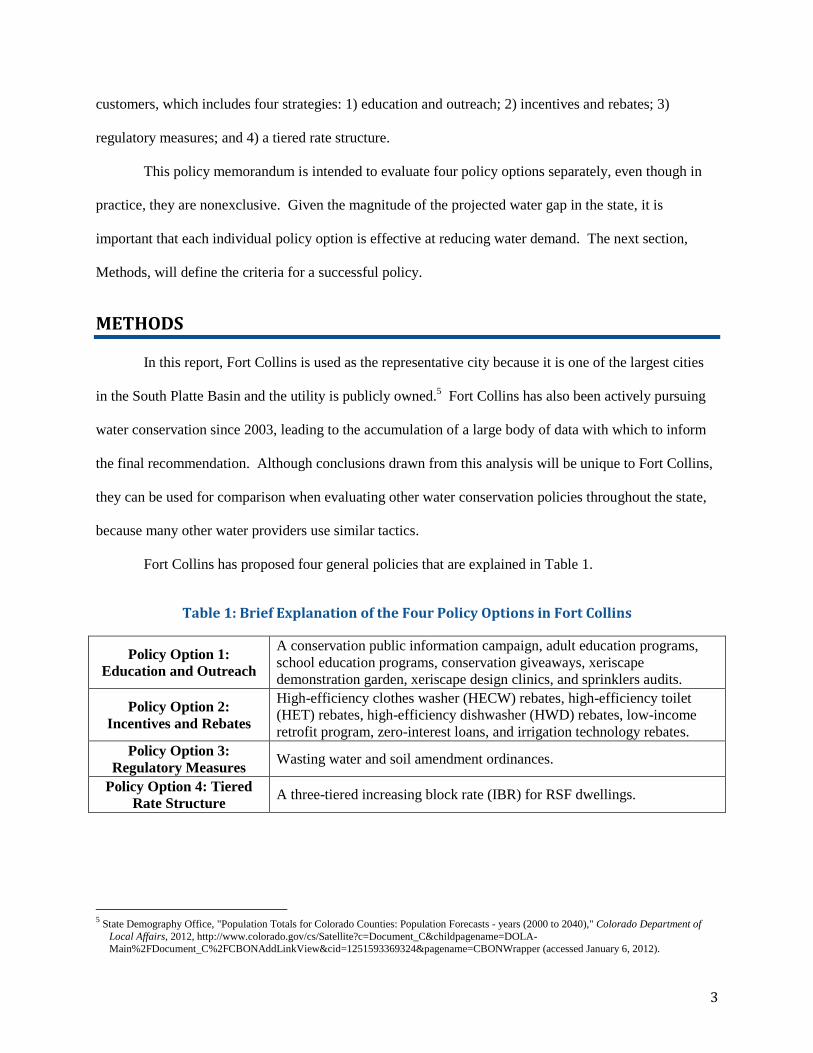
Fort Collins has proposed four general policies that are explained in Table 1.
Table 1: Brief Explanation of the Four Policy Options in Fort Collins
Policy Option 1:
Education and Outreach
A conservation public information campaign, adult education programs,
school education programs, conservation giveaways, xeriscape
demonstration garden, xeriscape design clinics, and sprinklers audits.
Policy Option 2:
Incentives and Rebates
High-efficiency clothes washer (HECW) rebates, high-efficiency toilet
(HET) rebates, high-efficiency dishwasher (HWD) rebates, low-income
retrofit program, zero-interest loans, and irrigation technology rebates.
Policy Option 3:
Regulatory Measures Wasting water and soil amendment ordinances.
Policy Option 4: Tiered
Rate Structure A three-tiered increasing block rate (IBR) for RSF dwellings.
5 State Demography Office, "Population Totals for Colorado Counties: Population Forecasts - years (2000 to 2040)," Colorado Department of
Local Affairs, 2012, http://www.colorado.gov/cs/Satellite?c=Document_C&childpagename=DOLA-
Main%2FDocument_C%2FCBONAddLinkView&cid=1251593369324&pagename=CBONWrapper (accessed January 6, 2012).

4
Fort Collins Utilities’ goal is to reduce water consumption to 140 gpcd by 2020 (normalized to
account for weather conditions).6 Estimating the future water demand for Fort Collins Utilities is
difficult, because the boundaries are not the same as the city limits. Fort Collins used Traffic Analysis
Zone (TAZ) information to estimate projected population growth. Using TAZ, the city concluded that
more growth would occur in the next 15 years (2008 to 2023) than the following years (2024 to 2035).
Obviously, population growth and water demand are correlated. It is estimated that by 2035, an
additional 10,000 people will be served by the Utilities, with the total served population equaling
approximately 157,700.7 Table 2 shows the projected treated water demand assuming a gpcd of 185 and
161.8
Table 2: Historic and Projected Treated Water Demand in Fort Collins (1960-2035)9
Year
Historic Service Area Projected Service Area
Population
(1,000)
Demand
(AF)
Population
(1,000)
Demand
185 gpcd
(AF)
161 gpcd
(AF)
1960 27.5 7,277
1965 38.2 10,109
1970 48.4 12,808
1975 60.4 15,984
1980 73.7 19,504
1985 85.0 22,494
1990 95.9 29,316
1995 106.2 30,168
2000 118.0 31,690
2005 130.3 32,694
2010 137.4 34,219 30,416
2015 144.4 36,497 32,498
2020 148.5 38,144 34,032
2025 152.4 39,749 35,529
2030 155.1 41,098 36,803
2035 157.7 42,425 38,059
6 Normalized values are adjusted to estimate average expected use based on "normalized" 1930-1995 weather conditions. Source: Peter Mayer,
Laurie D’Audney and Dennis Bode, Water Conservation Plan, (Fort Collins: City of Fort Collins Utilities, 2009), 18. 7 Peter Mayer, Laurie D’Audney and Dennis Bode, Water Conservation Plan, (Fort Collins: City of Fort Collins Utilities, 2009), 24.
8 Ibid.
9 Ibid.

5
Using population to calculate projected water use can be complicated, because there are large
contractual users that can greatly alter the gpcd estimate. For this reason, the city did not include the
large contractual users in its gpcd. These were individually calculated, and then added to the population-
based demand. These calculations reflect the forecast for treated water demands.10
Raw water is used for irrigation of parks, golf courses, a cemetery, school grounds, and other
uses. Fort Collins reports that raw water demands range between 3,000 and 4,000 AF annually.
Although it makes sense that raw water demands will also increase in the future, the city believes that
more water rights will be provided to account for those increases, therefore future raw water demand will
not be calculated in this analysis.11
Fort Collins Utilities does not serve everyone inside the city limits and serves some customers
outside of the city limits. Two other districts serve residents within the city, which include the Fort-
Collins-Loveland Water District and the East Larimer County Water District.12
In 2010, Fort Collins
Utilities served approximately 23,937 AF (7.8 billion gallons) of water to 129,000 customers, in a 35
square mile area.13
Of these customers, RSF households were the Utilities’ largest consumer (around 37
percent).14
The city legally owns water rights that average over 70,000 AF (22.8 billion gallons) a year if
they are fully usable. Legal and capacity constraints, however, restrict municipal use to about 31,000 AF
(10.1 billion gallons).15
10
Peter Mayer, Laurie D’Audney and Dennis Bode, Water Conservation Plan, (Fort Collins: City of Fort Collins Utilities, 2009), 24-25. 11
Ibid., 25. 12
Ibid., 3-5. 13
City of Fort Collins Utilities, "Water Conservation," Annual Report (Fort Collins, 2010), 13. 14
Peter Mayer, Laurie D’Audney and Dennis Bode, Water Conservation Plan, (Fort Collins: City of Fort Collins Utilities, 2009), 3-5. 15
Ibid., 9.

6
Since its conservation plan was submitted to the Colorado Water Conservation Board (CWCB) in
2008, the gpcd has been reduced to 144 (2010). Given Fort Collins’ population projection for 2020, this
will not be enough to close the water gap. By 2020, the demand in Fort Collins will exceed its allotted
supply by an estimated 2,301 AF (750 MG).16
This calculation makes the following assumptions:
1. Fort Collins Utilities does not create more supply through development projects nor
agriculture to municipal transfers;
2. The projected population served by the provider is 147,680;
3. The projected large contractual demand of 8,510 AF is correct;
4. Three percent is added to the total demand, which accounts for water loss during the process;
and
5. The average gpcd is 144 (normalized for weather conditions).17
Each of the four strategies will be evaluated based on their ability to reduce water demand among
RSF households, which are Fort Collins’ largest consumers of water.18
The ultimate goal would be to
conserve enough water to close the projected gap of 2,301 AF (750 MG) by 2020, which equates to 130
gpcd for the total population served. However, RSF consumption only accounts for 37 percent of
demand. Assuming this percentage remains relatively stable, and the other water users in the service area
conserve water at the same rate, RSF consumers would need to reduce consumption by 851 AF (277 MG).
In order to account for this water gap, in 2020, RSF water use would need to equal 130 gpcd.19
20
Criteria for a Successful Policy
Meeting the state’s water demands, including municipal, industrial, agricultural, environmental,
and recreational, will require a multifaceted approach.21
This report is only addressing one stakeholder’s
consumption, namely RSF households. However, it should be viewed as part of a larger management
16
Peter Mayer, Laurie D’Audney and Dennis Bode, Water Conservation Plan, (Fort Collins: City of Fort Collins Utilities, 2009), 1-49.
City of Fort Collins Utilities, "Water Conservation," Annual Report (Fort Collins, 2010), 1-18. 17
Normalized values are adjusted to estimate average expected use based on "normalized" 1930-1995 weather conditions. Source: Peter Mayer,
Laurie D’Audney and Dennis Bode, Water Conservation Plan, (Fort Collins: City of Fort Collins Utilities, 2009), 18. 18
Peter Mayer, Laurie D’Audney and Dennis Bode, Water Conservation Plan, (Fort Collins: City of Fort Collins Utilities, 2009), 3-5. 19
City of Fort Collins Utilities, "Water Conservation," Annual Report (Fort Collins, 2010), 1-18. 20
Peter Mayer, Laurie D’Audney and Dennis Bode, Water Conservation Plan, (Fort Collins: City of Fort Collins Utilities, 2009), 1-49. 21
Statewide Water Supply Initiative. Colorado Water Conservation Board. Colorado Department of Natural Resources., "South Platte Basin
Needs Assessment Report," Draft Report (2011), 1-5.

7
plan to reduce total water consumption. Four metrics are used to compare each policy option, which
include:
1. Net present value;
2. Ability to reduce RSF water use to less than 130 gpcd by 2020;
3. Total water savings in the eight-year program (2012 through 2019); and
4. Total participants.
In addition to conducting a quantitative cost-benefit analysis (CBA), qualitative measures will be
examined as well. Water is a necessity that cannot be treated similarly to other city projects. The issue of
equity and political feasibility will be discussed throughout the analysis of the four policy options.
ISSUE ANALYSIS
This section will provide a background of the policy issue, starting with water in the state of
Colorado, followed by the South Platte Basin, finally focusing on Fort Collins. There are many
contributing factors to water scarcity in the South Platte Basin, including Colorado water law, population
growth, climate, and increasing water demand from stakeholders, all of which will be explored in this
section.
The population in the Southwest region of the U.S. is the fastest growing region in the country.22
Foreseeing that water is a valuable resource in the region, several agreements and compacts were created
to avoid overconsumption.23
Although the amount of water available is dependent on such factors as
snowfall, water in this region is relatively finite. As population continues to grow, proper management of
the resource will become increasingly important.
22
A. D. Konieczki and J. A. Heilman, Water-Use Trends in the Desert Southwest—1950–2000, Scientific Investigations Report 2004–5148 (U.S.
Department of the Interior and U.S. Geological Survey, 2004), 1. 23
Colorado Division of Water Resources, "A Summary of Compacts and Litigation Governing Colorado’s Use of Interstate Streams," 2006,
water.state.co.us/DWRIPub/Documents/compactsreport.pdf, 3.

8
Water is Scarce in Colorado
Various international and interstate compacts and agreements regulate the allocation of water
supply in Colorado. Table 3 lists each international and interstate document that has affected water use in
Colorado throughout history.24
Table 3: International and Interstate Documents Affecting Colorado's Water Supply25
International Treaties
Convention with Mexico on the Rio Grande above Ft. Quitman, Texas 1906
Mexican Treaty on Rio Grande, Tijuana, and Colorado Rivers 1945
Interstate Compacts
Colorado River Compact 1922
La Plata River Compact 1922
South Platte River Compact 1923
Rio Grande River Compact 1938
Republican River Compact 1942
Costilla Creek Compact 1944 (Rev. 1963)
Upper Colorado River Compact 1948
Arkansas River Compact 1969
Animas-La Plata Project Compact 1969
U. S. Supreme Court Cases
Nebraska v. Wyoming (North Platte River) 325 U.S. 589 (1945)
Wyoming v. Colorado (Laramie River) 353 U.S. 953 (1957)
Agreements
Sand Creek Memorandum of Agreement 1997
Pot Creek Memorandum of Understanding 2005
Although Colorado’s rivers generate an average of 16 million AF (MAF) of water annually, only
about one-third of this water remains in Colorado, while the rest supplies water to other states. Eighty
percent of this water is on the Western Slope of the state, while about 80 percent of the state’s population
resides on the Eastern Slope.26
This is one reason why the projected water gap for the Front Range region
is so large.
24
Colorado Division of Water Resources, "A Summary of Compacts and Litigation Governing Colorado’s Use of Interstate Streams," 2006,
water.state.co.us/DWRIPub/Documents/compactsreport.pdf, 3. 25
Ibid. 26
Colorado Water Conservation Board, "Water Management: Water Supply Planning," Colorado Water Conservation Board,
http://cwcb.state.co.us/water-management/water-supply-planning/Pages/main.aspx (accessed December 14, 2011).

9
Groundwater
Groundwater27
supplies 18 percent of the water used in Colorado. Nineteen of the 63 Colorado
counties rely completely on groundwater for its domestic use. The agricultural industry uses an estimated
96 percent of the state’s groundwater, because in many parts of Colorado, surface water is not available
for irrigation.28
The South Platte Basin uses an estimated 600,000 AF of groundwater a year, the majority
of which is for irrigation (about 500,000 AFY), while the rest it for municipal and industrial consumption.
The region’s aquifers29
include the South Platte Alluvial Aquifer and the Denver Basin Aquifers.30
Counties in the Eastern Plains region are the largest consumers of groundwater, where there is little
surface water and high agricultural production. Larimer County’s groundwater withdrawals are
consistent with the state’s average of about 18 percent.31
Increasing Water Supply
Closing the city’s water gap can be accomplished by reducing demand for water, or by creating
more supply, through water development projects. Water development projects have been a source of
contention in the past, where suggestions have been presented to develop the Colorado River Basin for
the Front Range region. The South Platte Basin roundtable “believes that there is some available water to
be developed from the Colorado River Basin, and that all of Colorado needs to work together to
successfully develop it.”32
The amount of available water in the Colorado River Basin has not yet been
27
Groundwater: water that flows or seeps downward and saturates soil or rock, supplying springs and wells. 28
Ground Water Protection Council, "Colorado Ground Water Conditions," Ground Water Protection Council, 2007, http://gwpc.org/e-
library/documents/state_fact_sheets/colorado.pdf (accessed January 24, 2012), 11. 29
Aquifer: a geologic formation(s) that is water bearing. A geological formation or structure that stores and/or transmits water, such as to wells
and springs. Use of the term is usually restricted to those water-bearing formations capable of yielding water in sufficient quantity to
constitute a usable supply for people's uses. 30
Statewide Water Supply Initiative. Colorado Water Conservation Board. Colorado Department of Natural Resources, "South Platte Basin
Needs Assessment Report," Draft Report (2011), 1-1. 31
Colorado Geological Survey, "Distribution of ground-versus surface-water withdrawals by county in 1995," Ground Water Atlas of Colorado,
1995, http://geosurvey.state.co.us/apps/wateratlas/images/jpeg.gif (accessed January 24, 2012). 32
Statewide Water Supply Initiative. Colorado Water Conservation Board. Colorado Department of Natural Resources, "South Platte Basin
Needs Assessment Report," Final Report (2011), 8-3.

10
quantified, and to date there is disagreement between basins about whether or not water will be
transported across the state to accommodate for urban growth.33
Water development projects, such as construction of dams and reservoirs, are often the response
to population growth. In recent years, this has proven to be a difficult method of creating supply, because
of environmental considerations. Additionally, the origin of the supply can cause disagreement, which
makes the process political.34
Finally, several basins in Colorado are at or near development capacity.35
Because of the environmental and political difficulties of water development projects, agriculture-to-
municipal transfers are viewed as an alternative possibility. However, in order for these transfers to be
successful, storage is needed to allow this seasonal supply to be used year-round.36
Fort Collins is planning to expand the Halligan Reservoir to increase its supply by an estimated
12,000 AF storing capacity. This project is in cooperation with the other local districts that provide water
to users in Larimer County. The estimated cost for the city is around $14 million, if the permit is granted
by the U.S. Corps of Engineers and complies with the requirements set forth by the National
Environmental Policy Act (NEPA).37
This analysis recognizes the need to increase water supply in the
region. However, the Water Supply and Demand Management Policy, Resolution 2003-104, which
included this project, was adopted by the city council in September of 2003,38
and the project has not yet
begun eight years later. This illustrates that water development projects, especially in the Front Range
region of Colorado, tend to be slow moving and expensive. For these reasons, this analysis will only be
focusing on decreasing demand. Although a balance between decreasing demand and increasing supply
is necessary for future growth, water development projects are outside the scope of this report.
33
For a more in-depth discussion of the history of transferring water from the West Slope to the East Slope of Colorado, see Peter D. Nichols,
Megan K. Murphy and Douglas S. Kenney, "Water and Growth in Colorado: A Review of Legal and Policy Issues," Natural Resource Law
Center, University of Colorado School of Law (2001). 34
Peter D. Nichols, Megan K. Murphy and Douglas S. Kenney, "Water and Growth in Colorado: A Review of Legal and Policy Issues," Natural
Resource Law Center, University of Colorado School of Law (2001), xii. 35
Ibid. 36
Statewide Water Supply Initiative. Colorado Water Conservation Board. Colorado Department of Natural Resources, "South Platte Basin
Needs Assessment Report," Final Report (2011), 8-4. 37
The City of Fort Collins Utilities, "Halligan Reservoir Enlargement: Update," The City of For Collins, http://www.fcgov.com/utilities/what-
we-do/water/halligan-reservoir-enlargement-project/update (accessed November 28, 2011). 38
Ibid.

11
Population Growth in Colorado
The state of Colorado’s population has grown substantially over the last six decades, and is
projected to almost double by 2050.39
Chart 1 illustrates that by 2040, the State Demography Office
estimates that the population of Colorado will be 7,919,867.40 It is projected that the Arkansas, Metro,
and South Platte Basins, which make up the Front Range region of the state, will continue to have the
largest populations. The West Slope will in fact grow at a faster rate than the Front Range, but will have
less of an impact given the vast difference in total population.41
Excluding all other factors, population
growth alone will increase water scarcity within the next few decades.
Chart 1: Colorado Population and Population Projections from 1950 to 2040 42 43
39
Statewide Water Supply Initiative. Colorado Water Conservation Board. Colorado Department of Natural Resources, "South Platte Basin
Needs Assessment Report," Draft Report (2011), 4-3. 40
State Demography Office, "Population Totals for Colorado and Sub-state Regions: Historical Census – years (1790 to 2010)," Colorado
Department of Local Affairs, 2012, https://dola.colorado.gov/demog_webapps/hcp_parameters.jsf (accessed January 6, 2012). 41
Statewide Water Supply Initiative. Colorado Water Conservation Board. Colorado Department of Natural Resources, "South Platte Basin
Needs Assessment Report," Draft Report (2011), 4-3. 42
State Demography Office, "Population Totals for Colorado and Sub-state Regions: Historical Census – years (1790 to 2010)," Colorado
Department of Local Affairs, 2012, https://dola.colorado.gov/demog_webapps/hcp_parameters.jsf (accessed January 6, 2012). 43
State Demography Office, "Population Totals for Colorado Counties: Population Forecasts - years (2000 to 2040)," Colorado Department of
Local Affairs, 2012, http://www.colorado.gov/cs/Satellite?c=Document_C&childpagename=DOLA-
Main%2FDocument_C%2FCBONAddLinkView&cid=1251593369324&pagename=CBONWrapper (accessed January 6, 2012).
0
1,000,000
2,000,000
3,000,000
4,000,000
5,000,000
6,000,000
7,000,000
8,000,000
9,000,000
Population
PopulationProjection

12
Colorado’s Climate
Climate change will be an important factor in determining Colorado’s future water supply. In
Colorado, temperatures have increased an estimated 2o F between 1977 and 2006, which clearly affects
both the supply and demand of water resources. Climate models predict an increase in average annual
temperature between 2.5o F and 4
o F by 2050.
44 However, it is difficult to predict how climate change in
Colorado will affect precipitation. There is no consensus on whether average precipitation will increase
or decrease by 2050.45
Despite not knowing the consequences of climate change, snow pack, runoff, and
droughts will all be altered. Although climate change will be an important determiner of Colorado’s
future water supply, its effects are uncertain, and will not be estimated in this report.
South Platte Basin
The South Platte Basin covers the northeast region of Colorado, and is approximately 22,000
square miles. The largest cities in this region are Boulder, Fort Collins, Longmont, and Greeley. Similar
to the state as a whole, the population is projected to double by 2050, bringing the total to between 1.8
and 2.1 million people. The Metro Basin, which includes Denver, is a subset of the South Platte Basin.
Together, these basins are projected to reach 6 million people by 2050. These two basins account for 70
percent of jobs in Colorado and 60 percent of all Colorado revenues. Furthermore, both basins have a
strong agricultural sector, further increasing the demand for water in the region.46
Major Water Stakeholders
Many industries have a stake in Colorado’s future water supply. Although an in-depth analysis of
all the various stakeholders is outside the scope of this report, this section will briefly acknowledge two:
the agricultural sector and the oil and gas industry. Throughout history, agriculture has played a
44
University of Colorado at Boulder. Western Water Assessment., Climate Change in Colorado: A Synthesis to Support Water Resource
Management and Adoption, (Colorado Water Conservation Board, 2008), 32. 45
Ibid., 35. 46
Statewide Water Supply Initiative. Colorado Water Conservation Board. Colorado Department of Natural Resources., "South Platte Basin
Needs Assessment Report," Draft Report (2011), 1-1.

13
significant role in the culture, development, and economy of Colorado. To this day, agriculture uses more
water than any other stakeholder. The oil and gas industry’s water demand is relatively new, and is
driven by new technological advances in drilling. Although the latter uses a small fraction of the state’s
water, it illustrates how a new industry can change water demand in the future.
Agriculture Water Demand
Future agricultural water demand is just as important as municipal and industrial demand.
Agriculture is a strong economic driver in the state and tied closely to its history and culture. In the South
Platte Basin, agriculture uses approximately 3.2 MAF of water.47
In addition, agriculture is a major
contributor to the region’s economy. In fact, the South Platte Basin diverts 26 percent of the state’s water
and produces 73 percent of the total agricultural sales in the state; meaning agriculture is 19 times as
economically productive as the Colorado River Basin per AF of water.48
Given that agriculture is a main economic contributor in the Basin and uses water more
efficiently than the Colorado River Basin, water transfers from the agricultural sector to the residential
sector will not be explored in this analysis. Furthermore, the decrease in irrigated acres from planned
agricultural-to-municipal transfers in the South Platte Basin (including the Metro Basin) is 19,000 acres
of the total 831,000 acres. This equates to an approximate 2.3 percent decrease.49
These planned water
transfers alone cannot close the water gap in the region.
Oil and Gas Water Demands
Recently, the natural gas industry has become a water stakeholder in Colorado. A new drilling
technique called hydraulic fracturing has become widely used to release natural gas that could not be
captured using traditional drilling methods. Hydraulic fracturing, or “fracking,” uses pressurized water
and chemical additives to crack a shale in order to collect the trapped gas. This extraction process uses
47
Statewide Water Supply Initiative. Colorado Water Conservation Board. Colorado Department of Natural Resources., "South Platte Basin
Needs Assessment Report," Draft Report (2011), 1-2. 48
Peter D. Nichols, Megan K. Murphy and Douglas S. Kenney, "Water and Growth in Colorado: A Review of Legal and Policy Issues," Natural
Resource Law Center, University of Colorado School of Law (2001), 6. 49
Nicole Rowan, Ed Harvey, Meg Frantz and Hal Simpson, state of Colorado Current and 2050 Agricultural Demands, Memorandum (Colorado
Water Conservation Board, 2010), 20.

14
around 3 to 7 MG (9.2 to 21.5 AF) of water per well.50
The Colorado Oil and Gas Conservation
Commission estimates that hydraulic fracturing will require 16,100 AF this year (2012), and by 2015, it
will require 18,700 AF annually.51
Obviously, these values are estimates that depend on variables such as
the price of other energy sources, regulations, technological advances, and other factors.
Similar to all other water users in the state, the oil and gas industry has to adhere to the Colorado
water laws when sourcing water for hydraulic fracturing. There are several ways the industry could
secure water, which include, but are not limited to: transporting water from outside the state; purchasing
irrigation water from landowners; purchasing treated or raw water from water providers; purchasing
waste water from treatment plants; diverting water from wells or aquifers; and reusing or recycling well
construction water.
When oil and gas companies purchase water form a public water provider, instead of a private
landowner, the possible consequences are very different. This is because many people who live in the
Front Range region rely on their local utility to supply them with water. Despite this fact, utilities have
chosen to lease water to private oil and gas companies. Confirmed providers include: Greeley (1,150
AF), Longmont (about 400 AF), Fort Lupton (441 AF), Loveland (amount not disclosed), Frederick (100
AF), Firestone (amount undetermined), South Adams County Water and Sanitation District (amount
undetermined), and Walsenburg (arranged deal for at least 5 AF annually).52
According to Beth
Molenaar, Water Resource Engineer for the City of Fort Collins, Fort Collins has not leased any surplus
water to the oil and gas industry.53
50
Statewide Water Supply Initiative. Colorado Water Conservation Board. Colorado Department of Natural Resources., "South Platte Basin
Needs Assessment Report," Draft Report (2011), 5. 51
Colorado Oil and Gas Conservation Commission, "Water Sources and Demand for the Hydraulic Fracturing of Oil and Gas Wells in Colorado
from 2010 through 2015," January 24, 2012, http://cogcc.state.co.us/Library/Oil_and_Gas_Water_Sources_Fact_Sheet.pdf (accessed February 20, 2012), 2.
52 Bruce Finley, "Fracking of wells puts big demand on Colorado water," The Denver Post, November 23, 2011,
http://www.denverpost.com/news/ci_19395984 (accessed December 10, 2011). 53
Beth Molenaar, interview by Hanna Schum, Email, (December 9, 2011).

15
Background: City of Fort Collins
Fort Collins in located about 65 miles north of Denver in Larimer County. According to the U.S.
Census, in 2010, the population of Fort Collins was 143,986, a 21.4 percent increase since 2000.54
Additionally, about 25,000 students are enrolled at the Colorado State University. Originally, the city
was established for agricultural production, but has since shifted much of this focus to a high-tech
economy.55
Similar to the rest of Colorado, Fort Collins has an arid climate with an average of 15 inches
annual rainfall and 300 days of sunshine per year.56
For this reason, the agricultural sector depends
heavily on irrigation. Fort Collins’ water supply comes from the Cache la Poudre River Basin, the
Colorado-Big Thompson Project, which includes the Horsetooth and Halligan Reservoir, and a smaller
portion from the Michigan River Basin that flows into the Cache la Poudre River via the Michigan Ditch
and Joe Wright Reservoir system (see Figure 1).57
The state of Colorado Water Conservation Act of 2004 (HB 1365) requires entities that supply
2,000 AF or more annually to submit a water conservation plan to the CWCB before receiving financial
assistance from the CWCB or the Colorado Water Resources and Power Development Authority.
Although Fort Collins is not currently seeking financial assistance, it voluntarily submitted a conservation
plan to the CWCB in 2009, outlining a goal to reduce demand from approximately 160 gpcd to 140 gpcd
by 2020.58
54
U.S. Census Bureau, "State & County Quick Facts: Fort Collins (city), Colorado," U.S. Census Bureau, October 18, 2011,
http://quickfacts.census.gov/qfd/states/08/0827425.html (accessed December 15, 2011). 55
Peter Mayer, Laurie D’Audney and Dennis Bode, Water Conservation Plan, (Fort Collins: City of Fort Collins Utilities, 2009), 3. 56
Peter Mayer, Laurie D’Audney and Dennis Bode, Water Conservation Plan, (Fort Collins: City of Fort Collins Utilities, 2009), 3. 57
Ibid., 6. 58
Ibid., 19.

16
Figure 1: City of Fort Collins' Water Supply System59
PROPOSED SOLUTIONS
There are four general methods used in Fort Collins’ water conservation plan for RSF households,
which include:
1. Education and Outreach;
2. Incentives and Rebates;
3. Regulatory Measures; and
4. Tiered Rate Structure.
The first three policy options are all non-price methods, while a Tiered Rate Structure uses a pricing
mechanism to reduce water consumption. This analysis will compare the advantages and disadvantages
59
Peter Mayer, Laurie D’Audney and Dennis Bode, Water Conservation Plan, (Fort Collins: City of Fort Collins Utilities, 2009), 8.
17
associated with each policy option. For the purpose of consistency, the most recent recorded year, 2010,
will be used when comparing each policy.
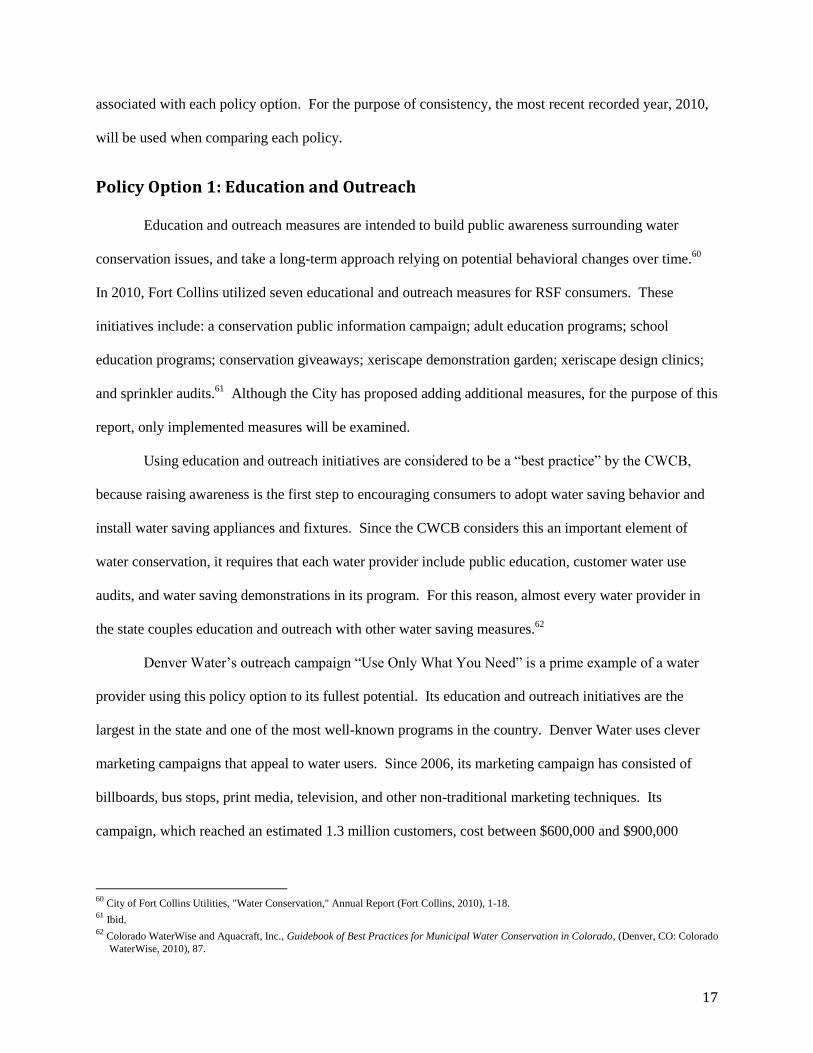
Policy Option 1: Education and Outreach
Education and outreach measures are intended to build public awareness surrounding water
conservation issues, and take a long-term approach relying on potential behavioral changes over time.60
In 2010, Fort Collins utilized seven educational and outreach measures for RSF consumers. These
initiatives include: a conservation public information campaign; adult education programs; school
education programs; conservation giveaways; xeriscape demonstration garden; xeriscape design clinics;
and sprinkler audits.61
Although the City has proposed adding additional measures, for the purpose of this
report, only implemented measures will be examined.
Using education and outreach initiatives are considered to be a “best practice” by the CWCB,
because raising awareness is the first step to encouraging consumers to adopt water saving behavior and
install water saving appliances and fixtures. Since the CWCB considers this an important element of
water conservation, it requires that each water provider include public education, customer water use
audits, and water saving demonstrations in its program. For this reason, almost every water provider in
the state couples education and outreach with other water saving measures.62
Denver Water’s outreach campaign “Use Only What You Need” is a prime example of a water
provider using this policy option to its fullest potential. Its education and outreach initiatives are the
largest in the state and one of the most well-known programs in the country. Denver Water uses clever
marketing campaigns that appeal to water users. Since 2006, its marketing campaign has consisted of
billboards, bus stops, print media, television, and other non-traditional marketing techniques. Its
campaign, which reached an estimated 1.3 million customers, cost between $600,000 and $900,000
60
City of Fort Collins Utilities, "Water Conservation," Annual Report (Fort Collins, 2010), 1-18. 61
Ibid. 62
Colorado WaterWise and Aquacraft, Inc., Guidebook of Best Practices for Municipal Water Conservation in Colorado, (Denver, CO: Colorado
WaterWise, 2010), 87.

18
annually, since 2006.63
Although Denver Water’s efforts have been publicized, there are some
disadvantages to investing in public education and outreach, which is discussed in more detail in the
following sections.
Policy Option 1: Advantages
Education and Outreach does not force any customers to conserve water; it merely serves as a
method of influencing consumer behavior. Because of this, equity is not an issue with this policy option
and there are no direct costs for the customer. In addition, Education and Outreach reaches a greater
audience than both Incentives and Rebates, and Regulatory Measures. All customers are exposed to this
policy in some way. For example, bill inserts are sent to each customer, which makes this policy option
far reaching. Policy Option 4: Tiered Rate Structure is the only other policy that has the ability to reach
the entire customer base. Finally, public education and outreach is politically feasible, because water
conservation is voluntary and every customer is exposed to the same information.64
Policy Option 1: Disadvantages
The lack of evidence on the impact of education and outreach programs is the main disadvantage of
this policy option. Even the CWCB states that water providers should not rely on any water savings from
education and outreach alone.65
Research has shown that education programs are only modestly
beneficial.66
Although non-price conservation measures, such as education and outreach programs, have
been implemented by utilities across the country, there is little evidence proving that they are effective at
reducing water demand.67
63
Colorado WaterWise and Aquacraft, Inc., Guidebook of Best Practices for Municipal Water Conservation in Colorado, (Denver, CO: Colorado
WaterWise, 2010), 90-92. 64
Sheila M. Olmstead and Robert N. Stavins, "Comparing Price and Non-price Approaches to Urban Water Conservation ," Fondazione Eni
Enrico Mattei , no. 225 (September 2008): 28. 65
Colorado WaterWise and Aquacraft, Inc., Guidebook of Best Practices for Municipal Water Conservation in Colorado, (Denver, CO: Colorado
WaterWise, 2010), 90. 66
Douglas S. Kenney, Christopher Goemans, Roberta Klein, Jessica Lowrey and Kevin Reidy, "Residential Water Demand Management:
Lessons From Aurora, Colorado," Journal of American Water Resources Association 44, no. 1 (February 2008): 195. 67
Ari M. Michelsen, Thomas J. McGuckin and Donna Stumpf, "Nonprice Water Conservation Programs as a Demand Management Tool,"
Journal of the American Water Resource Association 35, no. 3 (June 1999): 594.

19
The second disadvantage is the cost of implementation. Knowing that education and outreach must
be multifaceted and far reaching to receive any benefits, Fort Collins has implemented several initiatives.
However, this policy option is costly to implement and decreases revenue, which is not ideal for a city
with probable future budget deficits.
At first glance, a program such as Denver Water’s appears to be relatively cost-effective. It
reaches approximately 1.3 million customers, which costs them less than a dollar per customer per year.68
The problem with this point-of-view is that there are no measurable benefits associated with Denver
Water’s campaign. Furthermore, the amount of appliance rebates or free water-efficient fixtures that
could be provided to Denver Water’s customers in place of this extensive marketing campaign is
astounding. For example, the city could give out 12,000 to 18,000 water-efficient clothes washer rebates
of $50 instead. This is just one example illustrating a need to compare the effectiveness of various
programs.
Policy Option 2: Incentives and Rebates
Fort Collins’ incentive and rebate program includes: HECW rebates, HET rebates, HED rebates,
zero-interest loans for conservation, and sprinkler equipment rebates. All of these measures were utilized
in 2010, totaling 3,143 rebates and loans, amounting to $121,333 (see Table 4).69
Additionally, the City
participated in the Larimer County Youth Corps retrofit program, which installed showerheads, faucet
aerators, toilet tank bags, and shower timers in low-income homes at no charge. The Youth Corps
estimated the showerheads and faucet aerators resulted in water saving of 2.4 MG annually.70
This
number could be an overestimate, given that a study done in Boulder, Colorado, found that showerhead
replacement had no statistically significant effect on water use.71
68
Colorado WaterWise and Aquacraft, Inc., Guidebook of Best Practices for Municipal Water Conservation in Colorado, (Denver, CO: Colorado
WaterWise, 2010), 90-92. 69
City of Fort Collins Utilities, "Water Conservation," Annual Report (Fort Collins, 2010), 5-6. 70
Ibid., 6. 71
Aquacraft Water Engineering and Management, ""Project Report: Measuring Actual Retrofit Savings and Conservation Effectiveness Using
Flow Trace Analysis"," Prepared for the City of Boulder, Colorado, Utilities Division, Office of Water Conservation (1996).

20
Table 4: City of Fort Collins Utilities’ 2010 Incentives and Rebates Provided to Customers72
Rebate/Incentive Rebate/Incentive
Amount Quantity
Total Amount
Spent
ENERGY STAR® Certified Clothes Washer
Rebate $50 1,249 $62,450
WaterSense Toilet Rebate $35 497 $17,395
Recycling Old Toilet Rebate $15 440 $6,600
ENERGY STAR® Certified Dishwasher
Rebate $25 780 $19,500
Zero-Interest Loan for Clothes Washers and
Water Line Replacement n/a 13 $15,388
Sprinkler Equipment Rebate $15-$150 164 n/a
Total 3,143 $121,333
High-efficiency retrofits and appliance rebates are a commonly used conservation tool by
municipalities.73
The CWCB places high-efficiency fixtures and appliance rebates in its list of best
practices, stating that Colorado has a significant opportunity for indoor water use conservation.74
The
average indoor RSF household’s water consumption is used by toilets (26.7%), showers (16.8%), faucets
(15.7%), clothes washers (15%), leaks (13.7%), other domestic uses (2.2%), baths (1.7%), and
dishwashers (1.4%).75
Replacing appliances and fixtures such as toilets, showerheads, faucets, and
clothes washers, with more efficient technologies can lead to substantial long-term water savings.
Policy Option 2: Advantages
The major advantage with high-efficiency appliance and retrofit rebates is that the effectiveness
of the program is easier to estimate than Education and Outreach, and Regulatory Measures. In this case,
Fort Collins was able to track the amount spent on rebates and the projected water savings associated with
the program. Additionally, the water savings from this policy option are long-term. For example, if Fort
Collins had to cut all education and outreach measures, the water savings provided by those initiatives
72
City of Fort Collins Utilities, "Water Conservation," Annual Report (Fort Collins, 2010), 5. 73
Lori S. Bennear, Jonathan M. Lee and Laura O. Taylor, "PARTICIPATION INCENTIVES, REBOUND EFFECTS AND THE COST-
EFFECTIVENESS OF REBATES FOR WATER-EFFICIENT APPLIANCES," Duke Environmental Economics Working Paper No. 11-10
(2011), 1. 74
Colorado WaterWise and Aquacraft, Inc., Guidebook of Best Practices for Municipal Water Conservation in Colorado, (Denver, CO: Colorado
WaterWise, 2010), 158. 75
Amy Vic, Handbook of water use and conservation: [homes, landscapes, businesses, industries, farms] (Amherst, Massachusetts: Waterplow
Press, 2001), 15.
21
would probably decrease. Oppositely, once appliances and fixtures are replaced, benefits will be realized
for the lifetime of the product.
The return on investment for households can be better than initially presumed, because of
reductions in energy and wastewater. Fixture and appliance replacement can result in a reduction of
household energy consumption, because high-efficiency technologies such as dishwashers, clothes
washers, faucets and showerheads all use hot water, therefore a reduction in water leads to a reduction in
energy. Some water providers charge customers for wastewater. This cost will also decrease with
decreased water use.76
Policy Option 2: Disadvantages
One disadvantage to high-efficiency appliances is that there may be a rebound effect (also
referred to as a take-back effect). The rebound effect refers to the potential increased use of the given
resource, associated with a decrease in the cost of the service provided by the new appliance. For
example, decreasing the cost of washing clothes will lead to more loads being washed more frequently.77
This behavioral change can also take place for other reasons besides a decreasing cost of service.
Unsatisfactory waste removal capabilities of high-efficiency toilets or cleaning capabilities of clothes
washers and dishwashers can also result in a rebound effect. Regardless of the reason, water savings seen
from high-efficiency appliances will be lower than engineering estimates suggest.78
However, the
rebound effect is difficult to estimate. A study done in North Carolina of 683 households concluded that
there was no rebound effect seen in HET.79 Although the specific rebound effect is unknown for
water-efficient appliances in Fort Collins, it is likely that one exists, which would cause the estimated
water savings of this policy option to be high. Unfortunately, the rebound effect in Fort Collins cannot
be obtained, but this issue can be considered when evaluating the efficiency of this policy
76
Colorado WaterWise and Aquacraft, Inc., Guidebook of Best Practices for Municipal Water Conservation in Colorado, (Denver, CO: Colorado
WaterWise, 2010), 165. 77
Lori S. Bennear, Jonathan M. Lee and Laura O. Taylor, "PARTICIPATION INCENTIVES, REBOUND EFFECTS AND THE COST-
EFFECTIVENESS OF REBATES FOR WATER-EFFICIENT APPLIANCES," Duke Environmental Economics Working Paper No. 11-10
(2011), 2-3. 78
Ibid., 3. 79
Ibid., 3-4.

22
A second disadvantage of rebates and retrofits is the fact that many customers are likely to
purchase water-efficient technologies without the rebate.80
This does not affect the amount of water
conserved by the technologies, but does challenge the cost-effectiveness of the program. If Fort Collins
did not offer rebates to customers in 2010, how many of them would have bought those appliances
anyway? In a study done in North Carolina, the authors concluded that 47 percent of the households
would have bought a high-efficiency toilet, even without a rebate.81
This, however, may vary greatly
depending on factors such as weather in the region, household income, and other conservation measures,
such as educational programs, which reinforce the need for conservation. Therefore, conclusions drawn
from a study done in North Carolina cannot be directly used for Fort Collins.
Policy Option 3: Regulatory Measures
In 2010, Fort Collins implemented two RSF regulatory measures, which included: a wasting
water ordinance, and a soil amendment ordinance. Both were utilized to deter water waste and encourage
efficiency.
The wasting water ordinance refers to investigating complaints by the community under the Fort
Collins Municipal Code wasting water ordinance. In 2010, 26 complaints were investigated. The soil
amendment ordinance requires builders to add organic matter to the soil before planting turf grass to
increase root depth and water penetration.82
This is enforced through a visual inspection of each property.
Fort Collins did not state the outcome of these investigations and inspections, nor the projected price or
water savings from each initiative;83
therefore, estimates from the City of Greeley and Denver Water are
used in the CBA (refer to Policy Option 2: Cost-Benefit Analysis for more information).
Mandatory or regulatory measures, as compared with rate structures, use a command-and-control
model to limit water consumption. Some common regulatory measures, not utilized by Fort Collins,
80
Lori S. Bennear, Jonathan M. Lee and Laura O. Taylor, "PARTICIPATION INCENTIVES, REBOUND EFFECTS AND THE COST-
EFFECTIVENESS OF REBATES FOR WATER-EFFICIENT APPLIANCES," Duke Environmental Economics Working Paper No. 11-10
(2011), 3. 81
Ibid., 4. 82
City of Fort Collins Utilities, "Water Conservation," Annual Report (Fort Collins, 2010), 7. 83
Ibid., 8.

23
include restrictions on the total quantity of water used in a billing cycle, and restrictions on particular
water uses, such as lawn watering and car washing. The empirical evidence is mixed regarding the
impact of these programs on reducing water consumption.84
It is difficult to measure the impact of
regulatory programs, because they are often times combined with several other water conservation
measures.85
Kenney, et al., notes, “the response of households to changes in price is likely to differ when
restrictions are in place.”86
This is important when comparing the efficiency of different water
conservation methods. If water restrictions lessen the effectiveness of a price increase, then the two
measures are working against each other.
Policy Option 3: Advantages
Because of the enforcement and administrative costs, command-and-control models have
received criticism for their lack of efficiency. This, however, is a debated topic among scholars, because
unlike the other policy options, regulatory policy is the only one that provides a certain outcome.87
This
analysis makes the assumption that because regulatory measures can provide more certainty, many
utilities continue to use them when implementing water conservation programs, despite high
administrative costs.
Policy Option 3: Disadvantages
The main argument against regulatory water conservation measures is that they require
monitoring and enforcement.88
Unlike the other three policy options, in order for this policy to work
effectively, the utility provider must enforce these measures.89
Fort Collins has not implemented water
restrictions, and instead has a wasting water ordinance. Since enforcement of this regulation is only
84
Sheila M. Olmstead and Robert N. Stavins, "Managing Water Demand: Price vs. Non-Price Conservation Programs," Pioneer Institute for
Public Policy Research, no. 39 (July 2007): 29. 85
Douglas S. Kenney, Christopher Goemans, Roberta Klein, Jessica Lowrey and Kevin Reidy, "Residential Water Demand Management:
Lessons From Aurora, Colorado," Journal of American Water Resources Association 44, no. 1 (February 2008): 192-207. 86
Ibid. 87
Heather E. Campbell, Ryan M. Johnson and Elizabeth Hunt Larson, "Prices, Devices, People, or Rules: The Relative Effectiveness of Policy
Instruments in Water Conservation," Review of Policy Research 21, no. 5 (2004): 640. 88
Sheila M. Olmstead and Robert N. Stavins, "Managing Water Demand: Price vs. Non-Price Conservation Programs," Pioneer Institute for
Public Policy Research, no. 39 (July 2007): 5. 89
Colorado WaterWise and Aquacraft, Inc., Guidebook of Best Practices for Municipal Water Conservation in Colorado, (Denver, CO: Colorado
WaterWise, 2010), 81.

24
initiated by complaints from neighbors, the cost of enforcement is relatively low compared to programs
that have implemented watering restrictions. For example, in 2010, only 26 complaints were investigated
in Fort Collins. Denver Water, on the other hand, employs water use enforcement officers to uphold its
strict seasonal water restrictions. The tradeoff between different levels of enforcement is that Denver
Water’s regulatory measures, although more costly, reach a greater population.
The other disadvantage is that regulatory measures alone are unlikely to reach the goal of
reducing RSF use to 130 gpcd. Additionally, the water savings associated with regulatory measures are
very difficult to track, and the effectiveness of this policy option cannot be easily determined. Because of
this, Fort Collins should not depend on regulatory measures to reduce their demand by enough to account
for future population growth.
Policy Option 4: Tiered Rate Structure
In 2003, Fort Collins changed its rate structure to encourage water conservation. Up until then,
residential customers paid a set rate per 1,000 gallons no matter how much the household used. Fort
Collins Utilities believes that this economic incentive for residents to use water more efficiently has
proven to be an effective method at reducing water demand.90
A three-tiered rate structure is used for
RSF households, meaning customers pay a base charge per household with a cost per 1,000 gallons of
water, which increases in price at a 7,000- and 13,000-gallon mark.91
Each year, both the base price and
each tier price increase by three percent (see Table 5).
90
City of Fort Collins Utilities, "Water Conservation," Annual Report (Fort Collins, 2010), 5. 91
City of Fort Collins Utilities, Single-family and Duplex Water Rates, http://www.fcgov.com/utilities/residential/rates/water (accessed
December 26, 2011).

25
Table 5: Monthly Residential Single-Family Water Rates (2011)92
Monthly Single-Family Water Rates
Base Charge $14.42
Tier Volume Charge, per 1,000 Gallons
1 0-7,000 Gallons $2.23
2 7,001-13,000 Gallons $2.56
3 Over 13,000 Gallons $2.95
Utilities can use several pricing options for residential customers. First, water can be metered or
unmetered. If a household is unmetered, it is charged a flat rate regardless of how much water it
consumes.93
In this case, households are encouraged to consume water until their own marginal benefit of
water consumption is driven down to zero, which does not encourage water conservation.94
Typically,
when communities move to metered pricing, water consumption drops dramatically.95
Since 2005, all
Colorado water providers serving more than 600 taps are required to meter all customers (Colorado
Revised Statutes 37-97-103 “Water Metering Act”).96
Given that most Colorado households are already
metered, the majority of savings from this mechanism has already been realized.
Once metered, utilities have several pricing options. First, residents can pay a set rate per unit of
water consumed (typically 1,000 gallons). Compared to a flat rate unmetered system, residents are more
likely to use less water, because their charges increase as consumption increases. Until 2003, Fort Collins
used this pricing scheme.
Rate structures that encourage conservation are either tiered (also called increasing block
pricing), or seasonal. Under a tiered rate structure, the marginal price of water depends on the quantity
92
City of Fort Collins Utilities, Single-family and Duplex Water Rates, http://www.fcgov.com/utilities/residential/rates/water (accessed
December 26, 2011). 93
Sheila M. Olmstead and Robert N. Stavins, "Managing Water Demand: Price vs. Non-Price Conservation Programs," Pioneer Institute for
Public Policy Research, no. 39 (July 2007): 17. 94
Ibid. 95
Ibid. 96
Colorado WaterWise and Aquacraft, Inc., Guidebook of Best Practices for Municipal Water Conservation in Colorado, (Denver, CO: Colorado
WaterWise, 2010), 34.

26
consumed.97
There are two types of tiered rate structures, which include: increasing block price (IBP)
structures, and decreasing block price (DBP) structures. As the name implies, IBP structures charge a
higher marginal price at higher levels of consumption. The block size is usually fixed for one type of
customer (i.e. RSF households). In Colorado, this is one of the most popular rate structures, utilized by
providers such as Fort Collins Utilities, Denver Water, and Colorado Springs Utilities.98
DBP structures work in the opposite direction, offering a discount at higher volumes. Clearly,
only IBP structures incentivize water conservation, while DBP structures are typically used by regions
trying to attract manufacturing industries.99
Subsidizing the price of water to attract certain industries is
unlikely to lead to a positive long-term outcome, because communities with water supply issues attract
these industries, without taking into account future shortages.100
For this reason, some states prohibit
public water utilities from implementing DBP structures.101
A seasonal water rate structure is the other type of water conservation method currently utilized
in the U.S. Seasonal rates typically increase the price in the summer months, when the demand for water
is the highest.102
Economically, this method makes sense. Charging more for a resource during periods
of scarcity signals to customers the need to reduce consumption.
Rate structures are unique to each utility, and it is almost impossible to find two water providers
utilizing the exact same rate structure. Each utility has its own set of revenue requirement and objectives
of its rate structure. Climate, water supply, future population growth, current water use, capital costs,
97
Sheila M. Olmstead and Robert N. Stavins, "Managing Water Demand: Price vs. Non-Price Conservation Programs," Pioneer Institute for
Public Policy Research, no. 39 (July 2007): 17. 98
Colorado WaterWise and Aquacraft, Inc., Guidebook of Best Practices for Municipal Water Conservation in Colorado, (Denver, CO: Colorado
WaterWise, 2010), 37. 99
Sheila M. Olmstead and Robert N. Stavins, "Managing Water Demand: Price vs. Non-Price Conservation Programs," Pioneer Institute for
Public Policy Research, no. 39 (July 2007): 17. 100
Ibid. 101
Ibid., 18. 102
Ibid., 18.
27
among others, all play a role in determining a rate structure.103
Key considerations when designing a rate
structure include:104
1. Sizing blocks appropriately;
2. Setting the block price differential so that it incentivizes conservation;
3. High base service charges can weaken the effect of the block rates; and
4. Billing cycles and water tracking can influence customers’ response to the rate structure.
Setting the price for the blocks in a rate structure is extremely important in order to achieve the
level of intended conservation. Clearly, a water provider could set each block at a price so high that
households would never risk using water at that price level. Since this strategy is not politically feasible,
this report will not be exploring the option of pricing water absurdly high.105
For residential use, the size
of the first tier should be based on the monthly (or bimonthly, depending on the billing cycle) average
indoor use.106
Indoor use is generally viewed as necessary consumption, while outdoor use is not. For
this reason, customers should ideally be able to stay within the first block if they are only using water for
necessary consumption.
The majority of IBP structures have very small incremental increases between each block. For
example, in Fort Collins, the price increase from block one to block two is only 33 cents for every
additional 1,000 gallons of water. This may not be enough to signal to customers that they should reduce
water use.107
Increasing the block differential in Fort Collins may better promote water conservation.
Setting the base charge is complicated in itself. If the base charge is set too high compared to the
block differential, customers may be less likely to conserve water since the incremental price increase
may be small relative to the set amount customers must pay per billing cycle.108
For example, looking at
103
Colorado WaterWise and Aquacraft, Inc., Guidebook of Best Practices for Municipal Water Conservation in Colorado, (Denver, CO:
Colorado WaterWise, 2010), 36. 104
Ibid., 38-39. 105
In the late 1970’s, the City of Tucson, Arizona adopted marginal cost water prices, which increased the cost substantially. One year later, the
entire city council was voted out of office because of the water rate increase. As cited by: Sheila M. Olmstead and Robert N. Stavins, "Comparing price and nonprice approaches to urban water conservation," Water Resources Research 45 (April 2009), 6.
106 Colorado WaterWise and Aquacraft, Inc., Guidebook of Best Practices for Municipal Water Conservation in Colorado, (Denver, CO:
Colorado WaterWise, 2010), 38. 107
Ibid., 39. 108
Ibid., 38.

28
Fort Collins’ tiered rate structure, what if the base charge was $30 dollars instead of about $15? It is
likely that households would be less responsive to a block increase, because that amount relative to the
$30 base charge would be much smaller.
In order for a conservation rate structure to work effectively, the billing cycle must to be prompt
and informational, so that customers notice a change in their water bill and can determine the possible
causes. Monthly billing cycles are more useful than bimonthly or quarterly billing cycles, because it
establishes a relationship for the household between their water use and an increase or decrease in their
bill.109
An example of this is seasonal rates. If a city has a rate structure that increases for three months
in the summer, but only bills their customers bimonthly or quarterly, it does not give them enough time to
respond to the increased price. Consumers will be less likely to associate their increased lawn watering
with their high bill if their billing cycle is too long. Additionally, information included with the bill is
important. Providing households with a history of their usage and comparing them to their neighbors are
two ways to encourage response.110
Policy Option 4: Advantages
The main argument for a tiered rate structure is efficiency. Price-based approaches to water
conservation are more cost-effective than nonprice-based approaches and utilities will typically witness
an increase in total revenue.111
Although utilities are required to cover costs, but are not permitted to
profit from providing water, the extra revenue could be given back to the community in the form of
rebates, educational material, and high-efficiency retrofits, which would benefit the community.
From a societal perspective, rate structures can be very beneficial at accomplishing two main
goals: increasing revenue for the water provider and stabilizing future water use.112
If a water
conservation program can be self-sufficient and not depend on tax revenue, society will be better off. If
109
Colorado WaterWise and Aquacraft, Inc., Guidebook of Best Practices for Municipal Water Conservation in Colorado, (Denver, CO:
Colorado WaterWise, 2010), 38. 110
Ibid. 111
Sheila M. Olmstead and Robert N. Stavins, "Managing Water Demand: Price vs. Non-Price Conservation Programs," Pioneer Institute for
Public Policy Research, no. 39 (July 2007): 5. 112
Colorado WaterWise and Aquacraft, Inc., Guidebook of Best Practices for Municipal Water Conservation in Colorado, (Denver, CO:
Colorado WaterWise, 2010), 44.

29
citizens are already paying for their water, they should not have to pay taxes to fund water conservation
programs. Additionally, self-sufficiency provides greater stability over the long run, because it ensures
that the program can continue to promote conservation even when other programs are being cut.
Policy Option 4: Disadvantages
A strong argument against increasing the price is equity. High-income households tend to be less
responsive to an increase in the price of water. If a community increases the price of water to reduce
demand, the low-income households will unfairly carry the burden of water conservation. Although this
may be the case, there are methods of reducing demand in an equitable manner. First, a tiered rate
structure allows low-income households to remain in a lower price tier if it chooses to do so. It should be
noted that this is only true in RSF households, not multi-family households, because the latter pays a
share of the total household consumption and does not have control over that cost.113
This may be the
reason that Fort Collins’ tiered rate structure is only for RSF households and not multi-family households.
As sub-metering becomes more popular, this may change.
COST-BENEFIT ANALYSIS
The CBA used in this memorandum is an ex ante CBA, which is conducted before program
implementation. This section will compare the net present value (NPV) of each policy option, in order to
evaluate cost-effectiveness. This CBA accounted for the following stakeholders: customers; the City of
Fort Collins Utilities; and the city, county, and state governments.
A CBA was not calculated for Policy Option 1: Education and Outreach for two reasons. First,
throughout Colorado and the U.S., education and outreach initiatives usually accompany other
conservation methods, such as incentive and rebate programs. When considering any method of
residential water conservation, informing the public about the program is crucial to its success, therefore
it could not be considered as a stand-alone policy option in the CBA. Second, there is currently no
113
Sheila M. Olmstead and Robert N. Stavins, "Managing Water Demand: Price vs. Non-Price Conservation Programs," Pioneer Institute for
Public Policy Research, no. 39 (July 2007): 34.
30
accurate approach used to calculate the water savings associated with education and outreach initiatives.
Only costs could be calculated for Policy Option 1, which would be a misrepresentation of its
effectiveness.
Social Discount Rates
An eight-year program is used for all policy options in this CBA. Because it is a multi-year
program, a social discount rate (SDR) is used to make future costs and benefits comparable to current
costs and benefits. This is because of time preference. A simple example illustrating why economists use
discount rates is that a dollar today is worth more to a person than a dollar in the future. The present
value (PV) of the costs and benefits are calculated using the amount of time between now and when the
costs and benefits are incurred.114
Because there is no consensus on what the SDR is for water
conservation, this CBA uses three values for comparison, 5, 7, and 10 percent.
Price Elasticity of Water Demand
Part of setting a tiered rate structure is determining the price elasticity of water demand, or
consumers’ sensitivity to an increase in price. The elasticity of water demand is debated among
scholars.115
Using price as a mechanism to decrease water demand depends on the notion that residential
water demand is not inelastic. A portion of water used by households is for basic needs, while the rest is
used for watering lawns, washing cars, etc. Necessities tend to be relatively inelastic, because people will
pay more for a resource that they depend on for basic survival. On the other hand, water used for
unnecessary tasks are more responsive to price.
The elasticity for residential water demand may be explained by many functions, including: price,
household income, family size, home and lot size, homeowners associations (HOAs), and weather.116
114
U.S. Environmental Protection Agency, Appendix A: Inflation and Discounting Factors, www.epa.gov/oppt/coi/pubs/appa.pdf (accessed
February 28, 2012), A-5. 115 M. Espey, J. Espey and W. D. Shaw, "Price Elasticity of Residential Demand for Water: A Meta-Analysis," Water Resources Research 33, no.
6 (1997): 1369-1374. 116
Sheila M. Olmstead and Robert N. Stavins, "Managing Water Demand: Price vs. Non-Price Conservation Programs," Pioneer Institute for
Public Policy Research, no. 39 (July 2007): 22.

31
Estimates of elasticity are averages and actual numbers can vary greatly from household to household.
High-income households are less sensitive to an increase in price compared to low-income households.
Additionally, price elasticity can increase by 30 percent or more when price information is provided on
water bills.117
For this reason, rate structures vary across communities to account for some of these
variables that impact elasticity.
Considering that there are many different factors that determine price elasticity, and the actual
value for residential water conservation is debated, this CBA uses three different values for price
elasticity, 0.5, 1, and 2, for Policy Option 4: Tiered Rate Structure, to compare the effects of elasticity on
each NPV.
Cost-Benefit Analysis Summary
Each policy option was calculated for the eight-year program from 2012 through 2019. Table 6
shows the comparison of CBA results for each policy option in the form of NPV. The three other criteria
evaluated, RSF gpcd use by 2020, total gallons of water saved in the eight years of implementation, and
total participants influenced by each policy, is included in the detailed sections for each individual policy
option below.
The results of the CBA explain that Policy Option 4: Tiered Rate Structure has a positive NPV
under all three discount rates, using all three values for elasticity. This is because there are no
quantifiable costs associated with this policy option. The policy option with the most negative NPV was
Policy Option 2: Incentives and Rebates.
117
Sheila M. Olmstead and Robert N. Stavins, "Managing Water Demand: Price vs. Non-Price Conservation Programs," Pioneer Institute for
Public Policy Research, no. 39 (July 2007): 25.

32
Table 6: Matrix of the Net Present Value for Each Policy Option118
Total PV Benefits Total PV Costs Total NPV
Policy Option 2: Incentives and Rebates
5% Social Discount Rate $271,779 $2,764,383 ($2,492,604)
7% Social Discount Rate $269,446 $2,743,575 ($2,474,129)
10% Social Discount Rate $266,104 $2,713,781 ($2,447,677)
Policy Option 3: Regulatory Measures
5% Social Discount Rate $93,225 $72,374 ($20,852)
7% Social Discount Rate $92,604 $71,580 ($21,025)
10% Social Discount Rate $91,715 $70,443 ($21,272)
Policy Option 4: Tiered Rate Structure – Price Elasticity of 0.5
5% Social Discount Rate $19,089 $0 $19,089
7% Social Discount Rate $18,733 $0 $18,733
10% Social Discount Rate $18,222 $0 $18,222
Policy Option 4: Tiered Rate Structure – Price Elasticity of 1
5% Social Discount Rate $71,675 $0 $71,675
7% Social Discount Rate $70,335 $0 $70,335
10% Social Discount Rate $68,417 $0 $68,417
Policy Option 4: Tiered Rate Structure – Price Elasticity of 2
5% Social Discount Rate $174,146 $0 $174,146
7% Social Discount Rate $170,891 $0 $170,891
10% Social Discount Rate $166,231 $0 $166,231
118 Refer to Appendices A, B, and C for complete calculations, assumptions, and sources.

33
Policy Option 2: Cost-Benefit Analysis
The CBA for Policy Option 2: Incentives and Rebates resulted in the most negative NPV under
all three discount rates (Table 7).
Table 7: Policy Option 2: Incentives and Rebates NPV
Total PV Benefits Total PV Costs Total NPV
Policy Option 2: Incentives and Rebates
5% Social Discount Rate $271,779 $2,764,383 ($2,492,604)
7% Social Discount Rate $269,446 $2,743,575 ($2,474,129)
10% Social Discount Rate $266,104 $2,713,781 ($2,447,677)
This is because appliances and other water efficient technologies are costly for customers and rebates are
costly for Fort Collins Utilities, relative to the value of water savings. Table 8 presents a summary of the
costs and benefits calculated in this CBA.
Table 8: Policy Option 2: Summary of Costs and Benefits
Costs Benefits
Rebates and zero-interest loans given out by Fort
Collins Utilities.
Increase in tax revenue for city, county, and state
governments.
Labor cost of administering the incentives and
rebates. Water savings for customers.
Cost of appliances or other water-efficient
technologies for the customer.
There are two positive elements of this policy option not represented by the NPV. First, this is the only
policy option that benefits the city, county, and state governments through an increase in tax revenue.
Second, the total water savings associated with this policy is more reliable, given that the estimates are
based on water-efficient technologies and less on behavioral changes.

34
Some assumptions were made in this CBA, which include:
1. There is no rebound (or take-back) effect associated with customers using new water-efficient
technologies;
2. Incentives and rebates increase each year by 10.5% for clothes washers, 17% for
dishwashers, and 14% for all other technologies; and
3. Administering the incentives and rebate program requires a 0.7 full-time equivalent (FTE)
staff member, which would increase each year as the amount of incentives and rebates
increase.
For more information on the calculations made for this policy option, see Appendix A.
Policy Option 2 saves a total of 603,030,500 gallons of
water. This amount would result in a gpcd of approximately 114,
surpassing the goal of 130. Finally, 34,895 participants are
influenced by this policy over the eight-year program. If it were
not for the very negative NPV, this policy option would be favorable.
Policy Option 3: Cost-Benefit Analysis
The CBA for Policy Option 3: Regulatory Measures resulted in a negative NPV under all three
discount rates (see Table 9).
Table 9: Policy Option 3: Regulatory Measures NPV
Total PV Benefits Total PV Costs Total NPV
Policy Option 3: Regulatory Measures
5% Social Discount Rate $93,225 $72,374 ($20,852)
7% Social Discount Rate $92,604 $71,580 ($21,025)
10% Social Discount Rate $91,715 $70,443 ($21,272)
Total Participants: 34,895
Total Water Savings: ~603 MG
GPCD by 2020: 114

35
Regulatory measures usually have high enforcement costs compared to water savings, which was
the case for Fort Collins. Table 10 explains the costs and benefits that were calculated in the CBA.
Table 10: Policy Option 3: Summary of Costs and Benefits
Costs Benefits
Enforcement costs of upholding the wasting water
ordinance. Water savings from water wasting violations.
Enforcement costs of inspecting new developments
under the soil amendment ordinance.
Water savings from adding organic content to soil
before planting turf grass for new developments.
This policy option relied on some significant assumptions, since there was no water savings data
provided by Fort Collins. These assumptions include:
1. Utilities would need 0.6 FTE to enforce this policy option;
2. The number of wasting water violations is the same each year; and
3. The average annual number of new single-family homes built between 2002 and 2006
remains stable through the 8-year program.
Additionally, since Fort Collins did not have estimates of water savings for either measure, data from
other cities were used. The City of Greeley has a similar soil amendment ordinance, so its estimates for
water savings was recalculated and used for Fort Collins. Similarly, water savings for the wasting water
ordinance was calculated using Denver Water’s estimates (see Appendix B).
Although both Policy Option 2 and Policy Option 3 have negative NPVs, each NPV for Policy
Option 3 becomes more positive as the number of program years increase. This is because soil
amendment ordinances have long lasting effects, and increasing organic matter in soil before planting turf
grass on new developments can have significant water savings, with no additional costs from year-to-
year.
Fort Collins only enforced 29 wasting water complaints, which does not significantly reduce
water use. Denver Water, for example, made over 5,000 stops in 2010, to either reward correct watering
behavior, or issue violations. Although its enforcement costs are presumably much higher, Denver Water
is more likely to change its customers’ behavior, by reaching a greater audience.

36
Policy Option 3 does not reach as many participants as the other two policy options. By 2020, it
is estimated that 25,732 total participants are influenced by this
policy, and 417,030,427 gallons of water is saved. In the final
program year (2019), this policy option reduced water use by
92,577,253, which would result in a gpcd of approximately 139.
Policy Option 4: Cost- Benefit Analysis
The cost-benefit analysis for Policy Option 4: Tiered Rate Structure resulted in a positive NPV
using all three SDRs and values for price elasticity (see Table 11). This is because there are no costs
associated with this policy option. The benefits were calculated based off the value of the water savings.
Table 11 explains that the value for price elasticity has a substantial effect on the final NPV. For
complete calculations, see Appendix C.
Table 11: Policy Option 4: Tiered Rate Structure NPV
Total PV Benefits Total PV Costs Total NPV
Policy Option 4: Tiered Rate Structure – Price Elasticity of 0.5
5% Social Discount Rate $19,089 $0 $19,089
7% Social Discount Rate $18,733 $0 $18,733
10% Social Discount Rate $18,222 $0 $18,222
Policy Option 4: Tiered Rate Structure – Price Elasticity of 1
5% Social Discount Rate $71,675 $0 $71,675
7% Social Discount Rate $70,335 $0 $70,335
10% Social Discount Rate $68,417 $0 $68,417
Policy Option 4: Tiered Rate Structure – Price Elasticity of 2
5% Social Discount Rate $174,146 $0 $174,146
7% Social Discount Rate $170,891 $0 $170,891
10% Social Discount Rate $166,231 $0 $166,231
Total Participants: 25,732
Total Water Savings: ~417 MG
GPCD by 2020: 139

37
By 2020, it is estimated that 54,642 RSF customers will be served (Table 24). The total number
of gallons saved, and the estimated gpcd by 2020 varies with price elasticity. A price elasticity of 0.5
results in a total of 142,855,191 gallons saved, and an
estimated 130 gpcd. A price elasticity of 1 results in
a total of 406,001,012 gallons saved, and an
estimated 116 gpcd. A price elasticity of 2 results in
a total of 864,094,110 gallons saved, and an estimated 93 gpcd. Clearly, this policy option reaches the
goal of reducing gpcd to less than 130 using all three values for price elasticity. If Fort Collins happened
to be more price inelastic than 0.5, then it would have to increase price by more than three percent
annually in order to reach the goal by 2020.
WEAKNESSES AND LIMITATIONS
The weaknesses and limitations in this analysis are primarily associated with lack of available
data for the CBA and assumptions used to make the calculations. Specifically, calculating the water
savings seen from education and outreach, and regulatory measures is difficult, because there is little
research on each measure. Additionally, averages for the cost of water-efficient technologies was used to
calculate the NPV for Policy Option 2, even though there are large price discrepancies from one product
to another. Finally, there is little research on the take-back effect and SDR for water-efficient
technologies. There are estimates for energy conservation, but not for water conservation. This may
change as water becomes scarcer in the U.S.
In Policy Option 2: Incentives and Rebates, the zero-interest loans given out for water line
replacement was not calculated in the CBA. This is because water savings is completely dependent on
the size of the hole in the line, water pressure, and how long the customer goes without fixing it. An
average would not adequately represent the savings, because residents can go a very long time without
noticing a leak, if it is small, or fix it right away, if it is large. For this reason, it was not included in the
CBA.
Total Participants: 54,642
Total Water Savings: ~143 to ~864 MG
GPCD by 2020: 93 to 130

38
The CBA conducted for Policy Option 3: Regulatory Measures relied on recalculating data given
by both the City of Greeley, and Denver Water. This makes the results less reliable than the other
policies. Additionally, water savings estimates given for wasting water ordinances and soil amendments
are variable. There is no definitive water savings associated with wasting water ordinances, because it
relies on behavioral change, which is very difficult to track, unless it is the only water conservation
method being used. The water savings from soil amendment requirements are dependent on the type of
organic matter added, and the type of soil. For these reasons, the NPVs for Policy Option 3 are the most
variable.
The last major weakness is not having the exact price elasticity for Fort Collins. In this analysis,
three values were chosen in order to compare what effect each would have on water usage and NPV.
Unfortunately, there are many factors that contribute to price elasticity, and it is possible that none of the
three values in this analysis accurately represent Fort Collins. However, given that Policy Option 4 does
not have any foreseeable costs, as long as price is relatively elastic in Fort Collins, this option would
always result in a positive NPV.
STRATEGIC RECOMMENDATION
Based on the criteria outlined in the Methods section of this report, Policy Option 4: Tiered Rate
Structure is the most cost-effective initiative pursued by Fort Collins Utilities. Considering there no
additional administrative and enforcement costs, using price to signal the scarcity of the water in the
region is the best option for the city moving forward. Although Fort Collins Utilities may want to use a
combination of measures to achieve ideal levels of water savings, under budget constraints or other
barriers, using price to manage demand should be the focus of its conservation plan. That said, for a
tiered rate structure to be effective, consumers need to have a thorough understanding of their water usage
and how the rate structure is designed. Pairing a tiered rate structure with informational bill inserts may
help to achieve greater water savings.

39
Opponents of this recommendation may argue that using a market-based approach to reduce
residential water consumption is not an equitable solution, given that low-income households’ demand is
more elastic, which results in the conservation burden falling on those households. Although this is a
valid point, using a tiered rate structure enables households to remain within the lowest tier, if they prefer
to do so. Additionally, the revenue generation from increasing the price of water could be returned to the
low-income households to balance this inequity.
Although economists typically advocate pricing goods to reflect scarcity, opponents to this policy
option would argue that this theory should not be applied to goods that are considered a necessity. This is
a reasonable concern, but there is one main problem with this argument. The market does not set the
price for water, under any pricing scheme. If the price of water were to be determined completely by the
market, it would be substantially higher. Every utility in the U.S. determines the price of water, and
cannot make a profit above their operating expenses. If a utility decides to use price to reduce water
consumption by implementing the appropriate rate structure, then it is using a more market-based
approach than other non-price measures, but is not completely letting the market dictate the price.
Finally, many other necessities, such as food and fuel, are priced by the market and do reflect scarcity.
Proper water management and planning in Colorado’s Front Range region will be crucial in the
next few decades to accommodate future population growth. In current economic times, when states and
cities are being confronted with major budget cuts, it does not make sense to implement water
conservation measures that add to budget deficits. There are no monetary costs associated with
implementing a tiered rate structure, and the revenue generated could be used to implement other
conservation measures, returned to low-income households, or used for water development projects that
increase supply.
Closing the projected South Platte Basin water gap of 32 to 66 percent by 2050 will require that
all providers take a proactive approach in their own region to reduce water demand. Although using price
as a mechanism to reduce water use may only be the best option for Fort Collins moving forward, all
utilities should be constantly evaluating the effectiveness of their individual programs. If providers in the

40
South Platte Basin are able to close their individual water gaps, then the region as a whole will have a
more sustainable future.

41
REFERENCES
Aquacraft Water Engineering and Management. ""Project Report: Measuring Actual Retrofit Savings and
Conservation Effectiveness Using Flow Trace Analysis"." Prepared for the City of Boulder,
Colorado, Utilities Division, Office of Water Conservation, 1996.
Bennear, Lori S., Jonathan M. Lee, and Laura O. Taylor. "PARTICIPATION INCENTIVES, REBOUND
EFFECTS AND THE COST-EFFECTIVENESS OF REBATES FOR WATER-EFFICIENT
APPLIANCES." Duke Environmental Economics Working Paper No. 11-10 , 2011.
Campbell, Heather E., Ryan M. Johnson, and Elizabeth Hunt Larson. "Prices, Devices, People, or Rules:
The Relative Effectiveness of Policy Instruments in Water Conservation." Review of Policy
Research 21, no. 5 (2004): 637-662.
Cascade Water Alliance. "Cascade WaterSense Toilet Replacement Program: Bellevue, WA." Cascade
Water Alliance. October 12, 2011. (accessed March 12, 2012).
City of Fort Collins City Planning and Community Development. "Trends 2006." City of Fort Collins.
www.fcgov.com/advanceplanning/pdf/trends2006-doc.pdf (accessed March 31, 2012).
City of Fort Collins Utilities. "Halligan Reservoir Enlargement: Update." City of Fort Collins.
http://www.fcgov.com/utilities/what-we-do/water/halligan-reservoir-enlargement-project/update
(accessed November 28, 2011).
—. Single-family and Duplex Water Rates. http://www.fcgov.com/utilities/residential/rates/water
(accessed December 26, 2011).
—. "Water Conservation." Annual Report, Fort Collins, 2010, 1-18.
City of Greeley. "Water Conservation Plan: CIty of Greeley, Colorado." November 20, 2008.
http://www.aquacraft.com/sites/default/files/pub/Mayer-%282008%29-City-of-Greeley-Water-
Conservation-Plan.pdf (accessed March 31, 2012).
Colorado Division of Water Resources. "A Summary of Compacts and Litigation Governing Colorado’s
Use of Interstate Streams." 2006. water.state.co.us/DWRIPub/Documents/compactsreport.pdf.
Colorado Geological Survey. "Distribution of ground- versus surface-water withdrawals by county in
1995." Ground Water Atlas of Colorado . 1995.
http://geosurvey.state.co.us/apps/wateratlas/images/jpeg.gif (accessed January 24, 2012).
Colorado Oil and Gas Conservation Commission. "Water Sources and Demand for the Hydraulic
Fracturing of Oil and Gas Wells in Colorado from 2010 through 2015." January 24, 2012.
http://cogcc.state.co.us/Library/Oil_and_Gas_Water_Sources_Fact_Sheet.pdf (accessed February
20, 2012).
Colorado Water Conservation Board. "Colorado’s Nonconsumptive Needs and Project and Methods
Implementation." Technical Assistance for Basin Roundtables, CWCB, and IBCC, 2011.
—. "Water Management: Water Supply Planning." Colorado Water Conservation Board.
http://cwcb.state.co.us/water-management/water-supply-planning/Pages/main.aspx (accessed
December 14, 2011).

42
Colorado WaterWise and Aquacraft, Inc. Guidebook of Best Practices for Municipal Water Conservation
in Colorado. Denver, CO: Colorado WaterWise, 2010.
D'Audney, Laurie, interview by Hanna Schum. Rebate History (March 23, 2012).
Denver Water. "Solutions 2011." Denver Water. 2011.
http://www.denverwater.org/docs/assets/44EC9CA1-A444-8348-
68E2A8D5BD36DFA4/Solutions2011.pdf (accessed March 31, 2012).
Espey, M., J. Espey, and W. D. Shaw. "Price Elasticity of Residential Demand for Water: A Meta-
Analysis." Water Resources Research 33, no. 6 (1997): 1369-1374.
Finley, Bruce. "Fracking of wells puts big demand on Colorado water." The Denver Post. November 23,
2011. http://www.denverpost.com/news/ci_19395984 (accessed December 10, 2011).
Ground Water Protection Council. "Colorado Ground Water Conditions." Ground Water Protection
Council. 2007. http://gwpc.org/e-library/documents/state_fact_sheets/colorado.pdf (accessed
January 24, 2012).
Kenney, Douglas S., Christopher Goemans, Roberta Klein, Jessica Lowrey, and Kevin Reidy.
"Residential Water Demand Management: Lessons From Aurora, Colorado." Journal of
American Water Resources Association 44, no. 1 (February 2008): 192-207.
Konieczki, A. D., and J. A. Heilman. Water-Use Trends in the Desert Southwest—1950–2000. Scientific
Investigations Report 2004–5148, U.S. Department of the Interior and U.S. Geological Survey,
2004.
Mayer, Peter, Laurie D’Audney, and Dennis Bode. Water Conservation Plan. Fort Collins : City of Fort
Collins Utilities, 2009, 1-49.
Michelsen, Ari M., Thomas J. McGuckin, and Donna Stumpf. "Nonprice Water Conservation Programs
as a Demand Management Tool." Journal of the American Water Resource Association 35, no. 3
(June 1999): 593-602.
Molenaar, Beth, interview by Hanna Schum. Email (December 9, 2011).
Nichols, Peter D., Megan K. Murphy, and Douglas S. Kenney. "Water and Growth in Colorado: A
Review of Legal and Policy Issues." Natural Resource Law Center, University of Colorado
School of Law, 2001.
Olmstead, Sheila M., and Robert N. Stavins. "Comparing Price and Non-price Approaches to Urban
Water Conservation ." Fondazione Eni Enrico Mattei , no. 225 (September 2008): 1-24.
—. "Comparing price and nonprice approaches to urban water conservation." Water Resources Research
45 (April 2009): 1-10.
—. "Managing Water Demand: Price vs. Non-Price Conservation Programs." Pioneer Institute for Public
Policy Research, no. 39 (July 2007): 1-42.
Rowan, Nicole, Ed Harvey, Meg Frantz, and Hal Simpson. State of Colorado Current and 2050
Agricultural Demands. Memorandum, Colorado Water Conservation Board, 2010, 1-30.

43
State Demography Office, "Population Totals for Colorado and Sub-state Regions: Historical Census –
years (1790 to 2010)," Colorado Department of Local Affairs, 2012,
https://dola.colorado.gov/demog_webapps/hcp_parameters.jsf (accessed January 6, 2012).
—. "Population Totals for Colorado Counties." State of Colorado: Department of Local Affairs.
September 2010. http://www.colorado.gov/cs/Satellite?c=Document_C&childpagename=DOLA-
Main%2FDocument_C%2FCBONAddLinkView&cid=1251593369324&pagename=CBONWrap
per (accessed November 2, 2011).
—. "Population Totals for Colorado Counties: Population Forecasts - years (2000 to 2040) ." Colorado
Department of Local Affairs. 2012.
http://www.colorado.gov/cs/Satellite?c=Document_C&childpagename=DOLA-
Main%2FDocument_C%2FCBONAddLinkView&cid=1251593369324&pagename=CBONWrap
per (accessed January 6, 2012).
Statewide Water Supply Initiative. Colorado Water Conservation Board. Colorado Department of Natural
Resourcs. "South Platte Basin Needs Assessment Report." Draft Report, 2011.
—. "South Platte Basin Needs Assessment Report," Final Report, 2011.
U.S. Census Bureau. "State & County Quick Facts: Fort Collins (city), Colorado ." U.S. Census Bureau.
October 18, 2011. http://quickfacts.census.gov/qfd/states/08/0827425.html (accessed December
15, 2011).
U.S. Environmental Protection Agency and U.S. Department of Energy. "Clothes Washers for
Consumers." Energy Star.
http://www.energystar.gov/ia/business/bulk_purchasing/bpsavings_calc/CalculatorConsumerClot
hesWasher.xls?cd09-6557 (accessed March 12, 2012).
—. "Dishwashers for Consumers." Energy Star.
http://www.energystar.gov/ia/business/bulk_purchasing/bpsavings_calc/CalculatorConsumerDish
washer.xls?04d0-7f42 (accessed March 12, 2012).
U.S. Environmental Protection Agency. Appendix A: Inflation and Discounting Factors.
www.epa.gov/oppt/coi/pubs/appa.pdf (accessed Feburary 28, 2012).
—. "Outdoor Water Use." United States Environmental Protection Agency. April 14, 2011.
http://www.epa.gov/WaterSense/pubs/outdoor.html (accessed May 1, 2011).
—. "Sub-surface Drip Irrigation Cost Calculator."
www.epa.gov/osw/conserve/rrr/greenscapes/tools/drip.pdf (accessed March 31, 2012).
—. "Tips for Consumers." United States Environmental Protection Agency. April 14, 2011.
http://www.epa.gov/WaterSense/water_efficiency/cons.html (accessed May 04, 2011).
U.S. Environmental Protection Agency Water Sense. "Toilet." Water Sense. February 2, 2012.
http://www.epa.gov/WaterSense/products/toilets.html (accessed March 31, 2012).
—. "WaterSense® Draft Specification for Weather-Based Irrigation Controllers Supporting Statement."
November 19, 2009. epa.gov/watersense/docs/controller_suppstat508.pdf (accessed March 31,
2012).

44
United States Department of Energy. Domestic Water Conservation Technologies: Using less water and
energy is an investment in a sustainable future. Washington, DC: National Renewable Energy
Laboratory , 2002.
University of Colorado at Boulder. Western Water Assessment. Climate Change in Colorado: A Synthesis
to Support Water Resource Management and Adoption. Colorado Water Conservation Board,
2008.
Vic, Amy. Handbook of water use and conservation : [homes, landscapes, businesses, industries, farms].
Amherst, Massachusetts: Waterplow Press, 2001.

Appendix A
45
Appendix A - Policy Option 2: Incentives and Rebates Calculations
Table 12: Policy Option 2: Incentives and Rebates Costs (Program Year 0)119
Stakeholder
Rebate Amount Quantity Program Year 0
Utilities
ENERGY STAR® Certified Clothes Washer Rebate $50 1249 $62,450
WaterSense Toilet Rebate $35 497 $17,395
Recycling Old Toilet Rebate $15 440 $6,600
ENERGY STAR® Certified Dishwasher Rebate $25 780 $19,500
Zero-Interest Loan for Clothes Washers $796 6 $4,775
Multi-jet Rotating Nozzles Rebate $38 79 $2,963
Weather-Based Controller Rebate $150 41 $6,150
Rain Sensor Rebate $23 44 $990
Total $120,823
Program Costs FTE 120 Labor Costs
ENERGY STAR® Certified Clothes Washer Rebate 0.1 $10,000
WaterSense Toilet Rebate 0.1 $10,000
Recycling Old Toilet Rebate 0.0 $0
ENERGY STAR® Certified Dishwasher Rebate 0.1 $10,000
Zero-Interest Loan for Clothes Washers 0.1 $10,000
Multi-jet Rotating Nozzles Rebate 0.1 $10,000
Weather-Based Controller Rebate 0.1 $10,000
Rain Sensor Rebate 0.1 $10,000
Total Program Costs 0.7 $70,000
Total Utilities Costs $190,823
Product Average Price Rebate Quantity Total
Customers
ENERGY STAR® Certified Clothes Washer $796121 $50 1249 $931,617
WaterSense Toilet $177122 $35 497 $70,634
ENERGY STAR® Certified Dishwasher $584123 $25 780 $435,747
Multi-jet Rotating Nozzles $75124 $38 79 $2,963
Weather-Based Controller $499125 $150 41 $14,299
Rain Sensor $138126 $23 44 $5,060
Total Customer Costs $1,460,319
Total $1,651,142
119
Source for all rebate amount and quantities: City of Fort Collins Utilities, "Water Conservation," Annual Report (Fort Collins, 2010), 1-18. 120
Assumption: Fort Collins estimates that is costs the city 0.1 FTE @ $10,000 annually to administer HET rebates. The same estimate was used
for all other rebates, despite variance in the number of rebates given for each product. Source: Peter Mayer, Laurie D’Audney and Dennis Bode, Water Conservation Plan, (Fort Collins : City of Fort Collins Utilities, 2009), 1-49.
121 Average price for ENERGY STAR® certified clothes washer in 2012 dollars. Source: U.S. Environmental Protection Agency and U.S.
Department of Energy, "Clothes Washers for Consumers," Energy Star,
http://www.energystar.gov/ia/business/bulk_purchasing/bpsavings_calc/CalculatorConsumerClothesWasher.xls?cd09-6557 (accessed March 12, 2012).
122 Average price for WaterSense certified toilet in 2012 dollars. Cascade Water Alliance, "Cascade WaterSense Toilet Replacement Program:
Bellevue, WA," Cascade Water Alliance, October 12, 2011, (accessed March 12, 2012). 123
Average price for ENERGY STAR® certified Dishwasher. Source: U.S. Environmental Protection Agency and U.S. Department of Energy,
"Dishwashers for Consumers," Energy Star,
http://www.energystar.gov/ia/business/bulk_purchasing/bpsavings_calc/CalculatorConsumerDishwasher.xls?04d0-7f42 (accessed March 12,
2012). 124
Average ($50-$100). Source: City of Fort Collins Utilities, "Water Conservation," Annual Report (Fort Collins, 2010), 6. 125
U.S. Environmental Protection Agency Water Sense, "WaterSense® Draft Specification for Weather-Based Irrigation Controllers Supporting
Statement," November 19, 2009, epa.gov/watersense/docs/controller_suppstat508.pdf (accessed Marcg 31, 2012).6. 126
James City County, "Rain Sensor Rebate Facts," James City County,
http://www.jamescitycountyva.gov/bewatersmart/RebatePrograms/Rain%20Sensors/RainSensorsFAQ.html (accessed March 31, 2012).

Appendix A
46
Table 13: Policy Option 2: Incentives and Rebates Costs (Program Year 1 -7) 127
Stakeholder
Rebate Program
Year 1
Program
Year 2
Program
Year 3
Program
Year 4
Program
Year 5
Program
Year 6
Program
Year 7
Utilities
ENERGY STAR® Certified Clothes Washer Rebates $69,007 $76,253 $84,260 $93,107 $102,883 $113,686 $125,623
WaterSense Toilet Rebate $19,830 $22,607 $25,771 $29,379 $33,493 $38,182 $43,527
Recycling Old Toilet Rebate $7,524 $8,577 $9,778 $11,147 $12,708 $14,487 $16,515
ENERGY STAR® Certified Dishwasher Rebate $22,815 $26,694 $31,231 $36,541 $42,753 $50,021 $58,524
Zero-Interest Loan for Clothes Washers $5,444 $6,206 $7,075 $8,065 $9,195 $10,482 $11,949
Multi-jet Rotating Nozzles $3,377 $3,850 $4,389 $5,004 $5,704 $6,503 $7,413
Weather-Based Controller Rebates $7,011 $7,993 $9,111 $10,387 $11,841 $13,499 $15,389
Rain Sensor $1,129 $1,287 $1,467 $1,672 $1,906 $2,173 $2,477
Total Rebate Cost $136,137 $153,466 $173,083 $195,302 $220,482 $249,031 $281,417
Program Costs FTE FTE FTE FTE FTE FTE FTE
ENERGY STAR® Certified Clothes Washer Rebates $11,050 $12,210 $13,492 $14,909 $16,474 $18,204 $20,116
WaterSense Toilet Rebate $11,400 $12,996 $14,815 $16,890 $19,254 $21,950 $25,023
Recycling Old Toilet Rebate $0 $0 $0 $0 $0 $0 $0
ENERGY STAR® Certified Dishwasher Rebate $11,700 $13,689 $16,016 $18,739 $21,924 $25,652 $30,012
Zero-Interest Loan for Clothes Washers $11,400 $13,338 $15,605 $18,258 $21,362 $24,994 $29,243
Multi-jet Rotating Nozzles $11,400 $12,996 $15,205 $17,790 $20,815 $24,353 $28,493
Weather-Based Controller Rebates $11,400 $12,996 $14,815 $17,334 $20,281 $23,729 $27,762
Rain Sensor $11,400 $15,205 $17,790 $20,815 $24,353 $28,493 $33,337
Total Program Cost $79,750 $93,431 $107,740 $124,735 $144,464 $167,374 $193,986
Total Utilities Cost $215,887 $246,896 $280,823 $320,037 $364,946 $416,406 $475,403
Product
Customers
ENERGY STAR® Certified Clothes Washer Rebates $1,029,436 $1,137,527 $1,256,968 $1,388,949 $1,534,789 $1,695,942 $1,874,015
WaterSense Toilet Rebate $80,522 $91,795 $104,647 $119,297 $135,999 $155,039 $176,744
ENERGY STAR® Certified Dishwasher Rebate $509,824 $596,494 $697,898 $816,541 $955,353 $1,117,763 $1,307,782
Multi-jet Rotating Nozzles $3,377 $3,850 $4,389 $5,004 $5,704 $6,503 $7,413
Weather-Based Controller Rebates $16,301 $18,583 $21,185 $24,151 $27,532 $31,386 $35,780
Rain Sensor $5,768 $6,576 $7,497 $8,546 $9,743 $11,107 $12,661
Total Customer Cost $1,645,229 $1,854,826 $2,092,583 $2,362,488 $2,669,119 $3,017,739 $3,414,397
Total $1,861,117 $2,101,722 $2,373,406 $2,682,525 $3,034,065 $3,434,144 $3,889,800
127
Growth of rebates and incentives based off the average of the most recent three years. Clothes washers = 10.5%. Dishwashers = 17%. Average of clothes washers and dishwashers was used for all
others = 14%. Source: Laurie D'Audney, interview by Hanna Schum, Rebate History, (March 23, 2012).

Appendix A
47
Table 14: Policy Option 2: Incentives and Rebates Benefits (Program Year 0) 128
Stakeholder
Product Average Price Quantity Sales Tax Program Year 0
Government
ENERGY STAR® Certified Clothes Washer $796 1249 7.55% $75,052
WaterSense Toilet $177 497 7.55% $6,646
ENERGY STAR® Certified Dishwasher $584 780 7.55% $34,371
Zero-Interest Loan for Clothes Washers Replacement $796 6 7.55% $361
Multi-jet Rotating Nozzles $75 79 7.55% $447
Weather-Based Controller $499 41 7.55% $1,544
Rain Sensor $138 44 7.55% $457
Total $118,878
Product Average Annual
Water Savings Quantity
Gallons Saved
Annually
Total Value of
Water Saved
Customers
ENERGY STAR® Certified Clothes Washer 6542129 1249 8170958 $18,221
WaterSense Toilet 4000130 497 1988000 $4,433
ENERGY STAR® Certified Dishwasher 430131 780 335400 $748
Zero-Interest Loan for Clothes Washers Replacement 6542132 6 39252 $88
Weather-Based Controller 11600133 41 475600 $1,061
Multi-jet Rotating Nozzles 6406134 79 506074 $1,129
Rain Sensor 24061135 44 1058684 $2,361
Total 12573968 $28,040
Total Benefits $146,918
128
Source for all rebates amounts and quantities: City of Fort Collins Utilities, "Water Conservation," Annual Report, 2010), 1-18. 129 Average annual water savings for ENERGY STAR® certified clothes washers. Source: U.S. Environmental Protection Agency and U.S. Department of Energy, "Clothes Washers for Consumers,"
Energy Star, http://www.energystar.gov/ia/business/bulk_purchasing/bpsavings_calc/CalculatorConsumerClothesWasher.xls?cd09-6557 (accessed March 12, 2012). 130 U.S. Environmental Protection Agency Water Sense, "Toilet," Water Sense, February 2, 2012, http://www.epa.gov/WaterSense/products/toilets.html (accessed March 31, 2012). 131 Average annual water savings for ENERGY STAR® certified Dishwasher. Source: U.S. Environmental Protection Agency and U.S. Department of Energy, "Dishwashers for Consumers," Energy
Star, http://www.energystar.gov/ia/business/bulk_purchasing/bpsavings_calc/CalculatorConsumerDishwasher.xls?04d0-7f42 (accessed March 12, 2012). 132 Average annual water savings for ENERGY STAR® certified clothes washers. Source: U.S. Environmental Protection Agency and U.S. Department of Energy, "Clothes Washers for Consumers,"
Energy Star, http://www.energystar.gov/ia/business/bulk_purchasing/bpsavings_calc/CalculatorConsumerClothesWasher.xls?cd09-6557 (accessed March 12, 2012). 133 U.S. Environmental Protection Agency Water Sense, "WaterSense® Draft Specification for Weather-Based Irrigation Controllers Supporting Statement," November 19, 2009,
epa.gov/watersense/docs/controller_suppstat508.pdf (accessed Marcg 31, 2012).6. 134 Assumption: Saves 65% of outdoor watering use (Source: "MP Rotator Water Saving Lawn Sprinklers," Drip Works, http://www.dripworks.com/category/mprot (accessed March 31, 2012) , which
is an average of 27 gpcd (Source Amy Vic, Handbook of water use and conservation: [homes, landscapes, businesses, industries, farms] (Amherst, Massachusetts: Waterplow Press, 2001, 141)), equaling 6,406 gallons annually (27x365x0.65).
135 U.S. Environmental Protection Agency, "Sub-surface Drip Irrigation Cost Calculator," www.epa.gov/osw/conserve/rrr/greenscapes/tools/drip.pdf (accessed March 31, 2012).

Appendix A
48
Table 15: Policy Option 2: Incentives and Rebates Benefits (Program Year 1-7) 136
Stakeholder
Product Program
Year 1
Program
Year 2
Program
Year 3
Program
Year 4
Program
Year 5
Program
Year 6
Program
Year 7
Government
ENERGY STAR® Certified Clothes Washer $82,932 $91,640 $101,263 $111,895 $123,644 $136,627 $150,973
WaterSense Toilet $7,577 $8,637 $9,847 $11,225 $12,797 $14,588 $16,630
ENERGY STAR® Certified Dishwasher $40,214 $47,051 $55,049 $64,408 $75,357 $88,168 $103,156
Zero-Interest Loan for Clothes Washers Replacement $411 $469 $534 $609 $694 $791 $902
Multi-jet Rotating Nozzles $510 $581 $663 $756 $861 $982 $1,119
Weather-Based Controller $1,760 $2,006 $2,287 $2,608 $2,973 $3,389 $3,863
Rain Sensor $521 $594 $677 $771 $879 $1,003 $1,143
Total $133,925 $150,978 $170,320 $192,272 $217,205 $245,547 $277,787
Product Program
Year 1
Program
Year 2
Program
Year 3
Program
Year 4
Program
Year 5
Program
Year 6
Program
Year 7
Customers
ENERGY STAR® Certified Clothes Washer $20,134 $22,249 $24,585 $27,166 $30,019 $33,170 $36,653
WaterSense Toilet $5,054 $5,761 $6,568 $7,488 $8,536 $9,731 $11,093
ENERGY STAR® Certified Dishwasher $875 $1,024 $1,198 $1,402 $1,640 $1,919 $2,245
Zero-Interest Loan for Clothes Washers Replacement $100 $114 $130 $148 $169 $192 $219
Weather-Based Controller $1,209 $1,378 $1,571 $1,791 $2,042 $2,328 $2,654
Multi-jet Rotating Nozzles $1,287 $1,467 $1,672 $1,906 $2,173 $2,477 $2,824
Rain Sensor $2,691 $3,068 $3,498 $3,987 $4,546 $5,182 $5,908
Total $31,350 $35,061 $39,221 $43,888 $49,123 $54,999 $61,596
Total Benefits $165,275 $186,039 $209,541 $236,159 $266,329 $300,547 $339,383
136
Growth of rebates and incentives based off the average of the most recent three years. Clothes washers = 10.5%. Dishwashers = 17%. Average of clothes washers and dishwashers was used for all
others = 14%. Source: Laurie D'Audney, interview by Hanna Schum, Rebate History, (March 23, 2012).

Appendix A
49
Table 16: Policy Option 2: Incentives and Rebates – NPV – SDR 5%
Program Year Year Cost SDR PV Cost Benefit SDR PV Benefit
0 2012 $1,651,142 0% $1,651,142 $146,918 0% $146,918
1 2013 $1,861,117 5% $652,063 $193,315 5% $67,730
2 2014 $2,101,722 5% $270,893 $245,429 5% $31,634
3 2015 $2,373,406 5% $112,538 $303,992 5% $14,414
4 2016 $2,682,525 5% $46,793 $369,832 5% $6,451
5 2017 $3,034,065 5% $19,470 $443,889 5% $2,848
6 2018 $3,434,144 5% $8,107 $527,230 5% $1,245
7 2019 $3,889,800 5% $3,378 $621,065 5% $539
Total $2,764,383 $271,779
Total NPV -$2,492,604
Table 17: Policy Option 2: Incentives and Rebates – NPV – SDR 7%
Program Year Year Cost SDR PV Cost Benefit SDR PV Benefit
0 2012 $1,651,142 0% $1,651,142 $146,918 0% $146,918
1 2013 $1,861,117 7% $639,875 $193,315 7% $66,464
2 2014 $2,101,722 7% $265,829 $245,429 7% $31,042
3 2015 $2,373,406 7% $110,435 $303,992 7% $14,145
4 2016 $2,682,525 7% $45,918 $369,832 7% $6,331
5 2017 $3,034,065 7% $19,106 $443,889 7% $2,795
6 2018 $3,434,144 7% $7,956 $527,230 7% $1,221
7 2019 $3,889,800 7% $3,315 $621,065 7% $529
Total $2,743,575 $269,446
Total NPV -$2,474,129
Table 18: Policy Option 2: Incentives and Rebates – NPV – SDR 10%
Program Year Year Cost SDR PV Cost Benefit SDR PV Benefit
0 2012 $1,651,142 0% $1,651,142 $146,918 0% $146,918
1 2013 $1,861,117 10% $622,424 $193,315 10% $64,652
2 2014 $2,101,722 10% $258,579 $245,429 10% $30,196
3 2015 $2,373,406 10% $107,423 $303,992 10% $13,759
4 2016 $2,682,525 10% $44,666 $369,832 10% $6,158
5 2017 $3,034,065 10% $18,585 $443,889 10% $2,719
6 2018 $3,434,144 10% $7,739 $527,230 10% $1,188
7 2019 $3,889,800 10% $3,225 $621,065 10% $515
Total $2,713,781 $266,104
Total NPV -$2,447,677

Appendix B
50
Appendix B – Policy Option 3: Regulatory Measures Calculations
Table 19: Policy Option 3: Regulatory Measures - Costs
Stakeholder
Program Costs Labor (FTE)137 Labor Cost
Utilities
Wasting Water Ordinance 0.1 $10,000
Soil Amendment Ordinance 0.5 $50,000
Total Utilities Costs $60,000
Total Costs $60,000
Table 20: Policy Option 3: Regulatory Measures - Benefits
Stakeholder
Ordinance Quantity Water Savings Total Water Savings Value of Water Saved
Customers
Wasting Water Ordinance 26 4,756138 123,653 $317
Soil Amendment Ordinance 709139 16,300140 11,556,700 $29,585
Total Customer Benefits $29,902
Total Benefits $29,902
137
Estimates extrapolated from Fort Collins’ FTE estimates for rebates. 138
Denver Water, "Solutions 2011," Denver Water, 2011, http://www.denverwater.org/docs/assets/44EC9CA1-A444-8348-
68E2A8D5BD36DFA4/Solutions2011.pdf (accessed March 31, 2012), 6. 139
The average for new single-family homes built between 2002 and 2006 in Fort Collins was used. Source: City of Fort Collins City Planning
and Community Development, "Trends 2006," City of Fort Collins, www.fcgov.com/advanceplanning/pdf/trends2006-doc.pdf (accessed March 31, 2012), 32.
140 City of Greeley, "Water Conservation Plan: City of Greeley, Colorado," November 20, 2008,
http://www.aquacraft.com/sites/default/files/pub/Mayer-%282008%29-City-of-Greeley-Water-Conservation-Plan.pdf (accessed March 31,
2012), 35.

Appendix B
51
Table 21: Policy Option 3: Regulatory Measures – NPV – SDR 5%
Program Year Year Cost SDR PV Cost Benefit SDR PV Benefit 141
0 2012 $60,000 0.00% $60,000 $29,902 0.00% $29,902
1 2013 $60,000 5.00% $21,022 $59,487 5.00% $20,842
2 2014 $60,000 5.00% $7,733 $89,389 5.00% $11,521
3 2015 $60,000 5.00% $2,845 $119,290 5.00% $5,656
4 2016 $60,000 5.00% $1,047 $149,192 5.00% $2,602
5 2017 $60,000 5.00% $385 $179,094 5.00% $1,149
6 2018 $60,000 5.00% $142 $208,995 5.00% $493
7 2019 $60,000 5.00% $52 $238,897 5.00% $207
Total $93,225 $72,374
Total NPV -$20,852
Table 22: Policy Option 3: Regulatory Measures – NPV – SDR 7%
Program Year Year Cost SDR PV Cost Benefit SDR PV Benefit 142
0 2012 $60,000 0.00% $60,000 $29,902 0.00% $29,902
1 2013 $60,000 7.00% $20,629 $59,487 7.00% $20,452
2 2014 $60,000 7.00% $7,589 $89,389 7.00% $11,306
3 2015 $60,000 7.00% $2,792 $119,290 7.00% $5,551
4 2016 $60,000 7.00% $1,027 $149,192 7.00% $2,554
5 2017 $60,000 7.00% $378 $179,094 7.00% $1,128
6 2018 $60,000 7.00% $139 $208,995 7.00% $484
7 2019 $60,000 7.00% $51 $238,897 7.00% $204
Total $92,604 $71,580
Total NPV -$21,025
Table 23: Policy Option 3: Regulatory Measures – NPV – SDR 10%
Program Year Year Cost SDR PV Cost Benefit SDR PV Benefit 143
0 2012 $60,000 0% $60,000 $29,902 0% $29,902
1 2013 $60,000 10% $20,066 $59,487 10% $19,895
2 2014 $60,000 10% $7,382 $89,389 10% $10,998
3 2015 $60,000 10% $2,716 $119,290 10% $5,399
4 2016 $60,000 10% $999 $149,192 10% $2,484
5 2017 $60,000 10% $368 $179,094 10% $1,097
6 2018 $60,000 10% $135 $208,995 10% $471
7 2019 $60,000 10% $50 $238,897 10% $198
Total $91,715 $70,443
Total NPV -$21,272
141
Assumes water savings for soil amendments continue through the 8-year program, but water wasting ordinances are annual, given they rely on
behavior changes. 142
Assumes water savings for soil amendments continue through the 8-year program, but water wasting ordinances are annual, given they rely on
behavior changes. 143
Assumes water savings for soil amendments continue through the 8-year program, but water wasting ordinances are annual, given they rely on
behavior changes.

Appendix C
52
Appendix C - Policy Option 4: Tiered Rate Structure Calculations
Table 24: Policy Option 4: Tiered Rate Structure- Benefits - Price Elasticity of 0.5
Stakeholder
Customers
Program
Year Year
Population
Served144
RSF
Consumers145
Current
Use (gpcy)
Price
(1,000
gal.)
% Change
in price
Change
in Qd
Total RSF
Annual Use
(gal.)
Annual Change
in Qd (gal.)
Total
Benefit
0 2012 140200 51874 52560 2.23 0% 0 2726497440 0 $0
1 2013 141600 52392 51772 2.30 3% -788 2712417667 -14079773 $32,340
2 2014 143000 52910 50995 2.37 3% -777 2698146826 -14270842 $33,762
3 2015 144400 53428 50230 2.44 3% -765 2683693815 -14453010 $35,219
4 2016 145220 53731 49477 2.51 3% -753 2658449623 -25244192 $63,360
5 2017 146040 54035 48734 2.59 3% -742 2633358926 -25090697 $64,864
6 2018 146860 54338 48003 2.66 3% -731 2608422799 -24936127 $66,398
7 2019 147680 54642 47283 2.74 3% -720 2583642249 -24780549 $67,964
Total -142855190.7 $363,907
144
Peter Mayer, Laurie D’Audney and Dennis Bode, Water Conservation Plan, (Fort Collins: City of Fort Collins Utilities, 2009), 1-49. 145
Assumption: RSF water use remains 37% of total population served by Fort Collins Utilities.

Appendix C
53
Table 25: Policy Option 4: Tiered Rate Structure- Benefits - Price Elasticity of 1
Stakeholder
Customers
Program
Year Year
Population
Served146
RSF
Consumers147
Current
Use (gpcy)
Price
(1,000
gal.)
% Change
in price
Change
in Qd
Total RSF
Annual Use
(gal.)
Annual
Change in Qd
(gal.)
Total
Benefit
0 2012 140200 51874 52560 2.23 0% n/a 2726497440 0 $0
1 2013 141600 52392 50983 2.30 3% -1577 2671111814 -55385626 $127,215
2 2014 143000 52910 49454 2.37 3% -1529 2616595479 -54516336 $128,975
3 2015 144400 53428 47970 2.44 3% -1484 2562946122 -53649356 $130,732
4 2016 145220 53731 46531 2.51 3% -1439 2500175241 -62770881 $157,548
5 2017 146040 54035 45135 2.59 3% -1396 2438863961 -61311280 $158,501
6 2018 146860 54338 43781 2.66 3% -1354 2378981200 -59882761 $159,452
7 2019 147680 54642 42468 2.74 3% -1313 2320496428 -58484773 $160,401
Total -406001012 $1,022,824
Table 26: Policy Option 4: Tiered Rate Structure- Benefits - Price Elasticity of 2
Stakeholder
Customers
Program
Year Year
Population
Served148
RSF
Consumers149
Current
Use (gpcy)
Price
(1,000
gal.)
% Change
in price
Change
in Qd
Total RSF
Annual Use
(gal.)
Annual
Change in Qd
(gal.)
Total
Benefit
0 2012 140200 51874 52560 2.23 0% n/a 2726497440 0 $0
1 2013 141600 52392 49406 2.30 3% -3154 2588500109 -137997331 $316,966
2 2014 143000 52910 46442 2.37 3% -2964 2457247067 -131253042 $310,519
3 2015 144400 53428 43655 2.44 3% -2787 2332425789 -124821278 $304,162
4 2016 145220 53731 41036 2.51 3% -2619 2204930614 -127495175 $319,998
5 2017 146040 54035 38574 2.59 3% -2462 2084338128 -120592487 $311,753
6 2018 146860 54338 36260 2.66 3% -2314 1970278989 -114059138 $303,709
7 2019 147680 54642 34084 2.74 3% -2176 1862403330 -107875659 $295,862
Total -864094110 $2,162,970
146
Peter Mayer, Laurie D’Audney and Dennis Bode, Water Conservation Plan, (Fort Collins: City of Fort Collins Utilities, 2009), 1-49. 147
Assumption: RSF water use remains 37% of total population served by Fort Collins Utilities. 148
Peter Mayer, Laurie D’Audney and Dennis Bode, Water Conservation Plan, (Fort Collins: City of Fort Collins Utilities, 2009), 1-49. 149
Assumption: RSF water use remains 37% of total population served by Fort Collins Utilities.

Appendix C
54
Table 27: Policy Option 4: Tiered Rate Structure- NPV - Price Elasticity of 0.5
Program Year Year Total Benefit SDR 5% SDR 7% SDR 10%
0 2012 0 0 0 0
1 2013 32340 11331 11119 10816
2 2014 33762 4352 4270 4154
3 2015 35219 1670 1639 1594
4 2016 63360 1105 1085 1055
5 2017 64864 416 408 397
6 2018 66398 157 154 150
7 2019 67964 59 58 56
Total NPV 363907 19089 18733 18222
Table 28: Policy Option 4: Tiered Rate Structure- NPV - Price Elasticity of 1
Program Year Year Total Benefit SDR 5% SDR 7% SDR 10%
0 2012 0 0 0 0
1 2013 127215 44571 43738 42545
2 2014 128975 16624 16313 15868
3 2015 130732 6199 6083 5917
4 2016 157548 2748 2697 2623
5 2017 158501 1017 998 971
6 2018 159452 376 369 359
7 2019 160401 139 137 133
Total NPV 1022824 71675 70335 68417
Table 29: Policy Option 4: Tiered Rate Structure- NPV - Price Elasticity of 2
Program Year Year Total Benefit SDR 5% SDR 7% SDR 10%
0 2012 0 0 0 0
1 2013 316966 111053 108977 106005
2 2014 310519 40023 39275 38204
3 2015 304162 14422 14153 13767
4 2016 319998 5582 5478 5328
5 2017 311753 2001 1963 1910
6 2018 303709 717 704 684
7 2019 295862 257 252 245
Total NPV 2162970 174054 170801 166143