Water & Climate Update - wcc.nrcs.usda.gov · USDA 2018 Secretarial ... Dataset . U.S. Bureau of...
18
The Natural Resources Conservation Service provides leadership in a partnership effort to help people conserve, maintain, and improve our natural resources and environment. Water and Climate Update March 22, 2018 The Natural Resources Conservation Service produces this weekly report using data and products from the National Water and Climate Center and other agencies. The report focuses on seasonal snowpack, precipitation, temperature, and drought conditions in the U.S. Snow .......................................................................... 1 Precipitation ............................................................... 3 Temperature .............................................................. 7 Drought ...................................................................... 9 Other Climatic and Water Supply Indicators ............ 12 Short- and Long-Range Outlooks............................. 15 More Information ...................................................... 18 California starts spring with heavy rain and snowfall Thus far in March, California and much of Nevada have gone from near-record dry conditions to near- record rain and snowfall. The monthly gridded data map from the NOAA California Nevada River Forecast Center shows the percent of normal precipitation for March. Heavy rain on burned areas in southern California has prompted officials to urge 30,000 people to evacuate where mudslides have occurred or are expected. Heavy snow in the Sierra Nevada has dramatically increased the snowpack, with the latest storm adding from six inches to four feet, depending on elevation. Related: 'Atmospheric river' triggers evacuations in Southern California - CNN Over 30000 urged to flee as 'strongest storm of the year' barrels toward Southern California burn areas – LA Times, CA Lake Tahoe snowpack doubles in March — and more on the way -Tahoe Tribune, CA Is it a 'March Miracle'? Atmospheric river heads for Sacramento area – Sacramento Bee, CA California was in for one of the driest winters on record. Then March happened – KPCC, CA
Transcript of Water & Climate Update - wcc.nrcs.usda.gov · USDA 2018 Secretarial ... Dataset . U.S. Bureau of...
The Natural Resources Conservation Service provides leadership in a partnership effort to help people conserve, maintain, and improve our natural resources and environment.
Water and Climate Update March 22, 2018
The Natural Resources Conservation Service produces this weekly report using data and products from the National Water and Climate Center and other agencies. The report focuses on seasonal snowpack, precipitation, temperature, and drought conditions in the U.S.
Snow .......................................................................... 1 Precipitation ............................................................... 3 Temperature .............................................................. 7 Drought ...................................................................... 9
Other Climatic and Water Supply Indicators ............ 12 Short- and Long-Range Outlooks ............................. 15 More Information ...................................................... 18
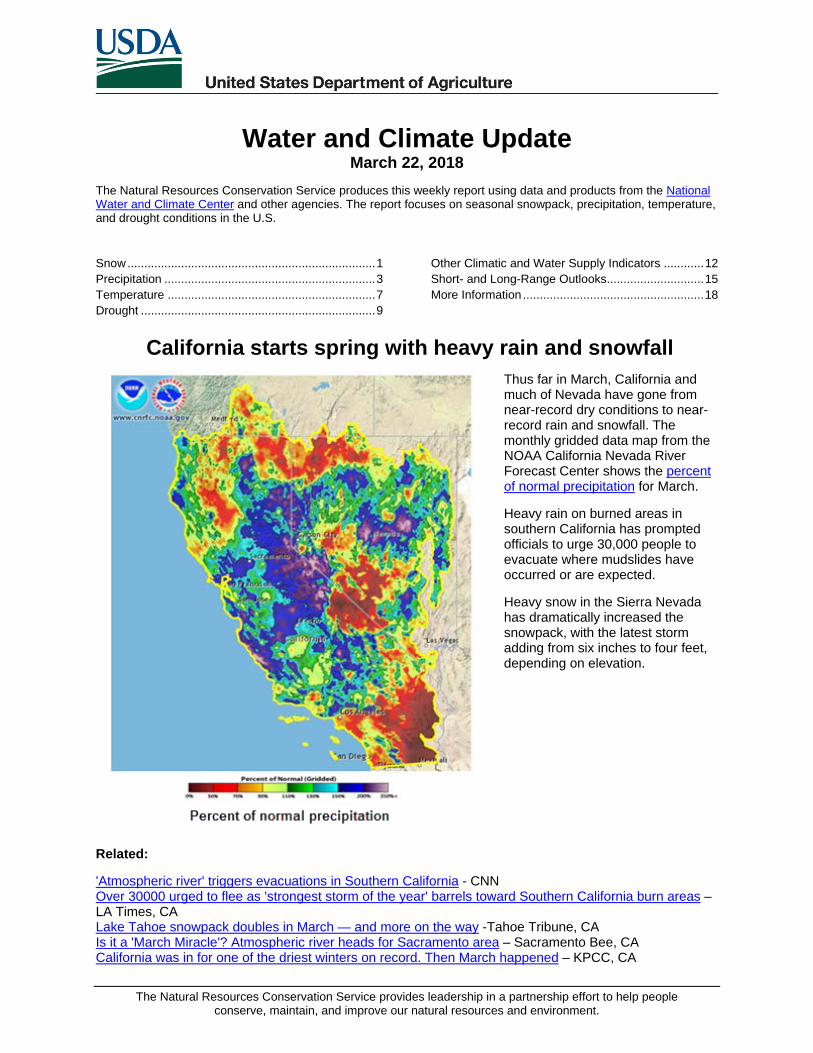
California starts spring with heavy rain and snowfall
Thus far in March, California and much of Nevada have gone from near-record dry conditions to near-record rain and snowfall. The monthly gridded data map from the NOAA California Nevada River Forecast Center shows the percent of normal precipitation for March.
Heavy rain on burned areas in southern California has prompted officials to urge 30,000 people to evacuate where mudslides have occurred or are expected.
Heavy snow in the Sierra Nevada has dramatically increased the snowpack, with the latest storm adding from six inches to four feet, depending on elevation.
Related:
'Atmospheric river' triggers evacuations in Southern California - CNN Over 30000 urged to flee as 'strongest storm of the year' barrels toward Southern California burn areas – LA Times, CA Lake Tahoe snowpack doubles in March — and more on the way -Tahoe Tribune, CA Is it a 'March Miracle'? Atmospheric river heads for Sacramento area – Sacramento Bee, CA California was in for one of the driest winters on record. Then March happened – KPCC, CA

Water and Climate Update
3/22/2018 Page 2
Snow
Current Snow Water Equivalent, NRCS SNOTEL Network
Snow water equivalent percent of median map
See also: Snow water equivalent values (inches) map
Alaska snow water equivalent percent of median map
See also: Alaska snow water equivalent values (inches) map
Water and Climate Update
3/22/2018 Page 3
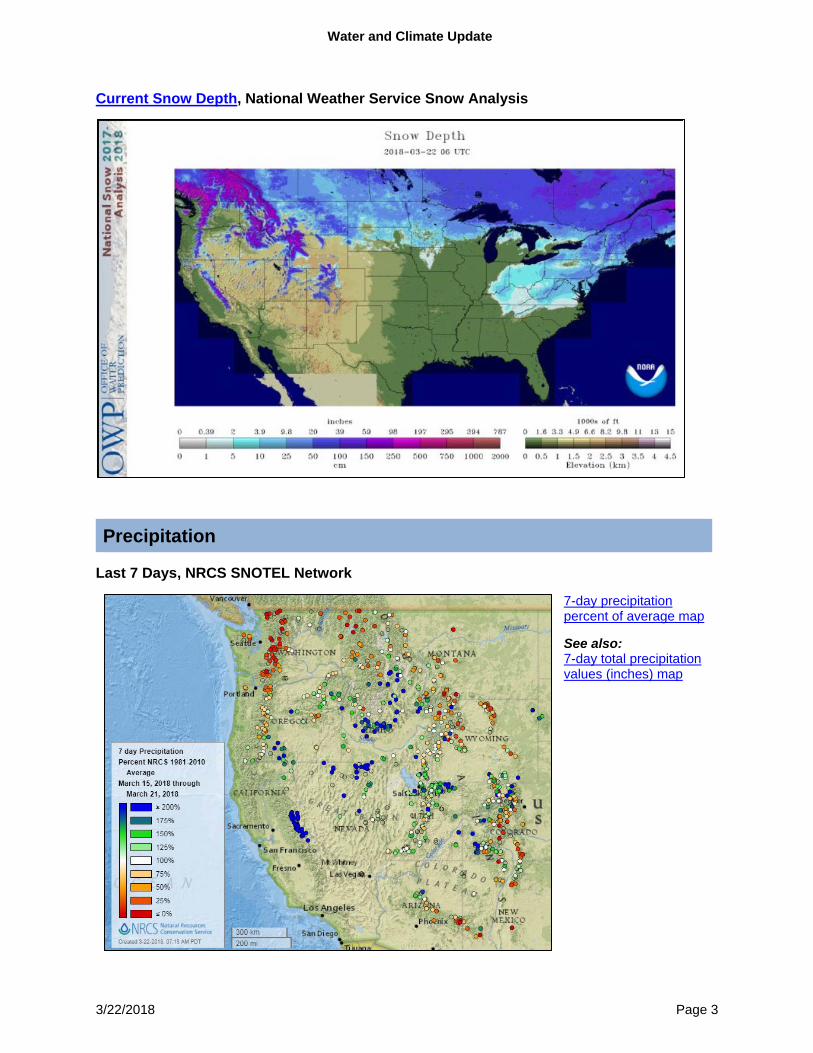
Current Snow Depth, National Weather Service Snow Analysis
Precipitation
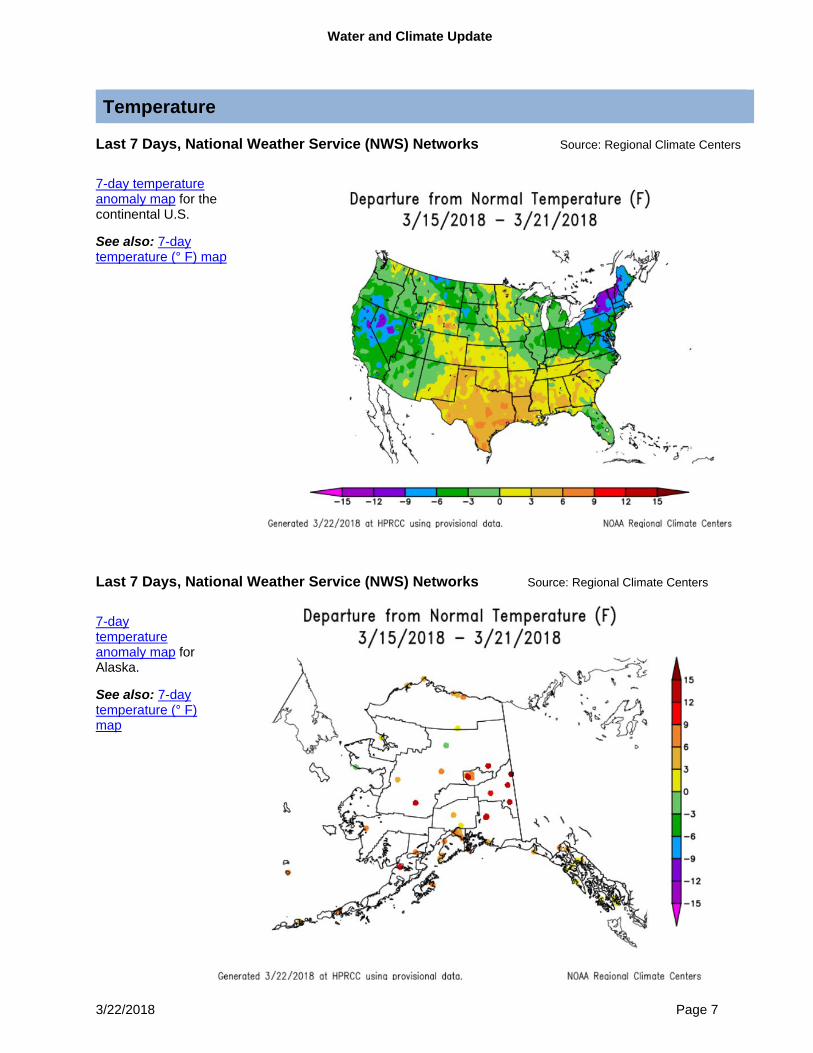
Last 7 Days, NRCS SNOTEL Network
7-day precipitation percent of average map
See also: 7-day total precipitation values (inches) map

Water and Climate Update
3/22/2018 Page 4
Alaska 7-day precipitation percent of average map
See also: Alaska 7-day total precipitation values (inches) map
Last 7 Days, National Weather Service (NWS) Networks Source: Regional Climate Centers
7-day precipitation percent of normal map for the continental U.S.
See also: 7-day total precipitation values (inches) map

Water and Climate Update
3/22/2018 Page 5
Month-to-Date, All Available Data Including SNOTEL and NWS Networks Source: PRISM
Month-to-date national total precipitation percent of average map
Last 3 Months, All Available Data Including SNOTEL and NWS Networks Source: PRISM
December 2017 through February 2018 total precipitation percent of average map

Water and Climate Update
3/22/2018 Page 6
Water Year-to-Date, NRCS SNOTEL Network
2018 water year-to-date precipitation percent of average map
See also: 2018 water year-to-date precipitation values (inches)
Alaska 2018 water year-to-date precipitation percent of average map
See also: Alaska 2018 water year-to-date precipitation values (inches) map
Water and Climate Update
3/22/2018 Page 7
Temperature
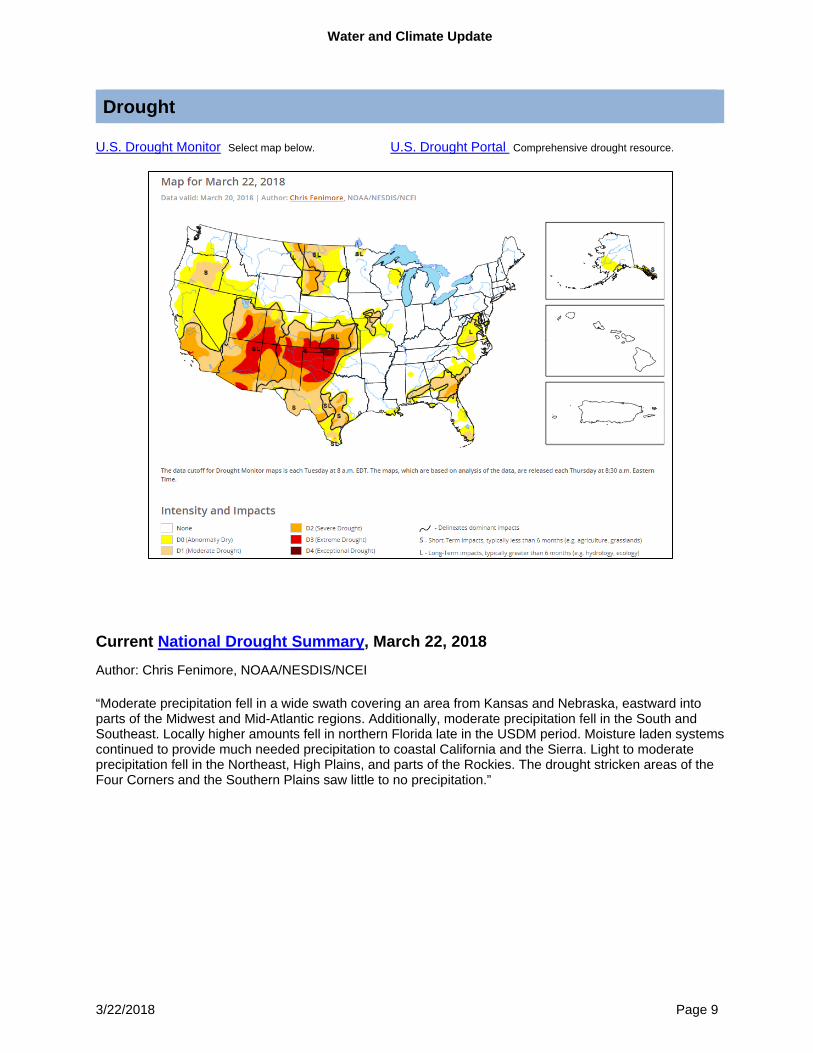
Last 7 Days, National Weather Service (NWS) Networks Source: Regional Climate Centers
7-day temperature anomaly map for the continental U.S.
See also: 7-day temperature (° F) map
Last 7 Days, National Weather Service (NWS) Networks Source: Regional Climate Centers
7-day temperature anomaly map for Alaska.
See also: 7-day temperature (° F) map

Water and Climate Update
3/22/2018 Page 8
Month-to-Date, All Available Data Including SNOTEL and NWS Networks Source: PRISM
Month-to-date national daily mean temperature anomaly map
Last 3 Months, All Available Data Including SNOTEL and NWS Networks Source: PRISM
December 2017 through February 2018 daily mean temperature anomaly map
Water and Climate Update
3/22/2018 Page 9
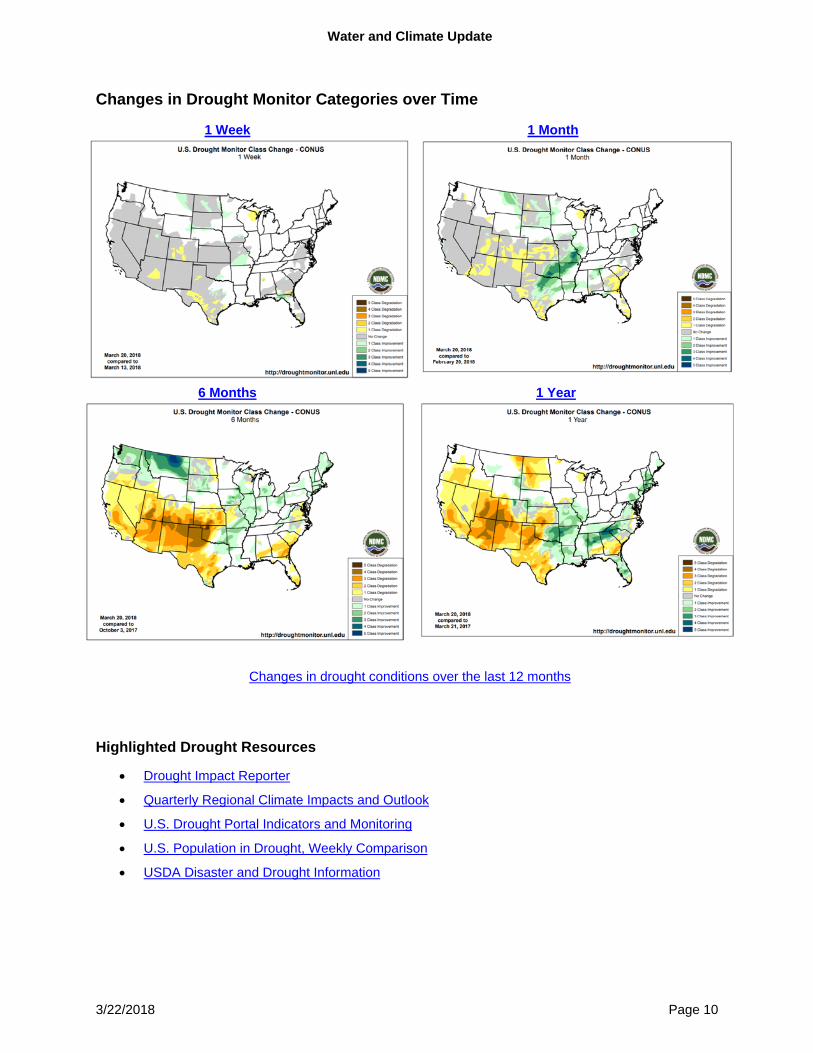
Drought
U.S. Drought Monitor Select map below. U.S. Drought Portal Comprehensive drought resource.
Current National Drought Summary, March 22, 2018 Author: Chris Fenimore, NOAA/NESDIS/NCEI
“Moderate precipitation fell in a wide swath covering an area from Kansas and Nebraska, eastward into parts of the Midwest and Mid-Atlantic regions. Additionally, moderate precipitation fell in the South and Southeast. Locally higher amounts fell in northern Florida late in the USDM period. Moisture laden systems continued to provide much needed precipitation to coastal California and the Sierra. Light to moderate precipitation fell in the Northeast, High Plains, and parts of the Rockies. The drought stricken areas of the Four Corners and the Southern Plains saw little to no precipitation.”
Water and Climate Update
3/22/2018 Page 10
Changes in Drought Monitor Categories over Time
1 Week
1 Month
6 Months
1 Year
Changes in drought conditions over the last 12 months
Highlighted Drought Resources
• Drought Impact Reporter
• Quarterly Regional Climate Impacts and Outlook
• U.S. Drought Portal Indicators and Monitoring
• U.S. Population in Drought, Weekly Comparison
• USDA Disaster and Drought Information

Water and Climate Update
3/22/2018 Page 11
USDA 2018 Secretarial Drought Designations

Water and Climate Update
3/22/2018 Page 12
Other Climatic and Water Supply Indicators
Soil Moisture Source: NOAA National Centers for Environmental Prediction
Modeled soil moisture percentiles as of March 17, 2018.
Soil Moisture Data Source: NRCS Soil Climate Analysis Network (SCAN)
The chart shows precipitation and soil moisture for the last 30 days at the Stubblefield SCAN site 2219 in California. Precipitation near the end of the period increased the soil moisture at the 2- and 4-inch depth sensors. In the last few days the 8-inch depth sensor has shown an increase in soil moisture. The deeper sensors have not responded to the precipitation.

Water and Climate Update
3/22/2018 Page 13
Soil Moisture Data Portals • CRN Soil Moisture • Texas A&M University North American Soil Moisture Database • University of Washington Experimental Modeled Soil Moisture
Streamflow Source: USGS
WaterWatch: Streamflow, drought, flood, and runoff conditions
Water and Climate Update
3/22/2018 Page 14
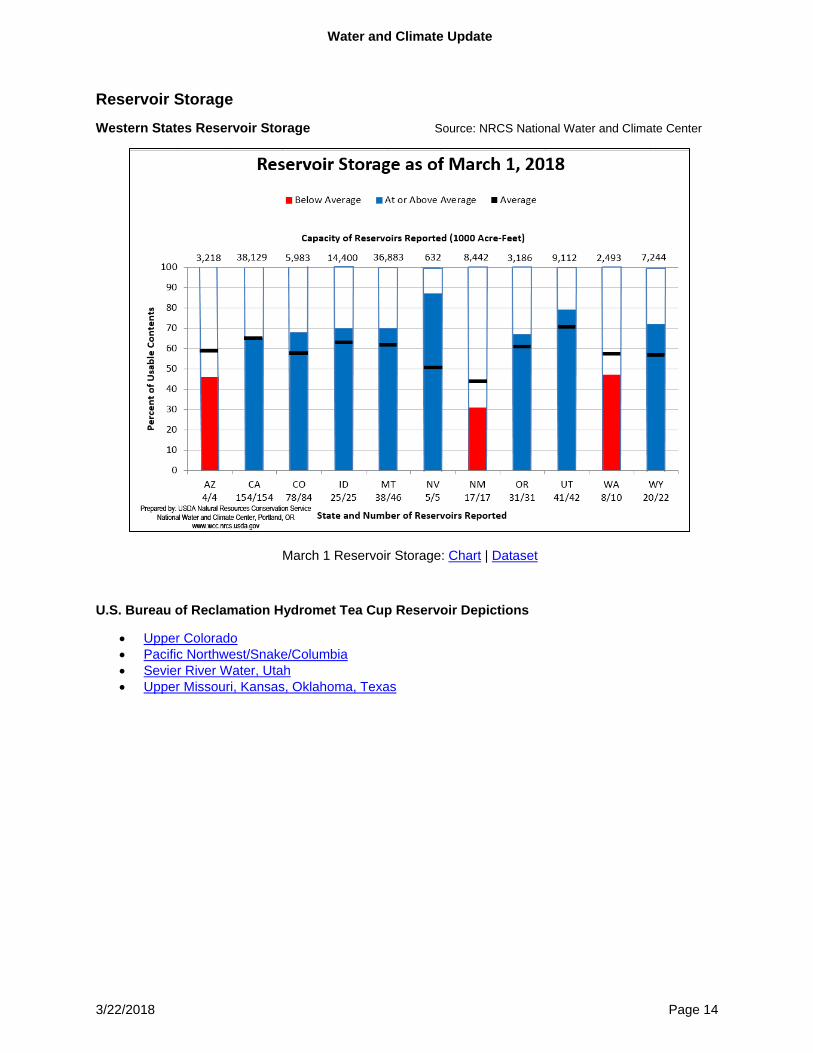
Reservoir Storage
Western States Reservoir Storage Source: NRCS National Water and Climate Center
March 1 Reservoir Storage: Chart | Dataset
U.S. Bureau of Reclamation Hydromet Tea Cup Reservoir Depictions
• Upper Colorado • Pacific Northwest/Snake/Columbia • Sevier River Water, Utah • Upper Missouri, Kansas, Oklahoma, Texas
Water and Climate Update
3/22/2018 Page 15
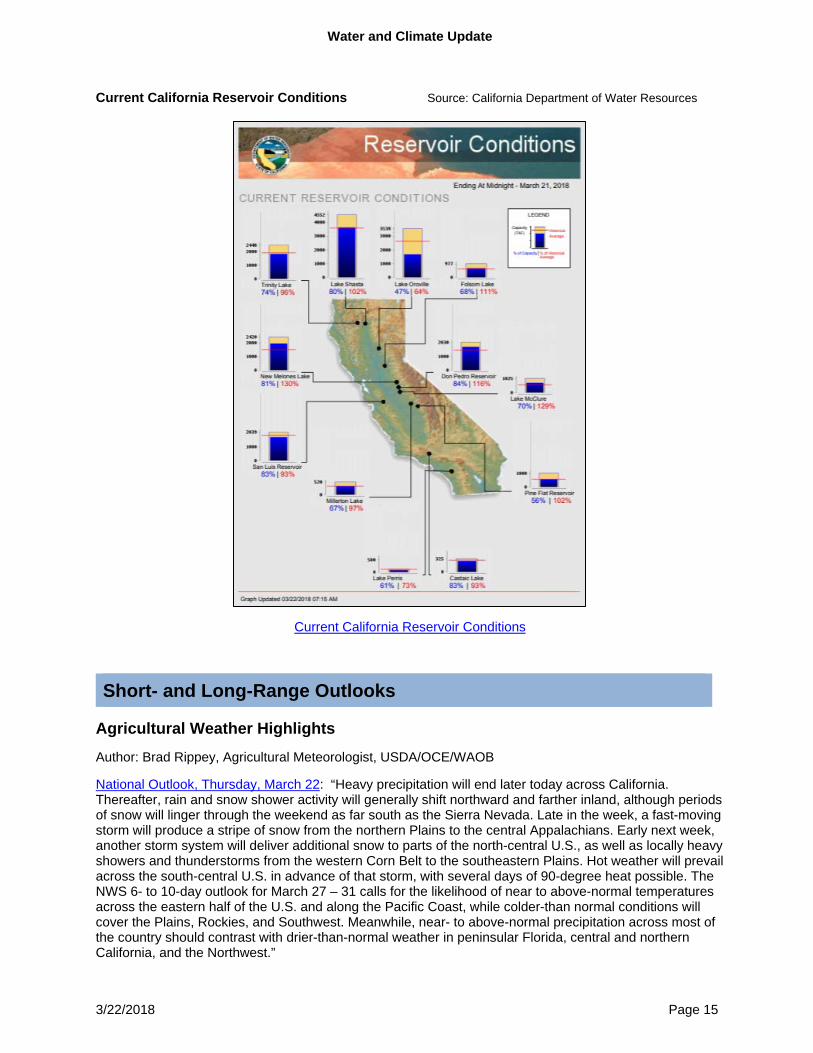
Current California Reservoir Conditions Source: California Department of Water Resources
Current California Reservoir Conditions
Short- and Long-Range Outlooks
Agricultural Weather Highlights Author: Brad Rippey, Agricultural Meteorologist, USDA/OCE/WAOB
National Outlook, Thursday, March 22: “Heavy precipitation will end later today across California. Thereafter, rain and snow shower activity will generally shift northward and farther inland, although periods of snow will linger through the weekend as far south as the Sierra Nevada. Late in the week, a fast-moving storm will produce a stripe of snow from the northern Plains to the central Appalachians. Early next week, another storm system will deliver additional snow to parts of the north-central U.S., as well as locally heavy showers and thunderstorms from the western Corn Belt to the southeastern Plains. Hot weather will prevail across the south-central U.S. in advance of that storm, with several days of 90-degree heat possible. The NWS 6- to 10-day outlook for March 27 – 31 calls for the likelihood of near to above-normal temperatures across the eastern half of the U.S. and along the Pacific Coast, while colder-than normal conditions will cover the Plains, Rockies, and Southwest. Meanwhile, near- to above-normal precipitation across most of the country should contrast with drier-than-normal weather in peninsular Florida, central and northern California, and the Northwest.”

Water and Climate Update
3/22/2018 Page 16
Weather Hazard Outlook March 24 - 28, 2018 Source: Climate Prediction Center
Significant Wildland Fire Potential Outlook Source: National Interagency Fire Center

Water and Climate Update
3/22/2018 Page 17
Seasonal Drought Outlook: March 15 - June 30, 2018 Source: National Weather Service
Climate Prediction Center 3-Month Outlook Source: National Weather Service Precipitation
Temperature
Apr-May-June (AMJ) 2018 precipitation and temperature outlook summaries

Water and Climate Update
3/22/2018 Page 18
More Information
The NRCS National Water and Climate Center publishes this weekly report. We welcome your feedback. If you have questions or comments, please contact us.