Water and Energy Conservation Programs and … and Energy Conservation Programs and Partnering ... o...
26
Water and Energy Conservation Programs and Partnering River Network Peer Learning Network February 29 th , 2012 Stacey Isaac Berahzer UNC Environmental Finance Center www.efc.unc.edu
Transcript of Water and Energy Conservation Programs and … and Energy Conservation Programs and Partnering ... o...
Water and Energy
Conservation Programs and Partnering
River Network
Peer Learning Network
February 29th , 2012
Stacey Isaac Berahzer
UNC Environmental
Finance Center
www.efc.unc.edu
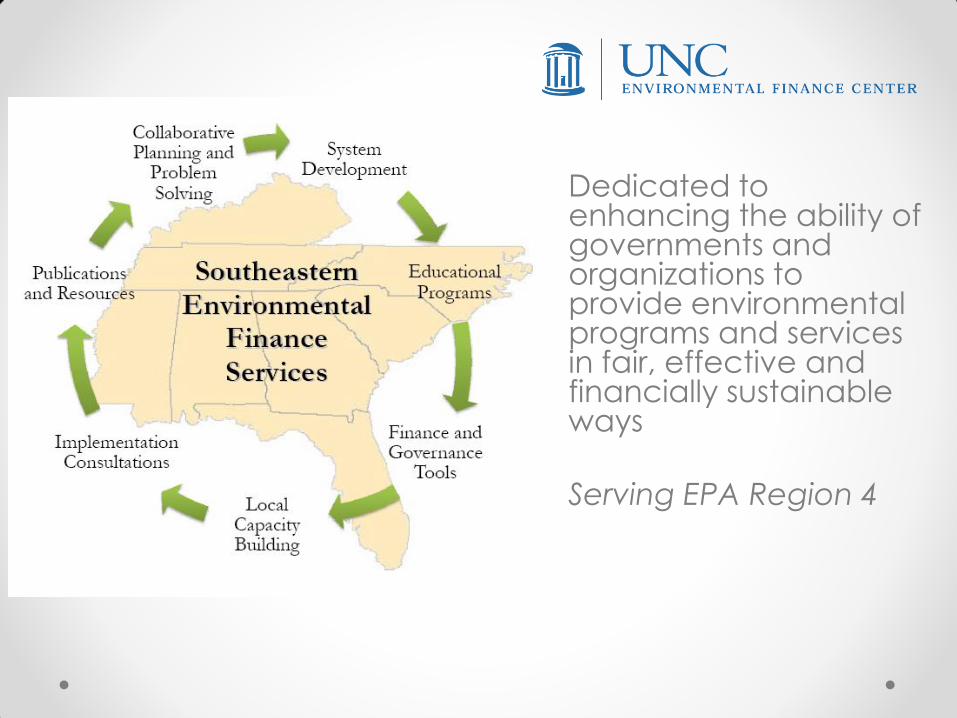
Dedicated to enhancing the ability of governments and organizations to provide environmental programs and services in fair, effective and financially sustainable ways
Serving EPA Region 4

Outline
• Water and Energy Conservation
Overview
• Water Pricing/Rates
• Partnering with your water utility

Water and Energy Conservation Overview

Potential for Financial Savings
• Treating less water less energy consumption
money saved
• Energy represents the largest controllable cost of
providing water or wastewater services to the
public: o 6,583 municipal treatment plants in the US
o Energy represents 25-30% of total plant O&M
• “In audits of 150 facilities…identified energy savings
of over 30%...” K. Moraff, EPA Region 1 (Boston),
Oct. 2011
How Water Utilities are Saving Energy
• Reduce demand during periods of peak electricity rates
• Use automation (e.g. continuously monitoring Dissolved Oxygen probe)
• Routine pump maintenance
• Reduction in voltage imbalance
• Source: WATERGY: Energy and Water Efficiency in
Municipal Water Supply and Wastewater Treatment
Cost-Effective Savings of Water and Energy
• Wastewater plants - biogas options o Evaluation of Energy Conservation Measures for Wastewater Treatment
Facilities September 2010, EPA 832-R-10-005

Financing options for energy efficiency retrofits at
water utilities
Financing • Loan and Grants:
o Example: Through Drinking Water and Clean Water SRFs (green project
reserve)
o Limited, intermittent grant opportunities
• Getting an energy project into the utility's Capital
Improvement Plan budget is an important
milestone
• Highlighting the payback time helps to make the
“business case” for prioritizing energy projects
• More resources at : http://efc.unc.edu/training.html#energy_sustainability

Water Pricing/Rates

Common Types of Rate Structures
• Flat
• Uniform
• Decreasing block
• Increasing block
• Seasonal
10

11

Partnering with your Water Utility
Understanding the Utility’s Challenges

The Conservation
Conundrum
• Water utilities face a dilemma in
encouraging water conservation
o By selling less water, utilities have to
increase rates to cover their costs
oCustomers are essentially being asked to
pay more for less water


What about expenses?

Partnering with your Water Utility
Talking Utility Language

Utility Lingo • “Portfolio Manager Benchmarking”
o provides a comparison of the energy use at specific WWTPs with a
national database of similar plants and results in a numeric benchmark
score
• Environmental management systems (EMS)
• ‘Plan-Do-Check-Act’ management framework
• Financial forecasting and consumption patterns
• RFPs for Energy Service Companies
(http://www.cee1.org/ind/mot-
sys/ww/rfp/index.php3)

Partnering with your Water Utility
Helping water utilities accept the
“new normal”
Plan for Conservation … because it is happening!
• State and Federal water
savings goals
• 1992 U.S. Energy Policy Act
• WaterSense
• LEED

Fixture Maximum Water Use Allowed (effective January 1994)
Water Sense
Toilets (water closets)
Gravity-tank 1.6 gallons per flush (gpf) 1.28 gpf
Gravity-tank, white, two-piece, labeled “Commercial Use Only”
3.5 gpf 1.28 gpf
Flushometer-tank 1.6 gpf 1.28 gpf
Flushometer-valve (except blowout valve)
1.6 gpf 1.28 gpf
Blowout-valve 3.5 gpf 1.28 gpf
Electromechanical hydraulic 1.6 gpf 1.28 gpf
Urinals
Any type 1.0 gpf 0.5 gpf
Showerheads
Any type (except those used for safety reasons)
2.5 gallons per minute (at 80 psi) or 2.2 gpm (at 60 psi)
2.0 gpm (at 20, 45 and 80 psi)
Faucets and Replacement Aerators
Lavatory faucets
2.5 gallons per minute (at 80 psi) or 2.2 gpm (at 60 psi)
1.5 gpm (at 60 psi)
Lavatory replacement aerators
Kitchen faucets
Kitchen replacement aerators
Metering faucets 0.25 gallons per cycle
Overview of Alternate Models
Selling Service as opposed to gallons
of water
21

Annually Adjusted Base Charges
• Inspiration = energy sector
• Looks at a customer’s cumulative consumption, AS
WELL AS a snapshot o Snapshot of utility’s peak, or
o Snapshot of customer’s peak
• Water: could the “base charge” for a customer be
set based on customer usage?

Cooperative/Dividend Model
• Inspiration = energy sector/ REI outdoor
• Customers are “members” of utility
• Utility clearly defines its revenue needs (including O&M, debt service, capital reserves, etc.)
• Utility develops a share of this total cost that a “member” should pay for a fiscal year
• Customer pays a fixed monthly fee
• “Extra” funds paid out to customers at end of fiscal year

Fixed Prices for Bundled Services
• Inspiration = cell phone plans
• Customer buys into a “plan” that allows them a certain “bundle of consumption:” o x Gallons of water provided
o x Gallons of wastewater treated
o Access to online usage data
o Insurance on service line
o Etc.
• Customers who use beyond their “plan” limit face much higher rates

Water Budget-Based Rates • Inspiration = western US water utilities
• Basically “individualized” increasing block rates per
customer
• Budget could be based on: o # of people in household, and/or
o Historic annual consumption of household

Contact Stacey Isaac Berahzer
Senior Project Director
Environmental Finance Center
Phone: 770-509-3887
www.efc.unc.edu