
Water and Agriculture in India - OAV and Agriculture in India ... falling at alarming rate of 2-3...
28
Water and Agriculture in India Background paper for the South Asia expert panel during the Global Forum for Food and Agriculture (GFFA) 2017 ............................................................................ Dr. Vibha Dhawan
Transcript of Water and Agriculture in India - OAV and Agriculture in India ... falling at alarming rate of 2-3...
Water and Agriculture in India
Background paper for the South Asia expert panel
during the Global Forum for Food and Agriculture
(GFFA) 2017
............................................................................
Dr. Vibha Dhawan

2
Content
Chapter
Content
Page
number
1 Introduction 3
2 India’s agriculture sector 4
2.1 Droughts and their impact 5
3 Water available for agricultural production 7
3.1 Available water 7
3.2 Water availability in different regions of India 8
4 Water and agriculture 9
4.1 Groundwater and surface water use for agriculture 9
4.1.1 Groundwater utilization for irrigation 9
4.2 Irrigation in India 12
4.2.1 Intensity of irrigation 12
4.2.2 Groundwater-based irrigation 13
4.2.3 Programs supporting irrigation 15
4.3 Water use efficiency in agriculture 16
4.4 Virtual water flow 18
4.5 Programs and technologies related to water use efficiency 19
4.6 Institutional and policy aspects 19
4.7
Watershed development for water use efficiency in the agriculture
sector 21
4.8 Water rights and water pricing 24
5 Conclusions 25
6 Possible options for action 25
3
Water and Agriculture in India
“Status, Challenges and Possible Options for Action”
1. Introduction
Water is a critical input into agriculture in nearly all its aspects having a determining effect on
the eventual yield. Good seeds and fertilizers fail to achieve their full potential if plants are not
optimally watered. Adequate availability of water is important for animal husbandry as well.
Fisheries are, of course, directly dependent on water resources. India accounts for about 17%
of the world’s population but only 4% of the world fresh water resources. Distribution of these
water resources across the vast expanse of the country is also uneven. The increasing demands
on water resources by India’s burgeoning population and diminishing quality of existing water
resources because of pollution and the additional requirements of serving India’s spiraling
industrial and agricultural growth have led to a situation where the consumption of water is
rapidly increasing while the supply of fresh water remains more or less constant. Surveys
conducted by the Tata Institute of Social Sciences (TISS) showed most of urban cities are water
deficient. Nearly 40% of water demand in urban India is met by ground water. As a result
ground water tables in most cities are falling at alarming rate of 2-3 meters per year.1 Water
scarcity has many negative impacts on the environment, including lakes, rivers, wetlands, and
other fresh water resources. Additionally, water overuse can cause water shortage, often
occurs in areas of irrigation agriculture, and harms the environment in several ways including
increased salinity, nutrient pollution, and the degradation and loss of flood plains and wetlands.
Furthermore, water shortage makes flow management in the rehabilitation of urban streams
problematic. Owing to poor water resource management system and climate change India
faces a persistent water shortage. As per OECD environmental outlook 2050, India would face
severe water constrains by 2050. Indian agriculture accounts for 90% water use due to fast
track ground water depletion and poor irrigation systems.
1 http://www.yourarticlelibrary.com/essay/essay-on-water-scarcity-in-india-1113-words/20871/
4
Another cause of concern is water quality. The eventual pressure for efficient use of highly
scarce water resources thus rises manifold. This paper reviews the current status of water
availability in India; its usage in agriculture; water smart technologies developed in agriculture
and how India is attempting to move towards sustainability.
2. India’s Agriculture Sector
India ranks 2nd world wide in farm output. Agriculture and allied sectors like forestry and
fisheries accounted 13.7% of the GDP (Gross Domestic Production) in 2013, and employed 50%
of the workforce. The irrigation infrastructure includes a network of canals from rivers, ground
water, well based systems, tanks and other rain water harvesting products for agriculture
activities. Today ground system is the largest, covering – 160 million ha of cultivated land in
India with 39 million ha irrigated by ground water, 22 million ha by irrigated canals and about
two third of cultivation in India is still depending on monsoon.
“The earth, the land and the water are not an inheritance from our forefathers but on loan
from our children. So, we have to handover to them at least as it was handed over to us.”
- Mahatama Gandhi2
India is the world’s largest producer of fresh fruits and vegetables, milk, major spices, various
crops such as jute, staples such as millets and castor oil seed. It is also the second largest
producer of wheat and rice. The average size of the around 138 million farms was around 1.15
ha in 2010/11 and average size of large-scale farmers’ farms (170.000) is around 37 ha in 2016
(BMEL India country report 2016). Agricultural extension has only one extension worker per
800-1000 farmers and degree of mechanization reaches less than 50% (BMEL India country
report 2016). Indicators of water stress and scarcity are generally used to reflect the overall
water availability in a country or a region. As per the international norms, a country is classified
as water stressed and water scarce if per capita water availability goes below 1700 m3 and 1000
2 Newman, J. (2011). Green Ethics and Philosophy: An A-to-Z Guide (Vol. 8). Sage.

5
m3, respectively. With 1544 m3 per capita water availability, India is already a water-stressed
country and is moving towards turning into water scarce.
2.1. Droughts and their impact
Droughts have severe impacts on economy, society and environment affecting crops, irrigation,
livestock, wildlife, soil, health problems, public safety ultimately leading to severe loss to
human life. Drought in India has resulted in millions of deaths over the course of the 18th, 19th,
and 20th centuries. The latest findings suggest that while there have been alternate dry and wet
spells over the past three decades, the frequency of occurrence of drought years has
significantly increased in India. The period between 1950 and 1989 had 10 drought years, while
there have been 5 droughts in the last 16 years (since 2000). According to meteorologists the
frequency is set to increase between 2020 and 2049.3 Indian agriculture is crucially dependent
on the local climate: favorable southwest summer monsoon is critical in securing water for
irrigating crops. In some parts of India, the lack of monsoons result in water shortages, resulting
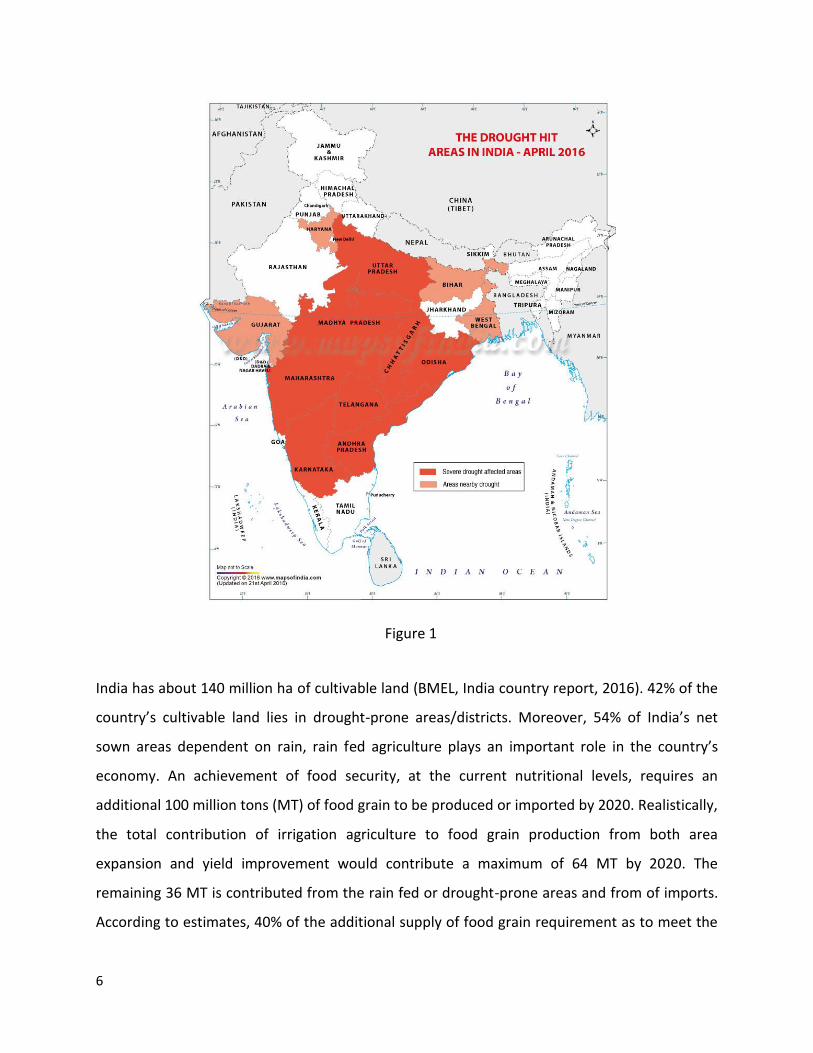
in below-average crop yields. This particularly occurs in major drought-prone regions such as
Southern and Eastern Maharashtra (Western India), Northern Karnataka (South-Western
India), Andhra Pradesh (Southeastern coast of India), Odisha (Eastern coast of
India), Telangana (Southeastern coast of India) and Rajasthan (Western India) [Figure 1].4
Droughts mean less water availability for agriculture than usual. Increased groundwater use
during droughts can help overcome such critical periods. However, the resulting groundwater
overuse and quality deterioration mean there is also less groundwater available for agriculture
than there was before, thereby causing even more pressure on agricultural production. The key
point of consideration is that all the above mentioned impacts must be critically considered
during planning and responding to drought conditions.
3 Collison, A., Wade, S., Griffiths, J., & Dehn, M. (2000). Modelling the impact of predicted climate change on
landslide frequency and magnitude in SE England. Engineering Geology, 55(3), 205-218.
4 http://www.mapsofindia.com/maps/india/drought-prone-areas.html
6
India has about 140 million ha of cultivable land (BMEL, India country report, 2016). 42% of the
country’s cultivable land lies in drought-prone areas/districts. Moreover, 54% of India’s net
sown areas dependent on rain, rain fed agriculture plays an important role in the country’s
economy. An achievement of food security, at the current nutritional levels, requires an
additional 100 million tons (MT) of food grain to be produced or imported by 2020. Realistically,
the total contribution of irrigation agriculture to food grain production from both area
expansion and yield improvement would contribute a maximum of 64 MT by 2020. The
remaining 36 MT is contributed from the rain fed or drought-prone areas and from of imports.
According to estimates, 40% of the additional supply of food grain requirement as to meet the
Figure 1

7
rice demand has to come from these areas. Poor agricultural productivity was observed during
2015 and early months of 2016, however in the summer of 2016 precipitation reached usual or
higher levels than average, thereby 2016/2017 is expected to bring good results. Earlier food
shortages were mainly due to the shortage in food grains and not water but, today ground
water depletion is serious cause of concern. For example, in Sonwati village in Latur district of
Maharashtra (Western India), groundwater was available within six meters, but now even 244
meter deep bore wells have gone dry. This has lead to a situation where there is no water, no
fodder and decline in farm produce, says the farmer. A long-term strategy to make India
drought-free is the substantial message for overcoming 2016 crisis though there is a positive
hope for 2017.
3. Water available for Agricultural Production
3.1. Available water
India is not a water rich country and is further challenged due to negative impact of climate
change; enormous wastage owing partly to poor management and distorted water pricing
policies. The Northern Ganga River Basin has abundant water resources, whereas the Southern
River Basin has few, but with high levels of pollution in ground water and surface water.
Increase in population and changing lifestyles has increased demand for water (largely for
irrigation) in both urban and rural areas. India has 18% of world population, having 4% of
world’s fresh water, out of which 80% is used in agriculture. India receives an average of 4,000
billion cubic meters of precipitation every year. However, only 48% of it is used in India’s
surface and groundwater bodies. A dearth of storage procedure, lack of adequate
infrastructure, inappropriate water management has created a situation where only 18-20% of
the water is actually used. India’s annual rainfall is around 1183 mm, out of which 75% is
received in a short span of four months during monsoon (July to September). This result in run
offs during monsoon and calls for irrigation investments for rest of the year. The population of
India is likely to be 1.6 billion by 2050, resulting in increased demand for water, food and
energy. This calls for infrastructure expansion and improved resource utilization.

8
It is worth mentioning that climate change will have negative impact on agricultural
productivity ranging from crop selection; time of cultivation, irrigation methods etc. Rice, wheat
and sugarcane constitute about 90% of India’s crop production and these are the most water
consuming crops. Rice, which is an important export crop, consumes as much as 3,500 liters of
water for a kilogram of grain produced.
3.2. Water availability in different regions of India
The availability and demand for water resources in India show sizeable variations from one
region to another. There is an inefficient and inequitable use of and distribution of water.
Nearly 90% of the India population lives in areas with some form of water stress or food
production deficit. Ground water has been relatively abundant in most parts of India. However,
in some regions, it is becoming one of the most serious resource issues. Conditions of poor
water quality and water stress in India are shown in Figures 2a5 and 2b6.
5 http://www.wri.org/blog/2015/02/3-maps-explain-india%E2%80%99s-growing-water-risks;
6 http://www.wri.org/blog/2015/02/3-maps-explain-india%E2%80%99s-growing-water-risks
Figure 2a. Conditions of poor water quality in India.
Figure 2b. Conditions of water stress in India.
9
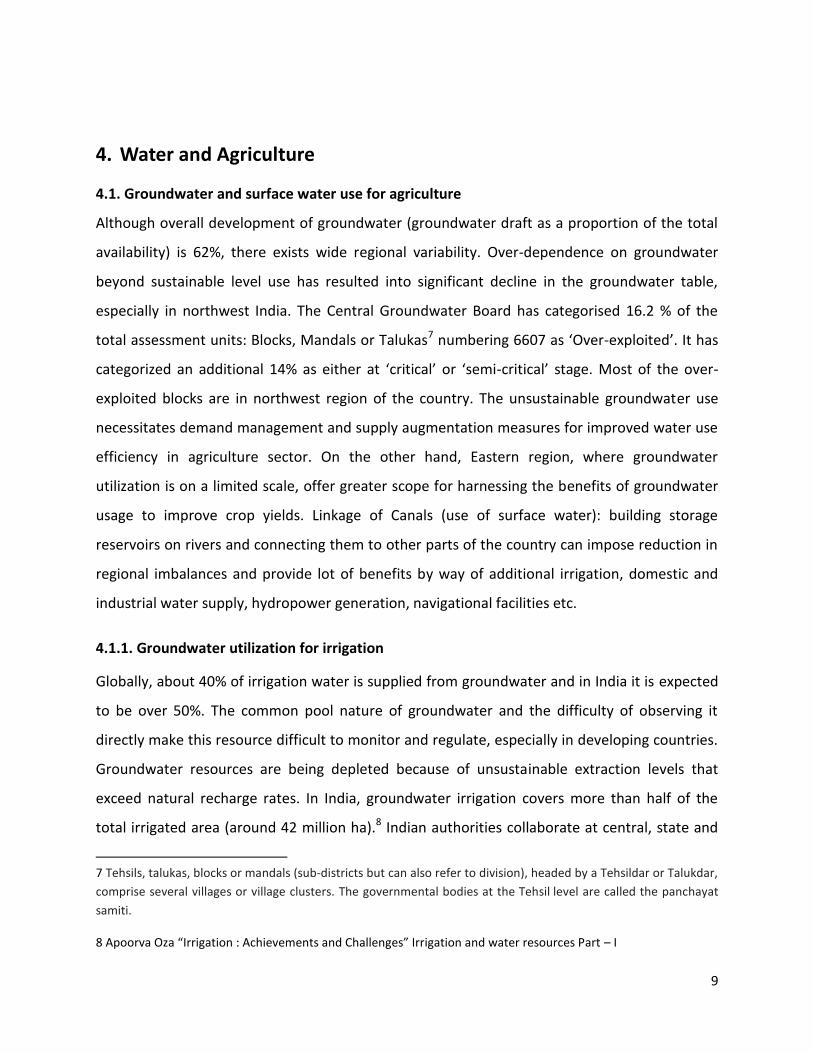
4. Water and Agriculture
4.1. Groundwater and surface water use for agriculture
Although overall development of groundwater (groundwater draft as a proportion of the total
availability) is 62%, there exists wide regional variability. Over-dependence on groundwater
beyond sustainable level use has resulted into significant decline in the groundwater table,
especially in northwest India. The Central Groundwater Board has categorised 16.2 % of the
total assessment units: Blocks, Mandals or Talukas7 numbering 6607 as ‘Over-exploited’. It has
categorized an additional 14% as either at ‘critical’ or ‘semi-critical’ stage. Most of the over-
exploited blocks are in northwest region of the country. The unsustainable groundwater use
necessitates demand management and supply augmentation measures for improved water use
efficiency in agriculture sector. On the other hand, Eastern region, where groundwater
utilization is on a limited scale, offer greater scope for harnessing the benefits of groundwater
usage to improve crop yields. Linkage of Canals (use of surface water): building storage
reservoirs on rivers and connecting them to other parts of the country can impose reduction in
regional imbalances and provide lot of benefits by way of additional irrigation, domestic and
industrial water supply, hydropower generation, navigational facilities etc.
4.1.1. Groundwater utilization for irrigation
Globally, about 40% of irrigation water is supplied from groundwater and in India it is expected
to be over 50%. The common pool nature of groundwater and the difficulty of observing it
directly make this resource difficult to monitor and regulate, especially in developing countries.
Groundwater resources are being depleted because of unsustainable extraction levels that
exceed natural recharge rates. In India, groundwater irrigation covers more than half of the
total irrigated area (around 42 million ha).8 Indian authorities collaborate at central, state and
7 Tehsils, talukas, blocks or mandals (sub-districts but can also refer to division), headed by a Tehsildar or Talukdar,
comprise several villages or village clusters. The governmental bodies at the Tehsil level are called the panchayat
samiti.
8 Apoorva Oza “Irrigation : Achievements and Challenges” Irrigation and water resources Part – I

10
local level. The Central Water Commission has the objective of promoting integrated and
sustainable development and management of India’s water resources by using state of art
technology and competency coordinating all stake holders. They are working on reserviour
monitoring system, real time water quality monitoring, flood forecast, river basin management,
watershed development, rejuvenation of major issues etc. The Central Ground Water Board has
been setup to develop and disseminate technologies for monitoring and implementing policies
for scientific sustainable development and management of ground water resources including
exploitation, assessment, conservation, augmentation, protection from pollution and strategy
based on economic and ecological efficiency and equality. Central Water Commission and
Central Ground Water Board have formulated "General Guidelines for Water Audit and Water
Conservation". These guidelines have been circulated to all the state governments and
concerned central ministries and other utilities for framing their own specific guidelines.
Some of the state governments such as Punjab (Northern India) offer free electricity for
pumping ground water. States such as Gujrat and Maharashtra (Western India) offer high
subsidy for solar pumps. For increasing water usage efficiency high subsidy has been given on
water sprinklers/ drip irrigation systems. Several regions in the country face acute water stress
chronically. These include districts of South and North Interior Karnataka (Southern India);
Rayalseema in Andhra Pradesh (Southeastern coast of India); Vidarbha and Marathwada in
Maharashtra (Western India); Western Rajasthan and Bundelkhand region of Uttar Pradesh
(Northern India) and Madhya Pradesh (Central India). Low and erratic rainfall for consecutive
years in these districts have rendered water-harvesting structures devoid of water and the
conservation measures almost unviable. The water storage in reservoirs has depleted leading to
scarcity of drinking water. The moisture index in majority of these districts in the range of -85 to
-50%, denoting that natural precipitation is highly inadequate to support the arable cropping.
States with the highest dependency on ground water for irrigation include Punjab (79% of the
area irrigated is by tube-wells and wells), Uttar Pradesh (80%) and Uttarakhand (67%). Local
governance in India has been formed under the Panchayati Raj system (PRC) in 1992. The
Panchayati Raj system is a three-tier system with elected bodies at the village, taluk
and district levels. The central and state government policies have put forward varying schemes

11
to promote irrigation and water use efficiencies. The over enthusiasm of some of the state
government is resulted in distorting water prices resulted in over exploitation of water. Various
functions related to the development of agriculture as important one including decision related
to irrigation services are taken by them at local level.
Despite growing scarcity, groundwater irrigation in India remains highly inefficient from a
technical point of view. For example, India’s third Minor Irrigation Census has shown that in
2001, only 3% of India’s some 8.5 million tube-well owners used drip or sprinkler irrigation and
88% delivered water to their crops by flooding through open channels. As per the assessment
carried out by the Central Ground Water Board (CGWB) in 2011, India’s total annual
replineshable groundwater resource is around 433 billion cubic meters (BCM) and net annual
ground water availability is 398 BCM of which India withdraws 245 BCM (62%) annually.
According to the CGWB, around 39% of the wells are showing a decline in groundwater level.
Out of 6,607 assessment units in the country, 1,071 units (in 15 states and 2 union territories)
have been categorized as “over exploited” based on the stage of groundwater withdrawal as
well as long term decline in groundwater level. Aquifers in poor, densely populated regions,
such as Northwest India, are under maximum stress (NASA GRACE Satellite data).9 The Indus
River Basin, which is shared between India and Pakistan, has the world’s second most stressed
aquifer. Presently, the deliberation in India is focused on how to restructure irrigation
departments so that they can become competent to improve water delivery process.
Understanding best practices from other countries and India’s own community based
interventions models will help present policy thinkers and planners to enhance governance
structures and understand key indicators that can assist in data-driven decision-making. In
Gujarat, (Western India) semiarid northern region, one of the most intensively irrigated regions
in India; water availability is a concern because groundwater irrigation contributes more than
90% of the overall livelihoods of the farms. It is worth mentioning that in some tehsils10 of
Latur11, there is no water even 304 meters below the ground. Many watersheds in Latur and
9 http://www.jpl.nasa.gov/news/news.php?feature=4626
10 Tehsil is an administrative area in parts of India.
11 Latur is a city in the Marathwada region in the Maharashtra state (western region) of India.
12
countrywide are overexploited. Just in one year (2015-16) the water table in Latur has gone
down by 3.5 to 4.0 meters.
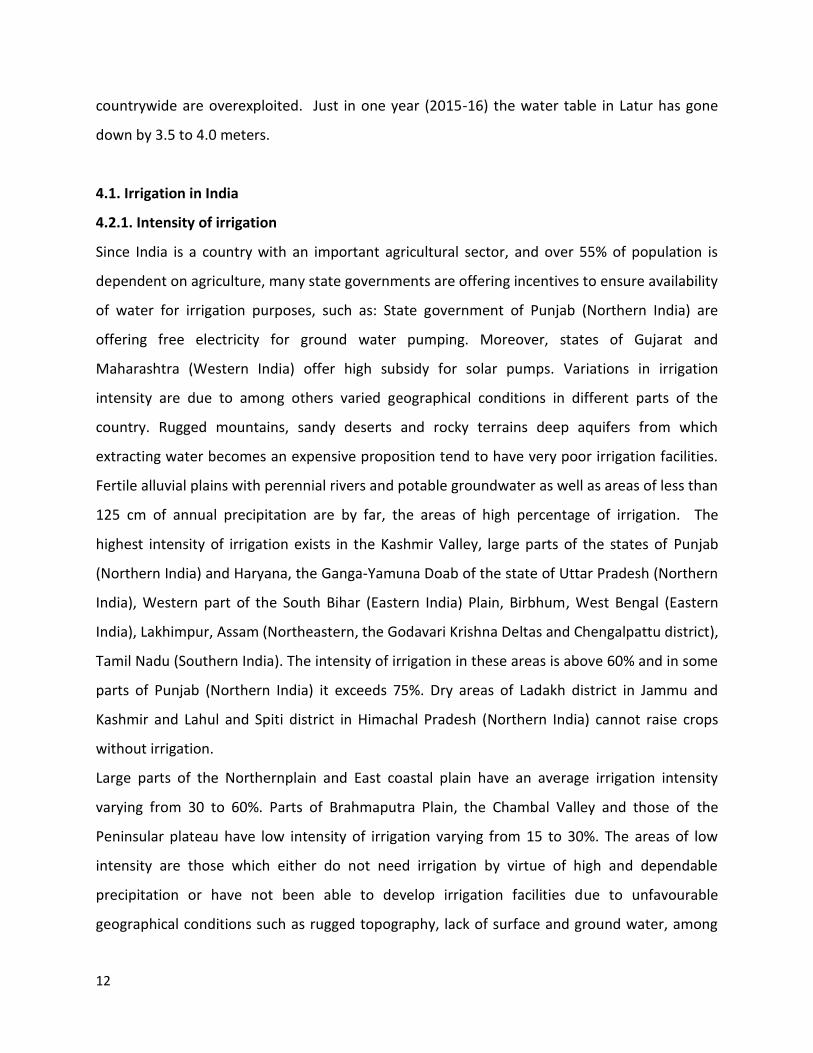
4.1. Irrigation in India
4.2.1. Intensity of irrigation
Since India is a country with an important agricultural sector, and over 55% of population is
dependent on agriculture, many state governments are offering incentives to ensure availability
of water for irrigation purposes, such as: State government of Punjab (Northern India) are
offering free electricity for ground water pumping. Moreover, states of Gujarat and
Maharashtra (Western India) offer high subsidy for solar pumps. Variations in irrigation
intensity are due to among others varied geographical conditions in different parts of the
country. Rugged mountains, sandy deserts and rocky terrains deep aquifers from which
extracting water becomes an expensive proposition tend to have very poor irrigation facilities.
Fertile alluvial plains with perennial rivers and potable groundwater as well as areas of less than
125 cm of annual precipitation are by far, the areas of high percentage of irrigation. The
highest intensity of irrigation exists in the Kashmir Valley, large parts of the states of Punjab
(Northern India) and Haryana, the Ganga-Yamuna Doab of the state of Uttar Pradesh (Northern
India), Western part of the South Bihar (Eastern India) Plain, Birbhum, West Bengal (Eastern
India), Lakhimpur, Assam (Northeastern, the Godavari Krishna Deltas and Chengalpattu district),
Tamil Nadu (Southern India). The intensity of irrigation in these areas is above 60% and in some
parts of Punjab (Northern India) it exceeds 75%. Dry areas of Ladakh district in Jammu and
Kashmir and Lahul and Spiti district in Himachal Pradesh (Northern India) cannot raise crops
without irrigation.
Large parts of the Northernplain and East coastal plain have an average irrigation intensity
varying from 30 to 60%. Parts of Brahmaputra Plain, the Chambal Valley and those of the
Peninsular plateau have low intensity of irrigation varying from 15 to 30%. The areas of low
intensity are those which either do not need irrigation by virtue of high and dependable
precipitation or have not been able to develop irrigation facilities due to unfavourable
geographical conditions such as rugged topography, lack of surface and ground water, among
13
others. More areas with low irrigation intensity due to inappropriate geographical factors
include large parts of Rajasthan to the west of the Aravali Range, parts of Bihar plain (Eastern
India), central part of Peninsular plateau, the Maharashtra (Western India) and Kerala coasts,
Manipur, Mizoram and Tripura. Andaman and Nicobar Islands (Southern India) have 0%
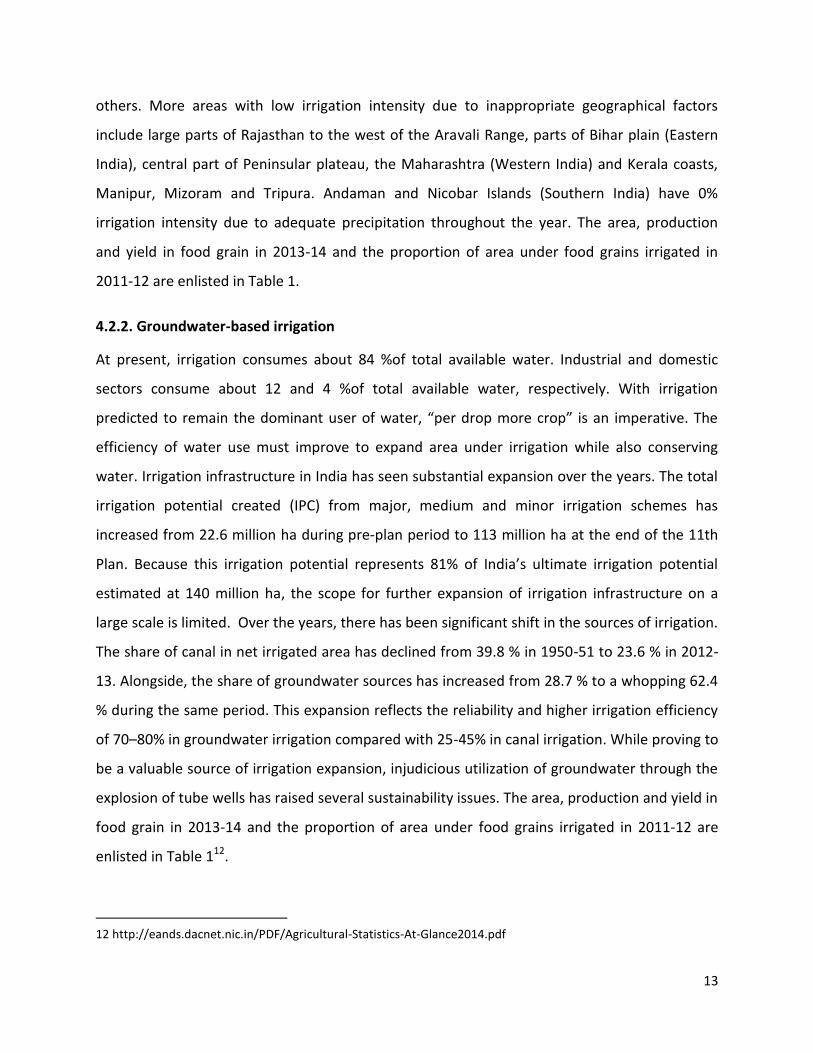
irrigation intensity due to adequate precipitation throughout the year. The area, production
and yield in food grain in 2013-14 and the proportion of area under food grains irrigated in
2011-12 are enlisted in Table 1.
4.2.2. Groundwater-based irrigation
At present, irrigation consumes about 84 %of total available water. Industrial and domestic
sectors consume about 12 and 4 %of total available water, respectively. With irrigation
predicted to remain the dominant user of water, “per drop more crop” is an imperative. The
efficiency of water use must improve to expand area under irrigation while also conserving
water. Irrigation infrastructure in India has seen substantial expansion over the years. The total
irrigation potential created (IPC) from major, medium and minor irrigation schemes has
increased from 22.6 million ha during pre-plan period to 113 million ha at the end of the 11th
Plan. Because this irrigation potential represents 81% of India’s ultimate irrigation potential
estimated at 140 million ha, the scope for further expansion of irrigation infrastructure on a
large scale is limited. Over the years, there has been significant shift in the sources of irrigation.
The share of canal in net irrigated area has declined from 39.8 % in 1950-51 to 23.6 % in 2012-
13. Alongside, the share of groundwater sources has increased from 28.7 % to a whopping 62.4
% during the same period. This expansion reflects the reliability and higher irrigation efficiency
of 70–80% in groundwater irrigation compared with 25-45% in canal irrigation. While proving to
be a valuable source of irrigation expansion, injudicious utilization of groundwater through the
explosion of tube wells has raised several sustainability issues. The area, production and yield in
food grain in 2013-14 and the proportion of area under food grains irrigated in 2011-12 are
enlisted in Table 112.
12 http://eands.dacnet.nic.in/PDF/Agricultural-Statistics-At-Glance2014.pdf
14
Table 1: Area, production and yield in food grain in 2013-14 and the proportion of area under
food grains irrigated in 2011-12.
State Area (m.
hectares)
(2013-14)
%of India
(2013-14)
Production
(million
tons)
(2013-14)
%of India
(2013-14)
Yield (kg per
hectare)
(2013-14)
% area
irrigated
(2011-12)
Uttar Pradesh 20.23 16.05 50.05 18.90 2474.00 76.10
Punjab (northern
India) (northern
India)
6.560 5.20 28.90 10.92 4409.00 98.70
Madhya Pradesh
(central India)
14.94 11.85 24.24 9.50 1622.00 50.50
Andhra Pradesh 7.61 6.04 20.10 7.59 2641.00 62.50
Rajasthan 13.42 10.64 18.30 6.91 1364.00 27.70
West Bengal 6.24 4.95 17.05 6.44 2732.00 49.30
Haryana 4.40 3.49 16.97 6.41 3854.00 88.90
Maharashtra
(western India)
(western India)
11.62 9.22 13.92 5.26 1198.00 16.40
Bihar (eastern
India) (eastern
India)
6.67 5.29 13.15 4.97 1971.00 67.40
Karnataka 7.51 5.95 12.17 4.60 1622.00 28.20
Tamil Nadu 3.55 2.81 8.49 3.21 2396.00 63.50
Odisha 5.15 4.09 8.33 3.15 1617.00 29.00
Gujarat (Western
India) (Western
India)
4.29 3.40 8.21 3.10 1917.00 46.00
Chhattisgarh 4.95 3.93 7.58 2.86 1532.00 29.70
Assam 2.53 2.01 4.94 1.87 1952.00 4.60
Jharkhand 2.24 1.77 4.19 1.58 1874.00 7.00
Uttarakhand 0.89 0.71 1.78 0.67 2001.00 44.00
Others 3.26 2.59 6.38 2.41 -

15
State Area (m.
hectares)
(2013-14)
%of India
(2013-14)
Production
(million
tons)
(2013-14)
%of India
(2013-14)
Yield (kg per
hectare)
(2013-14)
% area
irrigated
(2011-12)
All India 126.04 100.00 264.77 100.00 2101.00 49.80
4.2.3. Programs supporting irrigation
It is worth mentioning that Government of India has taken many initiatives in the past.
Between 1991 and 2007, India invested (approx.) ~ USD 4, 000 million in public canal systems.
Yet the canal–irrigated area decreased by 38 lakh13 hectares during that period, as
infrastructure is old, water supply is unreliable, further there are no incentives. Similarly, even
after a decade of a 50 to 90% subsidy for the micro irrigation, it covers less than 5% of India’s
cultivated area. The government schemes have succeeded in some states although faltered in
others. Electric powered ground water exploitation has thus emerged is a unique confluence of
physical, policy and political factors that have trapped many states in a vicious spiral of decline
ground water, deteriorating water quality, stagnant crop productivity, deteriorating power
service delivery and poor financial health of power generation companies. Most state
governments provide subsidized or free electricity to farmers. It is well recognized that this has
resulted in water use overuse and resulted in declining groundwater tables. It is estimated that
Indian farmers use 2 to 4 times more water to produce a unit of major food crop than in China
or Brazil.14 Of this maximum 45% is shared by tube wells followed by canals and wells. The
various sources of irrigation in India for the years 2010-11 are listed in Table 2.
Table 2. Sources of irrigation in India (2010-11).
Canals Tanks Wells Tubewells Others Total
17005.7 2249.4 1149.4 29108.2 4289.2 64624.7
13 A lakh is a unit in the Indian numbering system equal to one hundred thousand (100,000; scientific notation:
105).
14 http://indiabudget.nic.in/es2015-16/echapvol1-04.pdf
16
(Source: Department of Agriculture and Cooperation (Agriculture Census 2010-11)
Government has given considerable importance to the development of command area under
canals. Earlier during 1950-1951, the canal irrigated area was 8.3 million ha which is now 17
million ha. Despite that, the relative importance of canals has come down from 40% in 1951 to
26% in 2010-11. Wells and tube wells accounted for 29% total irrigated area in 1951 and they
had a share of 64% of the total irrigated area in 2010-11.
4.3. Water use efficiency
Different approaches have been put forward for using water efficiently, some are listed below:
1. The method of irrigation followed in the country is flood irrigation, which results in a lot
of water loss. Greater efficiency in irrigation were achieved through:
Proper designing of irrigation system for reducing water conveyance loss.
Adoptions of water saving technologies such as sprinkler and drip irrigation systems
have proven extremely effective in not just water conservation but also leading to
higher yields.
New agronomic practices like raised bed planting, ridge-furrow method of sowing, sub-
surface irrigation, and precision farming which offer a vast scope for economizing water
use.
In this context, the Indian government has tried to inculcate new policies and schemes to
improve agricultural productivity, while simultaneously increasing water use efficiency. The
Indian government introduces schemes as commendable effort to increase irrigated area. One
example is the launching of (approx.) ~ USD 7,5 billion “Pradhan Mantri Krishi Sinchai Yojana
(PMKSY)”. This scheme provides a sound framework for the expansion and effective water use
in irrigation. The impact of this scheme can be greatly enhanced, however, by restoring the
original flexibility of the Mahatma Gandhi National Rural Employment Guarantee Act
(MGNREGA)15 in asset creation. Despite these efforts, still a specialized solution is required in
chronically water stressed areas where measures implemented until now were ineffective.
15 MGNREGA, is an Indian labour law and social security measure that aims to guarantee the 'right to work'.

17
Specialized solutions are required in chronically water stressed areas where the normal
measures may not be effective. Connecting highly water stressed areas with perennial water
sources through linking of rivers or water grids is one such option. The value added agri-horti-
pastoral agro-forestry systems and alternative sources of livelihoods are required in these
districts. These districts could be ideal candidates for prioritized intervention of watershed plus
activities (water conservation along with livelihood support activities) under the recently
launched PMKSY and convergence with MGNREGA. As previously noted, priority must be given
to the completion of on-going irrigation projects over initiation of new ones through
strengthening of programs such as Command Area Development Programme (CADP)16 and
Accelerated Irrigation Benefits Programme (AIBP)17. Promotion of alternative planting methods
such as a system of rice production intensification and direct seeded rice can lead to water
saving and productivity increases.
2. Water productivity can be improved by adopting the concept of multiple water use,
which is beyond the conventional sectoral barriers of the productive sectors. There is
scope for increasing income through crop diversification and integration of fish, poultry
and other enterprises in the farming system. The multiple water use approach can
generate more income benefits, and decrease vulnerability by allowing more diversified
livelihood strategies and increasing the sustainability of ecosystems.
3. Emphasis should be given on water resources conservation through watershed
development in suitable areas and development of micro-water structures for rainwater
harvesting. The promotion of water conservation efforts has direct implications for
water resources availability, groundwater recharge, and socio-economic conditions of
the population.
4. The effective water management is critically linked with the performance of local level
water institutions. Therefore, institutional restructuring in favor of participatory
irrigation management and water users associations (WUAs) needs to be strengthened. 16 Command Area Development Programme (CADP) was launched in December 1974 to improve irrigation
potential utilization and optimize agricultural production from irrigated land through integrated and coordinated
approach of efficient water management.
17 Accelerated Irrigation Benefit Programme (AIBP) from 1996-97 for extending loan assistance to states for the
completion of near complete irrigation scheme.
18
5. National Water Policy is emphasizing the concept of Participatory Irrigation
Management and WUA through active involvement of people in execution of irrigation
project. According to the latest data available, 56,539 WUA manage 13.16 million ha of
irrigated land. It will be useful to evaluate the effectiveness of this participatory
approach.
4.4. Virtual water flow
The virtual water flow18 from states like Punjab (Northern India) is raising questions on water
sustainability as if we continue with the current methods; ground water depletion by 2050 may
increase up to 75%. India exports water intensive crops such as rice. It is estimated that in 2010,
India exported about 25 km3 of water embedded in its agricultural exports. This is equivalent to
the demand of nearly 13 million people. India was a ‘net importer’ of virtual water until around
the 1980s, but with the increase in grain exports, India has now become a net exporter of
virtual water – about 1% of total available water every year.19 The ratio of export to import of
virtual water is about four for India and 0.1 for China. Thus China remains a net importer of
water. This is also evident in China and India’s trade patterns. China imports water intensive
soybeans, cotton, meat and cereal grains, while exporting vegetables, fruits and processed
food. India, exports water intensive rice, cotton, sugar, and soybean. Crops such as rice, which
use as much as 3,000 to 3,500 liters for production of 1 kg of grain, may actually be produced at
far off locations which are water richresulting in virtual water transfer from areas with plenty of
water to water deficient areas.
4.5. Programs and technologies related to water use efficiency
Various government subsidy programs are attempting to boost adoption of more efficient
technologies, with varying degree of success. Part of the logic behind this subsidy program is
the hope that the adoption of water saving technologies can reduce groundwater extraction
and stabilize water tables. However, groundwater is seldom regulated or even priced in India,
18 Virtual water flow refers to the hidden flow of water if food or other commodities are traded from one place to
another.
19 http://indiabudget.nic.in/es2015-16/echapvol1-04.pdf
19
and electricity used for pumping is heavily subsidized and often priced at a flat tariff. Recently,
the state of Madhya Pradesh (Central India) has introduced a programme on raised bed
planting of soybean. Planting of soybean on ridges has helped conserve water and raise
productivity. Micro irrigation via sprinklers and drips has helped bring dramatic change in
several pockets of the country especially in undulating topography and sand dunes areas where
no other methods of irrigation can work.
4.6. Institutional and Policy Aspects
In India, designing applicable institutional strategies to allocate scarce water and river flows has
been an enormous challenge due to the complex legal, constitutional, and social issues
involved. States like Andhra Pradesh (Southeastern coast of India), Madhya Pradesh (Central
India), and Maharashtra (Western India), have made substantial headways in reforming their
water institutions and governance structures by adopting legislations to promote participatory
irrigation management. The water sector faces the challenge of improving performance and
irrigation infrastructure. There is little agreement about appropriate institutional arrangements
and criteria for successful institutional design. In India’s Western corridor, from Punjab
(Northern India) down to Tamil Nadu (Southern India), this led to relentless groundwater
depletion and bankrupt electricity utilities. In the Eastern corridor, sitting on abundant aquifers,
the countryside got de-electrified; and irrigation by the poor has been impeded by high and
rising costs of diesel.
A wide range of institutional arrangements has evolved over the last few decades to use and
manage the increasing demand for irrigation in India. For example, in India most state
governments practice a Participatory Irrigation Management (PIM) approach defined by a
system of participation of the farmers as beneficiaries with a loose joint role in management of
the irrigation system. There is wide variation in the number of Water User Associations (WUAs)
set up in different states, ranging from more than 10,000 in Andhra Pradesh (Southeastern
coast of India) to less than 100 in Bihar (Eastern India).20 With the PIM approach in place, in
some cases partial autonomy was given to WUAs to jointly manage either primary or secondary
20 https://www.nabard.org/pdf/PIM_Report%20-%20AP.pdf

20
irrigation canals. In some cases, a chosen group of farmers or a committee collaborates with
the states’ irrigation department. In yet other cases, full autonomy is given to farmers to
manage the irrigation management system.
The success of institutional designs such as PIM is contingent to collaboration at different levels
to operate and maintain efficient irrigation systems. In India, however, infrastructure in most
rural farming areas has remained largely unmaintained and there is an emerging gap between
the irrigation potential created and the potential utilization. Specifically, WUAs were formed
without adequate institutional support and training services for farmers (resulting in low
standards of operation and maintenance) and many WUAs do not employ staff to carry out the
basic functions of water management, maintenance and record keeping resulting in poor
service delivery. For now, State governments are promoting solar pumps instead by offering 80
to 90% capital cost subsidies. Solar pumps must be promoted as integrated energy-water-
livelihoods solution. Current subsidy regimes fail to achieve any of these. Electricity tariffs differ
from state to state. The following table shows that Punjab (Northern India), Haryana and
Madhya Pradesh (Central India) actually offer the largest power subsidy to the agricultural
sector.
Table 3: Electricity tariffs and subsidies to the agriculture sector for 2014–15
State Power Tariff – Agricultural
Consumer (INR)
Subsidy To Agricultural Power (INR
million)
Haryana1 0.08 – 0.10 52,840
Punjab2 0 44,540
Maharashtra 3 2.10 35,000
Andhra Pradesh4 0.50 – 1.0 43,000
Tamil Nadu5 3.22 32,600
Gujarat (Western India) (Western
India)6
0.60 11,010
Madhya Pradesh)7 3.20 – 4.05 59,050
21
Source: Respective SERC tariff orders:
1.Haryana Electricity Regulatory Commission. (2014a, pp. 123–124)
2. Punjab (Northern India) State Electricity Regulatory Commission (2014, pp. 270 and 277)
3. Maharashtra (Western India) State Electricity Distribution Co. Ltd. (2012, p. 6)
4. Andhra Pradesh (Southeastern coast of India) Electricity Regulatory Commission (2013, pp. 170 and 175)
5. Tamil Nadu (Southern India) Electricity Regulatory Commission (2014, pp. 251 and 254)
6. Gujarat (Western India) Electricity Regulatory Commission (2014, p. 102)
7. Madhya Pradesh (Central India) Electricity Regulatory Commission (2014, pp. 90 and 170)
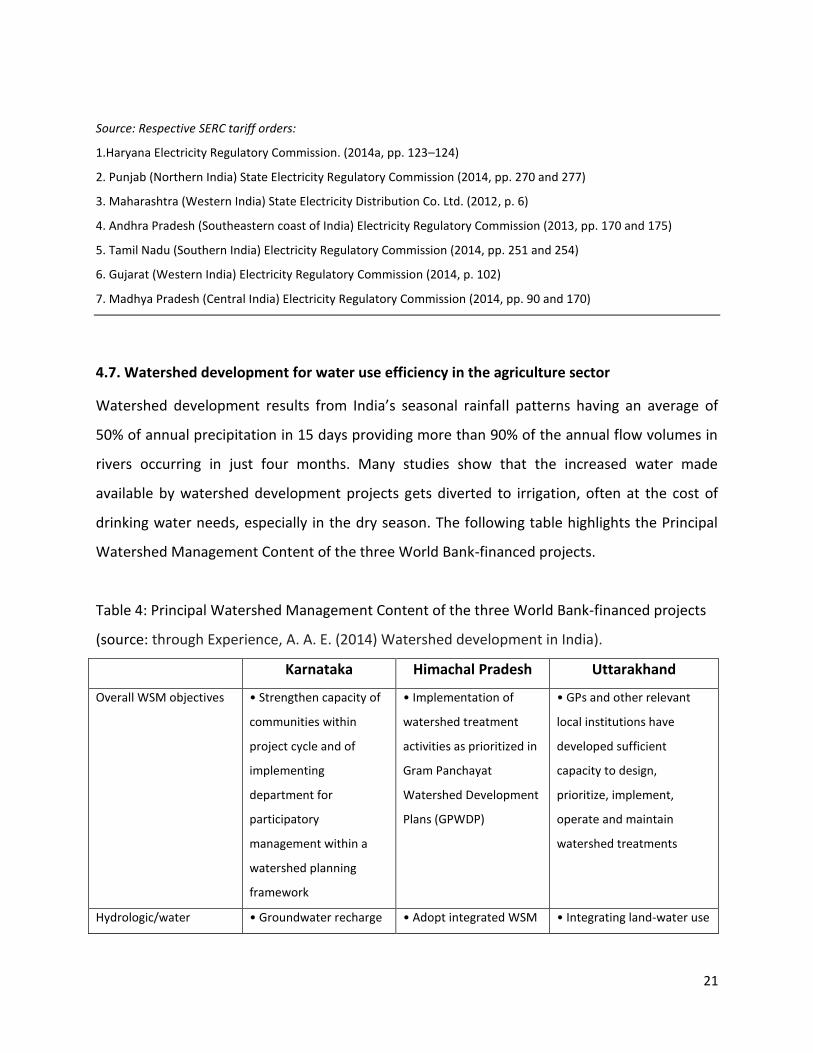
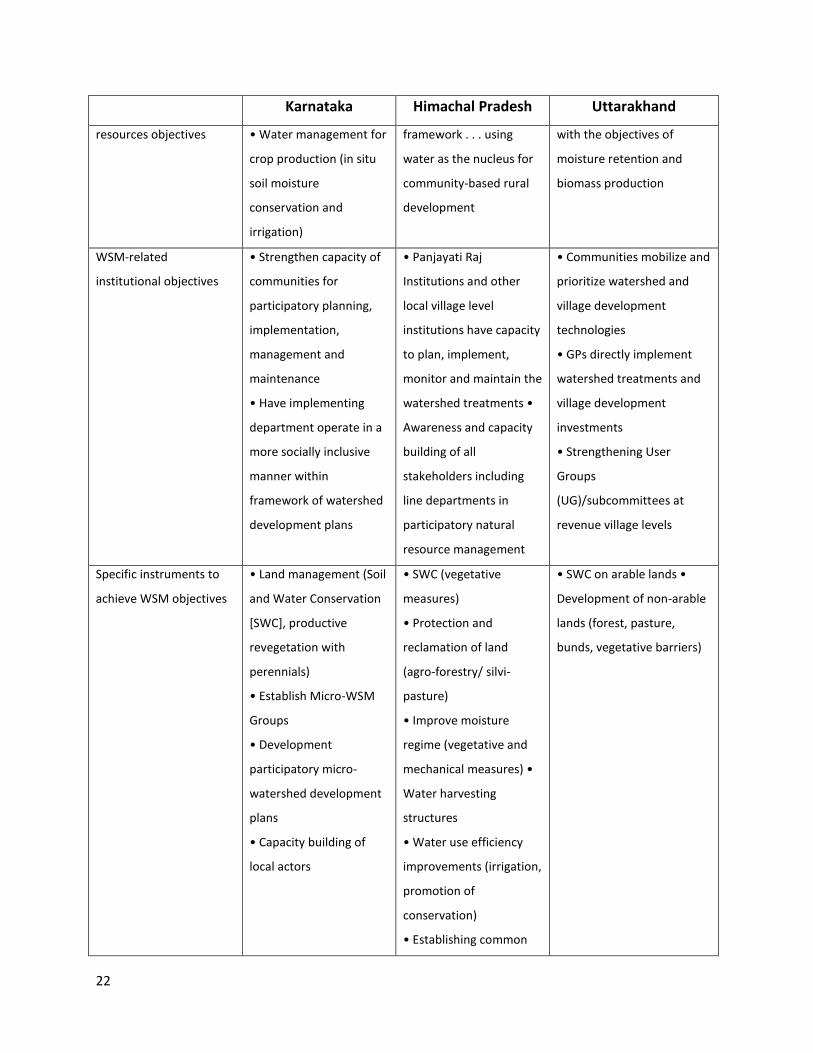
4.7. Watershed development for water use efficiency in the agriculture sector
Watershed development results from India’s seasonal rainfall patterns having an average of
50% of annual precipitation in 15 days providing more than 90% of the annual flow volumes in
rivers occurring in just four months. Many studies show that the increased water made
available by watershed development projects gets diverted to irrigation, often at the cost of
drinking water needs, especially in the dry season. The following table highlights the Principal
Watershed Management Content of the three World Bank-financed projects.
Table 4: Principal Watershed Management Content of the three World Bank-financed projects
(source: through Experience, A. A. E. (2014) Watershed development in India).
Karnataka Himachal Pradesh Uttarakhand
Overall WSM objectives • Strengthen capacity of
communities within
project cycle and of
implementing
department for
participatory
management within a
watershed planning
framework
• Implementation of
watershed treatment
activities as prioritized in
Gram Panchayat
Watershed Development
Plans (GPWDP)
• GPs and other relevant
local institutions have
developed sufficient
capacity to design,
prioritize, implement,
operate and maintain
watershed treatments
Hydrologic/water • Groundwater recharge • Adopt integrated WSM • Integrating land-water use
22
Karnataka Himachal Pradesh Uttarakhand
resources objectives • Water management for
crop production (in situ
soil moisture
conservation and
irrigation)
framework . . . using
water as the nucleus for
community-based rural
development
with the objectives of
moisture retention and
biomass production
WSM-related
institutional objectives
• Strengthen capacity of
communities for
participatory planning,
implementation,
management and
maintenance
• Have implementing
department operate in a
more socially inclusive
manner within
framework of watershed
development plans
• Panjayati Raj
Institutions and other
local village level
institutions have capacity
to plan, implement,
monitor and maintain the
watershed treatments •
Awareness and capacity
building of all
stakeholders including
line departments in
participatory natural
resource management
• Communities mobilize and
prioritize watershed and
village development
technologies
• GPs directly implement
watershed treatments and
village development
investments
• Strengthening User
Groups
(UG)/subcommittees at
revenue village levels
Specific instruments to
achieve WSM objectives
• Land management (Soil
and Water Conservation
[SWC], productive
revegetation with
perennials)
• Establish Micro-WSM
Groups
• Development
participatory micro-
watershed development
plans
• Capacity building of
local actors
• SWC (vegetative
measures)
• Protection and
reclamation of land
(agro-forestry/ silvi-
pasture)
• Improve moisture
regime (vegetative and
mechanical measures) •
Water harvesting
structures
• Water use efficiency
improvements (irrigation,
promotion of
conservation)
• Establishing common
• SWC on arable lands •
Development of non-arable
lands (forest, pasture,
bunds, vegetative barriers)

23
Karnataka Himachal Pradesh Uttarakhand
interest groups
• Information, education
and communication
• Local-level capacity
building
• Human resource
development of
implementing agencies
• Knowledge
management
• Harmonization of
watershed approaches
(state-level)
WSM-related indicators • Groundwater recharge:
increased cropping
intensity;% irrigated area
increase; # wells
recharged
• Soil erosion reduced •
Micro-WSM groups and
development plans
• SWC measures
• Watershed research
and extension plans
• Remote Sensing Center
assisting with Geographic
Information System (GIS)
and prep of treatment
plans for project
watersheds
• Influence on state
policies and guidelines
for watershed
development
• 2,500 UGs established
and taking care of
resources in a sustainable
manner
• Two-thirds of GPs with
tribals or nomads have
representation in
watershed committees
• 15% increase in
availability of water for
domestic and/ or
agriculture use.
• 20% improvement in
administrative capacity of
GPs.
• Water quantity and
quality indicators to be
incorporated
•% of activities in local plans
addressing water resource
management

24
4.8. Water rights and water pricing
Water rights
In India water rights are connected to land ownership. That essentially means that the land
owners have rights to extract water through wells on their lands. Also, they are encouraged to
collect rain water on their land.
Water pricing
Pricing water and water related services adequately can encourage people to waste less,
pollute less, invest more in water-related infrastructure, and value water shed services. In most
states, there is no payment of water fees or any other charge. Even in many states electricity is
provided free to pump water if water is to be used for irrigation purposes. The distorted water
pricing is resulting in over exploitation of the natural resources which may have long term
implication such as salination thus rendering good agricultural land unfit for growing crops, and
presence of heavy metals.
The state governments avoid withdrawing these provisions as farmers may consider high water
pricing as depriving of their entitlement, which could in turn lead to conflict and may also result
in increase in food prices.
5. Conclusions
Presently, India is facing a decrease in available water resources that has implications on India’s
agriculture sector. Several regions in the country are experiencing water stress. If water use
efficiency does not improve, the country could suffer under water scarcity in the next 1 to 2
decades. It is exceedingly important that the agriculture sector contributes to prevent the
exacerbation of the situation by making best use of the available technologies and resources to
increase water use efficiency. Improvement of policies, strategies and regulatory measures to
prevent the water misuse should be taken into consideration. Awareness and orientation of
water users in the agriculture sector to switch to more water efficient production methods can
help the country against water scarcity. Moreover, enforcement of best practices can help
present policy makers and planners to enhance governance structures to further understand
key indicators that can assist in data-driven decision-making. These challenges can be better

25
implicated, provided there are favorable policies and mechanisms that encourage the
agriculture sector to increase water use efficiency.
Further India’s Western corridor, the aim of solar pump promotion strategy should be to:
Reduce the deadweight subsidy burden on DISCOMs;
Reduce the huge carbon footprint of the groundwater economy; and
Remedy perverse incentive to over-exploit groundwater with subsidized electricity.
Target studies could include case studies of:
Groundwater management
Specific socio-economic impacts resulting from over abstraction and pollution caused by
the agriculture sector
Competition among water users (private and public) in regard to the agriculture sector.
6. Possible options for action
India must review its current trend of producing water intensive crops, such as sugarcane and
rice in water scarce areas. Also, it should review its policies related to exporting of water
intensive crops such as rice and cotton. Lack of adequate enforcement and monitoring or
existing water policies undermines water governance.
1. Technologies such as conservative agriculture should be popularized, as it is known to
increase water use efficiency.
2. Practicing conservation agriculture on a large scale has the added advantage of
conserving soil moisture, improving soil nutrient status, soil texture, less weeds, among
others.
3. Water pricing for the agriculture sector should be reviewed and revised.
4. Watershed development must be planned to pave way to safeguard the surface and
ground water recharge mechanisms.
5. Increase awareness to increase water use efficiency in the agriculture sector.

26
6. Declining water tables results in an increase in the cost of pumping, salination,
prescence of heavy metals etc, thus raising questions about the cost of crop production
and quality of the produce.
7. Introduce clearer incentive structure that improves the water use efficiency in the
agriculture sector thus ensuring long term sustainability of this natural resource.
8. Strengthening cross-sectoral water governance that includes the agriculture sector for a
better co-ordination and resolving conflicts.
9. Ensuring sustainable financing/subsidies to ensure that existing public irrigation
infrastructure is maintained.
Acknowledgement
I would extend thanks to Dr. Nameet Kaur for the basic research and prepration of the
manuscript.

27
Imprint
Published by:
OAV – German Asia-Pacific Business Association
within the frame of the Bilateral Cooperation Project on the Development of
International Cooperation with Asia, co-funded by the Federail Ministry of Food and
Agriculture (BMEL)
Author:
Dr. Vibha Dhawan, Distinguished Fellow and Senior Director New Initiatives and
Programmes, The Energy and Resources Institute (TERI)
Contact:
Alina Gumpert
Director German Agribusiness Alliance
OAV – German Asia-Pacific Business Association
Bleichenbrücke 9
20354 Hamburg
Germany
Tel.: +494035755936
Email: [email protected]
www.oav.de
www.german-agribusiness-alliance.de
Status:
January 2017