Water (2)
29
Our Water Resources
-
Upload
prembir-yadav -
Category
Technology
-
view
23 -
download
0
Transcript of Water (2)
Our Water Resources

Resources and ManThe Malthusian trapThe kinds of resources– renewable resources– Nonrenewable resources– Potentially renewable resources
The nature of exhaustibility

SELF-ACTUALI-ZATION
SOCIAL
SECURITY
PHYSIOLOGICAL
ESTEEM
Food is the most basic of allour needs
MASLOW’S HIERARCHY OF NEEDS

Oceans (71%)
Land(29%)
Most of theEarthiscoveredby water
“...water, water, every wherenor any drop to drink!”

In use
Potentialfarming
Unusable
Potentialgrazing
Cultivated11%
Grazed10%
14%Forests, semi-arid6% Arid
Ice, snow, deserts,mountains (51%)
8%Tropicalforests
Oceans (71%)
Land(29%)
andbarely a fifth of itis available forfarming related activities.
But the supply of land too is limited...

Economic growth exacerbates the demand for water, e.g.,
• with economic growth at 7-10% per year, poultry consumption is rising at the rate of 15% per year in India, Indonesia and China the water demands of this nontraditional industry are only likely to grow;
• we need about 250,000 gallons of water to produce a ton of corn, 375,000 gallons to produce a ton of wheat, 1,000,000 gallons to produce a ton of rice, and 7,500,000 of water to produce a ton of beef.

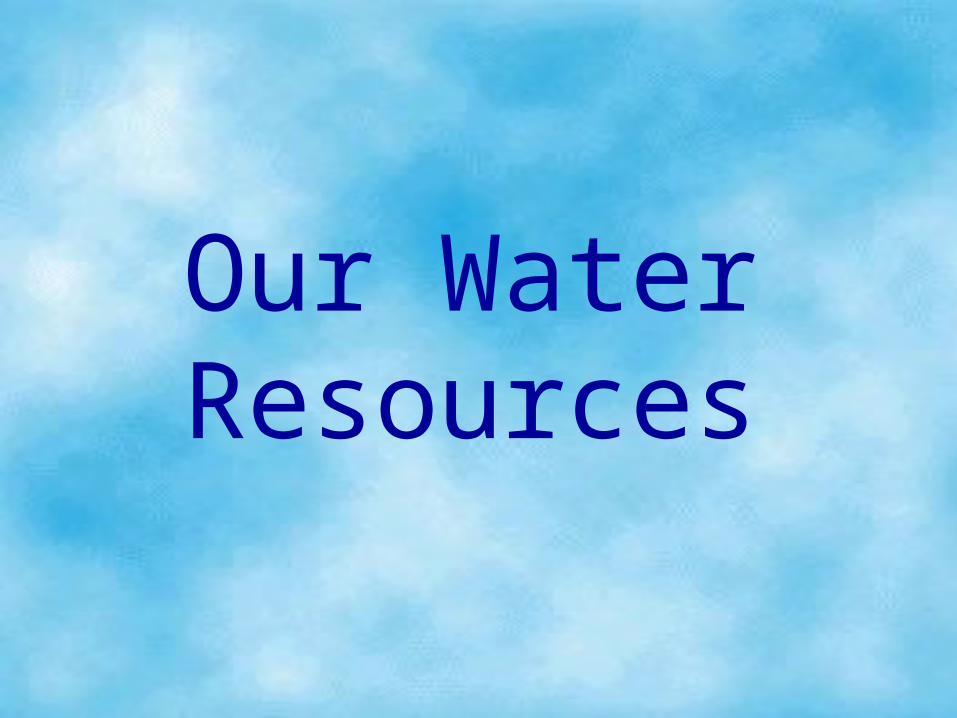
Farming (41%)Public(10%)
Industry(11%)Power-
Plant (38%)Farming (85%)
Public (6%)
Industry(7%)
Power-Plant (2%)
U.S.A. China
•to which we should also add industry’s needs.
Source: Worldwatch Institute
this comparison of U.S. and China shows how economic growth necessitates increased use of
water for nonagricultural purposes.

How much How much water do water do we have?we have?

http://ww2010.atmos.uiuc.edu/(Gh)/guides/mtr/hyd/smry.rxml
The hydrological cycleIgnoring such long-term effects as the changes in atmospheric storage conditions, run-off filling the ocean basins etc., hydro-logicalcycle ismerelythe re-cycling of waterbetweenland andoceans.

How much water in the hydrosphere?Conventional estimate assumesa total groundwater storage of about 1,700 quadrillion gallons. This gives the estimate of hydrosphere’s total water content as 3.5x10²⁰ gallons.
Oceans (97%)
Ice (1.2%)
Underground water (0.5%)Surface water (0.02%)
Atmosphericmoisture (0.001%)

An alternate assumption is that pores in sediments contain about 80,000 quadrillion gallons of groundwater (almost 50 times the conventional estimate). This yields an estimate of about 4x10²⁰ gallons of water in the entire hydroshere.
Oceans (80%)
Ground-water (19%)
Groundwater (19%)
Ice (1%)Surface water (0.002%)
Atmosphere(0.001%)
Farming (41%)Public(10%)
Industry(11%)Power-
Plant (38%)Farming (85%)
Public (6%)
Industry(7%)
Power-Plant (2%)
U.S.A. China
As is evident from the comparison of water use in the U.S. and China, economic growth necessitates increasing use of water for power generation.
Source: Worldwatch Institute
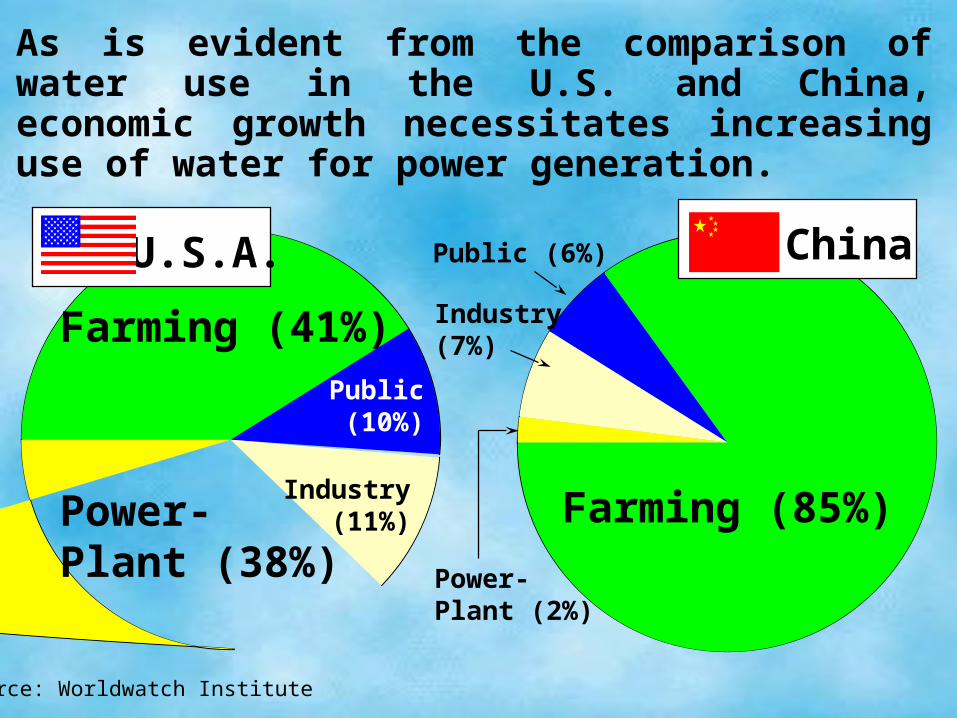
0.6
0.3
- 0.3
0.0
- 0.61900 1950 2000
Global mean temperature change through the past
century
Source: NOAA and NASA
5-yearrunningaverage
Tem
per
atu
re C
han
ge
(ºC
)

Se
a l
ev
el
rela
tiv
e t
o 1
95
1-7
0 (
cm
)
8
0
4
-12
-8
-4
1900 20001950
5-yearrunningaverage
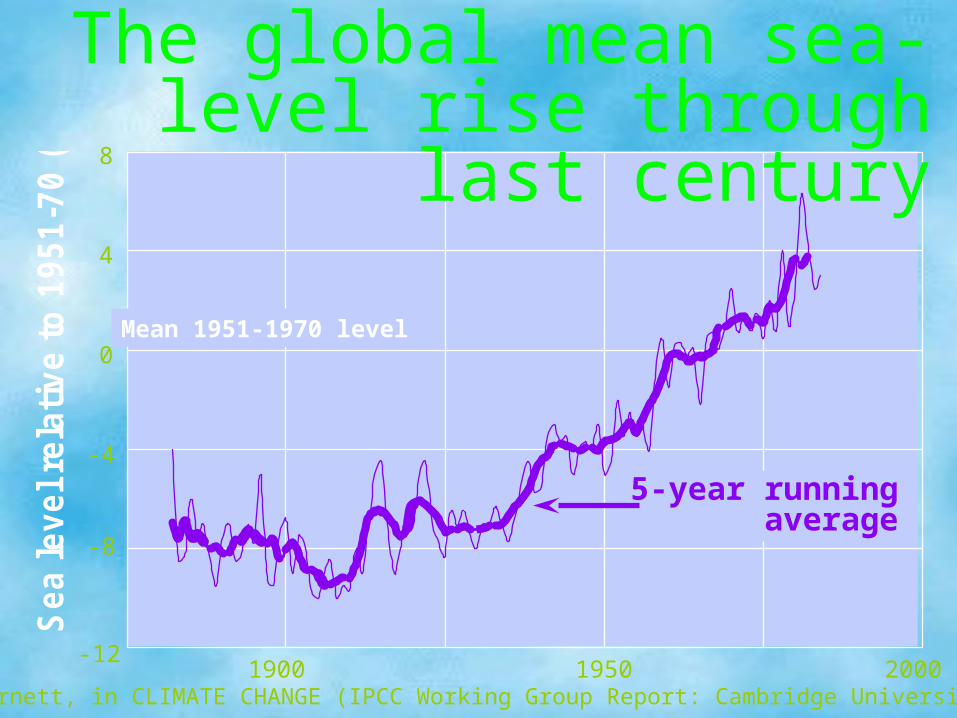
The global mean sea-level rise through last
century
Source: T.P. Barnett, in CLIMATE CHANGE (IPCC Working Group Report: Cambridge University Press, 1990)

Steric height (dynamic cm
)
Distance off California coast (km)500 400 300 200 100 0
100
95
90
85
80
1985-91
1950-56
0
100
200
300
400
500
0 0.3 0.6 0.9 1.2T (oC)
Dep
th (m
)The 1950-91 hydrographic data off California coast show that
sea surface waters (0-100m) became~0.8oC warmer in the 35-year period between 1950-56 and 1985-91; which
raised the sea level sur-face by 3.1+0.7 cm.
Note: Warming by 1oC the top 100 m of ocean with 15oC temperature and 3.4% salinity should raise the sea level by ~2.2 cm.
Source: D. Roemmich, SCIENCE: v. 257, p.373-375 (July 17, 1992).

80
85
90
95
100
0100200300400500
Distance off California coast (km)
Ster
ic he
ight (
dyna
mic c
m)
Dean Roemmich: Ocean warming and sea level rise along the southwest U.S. coast [Science: 257 ( 373-375), 1992]
1985-1991
1950-1956
Sea surface off California has risen by about 2 cm, on average, between 1950 and 1991

OceansPore water in the
sedimentsIce-caps, glaciers
Rivers, lakesAtmospheric
moisture
Total hydrosphere
Total mass(trillion tons)
1,370,000
330,00020,000
300
13
1,720,313
Share of thehydrosphere
80%
18.8%1.2%0.02%
0.0008%
100%
Considering all sediments*
Total mass(trillion tons)
1,370,000
7,00020,000
300
13
1,397,313
Share of thehydrosphere
97%
0.5%1.4%0.02%
0.0009%
100%
Conventional estimates
The availability of water too is a limiting factor. An average human needs about 300,000 gallons of water annually, including 250,000 gallons for growing food. Indeed, nations with under 150,000 gallons of annual per capita water supply face severe limits to their growth.
Mass of the present hydrosphere
*Karl K. Turekian: GLOBAL ENVIRONMENTAL CHANGE (Prentice Hall, 1996)

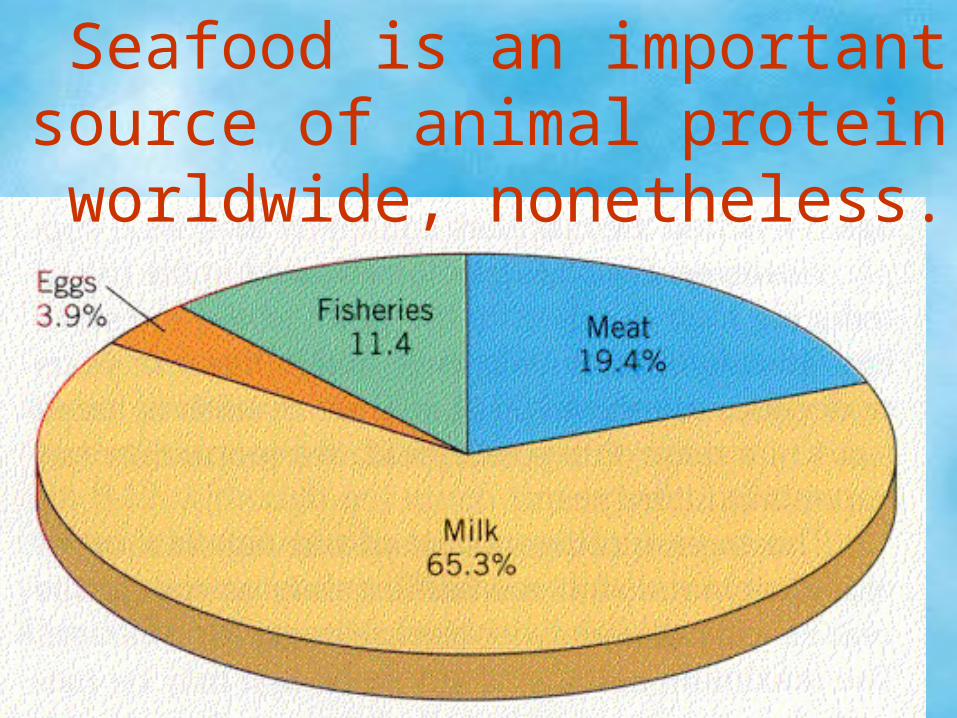
Seafood is an important source of animal protein worldwide, nonetheless.

That Climate Thing
•Global warming and its consequences
•The anthropogenic contributions
Number of Fatalities per Event3 30 300 3,000
3
0.3
0.03
Tornadoes
FloodsTornadoesHurricanesEarthquakes
Cu
mm
ula
tiv
e N
um
be
r o
f E
ve
nts
pe
r Y
ea
r
0.1
1
10
0.011 10 100 1,000 10,000
Floods
Hurricanes
Earthquakes
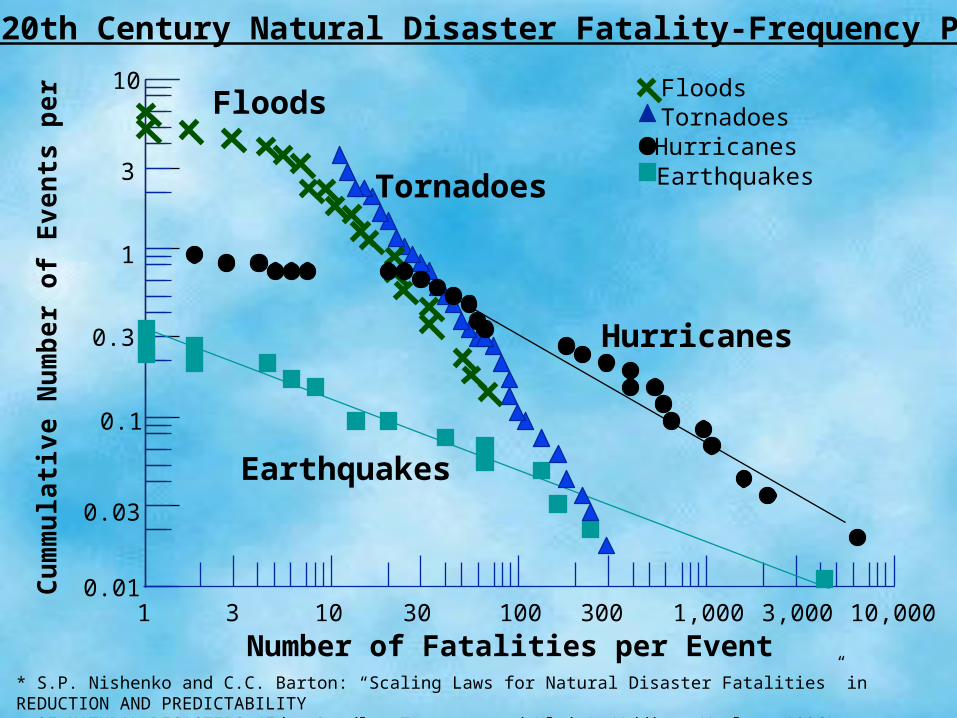
U.S. 20th Century Natural Disaster Fatality-Frequency Plots*
* S.P. Nishenko and C.C. Barton: “Scaling Laws for Natural Disaster Fatalities” in REDUCTION AND PREDICTABILITY OF NATURAL DISASTERS (Eds: Rundle, Turcotte and Klein) (Addison-Wesley, 1996)

* International Federation of Red Cross and Red Crescent Societies (The Economist, Sept 6, 1997)
High wind: 21%
Earthquake: 8%
Flood: 19%
Other naturaldisasters: 21%
Volcanoes: 1%
Drought & Famine: 6%Landslides: 3%
Man-madedisasters: 34%
Disasters*by type: 1971-96
Total: 8,219,000

Tem
pera
ture
Ch
an
ge (
C)
o
0.6
0.3
- 0.3
0.0
- 0.61900 1950 2000
Global mean temperature change through last
century
Source: Thomas Karl and C. Bruce Baker: GLOBAL WARMING UPDATE (NCDC-NOAA, 1994)
5-year runningaverage
1950-60 Mean level
Sea level
rela
tive t
o 1
951-7
0 (
cm
)
8
0
4
-12
-8
-4
1900 20001950
5-year runningaverage
The global mean sea-level rise through last
century
Source: T.P. Barnett, in CLIMATE CHANGE (IPCC Working Group Report: Cambridge University Press, 1990)
Mean 1951-1970 level

20%
0%
- 60%
- 20%
- 40%
Global warming will hurt the poor nations most!
Change in average national crop yield by the year 2,060 compared to yield corresponding to no change in climate
(based on the ocean-atmosphere coupling model) - SCIENCE NEWS, Aug 1992

Ocean Storage1,370,000,000 km3
The Hydrological Cycle
Precipitation285,000 km3
Evaporation320,000 km3
Precipitation95,000 km3
Evaporation60,000 km3
Run-off35,000 km3

Removable volume(in 1012 m3)
4.03.0
10.0
600.00.1
500.01.12.2
56.0220.0
3.38.6
-1.9
1406.7
North America
High plainsSouthwestCalifornia
Africa and Asia
SaharaSahel (soil water)ArabiaAral (Sea: 1960)Aral (groundwater)Caspian (Sea)Caspian (groundwater)
Worldwide
DeforestationWetland reductionDams
Total
Extraction rate(in 1010 m3/yr)
1.201.001.30
1.000.341.602.703.700.770.47
4.900.20
-
19.20
Sea-level riserate (mm/yr)
0.030.030.04
0.030.010.040.080.100.020.01
0.140.01
-
0.54
Estimated sea-levelchange to date (mm)
1.10 0.92 1.20
0.56 0.28 0.89 2.20 3.10 1.30 0.78
3.40 1.30-5.20
11.80
A century of human induced sea level rise*
* Walter Newman and Rhodes Fairbridge: The Management of Sea-level Rise (NATURE, v. 320, p. 319-328, 1986). Dork Sahagian, Frank Schwartz and David Jacobs: Direct Anthropogenic Contributions to Sea-level Rise in the Twentieth Century (NATURE: v. 367, p. 54-57, 1994).

Ocean Storage1,370,000,000 km3
The Hydrological Cycle
Evaporation320,000 km3
Precipitation285,000 km3
Evaporation60,000 km3
Precipitation95,000 km3
Run-off
35,000 km3
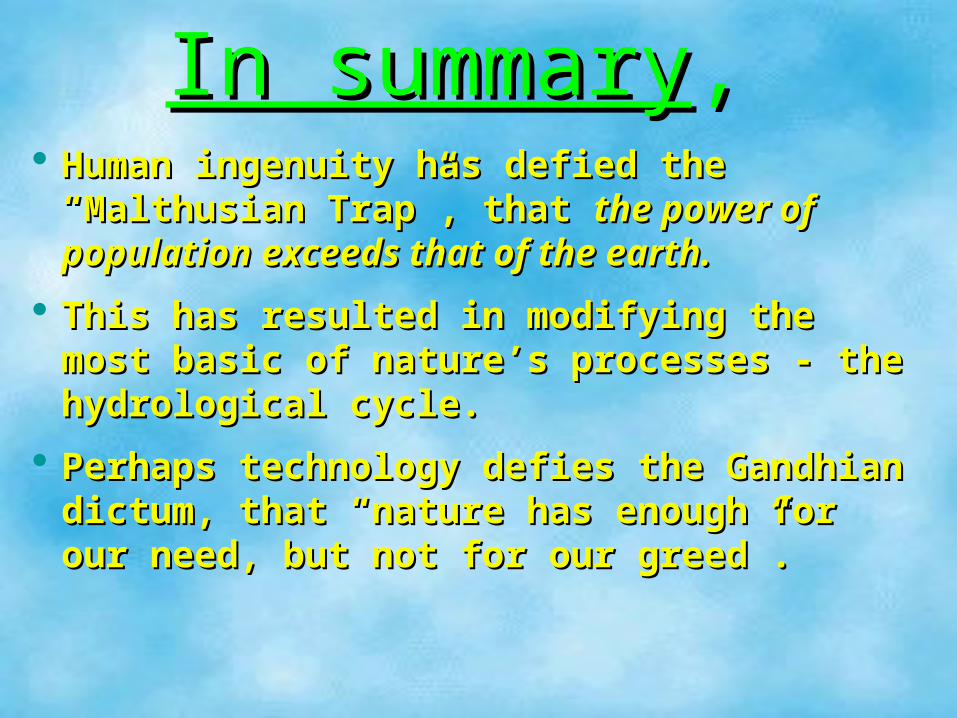
In summaryIn summary,, Human ingenuity has defied the “Malthusian Human ingenuity has defied the “Malthusian
Trap”, that Trap”, that the power of population exceeds the power of population exceeds that of the earth.that of the earth.
This has resulted in modifying the most basic This has resulted in modifying the most basic of nature’s processes - the hydrological cycle.of nature’s processes - the hydrological cycle.
Perhaps technology defies the Gandhian Perhaps technology defies the Gandhian dictum, that “nature has enough for our dictum, that “nature has enough for our need, but not for our greed”.need, but not for our greed”.