Wastewater Treatment Plant Capacity Report 3-18-2015
22
Northfield Township WWTP Capacity Evaluation Report March 18, 2015 PRESENTED TO PRESENTED BY Northfield Township 8350 Main Street Suite A Whitmore Lake, Michigan 48189 Tetra Tech 710 Avis Drive Suite 100 Ann Arbor, Michigan 48108 P +1-734-665-6000 tetratech.com
-
Upload
jgnelson -
Category
Government & Nonprofit
-
view
220 -
download
0
Transcript of Wastewater Treatment Plant Capacity Report 3-18-2015

Northfield Township WWTP Capacity Evaluation Report March 18, 2015
PRESENTED TO PRESENTED BY
Northfield Township
8350 Main Street
Suite A
Whitmore Lake, Michigan 48189
Tetra Tech
710 Avis Drive
Suite 100
Ann Arbor, Michigan 48108
P +1-734-665-6000
tetratech.com

Northfield Township WWTP Capacity Evaluation Report
i
TABLE OF CONTENTS
1.0 INTRODUCTION ..................................................................................................................................................1
2.0 EXISTING WASTEWATER INFRASTRUCTURE ...............................................................................................1
2.1 Infrastructure History and Configuration ........................................................................................................1
2.2 WWTP Flow Rates .........................................................................................................................................2
3.0 WASTEWATER SERVICE TO GREEN OAK TOWNSHIP .................................................................................2
4.0 FUTURE WASTEWATER SERVICE IN NORTHFIELD TOWNSHIP .................................................................3
4.1 Lake Point SAD ..............................................................................................................................................3
4.2 North Territorial SAD ......................................................................................................................................3
4.3 Seven Mile Road SAD ...................................................................................................................................5
4.4 Whitmore Lake Road SAD .............................................................................................................................5
5.0 SUMMARY OF ADDITIONAL FLOWS TRIBUTARY TO THE WWTP ...............................................................6
6.0 ALTERNATIVES TO MANAGE NEW CONNECTIONS ......................................................................................6
6.1 Average Flows ...............................................................................................................................................7
6.2 Wet Weather Flows ........................................................................................................................................8
7.0 GROWTH POLICY ............................................................................................................................................ 11
8.0 PROJECT FUNDING ........................................................................................................................................ 12
9.0 SUMMARY AND RECOMMENDATIONS......................................................................................................... 12
9.1 Summary ..................................................................................................................................................... 12
9.2 Recommendations ...................................................................................................................................... 13
LIST OF TABLES
Table 1: REUs and Average Daily Wastewater Flow in the North Territorial SAD ....................................................3 Table 2: REUs and Average Daily Wastewater Flow in the Seven Mile Road SAD ..................................................5 Table 3: REUs and Average Daily Wastewater Flow in the Whitmore Lake Road SAD ............................................6 Table 4: Summary of Additional Flows Tributary to the Northfield Township WWTP ................................................6 Table 5: Timeline of Recommended Improvements ................................................................................................ 13
LIST OF FIGURES
Figure 1: Map of Special Assessment Districts ..........................................................................................................4 Figure 2: Composite 25-year, 24-hour I/I Hydrograph Constructed from Individual Event Projections .....................9 Figure 3: Spring Design Storm Hydrograph with Treatment Capacity of 1.3 MGD and No Growth ....................... 10 Figure 4: Spring Design Storm Hydrograph with Treatment Capacity of 1.3 MGD, and 800 REUs Growth .......... 11

Northfield Township WWTP Capacity Evaluation Report
ii
APPENDICES
APPENDIX A: GREEN OAK TOWNSHIP AGREEMENTS
APPENDIX B: DATA USED FOR THE DEVELOPMENT OF THE 25-YEAR, 24-HOUR HYDROGRAPH
ACRONYMS AND ABBREVIATIONS
Acronym/Abbreviations Definition
gpd gallons per day
I/I infiltration and inflow
MDEQ Michigan Department of Environmental Quality
MG million gallons
MGD million gallons per day
NPDES National Pollution Discharge Elimination System
REU residential equivalent unit
SAD special assessment district
SRF State Revolving Fund
SSES Sewer System Evaluation Survey
WWTP wastewater treatment plant

Northfield Township WWTP Capacity Evaluation Report
iii
EXECUTIVE SUMMARY
Northfield Township owns and operates a wastewater treatment plant and sanitary collection system, which has
an average flow rate of 0.7 MGD and can be as high as 0.9 MGD during the spring season. This is less than the
treatment capacity of 1.3 MGD, but with potential future development, improvements will be necessary. The
Township engaged Tetra Tech to define the potential growth within the existing wastewater service area and
identify improvements necessary at the wastewater treatment plant to meet the growth. Tetra Tech used flow data
measured at the influent of the wastewater treatment plant as a basis point to estimate the magnitude and
timeline for the improvements. The purpose of this report is to document the level of projected growth, summarize
the analysis used to develop recommendations, and summarize the recommendations.
In addition to service areas within Northfield Township, flows from neighboring Green Oak Township are also
treated at the Northfield Township wastewater treatment plant. Two service agreements between the two
townships specifies that Green Oak Township can discharge an additional 227,000 gallons per day (equivalent to
873 REUs) to Northfield Township than it does currently.
The four sanitary sewer special assessment districts in Northfield Township have a potential to include an
additional 1,865 REUs with a design average day flow of 485,000 gallons per day. Three of these SADs have
been in place several years with only modest recent interest in development and in new connections being made.
However, should this development occur, improvements will be needed to meet both the additional daily flow and
to meet the requirements of the state for wet weather flows up to the 25-year, 24-hour design storm. An increase
in treatment capacity will address dry weather flow requirements, while a long-planned storage basin at the
wastewater treatment plant will address wet weather flow requirements.
The initial recommendation is to construct a storage basin large enough to meet future needs up to the next
expansion in treatment capacity because the cost of the storage will be less than the cost of the facilities required
to increase the treatment rate. A 1.7 million gallon storage basin is recommended in the near term before much
growth occurs. The basin size may be able to be made smaller through a more detailed analysis during the
preliminary design of the facility. Previous analysis of the WWTP indicated the basin will equalize peak flows and
allow an even higher rate of flow to be treated. When between 800 and 1,500 REUs of growth occurs (the lower
end corresponding to no storage basin and the upper end corresponding to a condition where the storage basin is
in place), a commitment to increase the WWTP capacity will need to be made.
If the Township decides to construct the recommended storage and wants to pursue construction funding through
the State Revolving Fund Loan Program, additional intermediate studies are required to secure the funding.
These intermediate studies will take multiple years to complete; therefore, pursuit of funds through the state’s loan
program will likely mean that funding will not be available until at least July 2017. Should the Township desire to
initiate construction earlier, the Township will need to arrange its funding through another source.

Northfield Township WWTP Capacity Evaluation Report
1
1.0 INTRODUCTION
Northfield Township owns and operates a wastewater collection and treatment system that serves portions of
Northfield and Green Oak Townships, but has not previously adopted a defined sanitary sewer service area. The
Township has evaluated developments on a case-by-case basis. A formal sanitary sewer master plan has been
discussed but is yet to be completed. Developing a wastewater master plan for Northfield Township is a large
undertaking. As an initial step in better understanding the sewer system needs, the Board of Trustees elected to
initiate this study of the sewer system to better understand the Township’s wastewater treatment needs. This
study has the following objectives:
Update the Township’s sanitary sewer map to include changes since the last map was created in 1996
Identify potential development in the existing special assessment districts within Northfield Township and
the likely flow impact on the Township’s wastewater treatment plant (WWTP)
Understand the commitment to provide sewer service to Green Oak Township and the likely flow impact
at the WWTP
Conceptually size a wet weather storage tank (also referred to as an equalization basin) at the
Township’s WWTP
A smaller scale revised sewer map is included in this document, and a full scale map will be delivered to the
Township separately.
Two other components that are commonly included in a master plan have been deferred to a later time, including
the detailed analysis of wastewater treatment plant expansion(s) and impacts to the collection system caused by
potential growth. Impacts to the collection system generally require flow monitoring and detailed calculations to
fully understand.
2.0 EXISTING WASTEWATER INFRASTRUCTURE
2.1 INFRASTRUCTURE HISTORY AND CONFIGURATION
The Township’s WWTP was originally constructed in 1961 to serve a State of Michigan correctional facility. The
WWTP was then purchased by Northfield Township and sewer systems were constructed through the 1970s to
initially serve portions of Green Oak Township and Northfield Township around Whitmore Lake and portions of
Northfield Township around Horseshoe Lake. Expansion of the system continued in the 1980s and 1990s to serve
growing residential development.
The Township’s existing wastewater treatment plant has a National Pollution Discharge Elimination System
(NPDES) permit limit of 1.3 MGD. This is a nominal limit on the average daily flow that the WWTP may accept,
treat and discharge. Peak flows into the WWTP may be higher than this and are allowed as long as the WWTP
can acceptably process and treat the water. Calculations by Tetra Tech in 2005 suggest that the WWTP may be
able to treat up to 1.5 MGD on average and meet limits if the peak flows into the WWTP are controlled through
the use of a storage basin.
The WWTP has been expanded and upgraded numerous times since its 1961 construction. In its current
configuration, the plant provides primary treatment (clarification), secondary treatment with a trickling filter and a
second stage activated sludge process, and tertiary treatment with travelling bridge sand filters. The wastewater
is disinfected with chlorine gas and receives post aeration by a cascade before being discharged to the
Horseshoe Lake Drain.
Northfield Township WWTP Capacity Evaluation Report
2
WWTP operations staff indicate that they can routinely treat a peak flow rate of 2.5 to 3.0 MGD. However, they
also indicate that the sand filters have reduced capacity due to suspected biological fouling of the underplates.
These plates are due to be refurbished in the next few years. In its present configuration, the sand filters can only
process a peak flow rate of approximately 2 MGD.
2.2 WWTP FLOW RATES
Average flows to the WWTP are lower than the permit limit of 1.3 MGD. Between 2011 and 2014, the WWTP
averaged 0.7 MGD of influent flow. In the spring, when more precipitation and a higher groundwater table typically
occur, the average flow was 0.9 MGD.
During wet weather, influent flows to the WWTP increase. On several occasions the Township has observed the
peak flow into the WWTP reaching 3 MGD, which is the limit that can be measured at the WWTP. This increase in
flows with wet weather is typical of older systems and is due to stormwater and groundwater being allowed to
enter the sewer system. This water is referred to as infiltration/inflow (I/I) and can occur due to leaks in the public
sewer, leaks in the privately-owned laterals, and improper connections made to either the publicly-owned system
(such as storm drains) or to privately-owned parts of the system (such as basement sump pumps).
The Township has not previously conducted a comprehensive evaluation of I/I. However, in 1999, a brief flow
monitoring program was conducted that showed that most parts of the Township’s sewer system experienced
flow increases with rainfall. Thus, the I/I was not isolated to a single part of the system. The Township also
conducted a survey that showed that several homeowners had sump pumps connected to the sanitary sewer.
While these connections are in violation of the Township’s sewer use ordinance, there is no record that the
Township followed up on removing these sources of I/I. It is also known that high water levels in Horseshoe Lake
have submerged toilets and other sewer inlets creating lake inflow.
3.0 WASTEWATER SERVICE TO GREEN OAK TOWNSHIP
Wastewater service to Green Oak Township originated in the 1960s and 1970s concurrently with service to
Northfield Township. The majority of this early service area occurred around the perimeter of Whitmore Lake.
A 2001 agreement between the Townships allows an additional 124 REUs to be connected within the existing
service area around Whitmore Lake. Mr. St. Charles, Green Oak Township Supervisor, indicated in a telephone
call that Green Oak Township’s records show that 20 REUs around the lake have been connected since the 2001
agreement. Therefore, 104 REUs remain to be connected from Green Oak Township around Whitmore Lake. At
260 gallons/day, these 104 REUs produce an average daily flow of 27,040 gallons/day.
Sometime after 2001, Green Oak Township approached Northfield Township about serving an additional area in
Green Oak Township. Northfield and Green Oak Township entered into a sewer service agreement dated
November 11, 2004, to serve development in a designated area west of US-23 and north of 8 Mile Road. This
agreement specifies that an additional 200,000 gallons of average daily flow will be allowed from Green Oak
Township equivalent to 1,600 residential equivalent units (REUs). These agreements with Green Oak Township
are presented in Appendix A.
Recent discussions with Green Oak Township resulted in a determination that a negligible amount of
development has occurred in this new service area, so Northfield Township has a remaining obligation of
approximately 200,000 gallons per day (gpd) to Green Oak Township. The discussions with Green Oak Township
also addressed the 1,600 REUs mentioned in the agreement. Northfield Township’s engineering standards define
one REU equal to 260 gpd of average daily flow. Thus, 200,000 gallons equates to 769 REUs, not the 1,600
REUs listed in the agreement. Green Oak Township Supervisor Mark St. Charles indicated that Green Oak
Township was likely to honor the 769 REU allocation.

Northfield Township WWTP Capacity Evaluation Report
3
In summary, the agreement with Green Oak Township suggests that Northfield Township is obligated to provide
an additional 873 REUs, or an equivalent average daily flow rate of 227,040 gpd.
4.0 FUTURE WASTEWATER SERVICE IN NORTHFIELD TOWNSHIP
Northfield Township has existing obligations to provide wastewater service to four special assessment districts
(SADs). The SADs were created specifically to provide wastewater service. The four SADs include the Lake Point
SAD, North Territorial SAD, Seven Mile Road SAD, and Whitmore Lake Road SAD, and are shown on Figure 1.
Northfield Township’s design standard for average daily wastewater flow is 260 gpd per REU. The density of
REUs for a particular zoning type is an estimate based on minimum lot size in the Township’s zoning ordinance
and values used on past planning projects.
4.1 LAKE POINT SAD
The Lake Point SAD was established in 2003. The SAD is small, consisting of four parcels along Lake Point Drive
on a peninsula extending into Whitmore Lake. All of the parcels are zoned single family residential or low density
residential and appear to be developed and understood to be already connected to the WWTP. There are four
total REUs in this SAD, all of which are currently connected to the WWTP.
4.2 NORTH TERRITORIAL SAD
The North Territorial SAD was established around 2000 to provide wastewater service to a planned commercial
area. A trunk sewer, pump, station, and force main were constructed. The force main discharges to the
Township’s Eight Mile Road Pump Station. To date, only a few parcels within the SAD have connected to the
trunk sewer representing about 49 REUs. The concept for this SAD was that the area could be expanded both
west and east as development demanded more wastewater service. Only the area within the current SAD is
depicted on Figure 1. Table 1 shows the estimated wastewater demand for parcels within the current district
limits.
Table 1: REUs and Average Daily Wastewater Flow in the North Territorial SAD
Zoning
Parcel Density,
REUs / acre
Current
Parcels
Total Area,
acres Ultimate REUs
Average Daily
Wastewater
Flow, gpd
Local
commercial
3.0 3 16.59 50 13,000
General
commercial
3.0 14 167.95 504 131,040
Planned
shopping center
3.5 4 87.29 306 79.560
Research,
technology,
manufacturing
2.5 18 323.58 809 210,340
Total - 39 595.41 1,669 433,940

Northfield Township WWTP Capacity Evaluation Report
4
Figure 1: Map of Special Assessment Districts

Northfield Township WWTP Capacity Evaluation Report
5
4.3 SEVEN MILE ROAD SAD
The Seven Mile Road SAD was established in approximately 2003 to serve the area along Seven Mile Road
southeast of Whitmore Lake. The sewer has been constructed but only three connections have been made
consisting of three REUs. Table 2 shows the estimated wastewater demand for the SAD.
Table 2: REUs and Average Daily Wastewater Flow in the Seven Mile Road SAD
Zoning
Parcel
Density,
REUs / acre
Current
Parcels
Total Area,
acres
Ultimate
REUs
Average
Daily
Wastewater
Flow, gpd Notes
Agricultural 0.2 5 43.89 8 2,080 Assumes 3
parcels are
split into two
parcels each
Low density
residential
0.5 10 21.60 13 3,380 Assumes 1
parcel is split
Recreational
conservation
0.1 5 108.80 11 2,860 Assumes 1
parcel is split
Single family
residential
4.0 2 45.14 140 36,400 20 percent of
area allotted
for right-of-
ways.
Remaining
area
developed at
4 parcels per
acre
Total - 22 219.43 172 44,720 -
4.4 WHITMORE LAKE ROAD SAD
The Whitmore Lake Road SAD was established in 2013 to provide sewer service to 24 parcels along Whitmore
Lake Road south of North Territorial Road. The Whitmore Lake SAD is tributary to the sewer improvements
funded by the North Territorial SAD. No sewers have yet been constructed. Table 3 shows the estimated
wastewater demand for the SAD. The basis of design for the Whitmore Lake Road district estimated a total of 76
REUs to be served.

Northfield Township WWTP Capacity Evaluation Report
6
Table 3: REUs and Average Daily Wastewater Flow in the Whitmore Lake Road SAD
Zoning
Parcel Density,
REUs / acre
Current
Parcels
Total Area,
acres Ultimate REUs
Average Daily
Wastewater
Flow, gpd
Agricultural 0.2 14 64.61 14 3,640
Limited
industrial
1.0 8 45.27 43 11,180
Local
commercial
3.0 2 6.52 19 4,940
Total - 24 116.40 76 19,760
5.0 SUMMARY OF ADDITIONAL FLOWS TRIBUTARY TO THE WWTP
In the build-out condition, a total of 2,794 REUs were estimated to be served by the WWTP within the current
SAD boundaries and growth areas within Green Oak Township. Of these 2,794 REUs, 56 are already connected
to the sewer system leaving 2,738 to potentially connect. These REUs would increase the average daily flow
beyond the existing WWTP capacity. Furthermore, as the existing treatment capacity is approached, there will be
a greater need to provide storage for both daily fluctuations in the flow and wet weather peaks. A summary of the
growth is provided in Table 4.
Table 4: Summary of Additional Flows Tributary to the Northfield Township WWTP
Community Location
Additional
REUs
Additional Average Daily
Wastewater Flow, gpd
Green Oak Township around Whitmore Lake (2001 agreement) 104 27,040
west of US-23 (2004 agreement) 769 200,000
Subtotal 873 227,040
Northfield Township Lake Point SAD1
0 0
North Territorial SAD 1,620 421,200
Seven Mile Road SAD 169 43,940
Whitmore Lake Road SAD 76 19,760
Subtotal 1,865 484,900
Total 2,738 711,940 1 These properties are already developed and connected to the WWTP.
6.0 ALTERNATIVES TO MANAGE NEW CONNECTIONS
Determining available capacity is not a straightforward determination. A wastewater utility must consider
treatment capacity during dry weather, treatment capacity during wet weather, and sewer system capacity.
Analysis of the sewer system capacity was not an objective of this evaluation, however, average and wet weather
conditions are discussed below.
Northfield Township WWTP Capacity Evaluation Report
7
6.1 AVERAGE FLOWS
The average flow for existing conditions is approximately 0.7 MGD and 0.9 MGD during springtime highs. The
WWTP’s rated capacity is presently 1.3 MGD with the potential of 1.5 MGD if storage is provided. Thus, there is
existing WWTP capacity during average conditions to accommodate new connections.
The Michigan Department of Environmental Quality (MDEQ) is generally reluctant to allow new connections to a
WWTP when the flow approaches 85 percent of the facility’s rated capacity. Assuming a treatment capacity of 1.3
MGD, this necessitates a decision on an expansion when rates reach 1.1 MGD (1.3 x 0.85). Assuming a
treatment capacity of 1.5 MGD, this necessitates a decision on an expansion when rates reach 1.3 MGD (1.5 x
0.85).
In 2005, Northfield Township explored a WWTP expansion to address the new connections it committed to in the
2004 agreement with Green Oak Township. That expansion was conceived to construct a storage basin and
expand the treatment capacity to 2.25 MGD. Development did not occur and this expansion was not
implemented.
Available capacity calculations are found below for various scenarios. The first two calculations consider growth
without differentiating new connections between Green Oak Township and Northfield Township. The last two
scenarios were calculated assuming the capacity in the Green Oak contract is reserved.
A summary of potential capacity available during average conditions without reserving capacity for Green Oak
Township follows (assuming no storage provided):
Allowable Rate before
Expansion (MGD) Springtime Rates (MGD) Allowable Increase (MGD) Allowable Increase (REU)
1.1 0.9 0.2 800
The summary of potential capacity available during average conditions without reserving capacity for Green Oak
Township follows (assuming storage provided):
Allowable Rate before
Expansion (MGD) Springtime Rates (MGD) Allowable Increase (MGD) Allowable Increase (REU)
1.3 0.9 0.4 1,500
The summary of potential capacity available during average conditions and reserving 0.227 MGD for Green Oak
Township follows (assuming no storage provided):
Allowable Rate before
Expansion (MGD) Springtime Rates (MGD) Allowable Increase (MGD) Allowable Increase (REU)
1.1 0.9 0 0
The summary of potential capacity available during average conditions and reserving 0.227 MGD for Green Oak
Township follows (assuming storage provided):
Allowable Rate before
Expansion (MGD) Springtime Rates (MGD) Allowable Increase (MGD) Allowable Increase (REU)
1.3 0.9 0.173 700

Northfield Township WWTP Capacity Evaluation Report
8
6.2 WET WEATHER FLOWS
Storing wastewater during peak flow rates is a proven technique for managing flows in excess of the treatment
capacity. Flows in excess of the treatment capacity are temporarily stored and returned to the system after the
peak flows abate. Many, and perhaps most, wastewater treatment plants have storage tanks. The existing
Northfield WWTP does not have any storage capacity. However, storage has been discussed for the WWTP
since at least 1988 without the construction occurring.
In 2002, the State of Michigan adopted a policy on controlling untreated overflows from sewer systems. This
policy requires that sewer systems control overflows for storms up to and including the 25-year, 24-hour storm.
This storm is defined as 3.9 inches of rainfall in 24 hours throughout the state.
Flows measured at the WWTP for four severe storms between 2011 and 2014 were used to project a hydrograph
for the 25-year, 24-hour storm, which can be added to a base flow to estimate the storage volume that would be
necessary to eliminate overflows at the WWTP for events up to that size. The procedure used to create the
hydrograph used for the 25-year, 24-hour storm followed these steps:
The second through fifth most extreme events from 2011 to 2014 between April and October of each of
those years, in terms of volume measured at the WWTP, were identified. The most extreme event,
beginning on May 25, 2011, was excluded because it is known that inflow from Horseshoe Lake was
occurring during and following this rainfall. The four rainfalls used in the analysis included:
o April 27-28, 2011, 2.17 inches of rain, 3.0 million gallons (MG) of I/I estimated at the WWTP
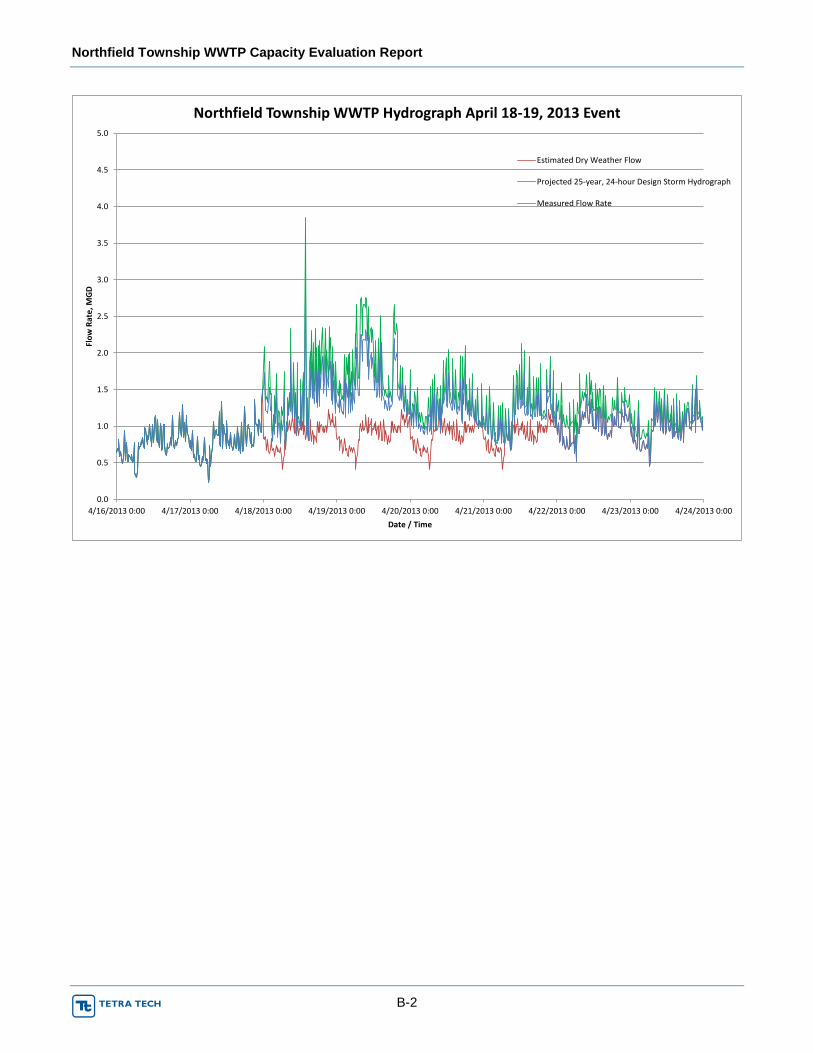
o April 18-19, 2013, 2.43 inches of rain, 1.7 MG of I/I
o May 12-15, 2014, 4.30 inches of rain, 4.3 MG of I/I
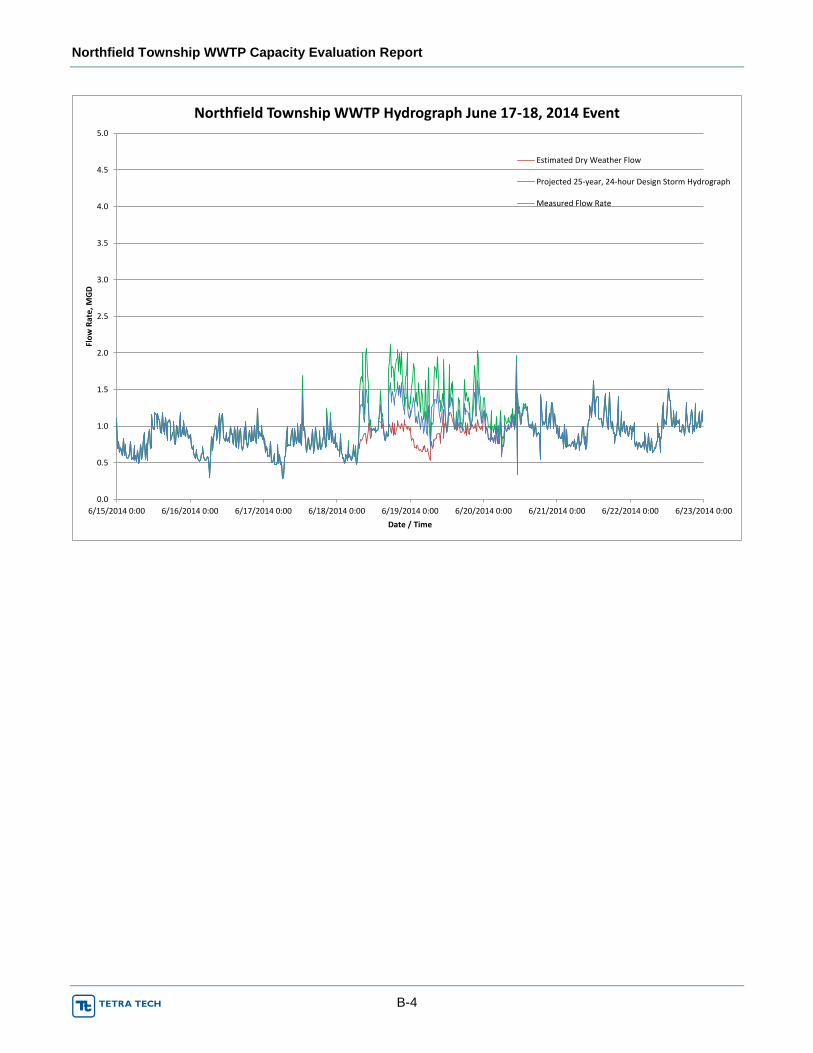
o June 17-18, 2014, 2.03 inches of rain, 0.5 MG of I/I
The I/I and base flow components of the hydrograph were estimated. Plots of the components for each of
the events are shown in Appendix B.
The I/I component of the flow was projected to the 25-year, 24-hour design storm using a ratio of the
design storm rainfall to the actual rainfall.
The individual projections were averaged over an hourly period to smooth the peaks and valleys in the
hydrograph using the 15-minute data from the WWTP.
A composite of the four individual projections was created by averaging the four individual event
projections. The composite projection is similar to the projection made for the May 12, 2014 event, which
had the closest rainfall volume to the design storm. The individual and composite projections (with base
flow removed) for the 25-year, 24-hour design storm is shown in Figure 2. The composite hydrograph was
used for all analyses in this report. The tail of the hydrograph extends well beyond the end of the rainfall
because of infiltration following the rainfall.

Northfield Township WWTP Capacity Evaluation Report
9
Figure 2: Composite 25-year, 24-hour I/I Hydrograph Constructed from Individual Event Projections
The required storage volume can now be estimated by adding the design storm I/I flows onto a base flow. For all
the storage calculations it was assumed that the WWTP could treat 150 percent of its sustained treatment
capacity for up to 6 hours and still meet its effluent limits. The remaining time, the WWTP could only treat its
sustained capacity. For example, for the existing conditions, the WWTP could treat 2.0 MGD for 6 hours and 1.3
MGD for the remaining time. For existing conditions, we project that the required storage volume is 0.9 MG during
spring (April and May) conditions. This is visually depicted in the hydrograph shown in Figure 3.
0.0
0.5
1.0
1.5
2.0
2.5
3.0
3.5
4.0
0 24 48 72 96 120 144 168 192 216 240
I\I R
ate
, MG
D
Elapsed Time, hours
Projected Design Storm RDII using April 27-28, 2011 Rainfall
Projected Design Storm RDII using April 18-19, 2013 Rainfall
Projected Design Storm RDII using May 12-15, 2014 Rainfall
Projected Design Storm RDII using June 17-18, 2014 Rainfall
Composite Projected Design Storm RDII

Northfield Township WWTP Capacity Evaluation Report
10
Figure 3: Spring Design Storm Hydrograph with Treatment Capacity of 1.3 MGD and No Growth
As growth occurs, the daily flow will increase and use more of the WWTP capacity. This will require that more of
the flow during wet weather be stored. We project that the necessary storage volume will be 1.7 MG for an
increase of 800 REUs or 0.2 MGD within the service area. This is visually depicted in the hydrograph shown in
Figure 4.
0.0
0.5
1.0
1.5
2.0
2.5
3.0
3.5
4.0
0 24 48 72 96 120 144 168 192 216 240
Flo
w R
ate
, MG
D
Elapsed Time, hours
25-year, 24-hour Design Storm Hydrograph
Treatment Capacity, MGD
Required StorageVolume = 0.9 MG

Northfield Township WWTP Capacity Evaluation Report
11
Figure 4: Spring Design Storm Hydrograph with Treatment Capacity of 1.3 MGD, and 800 REUs Growth
Above this level of growth, the treatment capacity should be increased (see the Average Flows section), which will
lessen the need for storage.
The MDEQ policy also provides an alternative methodology to demonstrate that the system will not overflow more
than once every ten years. This analysis generally shows that a smaller basin size will meet the state’s
requirements, but requires a much more detailed approach and is best deferred as a preliminary design step if a
storage project proceeds.
The cost for a storage tank will be dependent upon the type of construction (steel versus concrete) and features
desired for the tank such as flushing or aeration. We suggest the Township budget $2.5 million to $3.0 million for
a glass-lined steel tank. A concrete tank would have a higher initial cost but may also have a longer useful life.
7.0 GROWTH POLICY
Policy decisions on when to allow or deny new connections to the sewer system rest solely with the Northfield
Township Board of Trustees. The MDEQ will occasionally deny new connections when there are obvious capacity
problems with a sewer system (not presently the case with Northfield Township’s system).
One important consideration is the SAD parcels. The Township has facilitated the construction of sewers in these
areas. The property owners are paying an assessment for the construction of the sewers. However, these parcels
are largely undeveloped and as such, have not connected to the sewer and have not paid the Township’s system
development charge (connection fee). This connection fee is established to recover the prorated share of the
parcel’s use of the treatment plant and downstream sewers.
0.0
0.5
1.0
1.5
2.0
2.5
3.0
3.5
4.0
0 24 48 72 96 120 144 168 192 216 240
Flo
w R
ate
, MG
D
Elapsed Time, hours
25-year, 24-hour Design Storm Hydrograph
Treatment Capacity, MGD
Required StorageVolume = 1.7 MG

Northfield Township WWTP Capacity Evaluation Report
12
A conservative policy decision could consider the 0.227 MGD commitment to Green Oak Township, the future
SAD demands, and the higher springtime flows and determine that no other connections should be allowed until
the wastewater plant is expanded. An alternate policy would be to consider that no significant development in
Green Oak and the SADs has occurred in the last ten years, that new connections can be allowed and the WWTP
will be expanded prior to the plant being overloaded.
Tetra Tech can appear at a future board meeting to answer any technical questions that will better allow the
Board of Trustees to determine their policy regarding new connections.
8.0 PROJECT FUNDING
Wastewater utilities have the choice of financing capital projects with local funds (such as from reserves,
connection fees and/or bonds) or from a state-funded loan. A self-financed project has few prerequisites and
construction could be initiated within a few months of beginning.
The MDEQ administers a low interest, state funded loan program for wastewater improvements. This program is
entitled the State Revolving Fund loan and abbreviated as SRF. A condition of receipt of the loan is that the loan
monies are used to construct the cost-effective solution. This requires a series of studies to demonstrate that
building storage is cost effective over removing the I/I at its source. Loan applications are due by July 1 each year
and the prerequisite studies need to be completed ahead of this application date. Should Northfield Township
begin the studies in the spring of 2015, it is likely that the loan could not be applied for until July 1, 2017, or later.
The first study that would be needed is termed an Infiltration/Inflow Study which measures flow throughout the
system and makes projections regarding its likely sources and costs to remove. This study may cost $150,000 to
$200,000 to complete. This study makes a recommendation that looking for I/I sources will likely be fruitful, but
generally concludes that some level of detailed investigation is needed.
The second study is referred to as a Sewer System Evaluation Survey (SSES). It includes detailed investigations
within the system to locate specific sources of I/I. This may involve inspecting manholes, sewer pipes, and
quantifying illicit sump pumps among many other tasks. The cost of an SSES of Northfield Township’s collection
system cannot be determined until after completion of the I/I Study, but could range from $150,000 to $300,000.
9.0 SUMMARY AND RECOMMENDATIONS
9.1 SUMMARY
A capacity summary was completed that shows that Northfield Township has significant wastewater treatment
obligations to both Green Oak Township and special assessment districts within Northfield Township. An
additional 712,000 gallons per day (0.712 MGD) could be added to the system from these obligations.
Capacity determination in a wastewater system involves more than comparing a single set of numbers. An
evaluation must be conducted that looks at the WWTP performance during average (dry weather), during wet
weather, and in the sewer systems. This report evaluated conditions during average and wet weather conditions
and deferred sewer analysis to a later time.
The Township has sufficient treatment capacity available to continue to accept new connections during average
conditions (dry weather). Our analysis shows that approximately 800 REUs can be added until the WWTP flows
will reach 1.1 MGD during the spring conditions and approximately 1,500 REUs until the WWTP reaches 1.3
MGD during these same spring conditions. A growth of 800 REUs is estimated to increase flows to 85 percent of
the WWTP’s permit limit during spring conditions, which is a typical threshold upon which the MDEQ may request

Northfield Township WWTP Capacity Evaluation Report
13
a WWTP expansion be considered. Past calculations suggest the WWTP may be able to treat 1.5 MGD if storage
is built and thus the higher number of 1,500 REUs may be achievable.
However, during large storms, the Township’s WWTP will struggle to treat the peak flow that arrives and meet
permit limits. The Township has long discussed a storage basin to be constructed at the WWTP. The size of this
basin is dependent upon the level of growth and the available WWTP capacity. A basin is significantly less
expensive than a plant expansion. Therefore, the basin should be sized for a future flow condition to postpone a
WWTP expansion as long as possible. The MDEQ requires that the basin be sized to contain wastewater for the
25-year, 24-hour storm of 3.9 inches. This condition suggests the basin be sized for 1.7 MG. As discussed in the
report, a more sophisticated statistical analysis may show this size can be slightly reduced before it is built.
The basin will assist with existing WWTP operations and be even more critical as growth occurs. It is
recommended that the basin be constructed prior to any large developments occurring. For the purpose of
quantifying a threshold, it is suggested that the basin be constructed prior to allowing more than 100 REUs to
connect.
Table 5 provides a timeline for recommended improvements to summarize the number of new connections
(expressed as REUs) and thresholds that initiate new projects.
Table 5: Timeline of Recommended Improvements
Number of
Additional REUs
Average Dry Weather
Flow, MGD
Average Dry Weather Flow
during Peak Months, MGD
Recommended
Improvement
0 – 100 0.7 0.9 Construct 1.7 MG
storage basin
800 – 1,500 0.9 – 1.1 1.1 – 1.3 Expand WWTP
The REUs in Table 5 must consider new connections made from Green Oak Township and the 873 REUs
committed to Green Oak. If Green Oak develops to the amounts included in the intergovernmental agreements,
most or all of the surplus capacity in the existing wastewater treatment plant would be utilized.
9.2 RECOMMENDATIONS
The Township should begin planning for the storage basin that has long been identified for the WWTP. The
Township may also wish to revisit its 2005 thoughts about expanding the WWTP to confirm the size and cost of
the expansion. The next step toward implementing the storage basin or WWTP expansion is to consider how
these projects will be financed, because the method of financing may determine additional steps necessary. At a
minimum, we recommend Northfield Township evaluate its system development charge (also referred to as
connection fee) so that some of the cost of the basin and WWTP expansion is recovered through fees charged to
new connections.

Northfield Township WWTP Capacity Evaluation Report
A-1
APPENDIX A: GREEN OAK TOWNSHIP AGREEMENTS

Northfield Township WWTP Capacity Evaluation Report
B-1
APPENDIX B: DATA USED FOR THE DEVELOPMENT OF THE 25-YEAR, 24-HOUR HYDROGRAPH
0.0
0.5
1.0
1.5
2.0
2.5
3.0
3.5
4.0
4.5
5.0
4/25/2011 0:00 4/27/2011 0:00 4/29/2011 0:00 5/1/2011 0:00 5/3/2011 0:00 5/5/2011 0:00 5/7/2011 0:00
Flo
w R
ate
, MG
D
Date / Time
Northfield Township WWTP Hydrograph April 27-28, 2011 Event
Estimated Dry Weather Flow
Projected 25-year, 24-hour Design Storm Hydrograph
Measured Flow Rate
Northfield Township WWTP Capacity Evaluation Report
B-2
0.0
0.5
1.0
1.5
2.0
2.5
3.0
3.5
4.0
4.5
5.0
4/16/2013 0:00 4/17/2013 0:00 4/18/2013 0:00 4/19/2013 0:00 4/20/2013 0:00 4/21/2013 0:00 4/22/2013 0:00 4/23/2013 0:00 4/24/2013 0:00
Flo
w R
ate
, MG
D
Date / Time
Northfield Township WWTP Hydrograph April 18-19, 2013 Event
Estimated Dry Weather Flow
Projected 25-year, 24-hour Design Storm Hydrograph
Measured Flow Rate

Northfield Township WWTP Capacity Evaluation Report
B-3
0.0
0.5
1.0
1.5
2.0
2.5
3.0
3.5
4.0
4.5
5.0
5/10/2014 0:00 5/12/2014 0:00 5/14/2014 0:00 5/16/2014 0:00 5/18/2014 0:00 5/20/2014 0:00 5/22/2014 0:00
Flo
w R
ate
, MG
D
Date / Time
Northfield Township WWTP Hydrograph May 12-15, 2014 Event
Estimated Dry Weather Flow
Projected 25-year, 24-hour Design Storm Hydrograph
Measured Flow Rate
Northfield Township WWTP Capacity Evaluation Report
B-4
0.0
0.5
1.0
1.5
2.0
2.5
3.0
3.5
4.0
4.5
5.0
6/15/2014 0:00 6/16/2014 0:00 6/17/2014 0:00 6/18/2014 0:00 6/19/2014 0:00 6/20/2014 0:00 6/21/2014 0:00 6/22/2014 0:00 6/23/2014 0:00
Flo
w R
ate
, MG
D
Date / Time
Northfield Township WWTP Hydrograph June 17-18, 2014 Event
Estimated Dry Weather Flow
Projected 25-year, 24-hour Design Storm Hydrograph
Measured Flow Rate