Waste-to-Energy in China · 2. TABLE OF CONTENT . 1. China’s Environmental Protection Policies...
16
Waste-to-Energy in China MAY 2018 London WANG Tianyi, PhD / Prof. CEO, China Everbright International Limited (HKSE: 257) Chairman, China Everbright Water Limited (SGX: U9E) Chairman, China Everbright Greentech Limited (HKSE: 1257) Member, UNECE PPP Business Advisory Board Member, China Council for International Cooperation on Environment and Development
Transcript of Waste-to-Energy in China · 2. TABLE OF CONTENT . 1. China’s Environmental Protection Policies...
Waste-to-Energy in China
MAY 2018 London
WANG Tianyi, PhD / Prof.
CEO, China Everbright International Limited (HKSE: 257)Chairman, China Everbright Water Limited (SGX: U9E)Chairman, China Everbright Greentech Limited (HKSE: 1257)
Member, UNECE PPP Business Advisory BoardMember, China Council for International Cooperation on Environment and Development

2
TABLE OF CONTENT
1. China’s Environmental Protection Policies and Market
2. Development of Waste-to-Energy (“WTE”) in China
3. Technology and Business Model of WTE Projects in China
4. China Everbright International Limited’s WTE Business

“Ecological Civilization” is one of China’s national developmentstrategies. China made huge economic achievements since its “Reform and Opening-up”, recording a CAGR
of 11.2% in GDP growth* from 1977 to 2017. Despite the positive economic progress, the rapid growth also caused various pollution problems
to China, such as desertification, choking haze and smog, garbage siege in cities, contaminatedsoil in farmland etc.
Since Mr. Xi Jinping took the office as China’s president, he emphasized the importance ofenvironmental protection in many international arenas by explaining “clear waters and lushmountains are invaluable assets” to China’s sustainable development.
In line with the principle, China issues and revises a series of legislations and policies toimplement its ecological preservation and environmental protection plans. Some of the keylegislations and policies include:
* Source: World Bank Database and National Statistics Bureau of China.
• New Environmental Protection Law (2014)• Environmental Protection Tax Law (2016)• Air Pollution Prevention and Control Action
Plan (2013)
• Water Pollution Prevention and Control Action Plan (2014)• Soil Pollution Prevention and Control Action Plan (2016)

Start-up Growth Maturity Decline
Food Waste
Water Environment Management
Hazardous Waste
Biomass
Soil Remediation
Waste Landfill
Overall market size* of environmental protection market in China** Government’s strong determination Strict regulations Increasing public awareness Greater enforcement effort
The environmental protection market in China
Development phase of different business sectors Landfill as the final stage of solid waste treatment is phasing out. Municipal WTE is growing with intense competition. Hazardous waste and water environmental management sectors are expecting
huge growth. Soil remediation and food waste sectors are at start-up phase.
0.72.2
4.2
17
'01-'05 '06-'10 '11-'15 '16-'20* The market size referred hereto is calculated by investment from both public sector and private sector.** Source: https://www.thepaper.cn/newsDetail_forward_1877776, last retrieved on 2018-4-14.
Municipal WTEThe figures are expressed in trillion RMB.

5
TABLE OF CONTENT
1. China’s Environmental Protection Policies and Market
2. Development of Waste-to-Energy (“WTE”) in China
3. Technology and Business Model of WTE Projects in China
4. China Everbright International Limited’s WTE Business

Municipal solid waste treatment in China by volume of treated waste and number of plants from 2006-2016
207 215 253 273 290 300 311 323 335 344 35640 45
52 71 85 94 123 158 185 219 26652.8%
97.0%
0%
20%
40%
60%
80%
100%
0
100
200
300
400
500
600
700
2006 2007 2008 2009 2010 2011 2012 2013 2014 2015 2016
13.6 17.9 31.7 40.1 62.194.3 113.6 137.4 146.9 157.6 175.8
14.6 16.119.2
6%
88%
0%
20%
40%
60%
80%
100%
0
50
100
150
200
250
2006 2007 2008 2009 2010 2011 2012 2013 2014 2015 2016
Landfill WTE Others Sanitary treatment rate
Source: 2016 Yearbook of China City Statistic, E20
City level 2007-2016 CAGR of
WTE volume: 9.0% 2011-2016 CAGR of
WTE volume: 3.6% 2016 waste treatment
ratio: 97.0%
County level 2007-2016 CAGR of
WTE volume: 27.1% 2011-2016 CAGR of
WTE volume: 4.9% 2016 waste treatment
ratio: 88%
403721 29 31 341510423
257220109 138 166 18610493746669
# No. of WTE plants in operation in respective year
1,000tpd
1,000tpd
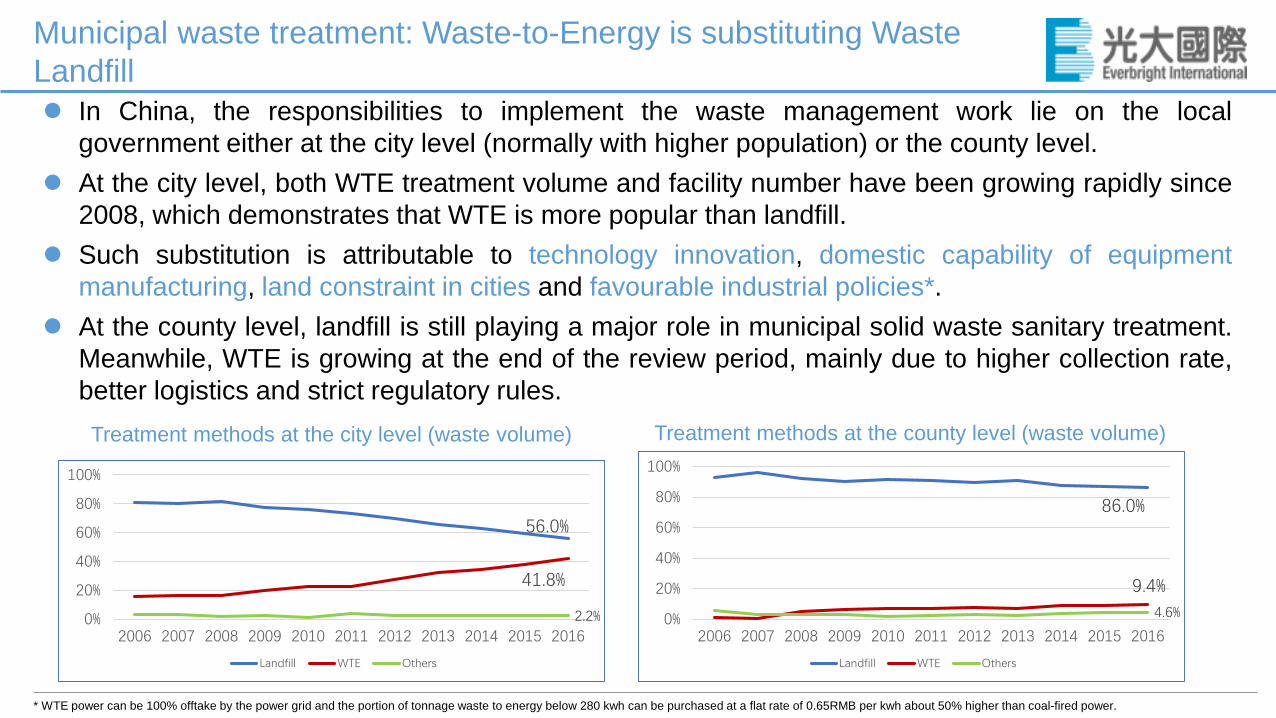
In China, the responsibilities to implement the waste management work lie on the localgovernment either at the city level (normally with higher population) or the county level.
At the city level, both WTE treatment volume and facility number have been growing rapidly since2008, which demonstrates that WTE is more popular than landfill.
Such substitution is attributable to technology innovation, domestic capability of equipmentmanufacturing, land constraint in cities and favourable industrial policies*.
At the county level, landfill is still playing a major role in municipal solid waste sanitary treatment.Meanwhile, WTE is growing at the end of the review period, mainly due to higher collection rate,better logistics and strict regulatory rules.
56.0%
41.8%
2.2%0%
20%
40%
60%
80%
100%
2006 2007 2008 2009 2010 2011 2012 2013 2014 2015 2016
Landfill WTE Others
86.0%
9.4%4.6%0%
20%
40%
60%
80%
100%
2006 2007 2008 2009 2010 2011 2012 2013 2014 2015 2016
Landfill WTE Others
Treatment methods at the county level (waste volume)Treatment methods at the city level (waste volume)
* WTE power can be 100% offtake by the power grid and the portion of tonnage waste to energy below 280 kwh can be purchased at a flat rate of 0.65RMB per kwh about 50% higher than coal-fired power.
Municipal waste treatment: Waste-to-Energy is substituting Waste Landfill

2015
2006
Beijing (East)
2015
2006
Shandong (East)
2015 2006
Jiangsu (East)
20152006
Hebei (Central)
2009 2015
Anhui (Central)
20152010
Sichuan (West)
Landfill WTE OthersThe figures are expressed in 1,000 tons in the respective year stated herein.
2015 2006
Landfill 3,258 4,683
WTE 2,094 98
Others 2,551 196
Total 7,903 4,977
2015 2007
Landfill 7,498 6,629
WTE 5,622 671
Others 655 327
Total 13,775 7,627
2015 2006
Landfill 3,849 2,314
WTE 2,204 455
Others 52 424
Total 6,105 3,193
2015 2009
Landfill 2,878 2,304
WTE 2,019 332
Others 0 0
Total 4,897 2,636
2015 2006
Landfill 4,073 6,104
WTE 10,488 1,137
Others 0 0
Total 14,561 7,241
2015 2010
Landfill 7,971 5,698
WTE 7,177 2,643
Others 2,794 808
Total 17,942 9,149
2%
29%
41%
9%
36%
14%
41%13%
14% 40%
72%
16%
CEIL takes 25% of WTE market
CEIL takes 60% of WTE market
Development of WTE in different regions of China

9
TABLE OF CONTENT
1. China’s Environmental Protection Policies and Market
2. Development of Waste-to-Energy (“WTE”) in China
3. Technology and Business Model of WTE Projects in China
4. China Everbright International Limited’s WTE Business

Core WTE technical process: Incineration system
Flue gas treatment system
Fly ash handling system
Leachate treatment system
Grate Furnace • High capex per unit• High tonnage Waste-to-
Energy output • No mixer in combustion• Long availability of more
than 8,000 hours/year• No pretreatment needed• Low maintenance cost
Circulating Fluidized Bed• Low capex per unit• Low tonnage Waste-to-
Energy output• Mixer is required in
combustion• Low availability of less than
7000 hours/year• Sorting and shredding
pretreatment required• High maintenance cost
Grate FurnaceCombustion hasgradually becomethe most popularand widely usedtechnology fornewly built WTEprojects in China.
Comply with National MSW Pollutant Control Directive 2014 (GB 18485-2014).
Hazardous waste in China. Solidified with chelate before transferred for landfill.
On-site treatment of leachate required when the plant collects municipal solid waste with more than 10% moisture content. Thus, most WTE projects in China have on-site leachate treatment facilities.
Characterization of China’s MSW: Low source sorting level without
pretreatment High moisture content (>20%) High non-combustibles (>25%) Low calorific value (c.1,200kcal/kg)
Grate Furnace and Circulating Fluidized Bed are two mainstream incineration technologies adopted in most WTE plants in China.

Project Co.(SPV)
Investment Platform Co. owned by local Gov.
Industrial Investor Equity
Loans Commercial BanksWaste supply
Environmental Protection Bureau
Regulation & Supervision
Media and the public
Power Grid OperatorPower sales revenue
Waste tipping fee Electricity Supply
O&M contractor
EPC contractor
Service feeRegulation
Mass / service stream
Financial stream
O&M • Joint Venture Agreement btw shareholders
• Waste Service Agreement btw owner and SPV
• Power Purchase Agreement
• O&M contract btw SPV and O&M contractor
Organizations bound by Agreements
• EPC Contract btw SPV and EPC contractor
LEDGED
• Concession Agreement btw owner and SPV
Tender& Selection
Commercial Banks
EPC
Third party supervision
PMT of EPC work
Dividend
Interest
PPP (including BOT and BOO) is the prevailing business model for WTE projects in China. Normally, a qualified industrial investor is selected through an open tender process.
Civil work contractor
Equipment suppliers
Installation contractor
Other sub-contractors
Bureau of City Admin and Law Enforcement
Municipal government (Owner)
12
TABLE OF CONTENT
1. China’s Environmental Protection Policies and Market
2. Development of Waste-to-Energy (“WTE”) in China
3. Technology and Business Model of WTE Projects in China
4. China Everbright International Limited’s WTE Business

Secured 94 Waste-to-Energy projects 47 projects in operation with a capacity of 40,600tpd.
Contracted capacity is more than 80,000tpd.
Commanded a total investment of c. USD6.4 billion*.
All projects are designed, built and operated in fullcompliance with Directive 2010/75/EU. In 2017, 12 million tons of MSW was processed.
In 2017, 4100 GWh green electricity was generated.
Received more than 1 million visitors on public open days.
Since 1st Jan 2017, real-time hourly emission data hasbeen disclosed on line.
Awards and Recognitions (HKSE: 257) Dow Jones Sustainability World Index, 2016&2017;
Hang Seng Corporate Sustainability Index, since 2014;
MSCI China Index since 2013;
RobecoSam Silver distinction, 2017.
China Everbright International Limited (“CEIL”) is the leading environmentalprotection company in China and the largest WTE investor and operator in Asia.
* 94 WTE projects commanded c. RMB40 billion.

CEIL’s Equipment Manufacturing
750t/d: 9 sets have been installed and in operation (eg,Hangzhou, Wujiang, Nanjing), 36 sets are under manufacturing.
850t/d: 2 sets have been installed and in operation in Yixing, 5sets are under manufacturing.
To date, 132 sets of different types have been either inoperation or purchased at manufacturing stage.
Track records of CEIL’s Grate Furnace
CEIL provides various products with customized designsranging from 300tdp, 350tpd, 400tpd, 500tpd, 600tpd,750tpd to 850tpd. Due to the economies of scale, a GrateFurnace with larger capacity usually delivers betterfinancial performance to the project.
CEIL’s Grate Furnace obtained CE Mark of EuropeanUnion and is eligible for export to overseas markets.
CEIL is the first company in China which owns bothforward moving and reverse moving Grate Furnacetechnologies.
Gas flow in CEIL’s Grate Furnace is simulated by CFDprocess in order to achieve the best combustionperformance.
The annual availability of CEIL’s Grate Furnace is longerthan 8,300 hours per set (regardless its capacity).
The unique tumbling grate design allows the excellentcombustion effect and low ignition loss rate of slagquantity less than 3%.
Advantages

Shangdong Province:Ji’nan, Shouguang, Rizhao,Weifang, Heze, Tengzhou, Xintai, Pingdu, Laiwu, Ju County, Zoucheng, Laiyang, Linshu, Jinan II
Henan Province:Xinzheng, Lankao,Xiayi,Sheqi
Jiangsu Province:Suzhou I, Suzhou II, Suzhou III, YixingI, Jiangyin I, Jiangyin II, Changzhou, Nanjing I, Zhengjiang I, Zhengjiang II, Suqian I, Pizhou, Xinbei, Guanyun, Yixing II, Nanjing II, Suqian II, Peixian ,Wujiang, Gaochun, Liuhe, Huaiyin, Wuxi I, Suzhou IV
Anhui Province:Dangshan, Lingbi, Xiaoxian, Ma’anshan, Fengyang
Zhejiang Province:Ningbo I, Ningbo II, Ninghai, Hangzhou, Chun’an
Hunan Province:Yiyang, Yongzhou, Xiangxiang
Guangdong Province:Boluo, Huidong, Machong, Boluo II
Hainan Province:Sanya I &II
Sichuang Province:Suining, Mianzhu, Ya’an,Leshan
Business Presence with WTE projects
Business Presence without WTE project
Projects Projects in operation
Novago 2,700tpd MBT+RDF projects
Can Tho 400tpd WtE Project