Waste Recycle Infrastructure Report
22
Office of Environment and Heritage Resource Recovery Infrastructure Needs Analysis Summary Report November 2011
Transcript of Waste Recycle Infrastructure Report

Office of Environment and Heritage
Resource Recovery Infrastructure Needs Analysis Summary Report
November 2011

21/20698/171537 Resource Recovery Infrastructure Needs Analysis Summary Report
GHD
133 Castlereagh St Sydney NSW 2000 - T: 2 9239 7100 F: 2 9239 7199 E: [email protected]
DISCLAIMER: This report was prepared by GHD in good faith exercising all due care and attention, but no representation or warranty, express or implied, is made as to the relevance, accuracy, completeness or fitness for purpose of this document in respect of any particular user’s circumstances. Users of this document should satisfy themselves concerning its application to, and where necessary seek expert advice in respect of, their situation. The views expressed within are not necessarily the views of the Environment Protection Authority (EPA) and may not represent EPA policy.
© Copyright State of NSW and the Environment Protection Authority

21/20698/171537 Resource Recovery Infrastructure Needs Analysis Summary Report
Contents
1. Introduction 1
1.1 Background 1 1.2 Data Gathering 1
2. Domestic Waste 2
2.1 Existing and proposed infrastructure 2 2.2 Current processing capacity 5 2.3 Future Waste Projections 5 2.4 Domestic Waste Recovery Targets 7 2.5 Domestic waste processing capacity requirements 9
3. Commercial Waste 11
3.1 C&I Waste Quantities 11 3.1 C&I Recovery Targets 11 3.2 C&I Capacity 12
4. Recommendations 18
4.1 Domestic waste 18 4.2 Commercial and Industrial 19
Table Index Table 1 Existing and proposed infrastructure by State Plan Region 2 Table 2 Existing infrastructure capacity by State Plan Region 5 Table 3 Infrastructure and Residential Quantities by State Plan Region 6 Table 4 Waste Projections 2010 to 2036 by Regulatory Region 7 Table 5 Estimated Diversion Rates by State Plan Region 8 Table 7 Current and Projected C&I Waste Quantities 11 Table 8 Corresponding Diversion Rates by State Plan Region 12 Table 9 Dry Recyclables and Organics (t) contained in C&I wastes not
currently being recovered 12 Table 10 Projected C&I Quantities and Possible Number of Processing
Facilities by Sydney Sub-Region 14 Table 11 Projected C&I Quantities and Possible Number of Processing
Facilities for ERA and NRA 17 Table 12 Infrastructure and Residential Quantities by State Plan Region 18

1
21/20698/171537 Resource Recovery Infrastructure Needs Analysis Summary Report
1. Introduction
1.1 Background The NSW Waste Avoidance and Resource Recovery Strategy 2007 set the following waste recovery targets to be achieved by 2014:
Municipal Solid Waste (MSW) from 26% (2000) to 66%;
Commercial and Industrial (C&I) from 28% to 63%; and
Construction and Demolition (C&D) from 65% to 76%.
The Resource Recovery Infrastructure Needs Analysis project further develops previous work to provide more information for industry and government to make decisions about the future of waste management in NSW with a particular focus on facilitating infrastructure. The project aims to answer the question - What is required to push recovery into the next range?
The reporting for this project is divided into two parts; a brief summary report and a background report that includes the underlying data and calculations. It also extends the scope of analysis to regional areas maintaining the emphasis on municipal and commercial waste but less so on construction waste.
This is the summary report.
1.2 Data Gathering GHD reviewed a range of documentation including the previous NSW Waste Systems Study Report 2009 as well as other published reviews of the NSW waste industry; Review of Waste Strategy and Policy in New South Wales – report by the Steering Committee (the Richmond Report) and Independent Public Assessment - Landfill Capacity and Demand 2009 (the Wright Report) among others.
GHD also reviewed and analysed data supplied by OEH which detailed waste quantities generated by every council in NSW as well as historical C&I data back to 2002. Data was analysed and results prepared for each of the 14 State Plan Regions as well as regions regulated by the Section 88 levy; the Sydney Metropolitan Area (SMA), Extended Regulated Area (ERA), and Northern Regulated Area (NRA).

2
21/20698/171537 Resource Recovery Infrastructure Needs Analysis Summary Report
2. Domestic Waste
2.1 Existing and proposed infrastructure Existing and proposed infrastructure in each State Plan region (based on regional waste plans and plans prepared by various councils) is summarised below. Table 3 shows the known infrastructure in each State Plan Region, current waste quantities and diversion rates and expected percent changes in waste quantities in 2036. It also prioritises the regions for action. Prioritisation of regions is based on current diversion, population, projected waste quantities and planned waste recovery infrastructure.
Table 1 Existing and proposed infrastructure by State Plan Region
State Plan Region Population Known Existing Infrastructure Planned
Infrastructure
Potential Additional Organics Infrastructure (showing
estimated feedstock capacity by 2036)
Northern Rivers 326,500 16 landfills
11 transfer stations
5 resource recovery facilities - 1 various materials, 3 organics, 1 plastics
3 MRFs
1 composting facility extension
2 new MRFs
New composting facility at Tweed Heads-35,000 t.
Upgrade existing or develop new composting facilities at Grafton–25,000 t and Byron Bay-10,000 t
Mid-North Coast 224,600 6 landfills
2 separated organics or mixed waste processing facilities
4 organics processing facilities
10 transfer stations
1 MRF
1 new landfill
3 new transfer stations
Upgrade existing or develop new composting facilities at Taree–18,000 t and Kempsey-30,000 t
New England-North West
184,800 64 landfills
15 transfer stations
2 MRFs
2 organics processing facilities
1 new landfill
1 new composting facility
1 new MRF
Upgrade existing composting facility at Tamworth–22,000 t
Orana 122,100 22 landfills1
28 transfer stations2
2 MRFs
3 organics processing facilities
1 upgrade to regional landfill
1 new composting facility
New composting facility at Mudgee–7,000 t
Riverina Murray 277, 000 69 landfills
10 transfer stations3
4 MRFs
9 resource recovery facilities – 8 organics, 1plastics
1 e-waste facility New composting facilities at Albury-14,000 t and Griffith-7,500 t
Upgrade existing composting facilites at Wagga Wagga–18,000 t, Tumut-3,500 t, Corowa-6,000 t,
Leeton-5,500 t
1 May be more 2 May be more 3 May be more

3
21/20698/171537 Resource Recovery Infrastructure Needs Analysis Summary Report
State Plan Region Population Known Existing Infrastructure Planned
Infrastructure
Potential Additional Organics Infrastructure (showing
estimated feedstock capacity by 2036)
Central West 179,600 49 landfills
14 transfer stations
3 MRFs
4 resource recovery facilities – 3 organics, 1 plastics
1 new landfill
1 new landfill or transfer station
1 new composting facility
1 new disposal facility
New composting facilities at Bathurst-20,000 t and Lithgow-
8,500 t.
Upgrade existing composting facilites at Blayney–6,000 t, and
Oberon-2,500 t
South East 216,600 38 landfills
21 transfer stations4
5 MRFs
3 organics processing facilities
1 landfill capacity increase
2 new landfills
New composting facilitiy at Bega-25,000 t.
Upgrade existing composting facilites at Surf Beach (Eurobodalla)–16,000 t
Hunter 644,300 22 landfills
3 transfer stations
8 resource recovery facilities – 1 mixed waste, 6 organics, 1 plastics
3 MRFs
1 new C&D facility
1 landfill extension
1 new garden organics processing facility
2 new organics processing facility
1 new C&I waste recovery facility
New composting facility at Cessnock/ Maitland/ Singleton-
100,000 t
Upgrade existing composting facility at Forster/Tuncurry-23,000
t
Far West 22,000 4 landfills
1 organics processing facility
None None proposed
South Western Sydney
813,500 10 landfills
12 transfer stations
17 resource recovery facilities – 5 organics, 12 plastics
3 MRFs
No firm plans New composting facilities at Bankstown-50,000 t and Picton or
Bargo-13,000 t.
Western Sydney 1.15 million 15 landfills
21 transfer stations
21 resource recovery facilities – 1 commercial food, 1 mixed waste, 1 separated organics and mixed waste, 12 organics, 7 plastics
3 MRFs
1 new organic processing facility and MRF
1 new C&D facility
1 C&D facility expansion
2 new landfills and recovery facilities
Upgrade existing or develop new facilities to provide 140,000 t capacity for The Hills, Blue Mountains and Hawksbury
Councils
Sydney 2.23 million 7 landfills
21 transfer stations
5 MRFs
3 resource recovery facilities – 2 paper, 1 organics and C&D, 4 organics, 1 plastics
1 new organics and mixed waste processing facility
1 new C&I mixed waste processing facility
1 new MRF
New facility in Inner West for composting-45,000 t and mixed
waste processing-26,000 t
New composting facility in Northern Sydney -67,000 t.
One or more new facilites in Southern Sydney with capacity for composting-170,000 t and mixed
waste processing-115,000 t
Central Coast 316,000 4 landfills
2 MRFs
2 resource recovery facilities – 1 organics, 1 plastics
No firm plans New composting facility -120,000 t.
4 May be more

4
21/20698/171537 Resource Recovery Infrastructure Needs Analysis Summary Report
State Plan Region Population Known Existing Infrastructure Planned
Infrastructure
Potential Additional Organics Infrastructure (showing
estimated feedstock capacity by 2036)
Illawarra 431,000 9 landfills
5 transfer stations
4 MRFs
8 resource recovery facilities – 3 various, 3 organics, 2 plastics
1 new composting facility
1 new MRF
1 new C&D facility
New composting facility at Wollongong-90,000 t.

5
21/20698/171537 Resource Recovery Infrastructure Needs Analysis Summary Report
2.2 Current processing capacity The current processing capacity of infrastructure within each region is summarised below.
Table 2 Existing infrastructure capacity by State Plan Region
Separated Organics and Mixed Waste processing
facilities
Kerbside Recyclables
MRFs
Total
Northern Rivers N/k5 6,000-12,000 6,000-12,000
Mid-North Coast 63,500 N/k 63,500
New England-North West
N/k N/k N/k
Orana N/k N/k N/k
Riverina Murray N/k N/k N/k
Central West N/k N/k N/k
South East N/k N/k N/k
Hunter 40,000 15,000 55,000
Far West N/k 0 N/k
South Western Sydney 90,000 200,000 290,000
Western Sydney 310,000 450,000 760,000
Sydney 100,000 300,000 400,000
Central Coast 0 45,000 45,000
Illawarra 0 N/k N/k
Total (tonnes per annum)
603,500 1,022,000 1,625,500
2.3 Future Waste Projections GHD analysed historical data and prepared projections of possible future waste quantities, based on population projections published by the Australian Bureau of Statistics and the NSW Department of Planning and Infrastructure.
2.3.1 By State Plan Region
Future waste projections by State Plan Region are provided in Table 2. Likely increases in recovered waste quantities and decreases in residual waste quantities (to be landfilled) have been taken into account in regions where processing facilities are planned (refer Table 1). The projections shown below are all based on a “business as usual” situation,
5 Not known

6
21/20698/171537 Resource Recovery Infrastructure Needs Analysis Summary Report
assuming that overall waste generation increases with population growth.
The nominated priority for new resource recovery infrastructure is based upon an assessment of current landfill diversion rates, likely increases in residual wastes and recovered waste quantities, population sizes and likely increases in population by 2036.
Table 3 Infrastructure and Residential Quantities by State Plan Region
2010 Quantities 2010 Diversion
Rate
Estimated Percent Change by 2036
Priority for New Resource
Recovery Infrastructure
State Plan Region
Domestic Residual (t)
Domestic Recovered
(t)
Residual (t)
Recovered (t)
Northern Rivers
97,215 86,241 47.0% 5.9% 26.1% High
Mid-North Coast
56,205 79,521 58.6% 36.2% 38.2% Medium
New England-North West
65,660 40,786 38.3% -9.6% -7.9% Medium
Orana 40,055 11,451 22.4% -8.8% -11.9% Low
Riverina Murray
89,199 44396 33.2% -1.0% 6.0% High
Central West 75,660 23,665 23.8% -8.3% 31.8% Medium
South East 70,624 50,306 41.6% 31.8% 32.7% High
Hunter 229,581 108,237 32.0% 37.2% 35.4% High
Far West 17,390 3,936 18.5% -30.5% -31.8% Low
South Western Sydney
143,938 192,380 57.2% 83.3% 48.4% Medium
Western Sydney
267,234 227,070 45.9% 52.7% 27.3% Low
Sydney 515,782 434,990 45.8% 15.0% 20.1% High
Central Coast 86,609 99,888 53.6% 38.1% 35.2% High
Illawarra 113,226 116,108 50.6% 22.9% 20.6% High
2.3.2 By Regulatory Region
Future waste projections by Regulatory Region are provided in Table 4. In regions where processing facilities are planned, the likely increases in recovered waste quantities and decreases in residual waste quantities (to be landfilled) have been taken into account. The projections shown below are all based on a “business as usual” situation, assuming that overall waste generation increases with population growth.

7
21/20698/171537 Resource Recovery Infrastructure Needs Analysis Summary Report
Table 4 Waste Projections 2010 to 2036 by Regulatory Region
Region Material 2010
Tonnes (actual)
2036
Tonnes (predicted)
Percent Change
SMA Residual 897,201 1,217,349 35.7%
Recovered 832,349 1,065,362 28.0%
ERA Residual 408,557 556,695 36.3%
Recovered 308,400 402,720 30.6%
RRA Residual 204,031 263,799 29.3%
Recovered 203,685 251,756 23.6%
NRA Residual 358,587 358,709 0.0%
Recovered 174,630 195,439 11.9%
Total
Residual 1,868,376 2,396,551 28.3%
Recovered 1,519,064 1,915,277 26.1%
Total 3,387,440 4,311,828 27.3%
The table shows that the greatest rate of growth in residual waste will be in the ERA, with the SMA close behind. For recovered waste, the greatest growth is expected in the RRA. In some areas, waste generation is expected to fall.
2.4 Domestic Waste Recovery Targets Diversion targets for domestic waste by State Plan Area have been calculated, taking into account the current and projected recovered quantities each year and the additional potentially recoverable proportion of the projected quantities of landfilled waste. This additional potentially recoverable proportion of landfilled waste is based on the composition of the domestic waste stream determined by waste audits.
The additional potentially recoverable proportion has been selected as follows:
2014 – 25%;
2017 – 50%;
2020 – 70%; and
2036 – 70%.
The additional potentially recoverable proportions of the landfill stream that may be recovered in the future for each year listed have been calculated based on several criteria. In 2014 the additional recovered proportion has been set at 25%. This assumes that

8
21/20698/171537 Resource Recovery Infrastructure Needs Analysis Summary Report
metals, timber, C&D waste and e-waste are recovered using simple technology such as a dirty MRF.
In 2017, the additional potentially recoverable proportion is 50% and assumes that systems have been established for the recovery of compostable organics, paper and cardboard, recyclable containers as well as metals, timber, C&D waste and e-waste.
Diversion provided by processing facilities known to be in advanced stages of planning has been taken into account so this figure only applies to facilities conceived, planned and constructed after 2011. Given the time required to design, plan and construct such facilities, 2016-17 is the earliest that any which are likely to be operating.
In addition once constructed several years may be required to reach maximum operational efficiency, so recovery of the maximum additional potential proportion is not expected to be approached until 2020, which is when the 70% is set. Capping the maximum at 70% assumes that not all of the available material will be recovered.
The resulting potential diversion rates have been calculated and are shown in Table 5 below.
Table 5 Estimated Diversion Rates by State Plan Region
State Plan Region 20106 2014 2017 2020 2036
Northern Rivers 47% 57% 71% 83% 83%
Mid-North Coast 59% 69% 79% 88% 88%
New England-North West 38% 54% 69% 82% 82%
Orana 22% 42% 61% 77% 77%
Riverina Murray 33% 50% 67% 80% 80%
Central West 24% 48% 65% 79% 79%
South East 42% 56% 71% 83% 83%
Hunter 32% 49% 66% 80% 80%
Far West 18% 39% 59% 75% 75%
South Western Sydney 57% 64% 76% 86% 86%
Western Sydney 46% 56% 70% 82% 82%
Sydney 46% 60% 74% 84% 84%
Central Coast 54% 65% 86% 86% 86%
Illawarra 51% 63% 75% 85% 85%
Overall 45% 58% 73% 83% 83%
These figures can be used as ambitious targets for domestic waste diversion in the case of each State Plan Region.
6 Actual reported diversion rate
9
21/20698/171537 Resource Recovery Infrastructure Needs Analysis Summary Report
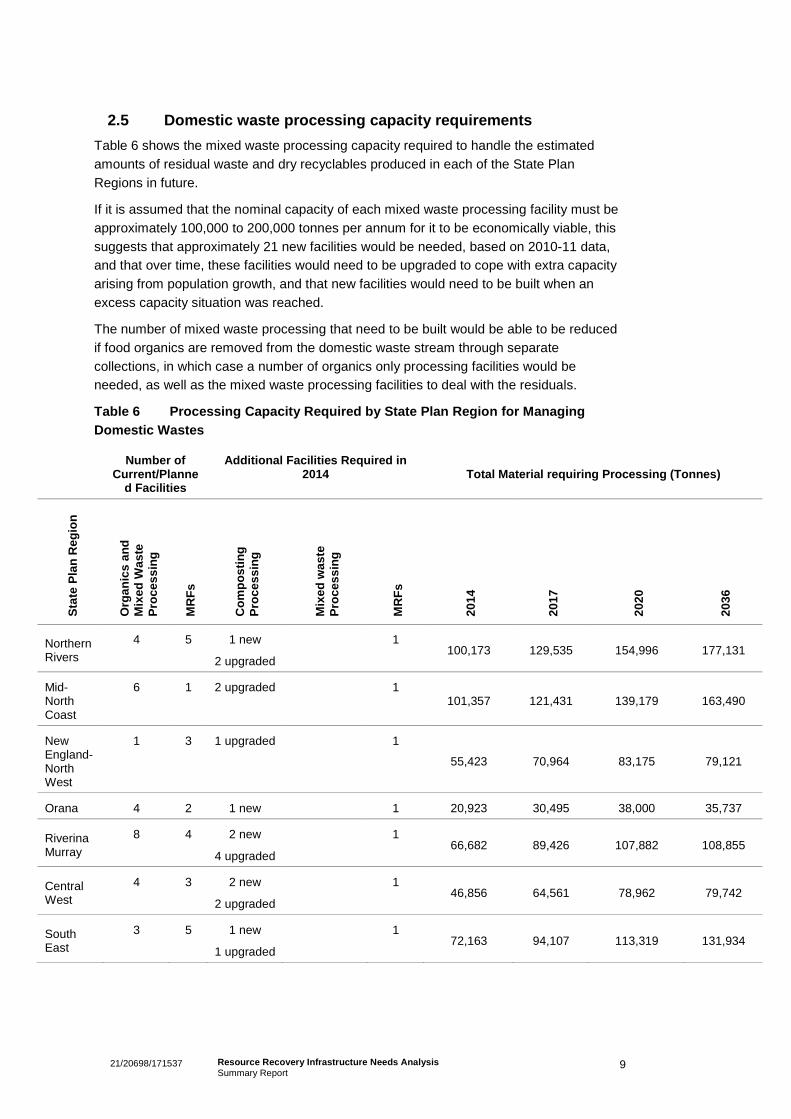
2.5 Domestic waste processing capacity requirements Table 6 shows the mixed waste processing capacity required to handle the estimated amounts of residual waste and dry recyclables produced in each of the State Plan Regions in future.
If it is assumed that the nominal capacity of each mixed waste processing facility must be approximately 100,000 to 200,000 tonnes per annum for it to be economically viable, this suggests that approximately 21 new facilities would be needed, based on 2010-11 data, and that over time, these facilities would need to be upgraded to cope with extra capacity arising from population growth, and that new facilities would need to be built when an excess capacity situation was reached.
The number of mixed waste processing that need to be built would be able to be reduced if food organics are removed from the domestic waste stream through separate collections, in which case a number of organics only processing facilities would be needed, as well as the mixed waste processing facilities to deal with the residuals.
Table 6 Processing Capacity Required by State Plan Region for Managing Domestic Wastes
Number of
Current/Planned Facilities
Additional Facilities Required in 2014 Total Material requiring Processing (Tonnes)
Stat
e Pl
an R
egio
n
Org
anic
s an
d M
ixed
Was
te
Proc
essi
ng
MR
Fs
Com
post
ing
Proc
essi
ng
Mix
ed w
aste
Pr
oces
sing
MR
Fs
2014
2017
2020
2036
Northern Rivers
4 5 1 new
2 upgraded
1 100,173 129,535 154,996 177,131
Mid-North Coast
6 1 2 upgraded 1 101,357 121,431 139,179 163,490
New England-North West
1 3 1 upgraded 1
55,423 70,964 83,175 79,121
Orana 4 2 1 new 1 20,923 30,495 38,000 35,737
Riverina Murray
8 4 2 new
4 upgraded
1 66,682 89,426 107,882 108,855
Central West
4 3 2 new
2 upgraded
1 46,856 64,561 78,962 79,742
South East
3 5 1 new
1 upgraded
1 72,163 94,107 113,319 131,934

10
21/20698/171537 Resource Recovery Infrastructure Needs Analysis Summary Report
Number of
Current/Planned Facilities
Additional Facilities Required in 2014 Total Material requiring Processing (Tonnes)
Stat
e Pl
an R
egio
n
Org
anic
s an
d M
ixed
Was
te
Proc
essi
ng
MR
Fs
Com
post
ing
Proc
essi
ng
Mix
ed w
aste
Pr
oces
sing
MR
Fs
2014
2017
2020
2036
Hunter 10 3 1 new
1 upgraded
2 187,627 260,075 322,684 367,010
Far West 1 0 7,826 11,524 14,210 11,146
South Western Sydney
5 3 2 new 3 228,463 287,059 343,556 285,509
Western Sydney
16 4 1 new or upgrade
3 295,222 391,296 476,236 574,757
Sydney 6 6 At least 3 new
At least 2 new
2 587,282 731,675 853,806 937,555
Central Coast
1 2 1 new 1 125,801 171,534 178,464 218,767
Illawarra 3 5 1 new 1 147,307 181,565 211,158 237,391
Total 72 46
At least 16 new
At least 13 upgraded
At least 2 new 10 2,045,119 2,637,264 3,117,647 3,410,181

11
21/20698/171537 Resource Recovery Infrastructure Needs Analysis Summary Report
3. Commercial Waste
3.1 C&I Waste Quantities Table 7 below shows quantities of C&I waste disposed and recycled in NSW in 2008-2009 and the amounts estimated for 2035-2036. These estimates are based on C&I waste generation trends between 2002-2003 and 2008-2009.
Table 7 Current and Projected C&I Waste Quantities
Reg
ion
Disposed (t) Recovered (t) Total (t)
Cur
rent
Div
ersi
on Projected
Increase
2008
-200
9
2035
-203
6
2008
-200
9
2035
-203
6
2008
-200
9
2035
-203
6
Dis
pose
d
Rec
over
ed
SMA 1,854,402 1,066,461 1,816,754 5,395,395 3,671,156 6,461,856 54% -42% 197%
ERA 357,976 506,367 546,633 1,793,731 904,609 2,300,099 63% 41% 228%
NRA 376,257 771,165 472,952 2,243,483 849,209 3,014,649 60% 105% 374%
NSW 2,588,635 2,343,994 2,836,338 9,432,609 5,424,973 11,776,603 56% -9% 233%
The table shows that the overall quantity of C&I waste disposed of in the SMA is expected to decrease by 2035-2036, while it is expected to increase in the ERA and NRA over the same period. This is based on expected population growth and a “business as usual” scenario, without any new infrastructure being provided.
3.1 C&I Recovery Targets Diversion targets for C&I waste by Regulatory Region have been calculated by taking into account the current and projected recovered quantities each year and the additional potentially recoverable proportion of the projected quantities of landfilled waste. This additional potentially recoverable proportion of landfilled waste is based on the typical composition of the C&I waste stream.
The additional potentially recoverable proportion has been selected as follows:
2014 – 3%
2017 – 25%
2020 – 50%
2036 – 50%
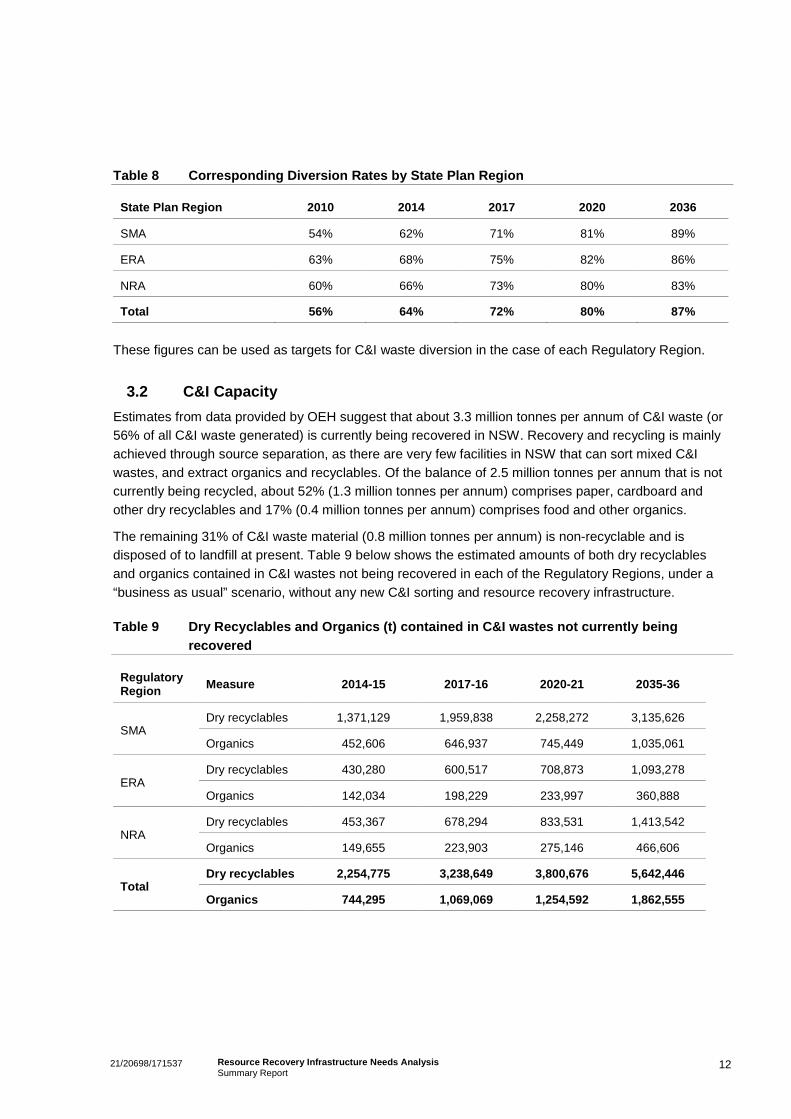
The diversion rates that correspond to the proposed estimated recovery rates are shown in Table 8 below. No separate data is available for the RRA and NRA. In the table, this data is all classified under NRA.
12
21/20698/171537 Resource Recovery Infrastructure Needs Analysis Summary Report
Table 8 Corresponding Diversion Rates by State Plan Region
State Plan Region 2010 2014 2017 2020 2036
SMA 54% 62% 71% 81% 89%
ERA 63% 68% 75% 82% 86%
NRA 60% 66% 73% 80% 83%
Total 56% 64% 72% 80% 87%
These figures can be used as targets for C&I waste diversion in the case of each Regulatory Region.
3.2 C&I Capacity Estimates from data provided by OEH suggest that about 3.3 million tonnes per annum of C&I waste (or 56% of all C&I waste generated) is currently being recovered in NSW. Recovery and recycling is mainly achieved through source separation, as there are very few facilities in NSW that can sort mixed C&I wastes, and extract organics and recyclables. Of the balance of 2.5 million tonnes per annum that is not currently being recycled, about 52% (1.3 million tonnes per annum) comprises paper, cardboard and other dry recyclables and 17% (0.4 million tonnes per annum) comprises food and other organics.
The remaining 31% of C&I waste material (0.8 million tonnes per annum) is non-recyclable and is disposed of to landfill at present. Table 9 below shows the estimated amounts of both dry recyclables and organics contained in C&I wastes not being recovered in each of the Regulatory Regions, under a “business as usual” scenario, without any new C&I sorting and resource recovery infrastructure.
Table 9 Dry Recyclables and Organics (t) contained in C&I wastes not currently being recovered
Regulatory Region Measure 2014-15 2017-16 2020-21 2035-36
SMA Dry recyclables 1,371,129 1,959,838 2,258,272 3,135,626
Organics 452,606 646,937 745,449 1,035,061
ERA Dry recyclables 430,280 600,517 708,873 1,093,278
Organics 142,034 198,229 233,997 360,888
NRA Dry recyclables 453,367 678,294 833,531 1,413,542
Organics 149,655 223,903 275,146 466,606
Total Dry recyclables 2,254,775 3,238,649 3,800,676 5,642,446
Organics 744,295 1,069,069 1,254,592 1,862,555

13
21/20698/171537 Resource Recovery Infrastructure Needs Analysis Summary Report
3.2.1 Facilities Required for Sydney
Data used in the 2009 NSW Waste Systems Study identified the main sources of C&I waste in the Sydney region. Nothing found in the research for this report indicates this has changed. Based on these proportions and the updated quantities of C&I waste for the SMA provided by OEH, the table below shows the quantities estimated to be generated in the future and some possible combinations of processing facilities that may be required.
Table 10 shows estimates of the quantities of C&I waste that may require processing in the future and the number and capacity of facilities that may be required to fully extract the amounts of recyclables and organics contained in C&I wastes that are not source separated and recycled.
The table shows that most C&I waste generated in the Sydney area comes from the North West followed by West Central. Up to 27 C&I waste processing facilities would be required by 2014-2015 to process the projected amounts of C&I waste generated. The projections assume that existing facilities could be upgraded to increase capacity. In 2016-2017, nine facilities are estimated to require upgrading and three new facilties would need to be built. In 2020-2021, eight are estimated to require upgrading and three more would need to be built. By 2035-2036, three would require upgrading and an additional 11 would need to be constructed.
Approximately 31% of the C&I stream is not recoverable, based on current composition data. Even if the estimated diversion was achieved, an estimated 538,000 tonnes of C&I waste would require landfill disposal in 2014-2015. This is estimated to fall to 336,000 tonnes by 2035-2036.

14
21/20698/171537 Resource Recovery Infrastructure Needs Analysis Summary Report
Table 10 Projected C&I Quantities and Possible Number of Processing Facilities by Sydney Sub-Region
Sub Region Percent Generated
2014-2015 2016-2017 2020-2021 2035-2036
Estimated Tonnes
Number and Capacity of Facilities
Estimated Tonnes
Number and Capacity of Facilities
Estimated Tonnes
Number and Capacity of Facilities
Estimated Tonnes
Number and Capacity of Facilities
Inner North 1.9% 81,535 1 x 85,000 t 87,981 1 x 90,000 t 93,318 1 x 95,000 t 122,775 1 x 130,000 t
North 3.3% 141,613 1 x 150,000 t 152,809 1 x 155,000 t 162,078 1 x 165,000 t 213,241 1 x 165,000 t
1 x 50,000 t
North East 2.3% 98,700 1 x 100,000 t 106,503 1 x 110,000 t 112,964 1 x 115,000 t 148,623 1 x 150,000 t
North West 33%
1,433,298 6 x 200,000 t
1 x 150,000 t
1 x 100,00 t
1,546,611 6 x 200,000 t
1 x 150,000 t
2 x 100,000 t
1,640,430 6 x 200,000 t
1 x 150,000 t
3 x 100,000 t
2,158,260 8 x 200,000 t
2 x 150,000 t
3 x 100,000 t
South West 8.1% 347,596 1 x 200,000 t
1 x 150,000 t
375,076 1 x 200,000 t
1 x 175,000 t
397,829 2 x 200,000 t 523,410 2 x 200,000 t
1 x 150,000 t
Inner West 4.7%
201,692 1 x 110,000 t
1 x 100,000 t
217,637 1 x 120,000 t
1 x 100,000
230,839 1 x 120,000 t
1 x 110,000 t
303,707 1 x 120,000 t
1 x 110,000 t
1 x 75,000 t
West Central 27%
1,158,654 6 x 200,000 t 1,250,254 6 x 200,000 t
1 x 50,000 t
1,326,096 7 x 200,000 t
1 x 100,000 t
1 x 50,000 t
1,744,701 9 x 200,000 t
1 x 100,000 t
1 x 50,000 t
East 5.6% 240,313 1 x 150,000 t
1 x 100,000 t
259,312 1 x 160,000 t
1 x 100,000 t
275,042 1 x 180,000 t
1 x 100,000 t
361,864 1 x 180,000 t
2 x 100,000 t

15
21/20698/171537 Resource Recovery Infrastructure Needs Analysis Summary Report
Sub Region Percent Generated
2014-2015 2016-2017 2020-2021 2035-2036
Estimated Tonnes
Number and Capacity of Facilities
Estimated Tonnes
Number and Capacity of Facilities
Estimated Tonnes
Number and Capacity of Facilities
Estimated Tonnes
Number and Capacity of Facilities
South 6.8%
291,809 2 x 150,000 t 314,879 1 x 170,000 t
1 x 150,000 t
333,980 1 x 170,000 t
1 x 170,000 t
439,406 1 x 170,000 t
1 x 170,000 t
1 x 100,000 t
Sydney City 5.6% 240,313 1 x 150,000 t
1 x 100,000 t
259,312 1 x 160,000 t
1 x 100,000 t
275,042 1 x 175,000 t
1 x 100,000 t
361,864 1 x 175,000 t
2 x 100,000 t
Mixed 1.2% 51,496 1 x 55,000 t 55,567 1 x 56,000 t 58,938 1 x 60,000 t 77,542 1 x 80,000 t
Total 100% 4,291,311 27 facilities 4,630,572 29 facilities 4,911,467 33 facilities 6,461,856 46 facilities

16
21/20698/171537 Resource Recovery Infrastructure Needs Analysis Summary Report
3.2.2 Facilities Required for the ERA and NRA
Table 11 shows estimates of the quantities of C&I waste that may require processing in the future and the number and capacity of facilities that may be required.
The greater area of the NRA means that it would require a larger number of smaller facilities compared to the ERA, where a smaller number of larger facilities could be used. These would be located in the Hunter, Illawarra and Central Coast areas. Facilities in the NRA would need to be located in major centres such as Wagga Wagga, Tweed Heads, Coffs Harbour, Albury, Port Macquarie, Dubbo, Armidale, Lismore, Tamworth and Nowra.
In addition, 31% of the C&I stream is not recoverable, based on current composition data. Even if the estimated diversion was achieved, an estimated 123,000 tonnes of C&I waste would require disposal in the ERA and 146,000 in the NRA in 2014-2015. This is estimated to rise to 159,500 tonnes per annum in the ERA and 243,000 tonnes per annum in the NRA by 2035-2036.

17
21/20698/171537 Resource Recovery Infrastructure Needs Analysis Summary Report
Table 11 Projected C&I Quantities and Possible Number of Processing Facilities for ERA and NRA
Sub Region
2014-2015 2016-2017 2020-2021 2035-2036
Estimated Tonnes
Number and Capacity of Facilities
Estimated Tonnes
Number and Capacity of Facilities
Estimated Tonnes
Number and Capacity of Facilities
Estimated Tonnes
Number and Capacity of Facilities
ERA 1,214,718 5 x 200,000 t
1 x 120,000 t
1 x 100,000 t
1,318,087 5 x 200,000 t
1 x 120,000 t
2 x 100,000 t
1,524,827 6 x 200,000 t
1 x 125,000 t
2 x 100,000 t
2,300,099 9 x 200,000 t
2 x 125,000 t
2 x 100,000 t
1 x 50,000 t
NRA 1,330,418 6 x 200,000 t
1 x 150,000 t
1,490,821 6 x 200,000 t
1 x 150,000 t
1 x 100,000 t
1 x 50,000 t
1,811,627 6 x 200,000 t
2 x 150,000 t
2 x 100,000 t
1 x 60,000 t
3,014,649 9 x 200,000 t
4 x 150,000 t
1 x 120,000 t
5 x 100,000 t
Total 2,545,135 14 facilities 2,808,908 17 facilities 3,336,453 20 facilities 5,314,747 33 facilities

18
21/20698/171537 Resource Recovery Infrastructure Needs Analysis Summary Report
4. Recommendations
4.1 Domestic waste
4.1.1 Infrastructure required
Approximately 21 new mixed waste processing facilities would be needed, based on 2010-11 data, if it is assumed that the nominal capacity of each mixed waste processing facility must be approximately 100,000 to 200,000 tonnes per annum for it to be economically viable. Over time, these facilities would need to be upgraded to cope with extra capacity arising from population growth, and that new facilities would need to be built when an excess capacity situation was reached.
The number of mixed waste processing facilities that need to be built would be able to be reduced if food organics are removed from the domestic waste stream through separate collections, in which case a number of organics only processing facilities would be needed, as well as the mixed waste processing facilities to deal with the residuals.
Table 12 Infrastructure and Residential Quantities by State Plan Region
State Plan Region Mixed waste processing facilities
needed
Priority
Northern Rivers 1 High
Mid-North Coast 1 Medium
New England-North West 1 Medium
Orana 1 Low
Riverina Murray 1 High
Central West 1 Medium
South East 1 High
Hunter 2 High
Far West 1 Low
South Western Sydney 2 Medium
Western Sydney 3 Low
Sydney 4 High
Central Coast 1 High
Illawarra 1 High

19
21/20698/171537 Resource Recovery Infrastructure Needs Analysis Summary Report
4.2 Commercial and Industrial
4.2.1 Infrastructure required
Ensure the establishment of waste processing facilities in the SMA as outlined in Table 10 Projected C&I Quantities and Possible Number of Processing Facilities by Sydney Sub-Region.
Ensure the establishment of waste processing facilities in the ERA as outlined in Table 11 Projected C&I Quantities and Possible Number of Processing Facilities for ERA and NRA.
– Larger capacity processing facilities should be established in:
o The Lower Hunter
o Wollongong
– Smaller capacity processing facilities should be established in:
o The Upper Hunter
o Shoalhaven
o Central Coast
Ensure the establishment of waste processing facilities in the NRA as outlined in Table 11 Projected C&I Quantities and Possible Number of Processing Facilities for ERA and NRA.
– Larger capacity processing facilities should be established in:
o Wagga Wagga
o Tweed Heads
o Coffs Harbour
o Tamworth
o Albury
– Smaller capacity processing facilities should be established in:
o Port Macquarie
o Dubbo
o Nowra
o Bathurst
o Lismore