Waste Management Feasibility Study - ICIici.gov.ck/sites/default/files/downloads/86125 Cook Islands...
65
REPORT Waste Management Feasibility Study Prepared for Cook Islands Infrastructure Prepared by Tonkin & Taylor Ltd Date November 2016 Job Number 86125.v1.6
Transcript of Waste Management Feasibility Study - ICIici.gov.ck/sites/default/files/downloads/86125 Cook Islands...

REPORT
Waste ManagementFeasibility Study
Prepared forCook Islands InfrastructurePrepared byTonkin & Taylor LtdDateNovember 2016Job Number86125.v1.6

Distribution:
Cook Islands Infrastructure 10 copies
Tonkin & Taylor Ltd (FILE) 1 copy

Tonkin & Taylor LtdWaste Management Feasibility StudyCook Islands Infrastructure
November 2016Job No: 86125.v1.6
Table of contents
1 Introduction 12 Policy Context 2
2.1 National Waste Policy (2016) 22.2 National Sustainable Development Plan 2016-2020 22.3 Other relevant policy 3
3 Waste generation and collection 43.1 Waste Quantity 43.2 Waste System Overview 63.3 Waste Composition 73.4 Waste generation and composition - issues and constraints 11
4 Waste Infrastructure and Services 124.1 Waste Collection 12
4.1.1 Self-managed waste 124.1.2 Waste and Recycling Collection 124.1.3 Collection Service Performance 13
4.2 Waste Processing and Disposal 154.2.1 Waste disposal 154.2.2 Waste consolidation and diversion 15
4.3 Waste Infrastructure and Services - Issues and Constraints 165 Option Identification 18
5.1 Collection options 195.2 Technology options 21
5.2.1 Processing Options 225.2.2 Disposal Options 245.2.3 Treatment and Disposal Options Considered 26
5.3 Outer Islands Options 296 Option Evaluation 30
6.1 Multi-Criteria Evaluation Approach 306.2 Multi-Criteria Evaluation Summary 31
6.2.1 Collection Options Evaluation 316.2.2 Treatment and Processing Infrastructure 33
6.3 High level cost benefit analysis 357 Cost Recovery Mechanisms 39
7.1 Waste disposal charges 397.2 Product Charges 397.3 Raising Revenue 407.4 Incentives for waste minimisation 40
8 Conclusions and Recommendations 429 Acknowledgements 4410 Applicability 45
Appendix A : Policy Context
Appendix B : Waste Technology options
Tonkin & Taylor LtdWaste Management Feasibility StudyCook Islands Infrastructure
November 2016Job No: 86125.v1.6
Appendix C : Options - Mass Flow Disgrama
Appendix D : Cost Benefit Analysis Model
1
Tonkin & Taylor LtdWaste Management Feasibility StudyCook Islands Infrastructure
November 2016Job No: 86125.v1.6
1 Introduction
Tonkin and Taylor International Limited (T+TI) have been commissioned by the Ministry for CookIslands Infrastructure (ICI) to complete a study to determine a long term strategy for themanagement of waste on Rarotonga. The study Terms of Reference can be summarised as:
“Undertaking a Feasibility Study of alternative treatment technologies for the long termdisposal of solid and hazardous waste for Rarotonga at a centralised facility.
The facility is to receive and process all major waste streams generated in Rarotonga, andpossibly the Outer Islands including, but not limited to, domestic waste, commercial andindustrial waste, tourism waste, medical / healthcare waste, quarantine waste and wastearising from the clean up after cyclones.“1
The Feasibility Study has been completed by T+TI with specialist inputs from Eunomia Research andConsulting (Waste Technology) and Covec (Cost Benefit Analysis). The project also involvedextensive stakeholder engagement and the project would not have been possible without theirinput.
This report is the output of the Feasibility Study and is structured as follows:
· Section 2 sets out the policy context for solid waste management in the Cook Islands;· Section 3 summarises available information on waste generation and composition;· Section 4 summarises available information on waste infrastructure including collections· Section 5 summarises the identification of potentially feasible options;· Section 6 Summarises the options evaluation process including high level cost benefit analysis
of landfill vs waste to energy;· Section 7 summarises cost recovery mechanisms; and· Section 8 provides conclusions and recommendations.
1 Section 6.1 (About these terms of reference) from the Request for Proposals for a Feasibility Study Of AlternativeTreatment Technologies For The Disposal Of Solid And Hazardous Waste For Rarotonga, Cook Islands (Contract No: 16/02,Id Number: 151633, March 2016

2
Tonkin & Taylor LtdWaste Management Feasibility StudyCook Islands Infrastructure
November 2016Job No: 86125.v1.6
2 Policy Context
There are a range of key policy documents of relevance to solid waste management in the CookIslands. These are summarised below with additional detail provided in Appendix A wherenecessary. The policy summarised here sets the direction and desired outcome from theimplementation of the options considered in this report.
2.1 National Waste Policy (2016)
The Cook Islands National Solid Waste Management Strategy 2013-2016 was developed by theNational Solid Waste Management Committee and contains a mix of policy elements and morespecific strategies. The policy elements have formed the foundation for the National Solid WasteManagement Policy 2016-26.
The policy vision is:
'An informed and proactive community taking responsibility for sustainable solid wastemanagement, aspiring towards Zero Waste Cook Islands.'
The objectives of the policy are:
· Objective 1. Minimise the generation of solid waste.· Objective 2. Develop a clear and robust institutional and legislative framework.· Objective 3. Develop appropriate waste management infrastructure including separation and
storage facilities.· Objective 4. Develop sustainable financing to manage solid waste.· Objective 5. Promote individual and community responsibility for solid waste management.· Objective 6. Develop a strong monitoring and evaluation system.
2.2 National Sustainable Development Plan 2016-2020
The National Sustainable Development Plan 2016-2020 (NSDP) is also an important policy documentto consider when looking at options for solid waste treatment and disposal. The National Vision, asset out in the NSDP is:
“To enjoy the highest quality of life consistent with the aspirations of our people, and inharmony with our culture and environment”
The NSDP sets sixteen national development goals. Goal 3 is of most direct relevance to this wastepolicy. It is to:
"3. Promote sustainable practices and effectively manage solid and hazardous waste"
The NSDP has identified two indicators to measure progress towards this goal. Indicator 3.1 trackstotal waste recycled. Indicator 3.2 tracks the percentage of hazardous waste that is accounted forand managed.
Other NSDP goals of relevance are:
"4. Sustainable management of water and sanitation"
"11. Promote sustainable land use, management of terrestrial ecosystems, and protectbiodiversity”
“12. Sustainable management of the oceans, lagoons and marine resources"
3
Tonkin & Taylor LtdWaste Management Feasibility StudyCook Islands Infrastructure
November 2016Job No: 86125.v1.6
These goals are of relevance because of the adverse effects that poor solid waste management canhave on the natural environment.
2.3 Other relevant policy
There is a wide range of other legislation and policy documents of relevance to this study. Theseinclude:
· The Cook Islands Public Health Act 2004· The Cook Islands Environment Act 2003· Pacific Regional Solid Waste Management Strategy 2010-2015· Cleaner Pacific 2025 - Pacific Regional Waste and Pollution Management Strategy 2016 - 2025· Cleaner Pacific 2025 - Pacific Regional waste and Pollution Management Strategy
Implementation Plan 2016 - 2019

4
Tonkin & Taylor LtdWaste Management Feasibility StudyCook Islands Infrastructure
November 2016Job No: 86125.v1.6
3 Waste generation and collection
Data on the generation of solid waste in the Cook Island is of variable quality. This reflects a mix offormal (government and private sector provided) services and informal (self-management)management of solid waste. Volume data has been used to develop estimates of tonnage, the morecommon way of presenting information on waste quantities. This also means that data presented isindicative of likely ranges rather than definitive numbers, with these ranges used for considering thefeasibility of potential options.
3.1 Waste Quantity
Waste generated by households is either managed on site (animal feed, compost or burnt) orcollected for disposal or recycling. Data on quantities collected can be estimated from the totalquantity of material entering waste facilities (rubbish and recycling). An alternative approach is todevelop an estimate of average waste per household and use this to estimate total waste tonnage.This approach has been used for Atiu as an indicator for all outer islands.
For this study data sources include:
· Average rubbish and recycling weights from a roadside waste survey completed in August2016.
· Average bale weight and counts for rubbish bales at Rarotonga Waste Facility· Records of loads entering Rarotonga and Aitutaki Waste Facilities· Data from other organisations handling waste and recycling on Rarotonga.
Table 1 Estimated Waste Generation2 on Rarotonga (T/year)
Landfill Recycle Total % DiversionRarotongaHouseholds and small businessLarge businessesSelf-managed wasteTOTAL
547726571
1,844
241807
1,048
6491533
2,321
31%53%
0%45%
AitutakiHouseholds and small businessLarge businessesTOTAL
9260
152
49103152
141163304
35%63%50%
Outer IslandsHouseholds and small business
10kg x 150 hhd x 2630 0 30 0%
Household Waste
Food waste is generally fed to household animals (pigs and chickens) rather than disposed of withother household waste. Garden waste is generally burnt or stockpiled on site.
On Rarotonga the remaining household waste is collected weekly with residents using their owncontainers or rubbish bags. Waste is manually loaded into a single compactor truck that servicesboth residential and commercial customers. Residents separate glass, cans (aluminium and steel)and plastic bottles (PET and HDPE) for recycling. Recyclables are manually loaded into a dedicatedcollection vehicle and trailer.
2 Waste generation in this context refers to material collected i.e. does not include self-managed materials.

5
Tonkin & Taylor LtdWaste Management Feasibility StudyCook Islands Infrastructure
November 2016Job No: 86125.v1.6
On Aitutaki household waste is collected every two weeks with residents using their own containersor rubbish bags. Waste is manually loaded into an open tray truck that services both residential andcommercial customers. Residents separate glass, cans (aluminium and steel) and plastic bottles (PETand HDPE) for recycling. Recyclables are manually loaded into a dedicated trailer.
On Atiu household waste is collected every fortnight from households by the Island Council. Eachhousehold was provided with a 120L Mobile Garbage Bins aka Wheelie Bins (MGB) in 20012/13.Waste is manually loaded on to the Island council truck. There is no collection of recyclables.
Commercial Waste
On Rarotonga and Aitutaki waste from small businesses is generally collected in tandem withhousehold waste. Larger businesses purchase a collection service or transport their waste directly tothe Rarotonga or Aitutaki Waste Facilities.
Many businesses have their own waste management/disposal arrangements for all or part of thewaste they generate. For example:
· Many businesses provide food waste to animals and burn garden rubbish on site.· Edgewater Resort have a burn pit opposite the old MOIP Office for disposal of materials not
captured for recycling by their staff or guests. It is likely other Resorts have similararrangements.
· The Port of Avatiu have a bunker for burning general waste.· Pacific Resort on Aitutaki burn combustible waste and crush glass for use as aggregate and
filter media across their operation.· CITC collect, consolidate and export various recyclable materials from their operations and
other businesses.· Atiu Villas periodically burn their ‘combustible’ waste in a burn pit. Their organic waste is
composted or buried in shallow pits.
There is no detail available on the quantity of material managed on-site by various businesses onRarotonga or other islands. Available data has been used to develop an estimate of the totalamount of waste generated by major businesses on Rarotonga based on businesses that bring all oftheir waste to the Rarotonga Waste Facility. This suggests that there could be over 500 tonnes ofwaste per year managed outside the Rarotonga Waste Facility - by burning or burial.
Other Wastes
Quarantine waste from the Airport, Port and clinical waste from Rarotonga Hospital is incinerated atthe Airport (Airport, Port) and Hospital. The hospital burns several times a week while the airportindicates they burn around 2-400 kg per day3,4 or 50-100 T per year.
Hazardous Waste
There are programmes in place to capture, store and export hazardous wastes including e-waste(computers, monitors, other electrical appliances), used batteries (lead acid and dry cell batteries)and used oil. Where materials are captured they are stored until there are sufficient quantities forexport.
3 From around 19 internal flights each week: 16 from Auckland (A320 and B777), 1 from Sydney (B767), 1 from Los Angeles(B777), 1 from Tahiti (ATR 42).4 Estimates are based on 0.4 kg/passenger (60T/yr) and self-reported estimate (400kg/day).

6
Tonkin & Taylor LtdWaste Management Feasibility StudyCook Islands Infrastructure
November 2016Job No: 86125.v1.6
Legacy materials
There is a range of other materials generated on Rarotonga and other islands on an ongoing basisincluding:
· Tyres· Old machinery (Outer Islands and Rarotonga)· Asbestos (from demolitions and storm damage)· Whiteware· Generators· Intermediate Bulk Containers (IBC) used to import emulsion, diesel and similar products.
These materials are generated on an ongoing basis but in many areas have also accumulated overtime. Examples include stockpiles of IBC’s at Infrastructure depots, old machinery on the outerislands, and used tyres.
3.2 Waste System Overview
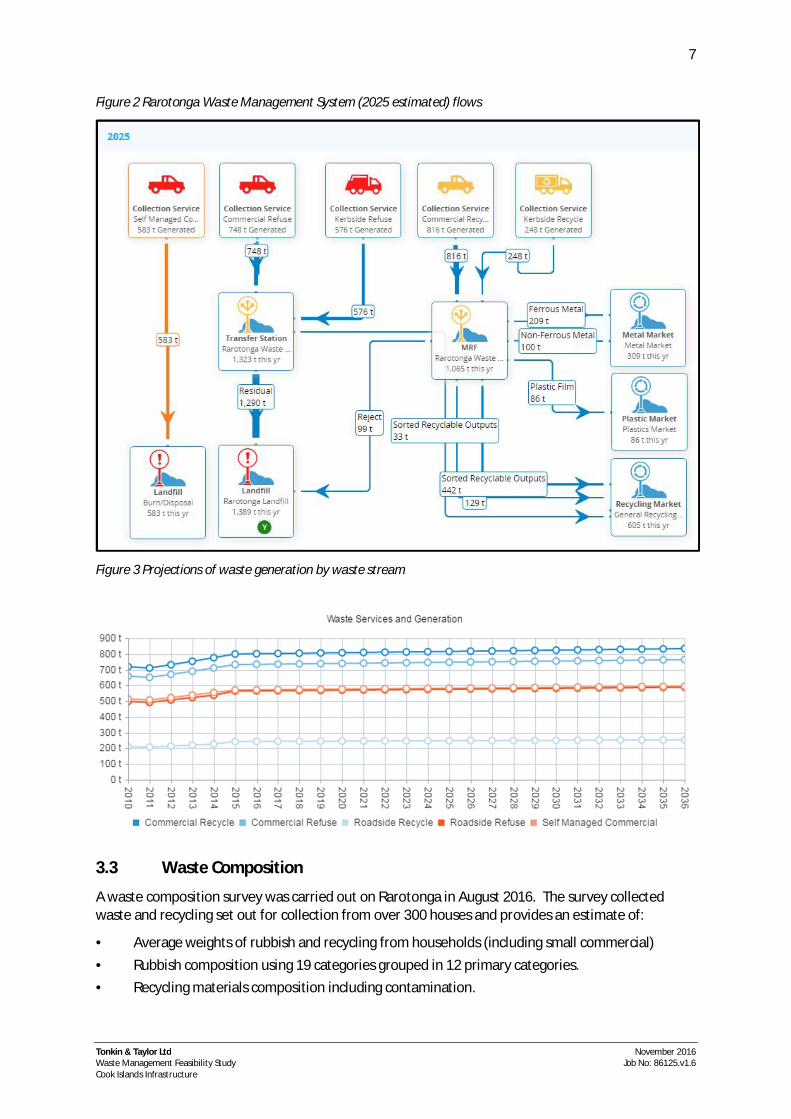
The Rarotonga waste flows are represented in the mass flow diagrams presented in Figure 1 andFigure 2. The difference between the two figures is the quantity of waste entering the system basedon projections developed considering historic waste generation, population and commercial activity.The projections are summarised, by waste stream, in Figure 3. The model underlying the diagramsallocates waste to either landfill (reject of residual) or recycling markets with the same % recoveryassume for 2015 and 2025.
Figure 1 Rarotonga Waste Management System (2015 estimated) flows
7
Tonkin & Taylor LtdWaste Management Feasibility StudyCook Islands Infrastructure
November 2016Job No: 86125.v1.6
Figure 2 Rarotonga Waste Management System (2025 estimated) flows
Figure 3 Projections of waste generation by waste stream
3.3 Waste Composition
A waste composition survey was carried out on Rarotonga in August 2016. The survey collectedwaste and recycling set out for collection from over 300 houses and provides an estimate of:
· Average weights of rubbish and recycling from households (including small commercial)· Rubbish composition using 19 categories grouped in 12 primary categories.· Recycling materials composition including contamination.

8
Tonkin & Taylor LtdWaste Management Feasibility StudyCook Islands Infrastructure
November 2016Job No: 86125.v1.6
For the purposes of this study the data from Rarotonga is assumed to reflect household/smallcommercial waste on Aitutaki. This is because the two islands have similar roadside collectionsystems and regular transport and shipping links. For islands without recycling services such as Atiucombining the rubbish and recycling data from Rarotonga provides an indication of likely rubbishcomposition. The data presented in Table 2, Figure 4 and Figure 5 provide a picture of the overallwaste composition with a focus on household waste and light commercial materials.
Points to note are:
· While organic waste (food scraps and garden rubbish) is a low proportion of waste comparedwith typical household and light commercial urban waste internationally it is a still over 10%of the waste stream.
· Plastic is a significant portion of the waste stream including a large amount of non-recyclablematerial (plastic bags, broken plastic items).
· Metals make up almost 10% of the waste (on Rarotonga) and are almost exclusivelyrecyclable.
· Glass is a significant portion of the waste stream, again largely recyclable.· Nappies (disposable) make up a large portion of the waste stream.

9
Tonkin & Taylor LtdWaste Management Feasibility StudyCook Islands Infrastructure
November 2016Job No: 86125.v1.6
Table 2 Estimated Waste Composition
Category Sub-Category Rarotonga (survey)/Aitutaki (est)
Atiu (est)
Rubbish Recycling Rubbish
Paper/Card 16.0% 4.5% 13.3%
Paper 4.8% 0.9% 3.9%
Cardboard 7.0% 1.5% 5.8%
Non-recyclable 4.2% 2.1% 3.7%
Plastic 27.0% 11.9% 23.5%
Plastic Recyclable 7.4% 5.5% 7.0%
Plastic Non recyclable 19.6% 6.4% 16.5%
Organic 13.8% 7.6% 12.4%
Food 10.0% 7.1% 9.3%
Garden 3.8% 0.5% 3.1%
Ferrous Metal 7.9% 2.4% 6.6%
Ferrous metals Recyclable 7.6% 2.4% 6.4%
Ferrous non recyclable 0.2% 0.0% 0.2%
Non ferrous metal 1.5% 1.5% 1.5%
Non-ferrous metals Recyclable 1.3% 1.5% 1.3%
Non-ferrous metals non recyclable 0.2% 0.0% 0.2%
Glass 15.0% 60.6% 25.5%
Glass Recyclable 14.3% 60.5% 25.0%
Glass Non recyclable 0.7% 0.1% 0.5%
Textiles Textiles 2.2% 2.2% 0.0% 0.0% 1.7% 1.7%
Nappies/Sanitary Nappies/Sanitary 13.5% 13.5% 11.0% 11.0% 12.9% 12.9%
Rubble Rubble 0.8% 0.8% 0.0% 0.0% 0.6% 0.6%
Timber Timber 0.0% 0.0% 0.0% 0.0% 0.0% 0.0%
Rubber Rubber 0.1% 0.1% 0.0% 0.0% 0.0% 0.0%
Potentially hazardous Potentially hazardous 2.3% 2.3% 0.5% 0.5% 1.9% 1.9%
Total 100% 100% 100% 100% 100% 100%

10
Tonkin & Taylor LtdWaste Management Feasibility StudyCook Islands Infrastructure
November 2016Job No: 86125.v1.6
Figure 4 Rarotonga Collected Waste Composition
Figure 5 Atiu (outer islands) Estimated Waste Composition

11
Tonkin & Taylor LtdWaste Management Feasibility StudyCook Islands Infrastructure
November 2016Job No: 86125.v1.6
3.4 Waste generation and composition - issues and constraints
While there is some information available about the quantity and composition of waste generated inthe Cook Islands the data is incomplete. The available data needs to be interpreted considering that:
· Quantities have been derived using volume based estimates.· A proportion of waste (household and commercial) is managed by burning or burial on site5.· There is no data on coverage, set out rate or participation rates for roadside collection.
There is potential to improve the estimates of waste quantity through improved reporting andperiodic surveys of quantities of waste entering the Rarotonga and Aitutaki Waste Facilities. Theremay be potential to develop estimates of waste managed on site by households through the Tutakainspections completed by the Health officials and targeted surveys of businesses.
5 Comparing waste entering the Rarotonga Waste Facility from businesses with their own burning/disposal arrangementswith businesses with no informal arrangements provides an estimate of total waste generated. Allowing for commercialcollection of waste and recyclable materials provides an estimate of 500 T/yr of waste burnt or buried by businesses onRarotonga. This is nearly 20% of the total waste stream on Rarotonga (see Table 1).

12
Tonkin & Taylor LtdWaste Management Feasibility StudyCook Islands Infrastructure
November 2016Job No: 86125.v1.6
4 Waste Infrastructure and Services
4.1 Waste Collection
Once a material becomes waste it can either be managed on the site where it is generated orcollected for management elsewhere. From a public authority perspective appropriate managementon site may be preferable with the waste generator taking full responsibility. Public authoritiesprovide collection services for waste to address waste streams households or businesses cannotmanage themselves or manage using inappropriate methods.
4.1.1 Self-managed waste
On Rarotonga and elsewhere in the Cook Islands some wastes are effectively managed withoutgovernment involvement. Examples include:
· Food waste - generally fed to animals· Garden waste - variously composted or burnt on site· Some recyclable materials from businesses - handled by the business themselves (CITC) or
collected by commercial operators (T&M Heather, General Transport).
There are examples of waste materials handled by households or businesses themselves in ways thatare not appropriate. Examples include:
· Open burning of waste (burning of plastic is banned by the Public Health Act) - burning ofplastics in burn pits or simple rubbish piles.
· Dumping of rubbish at informal dump sites - common on the Outer Islands
4.1.2 Waste and Recycling Collection
Waste collection aims to collect and manage household and business refuse to minimise health andenvironmental impacts. This involves households or businesses storing waste in a suitablereceptacle (bag or bin) and timely collection of waste. Collections are normally weekly butfortnightly collections do exist, often where organic waste collection means the putresciblecomponent in the waste bin is low.
On Rarotonga and Aitutaki households and businesses use their own receptacles6 with collectorsemptying bins and picking up rubbish bags. On Atiu householders and businesses have 120L wheeliebins with Council emptying these bins once per fortnight.
Collection of recyclable materials is most effective when it is easy for householders to separate andpresent recyclable materials for collection. Most systems in place involve a standard receptacle (oneor more crates or wheelie bin) with weekly or fortnightly collection. Larger receptacles generallyencourage a higher capture of material. Encouraging householders and businesses to pre-sortmaterial provides a higher quality (and value) product.
On Rarotonga, households and businesses use their own receptacles with collectors emptying binsand picking up bagged recycling. Recycling is collected separately from refuse and sorted further atthe Rarotonga Waste Facility. On Aitutaki recycling is collected in the same vehicle as waste (in woolsacks) and sorted at the Aitutaki Waste Facility. No recycling service is available on Atiu.
6
On Rarotonga households were provided with refuse wheelie bins several years ago and many households still use thesealthough in many cases the bins are beyond their useful life i.e. are broken or heavily degraded.

13
Tonkin & Taylor LtdWaste Management Feasibility StudyCook Islands Infrastructure
November 2016Job No: 86125.v1.6
The waste and recycle collection system including estimated quantities for 2015 is presentedschematically in Figure 6.
Figure 6 Schematic of Rarotonga Waste and Recycling System
4.1.3 Collection Service Performance
The performance of the collection system can be compared with benchmarks drawing on wastecomposition information, quantity data and estimates of the participation of households andbusinesses. The key metrics include:
- Recycling or diversion rate - the percentage of material captured for recycling - a highperforming system will achieve 50-60% recycling rate but this typically includes collection oforganic waste materials, not a significant portion of the waste stream on Rarotonga.
- Recognition rate - the percentage of recoverable material captured. A high performingsystem will capture 60% or more of available materials.

14
Tonkin & Taylor LtdWaste Management Feasibility StudyCook Islands Infrastructure
November 2016Job No: 86125.v1.6
Table 3: Rarotonga Waste Management System Performance
General Recovery Performance
Composition Tonnes/Yr Composition Tonnes/Yr RecyclingRate (%)
RecognitionRate (%)
Total 100% 1,844 100% 1048 36% 57%
Paper/Card 16.0% 295 5% 52 15% 15%
Plastic 27.0% 498 12% 126 20% 40%
Ferrous 7.9% 145 2% 21 13% 10%
Non Ferrous 1.5% 27 2% 21 43% 39%
Glass 15.0% 277 61% 639 70% 64%
Other (contamination) 32.7% 602 18% 189 18% contamination
The data presented in Table 3 suggests there are opportunities to capture additional recyclablematerial through the roadside collection including cardboard, plastics and glass. Specifically:· While cardboard is collected from some commercial premises a large proportion appears to
be burnt and there is a significant quantity in the rubbish collected from households. Withexisting baling and reuse or export it should be possible to increase the capture of cardboardat both roadside and from businesses.
· Recovery of Plastic Bottles (PET and HDPE) is reasonable, but again it should be possible toincrease the capture of materials at both roadside and from businesses.
· Aluminium recovery is at a reasonable level but there is potential to increase this.· Glass recovery is at a reasonable level.
Waste from certain sources can also present challenges or opportunities and is worthy ofconsideration. Examples include:
· Business waste - waste from larger businesses is in some cases burnt rather than managedthrough government or island council provided services. This reduces the burden on publicwaste management services but involves risks to health and the environment as a result of airemissions (combustion products) and ash.
· Hazardous wastes - there are systems in place for the capture and export (for treatment ordisposal) of hazardous waste from Rarotonga and the outer islands. Storage in some locationslack cover/containment and in some cases the availability of appropriate export options is notwell understood.
· Bulky/difficult wastes - bulky or difficult wastes include tyres, white ware and end of lifevehicles and machinery. In some cases programmes have been or are in place to capturematerials for appropriate disposal or recycling but uptake has been mixed.

15
Tonkin & Taylor LtdWaste Management Feasibility StudyCook Islands Infrastructure
November 2016Job No: 86125.v1.6
4.2 Waste Processing and Disposal
4.2.1 Waste disposal
Rarotonga
Rarotonga Landfill - solid waste from government collections, private sector collections and broughtdirectly to the facility is disposed of at the Rarotonga Landfill at the Rarotonga Waste Facility. Wastematerial is placed in a concrete pad and baled daily (Monday to Friday) into 1 x 1.5 m bales forplacement in the landfill. The landfill is lined (clay, GCL, HDPE) and has been filled to ground level.Waste bales are currently (2016) stockpiled on the landfill surface pending further liner constructionor an alternative being in place. The original design anticipated a 15 year design life fromcompletion of construction in 2004 i.e. completed around 2019.
Airport Waste Incinerator - quarantine waste from the airport (from international flights) and port(international shipping) is incinerated at Rarotonga Airport. The incinerator is overdue forreplacement but has been waiting on the outcome of consideration of long term options for generalwaste and medical waste.
Hospital Waste Incinerator - medical waste from the Rarotonga Hospital is incinerated at thehospital. The incinerator is overdue for replacement but has been waiting on the outcome ofconsideration of long term options for general waste and quarantine waste.
T&M Heather - T&M Heather have a stockpile/disposal site for green and general fill immediatelyadjacent to the Rarotonga Waste Facility.
Edgewater Burn Pit - Edgewater Resort have a burn pit for general waste from their operation atArorangi.
Aitutaki
Aitutaki Landfill - solid waste from government collections and brought directly to the facility isdisposed of at the Aitutaki Landfill at the Aitutaki Waste Facility. Waste material is currentlyunloaded adjacent to the landfill and then transferred to the filling area using a loader. The landfill islined (clay, GCL, HDPE) but exposure to the elements including significant tropical storms hasresulted in significant deterioration of the exposed liner. The site has significant remaining capacitybased on filling rates to date.
Outer Islands
Atiu - solid waste collected by the Island Council is currently disposed of at an informal dump site tothe south of the island. The dump is immediately adjacent to the road with materials placed andperiodically covered with soil.
4.2.2 Waste consolidation and diversion
Rarotonga
Rarotonga Waste Facility - materials collected or dropped off for recycling at the waste facility aresorted (if required) and baled. Some recyclable materials are captured from general waste as it isloaded (via conveyor) into the baler. Aluminium is periodically exported to New Zealand withrevenue covering shipping costs and providing a return. Plastics (HDPE and PET) are baled andstockpiled because returns from sale do not cover the cost of shipping to New Zealand. Glass iscrushed, usually by placing on the landfill and running over with an excavator, and reused at theFacility as an aggregate replacement. Hazardous materials (e-waste, chemicals, oil) are stockpiledbefore export.

16
Tonkin & Taylor LtdWaste Management Feasibility StudyCook Islands Infrastructure
November 2016Job No: 86125.v1.6
The plastic that has been baled and stockpiled will be difficult to sell. This is because exposure to theelements has cause deterioration over time.
Cook Islands General Transport - General Transport accept a range of recoverable materials andconsolidates loads prior to export to New Zealand. Materials handled include general scrap(vehicles, machinery), lead acid batteries, e-waste and whiteware. Some wastes attract fundingsupport from the Cook Island Government or regional organisations (SPREP) while others arehandled on a purely commercial basis.
Titikaveka Growers Association - the Titikaveka Growers Association compost organic materials forre-use on their market gardens.
Cook Islands Trading Corporation (CITC) - CITC collect cardboard and plastic film from theiroperations and some other businesses. The materials are reused on Rarotonga (some cardboard ascover eventually converting into compost on taro patches) or exported for recycling on a commercialbasis.
CITC also collect and contain fluorescent light bulb tubes and sent away for safe disposals.
Aitutaki
Aitutaki Waste Facility - materials collected or dropped off for recycling at the waste facility aresorted (if required) and baled. Aluminium is periodically exported to New Zealand via Rarotongawith revenue covering shipping costs and providing a small return. Plastics (HDPE and PET) are baledand stockpiled with returns not covering the cost of shipping to New Zealand via Rarotonga. Glass iscrushed using a single bottle crusher and reused on site. Hazardous materials (e-waste, chemicals,oil) are stockpiled.
4.3 Waste Infrastructure and Services - Issues and Constraints
In collating and considering information about the delivery of waste infrastructure and services inthe Cook Islands, a number of issues were identified. These issues represent challenges in deliveringeffective services and achieving the aims of the National Waste Policy. In many cases the issues alsopresent opportunities for the Ministry for Infrastructure Cook Islands, Island Councils, thecommunity and/or the private sector to improve waste minimisation and management. The issuesidentified include:
· Illegal dumping of household and business waste including at old dump sites.· Landfill operations - the landfills in Rarotonga and Aitutaki are not operated in a way that
minimises exposure of placed waste to the elements.7
· Landfill construction - the landfills in Rarotonga and Aitutaki are in need of furtherdevelopment (Rarotonga8) and remediation (Aitutaki9).
· Outer Island dump sites for refuse disposal - on Atiu (assumed to be consistent with otherOuter Islands) general waste is disposed of at uncontrolled dump sites.
7 Landfill operation typically includes use of daily cover (a small amount of soil or other temporary cover) and intermediatecover (for completed landfill cells). This cover minimises access to the waste for vermin (flies, rats, birds) and allows thelandfill operator to more effectively manage rainfall entering the rubbish and the resulting leachate generation. ForRarotonga Landfill the Landfill Operations Plan sets out operations in defined cells with daily and intermediate cover. ForAitutaki Landfill the Operations Plan sets out similar requirements including minimising the area being actively filled at anypoint in time.8 The design for Rarotonga Landfill anticipated construction of a second cell including additional liner once filling reachedground level. This second phase of construction has not occurred and waste is currently stockpiled on top of the landfill9 Aitutaki Landfill’s liner system was extensively damaged during storms several years ago. Remediation requires designbut is likely to involve repairing and/or replacing the liner in the active filling area with provision to complete furtherremediation as filling progress through the site.

17
Tonkin & Taylor LtdWaste Management Feasibility StudyCook Islands Infrastructure
November 2016Job No: 86125.v1.6
· Performance of the collection system, there is potential to increase the capture of- Cardboard- Plastic bottles- Aluminium cans- Steel cans
· Access to recycling services - outside of Rarotonga and Aitutaki access to recycling is extremelylimited.
· Access to markets for recyclables - where materials are recovered access to viable markets isdifficult due to transport costs and variable material values (when shipping costs areconsidered), reflecting uncertain markets for many materials and currently low prices for mostrecycling commodities.- Aluminium provides a small return.- Steel is currently marginal.- Plastic (PET, HDPE) is not viable to export for recycling - the cost of collecting, baling and
exporting materials exceeds the revenue from sale of the materials in NZ.- Glass is not viable to export for recycling - the cost of collecting, consolidating and
exporting glass exceeds the revenue from sale in NZ.· There is a lack of enforcement of provisions banning illegal dumping of rubbish and burning of
certain waste streams.

18
Tonkin & Taylor LtdWaste Management Feasibility StudyCook Islands Infrastructure
November 2016Job No: 86125.v1.6
5 Option Identification
There are a wide range of approaches to providing waste minimisation and management servicesand programmes that could be adopted in the Cook Islands. A useful way to consider options is themodel set out in Figure 7. Simply put, effective waste minimisation and management relies on acombination of infrastructure (including collection), education/information and regulation or policy.These are supported by having the right data to inform strategic and operational decision making.
Figure 7: Effective Waste Minimisation and Management
For this project options have been identified by considering key challenges for the Cook Islands(Refer Sections 3.4 and 4.3), referencing approaches adopted elsewhere and looking for newsolutions where appropriate. Options have also been considered with reference to the currentrecovery rates of key materials10 (see Section 4.1). This report focuses on infrastructure options butoffers comment on Education, Policy and Data components where relevant.
Based on the model set out in Figure 7 options that could be considered can be grouped as follows.
Infrastructure· Providing collection services - collection of waste, recyclable materials (at roadside or waste
facility), organic waste and/or bulky items, litter bins;· Providing physical infrastructure - drop off facilities, waste processing and/or disposal
facilities;· Managing the negative impacts of waste - litter/illegal dumping.
Education (outside the scope of this report)· Changing behaviour - education programmes targeting schools, businesses and/or households· Working with importers to consider the materials entering the Cook Islands (packaging)
Policy (outside the scope of this report)· Implementation of existing policy e.g. regarding open burning of waste· Targeted data collection, for example waste surveys· Making information on waste issues and opportunities available.· Seeking funding for infrastructure projects that deliver on the goals and objectives for waste
minimisation and management
10 Key materials include paper/card, plastics, glass, nappies, metals and glass
The right data at the right time
Infrastructure
PolicyEducation
- Physical infrastructure- Collections- Addressing Illegal dumping/litter

19
Tonkin & Taylor LtdWaste Management Feasibility StudyCook Islands Infrastructure
November 2016Job No: 86125.v1.6
These options focus on the priority waste streams identified through the review of the currentsituation in Sections 3.4 and 4.3 and summarised in Table 4.
Table 4: Priority wastes and waste sources
Recyclable materials Other materials requiring activemanagement include:
Waste sources
· Paper/Cardboard · Hazardous waste · Households
· Plastics · Difficult or special waste · Tourism businesses
· Organic Waste · General waste
· Glass bottles · Disposable nappies
· Cans - steel and aluminium
5.1 Collection options
Once a material becomes waste it can either be managed on the site where it is generated orcollected for management elsewhere. From a public authority perspective management on site maybe preferable with the waste generator taking full responsibility. Public authorities providecollection services for waste to address waste streams households or businesses cannot managethemselves or manage using inappropriate methods.
Self-Managed Waste
On Rarotonga and elsewhere in the Cook Islands some wastes are effectively managed withoutgovernment involvement. Examples are noted in Section 4.1.1.There are also examples of wastematerials handled by households or businesses themselves in ways that are not appropriate.Examples are noted in Section 4.1.1.
Waste and Recycling Collection
Waste collection aims to collect and manage household and business refuse to minimise health andenvironmental impacts. This involves households or businesses storing waste in a suitablereceptacle (bag or bin) and timely collection of waste. Collections are normally weekly butfortnightly collections do exist, often where organic waste collection means the putresciblecomponent in the waste bin is low.
Globally services are funded variously through:
· General funds· A targeted charge for refuse services through property taxes· User charges e.g. through the purchase of official rubbish bags or direct charging for collection
services.
Collection of recyclable materials needs to make it easy for householders to separate and presentrecyclable materials for collection. Most systems in place involve a standard receptacle (one ormore crate or wheelie bin) with weekly or fortnightly collection. Larger receptacles generallyencourage a higher capture of material Encouraging householders and businesses to sort materialprovides a higher quality (and value) product.
Where there is a direct charge for rubbish collection there is a risk that households or businesses willavoid the charge through illegal disposal of rubbish. This is occurring to some degree with thereported illegal dumping or burning of commercial rubbish, possibly to avoid landfill disposalcharges. Any direct charge, for example through the sale of rubbish bags, will need to be set at alevel that is affordable for households and supported by education, and if required, enforcement.

20
Tonkin & Taylor LtdWaste Management Feasibility StudyCook Islands Infrastructure
November 2016Job No: 86125.v1.6
Current arrangements:· Refuse collection for households and small businesses is provided by the government
(Rarotonga) or the Island Council, funded by the government.· Recycling collection for households and small businesses on Rarotonga and Aitutaki is
provided by the government or Council funded by the government.· Larger businesses employ T&M Heather or Cook Islands General Transport to collect their
waste and recycling or handle their own waste· Businesses and households can drop waste and recycling at the Rarotonga or Aitutaki Waste
Management Facilities.
Issues· Illegal dumping of household waste· No limit on quantity of waste put out by each household11
· High level of contamination in recycling collections on Rarotonga· Low capture rates for recyclable materials from households· Inappropriate disposal of hazardous wastes· No recycling service on Atiu and outer islands
Rubbish collection options
The current refuse collection system is fully funded by the government. There is no detailedinformation on participation in the collection service or quantity of materials collected. There aresome issues with contamination in the recycling collection and recyclable material placed withrefuse for collections. There are also examples of illegal dumping of household refuse.
There are several reasons for considering changes to the way that rubbish is collected. Limiting thesize of the collection container (bag or bin) can encourage households to recycle where recyclingservices are available. Limiting the size and/or providing for mechanised collection also minimiseshealth and safety risks for collection personnel. Referencing approaches adopted elsewhere:· In Australia roadside waste is almost exclusively collected in wheeled bins with automated
loading.· In New Zealand there is an active debate contrasting wheeled bins (safety benefits, efficiency)
with bags (smaller, impose direct charges on households).· In the UK there is a mix of wheeled bin and bag based collections with drivers including user
pays (easier through bags) and the efficiencies (through automated collection).
Considering approaches adopted elsewhere waste collections could be:· A government run and funded collection service with each household providing their own
receptacle. This is the current approach and cost is assumed to be the same or similar.· A government run, tax funded service with either official bags or small
wheelie bins provided to each council. This approach is common withexamples in New Zealand, UK and Australia. New costs would include thebins or bags (similar total cost over the 5-10 year life of a wheelie bin).Advantages include limited refuse capacity encouraging diversion of wasteat home or into recycling and limiting weight of materials manuallyhandled by the collection crew.
11 Limits on the quantity of materials households can place for collection can encourage waste reduction (buying less), re-use (reusing containers, animal food) and/or recycling.
Objective:Limit rubbish capacityto encourage reuse/recycling and improvecollection crew safety

21
Tonkin & Taylor LtdWaste Management Feasibility StudyCook Islands Infrastructure
November 2016Job No: 86125.v1.6
- A government run, user pays refuse collection service. In most casesthis is through collection of approved rubbish bags that are boughtas required by households or businesses. In some cases householdspay for a wheelie bin collection service. This is a common approachin New Zealand with rubbish bags typically in the range $2.50-3.00per bag with prices range up to over $4.00 per bag in some areas.Assuming a single bag per week at this price for each householdrevenue in Rarotonga would be in the order of $3-400,000 per annum. In New Zealandhouseholds typical present bags 30-40 weeks per year, in Rarotonga this would translateto $100-$120 per household or $200 - $350,000 per annum total revenue.
Recycle collection options
The current recycling collection system is funded by the government. There is some information onparticipation in the collection service and quantity of materials collected. Considering approachesadopted elsewhere council could consider:· A government run and funded recycle bag service with each household providing their own
container or putting materials out in bags. This is the current approach and cost is assumed tobe the same or similar.
· A government run and funded recycle crate based service i.e. governmentproviding one or more recycle crate(s). This is the most common approachcurrently employed in New Zealand and Australia. Advantages includeproviding a standard container for recyclables to encourage diversion ofrecyclables into the recycling collection. The crate limits the size (andweight) of materials with safety benefits for the collection crew.
· A government run and funded recycle wheelie bin based service i.e.government providing recycle crate(s). This is a common approach inNew Zealand and the default system in Australia. Wheelie bins aretypically employed alongside automated collection. Advantages includeproviding a large storage container for recyclables and efficientcollections.
5.2 Technology options
In considering options that may be applicable in the Cook Islands it is important to recognise thechallenges noted in the National Solid Waste Management Policy. Specifically the small quantity ofwaste, small population and lack of funding are important issues to be considered. Also importantare the lack of specialist technical expertise, difficulty in maintaining a skilled operations team anddistance from technical support and markets.
The characteristics of the waste stream is another important factor when considering potentiallyviable options. Key characteristics include likely calorific value, moisture content, recoverablematerial and whether it is preferable (financial, triple bottom line) to recycle or recover energy. Inlocations where advanced waste treatment is applied there are typically comprehensive recyclingand recovery systems in place, e.g. roadside and self-haul recycling, organic waste collection andprocessing.
Electricity generation on Rarotonga is a mix of diesel generators and solar. There is a target toincrease renewable energy generation and new diesel generators have recently been procured witha resulting improvement in efficiency. There is potential for combustible waste to provide a sourceof energy using conventional or innovative waste to energy technology.
Objective:Limit rubbish capacityand impost cost toencourage reuse/recycling
Objective:Increase recyclingrate by providing astandard container
Objective:Increase recyclingby providing astandard container
22
Tonkin & Taylor LtdWaste Management Feasibility StudyCook Islands Infrastructure
November 2016Job No: 86125.v1.6
In many cases options considered in other locations are likely to be too large, too complex and/ortoo costly for Rarotonga. In identifying options for this study we have:
· Looked at options for key waste streams - plastics, glass, special waste (medical, biosecurity,confidential) and residual waste
· Reviewed options designed for small, remote communities or small quantities of waste· Considered options that simplify and scale down conventional approaches for larger
communities
Current arrangements· Rarotonga Waste Facility - sorting and baling of recyclables.· Cook Islands General Transport - sorting and export of metals (including whiteware) and e-
waste.· CITC cardboard collections· Commercial composting by Titikaveka Growers Association.· Rarotonga Landfill for general waste disposal.
Issues:· Landfill capacity - projected to be full around 2020.· Illegal burning of commercial and household waste.· Access to markets for recyclable materials.
5.2.1 Processing Options
There is a range of solid waste treatment technologies employed globally. These are discussedbelow with commentary on their suitability to Rarotonga.
Mechanical Biological Treatment (MBT)
Generic - mechanical (remove recyclable/recoverable materials) followed by biological (aerobic oranaerobic) treatment of biodegradable component. Configuration depends on objectives. Thebiological processing component may target production of a fuel (biodrying) or stabilisation (massreduction, creating a soil amendment product). The mechanical processing may target specificmaterials or removal of anything that is not biodegradable.
In Rarotonga and many of the Outer Island rich soils means the market for soil amendment may belimited. There are examples in Rarotonga12 of composting of food and garden waste with compostused to improve soil structure and provide nutrients.
Mechanical biological treatment processes typically employ automated sorting technology combinedwith enclosed composting and/or anaerobic digestion. Each of the components involve relativelycomplex mechanical engineering combined with sophisticated process control systems. These inturn require access to specialised maintenance and repair skills as well as trained operators.
Mechanical Heat Treatment (MHT)
Mechanical Heat Treatment involves mechanical processing (remove recyclable/recoverablematerials) followed by heat treatment of remaining materials. Configuration depends on objectives.The heat component may target pasteurisation (removing infection risk), production of a fuel, massreduction or creating a soil amendment product. The mechanical processing may target specificmaterials or removal of anything that is not amenable to heat treatment.
As noted above the market for soil amendment may be limited so MHT would most likely targetvolume reduction, pasteurisation or pre-treatment for waste as fuel. Heat treatment is used to
12 Titikaveka Growers Association

23
Tonkin & Taylor LtdWaste Management Feasibility StudyCook Islands Infrastructure
November 2016Job No: 86125.v1.6
render medical and quarantine waste suitable for landfill disposal, often with grinding of pasteurisedmaterial following heat treatment.
Mechanical heat treatment processes typically employ automated sorting technology combined withheat and/or heat with pressure processes. Each of the components involve relatively complexmechanical engineering combined with sophisticated process control systems. These in turn requireaccess to specialised maintenance and repair skills as well as trained operators.
Composting
Commercial scale composting of food and garden waste is common in many parts of the world, theresulting product can be sold for use in home gardens or used by commercial growers. TheTitikaveka Growers Association have a composting operation providing compost for their marketgardens. Some households on Rarotonga compost garden waste for use on site.
In many cases the biological component of Mechanical Biological Treatment process involvecomposting food, garden waste, other organic material, paper, cardboard and other biodegradablematerials in the waste stream such as disposable nappies13. There is potential to compost specificcomponents of the currently landfilled waste stream to either pre-treat prior to landfill or produce auseable, compost like product.
Composting can involve:· Complex, enclosed composting systems involving mechanical mixing of the composting
material and sophisticated process control.· Forced aeration of open composting piles e.g. via perforated pipes.· Open composting in windrows or pile. The composting material can be left to compost over
an extended period (static pile, 12-18 months) or regularly turned to improve aeration andreduce processing time (turned windrow).
Enclosed systems, and to a lesser extent forced aeration systems, are complex biological processesinvolving relatively complex mechanical engineering (enclosed systems) combined withsophisticated process control systems. These in turn require access to specialised maintenance andrepair skills as well as trained operators.
Anaerobic Digestion (AD)
Commercial scale anaerobic digestion of putrescible waste material is increasingly common in theUK and Europe with the technology also applied elsewhere. Anaerobic digestion is well establishedfor the treatment of wastewater treatment sludge providing stablisation, volume reduction andenergy recovery. Anecdotally in Rarotonga putrescible material (food waste) is largely captured foranimal feed. There could be potential for combining food waste with septage but on Rarotongaseptage is already treated through ponds at the Waste Facility.
Anaerobic digestion is a complex biological process with the operator balancing residence time thedigestion vessel, water content, temperature and agitation. Typical systems for solid waste or solidwaste components involve relatively complex mechanical and process engineering combined withsophisticated process control systems. These in turn require access to specialised maintenance andrepair skills as well as trained operators.
13 Enclosed composting of nappies in New Zealand has met with mixed success - key challenges include securing sufficientbulking material (garden waste, sawdust) and screening out physical contaminants (plastic) from the compost product.

24
Tonkin & Taylor LtdWaste Management Feasibility StudyCook Islands Infrastructure
November 2016Job No: 86125.v1.6
Biodrying
Normally the objective of aerobic decomposition processes such as composting is to stabilise andproduce a compost or composting like product. The composting process produces a significantamount of heat and this heat can be used to drying waste. Effectively the heat produced throughaerobic decomposition of organic matter in the waste stream dries the overall waste mass. Thisprocess is known as biodrying. Biodrying is typically used as pre-treatment for waste to energy. Thistechnology is applicable where there is a significant proportion of biodegradable material in thewaste stream and a downstream process that requires or would benefit from a dry feedstock 14.
5.2.2 Disposal Options
There are several options potentially applicable for solid waste disposal or destruction on Rarotonga,these are discussed below. More detail is provided in Appendix B.
Conventional waste to energy
Conventional waste to energy is flexible but likely to be very expensive at the small scale required.The quantity of waste generated on Rarotonga is intermediate in scale - larger than shipboardsystems (well established) but much smaller than even small scale municipal systems. Feasibilitydepends on a range of factors including:
· Inert content of the waste stream - non-combustible materials will cause issues with ashhandling and disposal.
· Capability to operate and maintain the technology· Access to use or disposal options for incineration residuals (bottom ash, air pollution control
residues)· Scale - conventional systems range from very small (50,000 Tonne per year) to more typical
150,000 - 500,000 tonne per year facilities.
Incineration systems typically employ automated sorting technology pre-incineration and may haveautomated ash handling systems. Each of the components involve relatively complex mechanicalengineering combined with sophisticated process control systems. These in turn require access tospecialised maintenance and repair skills as well as trained operators. Combustion by-products (airpollution control residues and bottom ash) require handling and suitable disposal or use options.
Advanced Thermal Treatment
Advanced thermal treatment technologies involve the oxidation of general waste in the absence ofoxygen (in the case of pyrolysis) or in low oxygen containing environments (for gasification). Outputsinclude a syngas which can then be used to generate energy. Energy generation efficiencies areusually slightly lower for advanced thermal process than for conventional incineration. This isbecause some energy is lost at the syngas conversion stage. The multiple stages in the conversionfrom waste to energy also significantly increases the operational challenges for advanced thermalprocess. As with incineration, some solid output is produced, typically including some hazardousmaterial.
Feasibility depends on a range of factors including:
· Content of the waste stream - inert materials will cause issues with processing equipment.· Consistency of inputs - advanced processes typically process homogenous materials i.e. pre-
processing via MBT, MHT or another pre-treatment process.
14 For example incineration or advanced thermal treatment. Other pre-processing is likely to be required - to removerecoverable materials and bulky items, to produce a consistent ‘fuel’ for the downstream process.

25
Tonkin & Taylor LtdWaste Management Feasibility StudyCook Islands Infrastructure
November 2016Job No: 86125.v1.6
· Capability to operate and maintain the technology· Access to use or disposal options for process residuals (char, air pollution control residues)· Commercial track record - there are very few facilities with a long track record and none with
track record at a very small scale required for Rarotonga.· Scale - existing or announced systems range from very small (50,000 Tonne per year) to more
typical 150,000 - 500,000 tonne per year facilities.
Advanced thermal systems typically employ automated sorting technology pre-thermal system andmay have automated product handling systems. Each of the components involve complexmechanical and process engineering combined with sophisticated process control systems. These inturn require access to specialised maintenance and repair skills as well as trained operators.Thermal treatment products (char, oil and air pollution control residues) require handling andsuitable disposal or use options.
Sanitary landfill
A new landfill site could be constructed by 2020 to replace the existing site once it has been filled. Anew site needs to be identified, secured and constructed in a relatively tight timeframe of 3 years.There was a 10 year lead time for the existing facility including site identification. There may bepotential to extend the current site, either up or down the valley, but this is dependent onlandowner and regulatory approvals. This will reduce lead time but it is estimated that communityengagement, permitting, design and construction will still require at least 3 years.
Regardless of the treatment and conversion option selected a disposal facility will be required toaccept residual materials (ash, char, and unsuitable materials).
Bale and export.
Another option is to consider exporting waste given the small quantity of material and challenges insecuring a suitable disposal site. Waste could be baled but would require treatment from abiosecurity perspective prior to entering the destination country. It may be possible to pasteurisethe waste prior to export using technology commonly used for medical and quarantine waste.
The cost of landfill in Rarotonga is around $100 per tonne for operations with an additional $100 pertonne funding for facility based on the capital cost of the existing facility. $200 per tonne for landfilldisposal is not unusual in NZ context although commercial rates can be negotiated that aresignificantly lower for large volumes. Material would require treatment in Rarotonga and/or NewZealand to address biosecurity risks. The cost of treatment and transport are likely to make thisoption prohibitively expensive.
Quarantine/Clinical Waste
A new solution is required for clinical and quarantine waste on Rarotonga. Typical solutions globallyinclude incineration15 or sterilisation followed by grinding and landfill disposal16. The currentsystems for managing these waste streams are at the end of their serviceable life i.e. a new solutionwill be required regardless of the outcome of this study. Incineration or advanced thermaltreatment could address these waste streams. If these technologies are not employed for generalwaste a single, small scale facility treating combined clinical and quarantine waste is an option forRarotonga.
15 SPREP have funded a number of small scale medical waste incinerators across the Pacific including for Aitutaki16 In New Zealand all medical and quarantine waste is treated by this method

26
Tonkin & Taylor LtdWaste Management Feasibility StudyCook Islands Infrastructure
November 2016Job No: 86125.v1.6
5.2.3 Treatment and Disposal Options Considered
As noted previously in this report, there are some activities that must occur - to address immediateissues or avoid likely future problems. These include:
· Complete Rarotonga Landfill design and construction17 - 2016/17.· Improve Rarotonga Landfill operation - 2016 and ongoing.· Improve Aitutaki Landfill Operation - 2016 and ongoing.· Replace Medical and Quarantine incinerators (single facility) - as soon as possible18.· Capture and stockpiling of hazardous waste prior to export for appropriate treatment and
disposal.· Proactive enforcement of current regulations regarding the open burning and uncontrolled
dumping of rubbish, particularly on Rarotonga.
Drawing on the discussion above, several options for the treatment and disposal of waste fromRarotonga have been considered. These are:
· New Landfill: A new landfill could be developed to accept waste once the existing RarotongaLandfill is full. The existing landfill has a conventional design employing a fully engineeredliner, leachate capture and treatment. A similar design, taking into account specific geologyand topography could be developed either at the current landfill site (an extension) or anothersuitable site on Rarotonga. Key considerations include:· Securing access to land - a long term lease would need to be secured for the landfill site.· Land area required, currently estimated at around 4 – 5 acres· Funding - the existing site cost $4-5M to build and requires $100-150,000 per year to
operate in a manner consistent with Landfill Operations Plan.· Treat - MHT: Solid waste that is currently landfilled could be subjected to mechanical heat
treatment (MHT), drawing on existing technology employed for larger scale plants in Australia,the US and Europe. Key considerations include:· MHT plants are typically large scale, application for such a small quantity of general
waste is relatively unknown.· The heat component of the process requires significant energy.· The mechanical component of the process targets recoverable materials which then
require a viable market.· A MHT plant will require a suitable location, with access to power, energy (heat source)
and space for managing incoming waste, recovered materials and treated waste.· The treated waste is potentially suitable as a fuel (subject to a suitable facility requiring
fuel), a low grade soil amendment or can be landfilled. The treatment process cansterilise the waste and reduces the volume of waste by 50-60%.
· Treat - MBT: Solid waste that is currently landfilled could be subjected to mechanicalbiological treatment (MBT), drawing on existing technology employed for larger scale plants inAustralia, the US and Europe. Key considerations include:
17 As noted previously the design for Rarotonga Landfill anticipated construction of a second cell including additional lineronce filling reached ground level. This second phase of construction has not occurred and waste is currently stockpiled ontop of the landfill with minimal containment.18 The cost for a new clinical and quarantine waste incinerator will vary depending on specifications, location forinstallation and supporting equipment and services. Based on a recent tender process for healthcare waste incineratorsacross the Pacific by SPREP the cost may fall in the range NZD$75-150,000 with installation, operator training and ongoingmaintenance additional to this figure.

27
Tonkin & Taylor LtdWaste Management Feasibility StudyCook Islands Infrastructure
November 2016Job No: 86125.v1.6
· MBT plants are typically large scale, application for such a small quantity of generalwaste is relatively unknown.
· The mechanical component of the process targets recoverable materials which thenrequire a viable market.
· The biological component of process involves processing of degradable material in anaerobic or anaerobic environment. The aerobic process is analogous to composting andproduces a compost like output. The anaerobic process produces biogas and solidresidue that can be further composted.
· A MBT plant will require a suitable location, with access to power, suitable separationfrom land uses sensitive to odour and space for managing incoming waste, recoveredmaterials and treated waste.
· The treated waste is potentially suitable as a fuel (subject to a suitable facility requiringfuel), a low grade soil amendment or can landfilled. The treatment process reduces thevolume of waste by 40-50%.
· Treat - Incineration: Solid waste that is currently landfilled could be processed through aconventional incineration plant. Waste incineration is a well-established with plants operatingin Asia, USA and Europe with typical scale range from 60,000 Tonne per year (very small) towell over 500,000 tonnes per year. There are a range of variations with a focus onarrangements feeding waste and managing ash. Key residuals include bottom ash and airpollution control residues. Key considerations include:· Incineration plants are typically large scale, application for such a small quantity of
general waste is unknown.· Incineration typically follows removal of bulky materials and metals.· An incinerator will require a suitable location, with access to power, suitable separation
from land uses sensitive to air emissions and space for managing incoming waste,recovered materials and ash.
· The bottom ash may be suitable as a low grade aggregate or could be landfilled. Theincineration process reduces the volume of waste by 60-80%.
· The air pollution control residues are hazardous waste and require stabilisation prior todisposal in a suitable facility.
· Treat - Advanced thermal treatment: Solid waste that is currently landfilled could beprocessed through an advanced thermal treatment plant with gasification the most advancedtechnology form a commercial perspective. Gasification is emerging at a commercial scalewith plants operating in Europe and Asia. The technology is best suited to consistentfeedstock - specific waste streams or pre-processed refuse. Commercial plants are similar inscale to other processing technologies but are often modular with relatively small modulescombined making use of common pre-processing and energy utilisation infrastructure. Thereare a range of variations with a focus on waste consistency, batch vs. continuous processingand use of gasification products (char, syn gas). Key residuals include char and air pollutioncontrol residues. Key considerations include:· Advanced thermal plants are typically large scale, combining pre and post processing
infrastructure to reduce cost. There are small scale examples operating on a pilot basis.· Advanced thermal treatments require a consistent feedstock. This is typically achieved
through pre-processing ranging from grinding/shredding of waste through to complexrefuse derived fuel production and additional to removal of bulky materials and metals.
· An advanced thermal plant will require a suitable location, with access to power,suitable separation from land uses sensitive to air emissions and space for managingincoming waste, recovered materials and char.

28
Tonkin & Taylor LtdWaste Management Feasibility StudyCook Islands Infrastructure
November 2016Job No: 86125.v1.6
· The char may be suitable as a carbon black type product, a low grade aggregate orshould be landfilled. The process reduces the volume of waste by 60-80%.
· The air pollution control residues are hazardous waste and require stabilisation prior todisposal in a suitable facility.
· Treat - Target specific materials: As noted above many of the advanced waste treatmentapproaches involve removal of recoverable materials before thermal (heating, burning orgasification) or biological treatment of the residual material. There is potential to focus onspecific materials within the residual waste stream drawing on components of MBT, MHT andpre-processing of materials prior to incineration or advanced thermal treatment. Examplesinclude removal of recyclable materials prior to landfill19 or putting in place processing forsource separated waste streams e.g. food waste, garden waste, disposable nappies. Keyconsiderations include:· Markets for captured materials. Recyclable materials captured from general waste are
likely to be of lower quality (contaminated). Logical targets would be aluminium cans(over 1% of rubbish) and glass bottles (over 14% of rubbish).
· Capacity to collect and process materials. The current arrangement at Rarotonga WasteFacility is an addition to a conveyor designed for feeding material into the baler, not forsorting. This means there is limited capacity to process/capture additional materialwith the current arrangements.
· Additional materials will need stockpiling, processing and storage prior to dispatch onsite.
19 Currently materials are ‘picked’ off the conveyor feeding the waste baler at the Rarotonga Landfill. Larger scale systemsdesigned for material capture typically have automated sorting, specifically designed sorting stations and conveyorsdesigned for ease of sorting and capture.

29
Tonkin & Taylor LtdWaste Management Feasibility StudyCook Islands Infrastructure
November 2016Job No: 86125.v1.6
5.3 Outer Islands Options
As previously noted, waste on the outer islands is either used on site (food waste for animals, gardenwaste for compost//mulch) or dumped. The current disposal arrangements are not ideal and thereis potential for significant environmental impacts without improvements being put in place.
For waste on the outer islands, options to improve the management of waste include:
Education - inform the community and businesses about waste management and recycling including:
· Better management of hazardous wastes (stockpiling for export to Rarotonga)· Management of food (animal feed) and garden waste (compost/mulch) at home· Avoid burning of general rubbish and particularly hazardous wastes and plastics.· Separation of recyclable materials, initially focussing on glass and aluminium cans
Recycling - capturing materials for recycling/reuse on the island or for export to Rarotonga.
· Using food waste and garden waste on site rather than disposing it with generalrubbish
· Providing for drop-off of glass and aluminium cans so they can be stockpiled and thenperiodically returned to Rarotonga (cans) or crushed for use on each island (glass)
· Exploring options to fund the return of plastics and steel to Rarotonga
Improving management of rubbish.
· Removing hazardous waste before material is dumped· Capturing materials for recycling - glass and aluminium cans and exploring options· Improving on-island dumping of rubbish - developing controlled dump sites taking into
account underlying soils, risk to drinking water and coastal waters, vermin andcontainment of leachates.
· Consolidation of general waste with periodic export to Rarotonga for treatment anddisposal.
There is potential to address the range of issues and options noted above for the Outer Islandsthrough the providing support for Island Councils. This could include:
· Developing clear and simple guidance on waste management and recycling.· Providing practical, on the ground support for establishing recycling collection points,
managing hazardous waste and establishing disposal sites.· Assisting with arrangements for returning materials (recyclables, hazardous waste) to
Rarotonga.
The Local Government Association of the Northern Territory (Australia) developed a suite ofguidance materials for small communities in the outback20. A similar suite of material targetingpractical, fit for purpose and effective strategies for the Outer Islands could be developed. Welldesigned, this material is likely to be relevant for other parts of the Pacific and other remote and/orsmall communities.
20 WASTE MANAGEMENT IN SMALL COMMUNITIES - web-resource with several guidance documents. Accessed August2016 at http://www.lgant.asn.au/policy-programs/sustainability-environment/waste-management-in-remote-regional-indigenous-communities

30
Tonkin & Taylor LtdWaste Management Feasibility StudyCook Islands Infrastructure
November 2016Job No: 86125.v1.6
6 Option Evaluation
6.1 Multi-Criteria Evaluation Approach
The options noted in Sections 5.1 to 5.3 need to be considered in light of the Cook Islands strategicdirection for solid waste management. This means assessing their ability to contribute to the vision,goals and objectives of the National Waste Policy while providing good value for money. The criteriaused for assessing options are set out in Table 5 below.
Table 5: Multi-Criteria Evaluation Framework
Criteria Policy Objective Comment
Cost to Government Objective 4 - Develop sustainablefinancing to manage solid waste.
Options that minimise government fundingrequirements are preferred. Cost can bemodelled for different scenarios underconsideration.
Landfill disposal/Diversion %
Objective 3 - Develop appropriatewaste management infrastructureincluding separation and storagefacilities.
Options that make it easy to avoid waste ordivert unwanted material from landfill arepreferred, measured as anticipated % diversion.
Local economicdevelopmentopportunities
To maximise local employment andbusiness opportunities
Options that provide opportunities for localbusinesses and community groups are preferred
Technology risk Addressing implementation risk(s) Options that employ well establishedtechnology are preferred - the simpler thebetter.
Market risk Addressing implementation risk(s) Options that have a viable market for theoutputs are preferred e.g. for compost orrecyclable materials
Community views Addressing implementation risk(s) Options that are, or are likely to be supportedby the community are preferred.
For the treatment and processing options the leading options have then be subjected to a high levelcost benefit analysis. The assumptions used in the Cost Benefit analysis have been employed forderiving indicative annual costs (amortised capital and operating). The Cost Benefit Analysis (Section6.3) is presented after the Multi-Criteria Assessment (Section 6.2).

31
Tonkin & Taylor LtdWaste Management Feasibility StudyCook Islands Infrastructure
November 2016Job No: 86125.v1.6
6.2 Multi-Criteria Evaluation Summary
There are several options for collection services and the supporting processing and disposalinfrastructure. These options have been considered using the Evaluation Framework noted inSection 6.1. The evaluation considered performance and cost at 2020 - when a new option isrequired for Rarotonga.
6.2.1 Collection Options Evaluation
The collection options evaluated are summarised below.
Table 6: Collection Options Considered
Option Description
Collection - Status Quo Government funded roadside collection of household and small commercialrubbish and recycling. Households and businesses use own container.Estimated cost $450,000 / year for collection21
Collection - New RubbishBins
Government funded roadside collection of household and small commercialrubbish and recycling. Households and businesses provided with new, small(80L) wheeled bin.Estimated cost $450,000 / year for collection
$50,000 / year for bins (amortised over 5 years)Collection - New RecycleBins
Government funded roadside collection of household and small commercialrubbish and recycling. Households and businesses provided with newrecycling crate.Estimated cost $450,000 / year for collection
$30,000 / year for crates (amortised over 5 years)Collection - New Rubbish& Recycle Bins
Government funded roadside collection of household and small commercialrubbish and recycling. Households and businesses provided with new, small(80L) wheeled bin and recycling crate.Estimated cost $450,000 / year for collection
$80,000 / year for bins (amortised over 5 years)Collection - Education Government funded roadside collection of household and small commercial
rubbish and recycling. Households and businesses use own container.$20,000 per year allocated to education targeting contamination, materialsrecognition and participation in the recycling scheme.Estimated cost $450,000 / year for collection
$20,000 / year for education.
Table 7 summarises the multi-criteria evaluation of collection options. Costs have been estimatedbased on current collection costs and incorporating likely capital costs for new collection containers.
21 This is similar to the current Collection Contract.

32
Tonkin & Taylor LtdWaste Management Feasibility StudyCook Islands Infrastructure
November 2016Job No: 86125.v1.6
Table 7:- Collection Options Evaluation
Criteria Coll - Status Quo Coll - NewRubbish Bins
Coll - NewRecycle Bins
Coll - NewRubbish &Recycle Bins
Coll - Education
Annual cost toGovernment
$450,000 $500,000 $480,000 $530,000 $470,000
Landfilldisposal/Diversion %
No changelandfill diversion
No changelandfill diversion
Greater than 40%diversion
Greater than 40%diversion
Greater than 40%diversion
Local economicdevelopmentopportunities
No change ineconomic activityin Cook Islands
No change ineconomic activityin Cook Islands
Small increase ineconomic activity(recycleprocessing)
Small increase ineconomic activity(recycleprocessing)
Small increase ineconomic activity(recycleprocessing)
Technology risk Commerciallyimplemented inthe Pacific
Commerciallyimplemented inthe Pacific
Commerciallyimplemented inthe Pacific
Commerciallyimplemented inthe Pacific
Commerciallyimplemented inthe Pacific
Market risk Single viablemarket
Single viablemarket
Single viablemarket
Single viablemarket
Single viablemarket
Communityviews
Communityunlikely to haveas strong view
Community likelyto be supportiveof change
Community likelyto be supportiveof change
Community likelyto be supportiveof change
Part ofcommunitysupportive -schools andmotivatedhouseholds
Summary score 31/45 31/45 34/45 32/45 35/45
Conclusion Do not progress Do not progress Seek funding Do not progress Recommended
The assessment summarised in Table 7 suggests that several options are not worthy of furtherconsideration at this point in time. These include continuing with the current service with nochanges and introducing new rubbish bins. There may however be an opportunity to investigatechanging the approach to collection of rubbish when the current collection contract is renewed in201922.
Introducing containers for roadside recycling warrants further investigation with a view toidentifying a suitable source of funding for the containers. Containers could be crates (commonlyemployed in New Zealand and Europe) or wheeled bins (commonly employed globally, tend to beused with mechanised collection). Crates could be employed within the current collection systemwhile effective introduction of wheeled bins may require new equipment and by implication changesto the current collection contract.
22 Any review of collection service should focus on collection staff safety, impact on recyclables recovery, overall costeffectiveness and setting performance criteria for the contractor to reward the contractor achieving a high level ofcustomer satisfaction and waste diversion.

33
Tonkin & Taylor LtdWaste Management Feasibility StudyCook Islands Infrastructure
November 2016Job No: 86125.v1.6
Targeted education to improve the use of the current service and once new containers for recyclingare introduced is also recommended. The data collected for this feasibility study suggests that keymessages could address:
· Contamination - there is a relatively high level of contamination in the recyclable materialcollected. Messages may be focussed on targeted materials or on the impact ofcontamination (nappies, food waste) on the recyclable materials, people processing materialsand the value of the product.
· Capture of recyclable materials - the composition data suggests there is a significant amountof recyclable material in rubbish (rather than recycling) put out for collection. Messages mayfocus on clearly explaining what can be recycled via the roadside collection and encouraginghouseholds to separate all that they can.
· Participation in the recycling collection - messages may focus on creating a community‘expectation’ that all households participate in the recycle collection.
6.2.2 Treatment and Processing Infrastructure
The treatment and processing options evaluated are summarised below. In all cases the disposal ortreatment option is for materials remaining after roadside recyclables collection and drop-off ofseparated recyclable material at the Rarotonga Waste Facility. The Waste Facility would continue tooperate for all options capturing recyclable materials and where relevant baling rubbish for landfill.Each of the options could accommodate rubbish from the outer islands if required.
Table 8: Treatment and Processing Options Considered
Option Description
Treat - New Landfill A new, government funded and operated, landfill on Rarotonga acceptinghousehold (collections) and commercial waste.Estimated cost $5-6M Capital Cost
$100,000 / year operating costTreat - MHT A new, government funded and operated, Mechanical Heat Treatment process on
Rarotonga accepting household (collections) and commercial waste.Estimated cost $6M Capital Cost
$225,000 / year operating costTreat - MBT A new, government funded and operated, Mechanical Biological Treatment
process on Rarotonga accepting household (collections) and commercial waste.Estimated cost $5-6M Capital Cost
$225,000 / year operating costTreat - Incineration A new, government funded and operated, incineration plant on Rarotonga
accepting household (collections) and commercial waste.Estimated cost $8-10M Capital Cost
$200-250,000 / year operating costTreat - Gasification A new, government funded and operated, Mechanical Biological Treatment
process on Rarotonga accepting household (collections) and commercial waste.Estimated cost $8-12M Capital Cost
$200-250,000 / year operating costTreat - Target specificmaterials
Targeted activity to capture and recycle, reuse or treat specific materialspotentially including food waste, garden waste and disposable nappies.Estimated cost alongside new landfill
Alongside new landfill, additional $20,000 operationalexpenditure

34
Tonkin & Taylor LtdWaste Management Feasibility StudyCook Islands Infrastructure
November 2016Job No: 86125.v1.6
Table 9, presented below, summarises the multi-criteria evaluation of treatment and processingoptions. Costs have been estimated based on existing commercial examples or based on workcompleted in similar locations. As noted previously the small scale of the Rarotonga for advancedtechnologies means there is considerable uncertainty in the capital and operational costs estimates.The annual cost includes an estimate of annual operating costs and the amortised capital costs 23.
Table 9:- Treatment and Disposal Options Evaluation
Criteria Treat - NewLandfill
Treat - MHT Treat - MBT Treat -Incineration
Treat -Gasification
Treat - Targetspecificmaterials
Annual cost toGovernment
$310,000 $500,000 $450,000 $670,000 $670,000 $330,000
Landfilldisposal/Diversion %
No changelandfill diversion
Greater than40% diversion
Greater than40% diversion
Greater than50% diversion
Greater than50% diversion
Greater than40% diversion
Localeconomicdevelopmentopportunities
No change ineconomicactivity in CookIslands
Small increasein economicactivity(recycleprocessing,processingplantoperationsandmaintenance)
Small increasein economicactivity(recycleprocessing,processingplantoperationsandmaintenance)
Smallincrease ineconomicactivity(recycleprocessing,processingplantoperationsandmaintenance)
Small increasein economicactivity(recycleprocessing,processingplantoperationsandmaintenance)
Small increasein economicactivity(recycleprocessing,processingplantoperationsandmaintenance)
Technologyrisk
Commerciallyimplemented inthe Pacific
Commerciallyimplementedbut not in thePacific
Newtechnology
Newtechnology
Newtechnology
Commerciallyimplementedin the Pacific
Market risk Landfill as thefinal destinationfor materials isa secure‘market’
No viablemarkets forheat treatedresidual,limitedmarkets forrecoveredmaterials
No viablemarkets forcompost likeoutput.limitedmarkets forrecoveredmaterials
Single viablemarket forenergy,limitedmarkets forrecoveredmaterials
Single viablemarket forenergy,limitedmarkets forrecoveredmaterials
Limitedmarkets forrecoveredmaterials
Communityviews
Communityunlikely to haveas strong view
Communityunlikely tohave as strongview
Communityunlikely tohave as strongview
Communityunlikely tohave asstrong view
Communityunlikely tohave as strongview
Part ofcommunitysupportive -motivatedhouseholdsandbusinesses
Summaryscore
28/45 23/45 21/45 24/45 24/45 31/45
Conclusion Recommended Do notprogress
Do notprogress
Do notprogress
Do notprogress
Investigatefurther
23 25 years at 0.5% real interest rate.

35
Tonkin & Taylor LtdWaste Management Feasibility StudyCook Islands Infrastructure
November 2016Job No: 86125.v1.6
While there are a range of waste processing and treatment approaches implemented globallycontinuing the current arrangements with a new landfill is the recommended option. This meansthat a new landfill site, or an extension of the current site, will be required from around 2020. Therecommended option reflects a number of factors including:
· The comparatively high capital and operating costs for alternative technologies.· Technical risks: the lack of commercially proven applications of advanced waste treatment
technology at a scale comparable to Rarotonga.· Market risks: the lack of markets for ‘products’ of the processes, in particular for heat treated
residual waste (MHT), compost like output (MBT), bottom ash (Incineration) and char(gasification).
· The likelihood that a new landfill will be required for residuals from the various advancedwaste treatment options considered.
There is also potential to build on the current capture of recyclable materials from the wasteimmediately prior to baling for landfill by targeting specific materials. This is a basic version of themechanical sorting component of MHT and MBT or the pre-processing component of bothconventional and advanced waste to energy plant.
6.3 High level cost benefit analysis
Approach
The leading options from the multi-criteria evaluation are the development of a new landfill,potentially supported by targeting specific materials for recovery. The next strongest optioninvolved energy recovery - conventional incineration and advanced thermal treatment returned asimilar weighted score. The economic analysis considers landfill vs. waste to energy to explore keydrivers of cost. The cost assumptions are the same, where relevant, as those used to develop anestimate of annual cost covering capital and operating costs.
The economic analysis of waste disposal options uses a cost benefit analysis (CBA) framework. Itcompares the full costs and benefits over the lifetime of the project options in terms of the effectson the Cook Islands as a whole.
The benefits of the options being considered are all defined as the disposal and/or effectivemanagement of all waste produced in the Cook Islands. Thus the waste management benefit is thesame in all instances. Our interest is in achieving these benefits at least cost.
Costs are defined as opportunity costs. The cost of using a resource for a particular activity is thatthe resource is not available for the next highest value use. This includes opportunity costs of capital(it could have been invested to create a return in some other venture), resources (they could havebeen used as inputs to some other industry) and labour (workers could be employed elsewhere).
Discount Rate in Net Present Value and Cost Benefit Calculations
Discount rates are used in CBA to adjust the impact on total value of costs and benefits, dependingon the time period in which they accrue. This adjustment is not to deal with inflation, which ishandled separately. Rather, it is to adjust values to take account of how any allocation of resourcesto a project, displaces the timing of consumption and/or investment relating to other activities.

36
Tonkin & Taylor LtdWaste Management Feasibility StudyCook Islands Infrastructure
November 2016Job No: 86125.v1.6
ADB projects are generally analysed using a discount rate of 10-12%.24 However, a recent ADBreview25 questions this practice and notes that rates might differ depending on whether inter-generational issues are at stake, and whether the primary impact is on consumption or investment.
Because the project being discussed is a significant capital project requiring Government funding,our assumption is that it is displacing capital expenditure, i.e. investment. For simplicity we haveused a rate of 10% in our analysis.
Options for consideration
The Options
The existing landfill is close to capacity. A new disposal option is required to be in place by 2020. Theoptions considered in this analysis are:
· a new landfill; and· an advanced waste treatment plant (advanced thermal). It would require the disposal of
residual ash /char and unsuitable materials.
In addition, there is the potential for increased recycling of waste. This would be in addition to oneof the options above, although it could mean reduced quantities of waste require management.
Costs and other data
The costs for the individual options are summarised in Table 10. The advanced waste treatmentplant requires both a plant and a new landfill for the disposal of the residuals. The total costs wouldinclude both components. For this assessment it is assumed that the capital costs of the new landfillwould be similar but that the quantity of waste (and thus the operational costs) would be 10% of thelandfill only option26.
Table 10 Volume and cost data
Component Commonassumptions
New landfill Advanced waste treatment
Annual volumes (t pa) Plant Residualsdisposal
Waste production 1,500
Recycled 500
Collection costs ($ pa) $300,000($200/t)
Capital costs ($)
Design/permitting(2017/18)
$250,000(2017/18)
$500,000(2017/18
$250,000(2017/18)
Construction,commissioning (2018/19– 2019/20)
$5 million $10 million $5 million
Operating costs ($ pa) $100,000 pa $250,000 $10,000 pa
24 Asian Development Bank (2013) Cost-Benefit Analysis for Development: A practical guide.25 ADB (op cit)26 Operational costs may be higher, reflecting high fixed costs regardless of scale although operational costs on Rarotongahave been relatively low with simple and cost effective approaches to waste handling and placement. Capital cost may belower if it is decided that a smaller void space can be developed. On balance the total annual cost incorporating financecosts (for capital) and operational costs are indicative of likely overall annual costs for the disposal component.

37
Tonkin & Taylor LtdWaste Management Feasibility StudyCook Islands Infrastructure
November 2016Job No: 86125.v1.6
The other information relevant to the consideration of costs and benefits and their timing, is that ofthe costs of finance. It is assumed that the capital costs for the project will be financed from an AsianDevelopment Bank loan. The costs of borrowing depend on the period of the loan, which is assumedto be 25 years. The assumptions are shown in Table 11.
Table 11 Interest rate assumptions (25-year ADB loan)
Factor Rate
Fixed swap rate (average 20 & 30 years USD) 1.88%
Contractual spread 0.50%
Maturity premium (17+ years) 0.20%
Total 2.58%
Source: Asian Development Bank Treasury Department (2016) Indicative Lending Rates for Loans under the LIBOR-BasedLoan Facility Foreign Exchange Rates & Cap/Collar Premiums for Floating Rate Loans; ADB (2014) Financial ManagementTechnical Guidance Note. Preparing and Presenting Cost Estimates for Projects and Programs Financed by the AsianDevelopment Bank.
These are nominal interest rates, whereas the costs data included in Table 10 are in constant dollar(real) terms. We use an inflation rate of 2.1% based on estimated annual inflation rates over theprevious five years.27 To adjust the nominal interest rate to a real rate we use the following formula:
= (1 + )
(1 + ) − 1
Where: rreal = interest rate in real terms
rnominal = interest rate in nominal terms
i = inflation rate
A nominal rate of 2.58% is equivalent to a real interest rate of 0.47% with an inflation rate of 2.1%.
In Table 12 we show the profile of costs between the two waste management options, includingcapital expenditure (capex), the finance costs which spread the capex costs over 25 years and theoperating costs from the first year of opening of the landfill or waste treatment plant.
Table 12 Profile of costs
Year ofoper-ation
Year New landfill Advanced waste treatment
Capex Financecost
Opex Total Capex Financecost
Opex Total
2017/18 $0.25m $250,000 $0.75m $750,000
2018/19 $2.5m $105,723 $105,723 $7.5m $317,170 $317,170
2019/20 $2.5m $211,446 $211,446 $7.5m $634,339 $634,339
1 2020/21 $211,446 $100,000 $311,446 $634,339 $260,000 $894,339
2 2021/22 $211,446 $100,000 $311,446 $634,339 $260,000 $894,339
.. ..
23 2041/42 $211,446 $100,000 $311,446 $634,339 $260,000 $894,339
24 2042/43 $211,446 $100,000 $311,446 $317,170 $260,000 $577,170
25 2043/44 $105,723 $100,000 $205,723 $0 $260,000 $260,000
27 ADB Key Indicators for Asia and the Pacific 2015

38
Tonkin & Taylor LtdWaste Management Feasibility StudyCook Islands Infrastructure
November 2016Job No: 86125.v1.6
Results
The overall results are shown in Table 13, in terms of an overall NPV to 2016 and an estimate ofcosts per tonne (in 2016 $ values).
Table 13 Cost benefit analysis results
Component New landfill Advanced wastetreatment
New landfill Advanced wastetreatment
PV ($m) to 2016 $/t
Collection $2.00 $2.00 $200 $200
Treatment $5.44 $543
Disposal $2.55 $1.95 $255 $195
Total $4.55 $9.39 $455 $938
A new landfill is clearly the lower cost option; advanced waste treatment costs are over double thecost.

39
Tonkin & Taylor LtdWaste Management Feasibility StudyCook Islands Infrastructure
November 2016Job No: 86125.v1.6
7 Cost Recovery Mechanisms
Waste management in the Cook Islands has high costs, including the costs of collection and formanagement which includes final disposal or recycling.
· There are a number of different options available for financing the costs of wastemanagement. Typically these are one of the following options:Financed by central or local government with revenues raised via taxes or property rates;
· Financed by households and businesses via charges for services, e.g. weekly charges perhousehold, or costs per bag collected.
As noted in Section 4.1 waste collection is funded by government with H&M Heather contracted todeliver rubbish and recycling collections. Waste disposal is partly funded through user charges withgovernment providing additional funding where required. The capital costs associated processing(baler, Rarotonga Waste Facility equipment) and the Rarotonga Landfill are not separated out frombroader government expenditure and debt.
Options to consider are those that shift the burden of costs from the government (and tax payers) tothose that produce waste. The main options for doing so are:
· Waste collection fees that cover the full costs of collection and disposal; and· Product charges which levy a charge on producers or importers of products, at the time that
the product is first sold, to cover the costs of eventual disposal.
These options are discussed below.
7.1 Waste disposal charges
Currently waste disposal charges recover some but not all of the costs of disposal. A total of$180,000 is recovered from charges. This is equivalent to $120/tonne for the disposal of 1,500tonnes of waste. This revenue covers the operational costs at the Rarotonga Waste Facility but doesnot offset the costs of collection or assumed cost of capital for the Rarotonga Landfill.
To recover the full costs of collection and disposal would require waste charges be increased toaround $550/tonne.
The risk with this approach is that it would introduce incentives for unauthorised waste disposal (flytipping). If this is thought to be significant, then finding other ways to pay for disposal will bepreferable (see below).
7.2 Product Charges
Product charges, sometimes called advance disposal fees (ADFs), place a charge on producers orthose first introducing products to the economy, on the basis of their expected impacts once theyenter the waste stream. They aim to “internalise” the costs of disposal in the product itself, i.e.ensure that the purchaser of the product pays for its disposal at the time of purchase. In addition toproviding revenue to pay for waste disposal, product charges can also have incentive effects. Thetype of incentive depends on the way in which they are levied.
· Those levied on the basis of weight or volume provide incentives for the purchase of lowerweight or smaller items.
· If charges vary with recyclability of the product, incentives are provided for purchase of morerecyclable products, although not necessarily for recycling itself.
40
Tonkin & Taylor LtdWaste Management Feasibility StudyCook Islands Infrastructure
November 2016Job No: 86125.v1.6
Product charges are used in a large number of countries, but often for specific products, e.g.electronics, tyres, packaging, hazardous wastes and vehicles.28 The charge bases include unitnumbers, e.g. charge per product sold, by volume or by weight. A charge as a percentage of value,equivalent to a goods and services charge, would be an alternative approach. The best approach touse would depend on the objectives being pursued.
7.3 Raising Revenue
If the objective is solely to raise revenue, then the best approach is likely to be that which wouldraise revenue at least cost. If it is not expected to have an incentive effect, then the basis fordeciding on a good mechanism is equivalent to that which governs good taxation policy, i.e. raisingrequired revenue in a way which minimises distortions in the economy. Distortions occur where thetax results in a shift in resource use within the economy from what it would be in the absence oftaxation. This includes changes in investment, hours of work and consumption.
Tax devices in the Cook Islands include company tax, income tax and value added tax (VAT). Becauseof the relationship of waste to consumption, an increase to VAT would appear to be a logicalavenue; it would be most easily explainable and would be likely to best meet fairness criteria bothbecause it targets tourists as well as locals and because of the relationship to products. However,increasing VAT may not necessarily be the least distortionary taxation option. This would requiredetailed analysis beyond the scope of this report. However, the point is that, if revenue is the solepurpose for the instrument, then general taxation provides a means to achieve this.
VAT is levied at 15% of the sales price in the Cook Islands. Approximately $85 million was raised fromVAT in 2015.29 The estimated annual costs of the different options, $311,000 and $673,000 for a newlandfill or advanced waste treatment respectively, would be equivalent to a 0.4% or 0.8% increase inthe VAT rate, i.e. to 15.4% or 15.8%. VAT was increased from 12.5% to 15% on 1 April 2014 and isthe same rate as applies in New Zealand. A small rate increase may not be worthwhile as there willbe transaction (administrative) costs for the government in introducing such a change which may cutinto some of the revenue saved.
However, in comparison with setting up a new product charge mechanism to levy a charge perweight or number of products, extending the VAT level may have lower costs.
7.4 Incentives for waste minimisation
A product charge levied on a weight or volume basis, would provide incentives for reduced wastethrough purchase of products with lower weight or volume. A product charge that varied in levelwith the recyclability of the product would provide incentives for a shift in purchasing towards thosethat were more recyclable.
Product charges with an incentive effect will raise revenue also and can be set at a level which (intheory) would recover all annual costs. However, because of the incentive effect, the amount ofwaste would be expected to fall such that the revenue collected is less than expected frommultiplying current waste quantities by the average charge level. The extent to which there is arevenue shortfall depends on the level of charge, and the price elasticity of demand. The elasticity
28 OECD Database on instruments used for environmental policy (http://www2.oecd.org/ecoinst); St Brown M, Yoder Jand Chouinard H (2011) Revenue sources to fund recycling, reuse, and waste reduction programs. Prepared forWashington State Department of Ecology29 Cook Islands Ministry of Finance and Economic Management (2016) Cook Islands Statistical Bulletin Taxation Statistics.March Quarter 2016

41
Tonkin & Taylor LtdWaste Management Feasibility StudyCook Islands Infrastructure
November 2016Job No: 86125.v1.6
will depend, in turn, on the existence of substitute products. The relevant elasticities are for therange of individual products rather than for waste disposal itself.30
The reduction in expected revenue does not matter if the amount charged per product is equal tothe disposal costs per product. However, because there are significant fixed costs of disposal (thecapital costs of the landfill or treatment facility), the reduction in revenue is likely to be greater thanthe reduction in costs; average costs of disposal are greater than marginal (or variable) costs.
An alternative approach is to make the level of charge equal to the marginal costs of disposal, i.e.the change in total costs of disposal resulting from one less tonne or cubic metre of waste. Such acharge would not recover all the costs of disposal but it would be optimal from an economicperspective. People would make a decision to purchase a product which produced more waste whenthe additional amount that they paid was equal to the costs which their purchase imposed on thecommunity because of the costs of final disposal. In theory, this results in the optimal amount ofwaste produced. The remaining costs of disposal can then be recovered using the least cost means,i.e. taxation as discussed above.
30 Price elasticities of demand for disposal are low. See: Covec (2012) Economic Factors of Waste Minimisation in NewZealand. Report to NZ Ministry for the Environment.

42
Tonkin & Taylor LtdWaste Management Feasibility StudyCook Islands Infrastructure
November 2016Job No: 86125.v1.6
8 Conclusions and Recommendations
The analysis set out in Section 6 indicates a clear course of action for treatment and disposal ofWaste on Rarotonga. The option identification and evaluation also considered collection of wasteand options for improving solid waste management on the outer islands.
Key recommended actions arising from the analysis presented in this report are:
1 Implement an education programme to improve the performance of the rubbish and recyclingcollection system and address key high risk waste streams and activities across the CookIslands. Key messages should include:· Appropriate management of hazardous wastes (stockpiling for export to Rarotonga)· Avoid burning of general rubbish and particularly hazardous wastes and plastics.· Management of food (animal feed) and garden waste (compost/mulch) at home· Separation of recyclable materials, initially focussing on glass and aluminium cans
2 Consider supplying recycling containers to households on Rarotonga and Aitutaki - to providea convenient storage container and improve capture of recyclable materials from householdsand small businesses.
3 Complete Rarotonga Landfill design and construction and Aitutaki Landfill remediation.4 Implement operational improvements at Rarotonga Landfill and Aitutaki Landfill.5 Replace clinical and quarantine waste incinerators with a single facility.6 Commence site identification community engagement, concept design, detailed design,
procurement and construction for new Rarotonga Landfill.7 Implement improvements in solid waste management on outer islands
· Education - inform the community and businesses about waste management· Develop simple, pragmatic and fit for purpose guidance to assist Island Councils
improve solid waste management on each island. Materials should cover:Implementing recycling initiatives - providing for drop-off of glass (to crush) andaluminium (return to Rarotonga), exploring options to fund the return of plastics andsteelImproving management of rubbish - capturing hazardous waste, controlling on-islanddumping of rubbish, considering consolidation and return to Rarotonga.
Table 14 summarises the actions noted above with indicative timing, indicative costs, responsibleagency and supporting parties.
.

43
Tonkin & Taylor LtdWaste Management Feasibility StudyCook Islands Infrastructure
November 2016Job No: 86125.v1.6
Table 14 - Recommendation Summary
Recommendation Indicative Timing Indicative Cost Responsible Support
1. Implement an educationprogramme
Commence Q1 2017. $20,000 per year, potentiallywith initial investment indeveloping material followed bylower level of ongoing funding.
InfrastructureCook Islands
Te Ipukarea.
2. Consider supplying recyclingcontainers
Confirm costs Q1 2017Confirm funding Q3 2017Roll out containers Q1 2018
$30,000 per annum to fundrecycle crates
InfrastructureCook Islands
T&M Heather,CI GeneralTransport
3. Complete Rarotonga Landfilldesign and construction
Design completed Q4 2016Construction Q1-2 2017
Design $30-50,000Construction
InfrastructureCook Islands
Consultants
4. Implement operationalimprovements at Rarotongaand Aitutaki Landfills
Operations Plan and training Completed Q1 20176 monthly ‘audit’ against plan
Additional $50,000 per yearoperational funding forRarotonga Waste Facility.
InfrastructureCook Islands
Consultants
5. Replace clinical andquarantine wasteincinerators
Confirm specification for new incinerator Q4 2016Permitting and Procurement of new incinerator Q1-2 2017
TBC Airport/Hospital
InfrastructureCook Islands
6. Commence new RarotongaLandfill process
Site identification and community engagement Q1-2 2017Design and permitting Q3 2017 - Q2 2018Procurement and Construction Q3 2018 - Q4 2019
Permitting approx. $250,000Construction approx. $5 -7,000,000
InfrastructureCook Islands
Consultants
7. Implement improvements insolid waste management onouter islands
Education - link to Recommendation 1Develop guidance for effective solid waste management onremote island communities.
Annual Budget Appropriation forsolid waste management and anestimated $200,000 capital perisland one off
Te Pa EnuaIslandGovernments
InfrastructureCook Islands

44
Tonkin & Taylor LtdWaste Management Feasibility StudyCook Islands Infrastructure
November 2016Job No: 86125.v1.6
9 Acknowledgements
Many stakeholders have contributed to the development of this report including providing valuableinsights into solid waste management across the Cook Islands, sharing information and ideas aboutoptions for the future and risks to be considered. Tonkin and Taylor extends thanks to all who haveoffer their input to the study.
45
Tonkin & Taylor LtdWaste Management Feasibility StudyCook Islands Infrastructure
November 2016Job No: 86125.v1.6
10 Applicability
This report has been prepared for the exclusive use of our client Cook Islands Infrastructure, withrespect to the particular brief given to us and it may not be relied upon in other contexts or for anyother purpose, or by any person other than our client, without our prior written agreement.
Tonkin & Taylor Ltd
Report prepared by: Authorised for Tonkin & Taylor Ltd by:
Chris Purchas Hugh Cherrill
Senior Consultant Project Director
CHPp:\86125\issueddocuments\86125 cook islands waste feasibility study final.docx

Appendix A: Policy Context
National Waste Policy (2016)
The Cook Islands National Solid Waste Management Strategy 2013-2016 was developed by theNational Solid Waste Management Committee and contains a mix of policy elements and morespecific strategies. The policy elements have formed the foundation for the National Solid WasteManagement Policy 2016-26.
The Policy notes that the Cook Islands faces a number of unique challenges as it deals withexternalities of economic development and its integration into the global economy. Solid wastemanagement is a significant challenge because of its impact on human health and ecosystems. Thecontextual challenges include:
· Lack of legislation heightens ambiguous role responsibilities· Limited institutional capacity due to small population· High transport costs related to small dispersed land masses· Lack of investment in infrastructure to manage solid waste· Asymmetrical trade balance, with the vast majority of consumables imported· Human and environmental health threatened by poor management of hazardous waste.
Several of these challenges are relevant to considering options for treatment and disposal of wastein Rarotonga. These are:
Limited institutional capacity due to small population
The limited number of knowledgeable staff working in solid waste management presents asignificant challenge for the government to advance proper solid waste management. Thisissue is compounded by the country’s depopulation trends. There is no appropriatelyresourced focal point within government that takes responsibility for waste management.For options that involve complex technology a key consideration will be ongoing access toskilled operators and technical support.
High transport costs related to small dispersed land masses
There are significant distances between the capital island, Rarotonga, and Te Pa Enua. Thisfactor, combined with the Cook Islands isolation from metropolitan countries that haverecycling facilities, increases the cost of recycling. This has inhibited solid waste recyclingand the safe disposal of hazardous waste. Distance also has an impact on access to technicalsupport for complex technology (see above) and may mean local treatment or processing ismore cost effective than exporting materials for treatment elsewhere despite small quantityof material requiring management.
Asymmetrical trade balance
Imports to the Cook Islands far exceed exports. The provisional balance of trade figures for2015 are NZ$157.2M for the value of imports, and NZ$20.2M for the value of exports. Thisis a negative trade balance of NZ$137.0M. The 2015 provisional figures categorise 25% ofimports (by total value) as food and live animals, with a further 6% categorised as beveragesand tobacco. Packaging from food, beverages and tobacco contributes significantly to thegeneration of waste. This waste stream increases to meet the additional consumptionneeds of visitors. In addition to this import export imbalance, many shipping containersreturn to New Zealand empty.
Human and environmental health threatened by hazardous substances
Any solutions considered must protect human and environmental health as a priority. Thismeans considering high impact components of the waste stream such as hazardous wastes.Residuals from treatment or disposal must also be appropriately managed to avoid negativeimpacts.
The following principles during the development of the National Waste Policy and are relevant forthis study:
1. Polluter pays principle
Those responsible for causing pollution or generating solid waste should pay for the cost ofdealing with the pollution, or for managing solid waste collection and disposal in order tomaintain ecological health and diversity. Individual responsibility for solid wastemanagement should be encouraged. It is essential to develop funding mechanisms based onthe polluter pays principle, which will sustain solid waste management in the future.
2. Precautionary principle
When an activity may lead to unacceptable but scientifically uncertain harm to humanhealth or the environment, actions will be taken to avoid or diminish that harm withouthaving to await the completion of further scientific research.
3. Consultation principle
All levels of government, communities and organisations should be consulted throughoutthe development and implementation of solid waste management strategies and actionplans. Such strategies or plans should be openly accessible to those in the community whoare interested.
4. Waste hierarchy principle
The 'Waste Hierarchy' is a strategic tool which prioritises actions for solid wastemanagement. The general hierarchical model that will be used under this policy consists of4 ‘Rs – Refuse, Reduce, Reuse and Recycle. This model prioritises waste avoidance andreduction methods, before reuse, recycling, and final disposal. In the Cook Islands, the firstR, (Refuse) places the onus on importers and consumers to reject the purchase of productsthat produce waste that is difficult and expensive to dispose of in an environmentally soundmanner.
5. Proximity principle
Solid waste should be managed as close to the source as possible. This recognises the needfor producers of waste to take responsibility for the management of that waste. It alsorecognises that there are costs - both environmental and financial - associated withtransporting waste over longer distances.
Objectives and policies
Waste minimisationObjective 1. Minimise the generation of solid waste.Policy 1.1 Follow the waste hierarchy model of the four 'R's - Refuse, Reduce, Reuse and Recycle - prioritising waste
avoidance and reduction, before reuse, recycling and final disposal.Policy 1.2 Promote responsible supplier and consumer behaviour using advocacy, education, incentives and
regulation.Policy 1.3 Encourage and require reduction of waste.Policy 1.4 Implement waste prevention and reduction approaches in all activities undertaken by government agencies.

Policy 1.5 Encourage businesses and industry to adopt waste minimisation practices, including cleaner productiontechnologies.
Explanation of Objective 1 and Policies:The outcome sought by Objective 1 is minimum generation of solid waste. This outcome is essential to achieving thepolicy vision of sustainable solid waste management, aspiring towards Zero Waste Cook Islands. The associated policiesgive effect to Objective 1 by following the waste hierarchy model of refuse, reduce, reuse and recycle which isconsistent with a zero waste approach. The policies recognise that minimisation of waste is the shared responsibility ofa range of stakeholders including suppliers, consumers, government, businesses and industry. The policies alsorecognise that advocacy, education, incentives and regulation, are all important tools that need to work together tominimise the generation of solid waste.Institutional and legislative frameworkObjective 2. Develop a clear and robust institutional and legislative framework.Policy 2.1 Establish a regulatory framework that:
a. Addresses solid waste prevention, recycling and management of different waste streamsb. Articulates the roles and responsibilities of agencies responsible for the coordination of solid
waste managementc. Supports the waste hierarchy model of the four 'R's - Refuse, Reduce, Reuse and Recycle.
Policy 2.2 Implement an institutional framework to ensure co-ordinated, effective and efficient management of solidwaste including supporting facilities and services.
Policy 2.3 Build capacity to ensure qualified and competent staff.Explanation of Objective 2 and Policies:The outcome sought by Objective 2 is an institutional and legislative framework which can support the policy vision ofsustainable solid waste management. This addresses two of the challenges identified in section 5.2 of this policy - thelack of legislation which heightens ambiguous role responsibilities, and the limited institutional capacity due to thesmall population. Policy 2.1 gives effect to the objective by recognising that a clear and robust legislative frameworkneeds to address all aspects of the solid waste stream; clarify the roles and responsibilities of the agencies involved; andsupport the waste hierarchy model.Policies 2.2 and 2.3 give effect to the objective by providing for the institutional framework with capacity building toensure qualified and competent staff.Appropriate infrastructureObjective 3. Develop appropriate waste management infrastructure including separation and storage facilities.Policy 3.1 Provide appropriate and effective waste management facilities across the country including community
recycling centres and solid waste storage sites.Policy 3.2 Store hazardous waste (including e-waste) safely as an interim arrangement, prior to its transfer to
environmentally sound disposal facilities overseas.Policy 3.3 Ensure waste management facilities are fit for purpose and are financially and operationally sustainable.Explanation of Objective 3 and Policies:The outcome sought by Objective 3 is the infrastructure needed to achieve the policy vision of sustainable wastemanagement. This addresses two of the challenges identified in section 5.2 of this policy - the lack of investment ininfrastructure to manage solid waste, and human and environmental health threatened by hazardous substances. Theassociated policies give effect to the objective by providing for appropriately located facilities which are of thenecessary standard for their intended use and which are financially and operationally sustainable. Policy 3.2 recognisesthe particular needs of hazardous waste which poses the most serious risks to human and environmental health.Sustainable financingObjective 4. Develop sustainable financing to manage solid waste.Policy 4.1 Introduce appropriate cost recovery measures such as: Advanced Disposal Fees, user pays for collection of
household waste, use of fees from fines.Policy 4.2 Give particular regard to cost recovery measures which encourage behaviour modification and more
responsible waste management.Policy 4.3 Undertake an economic assessment of the costs of solid waste management in the Cook Islands to inform
cost recovery mechanisms.

Explanation of Objective 4 and PoliciesThe outcome sought by Objective 4 is the sustainable financing needed to achieve the policy vision of sustainable wastemanagement. This addresses two of the challenges identified in section 5.2 of this policy - the high transport costsrelated to small dispersed land masses, and the lack of investment in infrastructure to manage solid waste. Theassociated policies give effect to the objective by providing for cost recovery measures and an economic assessment ofthe costs of solid waste management. Policy 4.2 recognises that cost recovery measures can also promote responsiblebehaviour such as by encouraging recycling or requiring the consumer to contribute directly towards the costs ofdisposal.Education and awarenessObjective 5. Promote individual and community responsibility for solid waste management.Policy 5.1 Undertake education and awareness, targeting the following groups:
Business and large scale waste producersGeneral adult populationYouth and children.
Policy 5.2 Develop and implement a communication strategy for solid waste management.
Explanation of Objective 5 and PoliciesThe outcome sought by Objective 5 is the individual and community responsibility needed to achieve the aspect of thevision expressed as 'an informed and proactive community taking responsibility…' This objective recognises that allstakeholders need to play an active role in moving to a zero waste approach. The policies give effect to the objective byproviding for education and awareness, and a communication strategy.Monitoring and evaluationObjective 6. Develop a strong monitoring and evaluation system.Policy 6.1 Collect accurate and up-to-date national statistics on solid waste.Policy 6.2 Ensure solid waste disposal facilities are monitored and managed in accordance with approved standards to
minimise environmental damage.Explanation of Objective 6 and PoliciesThe outcome sought by Objective 6 is the monitoring and evaluation required to measure progress towardsachievement of the vision. The policies give effect to the objective by providing for accurate and up-to-date statistics,and the monitoring of environmental standards at waste disposal facilities.
National Sustainable Development Plan 2016-2020
The National Sustainable Development Plan 2016-2020 (NSDP) is also an important policy documentto consider when looking at options for solid waste treatment and disposal. The National Vision, asset out in the NSDP is:
“To enjoy the highest quality of life consistent with the aspirations of our people, and inharmony with our culture and environment”
The NSDP sets sixteen national development goals. Goal 3 is of most direct relevance to this wastepolicy. It is to:
"3. Promote sustainable practices and effectively manage solid and hazardous waste"
The NSDP has identified two indicators to measure progress towards this goal. Indicator 3.1 trackstotal waste recycled. Indicator 3.2 tracks the percentage of hazardous waste that is accounted forand managed.
Other NSDP goals of relevance are:
"4. Sustainable management of water and sanitation"
"11. Promote sustainable land use, management of terrestrial ecosystems, and protectbiodiversity”
“12. Sustainable management of the oceans, lagoons and marine resources"
These goals are of relevance because of the adverse effects that poor solid waste management canhave on the natural environment.

Appendix B: Waste Technology options
CONVENTIONAL INCINERATION
Technologydescription
The technology involves the thermal combustion of waste in the presence ofoxygen, liberating energy, usually in the form of steam. It is used to treatmunicipal solid waste (MSW) as well as other streams such as hazardousmaterials (e.g. clinical waste); the latter typically requires the use of moresophisticated emissions abatement equipment. Where MSW is the feedstockthere is usually some generation of energy – most typically electricity,sometimes heat – from using the resulting steam in a steam turbine. Electricalgeneration efficiencies for the incineration of MSW (in the absence of any heatutilisation) range from 13%-29%, not taking into account the energy usedwithin the plant itself. In addition to energy, ash is produced (around 25% ofthe tonnage treated at the plant). Depending on the abatement equipmentbeing used, a portion of this solid output is usually hazardous, requiringadditional precautions to be undertaken to reduce environmental impactswhere it is landfilled.
Scale The technology itself does not preclude the development of very small facilities(less than 10,000 tonnes per annum), whilst very large facilities treating inexcess of 1 million tonnes per annum have also been developed. The energygeneration potential decreases as the size of the facility decreases, whilst costsper tonne increase.
Risk The technology has been widely used all over the world for many years, sooperational risks are relatively low.
Indicative costs Costs are dependent on facility size, pollution abatement requirements, andthe approach to procurement. Indicative per tonne costs for a CHP facility inShetland Islands (UK) treating 20,000 tonnes of waste annually were NZ$51capex and NZ$131 opex. Smaller facilities would be more expensive but thegeneration of electricity only (as opposed to CHP) would be expected to reducecosts.
Exterior of a MSW Incinerator in Qatar

ADVANCED THERMAL TECHNOLOGIES – PYROLYSIS & GASIFICATION
Technologydescription
These technologies involve the oxidation of carbon-based materials in theabsence of oxygen (in the case of pyrolysis) or in low oxygen containingenvironments (for gasification). Outputs include a syngas which can then beused in a steam turbine – by far the most common application - or gas engineto generate energy. Where a steam turbine is used, generation efficiencies areusually slightly lower (for the same size of facility) than for conventionalincineration as some energy is lost at the syngas conversion stage. Energygeneration efficiencies are higher where a gas engine is used, but thissignificantly increases the operational challenges. As with incineration, somesolid output is produced, typically including some hazardous material.
Scale These technologies are commonly marketed as modular and there are anumber of pilot facilities in operation, so the development of very smallfacilities is not precluded. However, as with incineration, costs increase andenergy generation performance decreases for small scale plant.
Risk Much higher risk than conventional incineration; many plant treating MSWhave experienced operational difficulties due to the heterogeneous nature ofthe material. Risks are especially high for technologies using gas engines – thereare very few reference facilities operating globally at any scale for this type oftechnology.
Indicative costs Costs are dependent on facility size, pollution abatement requirements, andthe approach to procurement. Costs for pyrolysis and gasification are unlikelyto be cheaper than that of incineration.
Interior Photo of the Chinook Gasification System
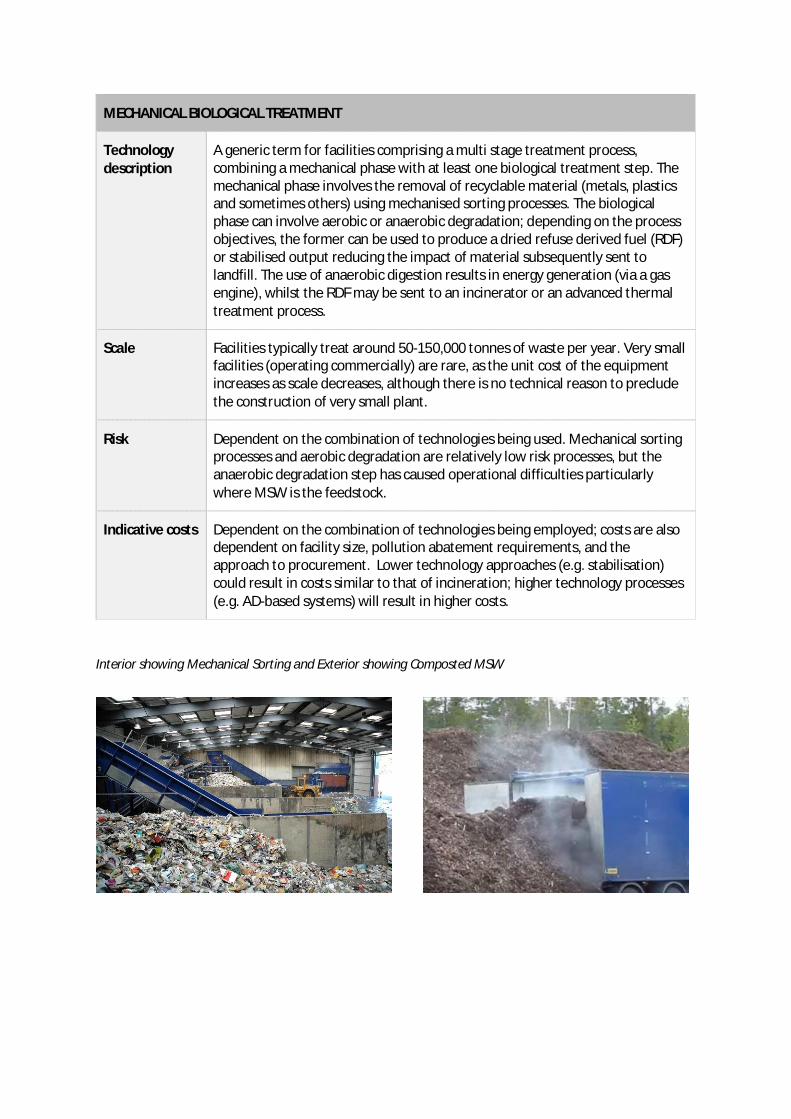
MECHANICAL BIOLOGICAL TREATMENT
Technologydescription
A generic term for facilities comprising a multi stage treatment process,combining a mechanical phase with at least one biological treatment step. Themechanical phase involves the removal of recyclable material (metals, plasticsand sometimes others) using mechanised sorting processes. The biologicalphase can involve aerobic or anaerobic degradation; depending on the processobjectives, the former can be used to produce a dried refuse derived fuel (RDF)or stabilised output reducing the impact of material subsequently sent tolandfill. The use of anaerobic digestion results in energy generation (via a gasengine), whilst the RDF may be sent to an incinerator or an advanced thermaltreatment process.
Scale Facilities typically treat around 50-150,000 tonnes of waste per year. Very smallfacilities (operating commercially) are rare, as the unit cost of the equipmentincreases as scale decreases, although there is no technical reason to precludethe construction of very small plant.
Risk Dependent on the combination of technologies being used. Mechanical sortingprocesses and aerobic degradation are relatively low risk processes, but theanaerobic degradation step has caused operational difficulties particularlywhere MSW is the feedstock.
Indicative costs Dependent on the combination of technologies being employed; costs are alsodependent on facility size, pollution abatement requirements, and theapproach to procurement. Lower technology approaches (e.g. stabilisation)could result in costs similar to that of incineration; higher technology processes(e.g. AD-based systems) will result in higher costs.
Interior showing Mechanical Sorting and Exterior showing Composted MSW

MECHANICAL HEAT TREATMENT
Technologydescription
A variant of the mechanical biological treatment process. In this case, the wasteis heated at high temperatures both to sterilise the material and to make iteasier to subsequently remove a cleaner stream of recyclable materials usingmechanical separation processes. A variation on the mechanical heat treatmentprocess involves the use of elevated pressures as well as high temperatures in aprocess known as autoclaving. Depending on the approach used, the heattreatment step may also be followed by a biological treatment step. Some kindof RDF is also usually produced which may be used in an incinerator or anadvanced thermal facility.
Scale Pilot facilities have been developed at very small scale for some technologyvariants. However, the more typical operational capacity is 50-150,000 tonnesper annum.
Risk Risks are high. There have been very few facilities operating globally using thistype of technology in the past decade, and a number of those have experiencedsignificant technical difficulties.
Indicative costs Dependent on the combination of technologies being employed; costs are alsodependent on facility size, pollution abatement requirements, and theapproach to procurement. Costs for systems involving a mechanical heattreatment step are unlikely to be cheaper than that of incineration.
Interior of Orchid Environment Mechanical Heat Treatment Process

Appendix C: Options - Mass Flow Disgrama
Treat - MHT 2015
Treat - MHT 2025

Treat - MBT 2015
Treat - MBT 2025

Treat - Incineration 2015
Treat - Incineration 2025

Treat - Advanced Thermal Treatment 2015
Treat - Advanced Thermal Treatment 2025

Appendix D: Cost Benefit Analysis Model