WASTE HEAT RECOVERY IN ENERGY INTENSIVE SMALL AND MEDIUM SIZE
58
Master Programme in Energy Systems Examiner: Taghi Karimipanah Supervisor: Patrick Olsson & Ulf Larsson FACULTY OF ENGINEERING AND SUSTAINABLE DEVELOPMENT WASTE HEAT RECOVERY IN ENERGY INTENSIVE SMALL AND MEDIUM SIZE INDUSTRIES Case Study – Gästrike Härdverkstad Vjekoslav Bosnjak June 2012 Master’s Thesis in Energy Systems
Transcript of WASTE HEAT RECOVERY IN ENERGY INTENSIVE SMALL AND MEDIUM SIZE
Master Programme in Energy Systems
Examiner: Taghi Karimipanah Supervisor: Patrick Olsson & Ulf Larsson
FACULTY OF ENGINEERING AND SUSTAINABLE DEVELOPMENT
WASTE HEAT RECOVERY IN ENERGY
INTENSIVE SMALL AND MEDIUM SIZE
INDUSTRIES
Case Study – Gästrike Härdverkstad
Vjekoslav Bosnjak
June 2012
Master’s Thesis in Energy Systems

ABSTRACT
In order to keep a high level and to stay competitive in the world market in the future, it is
important for the Swedish steel industry to improve their efficiencies continuously and to reduce
the energy consumption. In order to realize these goals, the Swedish steel association Jernkotoret
was found and by their initiative Triple Steelix was found in 2006 in Berglanden, a significant
area for the steel industry. In 2009, the Clean Production Centre was found in Hofors in order to
build a cluster of local steel manufacturers, factories and companies. One of those companies is
Gästrike Härdverkstad, a small steal heat treatment industry with six employees and about
700.000 tons treated materials every year.
The aim for this thesis is to suggest solutions for recovering waste heat and lowering the total
energy consumption in furnaces for heat treatment in the case of Gästrike Härdverkstad.
Some limitations were necessary to complete the analysis and to come to conclusions. The
yearly treated material and energy prices were assumed to be constant and the yearly power
consumption was estimated by an extrapolation of a one to five days measurement.
Gästrike Härdverkstad is located in Uhrfors, the southern part of Åshammar, a village with
727 inhabitants. There are not any buildings with a possibility to supply heat and there is no
district heating in the surroundings. The company has a power consumption of 1.40 GWh/year, of
which 65.7% is consumed by the 12 main furnaces. The rest is used by eight seldom used
furnaces, devices and auxiliary machines of the support process like fans, pumps, compressor,
office heating, and some other. The efficiencies of the main furnaces are between 10% and 20%.
The estimated energy consumption of the space heating is about 27 MWh/year, which
completely can be covered by the material coolant and the combustion heat of the exhaust gases
from the hardening furnaces. Since there are 10 different types of furnaces with different duties
and efficiencies, the preheating furnace was taken as an example and compared with a new
furnace. According to the needs of Gästrike Härdverkstad, the furnace VAW 60/100-650°C from
the company Vötsch was chosen at the cost of 248,827 SEK. The payback time depends on the
efficiency. With an efficiency of 40% the payback time would be about 13 years, see Figure 20.
After the annealing and ageing, the finished products are cooled down in the building hall by
the ambient air. In future, the possibility of preheating the material with the heat of the finished
products should be considered. With an efficiency of 30.87%, one preheating furnace could be

replaced, and taken a payback time of 5 years into account; the price of the construction would be
allowed to be up to 253,200 SEK.
ACKNOWLEGMENT
This investigation, as final Thesis Project of Master in Energy Systems (University of
Gävle), was started to carry out in May, in collaboration with the company Clean Production
Centre and Gästrike Härdverkstad. Many people have been involved answering my questions,
providing me with information and so forth; some of those are mentioned below.
First of all, I would like to thank Patrick Olsson, my supervisor, and Ulf Holmberg at Clean
Production Centre, very much for their attention, help and support. Their comments, guidance
and advices have been essential for the development of my work, I have learnt a lot from them.
Secondly, I would like to thank Anders Hegnell from Gästrike Härdverkstad. He answered
my never ending questions and explained everything necessary very patiently.
I would also like to thank Ulf Larsson at the University of Gävle for his help. Furthermore, I am
very grateful for all the information I have received from other companies.

TABLE OF CONTENT
1. INTRODUCTION ................................................................................................................... 1
1.1 BACKGROUND ...................................................................................................... 2
1.2 GÄSTRIKE HÄRDVERKSTAD ............................................................................ 3
1.3 OBJECTIVES AND LIMITATIONS ...................................................................... 4
1.3.1 OBJECTIVES ............................................................................................... 4
1.3.2 LIMITATION ............................................................................................... 5
2. METHODS .............................................................................................................................. 7
3. RESULTS .............................................................................................................................. 13
3.1 LOCAL MARKET OF WASTE HEAT ................................................................ 13
3.2 END-USER ENERGY DISTRIBUTION .............................................................. 13
3.3 ENERGY EFFICIENCY OF EACH FURNACE .................................................. 16
3.3.1 PREHEATING............................................................................................ 17
3.3.2 HARDENING ............................................................................................. 19
3.3.3 ANNEALING ............................................................................................. 20
3.3.4 AGEING ..................................................................................................... 21
3.3.5 VACUUM FURNACES ............................................................................. 22
3.4 COMBUSTION ENTHALPY ............................................................................... 23
3.5 WASTE HEAT THROUGH VENTILATION ...................................................... 23
3.6 SPACE HEATING ................................................................................................. 24
4. DISCUSSION AND CONCLUSION .................................................................................. 27
4.1 SHORT TERM – REPLACING THE HEATING ................................................. 27
4.2 MIDDLE TERM – INCREASING THE FURNACE EFFICIENCY ................... 29
4.3 LONG TERM – HEAT RECOVERY BY THE MATERIAL .............................. 32
REFERENCES ............................................................................................................................. 34

APPENDICES .............................................................................................................................. 36
APPENDIX I.: CALCULATION ...................................................................................... 36
APPENDIX II.: NEW PREHEATING FURNACE .......................................................... 46
NOMENCLATURE
FIGURE 1: STEEL INDUSTRY IN SWEDEN........................................................................................... 2
FIGURE 2: TURN OVER 2007 – 2011 ................................................................................................. 4
FIGURE 3: MEASURING DEVISE KIMO AMI 300, PITOT TUBE TYPE L AND VANE PROBE .............. 9
FIGURE 4: PITOT TUBE IN A PIPE ..................................................................................................... 10
FIGURE 5: ELECTRIC CONSUMPTION PER MONTH – 2011 ................................................................ 13
FIGURE 6: PIE DIAGRAM OF THE POWER DEMAND ........................................................................... 14
FIGURE 7: TREATED MATERIAL PER MONTH - 2011 ........................................................................ 15
FIGURE 8: THE PARTICIPATION OF THE TOTAL TREATED HEAT MATERIAL………………... ……...16
FIGURE 9: SCHEME OF THE MAIN FURNACES .................................................................................. 17
FIGURE 10: PREHEATING FURNACES WITH THE VENTILATION ........................................................ 18
FIGURE 11: PREHEATING FURNACES - POWER DEMAND OF A WEEK ................................................ 18
FIGURE 12: HARDENING FURNACES AND THE EXHAUST GAS COMBUSTION ABOVE ......................... 19
FIGURE 13: FIVE ANNEALING FURNACES ........................................................................................ 21
FIGURE 14: AGEING FURNACES – ONLY ONE IN USE........................................................................ 21
FIGURE 15: VACUUM FURNACES .................................................................................................... 22
FIGURE 16: HIGH TEMPERATURE VACUUM (LEFT) AND VACUUM BMI (RIGHT) FURNACES ............. 23
FIGURE 17: DRAWING OF THE OFFICE BUILDING ...……..……………...…………………..…….24
FIGURE 18: DRAWING OF THE MULTIFUNCTIONAL BUILDING...………………………….....…….25
FIGURE 19: HEAT LOSSES IN AN ELECTRICAL FURNACE………………………………….....…….30
FIGURE 20: PAYBACK TIME IN YEARS - NEW PREHEATING FURNACE...……………………………31
FIGURE 21: PREHEATING FURNACE - POWER DEMAND (KW) OF A WEEK .………………………..37
FIGURE 22: ANNEALING FURNACE SARLIN - POWER DEMAND (KW) OF A WEEK.....……………..32
FIGURE 23: AGEING FURNACE - POWER DEMAND (KW) OF A WEEK...……………………………32
FIGURE 24: HIGH TEMPERATURE VACUUM FURNACE - POWER DEMAND DURING A WEEK….……32
FIGURE 25: BMI VACUUM FURNACE - POWER DEMAND (KW) DURING A WEEK………………….32
LIST OF TABLES
TABLE 1: COMBUSTION OF EXHAUST GASES FROM THE HARDENING ............................................... 23
TABLE 2: EXHAUST AIR FLOWS FROM VENTILATION AND COMPRESSOR ......................................... 24
TABLE 3: LOSSES THROUGH TRANSMISSION - OFFICE HEATING ....................................................... 26
TABLE 4: LOSSES THROUGH TRANSMISSION - MULTIFUNCTIONAL BUILDING .................................. 26
TABLE 5: DAILY AVAILABLE HEAT FROM THE COOLANT OIL AND THE COMBUSTED EXHAUST GAS . 28
TABLE 6: FURNACE EFFICIENCY ..................................................................................................... 29
TABLE 7: ANNEALING AND AGEING FURNACES ............................................................................. 33
TABLE 8: POWER DEMAND OF THE HARDENING FURNACES ............................................................. 38
TABLE 9: HARDENING FURNACE - MATERIAL FLOW AND HEAT IN THE LOAD ................................. 38
TABLE 10: HARDENING FURNACE - HEAT IN THE LOAD .................................................................. 39
TABLE 11: ANNEALING FURNACE SARLIN - HEAT IN THE LOAD ..................................................... 40
TABLE 12: AGEING FURNACE - HEAT IN THE LOAD ........................................................................ 41
TABLE 13: HIGH TEMPERATURE VACUUM FURNACE - HEAT IN THE LOAD ..................................... 42
TABLE 14: ABSORBED HEAT BY OIL IN THE HARDENING FURNACE ................................................. 43
TABLE 15: TRANSMISSION LOSSES - OFFICE BUILDING................................................................... 44
TABLE 16: TRANSMISSION LOSSES - MULTIFUNCTIONAL BUILDING ............................................... 44
TABLE 17: NECESSARY HEAT AT THE COLDEST DAY PER YEAR - OFFICE BUILDING ........................ 45
TABLE 18: NECESSARY HEAT AT THE COLDEST DAY PER YEAR - MULTIFUNCTIONAL BUILDING ..... 45
TABLE 19: DAILY AVAILABLE HEAT FROM THE COOLANT OIL AND THE COMBUSTED EXHAUST GAS
................................................................................................................................................. 45
LIST OF EQUATIONS
EQUATION 1: HEAT IN THE LOAD ..................................................................................................... 7
EQUATION 2: FURNACE EFFICIENCY ................................................................................................. 8
EQUATION 3: HESS LAW ................................................................................................................... 8
EQUATION 4: TRANSMISSION HEAT LOSSES THROUGH THE VENTILATION ENVELOPE ..................... 11
EQUATION 5: DEGREE HOURS PER HEATING SEASON ...................................................................... 11
1
1. INTRODUCTION
Industry, and especially energy intensive industry like the iron and steel industry, play a big
role in the global energy use and emission. Today, industry accounts for about one-third of total
global energy use. The sector is responsible for about 22% of the worldwide CO2 emissions, of
which 26% are from the iron and steel industry, (Fridtjof Unander, 2006).
In Sweden, the energy intensive industries produce major product revenues and are therefore
important for the national economy. In total, Swedish industry accounts for almost 40% of the
country’s energy use. The pulp and paper industry, the iron and steel industry and the chemical
industry are collectively known as energy-intensive and account for over two-thirds of total
energy use in the Swedish industry, (Fridtjof Unander, 2006).
Many sectors in the iron and steel processing industry converts or upgrades raw material or
first step processed material and contributes to important export revenues of the country. These
markets are characterized by strong competition worldwide, mainly from China and India, (Guo,
et al., 2008). Due to permanently increasing energy costs and increased restrictions for emissions,
it is essential for companies worldwide to keep their energy use as low as possible, (Worrell, et
al., 2001)
Energy efficiency was recommended as the first of the seven solutions for G20 actions for
green global recovery, (Edenhofer, et al., 2009). Particularly for a country like Sweden, with high
personal costs, the only way to stay competitive is to improve consecutively both, the quality of
their specialized products and the efficiency of energy use due to other competitors having
cheaper working force but a lower technology level, (Ma, et al., 2000). The highest ranked
driving force for cost effective energy efficiency investments is cost reduction resulting from
lower energy use, (Thollander, et al., 2007).
Since the 1970s, Swedish industry has improved its production efficiency at about 2 % per
year, (Fridtjof Unander, 2006). In order to maintain the continuous improvement, there are
different organizations and associations involved. For the iron and steel industry Jernkontoret -
the Swedish Steel Producers' Association - is important for collaborating with research investors,
INTRODUCTION
2
research institutes, universities and members in the form of steel companies and the respective
resources.
1.1 BACKGROUND
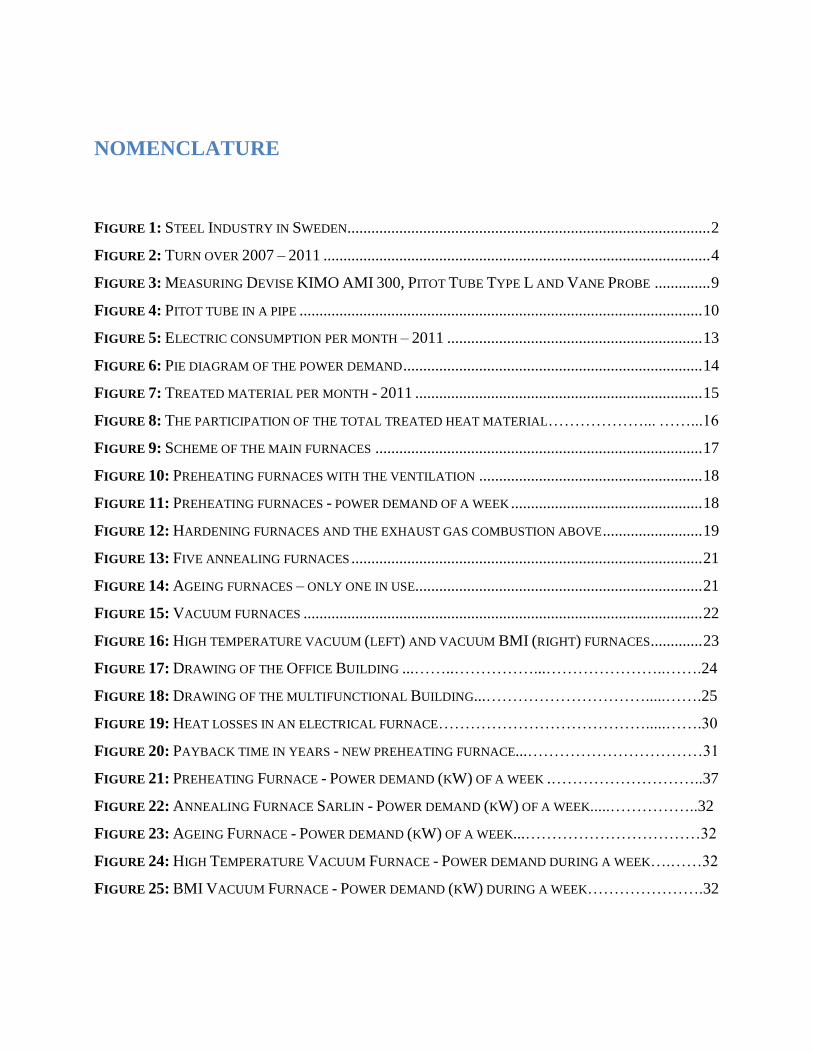
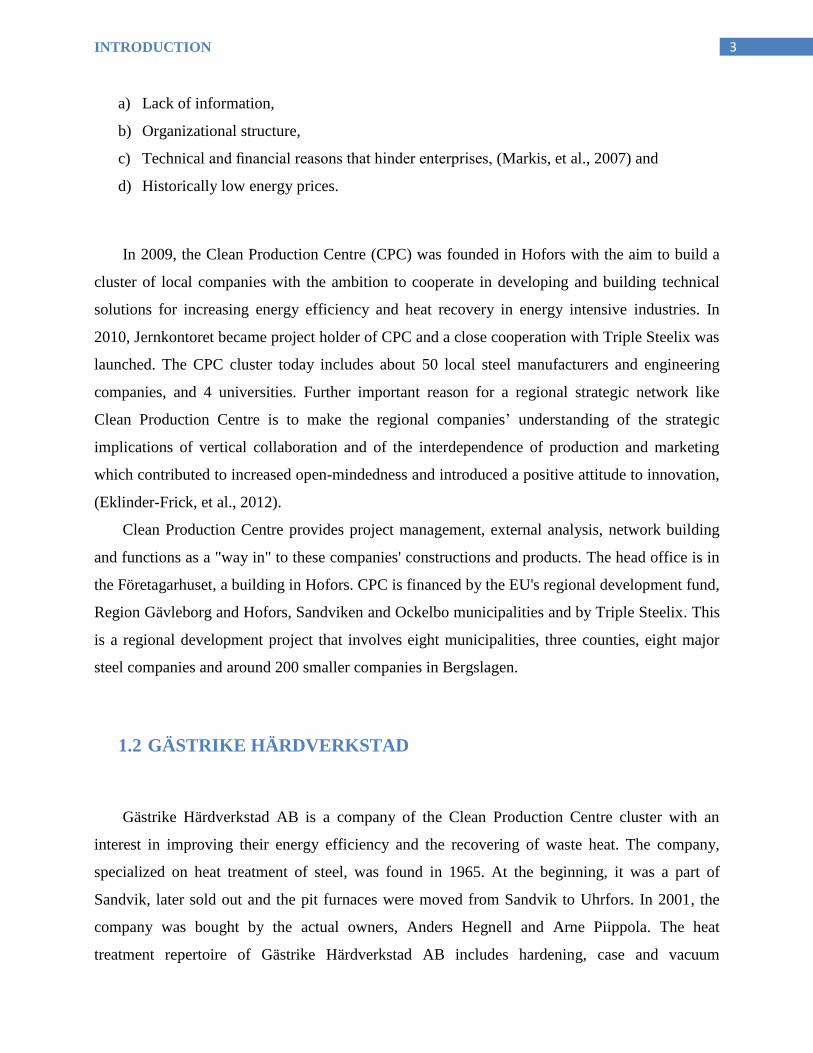
Significant importance in the Swedish steel industry has the
industrial area Bergslagen, (Figure 1). The Bergslagen Region is
globally leading within a number of specialized niche products such
as bearing steel, stainless pipes for oil-, nuclear and combustion
industries, high speed steel, high strength steel, tool steel, as well as
many other quality steels. Export accounts for 80 % of the total
production, (Steelix, 2012). By an initiative from Jernkontoret,
Triple Steelix was started 6 years ago with the objective to support
the development of the Bergslagen steel industrial cluster. This
cluster includes about 700 small and medium-sized enterprises
(SMEs), 6 steel producing companies, manufacturers of mechanical
equipment for metal forming, and industrial IT, etc. Members in the
Triple Steelix initiative are 13 municipalities, Region Dalarna,
Region Gävleborg, the University of Dalarna and Gävle, regional
actors as IUC Dalarna, Falun/Borlänge regionen and Stiftelsen
Teknikdalen (foundation for regional development) and the regional
authorities. Financially, Triple Steelix is supported by Vinnova, the regional public stakeholders
and the member industries.
The steel industry, as well as many of the SME’s in the steel industrial cluster, is large
energy consumers. The potential for increased energy efficiency, as well as heat recovery is
expected to be significant. The reasons for the insufficient adoption of energy conservation are
many, including:
Figure 1: Steel Industry in Sweden
INTRODUCTION
3
a) Lack of information,
b) Organizational structure,
c) Technical and financial reasons that hinder enterprises, (Markis, et al., 2007) and
d) Historically low energy prices.
In 2009, the Clean Production Centre (CPC) was founded in Hofors with the aim to build a
cluster of local companies with the ambition to cooperate in developing and building technical
solutions for increasing energy efficiency and heat recovery in energy intensive industries. In
2010, Jernkontoret became project holder of CPC and a close cooperation with Triple Steelix was
launched. The CPC cluster today includes about 50 local steel manufacturers and engineering
companies, and 4 universities. Further important reason for a regional strategic network like
Clean Production Centre is to make the regional companies’ understanding of the strategic
implications of vertical collaboration and of the interdependence of production and marketing
which contributed to increased open-mindedness and introduced a positive attitude to innovation,
(Eklinder-Frick, et al., 2012).
Clean Production Centre provides project management, external analysis, network building
and functions as a "way in" to these companies' constructions and products. The head office is in
the Företagarhuset, a building in Hofors. CPC is financed by the EU's regional development fund,
Region Gävleborg and Hofors, Sandviken and Ockelbo municipalities and by Triple Steelix. This
is a regional development project that involves eight municipalities, three counties, eight major
steel companies and around 200 smaller companies in Bergslagen.
1.2 GÄSTRIKE HÄRDVERKSTAD
Gästrike Härdverkstad AB is a company of the Clean Production Centre cluster with an
interest in improving their energy efficiency and the recovering of waste heat. The company,
specialized on heat treatment of steel, was found in 1965. At the beginning, it was a part of
Sandvik, later sold out and the pit furnaces were moved from Sandvik to Uhrfors. In 2001, the
company was bought by the actual owners, Anders Hegnell and Arne Piippola. The heat
treatment repertoire of Gästrike Härdverkstad AB includes hardening, case and vacuum
INTRODUCTION
4
hardening, annealing, nitrating and nitro carburizing. In the following chapters, the production
will be explained in more detail.
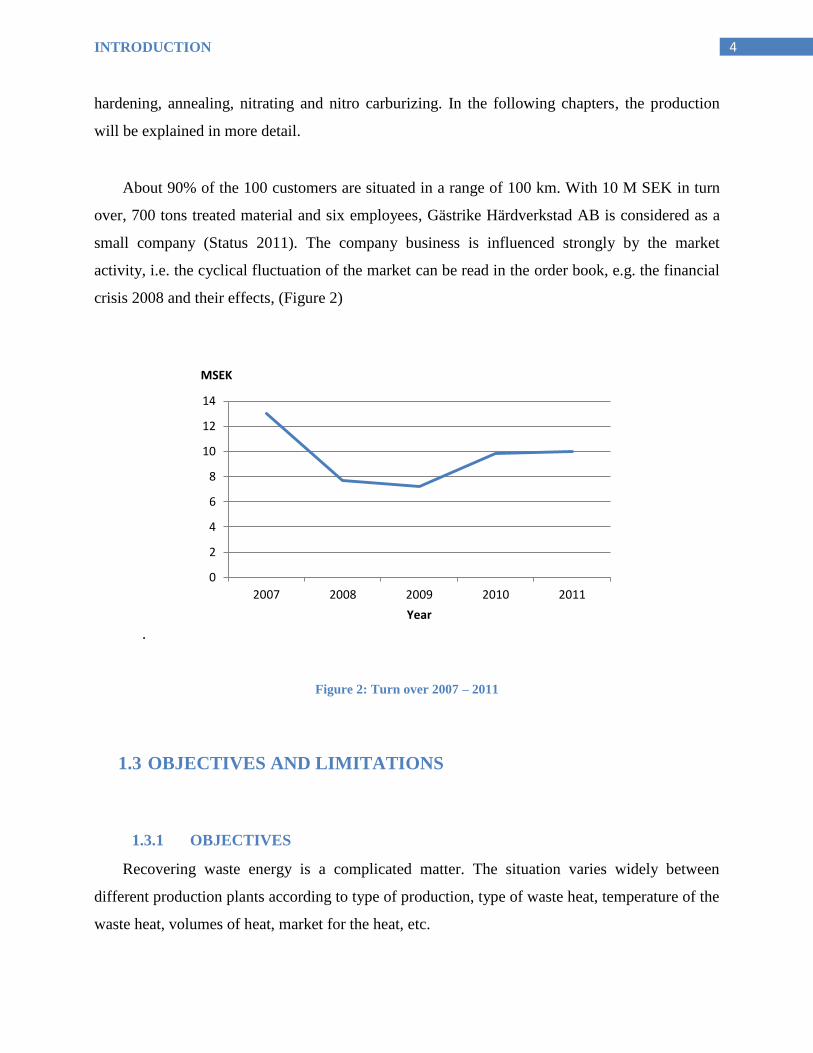
About 90% of the 100 customers are situated in a range of 100 km. With 10 M SEK in turn
over, 700 tons treated material and six employees, Gästrike Härdverkstad AB is considered as a
small company (Status 2011). The company business is influenced strongly by the market
activity, i.e. the cyclical fluctuation of the market can be read in the order book, e.g. the financial
crisis 2008 and their effects, (Figure 2)
.
Figure 2: Turn over 2007 – 2011
1.3 OBJECTIVES AND LIMITATIONS
1.3.1 OBJECTIVES
Recovering waste energy is a complicated matter. The situation varies widely between
different production plants according to type of production, type of waste heat, temperature of the
waste heat, volumes of heat, market for the heat, etc.
0
2
4
6
8
10
12
14
2007 2008 2009 2010 2011
MSEK
Year
INTRODUCTION
5
The aim for this thesis is to analyse and suggest solutions for recovering waste energy and
lowering the total energy consumption in furnaces for heat treatment.
1.3.2 LIMITATION
The limitations affect the way of calculating and the quality of the results. This study was
done in 2012, but some of the used input data are from other years. It is assumed that the power
demand and the amount of treated material are in 2011 and in the future years similar. Only the
electricity bill of June 2012 was available. It was analysed and the concluding price per kWh was
considered as constant.
In order to separate essential and insignificant parts of the production line from the
beginning, several furnaces and machines are not considered, since they are, according to the
energy manager, used rarely or their energy use is negligible. These are a pit furnace, five
annealing, a hardening and a nitrating furnace.
One point that must be considered is that the future estimations of the furnaces will be
limited by the accuracy of the input data given by the enterprise, as they will be taken as the
starting point. The data of the yearly power consumption for the furnaces is based on a five days
measurement of Gävle Energi and is extrapolated with the working weeks per year. According to
the energy manager, the considered annealing furnaces are similar, i.e. the same energy
consumption and material treatment can be considered.
The exhaust air of the ventilation outlets and of the compressor were measured on three days
for different time periods and afterwards with the results the yearly exhaust air flow was
estimated under the assumption that were average production days.
For the estimation of the power demand of the office heating were the maximal U-values
used, requested by the building laws at the construction period byggnorm SBN 67 BABS 1967
and SBN 75. In order to understand the future mathematical results, the calculations head
attached in the APPENDIX should be consulted.

2
7 METHODS
2. METHODS
In order to analyse this case, a “top-down” approach was used. This method is based on the
study of a system by getting a general view of the whole system and then developing a deeper
analysis by dividing this system in smaller subsystems and then studying the relevant one
separately and the others are considered as a black box without investigating further, (Capehart,
et al., 2008). This method is a necessity in small companies where it is important to indicate early
in an energy analysis measures that can be economically justified.
After understanding the production, the invoice and previous measurements were analysed
and calculation and measurements were planned to get further necessary data and information
about the particular case.
The subsequent research undertook the following steps:
Step 1: Analysing the Local Energy Market of Waste Energy
Step 2: End-User Distribution
To determine end-user energy distribution, historical energy consumption data was collected by
reviewing the available bills and the previous measurements made at the furnaces by Gävle
Energi during the 26th
week of 2011.
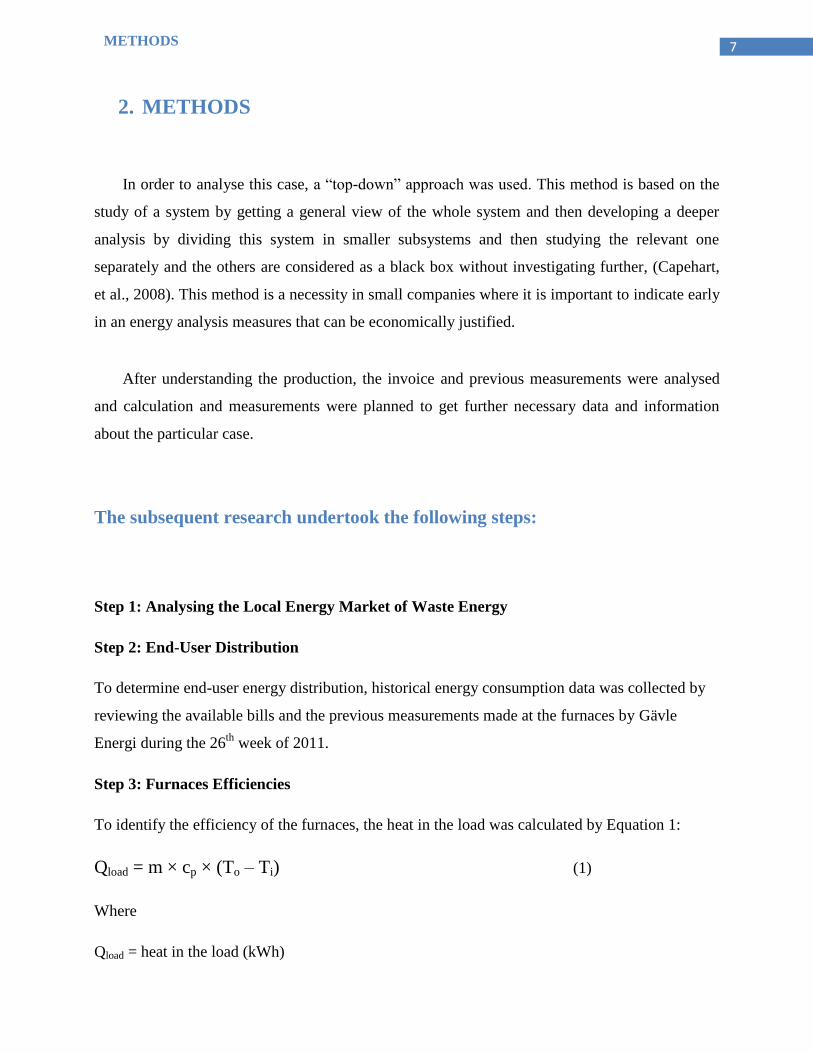
Step 3: Furnaces Efficiencies
To identify the efficiency of the furnaces, the heat in the load was calculated by Equation 1:
Qload = m × cp × (To – Ti) (1)
Where
Qload = heat in the load (kWh)
8 METHODS
m = mass of the load (kg)
cp = specific heat capacity (kJ/(kg,°C))
T0 = Temperature of the load after the heating (°C)
Ti = Temperature of the load before the heating (°C)
The efficiency of the furnaces was calculated by Equation 2:
ηth = Qload /Qin (2)
Where
ηth = Thermal efficiency of the furnace
Qload = heat in the load (kWh)
Qin = Energy/Heat input (kWh)
The Equation 1was also used to determine the heat taken by the coolant oil from the material in
the hardening furnace during cooling down.
Step 4: Combustion Enthalpy
To determine the combustion enthalpy of the exhaust gases from the hardening furnaces the
reaction enthalphy was estimated.
Germain Henri Hess, in 1840, discovered a very useful principle which is named after him:
“The enthalpy of a given chemical reaction is constant, regardless of the reaction
happening in one step or many steps.”
Heats of reactions can be calculated from tabulated standard molar enthalpy of formation,
ΔfH°. This intensive quantity is the standard reaction enthalpy for the formation of one mole of a
molecule from its constituent elements. (McQuarrie, et al., 1999); (Zhang, 1996).
According to Hess’slaw:
ΔH°rxn = ΣΔH°f, products - ΣΔH°f, reactants (3)
Where
ΔH°rxn = enthalpy of the reaction (kWh/m³)
9 METHODS
ΣΔH°f, products = sum of the standard molar enthalpies of formation of the products (kWh/m³)
ΣΔH°f, reactants= sum of the standard molar enthalpies of formation of the reactants (kWh/m³)
For the sake of simplicity, tables exist that present the calculated ΔH°rxn, from where the
combustion enthalpy was taken, (Gerthsen, 2006).
Step 5: Waste Heat Through Ventilation
To identify waste heat through the ventilation duct above the annealing and preheating
furnaces and at the compressed air outlet, structural data for ventilation were measured like
temperature, air velocity and air flow.
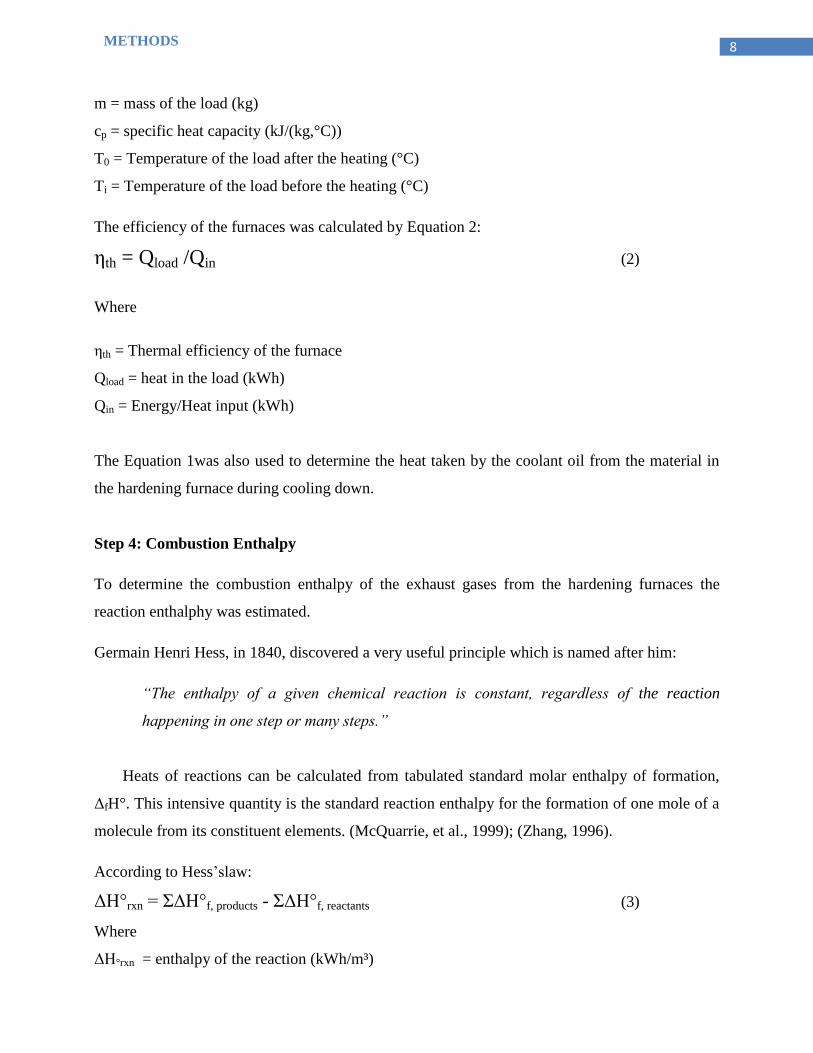
In both cases, for the temperature and the velocity, the anemometer KIMO AMI 300 (Figure
3) was used with different probes. For the ventilation duct a pitot tube was used of the type L in
order to measure the temperature inside the pipe and the air flow velocity (Figure 3). As
measuring the exhaust air flow of the compressor was not possible in the pipe, it has been
measured in front of the exhaust outlet with a vane probe (Figure 3).
Figure 3: Measuring Devise KIMO AMI 300, Pitot Tube Type L and Vane Probe (www.kimo.fr, 2012)
Pitot Tube
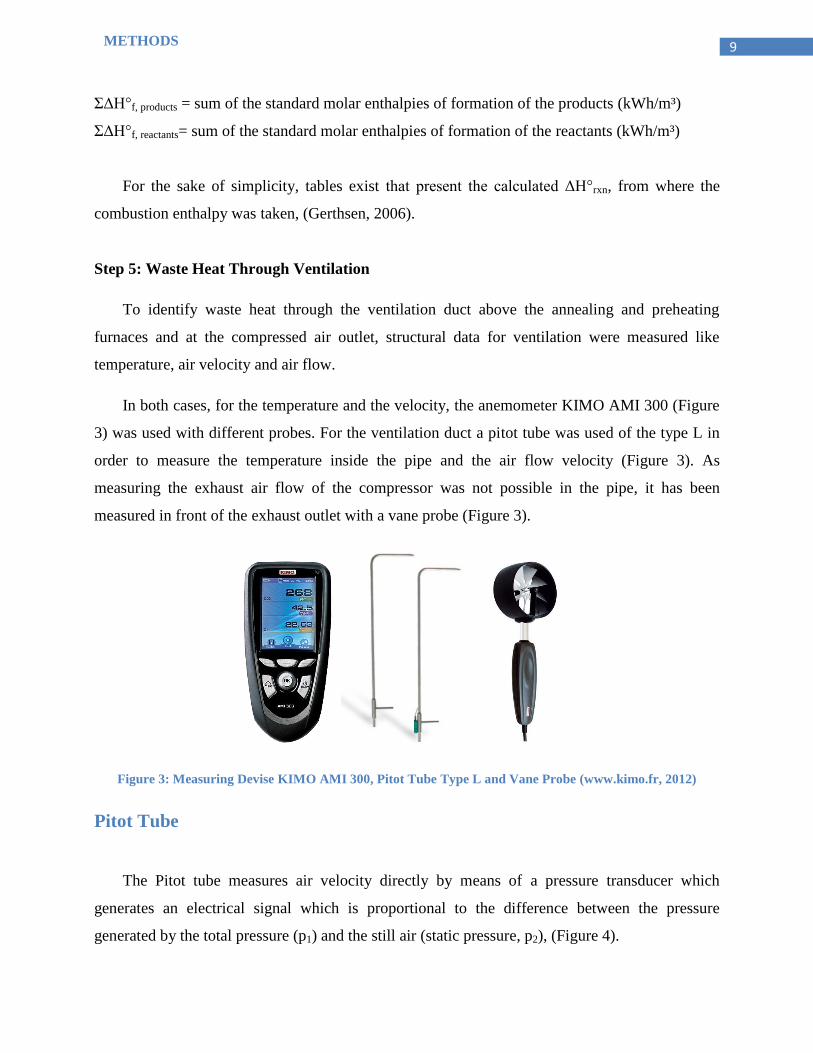
The Pitot tube measures air velocity directly by means of a pressure transducer which
generates an electrical signal which is proportional to the difference between the pressure
generated by the total pressure (p1) and the still air (static pressure, p2), (Figure 4).
10 METHODS
As the air mass flows through a closed pipe (air horn), friction is generated where the air
mass contacts the pipe wall. This frictional drag reduces the velocity of the air stream near the
pipe wall, (Klopfenstein, 1998).
In order to get the average velocity, the maximum velocity can be multiplied by the factor 0.83
for fully developed turbulent flow, (Wagner, 2008). The maximum velocity is in the centrum of
the pipe (Figure 4).
In order to get accurate measurements, the pitot tube has to be located in the middle of the
pipe and providing 8.5 or more diameters upstream and 1.5 or more diameters downstream, free
of elbows, dimension changes or obstructions, (ISO5167, 1991).
The measurements of the ventilation duct were made on three days for different time periods
during common working times. As a connection of the device and the computer was not possible
to transfer the data, the average temperature and air flow, calculated automatically by the device,
were taken.
The devices and probes were installed precise and carefully as explained above, but it has to
be taken into account that still different errors can occur. The pitot pipe can rotate around the own
axis, the horizontal part of the tube is not in the middle of the pipe or is not parallel to the air
flow. These errors lead to a deviation of the measurement results. The deviation was estimated
experimental. The test measurements made in advance in order to estimate the error show a
deviation of 10% of the results.
Figure 4: Pitot tube in a pipe
11 METHODS
Vane Probe
The probe is placed central in front of the outlet to measure the temperature, the air velocity
and the air flow. On three different days the measurements were taken, to be sure about the gotten
data. The average temperature and air flow, calculated automatically by the device, were taken
since a connection between the device and the computer was not possible. It has to be taken in
account that the probe cannot be hold accurately in the middle of the flow without moving, which
leads to deviation of the measurement results. As in the case of the pitot tube, the deviation of the
measurement results was determined experimental. Test measurements show a deviation of the
results up to 15%.
Step 6: Space Heating
To determine the necessary energy per year for the office heating, the heat losses through the
building envelop due to transmission was calculated by Equation 4:
Q = ∑(Uj*Aj)*DH (4)
Where
Q = Heat losses through transmission [W]
Uj = U-value coefficient of heat transmission [W/(m²,°C)]
Aj = Area [m²]
The total number of heating degree-hours for the whole heating season can be expressed as
Equation 5 shows.
(5)
Where
Ti and Tb are the constantly adopted indoor design air and base temperature [°C]
To = Hourly mean of external air temperatures measured at a meteorology station[°C]
N = The number of hours providing the condition of To ≤ Tb in the heating season [h]

12 METHODS
In order to understand the future mathematical results, the calculations head attached in the
APPENDIX should be consulted.
13
3. RESULTS
3.1 LOCAL MARKET OF WASTE HEAT
The company is located in Uhrfors, south of the village Åshammar, which has 727
inhabitants, in the Sandvikens kommun. Around Gästrike Härdverkstad is neither any industry
building nor any residential house. Consequently, there is no district heating in the surrounding.
Thus, it can be said that there is no local market of waste heat.
3.2 END-USER ENERGY DISTRIBUTION
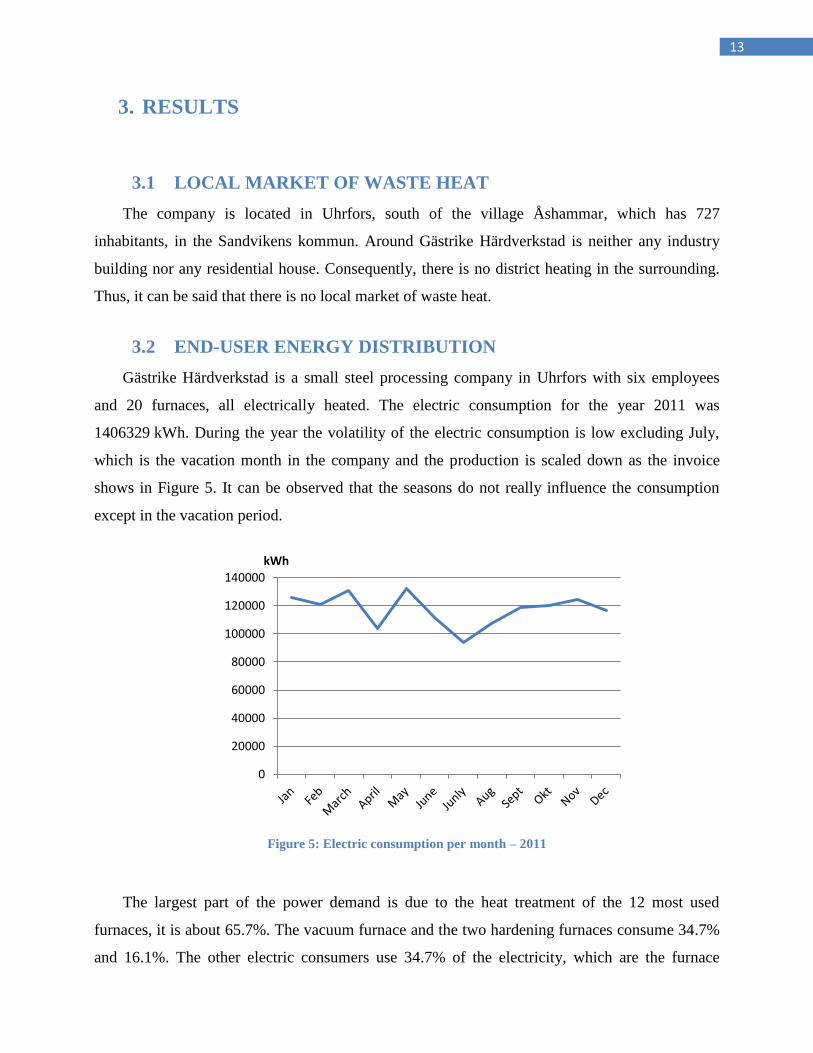
Gästrike Härdverkstad is a small steel processing company in Uhrfors with six employees
and 20 furnaces, all electrically heated. The electric consumption for the year 2011 was
1406329 kWh. During the year the volatility of the electric consumption is low excluding July,
which is the vacation month in the company and the production is scaled down as the invoice
shows in Figure 5. It can be observed that the seasons do not really influence the consumption
except in the vacation period.
Figure 5: Electric consumption per month – 2011
The largest part of the power demand is due to the heat treatment of the 12 most used
furnaces, it is about 65.7%. The vacuum furnace and the two hardening furnaces consume 34.7%
and 16.1%. The other electric consumers use 34.7% of the electricity, which are the furnace
0
20000
40000
60000
80000
100000
120000
140000
kWh
14 RESULTS
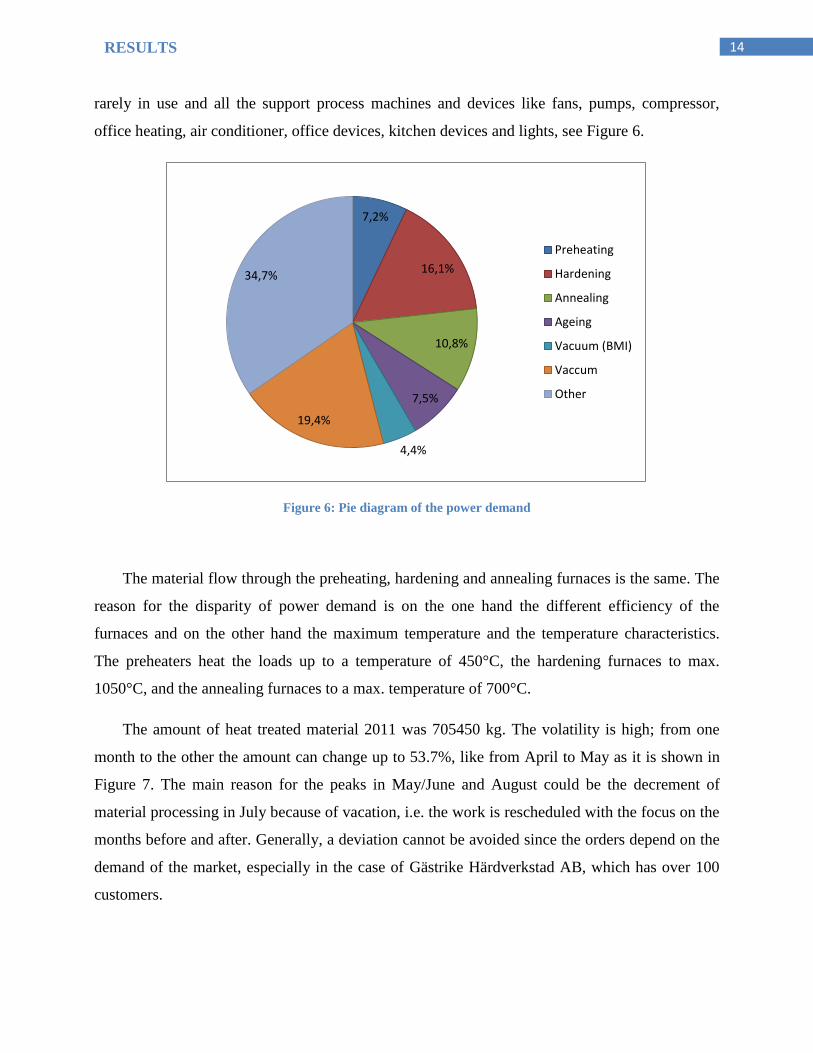
rarely in use and all the support process machines and devices like fans, pumps, compressor,
office heating, air conditioner, office devices, kitchen devices and lights, see Figure 6.
Figure 6: Pie diagram of the power demand
The material flow through the preheating, hardening and annealing furnaces is the same. The
reason for the disparity of power demand is on the one hand the different efficiency of the
furnaces and on the other hand the maximum temperature and the temperature characteristics.
The preheaters heat the loads up to a temperature of 450°C, the hardening furnaces to max.
1050°C, and the annealing furnaces to a max. temperature of 700°C.
The amount of heat treated material 2011 was 705450 kg. The volatility is high; from one
month to the other the amount can change up to 53.7%, like from April to May as it is shown in
Figure 7. The main reason for the peaks in May/June and August could be the decrement of
material processing in July because of vacation, i.e. the work is rescheduled with the focus on the
months before and after. Generally, a deviation cannot be avoided since the orders depend on the
demand of the market, especially in the case of Gästrike Härdverkstad AB, which has over 100
customers.
7,2%
16,1%
10,8%
7,5%
4,4%
19,4%
34,7%
Preheating
Hardening
Annealing
Ageing
Vacuum (BMI)
Vaccum
Other
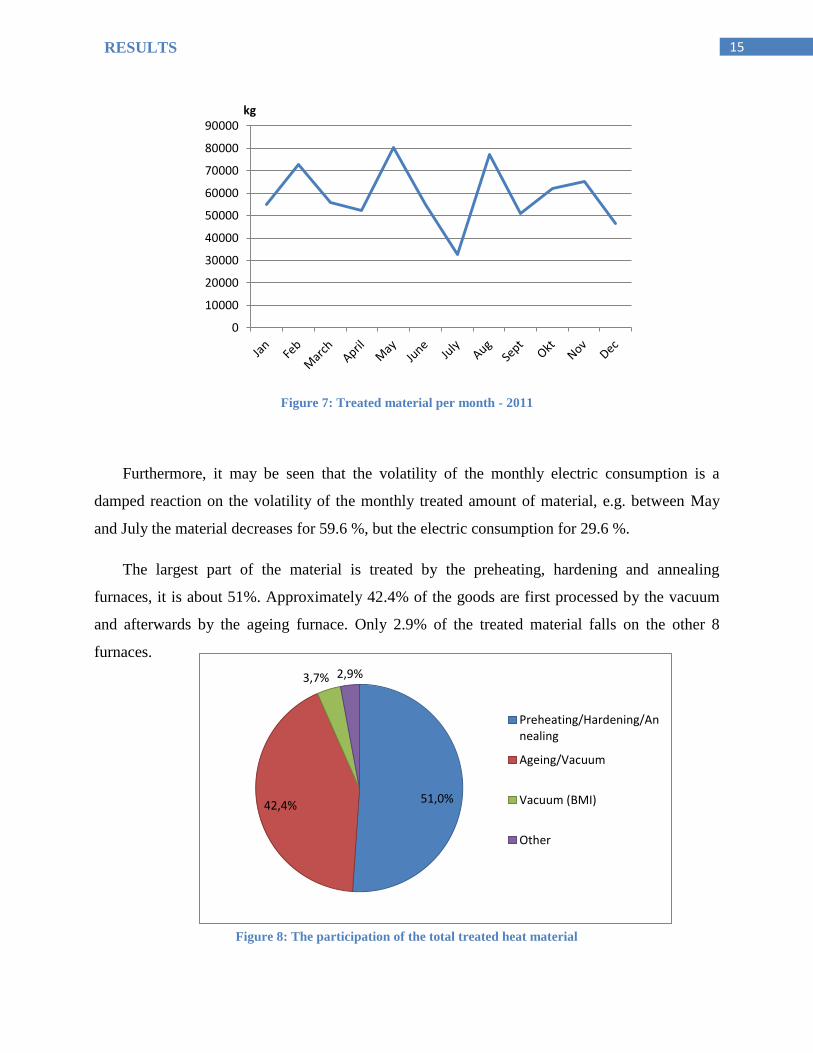
15 RESULTS
Figure 7: Treated material per month - 2011
Furthermore, it may be seen that the volatility of the monthly electric consumption is a
damped reaction on the volatility of the monthly treated amount of material, e.g. between May
and July the material decreases for 59.6 %, but the electric consumption for 29.6 %.
The largest part of the material is treated by the preheating, hardening and annealing
furnaces, it is about 51%. Approximately 42.4% of the goods are first processed by the vacuum
and afterwards by the ageing furnace. Only 2.9% of the treated material falls on the other 8
furnaces.
Figure 8: The participation of the total treated heat material
0
10000
20000
30000
40000
50000
60000
70000
80000
90000kg
51,0% 42,4%
3,7% 2,9%
Preheating/Hardening/Annealing
Ageing/Vacuum
Vacuum (BMI)
Other

16 RESULTS
3.3 ENERGY EFFICIENCY OF EACH FURNACE
As aforementioned, the company is in possession of 20 furnaces, but it has to be considered
that not all of them are regularly in use. The pit furnace is used with a maximum of 8 hours per
week and five annealing furnaces are used even less, according to the energy manager. One
hardening furnace is 8 hours and the nitrating furnace is maximum 48 hours in operation per
month. The just mentioned furnaces are not considered in the following analysis. The relevant
furnaces will be introduced in the following passages:
Two preheating furnaces
Two hardening furnaces
Five annealing furnaces
An ageing furnace
Two vacuum furnaces
The yearly working time for each furnace is 48 weeks per year; this value was determined in
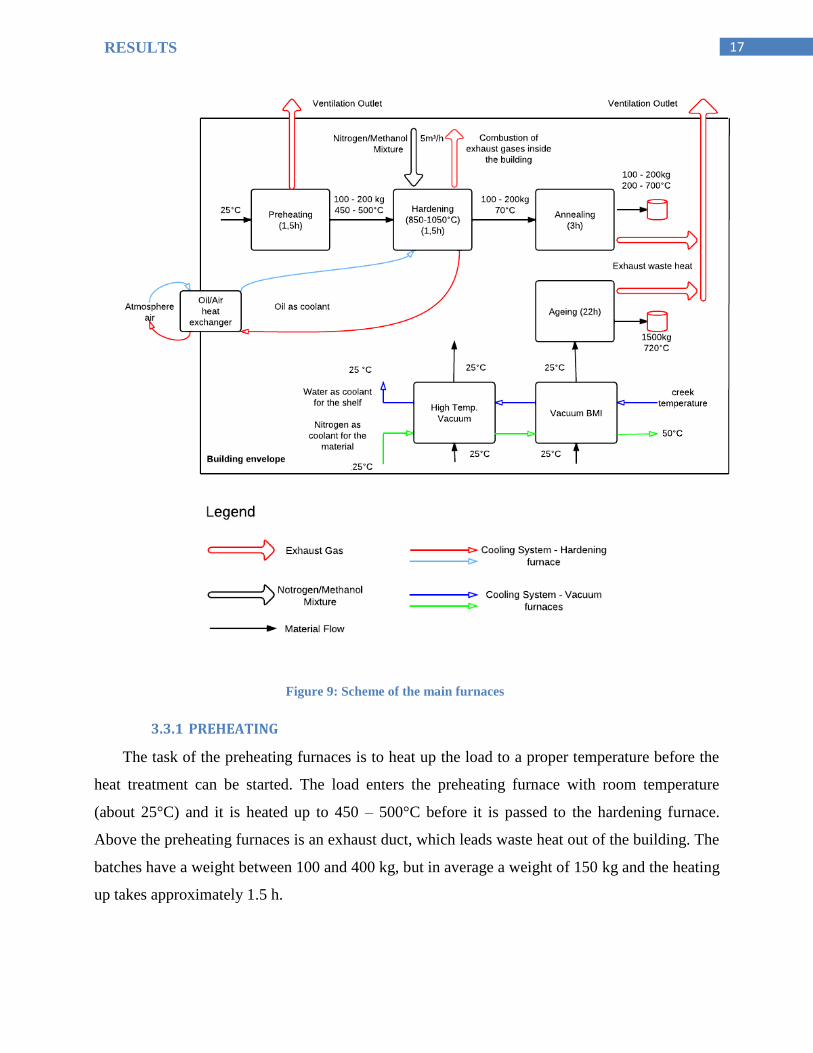
agreement with the owner Anders Hegnell, (APPENDIX I, Calculation I). Figure 9 shows the
correlation between the furnaces and gives an overview of the material flow, temperatures,
cooling system and the ventilation, which are going to be explained in the following paragraphs.
In case problems occur with reading the figures in this chapter regarding the measurements
of the power demand, because of the size, they can be checked in Appendix I in a major version.
17 RESULTS
Figure 9: Scheme of the main furnaces
3.3.1 PREHEATING
The task of the preheating furnaces is to heat up the load to a proper temperature before the
heat treatment can be started. The load enters the preheating furnace with room temperature
(about 25°C) and it is heated up to 450 – 500°C before it is passed to the hardening furnace.
Above the preheating furnaces is an exhaust duct, which leads waste heat out of the building. The
batches have a weight between 100 and 400 kg, but in average a weight of 150 kg and the heating
up takes approximately 1.5 h.
18 RESULTS
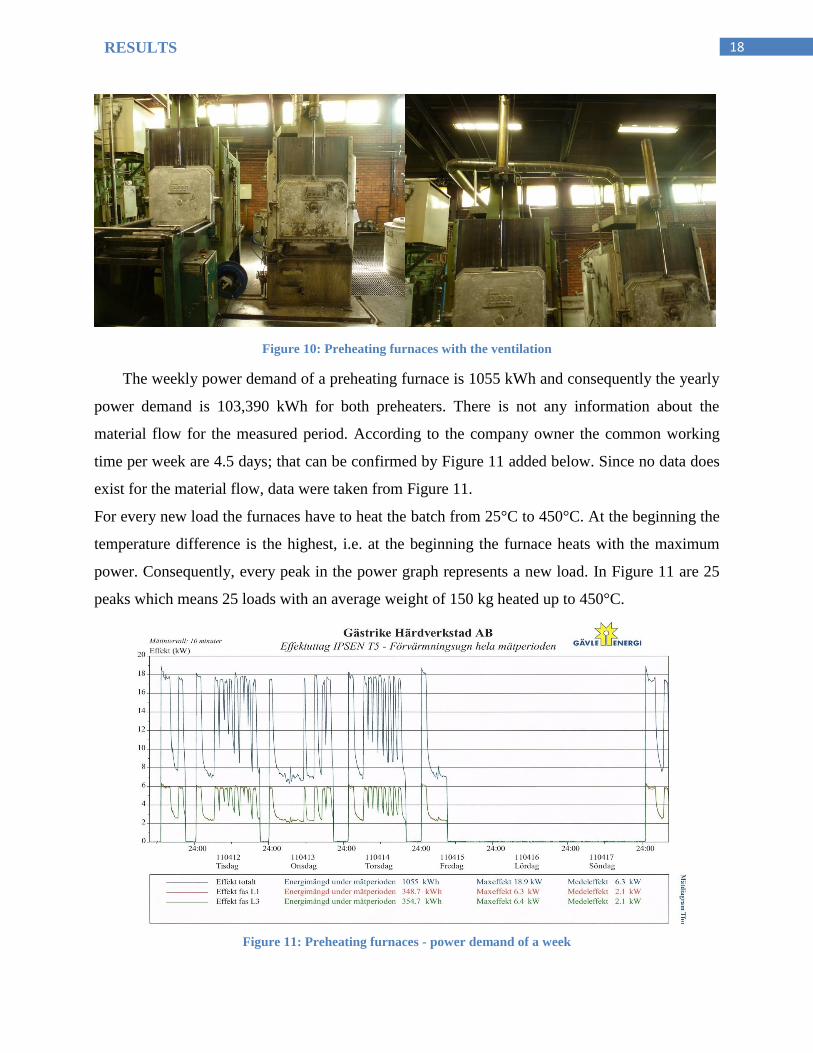
Figure 10: Preheating furnaces with the ventilation
The weekly power demand of a preheating furnace is 1055 kWh and consequently the yearly
power demand is 103,390 kWh for both preheaters. There is not any information about the
material flow for the measured period. According to the company owner the common working
time per week are 4.5 days; that can be confirmed by Figure 11 added below. Since no data does
exist for the material flow, data were taken from Figure 11.
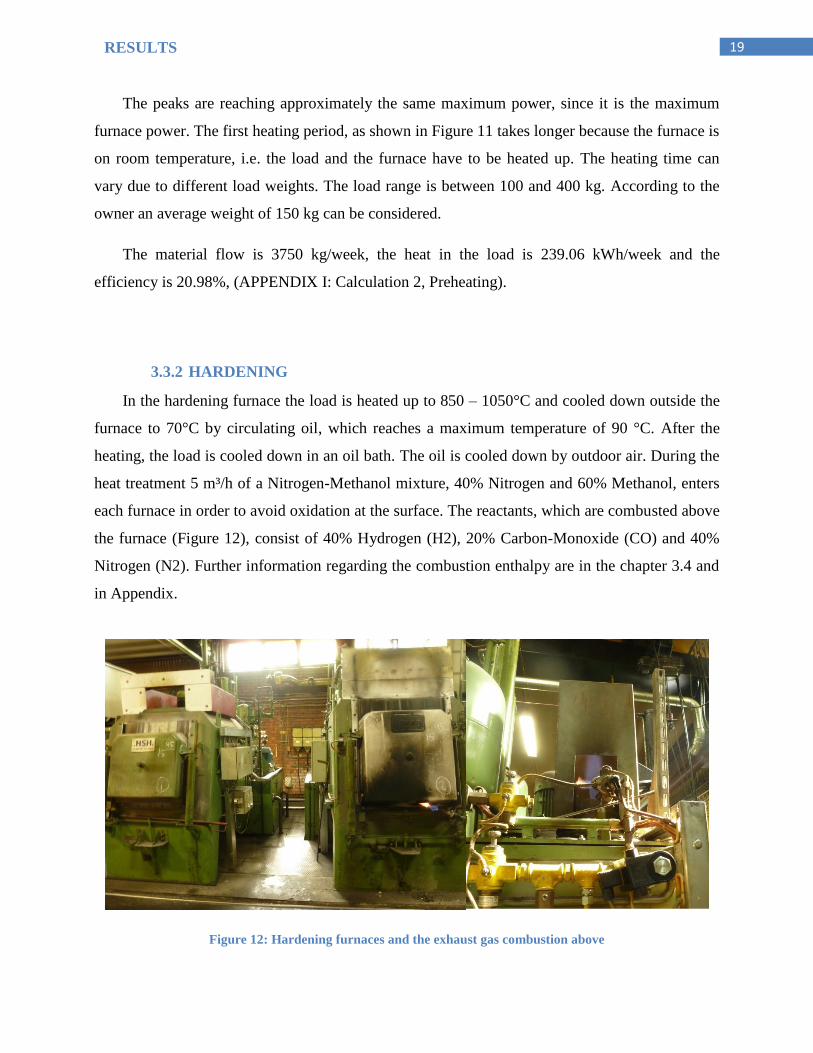
For every new load the furnaces have to heat the batch from 25°C to 450°C. At the beginning the
temperature difference is the highest, i.e. at the beginning the furnace heats with the maximum
power. Consequently, every peak in the power graph represents a new load. In Figure 11 are 25
peaks which means 25 loads with an average weight of 150 kg heated up to 450°C.
Figure 11: Preheating furnaces - power demand of a week
19 RESULTS
The peaks are reaching approximately the same maximum power, since it is the maximum
furnace power. The first heating period, as shown in Figure 11 takes longer because the furnace is
on room temperature, i.e. the load and the furnace have to be heated up. The heating time can
vary due to different load weights. The load range is between 100 and 400 kg. According to the
owner an average weight of 150 kg can be considered.
The material flow is 3750 kg/week, the heat in the load is 239.06 kWh/week and the
efficiency is 20.98%, (APPENDIX I: Calculation 2, Preheating).
3.3.2 HARDENING
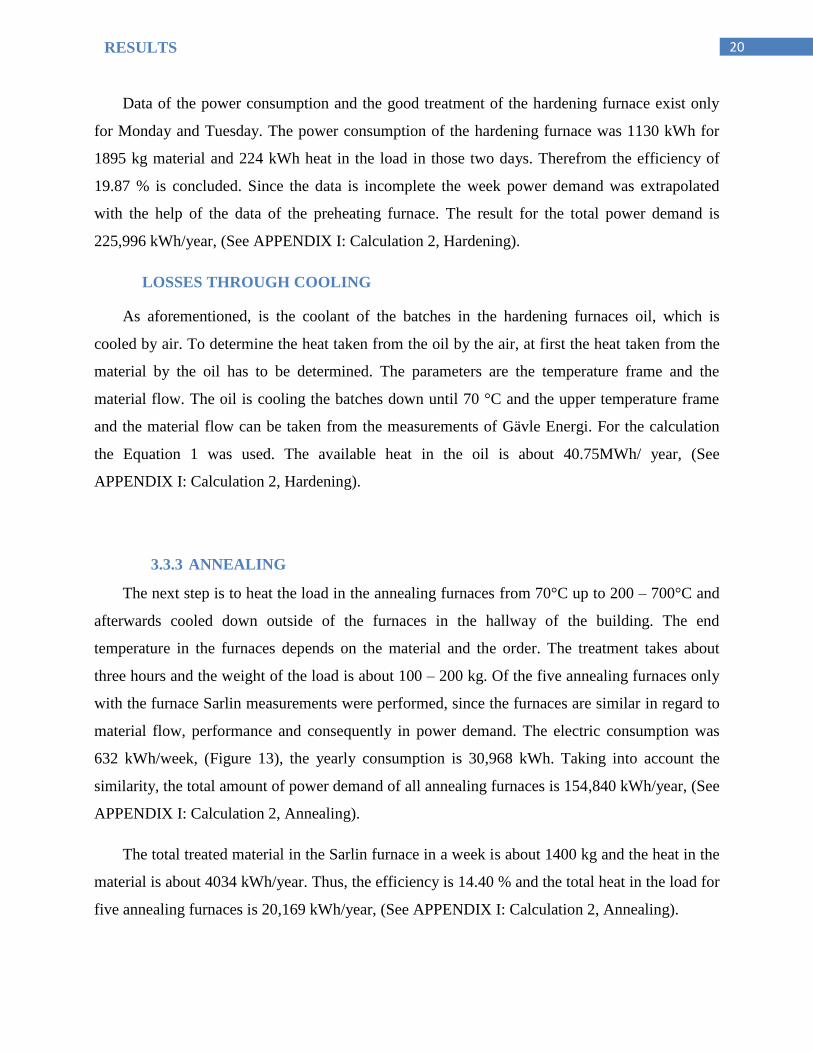
In the hardening furnace the load is heated up to 850 – 1050°C and cooled down outside the
furnace to 70°C by circulating oil, which reaches a maximum temperature of 90 °C. After the
heating, the load is cooled down in an oil bath. The oil is cooled down by outdoor air. During the
heat treatment 5 m³/h of a Nitrogen-Methanol mixture, 40% Nitrogen and 60% Methanol, enters
each furnace in order to avoid oxidation at the surface. The reactants, which are combusted above
the furnace (Figure 12), consist of 40% Hydrogen (H2), 20% Carbon-Monoxide (CO) and 40%
Nitrogen (N2). Further information regarding the combustion enthalpy are in the chapter 3.4 and
in Appendix.
Figure 12: Hardening furnaces and the exhaust gas combustion above
20 RESULTS
Data of the power consumption and the good treatment of the hardening furnace exist only
for Monday and Tuesday. The power consumption of the hardening furnace was 1130 kWh for
1895 kg material and 224 kWh heat in the load in those two days. Therefrom the efficiency of
19.87 % is concluded. Since the data is incomplete the week power demand was extrapolated
with the help of the data of the preheating furnace. The result for the total power demand is
225,996 kWh/year, (See APPENDIX I: Calculation 2, Hardening).
LOSSES THROUGH COOLING
As aforementioned, is the coolant of the batches in the hardening furnaces oil, which is
cooled by air. To determine the heat taken from the oil by the air, at first the heat taken from the
material by the oil has to be determined. The parameters are the temperature frame and the
material flow. The oil is cooling the batches down until 70 °C and the upper temperature frame
and the material flow can be taken from the measurements of Gävle Energi. For the calculation
the Equation 1 was used. The available heat in the oil is about 40.75MWh/ year, (See
APPENDIX I: Calculation 2, Hardening).
3.3.3 ANNEALING
The next step is to heat the load in the annealing furnaces from 70°C up to 200 – 700°C and
afterwards cooled down outside of the furnaces in the hallway of the building. The end
temperature in the furnaces depends on the material and the order. The treatment takes about
three hours and the weight of the load is about 100 – 200 kg. Of the five annealing furnaces only
with the furnace Sarlin measurements were performed, since the furnaces are similar in regard to
material flow, performance and consequently in power demand. The electric consumption was
632 kWh/week, (Figure 13), the yearly consumption is 30,968 kWh. Taking into account the
similarity, the total amount of power demand of all annealing furnaces is 154,840 kWh/year, (See
APPENDIX I: Calculation 2, Annealing).
The total treated material in the Sarlin furnace in a week is about 1400 kg and the heat in the
material is about 4034 kWh/year. Thus, the efficiency is 14.40 % and the total heat in the load for
five annealing furnaces is 20,169 kWh/year, (See APPENDIX I: Calculation 2, Annealing).
21 RESULTS
Figure 13: Five annealing furnaces
Since the loads are leaving the furnace with high temperatures and they are cooling down
inside the building, it is worth knowing how much energy is released free inside the building
envelope. The released heat inside the building is the same as the heat in the load, since the
annealing furnace is heating up from room temperature to a certain temperature and the load are
cooling down from this certain temperature to room temperature.
3.3.4 AGEING
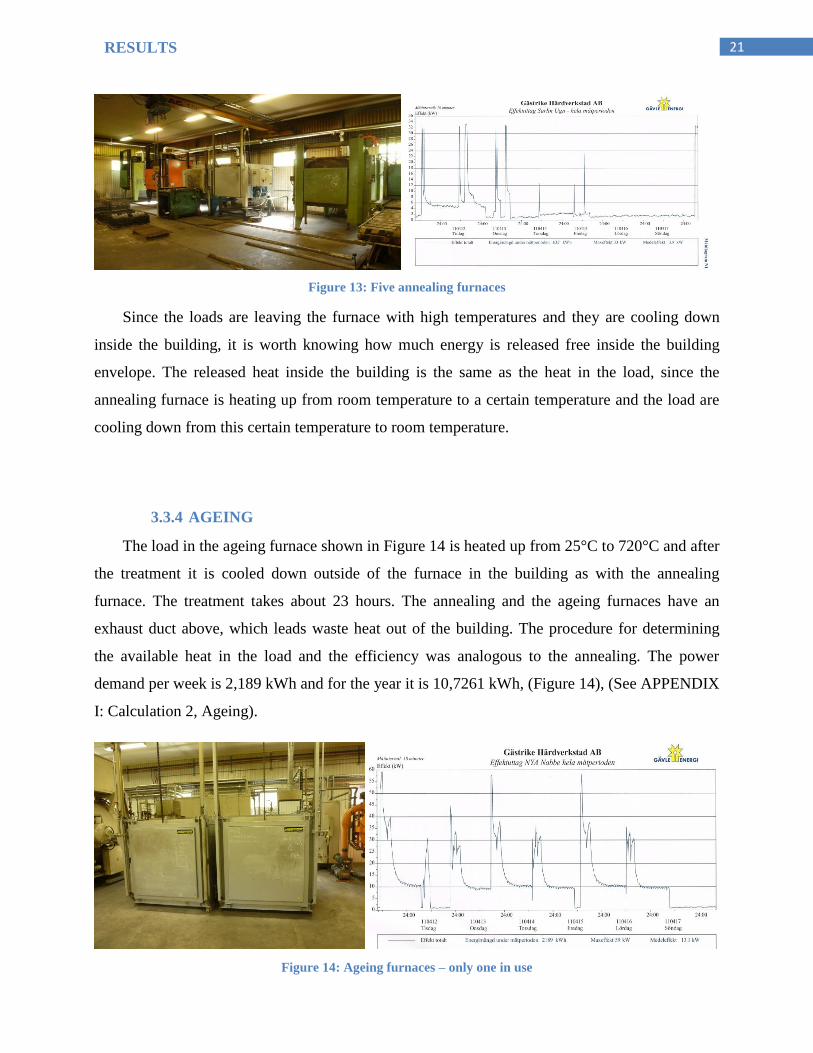
The load in the ageing furnace shown in Figure 14 is heated up from 25°C to 720°C and after
the treatment it is cooled down outside of the furnace in the building as with the annealing
furnace. The treatment takes about 23 hours. The annealing and the ageing furnaces have an
exhaust duct above, which leads waste heat out of the building. The procedure for determining
the available heat in the load and the efficiency was analogous to the annealing. The power
demand per week is 2,189 kWh and for the year it is 10,7261 kWh, (Figure 14), (See APPENDIX
I: Calculation 2, Ageing).
Figure 14: Ageing furnaces – only one in use
22 RESULTS
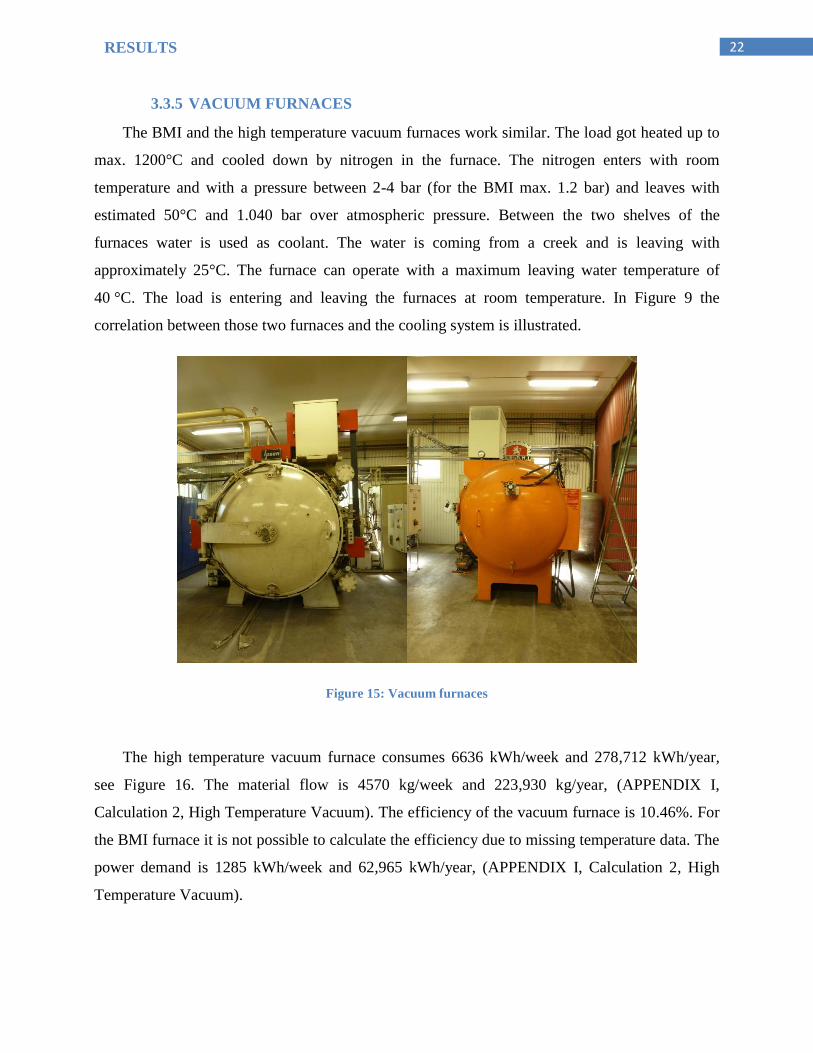
3.3.5 VACUUM FURNACES
The BMI and the high temperature vacuum furnaces work similar. The load got heated up to
max. 1200°C and cooled down by nitrogen in the furnace. The nitrogen enters with room
temperature and with a pressure between 2-4 bar (for the BMI max. 1.2 bar) and leaves with
estimated 50°C and 1.040 bar over atmospheric pressure. Between the two shelves of the
furnaces water is used as coolant. The water is coming from a creek and is leaving with
approximately 25°C. The furnace can operate with a maximum leaving water temperature of
40 °C. The load is entering and leaving the furnaces at room temperature. In Figure 9 the
correlation between those two furnaces and the cooling system is illustrated.
Figure 15: Vacuum furnaces
The high temperature vacuum furnace consumes 6636 kWh/week and 278,712 kWh/year,
see Figure 16. The material flow is 4570 kg/week and 223,930 kg/year, (APPENDIX I,
Calculation 2, High Temperature Vacuum). The efficiency of the vacuum furnace is 10.46%. For
the BMI furnace it is not possible to calculate the efficiency due to missing temperature data. The
power demand is 1285 kWh/week and 62,965 kWh/year, (APPENDIX I, Calculation 2, High
Temperature Vacuum).
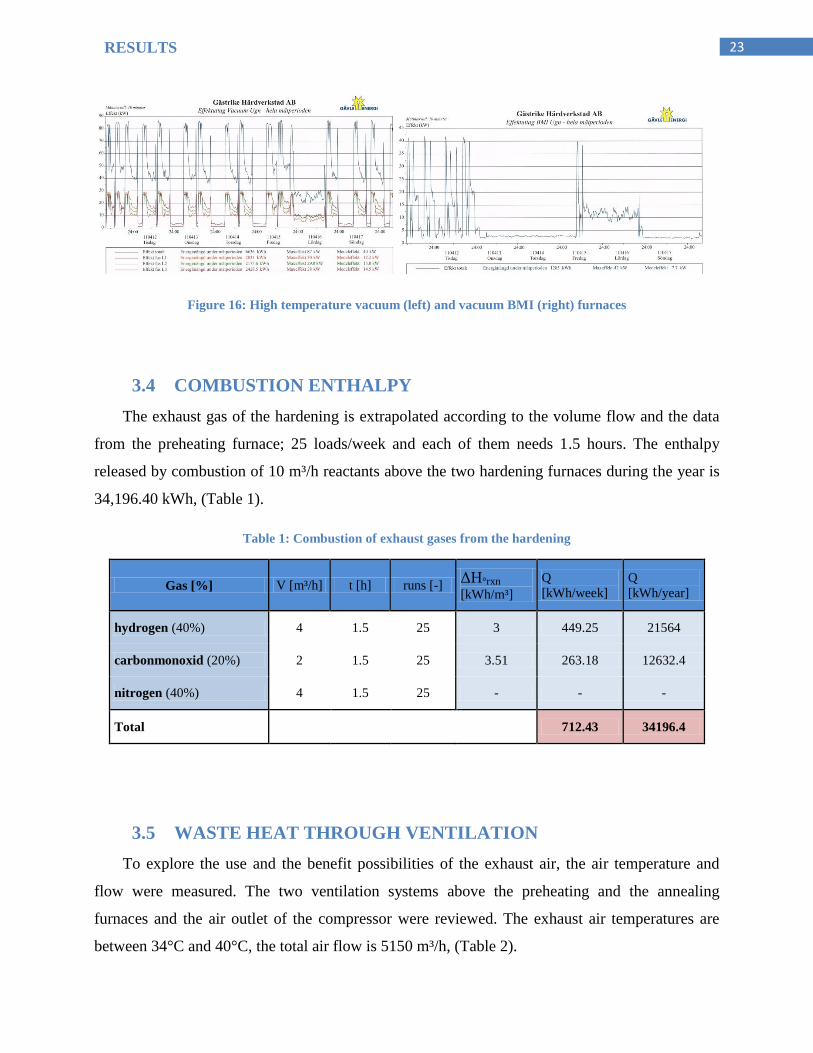
23 RESULTS
Figure 16: High temperature vacuum (left) and vacuum BMI (right) furnaces
3.4 COMBUSTION ENTHALPY
The exhaust gas of the hardening is extrapolated according to the volume flow and the data
from the preheating furnace; 25 loads/week and each of them needs 1.5 hours. The enthalpy
released by combustion of 10 m³/h reactants above the two hardening furnaces during the year is
34,196.40 kWh, (Table 1).
Table 1: Combustion of exhaust gases from the hardening
Gas [%] V [m³/h] t [h] runs [-] ΔH°rxn [kWh/m³]
Q
[kWh/week]
Q
[kWh/year]
hydrogen (40%) 4 1.5 25 3 449.25 21564
carbonmonoxid (20%) 2 1.5 25 3.51 263.18 12632.4
nitrogen (40%) 4 1.5 25 - - -
Total
712.43 34196.4
3.5 WASTE HEAT THROUGH VENTILATION
To explore the use and the benefit possibilities of the exhaust air, the air temperature and
flow were measured. The two ventilation systems above the preheating and the annealing
furnaces and the air outlet of the compressor were reviewed. The exhaust air temperatures are
between 34°C and 40°C, the total air flow is 5150 m³/h, (Table 2).
24 RESULTS
Table 2: Exhaust air flows from ventilation and compressor
Temperature [°C] Air flow [m³/h]
Compressor 34 650
Preheating vent. 35 3000
Annealing vent. 40 1500
The temperatures are high enough to be used in other industries or residential houses, but
since there are not any buildings in the surrounding, as explained in the chapter 3.1 Local market
of waste heat, this possibility is not available. Due to low temperatures and lacking possibilities
to recover that waste heat, the investigations of the ventilation systems were interrupted at this
step.
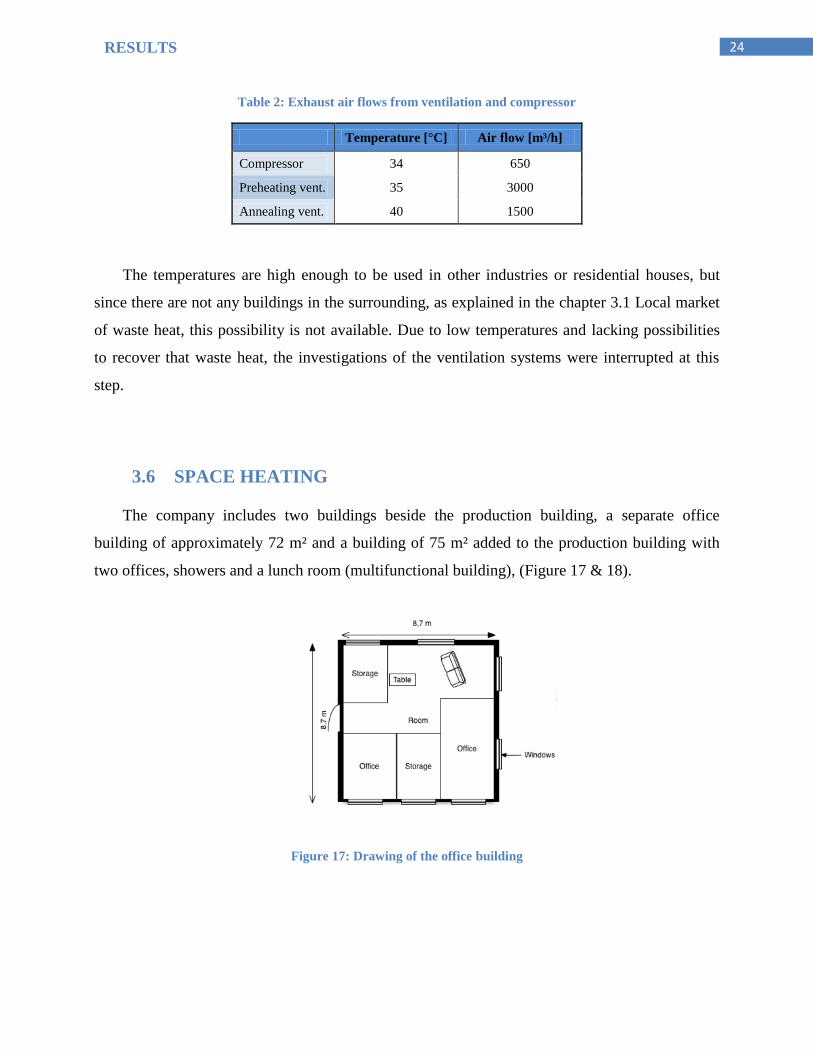
3.6 SPACE HEATING
The company includes two buildings beside the production building, a separate office
building of approximately 72 m² and a building of 75 m² added to the production building with
two offices, showers and a lunch room (multifunctional building), (Figure 17 & 18).
Figure 17: Drawing of the office building

25 RESULTS
Figure 18: Drawing of the multifunctional building
In order to determine the power demand of the space heating, the heat losses through
transmission were calculated in two steps. First, the power and therefrom, including the degree-
hours, the heat losses. Since the buildings do not have an installed ventilation system, the largest
part of the losses is through transmission. Due to low influence on the total heating system, other
losses were neglected. In order to determine the transmission losses, the Equation 4 was applied.
The chosen indoor temperature is 24°C and the outdoor mean temperature is 5°C. Further value
necessary for the estimation is the sum of hours per year when heated until a certain temperature
(24°C), expressed in degree-hours, in this case 145,600°Ch for Sandviken, which is close to
Uhrfors, (VVS, 2004). For the estimation were the maximal U-values used, requested by the
building laws at the construction period byggnorm SBN 67 BABS 1967 and SBN 75. Since the
buildings were constructed in different time periods (1965 and 1975), different U-values were
requested.
In order to heat in the coldest day of the year, the heating system must be able to cover the
losses for 24 h with a -21°C outdoor temperature, (VVS, 2004). The losses in the separated office
building are 9626.05 kWh/year and the losses in the multifunctional building are 17,464.31
kWh/year, (Table 3 & 4).
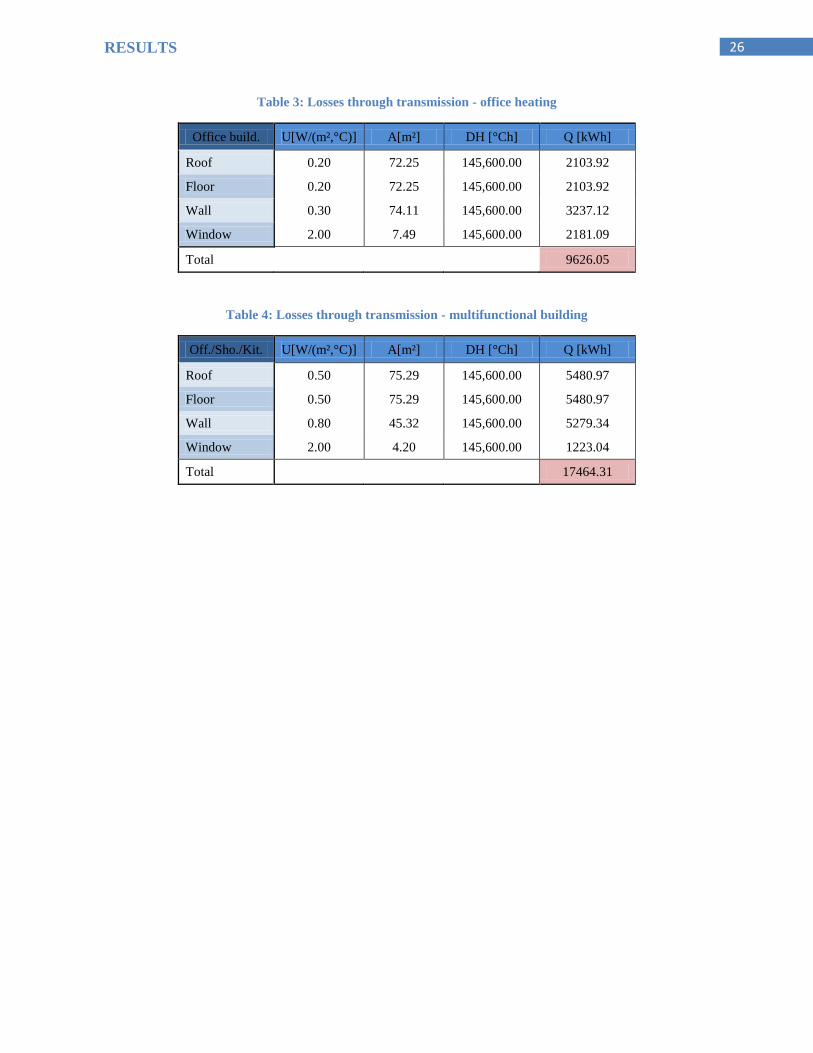
26 RESULTS
Table 3: Losses through transmission - office heating
Office build. U[W/(m²,°C)] A[m²] DH [°Ch] Q [kWh]
Roof 0.20 72.25 145,600.00 2103.92
Floor 0.20 72.25 145,600.00 2103.92
Wall 0.30 74.11 145,600.00 3237.12
Window 2.00 7.49 145,600.00 2181.09
Total 9626.05
Table 4: Losses through transmission - multifunctional building
Off./Sho./Kit. U[W/(m²,°C)] A[m²] DH [°Ch] Q [kWh]
Roof 0.50 75.29 145,600.00 5480.97
Floor 0.50 75.29 145,600.00 5480.97
Wall 0.80 45.32 145,600.00 5279.34
Window 2.00 4.20 145,600.00 1223.04
Total 17464.31
27
4. DISCUSSION AND CONCLUSION
Once all the calculations are done and the results are analysed, the energy audit can be
performed.
First of all, it should be mentioned that in order to accomplish all the calculations, it was not
always possible to work with exact data. An average estimation of the total energy had to be
accomplished because the given input data was based on five days energy consumption. Since I
assume these values as representatives of the whole year evolution, an extrapolation of these
days’ values to year estimation had to be carried on. However, it should be mentioned that the
energy distribution can fluctuate considerably from one week to another, as for example it is not
known if the working flow (this term means the amount of work fulfilled in the steel treatment
system) during those days is considered normal, or they had a smaller production because of an
increase in the amount of steel stocked or because the demand of treated steel decreased.
Secondary, the available data of which the extrapolations were made from are incomplete.
The information was incomplete for almost each furnace, either the material flow was missing or
the measurements were only partly available. By understanding the overall treatment processes
and the material flow, inferential conclusion could be made to reconstruct the information gaps.
The following part of the discussion and conclusion is subdivided according to the time
where the measures can be realized in:
Short term
Middle term
Long term
4.1 SHORT TERM – REPLACING THE HEATING
First, some discussion will be made about the volatility of the material flow and power
demand before going on with replacing the space heating. As mentioned before, the changes of
the power demand are a damped reaction of the material flow changes, e.g. the material flow
decreases for 59.6%, but the energy consumption for 29.6%. Even if the production is almost shut
28 DISCUSSION AND CONCLUSION
down, the energy costs are still high. One reason might be the high fix power consumption. The
responsible persons should take into consideration either to determine the reasons for the fix
power consumption and try to decrease it or avoid the volatility of the material flow during July.
In regard to the heating system no data exist; the calculations were made under several
assumptions; the coefficient of heat transmission (U-value) of the different building parts is the
maximum allowed by law in the building time, the average year temperature and the degree hours
are the same as in Gävle. In reality, the U-value can vary. However, compared to Uhrfors, the
climate is very similar in Gävle. Thus, the estimation has to be accomplished before making a
final decision about the realization of the following measure.
The power demand of the space heating is in total 27,090 kWh per year, considering the
regular electricity price of 0.956 SEK/kWh, which Gästrike Härdverkstad is paying, the total
costs are 25,898.4 SEK/year.
The heating system can be converted from electrical radiators to water radiators; the
necessary heat can be replaced completely with the oil from the hardening furnace and the
combusted exhaust gases. The hardening furnaces are working consecutive during the week and
have a working time from 4 am to 8 pm, which is enough time to heat the rooms before the office
working time starts at around 8 am. The available heat from the hardening coolant oil is about
18816 kWh for 6 months since the heating period is considered from September to March, the
combustion enthalpy is about 16950 kWh for 6 months.
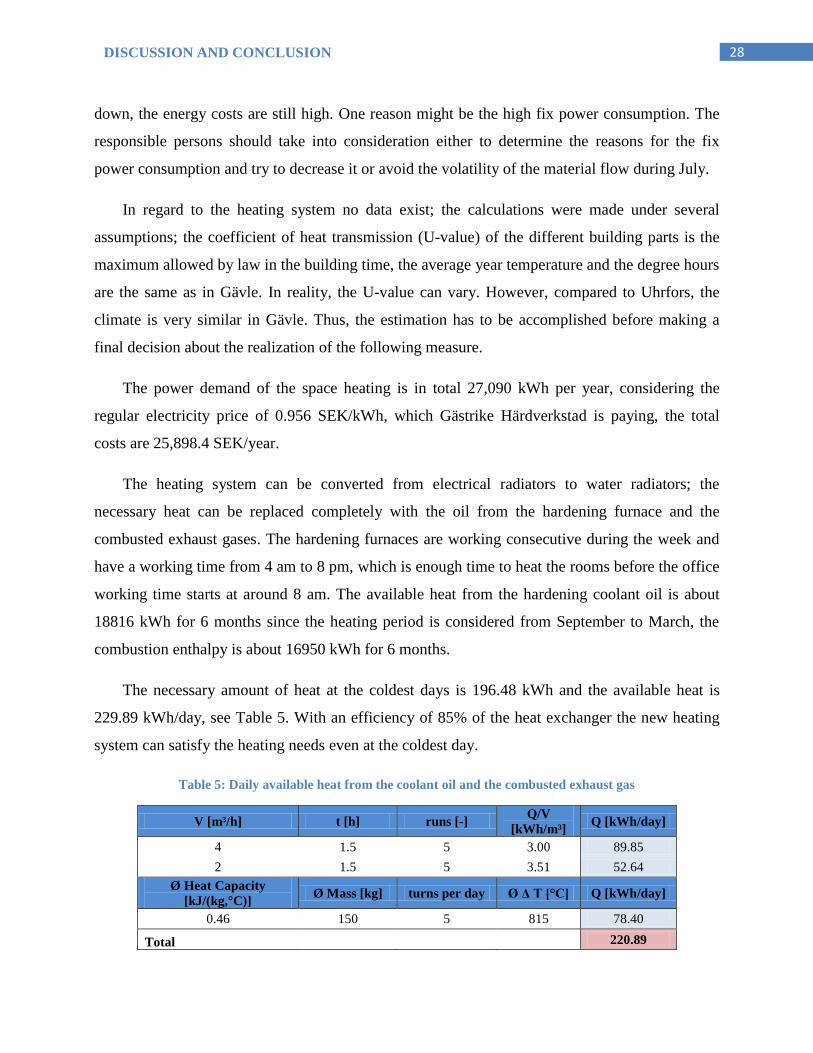
The necessary amount of heat at the coldest days is 196.48 kWh and the available heat is
229.89 kWh/day, see Table 5. With an efficiency of 85% of the heat exchanger the new heating
system can satisfy the heating needs even at the coldest day.
Table 5: Daily available heat from the coolant oil and the combusted exhaust gas
V [m³/h] t [h] runs [-] Q/V
[kWh/m³] Q [kWh/day]
4 1.5 5 3.00 89.85
2 1.5 5 3.51 52.64
Ø Heat Capacity
[kJ/(kg,°C)] Ø Mass [kg] turns per day Ø Δ T [°C] Q [kWh/day]
0.46 150 5 815 78.40
Total 220.89
29 DISCUSSION AND CONCLUSION
According to a local plumber, the costs are about 108000 SEK, not considering taxes,
including an electrical backup heater, just in case. With 25% taxes the total costs are
108000 SEK *1.25 = 135000 SEK
Considering savings of 25898.4 SEK/year per year, the payback time of the installation of
the heating systems is
135000 / 25898.4 = 5.21 years.
4.2 MIDDLE TERM – INCREASING THE FURNACE EFFICIENCY
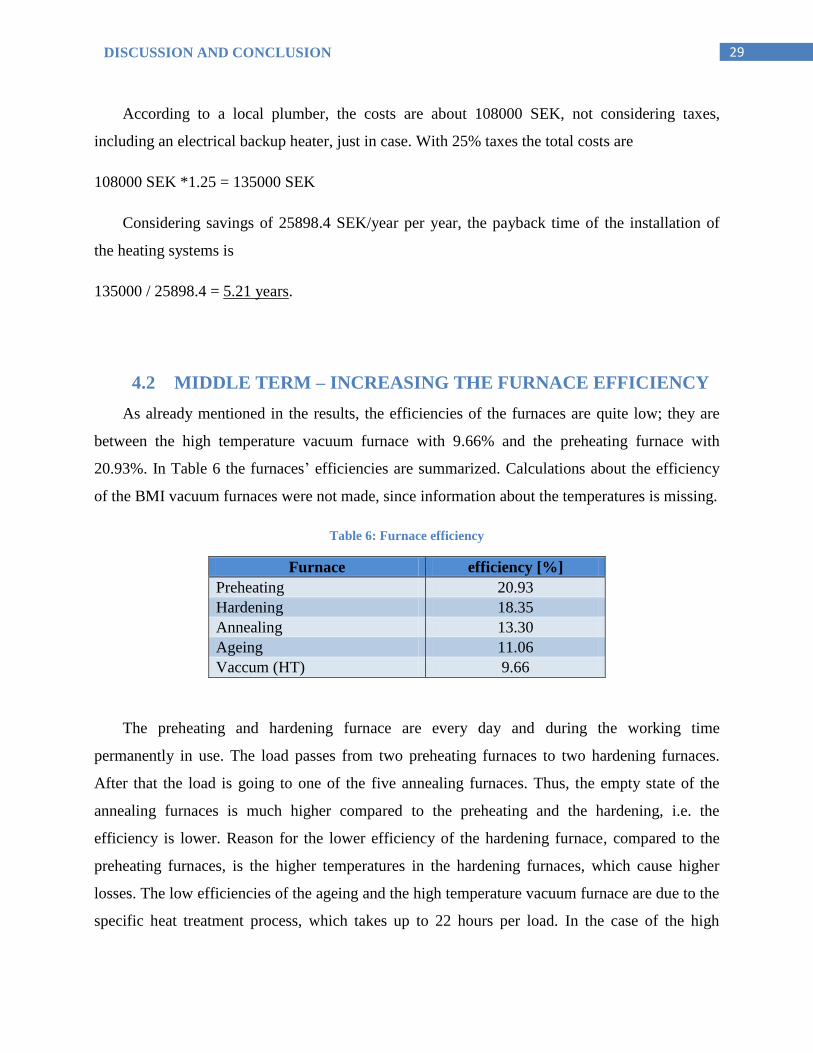
As already mentioned in the results, the efficiencies of the furnaces are quite low; they are
between the high temperature vacuum furnace with 9.66% and the preheating furnace with
20.93%. In Table 6 the furnaces’ efficiencies are summarized. Calculations about the efficiency
of the BMI vacuum furnaces were not made, since information about the temperatures is missing.
Table 6: Furnace efficiency
Furnace efficiency [%]
Preheating 20.93
Hardening 18.35
Annealing 13.30
Ageing 11.06
Vaccum (HT) 9.66
The preheating and hardening furnace are every day and during the working time
permanently in use. The load passes from two preheating furnaces to two hardening furnaces.
After that the load is going to one of the five annealing furnaces. Thus, the empty state of the
annealing furnaces is much higher compared to the preheating and the hardening, i.e. the
efficiency is lower. Reason for the lower efficiency of the hardening furnace, compared to the
preheating furnaces, is the higher temperatures in the hardening furnaces, which cause higher
losses. The low efficiencies of the ageing and the high temperature vacuum furnace are due to the
specific heat treatment process, which takes up to 22 hours per load. In the case of the high
30 DISCUSSION AND CONCLUSION
temperature vacuum furnace a part of the losses are also due to cooling: the material is cooled
with nitrogen and the furnace with creek water.
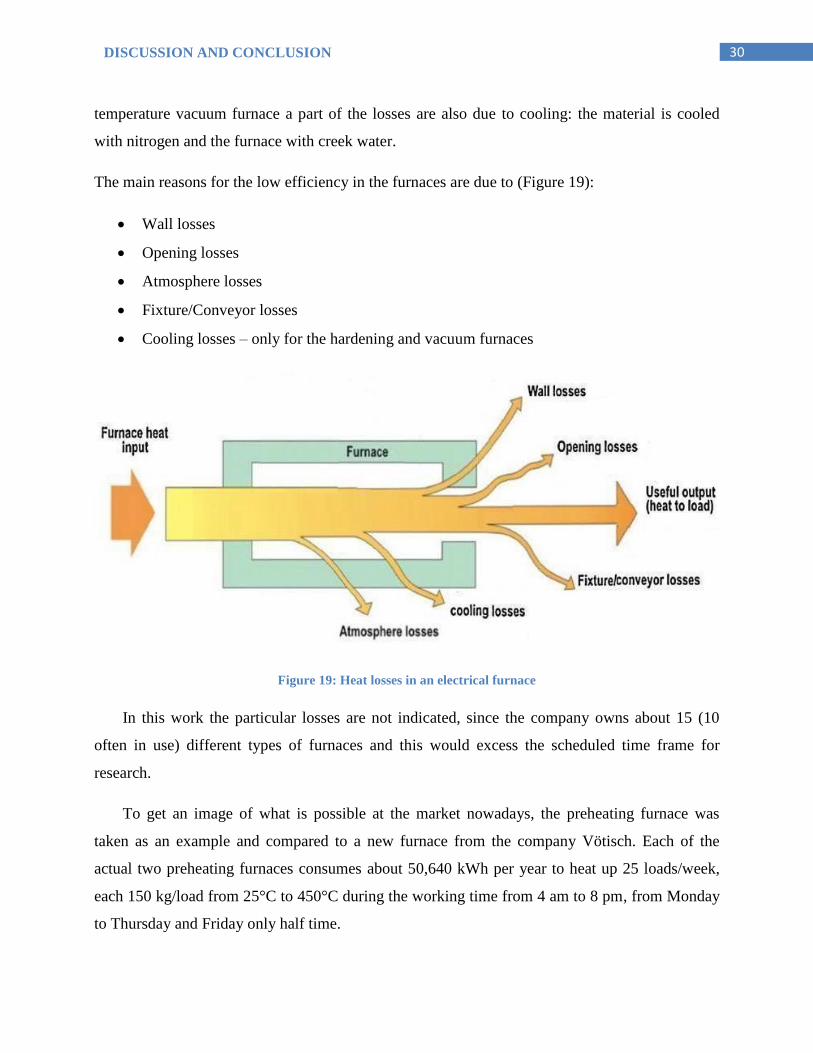
The main reasons for the low efficiency in the furnaces are due to (Figure 19):
Wall losses
Opening losses
Atmosphere losses
Fixture/Conveyor losses
Cooling losses – only for the hardening and vacuum furnaces
Figure 19: Heat losses in an electrical furnace
In this work the particular losses are not indicated, since the company owns about 15 (10
often in use) different types of furnaces and this would excess the scheduled time frame for
research.
To get an image of what is possible at the market nowadays, the preheating furnace was
taken as an example and compared to a new furnace from the company Vötisch. Each of the
actual two preheating furnaces consumes about 50,640 kWh per year to heat up 25 loads/week,
each 150 kg/load from 25°C to 450°C during the working time from 4 am to 8 pm, from Monday
to Thursday and Friday only half time.
31 DISCUSSION AND CONCLUSION
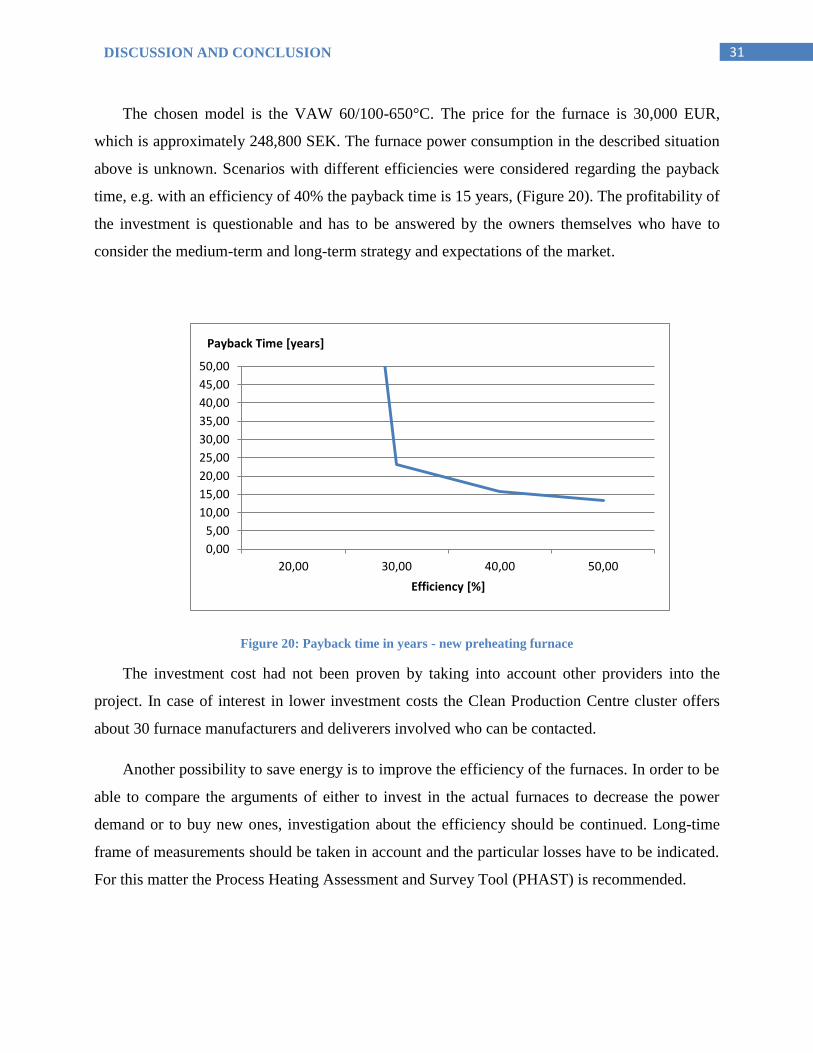
The chosen model is the VAW 60/100-650°C. The price for the furnace is 30,000 EUR,
which is approximately 248,800 SEK. The furnace power consumption in the described situation
above is unknown. Scenarios with different efficiencies were considered regarding the payback
time, e.g. with an efficiency of 40% the payback time is 15 years, (Figure 20). The profitability of
the investment is questionable and has to be answered by the owners themselves who have to
consider the medium-term and long-term strategy and expectations of the market.
Figure 20: Payback time in years - new preheating furnace
The investment cost had not been proven by taking into account other providers into the
project. In case of interest in lower investment costs the Clean Production Centre cluster offers
about 30 furnace manufacturers and deliverers involved who can be contacted.
Another possibility to save energy is to improve the efficiency of the furnaces. In order to be
able to compare the arguments of either to invest in the actual furnaces to decrease the power
demand or to buy new ones, investigation about the efficiency should be continued. Long-time
frame of measurements should be taken in account and the particular losses have to be indicated.
For this matter the Process Heating Assessment and Survey Tool (PHAST) is recommended.
0,00
5,00
10,00
15,00
20,00
25,00
30,00
35,00
40,00
45,00
50,00
20,00 30,00 40,00 50,00
Efficiency [%]
Payback Time [years]
32 DISCUSSION AND CONCLUSION
PHAST is developed by the U.S. Department of Energy. Industries can survey heating
equipment that consumes steam, electricity, or natural gas by this tool and identify energy losses
and energy efficiency potential.
By inputting the necessary parameters the PHAST computer model analyses energy
efficiency of furnaces considering all the necessary factors including:
1. Heat absorbed by coolant,
2. Heat transmission through wall, hearth and roof,
3. Heat radiation through opening areas (charge end and discharge end),
4. Heat losses by flue gas (in this case not necessary), and
5. Atmosphere losses by air leaking into furnace, (Si, et al., 2011).
4.3 LONG TERM – HEAT RECOVERY BY THE MATERIAL
The long term energy measures can be seen more as ideas for future research; interesting key
data are summarized with an approach to the realization. Further studies and a research of
appropriate technologies have to be made.
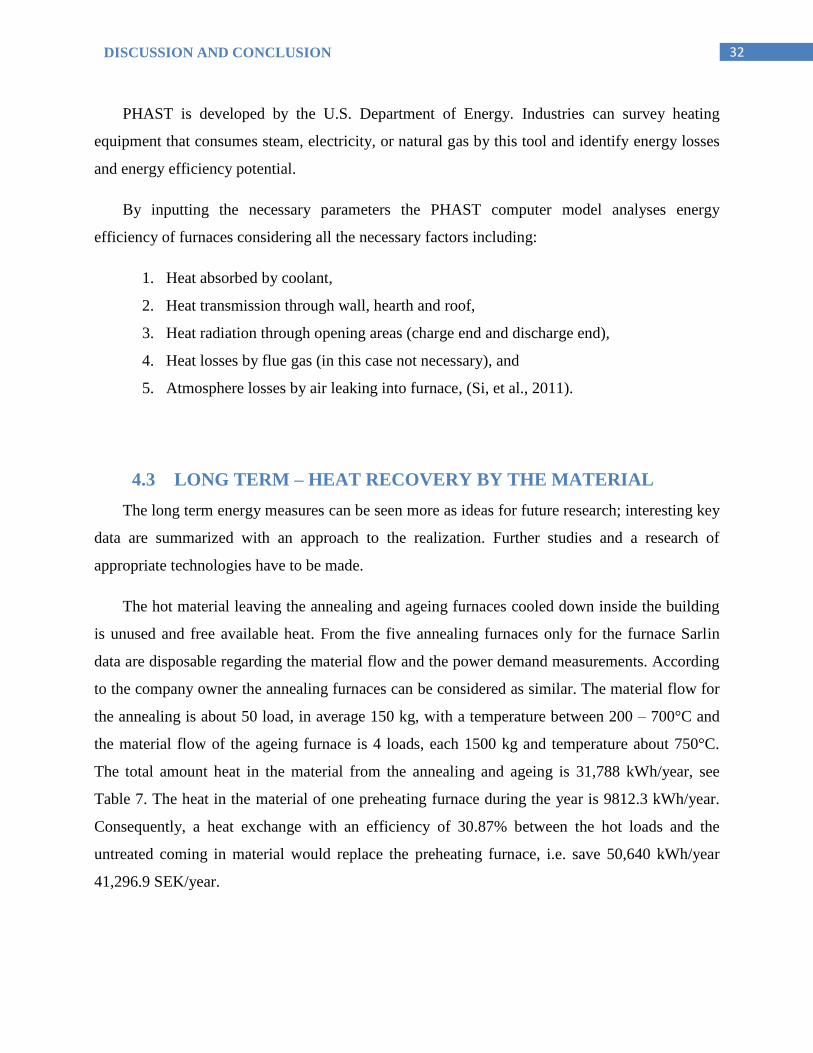
The hot material leaving the annealing and ageing furnaces cooled down inside the building
is unused and free available heat. From the five annealing furnaces only for the furnace Sarlin
data are disposable regarding the material flow and the power demand measurements. According
to the company owner the annealing furnaces can be considered as similar. The material flow for
the annealing is about 50 load, in average 150 kg, with a temperature between 200 – 700°C and
the material flow of the ageing furnace is 4 loads, each 1500 kg and temperature about 750°C.
The total amount heat in the material from the annealing and ageing is 31,788 kWh/year, see
Table 7. The heat in the material of one preheating furnace during the year is 9812.3 kWh/year.
Consequently, a heat exchange with an efficiency of 30.87% between the hot loads and the
untreated coming in material would replace the preheating furnace, i.e. save 50,640 kWh/year
41,296.9 SEK/year.
33 DISCUSSION AND CONCLUSION
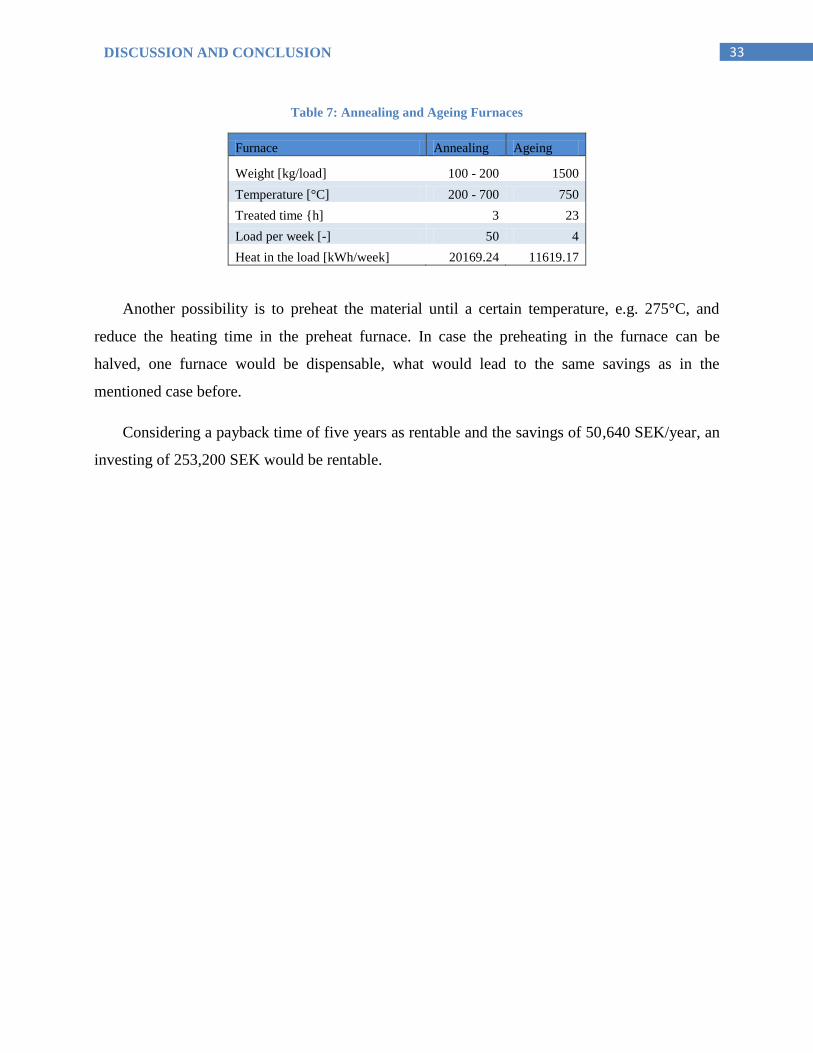
Table 7: Annealing and Ageing Furnaces
Furnace Annealing Ageing
Weight [kg/load] 100 - 200 1500
Temperature [°C] 200 - 700 750
Treated time {h] 3 23
Load per week [-] 50 4
Heat in the load [kWh/week] 20169.24 11619.17
Another possibility is to preheat the material until a certain temperature, e.g. 275°C, and
reduce the heating time in the preheat furnace. In case the preheating in the furnace can be
halved, one furnace would be dispensable, what would lead to the same savings as in the
mentioned case before.
Considering a payback time of five years as rentable and the savings of 50,640 SEK/year, an
investing of 253,200 SEK would be rentable.
34
REFERENCES
Capehart Barney L., Turner Wayne C. and Kennedy William J. Guide to Energy Management [Book]. -
Lilburn, GA : The Fairmont Press, Inc., 2008. - 6. : pp. 62-65.
Edenhofer Ottmar and Stern Lord Nicholas Towards a global green recovery [Report] / The Potsdam
Institute for Climate Impact Research, The Grantham Research Instit ute on Climate Change and the
Environment. - Potsdam/London : The German Foreign Office, 2009.
Eklinder-Frick Jens, Eriksson Lars Torsten and Hallén Lars Effects of social capital on processes in a
regional strategic network [Article] // Industrial Marketing Management. - 2012. - 5 : Vol. 41. - pp. 800-
806.
Fridtjof Unander Dolf Gielen, Michael Taylor, Pierpaolo Cazzola, Energy Technology Perspective
[Online] // International Energy Agency. - 2006. - 19 06 2012. -
http://www.iea.org/publications/freepublications/publication/etp2006-1.pdf.
Gerthsen Tarsilla Chemie für den Maschinenbau - Anorganische Chemie für Werkstoffe und Verfahren
[Book]. - Karlsruhe : Universtätsverlag Karlsruhe, 2006. - 1. : pp. 224-225.
Guo Z.C. and Fu Z.X. Current situation of energy consumption and measures taken for energy saving in
the iron and steel industry in China [Article] // Energy and Its Sustainable Development for China. -
2008. - 11 : Vol. 35. - pp. 4356-4360.
ISO5167 Measurement of fluid flow by means of differential pressure devices. - Geneva : International
Organization for Standardization, 1991.
Klopfenstein Rex Air velocity and flow measurement using a Pitot tube [Article] // ISA Transactions 37. -
1998. - 4 : Vol. 37. - pp. 257-263.
Liu Xiaohui and Shu Chang Determinants of Export Performance: Evidence from Chinese Industries
[Article] // Economics of Planning. - 2001. - 1 : Vol. 36. - pp. 45-67.
Ma Jinlong and Evans David G. Technical efficiency and productivity change of China's iron and steel
industry [Article] // Internation Journal of Production Economics. - 2000. - 3 : Vol. 76. - pp. 293-312.
Markis T. and Paravantis J.A. Energy conservation in small enterprises [Article] // Energy and buildings. -
2007. - 4 : Vol. 39. - pp. 404-415.
McQuarrie Donald A. and Simon John D. Molecular Thermodynamics [Book]. - Sausalito, CA : University
Science Books, 1999. - 1..
35
Si Minxing, Thomson Shirley and Calder Kurtis Energy efficiency assessment by process heating
assessment and survey tool (PHAST) and feasibility analysis of waste heat recovery in the reheat furnace
at a steel company [Article] // Renewable and Sustainable Energy Reviews. - 2011. - 6 : Vol. 15. - pp.
(2904 - 2908).
Steelix Tripple Tripplesteelix.se [Online]. - 2012. - 19 06 2012. - http://www.triplesteelix.se/about-triple-
steelix__18.
Thollander Patrik and Ottosson Mikael An energy efficient Swedish pulp and paper industry - exploring
barriers to and driving forces for cost-effective energy efficiency investments [Article] // Energy
Efficiency. - 2007. - 1 : Vol. 1. - pp. 21-34.
Upp E. L. and LaNasa Paul J. Fluid Flow Measurement - A Practical Guide to Accurate Flow Measurement
[Book]. - Woburn, MA : Butterworth-Heinemann, 2002. - 2..
VVS Meterologi&Klimatiologi VVS 2000 Tabeller & Diagramm [Report]. - Sweden : Förlags AB VVS, 2004.
Wagner Walter Strömung und Druckverlust [Book]. - Würzburg : Vogel, 2008. - 5..
Worrell Ernst, Price Lynn and Nathan Martin Energy efficiency and carbon dioxide emissions reduction
opportunities in the US iron and steel sector [Article] // Energy. - 2001. - 5 : Vol. 26. - pp. 513 - 536.
www.kimo.fr www.kimo.fr [Online]. - 2012. - 10 06 2012. -
http://www.kimo.fr/produits/instruments/anemometer-3.16.html.
Zhang B.L. Application of rate-ratio asymptotics to the prediction of extinction for methanol droplet
combustion [Article] // Combustion and Flame. - 1996. - 3 : Vol. 105. - pp. 267-290.
36
APPENDICES
APPENDIX I.: CALCULATION
Calculation 1: The working time per year in weeks
52 weeks – 2 weeks summer vacation – 1 week Christmas and other holidays – 1 week furnace
not in use due to maintenances or other reasons = 48 weeks
Calculation 2: Power demand per furnace
In the following passages the material flow and the power demand measurements of a one week
will be presented, if available, for each type of furnace. Under the given circumstances
conclusions are made regarding the yearly power demand and material flow and the efficiencies
are calculated.
Preheating furnaces
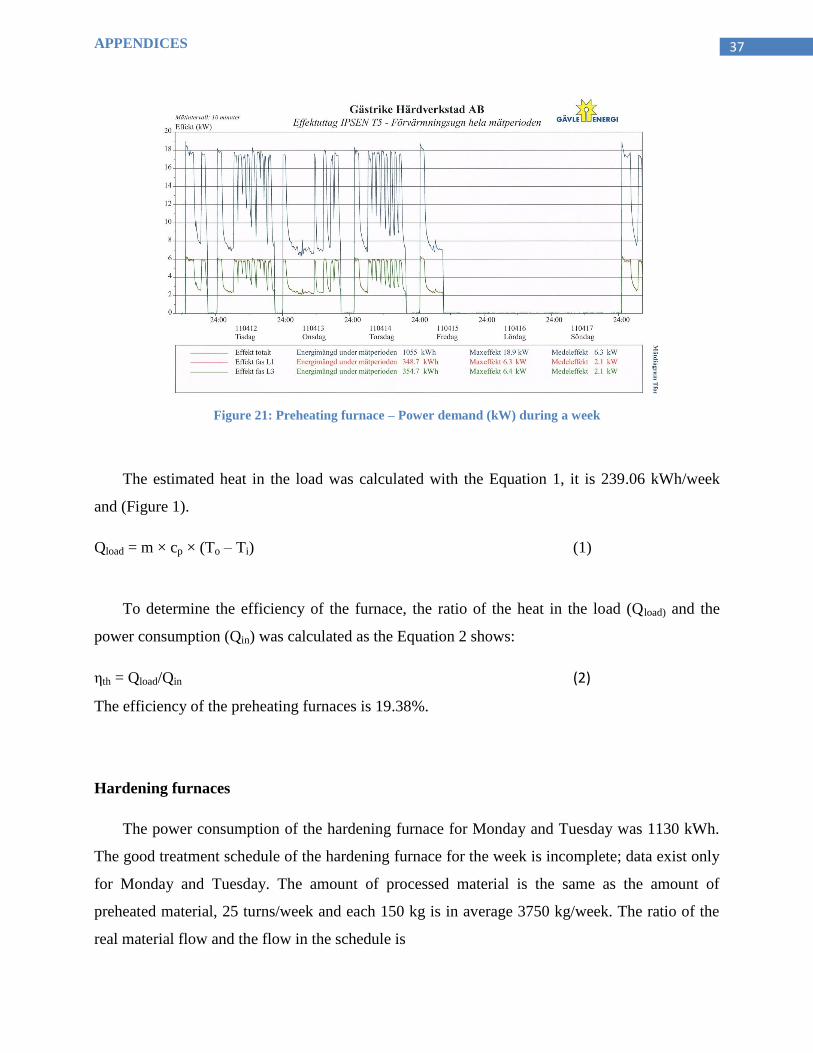
The power demand of each preheating furnaces is 1055 kWh. Data for the material flow does
not exist, therefore the number of load turns were read from the Figure 21. For every new load
the furnaces has to heat the batch from 25°C to 450°C; at the beginning the temperature
difference is the highest, i.e. at the beginning the furnace heats with the maximum power.
Consequently every peak in the power graph represents a new load. In Figure 21 are 27 peaks,
but according to the company owners one peak is due to heating up the furnace and another was
empthy, that means 25 loads with an average weight of 150kg heated up to 450°C.
APPENDICES
37
Figure 21: Preheating furnace – Power demand (kW) during a week
The estimated heat in the load was calculated with the Equation 1, it is 239.06 kWh/week
and (Figure 1).
Qload = m × cp × (To – Ti) (1)
To determine the efficiency of the furnace, the ratio of the heat in the load (Qload) and the
power consumption (Qin) was calculated as the Equation 2 shows:
ηth = Qload/Qin (2)
The efficiency of the preheating furnaces is 19.38%.
Hardening furnaces
The power consumption of the hardening furnace for Monday and Tuesday was 1130 kWh.
The good treatment schedule of the hardening furnace for the week is incomplete; data exist only
for Monday and Tuesday. The amount of processed material is the same as the amount of
preheated material, 25 turns/week and each 150 kg is in average 3750 kg/week. The ratio of the
real material flow and the flow in the schedule is
APPENDICES
38
3750/1895 = 2.0833
The week consumption was extrapolated with the factor and afterwards with 48 weeks to the
total year consumption
E = 1130 × 2.0833 × 48 = 112,998 kWh/year
For both furnaces the power demand per year is 225,996 kWh, (Table 8).
Table 8: Power demand of the hardening furnaces
Electricity for Mo. & Tu. [kWh] 1130
Electricity per week [kWh]: 1130 × 2.0833 2354
Working weeks per year [weeks]:
48
Electricity per year [kWh]: 3825 × 49 112,998
Total [kWh] 187425 × 2 225,996
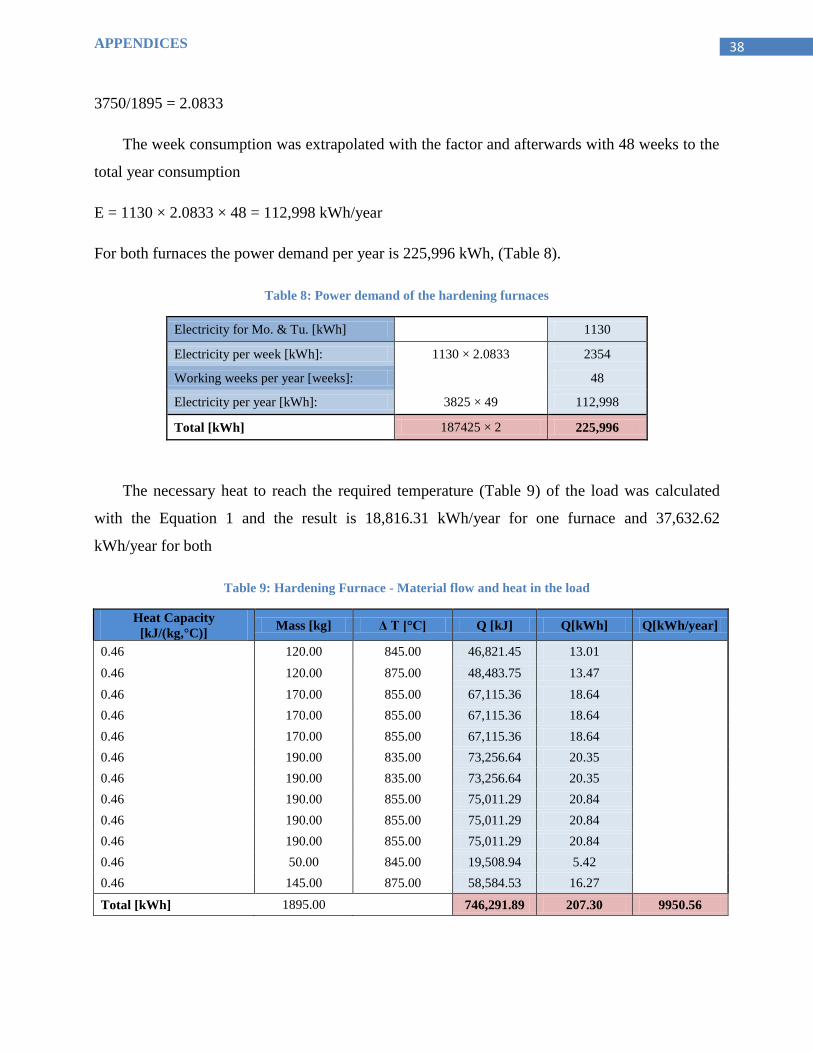
The necessary heat to reach the required temperature (Table 9) of the load was calculated
with the Equation 1 and the result is 18,816.31 kWh/year for one furnace and 37,632.62
kWh/year for both
Table 9: Hardening Furnace - Material flow and heat in the load
Heat Capacity
[kJ/(kg,°C)] Mass [kg] Δ T [°C] Q [kJ] Q[kWh] Q[kWh/year]
0.46 120.00 845.00 46,821.45 13.01
0.46 120.00 875.00 48,483.75 13.47
0.46 170.00 855.00 67,115.36 18.64
0.46 170.00 855.00 67,115.36 18.64
0.46 170.00 855.00 67,115.36 18.64
0.46 190.00 835.00 73,256.64 20.35
0.46 190.00 835.00 73,256.64 20.35
0.46 190.00 855.00 75,011.29 20.84
0.46 190.00 855.00 75,011.29 20.84
0.46 190.00 855.00 75,011.29 20.84
0.46 50.00 845.00 19,508.94 5.42
0.46 145.00 875.00 58,584.53 16.27
Total [kWh] 1895.00 746,291.89 207.30 9950.56
APPENDICES
39
Thus, the efficiency for the hardening furnace is 18.35% and the heat in the load per furnace is
18,816.31 kWh/year and for both 37,632.64 kWh/year, (Table 10).
Table 10: Hardening Furnace - Heat in the load
Ø Heat Capacity
[kJ/(kg,°C)] Ø Mass [kg]
turns per
week Ø Δ T [°C] Q [kJ/week]
Q
[kWh/week] Q [kWh/year]
0.46 150 25 815 1,411,223.44 392.01 18,816.31
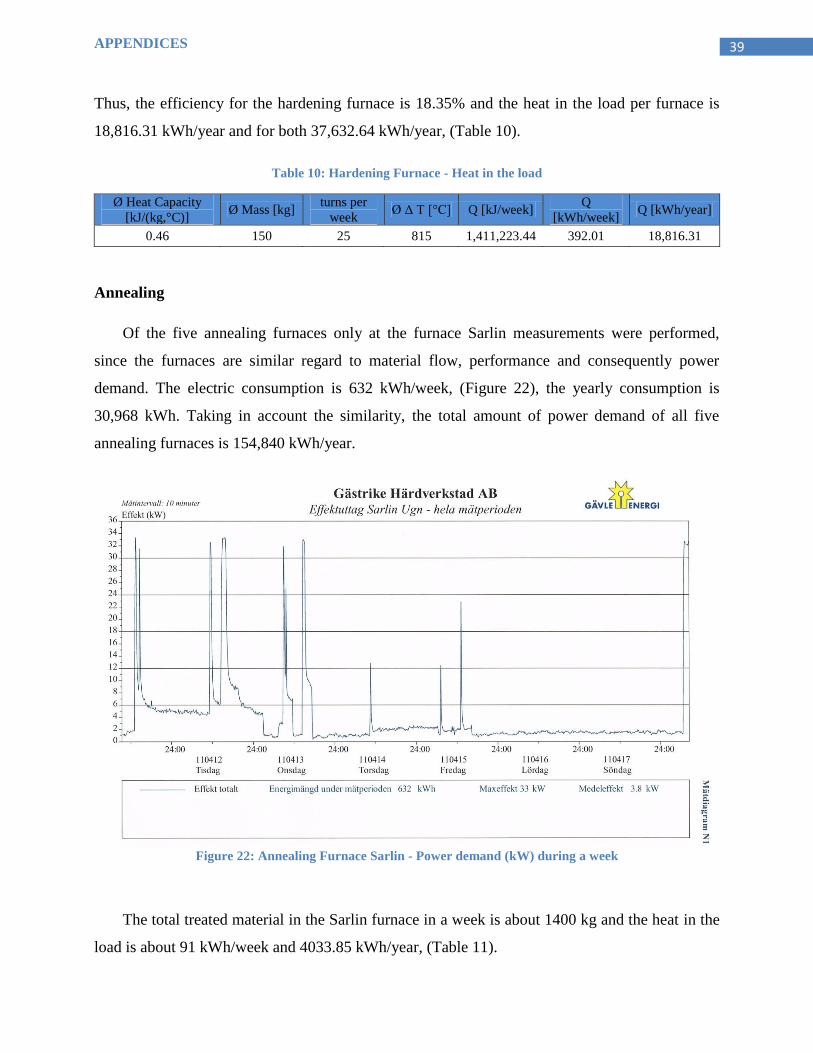
Annealing
Of the five annealing furnaces only at the furnace Sarlin measurements were performed,
since the furnaces are similar regard to material flow, performance and consequently power
demand. The electric consumption is 632 kWh/week, (Figure 22), the yearly consumption is
30,968 kWh. Taking in account the similarity, the total amount of power demand of all five
annealing furnaces is 154,840 kWh/year.
Figure 22: Annealing Furnace Sarlin - Power demand (kW) during a week
The total treated material in the Sarlin furnace in a week is about 1400 kg and the heat in the
load is about 91 kWh/week and 4033.85 kWh/year, (Table 11).
APPENDICES
40
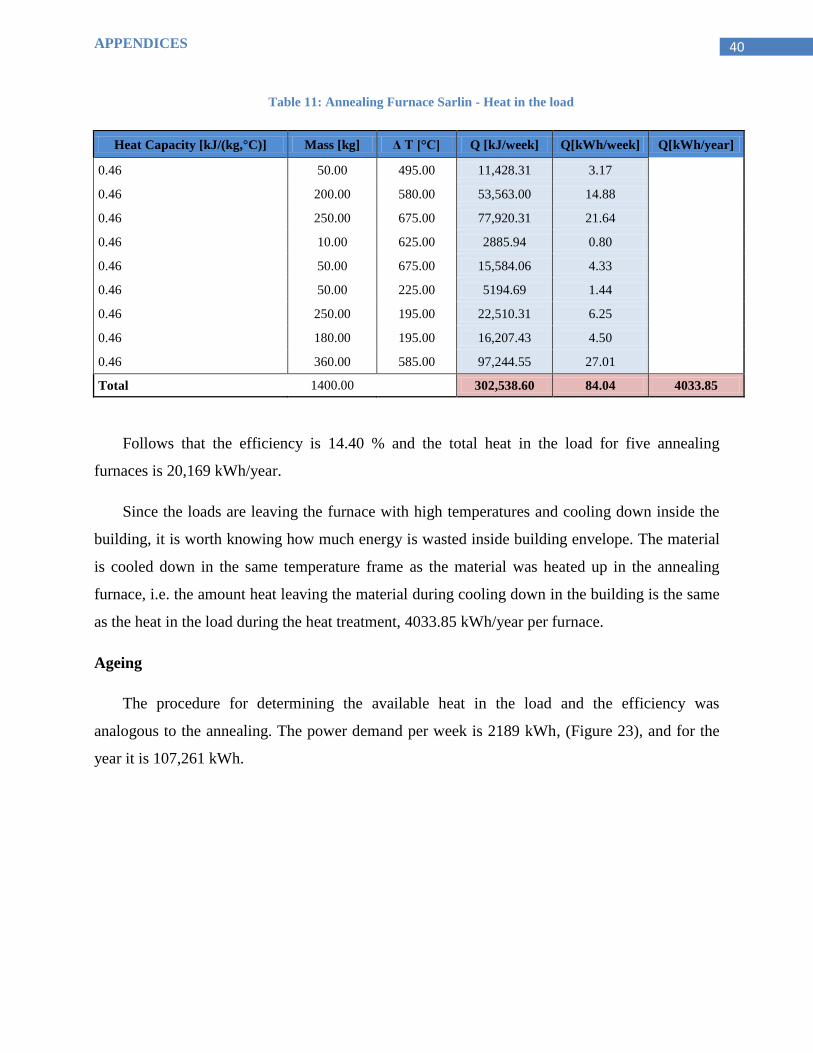
Table 11: Annealing Furnace Sarlin - Heat in the load
Heat Capacity [kJ/(kg,°C)] Mass [kg] Δ T [°C] Q [kJ/week] Q[kWh/week] Q[kWh/year]
0.46 50.00 495.00 11,428.31 3.17
0.46 200.00 580.00 53,563.00 14.88
0.46 250.00 675.00 77,920.31 21.64
0.46 10.00 625.00 2885.94 0.80
0.46 50.00 675.00 15,584.06 4.33
0.46 50.00 225.00 5194.69 1.44
0.46 250.00 195.00 22,510.31 6.25
0.46 180.00 195.00 16,207.43 4.50
0.46 360.00 585.00 97,244.55 27.01
Total 1400.00 302,538.60 84.04 4033.85
Follows that the efficiency is 14.40 % and the total heat in the load for five annealing
furnaces is 20,169 kWh/year.
Since the loads are leaving the furnace with high temperatures and cooling down inside the
building, it is worth knowing how much energy is wasted inside building envelope. The material
is cooled down in the same temperature frame as the material was heated up in the annealing
furnace, i.e. the amount heat leaving the material during cooling down in the building is the same
as the heat in the load during the heat treatment, 4033.85 kWh/year per furnace.
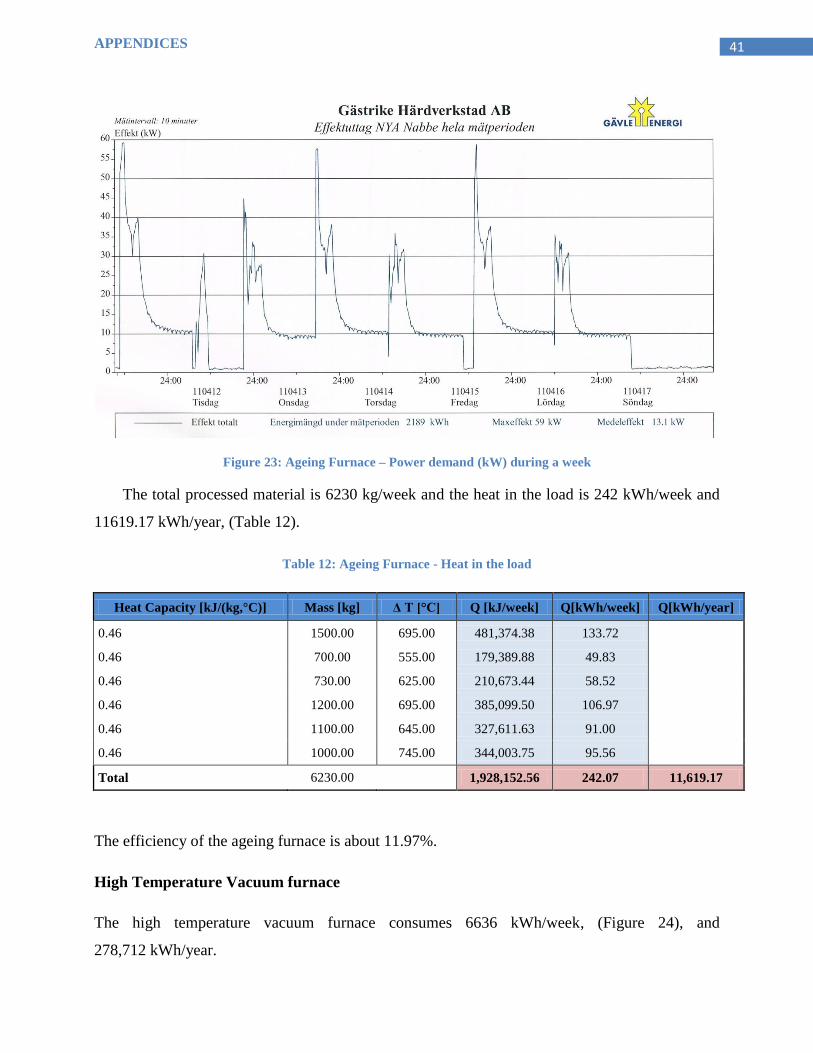
Ageing
The procedure for determining the available heat in the load and the efficiency was
analogous to the annealing. The power demand per week is 2189 kWh, (Figure 23), and for the
year it is 107,261 kWh.
APPENDICES
41
Figure 23: Ageing Furnace – Power demand (kW) during a week
The total processed material is 6230 kg/week and the heat in the load is 242 kWh/week and
11619.17 kWh/year, (Table 12).
Table 12: Ageing Furnace - Heat in the load
Heat Capacity [kJ/(kg,°C)] Mass [kg] Δ T [°C] Q [kJ/week] Q[kWh/week] Q[kWh/year]
0.46 1500.00 695.00 481,374.38 133.72
0.46 700.00 555.00 179,389.88 49.83
0.46 730.00 625.00 210,673.44 58.52
0.46 1200.00 695.00 385,099.50 106.97
0.46 1100.00 645.00 327,611.63 91.00
0.46 1000.00 745.00 344,003.75 95.56
Total 6230.00 1,928,152.56 242.07 11,619.17
The efficiency of the ageing furnace is about 11.97%.
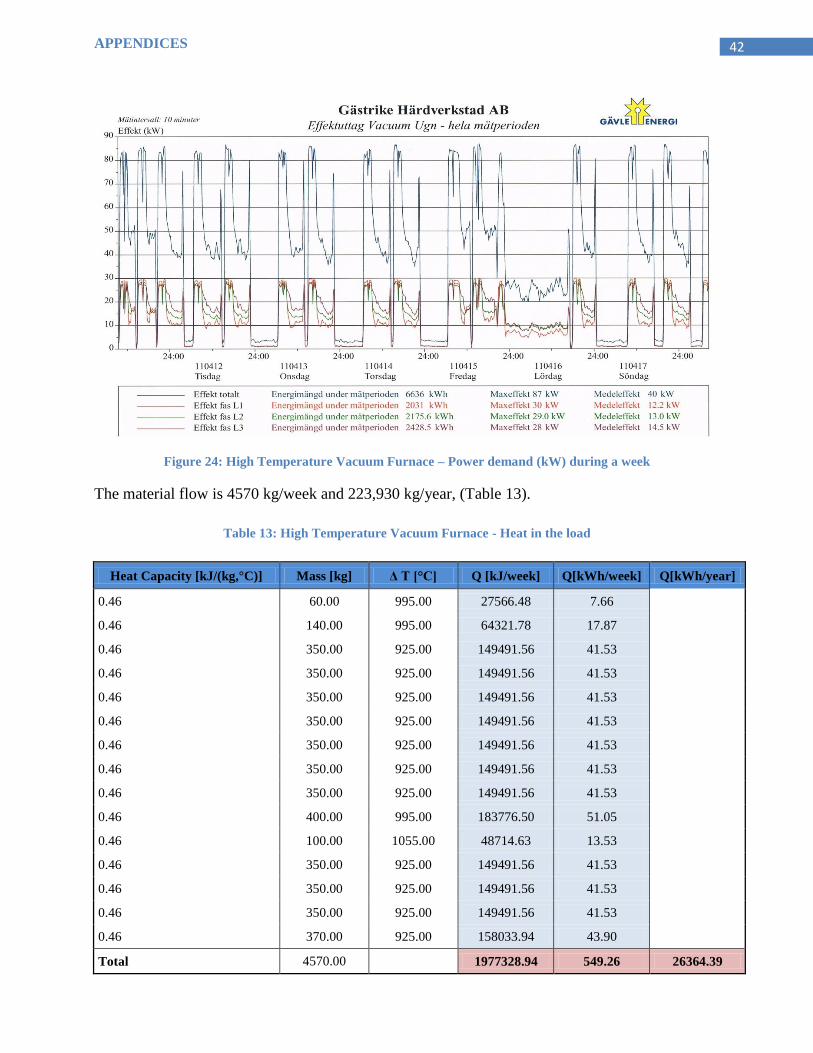
High Temperature Vacuum furnace
The high temperature vacuum furnace consumes 6636 kWh/week, (Figure 24), and
278,712 kWh/year.
APPENDICES
42
Figure 24: High Temperature Vacuum Furnace – Power demand (kW) during a week
The material flow is 4570 kg/week and 223,930 kg/year, (Table 13).
Table 13: High Temperature Vacuum Furnace - Heat in the load
Heat Capacity [kJ/(kg,°C)] Mass [kg] Δ T [°C] Q [kJ/week] Q[kWh/week] Q[kWh/year]
0.46 60.00 995.00 27566.48 7.66
0.46 140.00 995.00 64321.78 17.87
0.46 350.00 925.00 149491.56 41.53
0.46 350.00 925.00 149491.56 41.53
0.46 350.00 925.00 149491.56 41.53
0.46 350.00 925.00 149491.56 41.53
0.46 350.00 925.00 149491.56 41.53
0.46 350.00 925.00 149491.56 41.53
0.46 350.00 925.00 149491.56 41.53
0.46 400.00 995.00 183776.50 51.05
0.46 100.00 1055.00 48714.63 13.53
0.46 350.00 925.00 149491.56 41.53
0.46 350.00 925.00 149491.56 41.53
0.46 350.00 925.00 149491.56 41.53
0.46 370.00 925.00 158033.94 43.90
Total 4570.00 1977328.94 549.26 26364.39
APPENDICES
43
The efficiency of the vacuum furnace is 10.46 %.
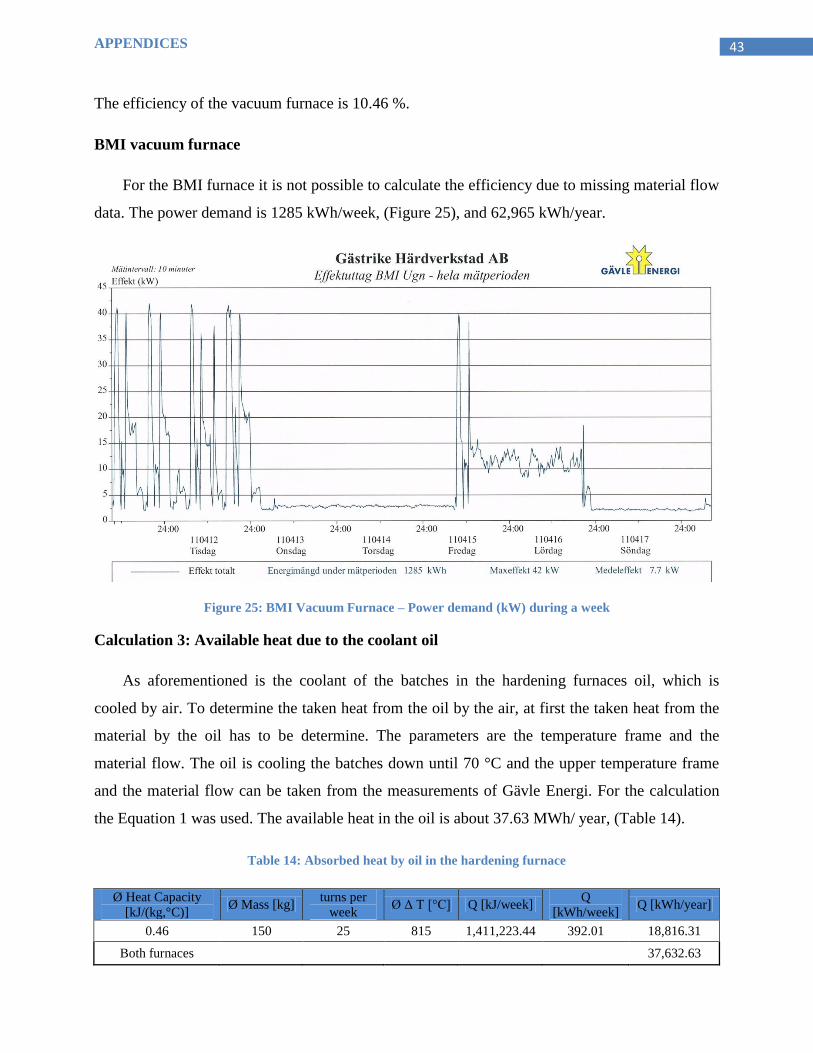
BMI vacuum furnace
For the BMI furnace it is not possible to calculate the efficiency due to missing material flow
data. The power demand is 1285 kWh/week, (Figure 25), and 62,965 kWh/year.
Figure 25: BMI Vacuum Furnace – Power demand (kW) during a week
Calculation 3: Available heat due to the coolant oil
As aforementioned is the coolant of the batches in the hardening furnaces oil, which is
cooled by air. To determine the taken heat from the oil by the air, at first the taken heat from the
material by the oil has to be determine. The parameters are the temperature frame and the
material flow. The oil is cooling the batches down until 70 °C and the upper temperature frame
and the material flow can be taken from the measurements of Gävle Energi. For the calculation
the Equation 1 was used. The available heat in the oil is about 37.63 MWh/ year, (Table 14).
Table 14: Absorbed heat by oil in the hardening furnace
Ø Heat Capacity
[kJ/(kg,°C)] Ø Mass [kg]
turns per
week Ø Δ T [°C] Q [kJ/week]
Q
[kWh/week] Q [kWh/year]
0.46 150 25 815 1,411,223.44 392.01 18,816.31
Both furnaces 37,632.63
APPENDICES
44
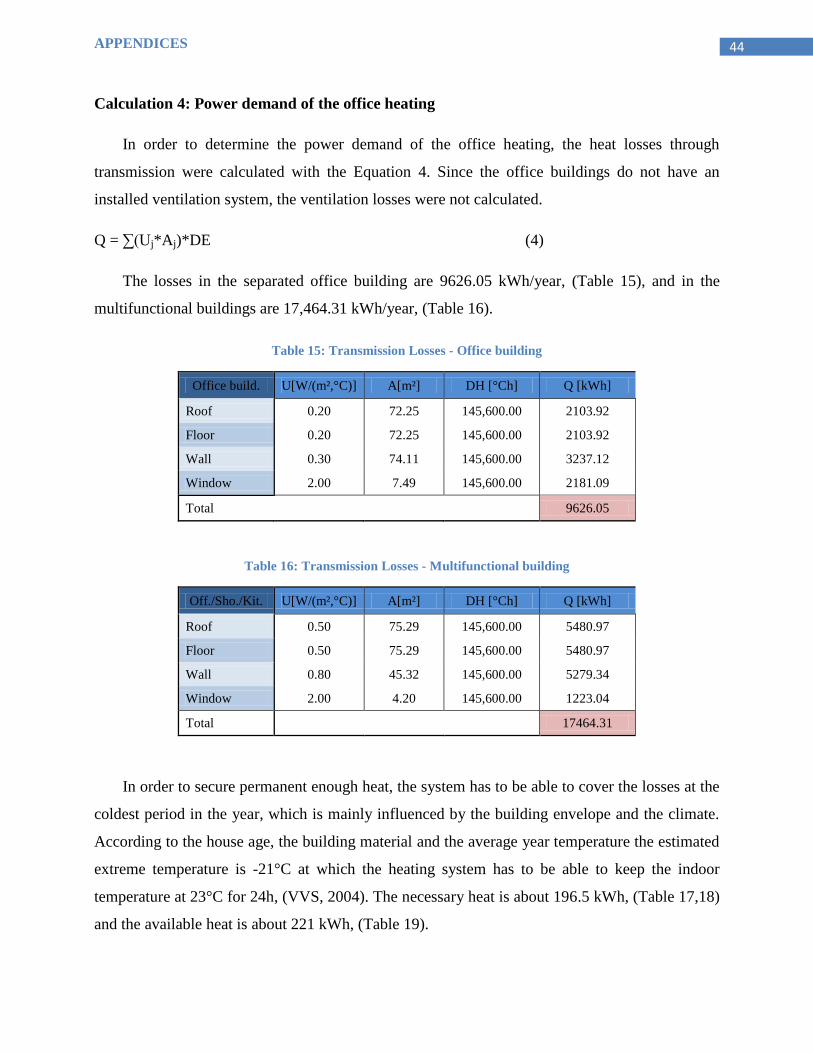
Calculation 4: Power demand of the office heating
In order to determine the power demand of the office heating, the heat losses through
transmission were calculated with the Equation 4. Since the office buildings do not have an
installed ventilation system, the ventilation losses were not calculated.
Q = ∑(Uj*Aj)*DE (4)
The losses in the separated office building are 9626.05 kWh/year, (Table 15), and in the
multifunctional buildings are 17,464.31 kWh/year, (Table 16).
Table 15: Transmission Losses - Office building
Office build. U[W/(m²,°C)] A[m²] DH [°Ch] Q [kWh]
Roof 0.20 72.25 145,600.00 2103.92
Floor 0.20 72.25 145,600.00 2103.92
Wall 0.30 74.11 145,600.00 3237.12
Window 2.00 7.49 145,600.00 2181.09
Total 9626.05
Table 16: Transmission Losses - Multifunctional building
Off./Sho./Kit. U[W/(m²,°C)] A[m²] DH [°Ch] Q [kWh]
Roof 0.50 75.29 145,600.00 5480.97
Floor 0.50 75.29 145,600.00 5480.97
Wall 0.80 45.32 145,600.00 5279.34
Window 2.00 4.20 145,600.00 1223.04
Total 17464.31
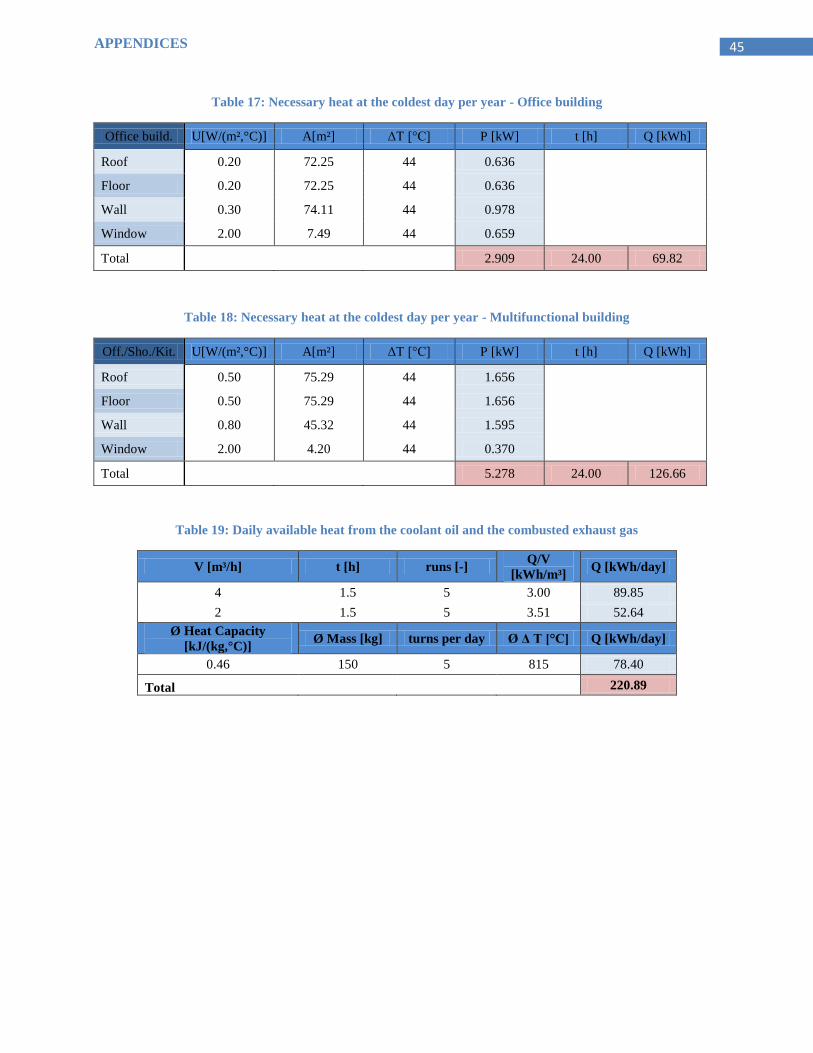
In order to secure permanent enough heat, the system has to be able to cover the losses at the
coldest period in the year, which is mainly influenced by the building envelope and the climate.
According to the house age, the building material and the average year temperature the estimated
extreme temperature is -21°C at which the heating system has to be able to keep the indoor
temperature at 23°C for 24h, (VVS, 2004). The necessary heat is about 196.5 kWh, (Table 17,18)
and the available heat is about 221 kWh, (Table 19).
APPENDICES
45
Table 17: Necessary heat at the coldest day per year - Office building
Office build. U[W/(m²,°C)] A[m²] ΔT [°C] P [kW] t [h] Q [kWh]
Roof 0.20 72.25 44 0.636
Floor 0.20 72.25 44 0.636
Wall 0.30 74.11 44 0.978
Window 2.00 7.49 44 0.659
Total 2.909 24.00 69.82
Table 18: Necessary heat at the coldest day per year - Multifunctional building
Off./Sho./Kit. U[W/(m²,°C)] A[m²] ΔT [°C] P [kW] t [h] Q [kWh]
Roof 0.50 75.29 44 1.656
Floor 0.50 75.29 44 1.656
Wall 0.80 45.32 44 1.595
Window 2.00 4.20 44 0.370
Total 5.278 24.00 126.66
Table 19: Daily available heat from the coolant oil and the combusted exhaust gas
V [m³/h] t [h] runs [-] Q/V
[kWh/m³] Q [kWh/day]
4 1.5 5 3.00 89.85
2 1.5 5 3.51 52.64
Ø Heat Capacity
[kJ/(kg,°C)] Ø Mass [kg] turns per day Ø Δ T [°C] Q [kWh/day]
0.46 150 5 815 78.40
Total 220.89
APPENDICES
46
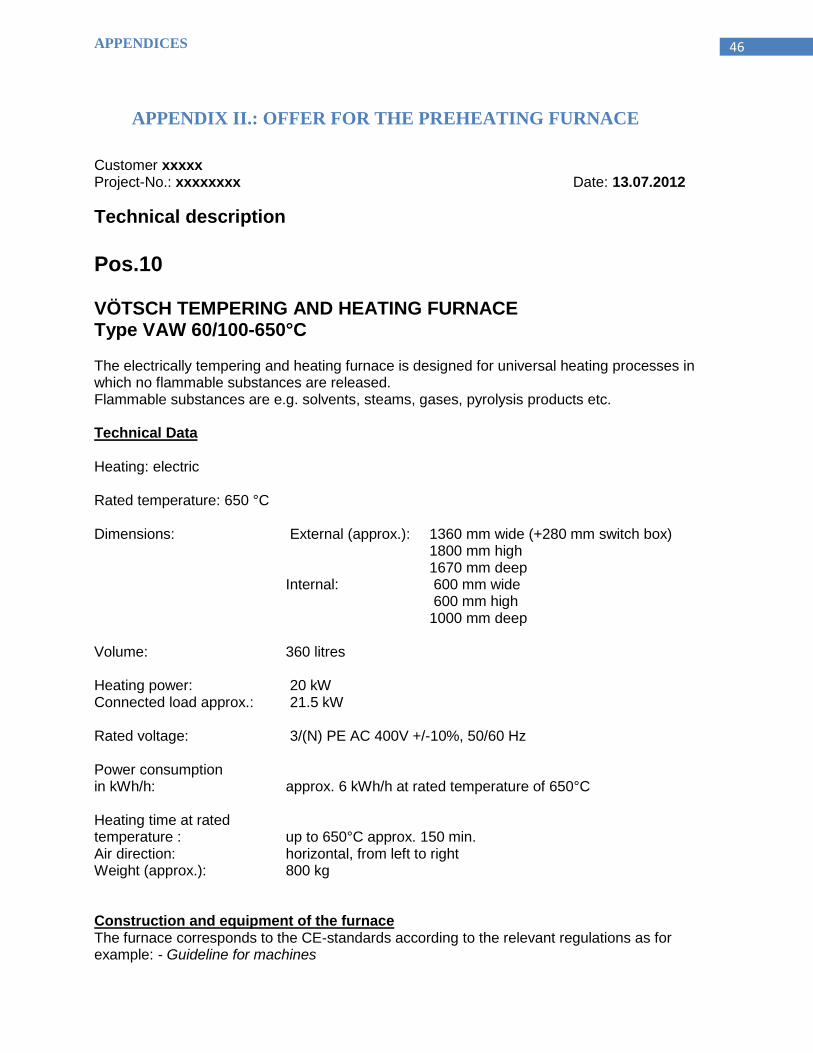
APPENDIX II.: OFFER FOR THE PREHEATING FURNACE
Customer xxxxx Project-No.: xxxxxxxx Date: 13.07.2012
Technical description
Pos.10 VÖTSCH TEMPERING AND HEATING FURNACE Type VAW 60/100-650°C The electrically tempering and heating furnace is designed for universal heating processes in which no flammable substances are released. Flammable substances are e.g. solvents, steams, gases, pyrolysis products etc. Technical Data Heating: electric Rated temperature: 650 °C Dimensions: External (approx.): 1360 mm wide (+280 mm switch box)
1800 mm high 1670 mm deep
Internal: 600 mm wide 600 mm high 1000 mm deep
Volume: 360 litres Heating power: 20 kW Connected load approx.: 21.5 kW Rated voltage: 3/(N) PE AC 400V +/-10%, 50/60 Hz Power consumption in kWh/h: approx. 6 kWh/h at rated temperature of 650°C Heating time at rated temperature : up to 650°C approx. 150 min. Air direction: horizontal, from left to right Weight (approx.): 800 kg Construction and equipment of the furnace The furnace corresponds to the CE-standards according to the relevant regulations as for example: - Guideline for machines
APPENDICES
47
Customer xxxxx Project-No.: xxxxxxxx Date: 13.07.2012 - Guideline for low voltage - Electromagnetic compatibility (industrial area) in their respectively valid versions at the time of the placing of orders. Description and function The furnace is built as a double-walled sheet steel construction and is insulated with high-quality mineral fibre (thickness approx. 300 mm). A radial fan and the heating system are installed below the bottom of the working chamber. The air is recirculated and heated using an electrical resistance heater. The circulated air is routed horizontally through the working chamber. The electrical heating system consists of heating elements which are made of stainless steel. The temperature of the furnace is kept constant by an electronic temperature controlling system. The power and control parts necessary for the operation are located in a switch box placed on the left hand side of the furnace. All operating and control elements are built as a modular system in the front of the switch box (modular panels RAL 7004). Protection IP 54 (EN 60529). The furnace is individually tested according to EN 60204-1 before delivery. Equipment: Outer casing The outer casing is made of electrolytically galvanized sheet steel with an aluminium-bronze protective lacquer coating. Inner casing The inner casing and the air ducts are made of stainless steel, material no. 1.4541, and welded tight. Inside the furnace there are vertical rails where supports can be fitted to support a maximum of 8 inserts (wire-mesh shelves, grates). The supports are adjustable at the vertical rails in steps with a minimum of 50mm. Vertical rails for a total load of max. 150 kg. Supports, shelves and grates are available as accessories. Work chamber bottom The work chamber bottom is insulated with mineral fibre (thickness approx. 180 mm). Work chamber bottom for a maximum flat load of 50 kg. Door Single-wing swinging door at the front with special locking device. The door seal is made of ceramic fibre cord.

APPENDICES
48
Customer xxxxx Project-No.: xxxxxxxx Date: 13.07.2012 Sockets for fresh air and exhaust air Sockets for fresh air and exhaust air are on top of the furnace, diameter 100 mm. The socket for fresh air is closed by a cap. This socket is used for the optional retrofiting with a fresh air fan in conjunction with a seal flap for quicker cooling. Heating The heating system consists of spirally wounded heating elements. The heating system is mounted in the air duct and is easily removable. Circulating fan The radial circulating fan is installed below the bottom of the working chamber. Temperature sensor Dubbel thermocouple NiCr-Ni installed in the air duct. using: sensor 1 for temperature controller
sensor 2 for temperature limit cut-out (TWB). Switch box The switch box is located on the left side of the furnace. The heating system is controlled by a solid state relays. Temperature controller Type JUMO dTRON 04.1, temperature input from the installed thermocouple NiCr-Ni (control sensor), 2-phase-controller with PID-action, LED-reading of the set point and actual value. Temperature limit cut-out (TWB) Protection class 2 according to EN 60519-2, fully independent of the temperature control feature. Safety aim: in case of breakdown, there is no danger that the electric heating system and the load will overheat. The temperature limit cut-out is used for the all-pole disconnection of the heating system when a temperature set by the operator has been reached. The furnace is delivered without mains cables and mains fuses, fuse protection by customers 35A (tr). Customer’s specifications are not taken into account in this offer.
Orientation price: € 30.000.00 (Plus value-added tax to comply with legal requirements) Delivery time: approx.20 weeks