Waste Heat Boilers
32
DAVID W. TAYLOR NAVAL SHIP FlESEARCH AND DEVELOPMENT CENTER Be th es da, Ma ryla nd 2 00 84 A STUDY OF WASTE-HEAT-BOILER SIZE AND PERFORMANCE OF A CONCEPTUAL MARINE COGAS SYSTEM b y R. K. Muench, D. T. Knauss and J . G. Purnell APPROVED FOR PUBLIC RELEASE; DISTRIB·JTION UNLIMITED PROPULSION AND AUXILIARY SYSTEMS DEPARTMENT RESEARCH AND DEVELOPMENT REPORT February 1980 DTNSRDC TM-27-80-19
-
Upload
sean-mccracken -
Category
Documents
-
view
219 -
download
0
Transcript of Waste Heat Boilers

8/3/2019 Waste Heat Boilers
http://slidepdf.com/reader/full/waste-heat-boilers 1/32
DAVID W. TAYLOR NAVAL SHIP
FlESEARCH AND DEVELOPMENT CENTER
Bethesda, Maryland 20084
A STUDY OF WASTE-HEAT-BOILER SIZE AND PERFORMANCE
OF A CONCEPTUAL MARINE COGAS SYSTEM
by
R. K. Muench, D. T. Knauss and J. G. Purnell
APPROVED FOR PUBLIC RELEASE; DISTRIB·JTION UNLIMITED
PROPULSION AND AUXILIARY SYSTEMS DEPARTMENT
RESEARCH AND DEVELOPMENT REPORT
February 1980 D TN SR DC T M- 27 -8 0- 19

8/3/2019 Waste Heat Boilers
http://slidepdf.com/reader/full/waste-heat-boilers 2/32

8/3/2019 Waste Heat Boilers
http://slidepdf.com/reader/full/waste-heat-boilers 3/32
UNCLASSIFIEDSECUHITY CLASSIFICATION OF THIS PAGE (When DBts Entered)
L
- - READ INSTRUCTIONSR EP OR T D OC UM EN TA TIO N P AG E BEFORE COMPLETING FORM
7"RE'PORT NUMBER r GOVT ACCESSION NO. 3. RECIPIENT'S CATALOG NUMBER
D TN SR DC T M- 27 -B O- 19-
4. TI TLE (Bnd Subtitle) 5. TYPE OF REPORT 6 PERIOD COVERED
A Study of W as te -H ea t- Boil er S ize andResearch & DevelopmentP s.r forman ce of a Conceptual Marine COGAS
.
Syst~m 6. PERFORMING ORG. REPORT NUMBER
~ITHOR(.) B. CONTRACT OR GRANT NUMBER(.)
R .K . M ue nc h, D.T. Knauss and J. G. P ur ne ll
9. PIORFORMING ORGANIZATION NAME AND ADDRESS 10. PROGRAM ELEMENT, PROJECT, TASK
AREA 6 WORK UNIT NUMBERS
Dav L d W. T ayl or Naval Ship R&D Center Element 62543NAr.napo1is, M D 21402 Task Area SF43-432-301
I-- -Work Unit 1-2721-152
II. CONTROLLING OFFICE NAME AND ADDRESS 12. REPORT DATE
David W. T ayl or Naval Ship R&D Center Februarv 1980Annapolis, M D 21402 13. NUMBER OF PAGES
2614. IIONITORING AGENCY NAME II ADDRES5(1f different from Controlllnil Offlcs) 15. SECURITY CLASS. (of thl. report)
1541 . DECL ASSI FI CATI ON! DOWN GRADING
SCHEDULE
16. CilSTRIBUTION STATEMENT (of this Report)r D~l]lUTION STATEMENT A
Approved for public releQSeI
. Distribution Unlimited
~'ISTRIBUTION STATEMENT (of the ab.tract entered In Block 20, If different from Reporl)
t-;s.--;UPPLEMENTARY NOTES
1l' ·-'1 ''\.
/ /~t: : :n! lh U ~ 7bj
~1 ~ EY WOR~S =r: on reverse olde If neceuary and Identify by blo.<;k number) ,"
Waste-~eat Zecover~, ,rSteam jX5'ttoming,.s;?,c1e~."P-
Waste--Heat-,B'oHer ,izing,-,\ < . - '
CO GAS S ystem _j J<:G.1S )f'urblne;;--- -..--..-- -- .~~ -~: -. ".
Heat; 'I'r ans f er-, _.
20. I.BSTRACT (Continue on reverse .Ide If nece ... ry and Identify by block number)
~The effect of waste-heat-boi1er weight and volume on the performance of anL112S00-based combined gas and steam turbine system (COGAS) is examined. Theboiler is a once-through ty pe wh ic h is c on tr ol le d to extract the maximum heatfrom the gas turb ine exhaust and s ti ll m ai nt ai n a cce pta ble minimu m wal ltemp er at.ur e . At a gas turbine power of 12,000 hp (B .95MW ) , the b oi le r w ith ou tf,~ed-water heating c an pr od uc e sufficient steam to generate 2840 hp (2120 kW)a': a turbine eff Lci.ency of 80% • This boiler, including diffuser, weighs --- ~
DOFORM
1 JAN 73 1473 EDITION OF 1 NOV 65 IS OBSOLETE
SIN 0102-014- 6601 UNCLASSIFIEDSECURITY CLASSIFICATION OF THIS PAGE (When Oat. Bnl.r.d)

8/3/2019 Waste Heat Boilers
http://slidepdf.com/reader/full/waste-heat-boilers 4/32
UNCLASSIFIED
<,
" /'v.",._,._~~,,: f
.L<...U' -1ITY CLASSI,!;ICATION OF THIS PAGE(When Data En'ter"d)
!,k~) , n I
19,300 f t % s (8770 kg) and has a gas side pressure drop of 9 in. H2~ (2.2 kPa).With feed-water heating, the steam power can be increased to 4000 hp (2980 kW)with a boiler weight of 38,3000 fl,.-b-s-.~17,400 kg). The 24 and 33% respectiveincreases in power for these two systems at cruise are translated to 15 and20% improvement in fuel consumption over the LM2500 gas turbine at the higherpower levels of the COCAS system. At the lower power levels, both COCAS
systems yield a 20% improvement in fuel consumption over the basic gas turbine
v & . ~ j J < : ~F'~ , . _ 1 'n ( .if; t).hJ , .,
f
UNCLASSIFIEDSECURITY CLASSIFICATION OF THIS PAGE(When Data Entered)
;

8/3/2019 Waste Heat Boilers
http://slidepdf.com/reader/full/waste-heat-boilers 5/32
TABLE OF CONTENTS
L IS T O F F IG U RE S •••••••••• " • ••••••• " . .... " .......................................................... iv
Page
L 1 ST O F T A B LE S .... '".. .. . . . . . .... .. .. . . . . . . . . .. . . . . . . . . . . . . . . . . .. . . . . . . . . . . . . . . . . . . . . . . . . . . . . . . . . . . . . . . . . . . . . . . . . . . . . . . .. . . .. iv
A BSTR AC T " " " " " • " " " " • " ••• " " " " " .. .. • • 1
IN T R O D U C T IO N . '"" .. " " " • " " It " " " " • " " .. " " " " " " " 1
AN~YSIS " " •• "" •.... """" "" ,, " .. "......... 2
RESULTS " " .. " " .. " " " " 5
Waste-Heat-Boiler Sizing.......................................... 5
COGAS-System Performance a .• " " " " " " 12
S l . . J t . 1 1 1 ! \ .R Y " " " " " - . . . • • • . . • • • • • • • • • • • • • • • • • • • • . . • • • 1 6
REFERENCES .. 18
A PPE ~DI X A - WAS TE- HEA T~B OIL ER SIZING ..•......•.••..•..••...••.•...•• 19
APPENDIX B - COGAS STATE-POINT MATCHING ....••......•...•.••••...•.•.. 23
By.o.. t ib.tio .-
Availability Codes.' . . . . _ _ . . •_----- ,
._.--._ ..,..Avail a0d Ior
D i : . ; t \ special \
\~/ILU. . .
-
iii
D TN SR DC T M- 27 -8 0- 19

8/3/2019 Waste Heat Boilers
http://slidepdf.com/reader/full/waste-heat-boilers 6/32
LIST OF FIGURES
1
2
3
Once-Through Waste-Heat Boiler•••••••••••••••••••••••••••••••••~oiler State-Point Designations ••••••••••••••••••••••••••••••••~ffe ct of B oil er -E xh au st- Ga s T empe ra tu re on B oil er
Size (Weight)IJ .
4 Effect of Boiler-Exhaust-Gas Temperature on BoilerSize (Pressure Drop) •.••••••.••••••••••.•••...•••••••••••.••
5 Effect of Feed-Water Heating on Boiler Size (Weight)•••••••••••6 Effect of Economizer Inlet Temperature on Total Waste-
Heat-Boiler Heat Transfer ••••••••••••••••••• o ••• ~ •••••••••••
7 W a st e- H ea t- B oi le r S iz in g S u mm ar y • • •• •• •• •• •• ••• •• •• •• •• •• ••• •• •8 Specific Fuel Consumption •••••••••••••.•••••••• o •••••••••••••••
9 W a s te - H e at - Bo il e r T e mp e ra t u re s • •• •• •• •• •• •• •• •• •• •• •• •• •• •• •• ••1 0 W a st e- H ea t- B oi le r S a tu r at io n P r es s ur e s • •• •• •• •• •• •• •• ••• •• •• •• •1 1 W as te -H ea t- Bo il er M as s F lo w R ate s • •••••••••••••••••••••••••••••1 2 W a s te - H e at , -B o il e r A r e a F r a c ti on s • •• •• •• •• •• •• •• •• •• •• •• •• •• •• ••1 3 F low C ha rt for C OG AS I te ra tion M od el •••••••••••••••••••••••••••14 Steam-Cycle Schematic •••.••••.••••••••.•••••••••••..•••• o ••••••
LIST OF TABLES
1 Nominal Cruise Conditions for Waste-Heat-Boiler Sf z Lng , ••••••••••••••••••••••••••••••••••••••••••••••
2 - Waste-Heat-Boiler Summary •••••••••••••••••••••••• o •••••••• IJ • •• •• •
D TN SR DC T M- 27 -8 0- 19iv
Page
2
3
6
7
8
9
101213
1415
1624
26
5
11

8/3/2019 Waste Heat Boilers
http://slidepdf.com/reader/full/waste-heat-boilers 7/32
ABSTRACT
The effect of waste-heat-boiler weight and volume on
the performance of an LM2s00-based combined gas and
steam turbine sy stem (COGAS) is examined. The
boiler is a once-through type which is controlled to
extract the maximum heat from the gas turbine
exhaust and still maintain acceptable minimum walltemperature. At a gas turbine power of 12,000 hp
(8.9sMW), the boiler without feed-water heating can
produce sufficient steam to generate 2840 hp (2120kW) at a turbtne efficiency of 80%. This boiler,
including diffuser, weighs 19,300 lbs (8770 kg) and
has a gas side pressure drop of 9 in. H20 (2.2kPa). With feed-water heating, the steam power can
be increas ed to 4000 hp (2980 kH) with a boiler
weight of 38,300 lbs. (17,400 kg). The 24 and 33%
respective increases in powe r for these two systems
at cruise are translated to 15 and 20% improvement
in fuel consumption over the LM2500 gas turbine atthe higher power levels of the COGAS system. At the
lower power levels, both COGAS systems yield a 2 0%
improvement in fuel consumption over the basic gas
turbine.
INTRODUCTION
Gas turbines have made simple and compact power plants for combatants a
real:Lty. One shortcoming of the gas turbine is its possibly high fuel
consumption. The addition of a waste-heat boiler which extracts heatfrom the gas turbine exhaust gas to operate a bottoming Rankine cycle is
one uay to improve the fuel consumption. This combined gas and steamturb:Lne system (COGAS) is the easiest way of obtaining improved fuel
consumption, requiring only the development of an add-on steam system.The hasic performance of the gas turbine is affected only slightly by
the ndditional exhaust backpressure introduced by the waste-heatboLl e r , Although the steam system itself does not need fuel to producepower, it does add significantly to the volume and weight of the total
system. This paper examines the trade-off between wa s t.e=hea t=b o Ll .er
size and perfor~lnce. including the effect of feed-water heating. Feed-
water heating is necessary in some instances in order to avoid sulfuric-
acid condensation in the boiler. The su lfuric acid in the exhaust gasis produc ed from the sulfur in the fuel.
The vras te -heat; boiler utilized in this study is a once-through cross-
counterflow type. shown schematically in Figure 1. In this boiler, the
feed water is introduced at the gas outlet and is moved through the coreuntil it leaves the other end at the desired condition (superheat). The
stea~ntexit conditions are controlled by the feed-water flow rate. A lowwatel' flow rate produces high superheat, high minimum wall temperatures
and low heat recovery. This control feature is utilized in this study toproduce maximum heat recovery at an acceptably lower wall temperature.
D TN SR DC T M- 27 -8 0- 191

8/3/2019 Waste Heat Boilers
http://slidepdf.com/reader/full/waste-heat-boilers 8/32

8/3/2019 Waste Heat Boilers
http://slidepdf.com/reader/full/waste-heat-boilers 9/32
TEMPERATURE
T6
T2D
WATER-SIO~
SUPERHEATER I HIG~~~~:~ITY II I
I 1II 1--e
D.7
l ~I ~I ~ ~_.
lOW-QUALITY
BOILER
WATER-S IDE FLOW lE~GTH
Figure 2 - Boiler State-Point Designations
The calc ulation starts with the given gas-side temperatures and mass
flow (a function of assumed gas-turbine cruise conditions). With
assumed steam-side superheat and feed-water te mp e r atur es , the total heat
transfer and water/steam mass flow are calcul ated. Also calculated is
the heat transfer in eac h of the boiler sections. This heat transfer is
then converted to a heat-transfer area and . ultimately, a tubing length
from the known characteristics of the boiler tube bun dle. T he a nalysis
relies on the theoretical developments and heat-transfer data provided
by K ays a nd London [1]. T he bof.Le r + t u b Lng weight is then added to the
weights of the boiler casing, water, diffuser. and nozzle to yield a
total boiler weight. In this particular model. the core and casing
weights each represent approximately 1/3 of the total boiler weight.
See Figure 1 for identification of these components.
The gas-side pressure loss through the core is also calculated, based
upon the pressu re-loss coeffici_ent of the particular boiler-tubegeometry. Ad~ed to this loss are the diffuser and nozzle press ureLosse s , Also added is a 2 in. H
20 (0.5 kPa) pressure-loss allotment for
the remainder of the exhaust system. The diffuser is assumed to have a
r ec t.angu l ar cross-section; it diffuses the exhaust gas from the gasturblne exhaust exit to the inlet of the boiler. The combined length of
the diffuser and boiler is taken to be 8 feet (2.4m). If the diffuserinclude d-angle e xceeds 70 degrees, the overall height of the system is
doubled to 16 feet (4.9m). This is done to make the boiler system
c omp.atfb Le with ship deck-heights, which are approximately 8 feet(2.4m).
Wal l temperatures at various points in the boiler are also calc ulated.
One I)f the most important wall temperatures is located at the water
inlet of the economizer. This minimum temperature must be maintained
above the sulfur-acid dew point. In this study the limit was taken as
DTNSRDC TM-27-80-193

8/3/2019 Waste Heat Boilers
http://slidepdf.com/reader/full/waste-heat-boilers 10/32
\.
2750F (1350C), which is slightly above the dew point of the exhaust gas
produced by the LM2500 using fuel with 1% sulfur [2]. The standard Navymarine diesel fuel [3J, which is used in gas-turbine-powered combatants,can have a maximum sulfur content of 1%.
The ~ubes used in this boiler study are nominal 3/4 inch (1.9 cm)
diameter with nine fins per inch (3.5 fins per cm) and are arranged in a
staggered tube bank (see configuration CF-9.0S-3/4 J (a) in reference[1]). The condenser hot-well condition is 11S.70F (46.SoC),corresponding to a condenser pressure of 3 in. Hg (10 kPa). Without
feed-water heating, the condenser water is fed directly to the
economizer inlet. In other situations, heated-feed-water temperatureincrements are specified, and the steam flow needed for this feed-waterheating is extracted from the turbine at a specified extractionpressure. The steam-turbine power is also corrected for the portion ofthe extracted flow not expanded through the turbine.
The outputs of interest to the waste-heat-boiler sizing are primarilyboiler weight, steam power, boiler gas-side pressure drop, boiler height
and pinch point. Additional outputs are needed for the performanceevaluation over the entire load line of the COGAS system. These outputs
are total heat-transfer area, distribution of heat-transfer area over
the various boiler sections, norm.lized steam turbine flow rate,extraction fraction, boiler gas-side pressure-loss coefficient, boiler
frontal area, and steam/gas turbine speed ratio.
The performance of selected design cases over the entire power range iscalculated with a state-point matching technique. The model used for
this COGAS simulation was originally programmed for the LM2S00 gasturbine [4) and later modified for a COGAS system using a recirculatingwaste-heat boiler [5]. The method was further modified for the once-
through boiler used in this application. Improvements in the heat-
transfer-calculation procedures were also included. The steam-system-performance portion of the program is described in more detail in
Appendix B.
The performance of various components making up the system is calculated
as a function of the independent variables or state points. Theresulting conditions, such as mass flow and heat transport between
components, may not agree, giving rise to errors. The independent
variables are then iterated to minimize these errors. The gas-turbine
calculations are based mostly on tabulated data of the component
performance. The steam-system calculations are based on tabulated heat-transfer coefficients and parameters obtained from the above boiler-s izin g me th od .
The calculation method for the boiler performance is essentially the
inverse of the boiler-sizing method discussed above. Instead of sizing
a boiler (total heat-transfer area) for a particular performance and
certain gas-side input conditions, the program calculates the
performance for a given total heat-transfer area and gas-side input
conditions. The program also calculates the effect of flow rate on the
D TN SR DC T M- 27 -8 0- 19
4

8/3/2019 Waste Heat Boilers
http://slidepdf.com/reader/full/waste-heat-boilers 11/32
performance of the fixed-geometry steam turbine. The effect of turbine
speed and inlet pressure on turbine efficiency is include d. T he steam-
turatne speed is set by the gas-turbine speed through a fixed gear
ratio. The program can handle both the case without feed-_later heating
and the ca se w.lth feed-water heating by steam-turbine extraction. In
the latter case, the fraction of steam mass flow extracted an d the steam
tur c Lne inlet-to-extraction pressure ratio are held constant. Feed -
wat(~r temperature is then calcu lated from a heat balance on the feed-
wat,;!rheater.
The outputs of interest are the power generated by the steam turbine an d
the resultant system specific fuel consumption. The waste-heat boiler
conditions, especially the location of the various regions within'the
boiler, and the steam-turbine inlet conditions (mass flowJtemperature
an~ pressur e) are also of interest when trying to explain the resulting
rematching of the steam system.
RESULTS
Wa ste-He at-Boil er Sizing
For the purpose of sizing the waste-he at boiler, it is assumed that theeng..ne cruise conditions are of interest. After all, most of thesystem's operating time will be spent near this point. It is assumed
that: the cruise power level of the LM2S0 0 is 12) 000 hp (8.95 MI,J).
Add. tional engine condi tLons and nominal steam-cycl e conditions are
gLven in Table 1.
Table 1. Nominal Cr uise Conditions for the w'aste-Heat-Boiler Sizing
E ngi ne C on dition s
Power
Exhaust Mass F low
E xh au st T em pe ra tu re
Inlet LossI nl et T em pe ra tu reExhaust Gas Dew Point
12,000 hp
100 Ib!sec
796°F
4 in. H2 059°F27SoF
(8.95 MW)
(45.4 kg/s)
(42 4 °C )(1.a kPa)OSoC)
(J.3SoC)
Nominal Steam-Cy cle Conditions
S atu ra ti on P re ss ur e
S up er he at T em pe ra tu re
C ondens er P ressur e
E xtr ac tion P re ss ur e
S te am- Tu rb in e E ffic ie nc y
300 psLa
700°F
3 in. Hg
50 p sLa
0.80
(2.06 MFa)(371 DC)
(10.1 kPa)
(344 kPa)
Figere 3 shows the effect of the boiler gas-side temperature drop on the
wei~;ht of the boiler without feed-water heating. Elimination of the
f eec.-wate r heat e r was thought to be desirable be cause of the bulk and
weig;ht associated with it. The steam system will require an o n-d.Ln e
storage volume for the feed water. This might be handled b y an
ove r s Lzed condens er hot well.
D TN SR DC T M- 27 -8 0- 195
8/3/2019 Waste Heat Boilers
http://slidepdf.com/reader/full/waste-heat-boilers 12/32
Ibs kg
100.000
40.000
80,000
l-X
30,000!: ?w;:; 60,000
a: :w-'
isCD
,1 -20,000.
Z 40,000.; ,. . . .V). .:;
20,00010,000
o
BOILER GAS-SIDE STEAM TURB.
TEMP. DROP POWER
of (Co) hp (kW)
500 (278) 4,543 (3,387)
450 (250) 4,100 (3,057)
3,655 (2,725)
3,208 (2,392)
2,758 (2,057)
2,305 (1,719)
1,850 (1,380)
10 m25 20 25
40 80 120 280 ft260 200 240
WASTE-HEAT-BOILER FACE AREA
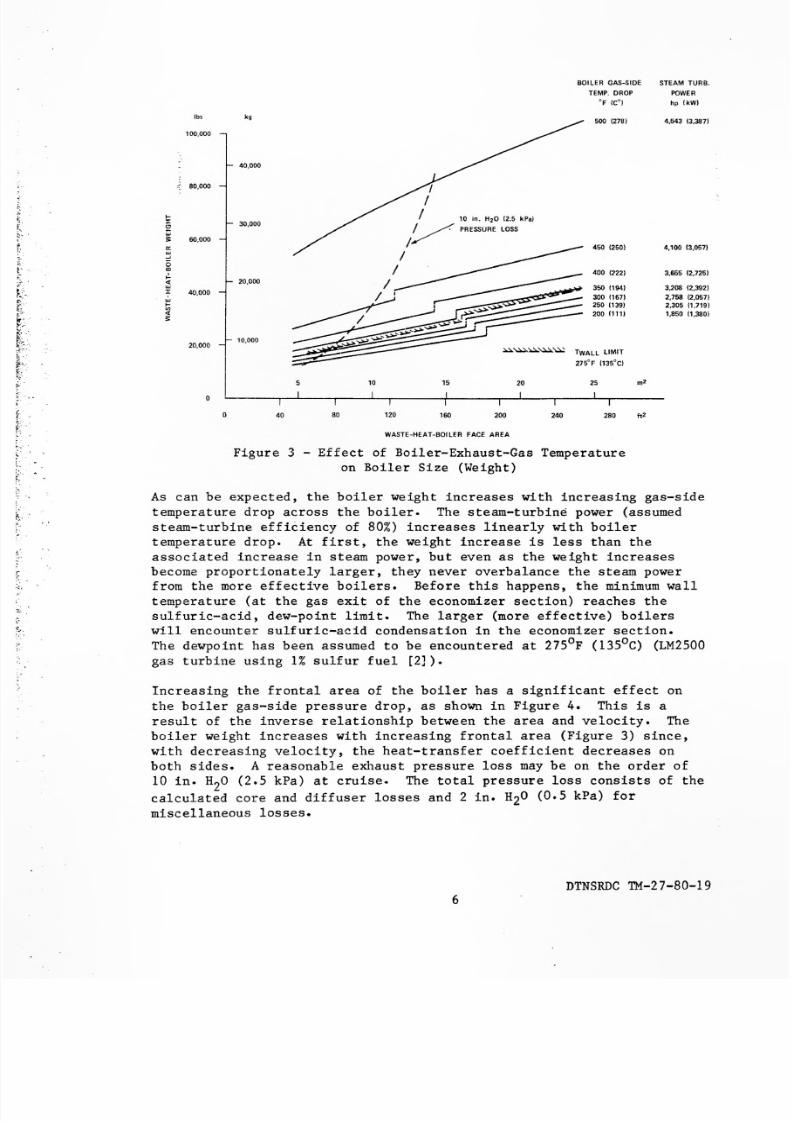
Figure 3 - Effect of Boiler-Exhaust-Gas T emperature
on Boiler Size (Weight)
As can b e expected, the boiler weight increas e s with increasing gas-side
temperature d rop across the boiler. T he steam-turbine power (assumed
steam-turbine efficiency of 80%) increa s es linear l y with boiler
temperature d rop_ At first, the weight increa s e is les s than the
as sociated incre a se in steam power, but even as the weight increas e s
b e come proportionately l arger, they never overbal a nc e the steam powerfrom the more effective boilers. B efore this happens, the minimum wall
temperature (at the gas exit of the economizer section) reach e s the
su lfuric-acid, dew-point limit. The l a rger (more effective) boilers
will encounter su lfuric-acid conden sation in the economizer section.
The dewpoint has bee n as s umed to be encountered at 27SoF (13SoC) (LM2500gas turbine using 1% s ulfur fuel [2J).
I n cr e asing the frontal are a of the boiler has a significant effect on
the boiler gas-side press ur e drop, as shown in Figure 4. This is a
re su lt of the inverse re l ationship between the are a an d velocity. The
boiler weight increa se s with increa sing frontal ar e a (Figure 3) since,
with decr ea sing velocity, the heat-transfer coefficient decr ea s es onboth sides. A r ea sonabl e exhaust pressur e loss may be on the order of10 in. H20 (2.5 kPa) at cruise. T he total press u re loss consists of the
cal cu l ated core an d diffuser losses an d 2 in. H20 (0.5 kPa) for
misc ell ane ous l oss es.
D T N S R D C TM-27-80-196

8/3/2019 Waste Heat Boilers
http://slidepdf.com/reader/full/waste-heat-boilers 13/32
25
400
12221
~;...I
W
0:
i;; 15
'"a:. ,~s"i ', _<t
~ 10
, _'"t;:
200
11111
300
11671
BOILER
GAS-SIDE
20 TEMP. DHOP.
of I'CI
10
OJ----- -.--L----.---_j--.------.L--- ~--~--_r-----L_r-------
15 20 20
40 80 120 160 zo o 240It?
280
WASTE-HEAT-BDILER FACE AREA
Figure 4 - Effect of Boiler-Exhaust-Gas Temperature on
Boiler Size (Press ure Drop)
The 10 in. H20 (2.5 kPa) pressur e-loss line is also shown on Figure 3.
To the right (larger frontal ar eas). the press ure loss is lower. At
Larg.er frontal area s, the angle of the diffuser exceeds 700 an d, asstat.ed b efore, it is then assumed that the overall height of the boiler
and diffuser increa ses from 8 feet to 16 feet. When this happens theweight of the diffuser increas es, a ccounting for the jump in weight seenin Figure 3. The more detrimental effect is the doubling of the boiler
vo L cme . The refore, it is of interest to select boiler configurations tothe left of the discontinuous cha nge in weight.
If cne stays within these three limitations: (1) pressure loss of lessthar..10 in. H
20, (2) boiler height of 8 ft (2.4 m) , a nd (3) wall
temperatures of more than 2750F (135°C), then the re coverable exhaustheat amoun ts to 2840 (2120) to 3020 hp (2250 HI), or less than 25% of
the as sumed LM2500 ga s-turb ine cru ise power level. Figure 3 showed thatadditional power could be extracted if a larger gas-side temperature
d rop across the boiler could be taken without exceeding the dew-point
temperature limit. The only way to obtain this additional powers in thecase of the once-through boiler, is to preheat the feed water.
DTNSRDC TM-27-80-197

8/3/2019 Waste Heat Boilers
http://slidepdf.com/reader/full/waste-heat-boilers 14/32
Ibs kg
100,000
40,000
80,000
30,000
60,000
20,000
40,000
, . : ; ; ; > " : ; ; ; >, . : ; ; ; >
...-~-';»: - ; > : > - » '
-.::»-,:-;:>...
_ . . . . . : ; : - - ; > : - - - ; ; ; > 1 ZERO PINCH-POINT LIMIT
:-_- ~,T"140'F 17S"CI
;>;--;;» - ; ; ;> /
//
/ / lain. H20 12.5 kPal
// PRESSURE LOSS
FEED WATER
"T, 'F lOCI
130 1721
120 167)
10,000
' " . ~ l L . -r---__ -.-_-110_.-- __ --,1r-5 -.----L20 __ .- __ 2,_5-, m
2
40 80 120 160 200 240 280 tt2
WASTE·HEAT·BOILER FACE AREA
Figure 5 - Effect of Feed- W ater He ating
Boiler Size (Weight)
on
Figure 5 shows the effect of feed-water he ating on boiler size as
various increments of feed-water he ating are provided. Again, theregion of interest is between the pressu r e loss of lOin. H20 (2.5 kPa)
and the discontinuous ch ange in weight. Initial increments in feed-water he ating result in very little gain in steam power. It can b e
s hown that the nominal feed-water temperature of 11S.7oF (46.SoC) is
near the minimum-heat-transfer level of a given size waste-heatboiler. From Appendix A, the following equation can be written for the
total heat transferre d a s a function of the feed water (TFEE D) and wall
( TW ) t em pe ra tu re s:
QTOT/(MC'CP) ; T6 - TW - (TW - TF E ED) (HI/HO) (AI/AO) (l/FE)
As the feed-water temperature incre a se s , the driving potential (TW-
T FE E D) decr ea s es , but the interna l h e at-transfer coefficient (HI)
increa s es . T h es e effects lea d to minimum heat transfe~ at a f~ed-watertemperature of approximately 1300F (54°C) for a 100 ft (9.3 m ) ·frontal
ar ea , s e e Figure 6. This does suggest that better waste-he at-boiler
configurations, utilizing different tube geometries, do exist for the
cas e of zero feed-water he ating. It also suggests that there a r edifferent optimum configurations for the cas es with and without feed-
wa ter h eating.
D TN SR DC T M- 27 -8 0- l98
8/3/2019 Waste Heat Boilers
http://slidepdf.com/reader/full/waste-heat-boilers 15/32
M Btu/hr MW
40
35
"
10
~ .25 ~
40 80
50 I 100 150 200
E CO NOM IZ ER IN LE T T EM PE RA TUR E
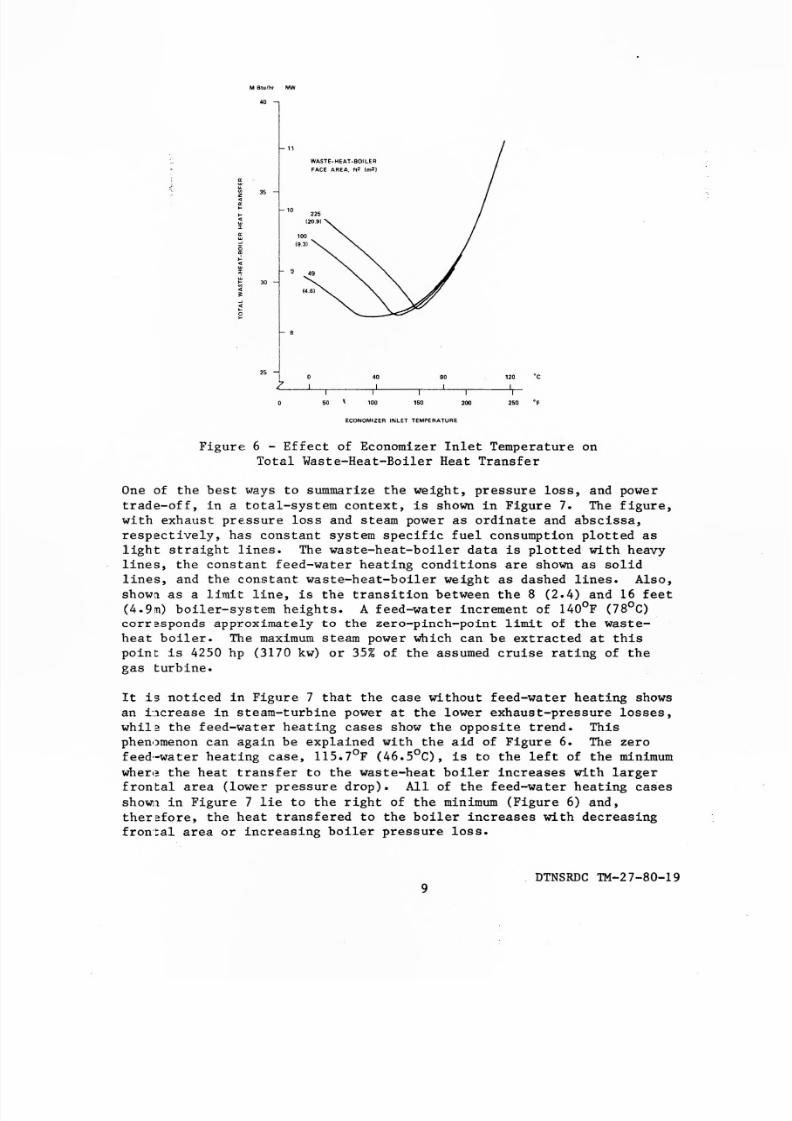
Figure 6 - Effect of Economizer Inlet Temperature on
Total Waste-Heat-Boiler Heat Tran sfer
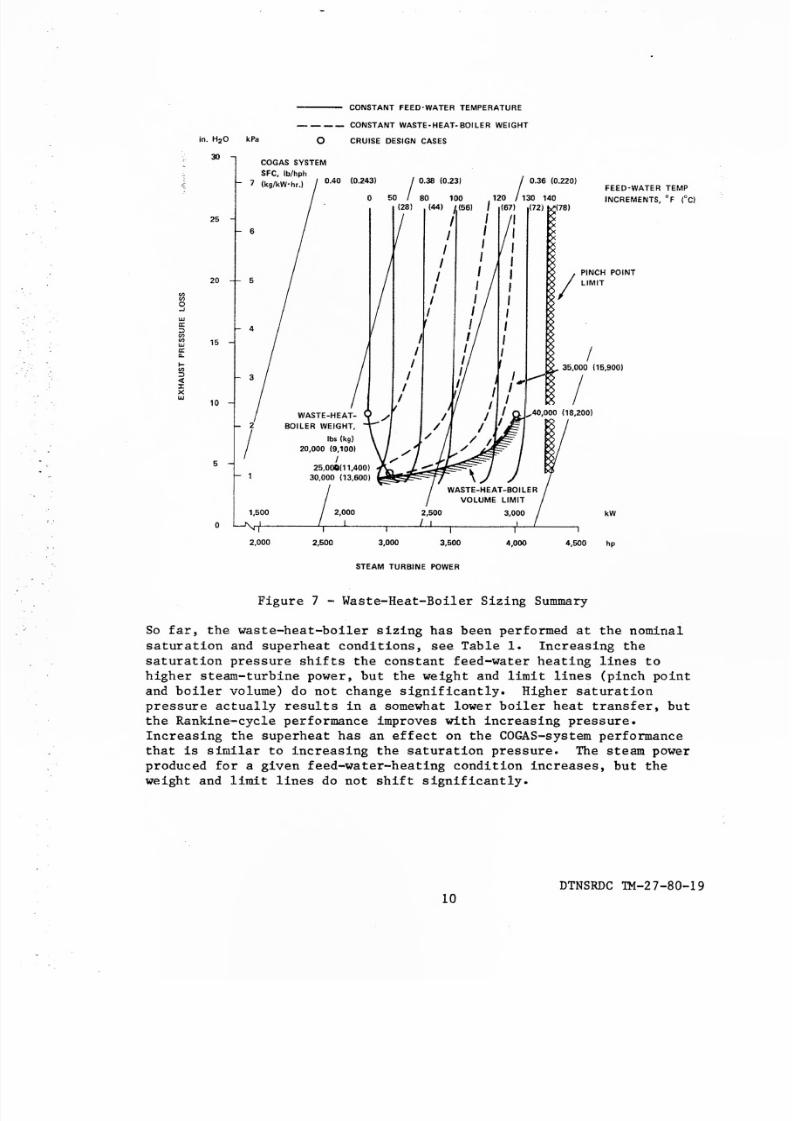
On e of the best ways to summarize the weight, press ur e loss, a n d power
trade -off, in a total-system context, is shown in Figure 7. Th e figure,
with exhaust pre.ssu r e loss an d steam power as ordinate and a bs cissa,
r espectively, ha s constant system specific fuel consumption plotted aslight straight lines. Th e waste-heat-boiler data is plotted with heavy
lines, the constant feed-water he ating conditions are s hown as solidlines, an d the constant waste-heat-boiler weight as dash e d lines. Al so,
shown as a li.mit line, is the transition between the S (2.4) an d 16 feet
(4.9m) boiler-sy stem heights. A feed-water increment of 1400F (7SoC)corr=sponds approximately to the zero-pinch-point limit of the waste-
he at boiler. T he maximum steam power which can b e extracted at thispoint is 4250 hp (3170 kw) or 35% of the assumed cr uise rating of the
gas turbine.
It is noticed in Figure 7 that the cas e without feed-water he ating shows
an La cr ea s e in steam-turbine power at the lower exhaus t-press ur e losses,whil~ the feed-water he ating cases s how the opposite trend. T his
phenomenon can again be explained with the aid of Figure 6. The zero
f eed-wa ter he ating case, 115.70F (46.50C), is to the left of the minimumwher,~ the heat transfer to the waste-he at boiler incre as e s with largerfrontal are a (lower press ur e d rop). All of the feed-water he ating case s
Sh O~l in Figure 7 lie to the right of the minimum (Figure 6) and,
therafore, the he at transfered to the boiler increa se s with decre a singfrontal ar ea or increa sing boiler press ur e loss.
DTNSRDCTM-27-S0-199
8/3/2019 Waste Heat Boilers
http://slidepdf.com/reader/full/waste-heat-boilers 16/32
CONSTANT FEED'WATER TEMPERATURE
---- CONSTANT WASTE·HEAT·BOILER WEIGHT
o CRUISE DESIGN CASES
30
5
SFC, Ib/hph
7 (kg/kW'hr.)0.40 (0.243)
COGAS SYSTEM
o /
0.38 (0.23)
50 80 100
(28) (44) ~ (56)
IIII
IIII
/
0.36 (0.220)
120 130 140
I(67) (72i (78)
FEED'WATER TEMPINCREMENTS, of (C)
WASTE-HEAT-
BOILER WEIGHT,
lb. (kg)
20,000 (9,100)
I
25,000(11,400) ')~~~t1~"\30,000 (13,600) I o !
IPINCH POINT
LIMIT
25
6
20
til
1 3...J
W
a::;)
tiltilW
a:0..
~
'"><t:x :Xw
15
10
/35,000 (15,900)
/
kW
o
2,000 2,500 3,000 3,500 4,000 4,500 hp
STEAM TURBINE POWER
Figure 7 - Waste-Heat-Boiler Sizing Summary
So far, the waste-heat-boiler sizing has been performed at the nominalsaturation and superheat conditions, see Table 1. Increasing thesaturation pressure shifts the constant feed-water heating lines tohigher steam-turbine power, but the weight and limit lines (pinch pointand boiler volume) do not change significantly. Higher saturationpressure actually results in a somewhat lower boiler heat transfer, butth e R an kin e- cy cle per for ma nc e impr oves with in cr eas in g pre ssu re .Increasing the superheat has an effect on the COGAS-system performance
that is similar to Lncr eas tng the saturation pressure. The steam powerproduced for a given feed-water-heating condition increases, but theweight and limit lines do not shift significantly.
DTNSRDC TM-27-80-1910

8/3/2019 Waste Heat Boilers
http://slidepdf.com/reader/full/waste-heat-boilers 17/32
Three different boiler sizes were selected from Figure 7 for further
analysis. The first (Case 1) is the lightest and smallest boiler
without feed-water heating, which weighs 19,300 lbs (8770 kg) and yields
a sys tem specific fuel consumption of 0.376 lb/hp-hr (0.229 kg/(kW.h))
(s ee Table 2). Even without feed-water heating, the specific fuel
conBumption can be improved by 1.5% to 0.370 (0.225) by accepting a
larger frontal area. This boiler (Case 2) weighs 9,300 lbs (4230 kg)
more than the minimum size boiler. More significant improvements can beobtained by accepting feed-water heating. Case 3 is a boiler which
reslllts in a 7.5% improvement in system specific fuel consumption over
the lightest case. It weighs 19,000 lbs (8640 kg) more than Case 1. It
shoul.d also be stated that the system weight will go up fur the r due to
the feed-water heating equipment and additional piping (which were not
sized for this study).
Table 2 - Waste-Heat-Boiler Summary
Design Cases
III 1 12 #3
Weight, l b s (kg) 19,300 (8770) 28,600 (13,000) 38,300 (17,400)
D iP .J .e n si on s , L ·W · H1 ft (m) 9 .0 • 9.0 • 8.0 13.0 • 13.0 • 8.0 10.6 • 10.6 • 8 . 0
(2.7 . 2 .7 • 2.4) (4.0 • 4.0 • 2.4) (3.2 • 3.2 • 2.4)
Heat Transfer Area, ft 2 (m 2) 13,200 (1230) 20,100 (1870) 36,600 (3400)
Cruise-Steam Power, hp (kW) 2840 (2120) 3020 (2250) 4000 (2980)
System SF C, Ib/hp-hr (kg/(kW.h) 0.376 (0.229) 0.370 (0.225) 0.350 (0.213)
Gas-side Pressure Loss, in. H2O (kPa) 9.1 (2.3) 4.3 (1.1 ) 9.5 (2.4)
S te am Fl ow R ate , lb /h r (kg/h ) 22,000 (10,000) 23,400 (10,600) 33,000 (15,000)
S at ur at io n P re ss ur e, ps ia (M Pa ) 30 0 (2.1) 30 0 (2.1) 30 0 (2.1)Superheat Temperature, O F (oe ) 700 (370) 700 (370) 700 (370)
F ul l P ow erSteam Power, hp (kW) 4460 (3320) 4510 (3360) 5870 (4380)
S ys te m S FC , l b/ hp -h r ( kg /( kW .h ) 0.327 (0.199) 0 .323 (0.196) 0.311 (0.189)
Gas-side Pressure Loss, in. H2O (kPa) 16.1 (4.0) 6.7 (1.7) 15.2 (3.8)
S te am F low Ra te , lb /h r (kg/h ) 38,300 (17,400) 35,500 (16,100) 58,300 (26,400)
Saturation Pressure, psia (MPa) 54 0 (3.7) 490 (3.4) 55 0 (3.7)
S up er he at T em pe ra tu re , O F (D C) 73 0 (390) 830 (440) 710 (380)
D TN SR DC T M-2 7-80-1 911

8/3/2019 Waste Heat Boilers
http://slidepdf.com/reader/full/waste-heat-boilers 18/32
C O GA S -S y st em P e rf or ma n ce
Figure 8 shows the specific fuel consumption of the COGAS system for thethree waste-heat-boiler cases discussed above and the baseline LM2500gas turbine. The specific fuel consumptions of the cruise design pointsare in agreement with the previous sizing results, Figure 7. At a givenpower level, the best COGAS case has 20% better fuel consumption than
the base gas turbine only. The improvement in fuel consumptiondecreases slightly with power. The lightest system (without feed-waterheating) has a 15% better fuel consumption in the mid-to-high powerrange than the base gas turbine. At low power, all of the design caseshave the same fuel consumption, a 20% improvement over the gas turbine.
Ih/hph kgI IkW-h I
0.5
0.8
0.4
\
\
\\\\\
\\
\-,-,<,
'-. LM-2500 GAS TURBINE
<,
- - _ - - _ - - _
o CRUISE DESIGN CONDITIONS
0.7
0.6
0.5t- 0.3
0.4 J
0.2
0.3
0
5,000 10,000 15,000 20,000 kW
5,000 10,000 15,000 20,000 25,000 30,000 hp
TOTAL POWER
Figure 8 - S pe cific F ue l C on su mption
D TN SR DC T M- 27 -8 0- 1912

8/3/2019 Waste Heat Boilers
http://slidepdf.com/reader/full/waste-heat-boilers 19/32
GAS TURBINE
,.. EXHAUST GAS
500 -. . . . -
. . . . . -. . . . . -
. . . . . -. . . . . -. . . . . -
. . . . . -/ CASE ".,
/"---~~----------~~~~~----------------~CASE~
TEMPERATURE
700
400
900
SUPERHEATTEMPERATURE
800
600
500
CASE #1 -'"' BOILER EXIT__=- ) GAS TEMP
_ _--::::...-
__ -- __ -- CASE #2 -
_ _--:::;--. .--- - - - - - - . - -»>: _ } SATURATION
_ - - _ - - CASE"., - / TEMP
__ - - CASE #2
.J__,.,;" _--~-'-'- --------- ~~
300
400
5,000 10,000 15,000 20,000 kW
300
5,000 10,000 15,000 20,000 25,000 30,000 hp
TOTAL POWER
Figure 9 - Waste-Heat-Boiler Temperatures
The performance of the steam system or the improvement of the fuel
consumption over the base gas turbine is a function of (1) the amount of
heat transferred in the waste-heat boiler and(2)
t he c on ve rs ionefficiency of the Rankine cycle. In sizing the waste-heat boiler,attention was focused on maximizing the heat transfer while maintaining
the minimum wall temperature. Case 3 allowed more heat to be extractedfrom the exhaust gas by preheating the feed water; this gave the better
performance at the cruise (mid-power) condition. Figure 9 shows theresulting lower boiler-exit-gas temperature of Case 3 in the mid-powerrange in comparison with the other two cases. At lower power levels,
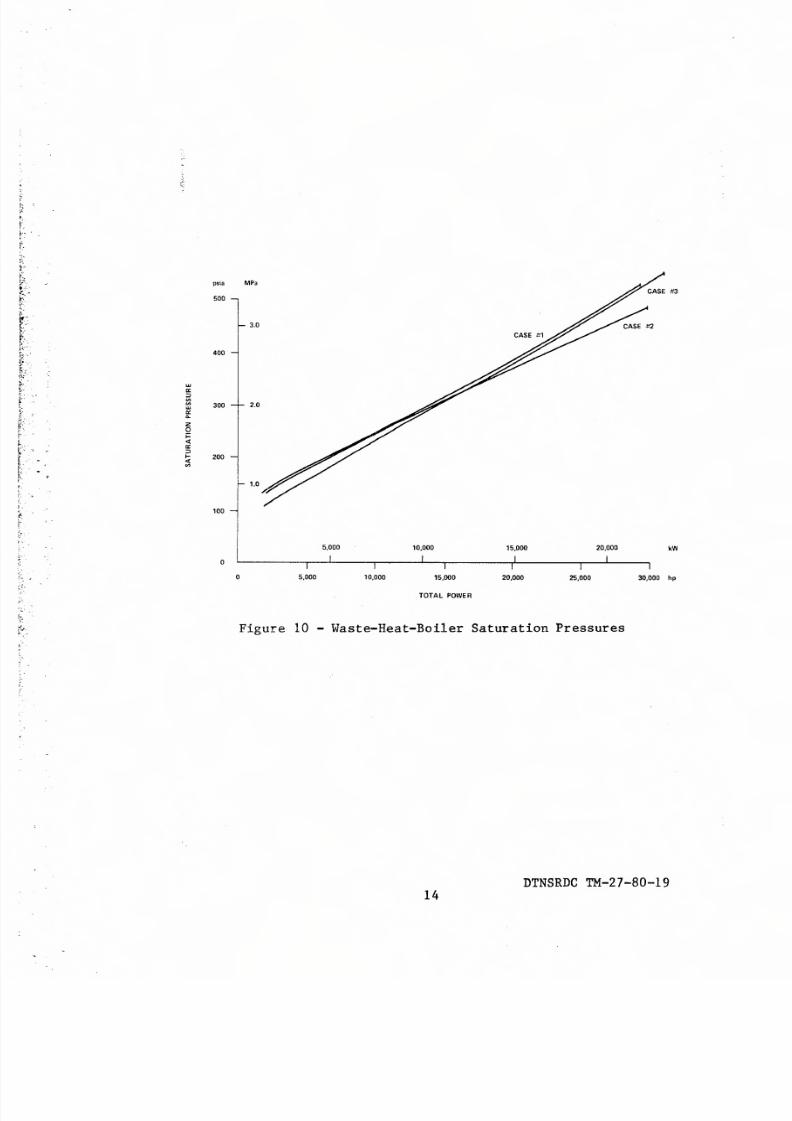
the Case 3 boiler still extracts more heat from the exhaust gas, but itsadvantage over the other cases is decreasing as power is reduced. This,coupled Tnth the lower pressures at which Case 3 operates, see Figure
10, accounts for its loss of performance advantage at low power, overthe other cases. The more rapid decrease in the saturation pressure of
Case 3 is a result of the economizer wall temperature limitation.Figure 11 shows the flow rate as a function of power level. Case 3 canpass significantly more water through the economizer in the mid-to-high
power range without running into dew-point problems. This is not thecase at lower power levels. The mass flow passing through the fixednozzle area of the steam turbine controls the steam-system pressure
lelTel.
DTNSRDC TM-27-80-1913
8/3/2019 Waste Heat Boilers
http://slidepdf.com/reader/full/waste-heat-boilers 20/32
wa:::J
'"'"a:c,
Z
0;::<ta:::J> -<t
'"
' 0 0 I L . - _ _5~ 0_00 ._-----1-0~ -00--._---------1 5L'0-00---------. 20~ ~_0_0 ~
. II .
20,000
psia M Pa
500
400
300
200
3.0
2.0
10
kW
5,000 10,000 15,000 25,000 30,000 hp
TOTAL POWER
Figure 10 - Waste-Heat-Boiler Saturation Pressures
D TN SR DC T M- 27 -8 0- 1914

8/3/2019 Waste Heat Boilers
http://slidepdf.com/reader/full/waste-heat-boilers 21/32
Ibl, kgls
/16.2 (7.4)
14
12
10
/.
/'/'
/",-
././
/"/'
/'/
////
//
2 /
WATER FLOW RATE
- - - GAS FLOW RATE 110.
kW
5,000 10,000 15,000 20,000 25,000 30,000 hp
TOTAL POWER
Figure 11 - Waste-Heat-Boiler Mass Flow Rates
Some additional observations about the steam conditions should be notedbefore concluding this paper. Figure 9' showed some rather severe'~ariations in superheat temperature. The Reynolds number on the'waterside in the ec onomizer section fa lls wi th in th e fl ow- tr an si tionregion. If a smoother correlation or tabulation were used for the heat-tr an sfe r c oe ffic ie nt, a s mooth er s upe rh ea t- te mpe ra tu re va ria tion wou ld·result. The important item is that in the transition region, the heat-tra nsfe r coefficien t d ecre ases some what fas ter with de crea Sing Rey nold s:lumber than it does in' the turbulent region. Therefore, the'pr opor tion ate ly l owe r h ea t- tr an sfe r c oe ffic ie nts a t l owe r powe rs a ll ow?roportionately larger mass flows without running into the sulfuric-,~cid-dew p oint problem. This effect is also seen in Figure 12, which
shows how the different boiler regions readjust with power level.:)esign-case 3 does not operate in the transition region, but it doesshow a significant increase in the superheater section at low power.The waste-heat boiler, in this case, is too large at the lower powerlevels. The other two cases would have shown the same behavior exceptthat the economizer sections operate in the transition region at thelower power levels.
DTNSRDC TM-27-80-1915

8/3/2019 Waste Heat Boilers
http://slidepdf.com/reader/full/waste-heat-boilers 22/32
1.0 .,-------------- _
SUPERHEATERCASE #3
0.8
CASE ;t1
CASE #2
0.6 -' CASE ;:1
~----- ------~7"-- -- --~~--/
- __ -- -_ =#2_----_-- -////
/ LOW-QUALITY CASE #3
EVAPORATOR
0.4
0.2
CASE # 1
CASE #2
HIGH-LOW QUALITY
EVAPORATQR SECTION
TRANSITION
5.000 10.000 15.000 20,000 kW
5,000 10,000 15,000 20,000 25,000 30,000 hp
TOTAL POWER
Figure 12 - Waste-Heat-Boiler Area Fractions
SUMMARY
For the particular application chosen, LM2s00 gas turbine operating at acruise rating of 12,000 hp (8.95 MW), the lightest boiler weighs 19,300lbs (8770 kg), producing sufficient steam to generate 2840 hp (2120 kW)at a turbine effiCiency of 80%. This same boiler is capable ofproducing 4460 hp (3320 kW) at the maximum rating of the gas turbine.
In this study the maximum rating of the engine was arbitrarily limitedto a power turbine inlet temperature of 14400F (782oC). The specificweight of this boiler is 4.3 lb/hp (2.6 kg/kW), based on the steam powerproduced at the maximum rating.
Feed water heating allows more heat to be extracted from the gas turbineexhaust before encountering the dew-point limitation. A boiler with13soF (7soC) feed-water-temperature increment is able to produce 4000 hp(2980 kW) at the cruise point and 5870 hp (4380 kW) at the maximumrating of the engine. This boiler weighs 38,300 lbs (17400 kg) or 6.5lb/hp (4.0 kg/kW). It should be remembered that this does not accountfor the weight of the feed-water heater and additional and larger steampiping. Additional steam power can be obtained, but the boiler weight
and volume increased dramatically beyond this point. For the specificcruise rating selected, the boiler can supply sufficient steam toproduce 4230 hp (3150 kW) at its zero-pinch-point limit.
DTNSRDC TM-27-80-1916

8/3/2019 Waste Heat Boilers
http://slidepdf.com/reader/full/waste-heat-boilers 23/32
The wall t~lperature at the economizer inlet can be maintained above theacid-dew-point limit by controlling the feed-water flow rate. In thecase without: feed-water heating, the velocities are sufficiently lowthat the heat-transfer coefficient is controlled by the transitionregime. This allows higher relative flow ratios to be maintained thanin:the case with feed water heating. The net result is comparableperformance at low power for the two cases. It might, therefore, not beadvantageous to go to the complexity of feed-water heating, and othermethod s of maintain ing re asonab le ec onomizer inle t temperature s whileextracting maximum heat from the gas turbine exhaust should be examined.
D TN SR DC T M- 27 -8 0- 1917

8/3/2019 Waste Heat Boilers
http://slidepdf.com/reader/full/waste-heat-boilers 24/32
REFERENCES
1. Kays, W. M. and A. L. London, Compact Heat Exchangers, McGraw-Hill,1964.
2. Petry, B. R., "Acid Dew-Point Determination for Gas Turbine, WasteHeat Recovery Units," DTNSRDC Report PAS-77-29, Mar 1978.
3. " "Fuel Oil, Diesel Marine," MIL SPEC MIL-F-16884F (3 Nov 1965).
1+ . Bowen, T. L., "Gas Turbine Simulation Technique for Ship PropulsionDynamic and Control Studies," Fifth Ship Control System Symposium,Annapolis, Md. 1978.
5. t. J'a tts ,. W., "Computer Simulation of a Proposed Marine COGASPropulsion System," SAE Preprint 790648.
6. Jakob, M., Heat Transfer, Vol. I, John Wiley and Sons, New York,1949.
7. Kern, D. Q., and A. D. Kraus, Extended Surface Heat Transfer,
McGraw-Hill Book Co., New York, 1972.
D TN SR DC T M- 27 -8 0- 1918

8/3/2019 Waste Heat Boilers
http://slidepdf.com/reader/full/waste-heat-boilers 25/32
APPENDIX A
W AS TE -H EA T- BO IL ER S IZ IN G
As stated before, the waste-heat boiler is composed of four sections ina (:r oss -c ou nte rfl ow a rra nge me nt. B es ide s th e c on ve ntion al ec on omize rand superheater sections, there is a split evaporator section. Thissp.i Lt _iisnecessitated by recognition of the radically different heat-transfer characteristics of the two boiling regions which exist withinthe evaporator. In the first part of evaporation, which has the lowerva por fr ac tion , n ucl ea te b oil in g pre domiI ). ateswh er ea s in th e h igh -va por -fraction region further downstream, the heat transfer is governed bymillt flow. The point of division between these two regions is taken tobe the location where the vapor quality reaches 70 percent.
T hE ! wa te r-s id e in pu t c on dition s (fe ed wa te r te mpe ratu re , s atur ationpressure and steam exit temperature) allow the calculation of theunknown state points on the water side. The gas-side input conditions(mass flow and inlet and outlet temperatures) allow the water mass-flowrate to be determined from an overall heat balance. Once the water flow
is known, the amount of heat transferred in each section of the boilercan be determined. By applying the definition of heat-exchangereffectiveness to each section" the area needed to transfer the heat canbe established from a trial-and-error solution for the number of heat-transfer units (NTU) and the calculation of the overall heat-transfercoef f LcLent, The sizing of the heat exchanger is completed byconverting the area to a corresponding number of passes and total tubelength. Other parameters of interest, such as gas-side pressure drop,wall temperatures, inlet diffuser size and pressure loss, and boiler anddiffuser weight are also calculated.
The steam tab Les are used to calculate the various enthalpies,densities, and temperatures needed at the inlet and outlet of each
boiler section. By employing the state-point notation given in Figure2, the enthalpy at the 70-percent-quality interface in the evaporatorcan be found from
H19X7 = HF19 + 0.7 (HG19 - HF19)
wher e HG19 and HF19 are the enthalpies of the saturated vapor andliquid, respectively. The gas-side energy equation defines the totalhes.t tr an sfe rr ed a s
QTOT = MG • CP (T6 - T9)
whE~re M G and CP are the mass flow and constant-pressure specific heat of
the gas, respectively, with CP evaluated at the average gastemperature. Once the total heat transfer is known, the mass flow onthe water-side can be found from
QTOT = M W [CPE (T19 - T18) + (HG19 - HFI9) + CPS (T20 - TI9)]
D TN SR DC T M- 27 -8 0- 1919

8/3/2019 Waste Heat Boilers
http://slidepdf.com/reader/full/waste-heat-boilers 26/32
where MW is the water mass flow, and CPE and CPS are the specific heatsof the water and steam, respectively, which are evaluated as averagesover their corresponding temperature ranges. The above terms for theheat load in the economizer and superheater were specifically chosenover the use of enthalpy differences because of compatibilityconsiderations encountered in a companion program for evaluating theboiler performance in a COGAS power cycle, described in Appendix B.
The above water flow rate canbalances, all of the unknownsections shown in Figure 2.energy equation is
now be used in determining, by heatend temperatures across the various boilerAs an example, the superheater water-side
QSHR = MW • CPS (T20 - T19)
and the gas-side energy equation is
QSHR = MG • CP (T6 - T7)
The above gas-side equation may then be solved for the unknown gas-exit
temperature T7 by iterating for the correct average value of CPo
The gas-side heat-transfer area A for each section of the boiler isfound by applying the effectiveness-NTU method. The heat-transfereffectiveness (s) of the section is first found from the generalrelation
s = Q/QMAX = Q/[CMIN • ~TMAX]
where CMIN is the smaller value of the two rate capaCities, MG • CP andMW • CPS. Now, it can be shown [1] that, for a given flow arrangement,there is a unique relationship between the NTU, the rate capacity ratio(CR), E, and the number of passes (PS) made by the water side.
NTU = (-PS) In {I + (I/CR) In [1 - CR(1 - ER1/PS)/(CR - ER1/PS)]}
whereER = (s • CR - 1)/(s - 1)
Since, initially, PS is unknown, the solution for the NTU is aniterative one. An analogous expression can be derived for the NTU in theboiling sections where CMAX is on the tube side. The resultingexpression simplifies since CR = 0, and the NTU is found to beindependent of PS. Once the value of the NTU is known, the heat-tr an sfe r a re a A can be found from the definition of NTU which is
NTU = U • A/CMIN
where U is the overall coefficient of heat transfer, the value of whichdepends on whether it is multiplied by the inside or outside value ofA. Since, in this heat-exchanger problem, the gas-side area isrequired, the value of U is also based on the gas side.
D TN SR DC T M- 27 -8 0- 1920

8/3/2019 Waste Heat Boilers
http://slidepdf.com/reader/full/waste-heat-boilers 27/32
ThE~ evaluation of D can be made by accounting for all of thecontributions to the thermal resistance between the two fluid paths.Thts leads to the relation for the gas-side D, which is
l/DO = (AD/AI) (l/RI) + (l/RO)(l/SE) + (ST/KW) + FF
whE~re;AD/AI is the ratio of the outside and Lns Ld e heat-transfer areas,respectively, no and HI are the outside and inside heat-transferc o erf f Lc Lent;s, respectively. SE is the thermal effectiveness of theoutside heat-transfer surface, ST is the boiler tube wall thickness, KW
is the thermal conductivity of the wall, and FF is an outside-surfacefouling factor. The heat-transfer coefficients are based on the averagepr oper tie s in each boiler section. The outside heat-transfercOE:fficient is based on the appropriate empirical correlation given inreference 1. This correlation is expressed in terms of the Colburnnumber for cross flow over various tabulated finned-tube geometries. Theim:ide heat-transfer coefficient used in the economizer, high-qualityboiler, and superheater is based on correlations found by Sieder andTate (6). This assumes that the heat transfer in the high-quality
boiler is controlled only by the vapor phase (as in the superheater).Correlations are available for handling all three flow regimes -laminar, semi-·turbulent, and fully turbulent flows. The heat-transfercoef f LcLerrt used in the low-quality boiler is based on a special boilingcorrelation, and the evaluation of surface effectiveness, SE, is basedon the assumption that the ratio of fin area to total heat-transfer areais sufficiently close to unity to permit replacement of SE with the fineffectiveness. The procedure for calculating fin effectiveness is basedon the exact solution for circular fins of rectangular cross section[7] •
One: o ther important parameter which is evaluated by the program is thewall temperature at the gas exit of the economizer. In sizing any
boiler, only those solutions which yield a wall temperature which isabcve the acid dew point of the gas are considered acceptable. Thesolution for the wall temperature is obtained by applying the thermalresistance law to each side of the economizer. By denoting the gasterr.peratureas T9, the water temperature by T18, and the walltemperature by TW, the governing relations for the total resistance oneach side can be written
RO l/(HO • AO • SE) + (FF/AO) = (T9 TW)/Q
T18) /QI = l/(HI • AI) + ST/(KW • AO) (TW
By combining the above equations, Q can be eliminated to give, aftersorr.erearrangemen t,
TW = [ST/KW + AD/CHI· AI») T9 + [l/(HO • SE) + FF] T18[1/ (HO • SE) + FF + ST/KW + ( AO /A I) (l /H I) ]
It should be noted that the denominator is lIDO and that all propertiesarE evaluated at the fluid temperatures T9 or TIB.
D TN SR DC T M- 27 -8 0- l921

8/3/2019 Waste Heat Boilers
http://slidepdf.com/reader/full/waste-heat-boilers 28/32
C al c ul ation of the steam-turbine power is bas ed on a turbine efficiency
of 80 perce nt. The e nthalpy out of the superhe ater of the boiler
(HG20), the isentropic expansion through the turbine to the conden se r
press u re (PCOND), and the steam flow rate (MW) form the basis for the
power cal cu l ation. Fee d-water he ating can a lso be han d le d b y the
program, in which ca s e the feed-water temperature (TI8) does not
correspond to the conden se r press u re (PCOND). Steam is extracted fromthe turbine at a specified press ur e (PEXTR) and u se d to preheat the feed
water. With these two pressur e s a nd the specified feed-water
temperature (TI8), an extraction fraction (EXTRF) of the steam-turbinemass flow is calc u lated from an ene rgy bala n ce ac ross the feed-water
he ater. This mass fraction is then applied as a correction to thes te am- tur bin e powe r c al cul ation.
D TN SR DC T M- 27 -8 0- I922

8/3/2019 Waste Heat Boilers
http://slidepdf.com/reader/full/waste-heat-boilers 29/32
APPENDIX B
C OG AS S TA TE ~P OI NT M AT CH IN G
A Newton-Raphson convergence technique is utilized to provide thenecessary state-point matching. The technique is relatively fast andeas LIy mod L f Lad , The particular program used here was originally set upfor tne LM2500 gas turbine [4] and then modified for an LM2500 COGAS
system with a recirculating boiler [5]. The program was again modifiedfor the once-through boiler configuration of interest in this study.
T he Ne wton-R aphson con ve rge nce tech nique requires the de fin ition ofindependent variables (state points), which are usually chosen toinclude those variables that can't be solved for explicitly. Figure 13shows the independent variables selected for this particular model. Thefirst eight variables are associated with the gas turbine. Thesevariables and the gas-turbine calculations have been describedpreviously. Ibe next five variables are associated with the steamportion of the system. Associated with the 13 independent variables isan equal number of error equations, which are usually obtained fromcOlltinuity considerations. The solution is obtained by perturbing the
iniependent variables one at a time to generate a matrix of the changein the error. The matrix is then inverted and applied to the absoluteerror to calculate new values of the independent variables which willdrive all the errors to zero. If the system of equations were linear,onty one iteration would be needed. Since the gas turbine and steamsy.s tem models are highly nonlinear, mu.l t. Lp. Leite ra tio ns a re n ee de d forcoave rge nce ,
Th,:!13 error equations used in this model are:
E1 = (P2 - P2A) /P2E2 = (HP C - H PTI )/HPCE3 (M GB - M G3)/M GBE4 - (MGT1 - MG4)/MGT1E5 (T4 - TB) / T4E6 = (MG T2 - MG 5)/MG T2E7 (HP L - H PTO T)/HP LE8 = (P9 - PO)/POE9 = (QH BI - QH BO )/QH BIE10 = (QL BI - QL BO) /QLBIEll (Tl8~T17)/T17E12 (TW - TWLIM) /TWLIME13 (MW20 - MW11)/MWll
The 13 independent variables are defined in Figure 13. The compressor-inlet pressure (P2) is calculated from the ambient pressure (PO) and theinlet pressure loss, which is a function of inlet mass flow. Thecalculations leading to the next six error equations have beenpr ervf.ous ly described for the LM2500 model [4]; the only difference isths.t th e powe r in err or- equation 7 is the stun of the gas and steamt ur bin e po we r.
D TN SR DC T M- 27 -8 0- 1923

8/3/2019 Waste Heat Boilers
http://slidepdf.com/reader/full/waste-heat-boilers 30/32
SYMBOLS
o I ND£PENOENT VAR IABLES
o F IXED CONDITIONS
ERROR < : > CALCULATED PARAMETERS
oERROR VARIABLES
ERROR
ERROR
ERROR
Figure 13 - Flow Chart for COCAS Interation Model
The exhaust backpressure on the gas turbine, P9, is calculated similarlyto the inlet loss, with the help of a loss coefficient which wasob ta in ed fr om th e wa ste -he at- boil er sizin g r ou tin e.
The variables for the last five error equations are a function of thewaste-heat-boiler performance, the flow through the steam turbine, and afeed-water~heater heat balance. The method used for this model isessentially the inverse of the boiler-sizing method described inAppendix A. In Appendix A, the boiler heat-transfer area was calculated
D TN SR DC T M- 27 -8 0- 1924
8/3/2019 Waste Heat Boilers
http://slidepdf.com/reader/full/waste-heat-boilers 31/32
as a func.tion o f known gas and water-side conditions. In the presentcase, the wate r=s Lde conditions are calculated for a known gas flow andtemperature at: the boiler inlet and a given total waste-heat boilerheat-transfer area. Although the total area of the boiler is constant,the distribution amongst the boiler sections will vary as boilercondi~ions change. To account for this, the boiler area fractions forthe superheater (XSH) and the high (XHB) and low (XLB) quality
evaporator s we re introduced as independent variables. The economizerarea fraction (XEC) is also known since the sum of the fractions isunity.
Based on known or assumed temperatures at the ends of each boilersection, the a verage external an d internal heat-tran sfer coefficients,overall heat transferred, NTU, and effectiveness can be calculated withthe same equations developed in Appendix A. In the superheater, theeffectiveness is then utilized to calculate the superheat temperature(120) and the gas temperature T7. Initially, guesses were made forthese temperatures to allow transport properties to be calculated. Inthe high and low-quality evaporator sections, only one effectiveness-te mpe ra tu re r e la tfon sh fp is a va il ab le
€ = (T7 - TP)/(T7 - T19)
This still leaves the heat balance in the high-quality-evaporatorunsatisfied, and, therefore, it becomes one of the error equations. Asimilar situation exists in the low-quality evaporator, resulting inanother heat-balance error equation. The economizer section is handledsimilarly to the superheater section, allowing T9 and T18 to becalculated from the two effectiveness equations. T9 does not have tomatch any other condition. T18 must match the feed-wat-er-heater outlettemperature (1'17),resulting in another error equation. The feed-waterheate r will bE ! dis cussed below.
The flow through the boiler is controlled by the feed-water pump. Abalance between the pump capability and the internal flow resistance ofthe boiler core could form another error equation. In the presentstudy, it is of interest to maximize the heat recovery without passingbelow the sulfur-acid dew point. Therefore, an error equation isincluded which controls the wall temperature at the gas exit of theeconomizer to the desired value.
The mass-flow continuity must be satisfied at the steam turbine. Thesteam turbine is a constant-area (no throttling) device. Therefore, themass flow into the turbine under choked-flow conditions, can be obtainedfrom
CHOKCN = MWll.JTll - 460: /Pll = constant
where CHOKCN is a function of area. The mass flow calculated from thisequation is used in the last error equation along with the independentva ria bl e M W2 0.
DTNSRDCTM-27-80-1925

8/3/2019 Waste Heat Boilers
http://slidepdf.com/reader/full/waste-heat-boilers 32/32
As mentioned before, the feed-water is preheated in order to extractmore heat from the exhaust gas without confronting the sulfur-acid, dew-p oin t pr ob le m. As shown in the steam-cycle schematic of Figure 14,theextraction port is located at a given stage of the steam turbine. Aportion of the steam is extracted at this point and does not passthrough the later stages of the turbine. The extraction port is ofconstant area, and the flow is choked; therefore, the fraction of theflow extracted (EXTRF) is constant. This fraction was initiallydete~ined in the sizing phase of the analysis. The enthalpy of thefeed water thus becomes
HI7 = HIS (1 - EXTRF) + ~GEXTR • EXTRF
where HGEXTR is the enthalpy of the steam at the extraction port. Thepressure at the extraction port is related to the inlet pressure by aconstant pressure ratio. The steam-turbine power, taking into accountthe extraction, is
HPSTRB 778/550 • ETA' MWII [(H20 - HGEXTRI)+ (1 - EXTRF) • (HGEXTRI - HI3I)]
where HI31 is the steam enthalpy which results from the isentropicexpansion from TIl, PII, to PI3.
GAS TURBINE
EXHAUST
Figure 14 - Steam-Cycle Schematic
D TN SR DC T M- 27 -8 0- 19