WASTE GENERATED AND TREATED IN EUROPE
139
8 EUROPEAN COMMISSION THEME 8 Environment and energy D E T A I L E D T A B L E S Waste generated and treated in Europe 2003 EDITION Data 1990-2001
Transcript of WASTE GENERATED AND TREATED IN EUROPE
8E U R O P E A NC O M M I S S I O N
THEME 8Environment and energyD
ET
AI
LE
D
TA
BL
ES
Waste generatedand treated inEurope
20
03
ED
ITIO
N
Data 1990-2001
A great deal of additional information on the European Union is available on the Internet.It can be accessed through the Europa server (http://europa.eu.int).
Luxembourg: Office for Official Publications of the European Communities, 2003
ISBN 92-894-6355-4
© European Communities, 2003
Europe Direct is a service to help you find answers to your questions about the European Union
New freephone number:
00 800 6 7 8 9 10 11
Waste generated and treated in Europe4
Acknowledgements:This publication was prepared under theresponsibility of Rainer Muthmann,Head of Unit E5, Environment and sustainabledevelopment, Eurostat
Publication editors:
Karin Jordan, EurostatChristian Heidorn, Eurostat
Consultants:
Marta de Medina RosalesThierry Leroy
National Statistical Institutes:
We would like to thank all the colleagues fromthe National Statistical Institutes that havecontributed with information.
Further information:
Karin JordanTel.:Fax:E-mail:
++ 352 4301 32308++ 352 4301 [email protected]
Christian HeidornTel.:Fax:E-mail:
++ 352 4301 35271++ 352 4301 [email protected]
The views expressed in this publication arethose of the authors and do not necessarilyreflect the opinion of the European Commission.
Waste generated and treated in Europe
Table of contents
Summary......................................................................................................................................... 6
1 Introduction.......................................................................................................................... 7
2 Total waste generated......................................................................................................... 82.1 Overview......................................................................................................................... 82.2 Breakdown by main sector ............................................................................................. 9
3 Industrial waste ................................................................................................................... 103.1 Industrial waste by country ............................................................................................. 103.2 Industrial waste by branch .............................................................................................. 12
4 Municipal Waste .................................................................................................................. 164.1 Amounts of municipal and household waste collected ................................................... 174.2 Composition of municipal waste ..................................................................................... 194.3 Type of collection of municipal waste ............................................................................. 214.4 Management of municipal waste: treatment and disposal ............................................. 23
5 Hazardous waste ................................................................................................................. 265.1 Generation of hazardous waste...................................................................................... 265.2 Management of hazardous waste: Treatment and disposal........................................... 29
6 Recycling and Packaging ................................................................................................... 326.1 Recycling ........................................................................................................................ 326.2 Packaging ....................................................................................................................... 34
Annex
List of figures ................................................................................................................................... 36
List of tables..................................................................................................................................... 38
Community Legislation .................................................................................................................... 39
Basel Convention, list of waste streams.......................................................................................... 41
Environment 2010, Our future, our choice....................................................................................... 42
Main elements of EU Waste Management Strategy ....................................................................... 43
Abbreviations and symbols.............................................................................................................. 45
Data tables and footnotes................................................................................................................ 46 ff
Waste generated and treated in Europe6
SUMMARY
The purpose of this publication is to offer a setof official European statistics on waste, whichare relevant for Community action on theenvironment, providing the basic data requiredfor the assessment of the environmental impactof waste generation and management.
After an introductory section describing thegeneral framework of the report, the statisticalsource and the methodology applied, resultsare presented in sections 2 to 6. Annexedtables include time series for Western Europe1,Eastern Europe Candidate Countries2 as wellas Malta and Cyprus. However, due to poordata availability, it has not been possible toshow a complete set for countries andindicators.
Section 2 deals with the total amounts ofwaste generated in Europe, broken down bymain sources: about 2.2 billion tons of wastehas been generated annually in Europebetween 1998 and 2001.
However, these 2.2 billion should not be takenindistinctly, as the management of agriculturalwaste (mostly biodegradable) for instance isnot at all equivalent to that of hazardous wasteproduced by the metal or chemical industries.The construction sector contributes the most towaste generation in Western and EasternEurope, followed by agriculture and by ‘miningand quarrying’ sectors. This information shouldnot be taken at face value, notably since thecountries interpret waste from agriculturedifferently.
Section 3 explains in more detail thegeneration of waste by manufacturing industry.The largest European waste producingindustries are the basic metal industries,followed by the food, beverages and tobaccoproducers and by the manufacturing of othernon-metallic mineral products.
Eastern Europe countries produced relativelymuch more industrial waste than WesternEurope: 953 kg per thousand € of value addedagainst 177 kg.
Overall structure of industry cannot explainsuch a high difference, given that thisdifference is also observed at the level of eachsector.
Municipal waste, presented in section 4, is thecategory of waste on which the bestinformation is collected. Data and figures showa tendency for the amounts of municipal wastegenerated to increase. Municipal wastegenerated by households was around 456 kgper capita in Western Europe and about 200 kgin Eastern Europe.
Separate collection of certain kinds of waste(packaging in particular) is growing, but thismethod of collection is not equally used amongthe countries: for instance, less than 5% ofmunicipal waste are collected separately inPortugal, but over 65% in Austria.
In 8 out of 18 Western European Countries,landfill continues to be a rather commonpractice but incineration is increasing and inrecent years recovery showed an importantincrease. In Eastern European CandidateCountries, landfill is the dominant way ofmanaging municipal waste and the onlymethod in Bulgaria, Cyprus, Lithuania,Romania and Slovakia.
Section 5 presents statistics on generation andmanagement of hazardous waste. A roughestimate shows that more than 36 milliontonnes of hazardous waste has beengenerated in Western Europe between 1997and 2001. In Eastern Europe, it has amountedmore than to 15 million tonnes.
Finally, section 6 relates to recycling andpackaging. Around 18% of municipal wastecollected in Western Europe has beencollected for recycling. On average, among fourselected packaging waste streams generated(paper, glass, plastics and metals), paperpacking is dominating (45%).
.
_____________________________________________________1 The EU-15 Countries, Norway, Iceland and Switzerland2 Bulgaria, Cyprus, Czech Republic, Estonia, Hungary, Latvia, Lithuania, Malta, Poland, Romania, Slovakia, Slovenia, Turkey.
Waste generated and treated in Europe 7
1 IntroductionDuring the last decades, waste generation hasbecome a serious problem for our highlyindustrialised societies. Waste volumes havepersistently grown faster than GDP.
The 6th Environmental Action Programme callsfor a number of inter-related measuresdesigned to reduce the environmental impactsof resource use in line with the ‘CommunityStrategy for a Sustainable Development’.
"Ensuring the sustainable management ofnatural resources and wastes" is one of thefour priority areas, which includes thedevelopment of a ‘Thematic Strategy on WasteRecycling’ and initiatives in the field of wasteprevention, notably proposals on Communitywaste prevention targets.
The proposed strategy on waste managementincludes a hierarchy of options in which primaryemphasis is laid on waste prevention, followedby promotion of recovery (recycling, re-use andenergy recovery) and lastly by optimisation offinal disposal methods3.
The improvement of waste management at EUlevel requires detailed information. Since 1988,international waste statistics are collectedthrough a questionnaire developed jointly byEurostat and the OECD (Questionnaire on theState of the Environment); this questionnaireconstitutes a prime source of information andavoids duplication of data collection for bothinstitutions.
This issue is the second publication made byEurostat on the generation and treatment ofwaste in Europe 4. The work carried out forthis publication has shown that it is still difficultto present a complete picture of wastemanagement. Data availability is not yetsatisfactory in many countries and theprovision of data according to nationaldefinitions and classifications may vary.Consequently, it is impossible to draw up acomparable set of data for the differentcountries at the time being. There is a strongneed to establish a more regular andharmonised system providing information onboth, the quantities of waste generated and onthe management facilities.
With the implementation of the Regulation onWaste Statistics it will be possible to build up amore complete picture on waste generationand treatment, not only in relation to the wholeeconomy but also at the different points of thewaste stream, including trans-bordermovements.
Eurostat did not carry out any estimations ofmissing data at national level. However, someaggregates have been estimated for WesternEurope as well as for the Candidate Countries.The data presented in the tables of thestatistical annex are figures provided by thenational authorities. Eurostat has checkedtheir accuracy and consistency in co-operationwith the OECD and the participating countries.For some countries, data has beensupplemented with figures from nationalpublications.
Waste statistics are not available at a regularfrequency. Data on waste generated bydifferent economic and industrial sectors are, ingeneral, the scarce.
An accurate estimation of the total wastequantities produced in Europe is not possible.Whenever they are provided, they should beinterpreted with care.
Waste, in this publication, refers to materialsthat are not prime products (i.e. productsproduced for the market) and that have to bedisposed of; the waste-producer has no furtheruse for his production process, transformationor consumption. Wastes may be generatedduring activities such as extraction of rawmaterials, processing of raw material intointermediate and final goods, consumption offinal products or during any other humanactivity. It is to be noted that residuals that arerecycled or reused at the place where theyhave been generated are excluded. Wastematerials that are directly discharged intoambient water or air5are also excluded.
_____________________________________________________3 See box on “Environment 2010: Our Future, our choice” in the annex.4 The EU-15 countries, the 13 Candidate Countries and Norway, Iceland and Switzerland.5 Definition used in the waste section of the joint Eurostat/OECD Questionnaire on the State of the Environment.
Waste generated and treated in Europe8
2 Total waste generated
Main findings:
o About 2.25 billion tons of waste has been generated in Western Europe between 1998and 2001 and 550 million in Eastern Europe Candidate Countries.
o Main sources of waste are agriculture and forestry (roughly 30% of total waste),construction (31% of total waste in Western Europe, 3% in Eastern Candidate Countries)and mining and quarrying (15% of total waste in Western Europe, 31% in CandidateCountries).
2.1 OverviewThis section aims at giving a global view of thequantities of waste generated in Europe.
According to some very crude estimates 6,some 2.25 billion tons of waste have beengenerated in the 18 Western Europeancountries (the 15 EU Member States,Switzerland, Iceland and Norway) between1998 and 2001. During the same time period,550 million tons of waste have been producedin the 13 Candidate Countries located inEastern Europe.
This overall aggregate includes wastegenerated by production as well asconsumption, i.e. it covers industrial andmunicipal waste. Industrial waste itself includeshazardous waste and waste destined forrecovery.
Households mainly generate municipal wasteat the consumption stage but also by theeconomic activities, the waste of which isgenerally collected with household waste andcannot be directly related to a specificeconomic sector (in general urban services).
Both types of waste, industrial and municipal,will be presented in more detail in separatesections.
It is recalled that those estimates should becarefully interpreted due to poor dataavailability (see Table 1 in annex) and touncertainties about their comparability. Inparticular, in some sectors (notably agricultureand construction) data show a very highvariability between countries, which may revealdifferences in the methodologies used formeasuring their waste.
_____________________________________________________6 Data presented in this section originate from replies to the 2002 Eurostat/OECD Questionnaire. However, as a lot of data are missing,especially in the production waste area, estimates had to be made. A method, based on value added growth, was used:• If waste data specific to a sector were provided at least for one year, a series was reconstituted by using sectoral value added
growth at constant prices, when available in New Cronos Eurostat database.• If sectoral value added data at constant prices were not available, corresponding value added at current prices was multiplied by the
GDP global deflator.• When no sectoral waste data was supplied, the other countries’ average was used.These assumptions have been used only for the assessment of the global waste total. No estimate for a specific country or sector ispresented in this report.
7 Bulgaria, Cyprus, Czech Republic, Estonia, Hungary, Latvia, Lithuania, Malta, Poland, Romania, Slovenia, Slovakia, Turkey
Waste generated and treated in Europe 9
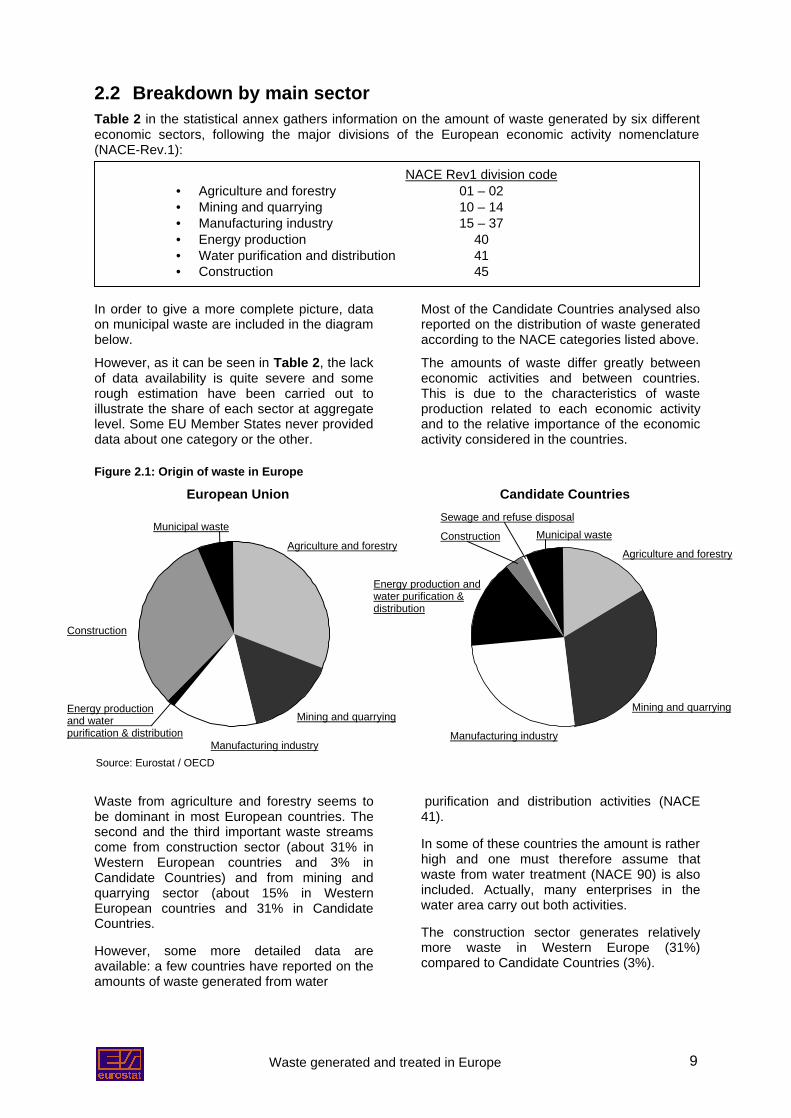
2.2 Breakdown by main sectorTable 2 in the statistical annex gathers information on the amount of waste generated by six differenteconomic sectors, following the major divisions of the European economic activity nomenclature(NACE-Rev.1):
In order to give a more complete picture, dataon municipal waste are included in the diagrambelow.
However, as it can be seen in Table 2, the lackof data availability is quite severe and somerough estimation have been carried out toillustrate the share of each sector at aggregatelevel. Some EU Member States never provideddata about one category or the other.
Most of the Candidate Countries analysed alsoreported on the distribution of waste generatedaccording to the NACE categories listed above.
The amounts of waste differ greatly betweeneconomic activities and between countries.This is due to the characteristics of wasteproduction related to each economic activityand to the relative importance of the economicactivity considered in the countries.
Figure 2.1: Origin of waste in Europe
European Union Candidate Countries
Waste from agriculture and forestry seems tobe dominant in most European countries. Thesecond and the third important waste streamscome from construction sector (about 31% inWestern European countries and 3% inCandidate Countries) and from mining andquarrying sector (about 15% in WesternEuropean countries and 31% in CandidateCountries.
However, some more detailed data areavailable: a few countries have reported on theamounts of waste generated from water
purification and distribution activities (NACE41).
In some of these countries the amount is ratherhigh and one must therefore assume thatwaste from water treatment (NACE 90) is alsoincluded. Actually, many enterprises in thewater area carry out both activities.
The construction sector generates relativelymore waste in Western Europe (31%)compared to Candidate Countries (3%).
Municipal waste
NACE Rev1 division code• Agriculture and forestry 01 – 02• Mining and quarrying 10 – 14• Manufacturing industry 15 – 37• Energy production 40• Water purification and distribution 41• Construction 45
Agriculture and forestryAgriculture and forestry
Mining and quarryingMining and quarrying
Manufacturing industryManufacturing industry
Construction
Sewage and refuse disposal
Energy production andwater purification &distribution
Municipal waste
Energy productionand water .purification & distribution
Construction
Source: Eurostat / OECD
Waste generated and treated in Europe10
3 Industrial waste
Main findings:
o For each thousand Euro of value added, manufacturing industry sectors produce onaverage 177 kg of waste in Western Europe and 953 kg of waste in Eastern EuropeanCandidate Countries.
o In Western Europe, the best performances are obtained by Germany, Denmark and Italy;the worst by Greece and Finland. Hungary, Slovenia and Turkey have similar levels ofindustrial waste in comparison with Western Europe.
o Basic metal industries, followed by the food, beverages and tobacco sector and by thewood and wood products sector seem to generate the largest amount of waste inEurope.
3.1 Industrial waste by countryTable 3 in the annex provides an overview of the waste generated by different branches of themanufacturing industry. These branches correspond to the following NACE codes:
Branch NACE code- Food, beverages, tobacco industry 15-16- Textile industries 17-18- Leather industries 19- Wood and wood products 20- Paper and paper products 21- Printing and publishing 22- Chemical industries 24- Rubber and plastics 25- Refineries, etc. : 23- Non-metallic mineral products 26- Basic metal industries 27- Fabricated metal products, machinery,
electrical, optical and transport equipment28-35
- Other manufacturing industries 36-37
Note that Table 11 gives the same details asTable 3 but relates to hazardous waste. Due topoor data availability, hazardous wastegenerated by sector will not be analysed. Datafor describing the generation of waste byselected streams also do exist (c.f. Table 4) butare rather incomplete. In this edition, forproduction sectors, the volume of waste isexpressed as a ratio of waste per value added,instead of a ratio per capita as compared to theformer publication. Although the coverage of
value added may not be completely in line withthe coverage of waste streams, in acomparison between countries, this indicator isless influenced by the overall structure of thecountries than the ratio per capita: for instancethe ratio per capita is sensitive to demographicelements such as the ratio labour force/ totalpopulation. However, when aggregatingdifferent sectors, the indicator calculated uponthe added value remains sensitive to theindustrial structure of the country.
Waste generated and treated in Europe 11
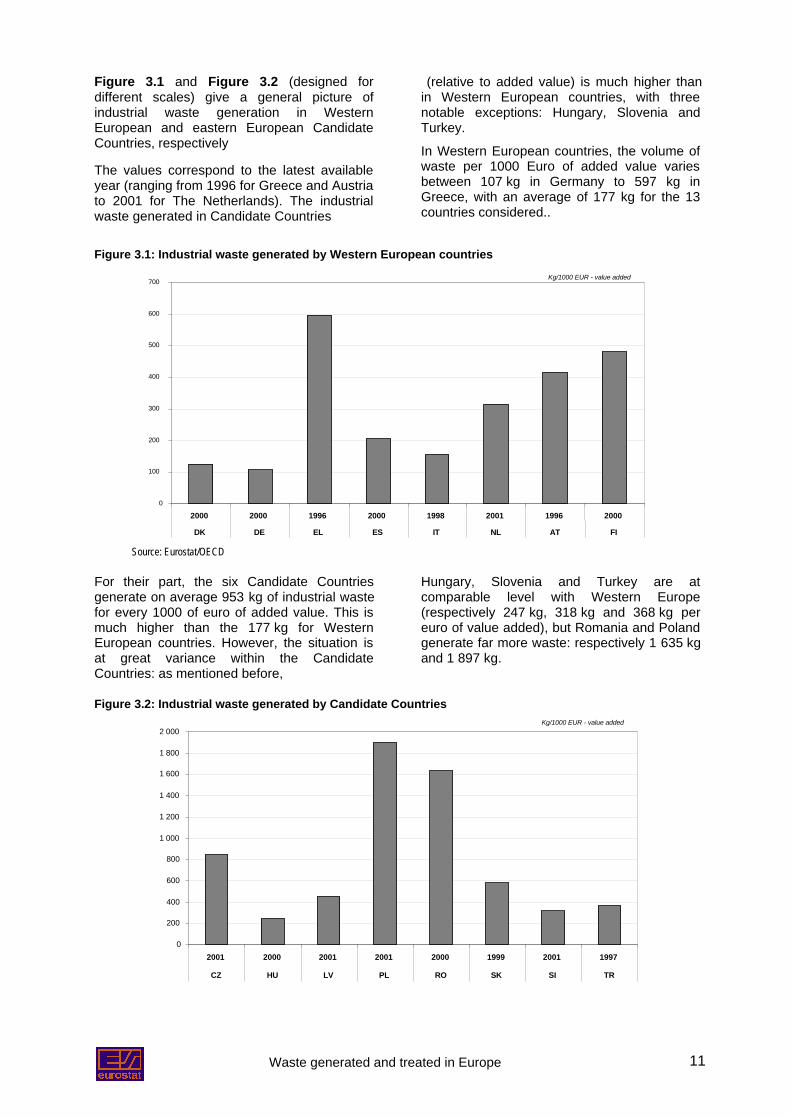
Figure 3.1 and Figure 3.2 (designed fordifferent scales) give a general picture ofindustrial waste generation in WesternEuropean and eastern European CandidateCountries, respectively
The values correspond to the latest availableyear (ranging from 1996 for Greece and Austriato 2001 for The Netherlands). The industrialwaste generated in Candidate Countries
(relative to added value) is much higher thanin Western European countries, with threenotable exceptions: Hungary, Slovenia andTurkey.
In Western European countries, the volume ofwaste per 1000 Euro of added value variesbetween 107 kg in Germany to 597 kg inGreece, with an average of 177 kg for the 13countries considered..
Figure 3.1: Industrial waste generated by Western European countries
0
100
200
300
400
500
600
700
2000 2000 1996 2000 1998 2001 1996 2000
DK DE EL ES IT NL AT FI
Kg/1000 EUR - value added
Source: Eurostat/OECD
For their part, the six Candidate Countriesgenerate on average 953 kg of industrial wastefor every 1000 of euro of added value. This ismuch higher than the 177 kg for WesternEuropean countries. However, the situation isat great variance within the CandidateCountries: as mentioned before,
Hungary, Slovenia and Turkey are atcomparable level with Western Europe(respectively 247 kg, 318 kg and 368 kg pereuro of value added), but Romania and Polandgenerate far more waste: respectively 1 635 kgand 1 897 kg.
Figure 3.2: Industrial waste generated by Candidate CountriesKg/1000 EUR - value added
0
200
400
600
800
1 000
1 200
1 400
1 600
1 800
2 000
2001 2000 2001 2001 2000 1999 2001 1997
CZ HU LV PL RO SK SI TR
Waste generated and treated in Europe12
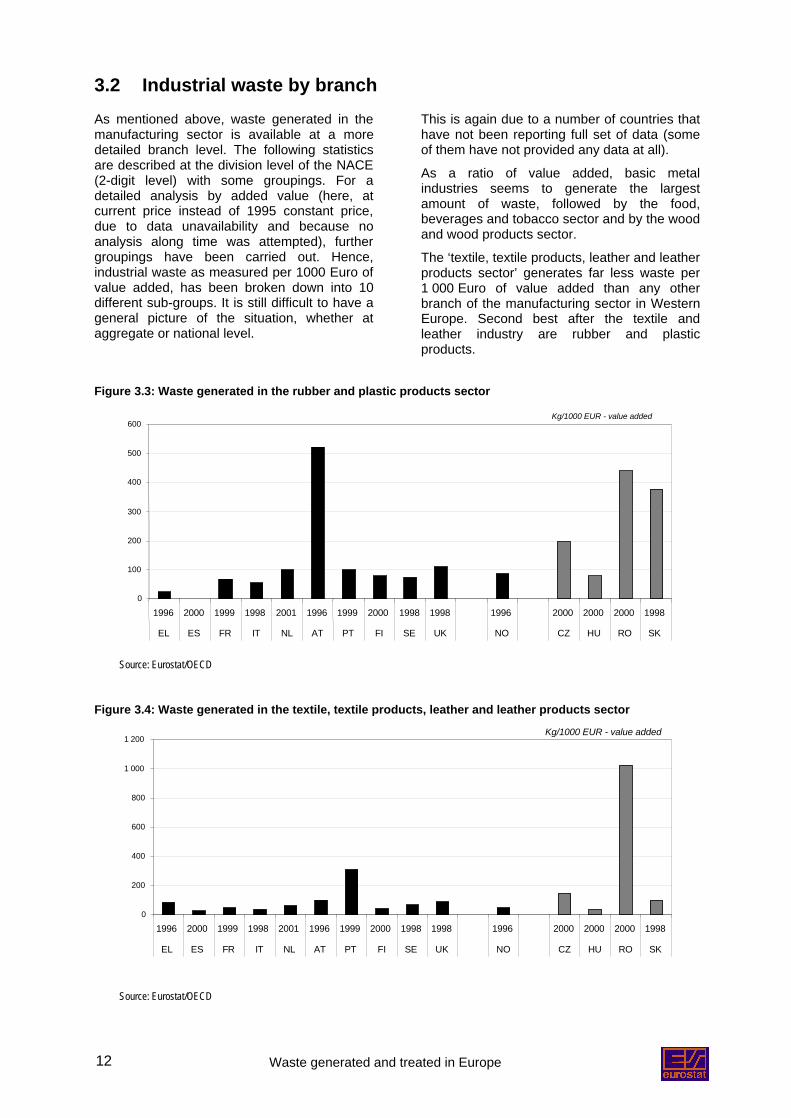
3.2 Industrial waste by branchAs mentioned above, waste generated in themanufacturing sector is available at a moredetailed branch level. The following statisticsare described at the division level of the NACE(2-digit level) with some groupings. For adetailed analysis by added value (here, atcurrent price instead of 1995 constant price,due to data unavailability and because noanalysis along time was attempted), furthergroupings have been carried out. Hence,industrial waste as measured per 1000 Euro ofvalue added, has been broken down into 10different sub-groups. It is still difficult to have ageneral picture of the situation, whether ataggregate or national level.
This is again due to a number of countries thathave not been reporting full set of data (someof them have not provided any data at all).
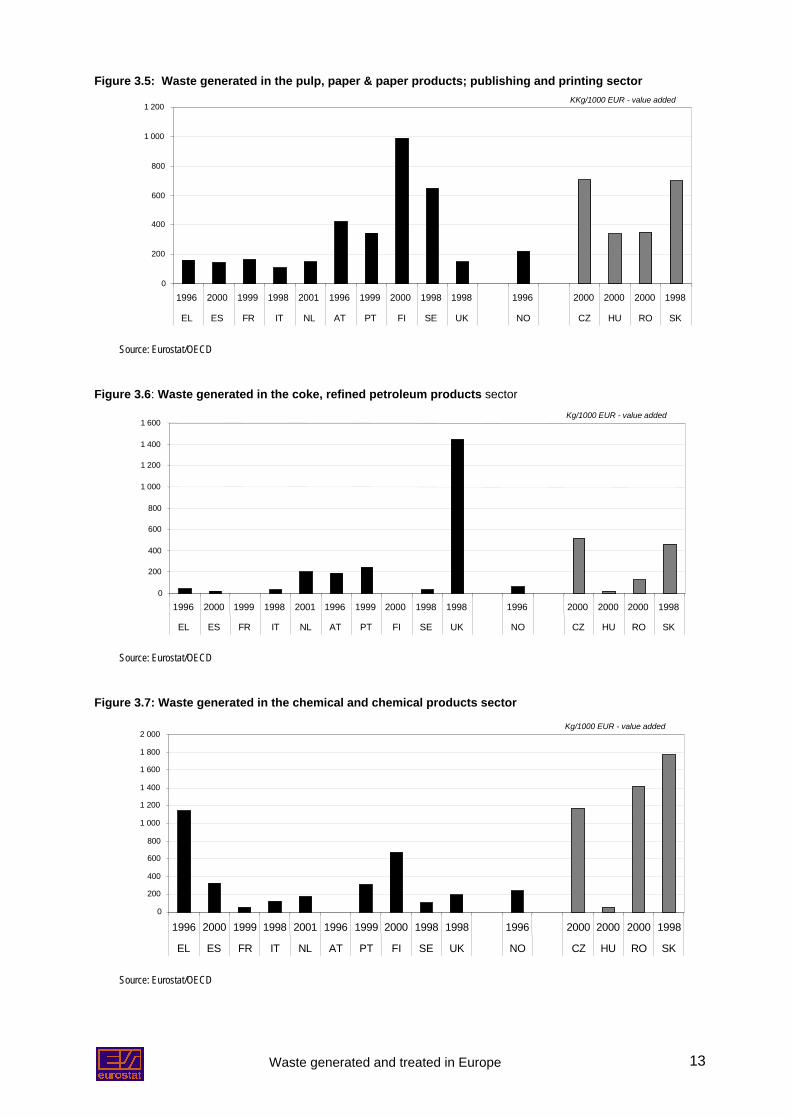
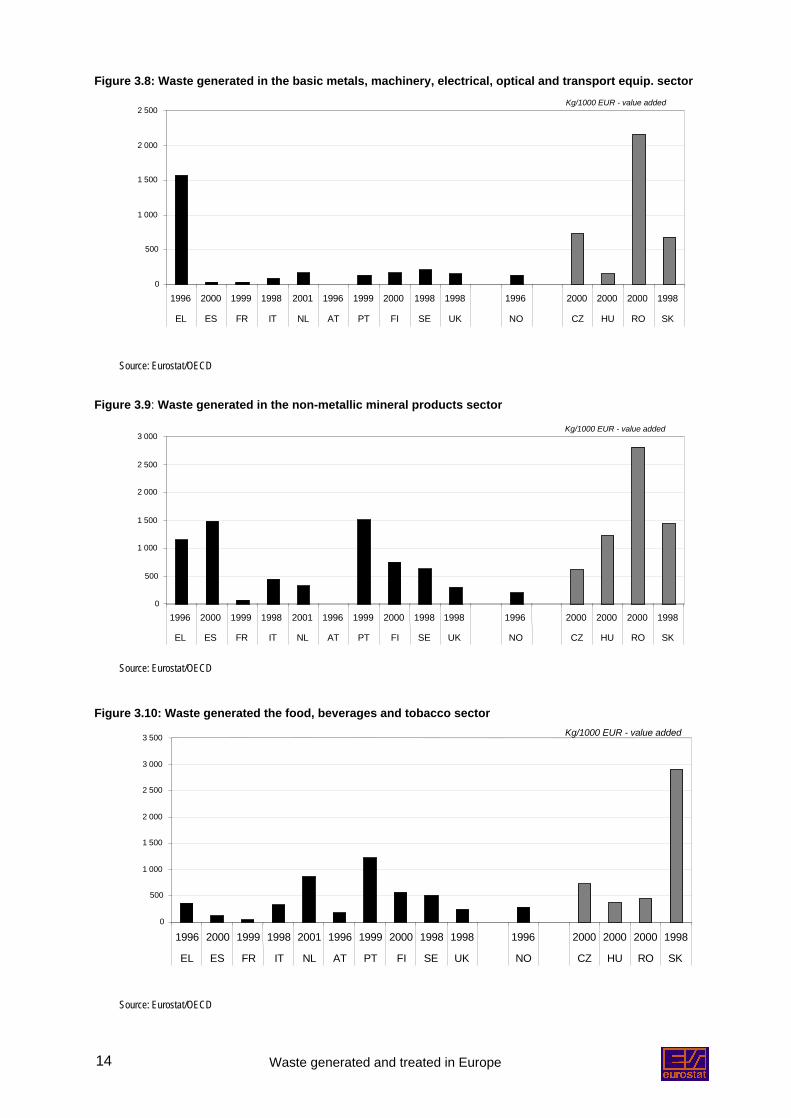
As a ratio of value added, basic metalindustries seems to generate the largestamount of waste, followed by the food,beverages and tobacco sector and by the woodand wood products sector.
The ‘textile, textile products, leather and leatherproducts sector’ generates far less waste per1 000 Euro of value added than any otherbranch of the manufacturing sector in WesternEurope. Second best after the textile andleather industry are rubber and plasticproducts.
Figure 3.3: Waste generated in the rubber and plastic products sector
0
100
200
300
400
500
600
1996 2000 1999 1998 2001 1996 1999 2000 1998 1998 1996 2000 2000 2000 1998
EL ES FR IT NL AT PT FI SE UK NO CZ HU RO SK
Kg/1000 EUR - value added
Source: Eurostat/OECD
Figure 3.4: Waste generated in the textile, textile products, leather and leather products sector
0
200
400
600
800
1 000
1 200
1996 2000 1999 1998 2001 1996 1999 2000 1998 1998 1996 2000 2000 2000 1998
EL ES FR IT NL AT PT FI SE UK NO CZ HU RO SK
Kg/1000 EUR - value added
Source: Eurostat/OECD
Waste generated and treated in Europe 13
Figure 3.5: Waste generated in the pulp, paper & paper products; publishing and printing sector
0
200
400
600
800
1 000
1 200
1996 2000 1999 1998 2001 1996 1999 2000 1998 1998 1996 2000 2000 2000 1998
EL ES FR IT NL AT PT FI SE UK NO CZ HU RO SK
KKg/1000 EUR - value added
Source: Eurostat/OECD
Figure 3.6: Waste generated in the coke, refined petroleum products sector
0
200
400
600
800
1 000
1 200
1 400
1 600
1996 2000 1999 1998 2001 1996 1999 2000 1998 1998 1996 2000 2000 2000 1998
EL ES FR IT NL AT PT FI SE UK NO CZ HU RO SK
Kg/1000 EUR - value added
Source: Eurostat/OECD
Figure 3.7: Waste generated in the chemical and chemical products sector
0
200
400
600
800
1 000
1 200
1 400
1 600
1 800
2 000
1996 2000 1999 1998 2001 1996 1999 2000 1998 1998 1996 2000 2000 2000 1998
EL ES FR IT NL AT PT FI SE UK NO CZ HU RO SK
Kg/1000 EUR - value added
Source: Eurostat/OECD
Waste generated and treated in Europe14
Figure 3.8: Waste generated in the basic metals, machinery, electrical, optical and transport equip. sector
0
500
1 000
1 500
2 000
2 500
1996 2000 1999 1998 2001 1996 1999 2000 1998 1998 1996 2000 2000 2000 1998
EL ES FR IT NL AT PT FI SE UK NO CZ HU RO SK
Kg/1000 EUR - value added
Source: Eurostat/OECD
Figure 3.9: Waste generated in the non-metallic mineral products sector
0
500
1 000
1 500
2 000
2 500
3 000
1996 2000 1999 1998 2001 1996 1999 2000 1998 1998 1996 2000 2000 2000 1998
EL ES FR IT NL AT PT FI SE UK NO CZ HU RO SK
Kg/1000 EUR - value added
Source: Eurostat/OECD
Figure 3.10: Waste generated the food, beverages and tobacco sector
0
500
1 000
1 500
2 000
2 500
3 000
3 500
1996 2000 1999 1998 2001 1996 1999 2000 1998 1998 1996 2000 2000 2000 1998
EL ES FR IT NL AT PT FI SE UK NO CZ HU RO SK
Kg/1000 EUR - value added
Source: Eurostat/OECD
Waste generated and treated in Europe 15
Figure 3.11: Waste generated in the wood and wood products sector
0
500
1 000
1 500
2 000
2 500
3 000
3 500
4 000
4 500
1996 2000 1999 1998 2001 1996 1999 2000 1998 1998 1996 2000 2000 2000 1998
EL ES FR IT NL AT PT FI SE UK NO CZ HU RO SK
Kg/1000 EUR - value added
Source: Eurostat/OECD
Figure 3.12: Waste generated in the manufacturing non-elsewhere comprised (n.e.c) sector
0
1 000
2 000
3 000
4 000
5 000
6 000
7 000
1996 2000 1999 1998 2001 1996 1999 2000 1998 1998 1996 2000 2000 2000 1998
EL ES FR IT NL AT PT FI SE UK NO CZ HU RO SK
Kg/1000 EUR - value added
Source: Eurostat/OECD
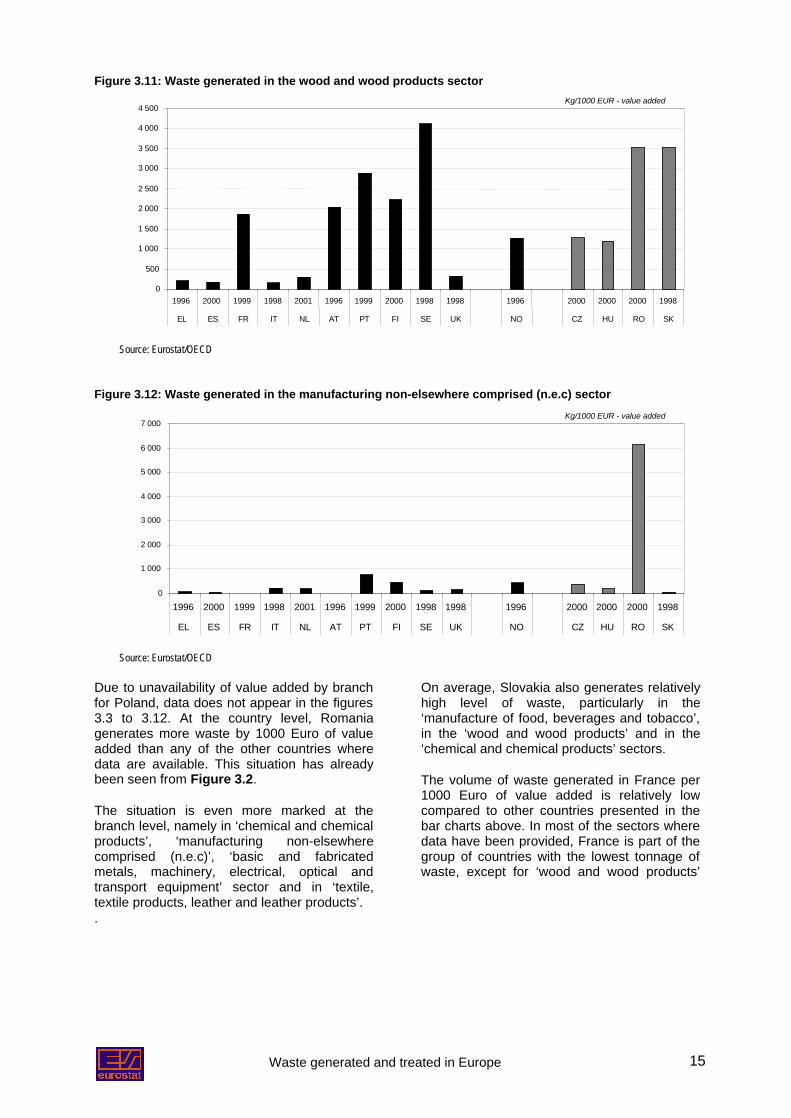
Due to unavailability of value added by branchfor Poland, data does not appear in the figures3.3 to 3.12. At the country level, Romaniagenerates more waste by 1000 Euro of valueadded than any of the other countries wheredata are available. This situation has alreadybeen seen from Figure 3.2.
The situation is even more marked at thebranch level, namely in ‘chemical and chemicalproducts’, ‘manufacturing non-elsewherecomprised (n.e.c)’, ‘basic and fabricatedmetals, machinery, electrical, optical andtransport equipment’ sector and in ‘textile,textile products, leather and leather products’.
On average, Slovakia also generates relativelyhigh level of waste, particularly in the‘manufacture of food, beverages and tobacco’,in the ‘wood and wood products’ and in the‘chemical and chemical products’ sectors.
The volume of waste generated in France per1000 Euro of value added is relatively lowcompared to other countries presented in thebar charts above. In most of the sectors wheredata have been provided, France is part of thegroup of countries with the lowest tonnage ofwaste, except for ‘wood and wood products’
.
Waste generated and treated in Europe16
4 Municipal Waste
Main findings:
o Some 550 kg of municipal waste were generated per capita per annum in WesternEurope between 1998 and 2001, of which 456 kg were generated by households.
o In the Candidate Countries, these figures respectively amounted to around 358 kg formunicipal waste and to 200 kg for household waste.
o In Western Europe, on average, municipal waste mainly consisted in organic materials(27%) and paper products (26%).
o The share of separately collected waste globally increased, but remained highly variableamong countries and among materials.
o Landfill was the dominating method of management in 8 out of 18 Western EuropeanCountries and in all Candidate Countries.
Municipal waste is a traditional domain inwaste management and is therefore thecategory for which most reliable data isavailable, both from the point of view ofquantity and quality. Nevertheless, thereremain gaps preventing the establishment of adetailed picture of the existing situation for thewhole of Europe.
This report is based on data collected throughthe joint Eurostat/OECD questionnaire on thestate of the environment where municipalwaste is defined as waste collected by or onbehalf of municipalities. These generallyoriginate from households, commerce andtrade, small businesses, office buildings andinstitutions such as schools, hospitals,government buildings, etc. If managed aswaste, waste from selected municipal services,i.e. waste from parks and garden maintenance,from street cleaning services (streetsweepings, content of litter containers, marketcleansing, …) are also included. Waste aregenerally collected by door-to-door throughtraditional collection (mixed household waste)or collected separately for recovery operations(door-to-door collection / voluntary deposits).The definition also relates to waste collecteddirectly by the private sector (business orprivate non-profit institutions) not on behalf ofmunicipalities or those originating form ruralareas not served by regular waste service,even though they are disposed of by thegenerator. However, it excludes waste frommunicipal sewage network and treatment andmunicipal construction and demolition waste.
When interpreting the figures, it should be keptin mind that the countries, when filling in thequestionnaire, do not uniformly apply thisdefinition; consequently this leads to some datainconsistencies and makes cross-countrycomparisons problematic8. Taking into accountthe above-mentioned imperfections, it can beestimated that the total yearly amount ofmunicipal waste collected in Western Europeaccounted for over 210 million tonnes between1998 and 2001, i.e. a yearly average of some550 kg per capita. In the same line, in theCandidate Countries municipal wasteamounted to 60 million tonnes, an average ofnearly 358 kg per inhabitant. All in all,municipal waste in these two groups ofcountries summed to around 275 million tonnes(about 510 kg per capita).
Based on some very rough estimations, theshare of waste generated by households intotal municipal waste collected is about 82%between 1998 and 2001, i.e. Western-European households have generated some170 million tonnes of waste collected by or onbehalf of municipalities, an approximateaverage of 456 kg per capita. As for theCandidate Countries, the total amount ofhousehold waste managed by municipalities isestimated to 45 million tonnes (200 kg perinhabitant). The following section shows trendson municipal and household waste generated,the composition of waste, as well as thetreatment and disposal methods used._____________________________________________________8 Cf. “Household and municipal waste: Comparability ofdata in EEA member countries”, European Topic Centre onWaste (European Environment Agency), April 2000
Waste generated and treated in Europe 17
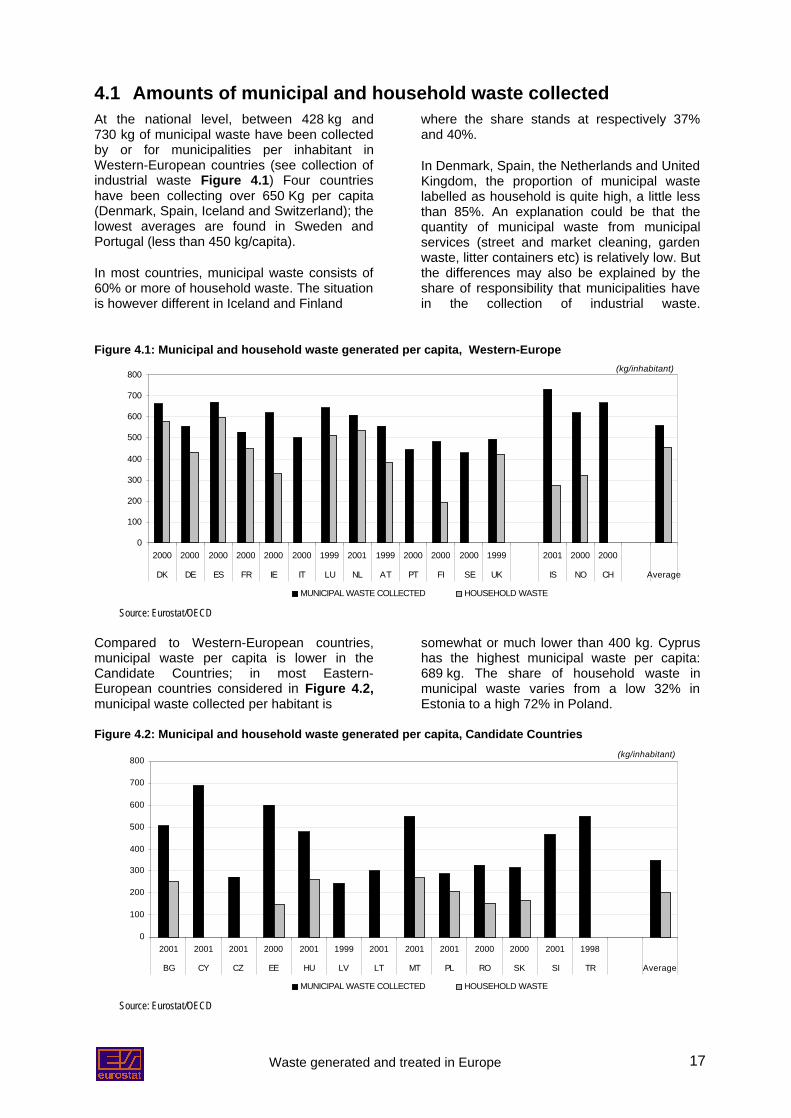
4.1 Amounts of municipal and household waste collectedAt the national level, between 428 kg and730 kg of municipal waste have been collectedby or for municipalities per inhabitant inWestern-European countries (see collection ofindustrial waste Figure 4.1) Four countrieshave been collecting over 650 Kg per capita(Denmark, Spain, Iceland and Switzerland); thelowest averages are found in Sweden andPortugal (less than 450 kg/capita).
In most countries, municipal waste consists of60% or more of household waste. The situationis however different in Iceland and Finland
where the share stands at respectively 37%and 40%.
In Denmark, Spain, the Netherlands and UnitedKingdom, the proportion of municipal wastelabelled as household is quite high, a little lessthan 85%. An explanation could be that thequantity of municipal waste from municipalservices (street and market cleaning, gardenwaste, litter containers etc) is relatively low. Butthe differences may also be explained by theshare of responsibility that municipalities havein the collection of industrial waste.
Figure 4.1: Municipal and household waste generated per capita, Western-Europe
0
100
200
300
400
500
600
700
800
2000 2000 2000 2000 2000 2000 1999 2001 1999 2000 2000 2000 1999 2001 2000 2000
DK DE ES FR IE IT LU NL AT PT FI SE UK IS NO CH Average
(kg/inhabitant)
MUNICIPAL WASTE COLLECTED HOUSEHOLD WASTE
Source: Eurostat/OECD
Compared to Western-European countries,municipal waste per capita is lower in theCandidate Countries; in most Eastern-European countries considered in Figure 4.2,municipal waste collected per habitant is
somewhat or much lower than 400 kg. Cyprushas the highest municipal waste per capita:689 kg. The share of household waste inmunicipal waste varies from a low 32% inEstonia to a high 72% in Poland.
Figure 4.2: Municipal and household waste generated per capita, Candidate Countries
0
100
200
300
400
500
600
700
800
2001 2001 2001 2000 2001 1999 2001 2001 2001 2000 2000 2001 1998
BG CY CZ EE HU LV LT MT PL RO SK SI TR Average
(kg/inhabitant)
MUNICIPAL WASTE COLLECTED HOUSEHOLD WASTE
Source: Eurostat/OECD
Waste generated and treated in Europe18
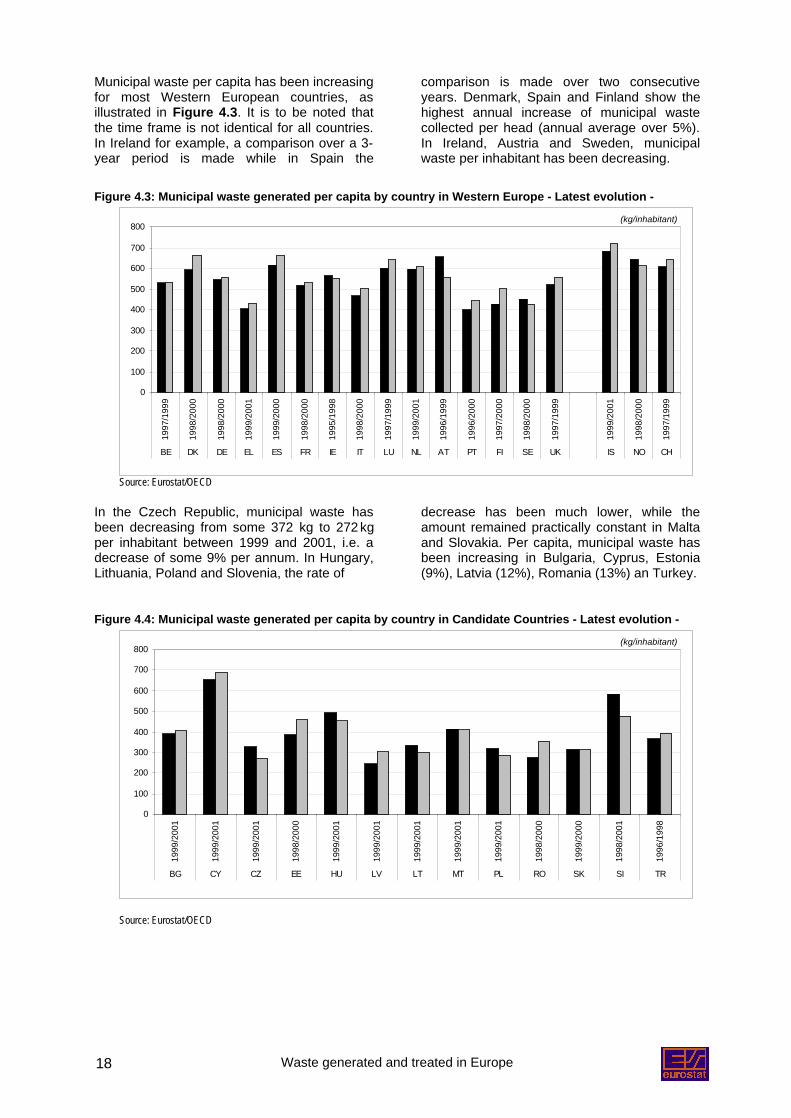
Municipal waste per capita has been increasingfor most Western European countries, asillustrated in Figure 4.3. It is to be noted thatthe time frame is not identical for all countries.In Ireland for example, a comparison over a 3-year period is made while in Spain the
comparison is made over two consecutiveyears. Denmark, Spain and Finland show thehighest annual increase of municipal wastecollected per head (annual average over 5%).In Ireland, Austria and Sweden, municipalwaste per inhabitant has been decreasing.
Figure 4.3: Municipal waste generated per capita by country in Western Europe - Latest evolution -
0
100
200
300
400
500
600
700
800
1997
/199
9
1998
/200
0
1998
/200
0
1999
/200
1
1999
/200
0
1998
/200
0
1995
/199
8
1998
/200
0
1997
/199
9
1999
/200
1
1996
/199
9
1996
/200
0
1997
/200
0
1998
/200
0
1997
/199
9
1999
/200
1
1998
/200
0
1997
/199
9
BE DK DE EL ES FR IE IT LU NL AT PT FI SE UK IS NO CH
(kg/inhabitant)
Source: Eurostat/OECD
In the Czech Republic, municipal waste hasbeen decreasing from some 372 kg to 272 kgper inhabitant between 1999 and 2001, i.e. adecrease of some 9% per annum. In Hungary,Lithuania, Poland and Slovenia, the rate of
decrease has been much lower, while theamount remained practically constant in Maltaand Slovakia. Per capita, municipal waste hasbeen increasing in Bulgaria, Cyprus, Estonia(9%), Latvia (12%), Romania (13%) an Turkey.
Figure 4.4: Municipal waste generated per capita by country in Candidate Countries - Latest evolution -
0
100
200
300
400
500
600
700
800
1999
/200
1
1999
/200
1
1999
/200
1
1998
/200
0
1999
/200
1
1999
/200
1
1999
/200
1
1999
/200
1
1999
/200
1
1998
/200
0
1999
/200
0
1998
/200
1
1996
/199
8
BG CY CZ EE HU LV LT MT PL RO SK SI TR
(kg/inhabitant)
Source: Eurostat/OECD
Waste generated and treated in Europe 19
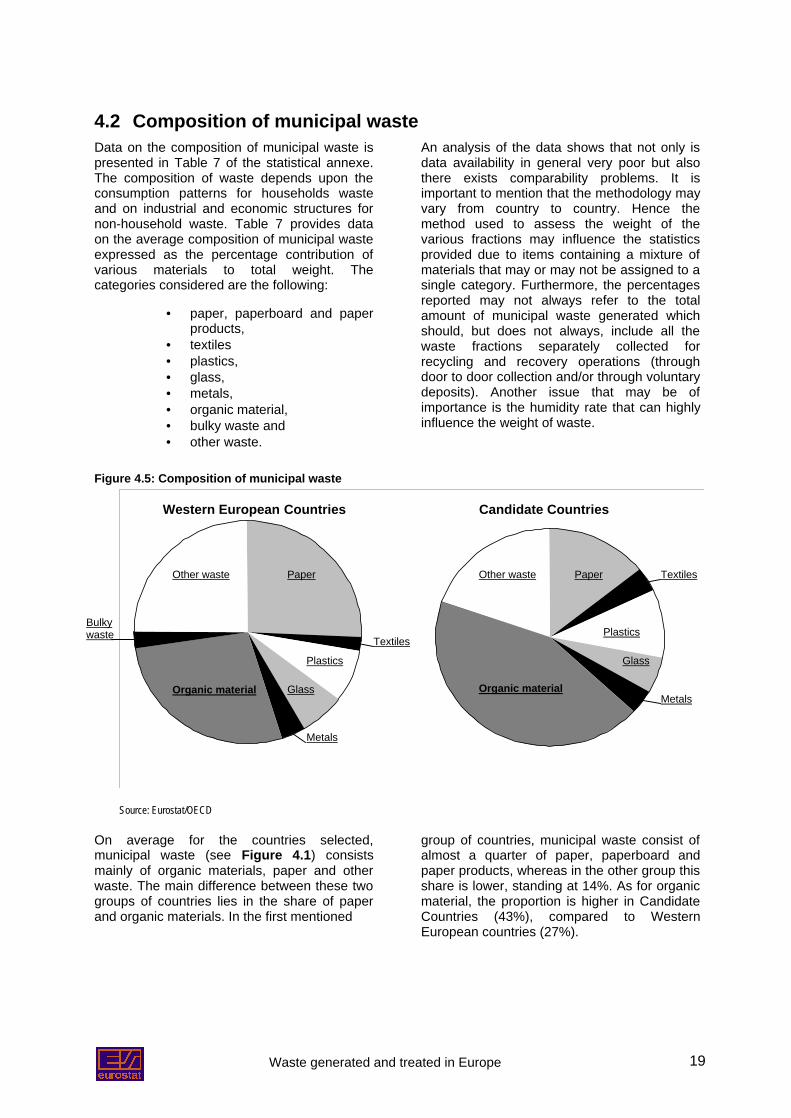
4.2 Composition of municipal wasteData on the composition of municipal waste ispresented in Table 7 of the statistical annexe.The composition of waste depends upon theconsumption patterns for households wasteand on industrial and economic structures fornon-household waste. Table 7 provides dataon the average composition of municipal wasteexpressed as the percentage contribution ofvarious materials to total weight. Thecategories considered are the following:
• paper, paperboard and paperproducts,
• textiles• plastics,• glass,• metals,• organic material,• bulky waste and• other waste.
An analysis of the data shows that not only isdata availability in general very poor but alsothere exists comparability problems. It isimportant to mention that the methodology mayvary from country to country. Hence themethod used to assess the weight of thevarious fractions may influence the statisticsprovided due to items containing a mixture ofmaterials that may or may not be assigned to asingle category. Furthermore, the percentagesreported may not always refer to the totalamount of municipal waste generated whichshould, but does not always, include all thewaste fractions separately collected forrecycling and recovery operations (throughdoor to door collection and/or through voluntarydeposits). Another issue that may be ofimportance is the humidity rate that can highlyinfluence the weight of waste.
Figure 4.5: Composition of municipal waste
Source: Eurostat/OECD
On average for the countries selected,municipal waste (see Figure 4.1) consistsmainly of organic materials, paper and otherwaste. The main difference between these twogroups of countries lies in the share of paperand organic materials. In the first mentioned
group of countries, municipal waste consist ofalmost a quarter of paper, paperboard andpaper products, whereas in the other group thisshare is lower, standing at 14%. As for organicmaterial, the proportion is higher in CandidateCountries (43%), compared to WesternEuropean countries (27%).
Paper PaperOther waste Other waste
Organic materialOrganic material
Bulkywaste
Metals
Glass
Glass
Metals
Plastics
PlasticsTextiles
Textiles
Western European Countries Candidate Countries
Waste generated and treated in Europe20
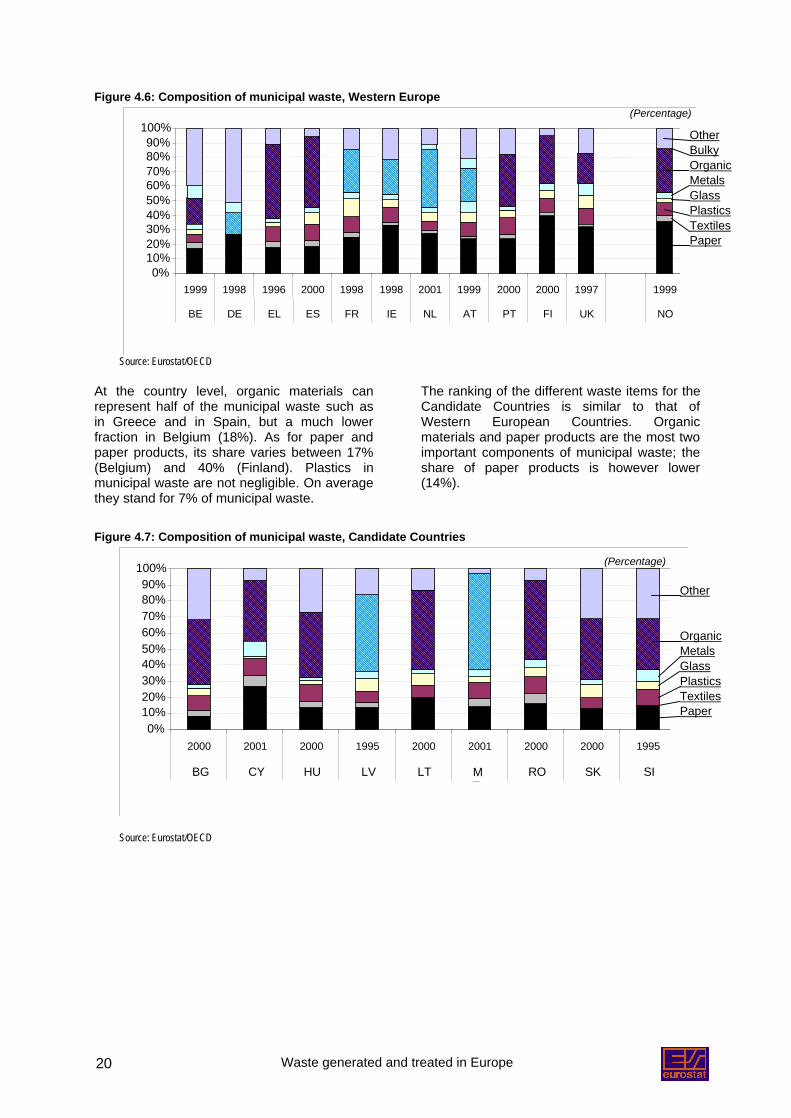
Figure 4.6: Composition of municipal waste, Western Europe
0%10%20%30%40%50%60%70%80%90%
100%
1999 1998 1996 2000 1998 1998 2001 1999 2000 2000 1997 1999
BE DE EL ES FR IE NL AT PT FI UK NO
(Percentage)
Source: Eurostat/OECD
At the country level, organic materials canrepresent half of the municipal waste such asin Greece and in Spain, but a much lowerfraction in Belgium (18%). As for paper andpaper products, its share varies between 17%(Belgium) and 40% (Finland). Plastics inmunicipal waste are not negligible. On averagethey stand for 7% of municipal waste.
The ranking of the different waste items for theCandidate Countries is similar to that ofWestern European Countries. Organicmaterials and paper products are the most twoimportant components of municipal waste; theshare of paper products is however lower(14%).
Figure 4.7: Composition of municipal waste, Candidate Countries
0%10%20%30%40%50%60%70%80%90%
100%
2000 2001 2000 1995 2000 2001 2000 2000 1995
BG CY HU LV LT MT
RO SK SI
(Percentage)
Source: Eurostat/OECD
Other
OrganicMetalsGlassPlasticsTextilesPaper
OtherBulkyOrganicMetalsGlassPlasticsTextilesPaper
Waste generated and treated in Europe 21
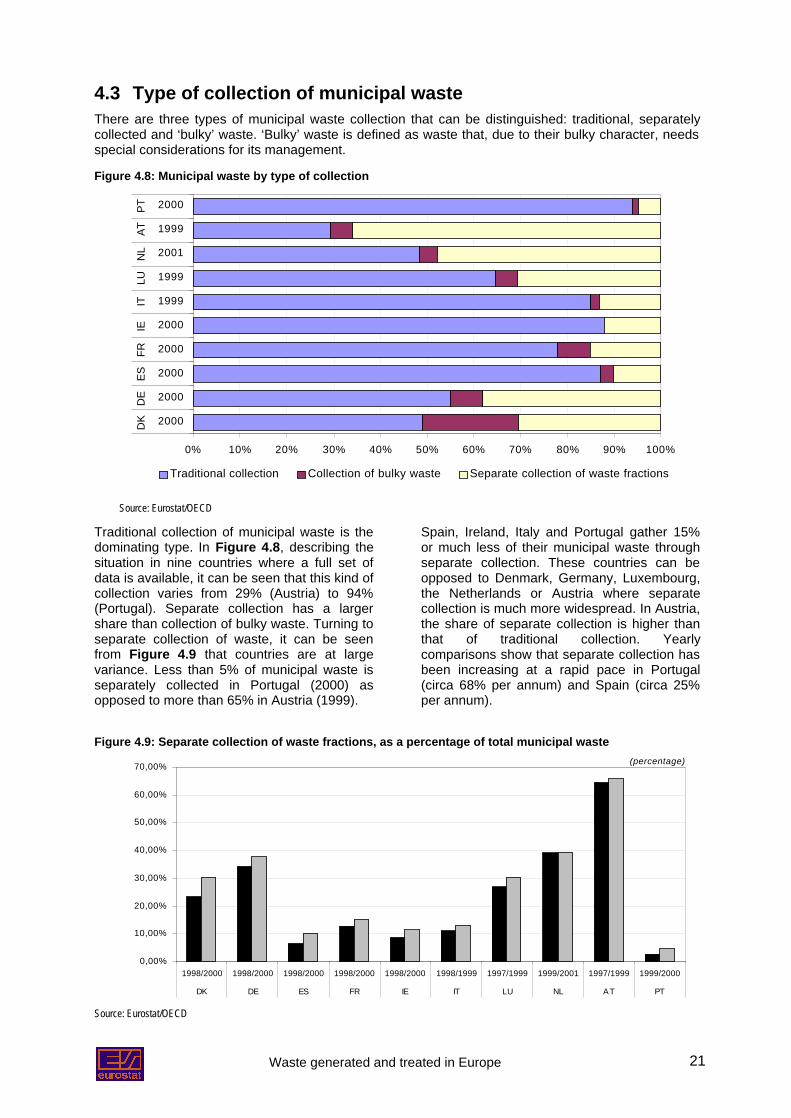
4.3 Type of collection of municipal wasteThere are three types of municipal waste collection that can be distinguished: traditional, separatelycollected and ‘bulky’ waste. ‘Bulky’ waste is defined as waste that, due to their bulky character, needsspecial considerations for its management.
Figure 4.8: Municipal waste by type of collection
0% 10% 20% 30% 40% 50% 60% 70% 80% 90% 100%
2000
2000
2000
2000
2000
1999
1999
2001
1999
2000
DK
DE
ESFR
IEIT
LUN
LAT
PT
Traditional collection Collection of bulky waste Separate collection of waste fractions
Source: Eurostat/OECD
Traditional collection of municipal waste is thedominating type. In Figure 4.8, describing thesituation in nine countries where a full set ofdata is available, it can be seen that this kind ofcollection varies from 29% (Austria) to 94%(Portugal). Separate collection has a largershare than collection of bulky waste. Turning toseparate collection of waste, it can be seenfrom Figure 4.9 that countries are at largevariance. Less than 5% of municipal waste isseparately collected in Portugal (2000) asopposed to more than 65% in Austria (1999).
Spain, Ireland, Italy and Portugal gather 15%or much less of their municipal waste throughseparate collection. These countries can beopposed to Denmark, Germany, Luxembourg,the Netherlands or Austria where separatecollection is much more widespread. In Austria,the share of separate collection is higher thanthat of traditional collection. Yearlycomparisons show that separate collection hasbeen increasing at a rapid pace in Portugal(circa 68% per annum) and Spain (circa 25%per annum).
Figure 4.9: Separate collection of waste fractions, as a percentage of total municipal waste
0,00%
10,00%
20,00%
30,00%
40,00%
50,00%
60,00%
70,00%
1998/2000 1998/2000 1998/2000 1998/2000 1998/2000 1998/1999 1997/1999 1999/2001 1997/1999 1999/2000
DK DE ES FR IE IT LU NL AT PT
(percentage)
Source: Eurostat/OECD
Waste generated and treated in Europe 61
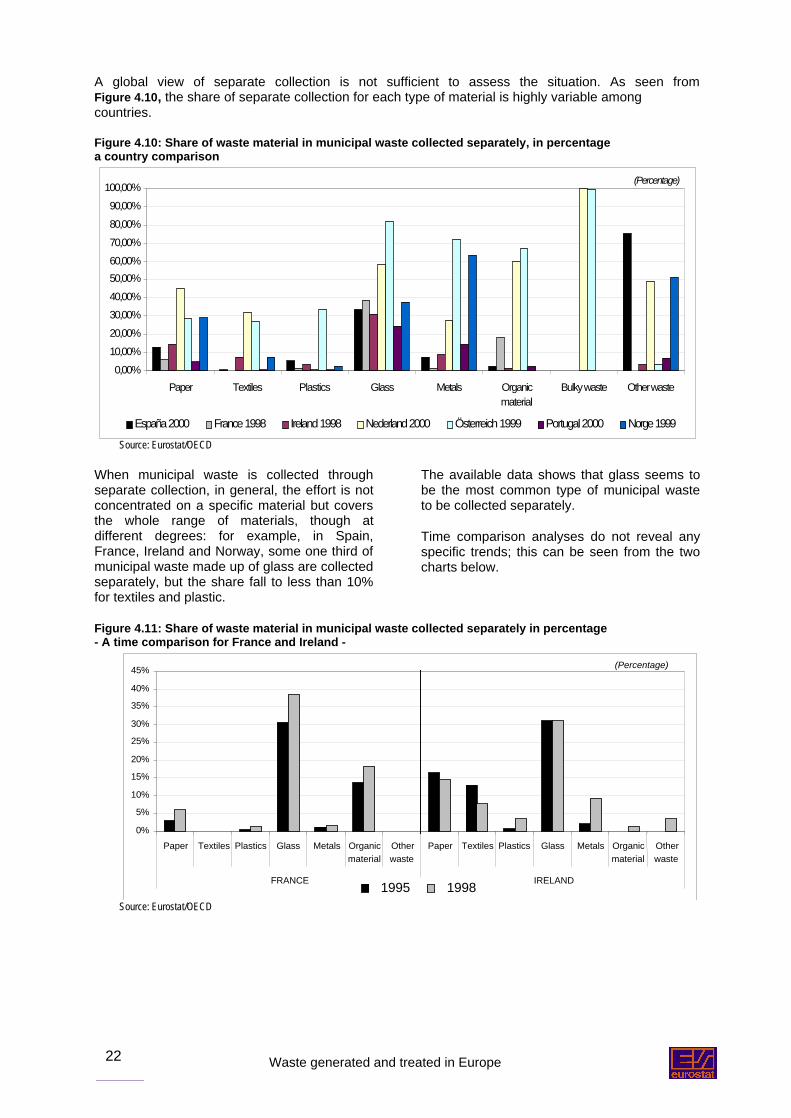
A global view of separate collection is not sufficient to assess the situation. As seen fromFigure 4.10, the share of separate collection for each type of material is highly variable amongcountries.
Figure 4.10: Share of waste material in municipal waste collected separately, in percentagea country comparison
0,00%10,00%20,00%30,00%40,00%50,00%60,00%70,00%80,00%90,00%
100,00%
Paper Textiles Plastics Glass Metals Organicmaterial
Bulky waste Other waste
(Percentage)
España 2000 France 1998 Ireland 1998 Nederland 2000 Österreich 1999 Portugal 2000 Norge 1999
Source: Eurostat/OECD
When municipal waste is collected throughseparate collection, in general, the effort is notconcentrated on a specific material but coversthe whole range of materials, though atdifferent degrees: for example, in Spain,France, Ireland and Norway, some one third ofmunicipal waste made up of glass are collectedseparately, but the share fall to less than 10%for textiles and plastic.
The available data shows that glass seems tobe the most common type of municipal wasteto be collected separately.
Time comparison analyses do not reveal anyspecific trends; this can be seen from the twocharts below.
Figure 4.11: Share of waste material in municipal waste collected separately in percentage- A time comparison for France and Ireland -
0%
5%
10%
15%
20%
25%
30%
35%
40%
45%
Paper Textiles Plastics Glass Metals Organicmaterial
Otherwaste
Paper Textiles Plastics Glass Metals Organicmaterial
Otherwaste
FRANCE IRELAND
(Percentage)
1995 1998Source: Eurostat/OECD
22
Waste generated and treated in Europe 23
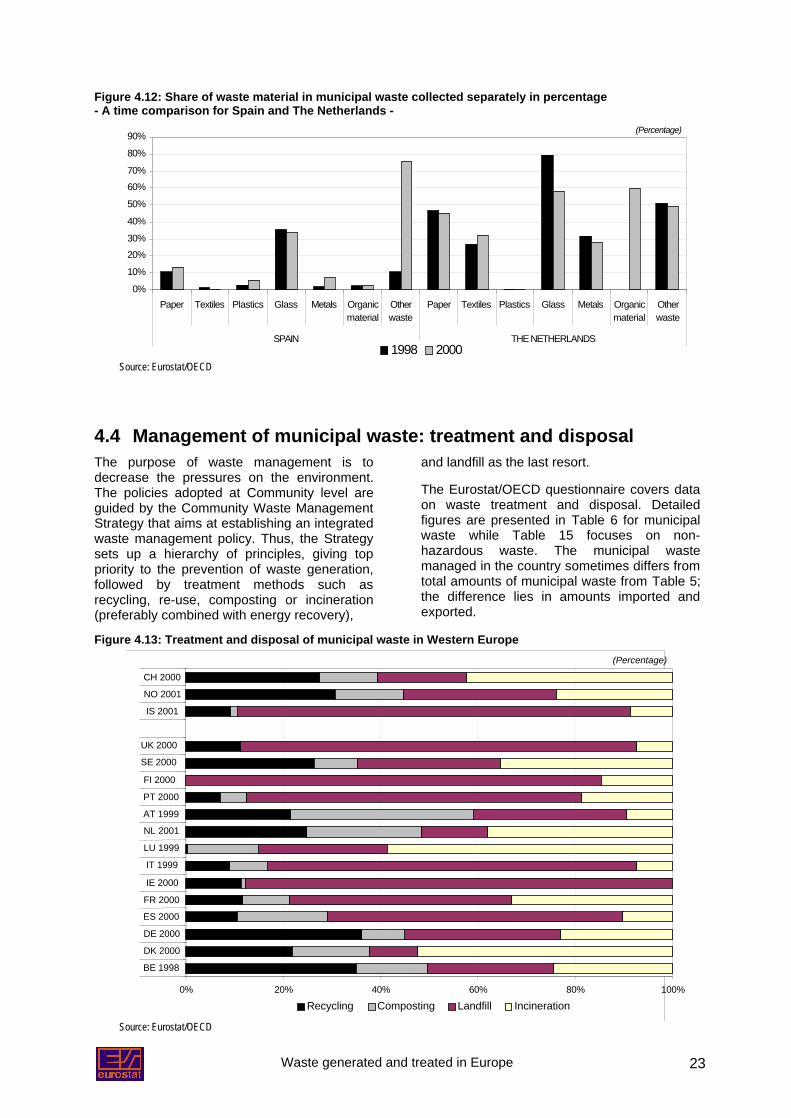
Figure 4.12: Share of waste material in municipal waste collected separately in percentage- A time comparison for Spain and The Netherlands -
0%
10%
20%30%
40%
50%
60%70%
80%
90%
Paper Textiles Plastics Glass Metals Organicmaterial
Otherwaste
Paper Textiles Plastics Glass Metals Organicmaterial
Otherwaste
SPAIN THE NETHERLANDS
(Percentage)
1998 2000Source: Eurostat/OECD
4.4 Management of municipal waste: treatment and disposalThe purpose of waste management is todecrease the pressures on the environment.The policies adopted at Community level areguided by the Community Waste ManagementStrategy that aims at establishing an integratedwaste management policy. Thus, the Strategysets up a hierarchy of principles, giving toppriority to the prevention of waste generation,followed by treatment methods such asrecycling, re-use, composting or incineration(preferably combined with energy recovery),
and landfill as the last resort.
The Eurostat/OECD questionnaire covers dataon waste treatment and disposal. Detailedfigures are presented in Table 6 for municipalwaste while Table 15 focuses on non-hazardous waste. The municipal wastemanaged in the country sometimes differs fromtotal amounts of municipal waste from Table 5;the difference lies in amounts imported andexported.
Figure 4.13: Treatment and disposal of municipal waste in Western Europe
0% 20% 40% 60% 80% 100%
BE 1998
DK 2000
DE 2000
ES 2000
FR 2000
IE 2000
IT 1999
LU 1999
NL 2001
AT 1999
PT 2000
FI 2000
SE 2000
UK 2000
IS 2001
NO 2001
CH 2000
(Percentage)
Recycling Composting Landfill Incineration
Source: Eurostat/OECD
Waste generated and treated in Europe24
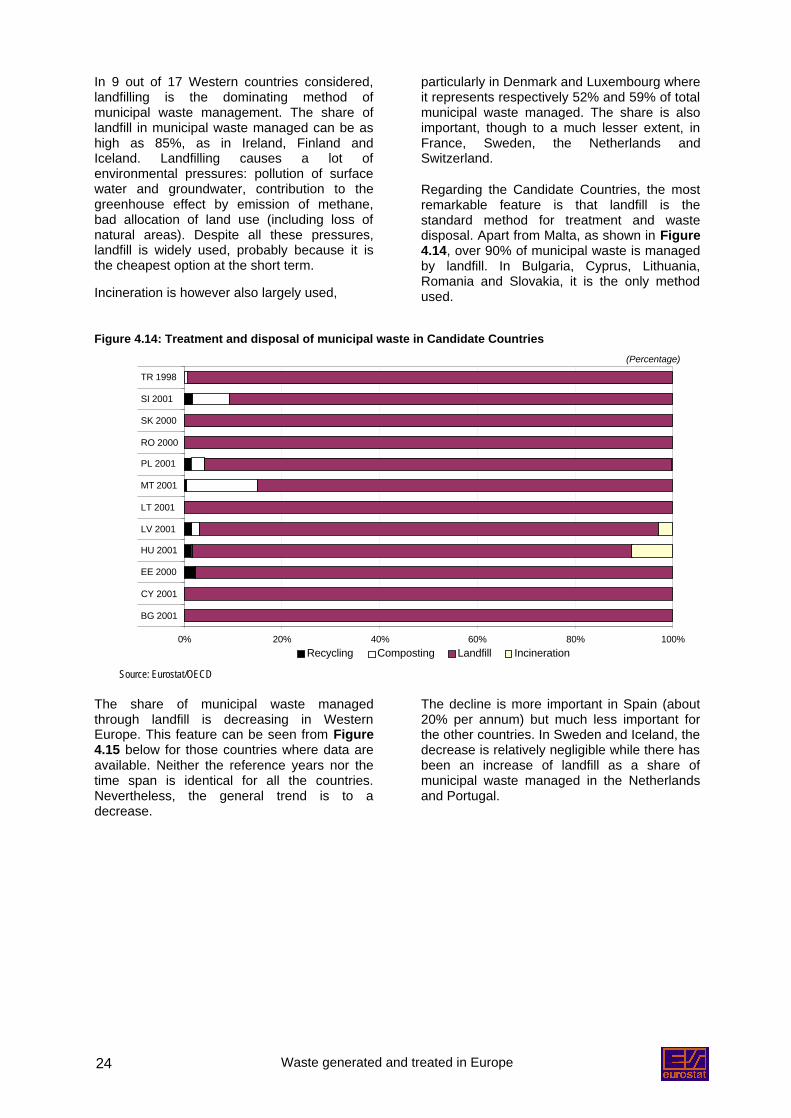
In 9 out of 17 Western countries considered,landfilling is the dominating method ofmunicipal waste management. The share oflandfill in municipal waste managed can be ashigh as 85%, as in Ireland, Finland andIceland. Landfilling causes a lot ofenvironmental pressures: pollution of surfacewater and groundwater, contribution to thegreenhouse effect by emission of methane,bad allocation of land use (including loss ofnatural areas). Despite all these pressures,landfill is widely used, probably because it isthe cheapest option at the short term.
Incineration is however also largely used,
particularly in Denmark and Luxembourg whereit represents respectively 52% and 59% of totalmunicipal waste managed. The share is alsoimportant, though to a much lesser extent, inFrance, Sweden, the Netherlands andSwitzerland.
Regarding the Candidate Countries, the mostremarkable feature is that landfill is thestandard method for treatment and wastedisposal. Apart from Malta, as shown in Figure4.14, over 90% of municipal waste is managedby landfill. In Bulgaria, Cyprus, Lithuania,Romania and Slovakia, it is the only methodused.
Figure 4.14: Treatment and disposal of municipal waste in Candidate Countries
0% 20% 40% 60% 80% 100%
BG 2001
CY 2001
EE 2000
HU 2001
LV 2001
LT 2001
MT 2001
PL 2001
RO 2000
SK 2000
SI 2001
TR 1998
(Percentage)
Recycling Composting Landfill Incineration
Source: Eurostat/OECD
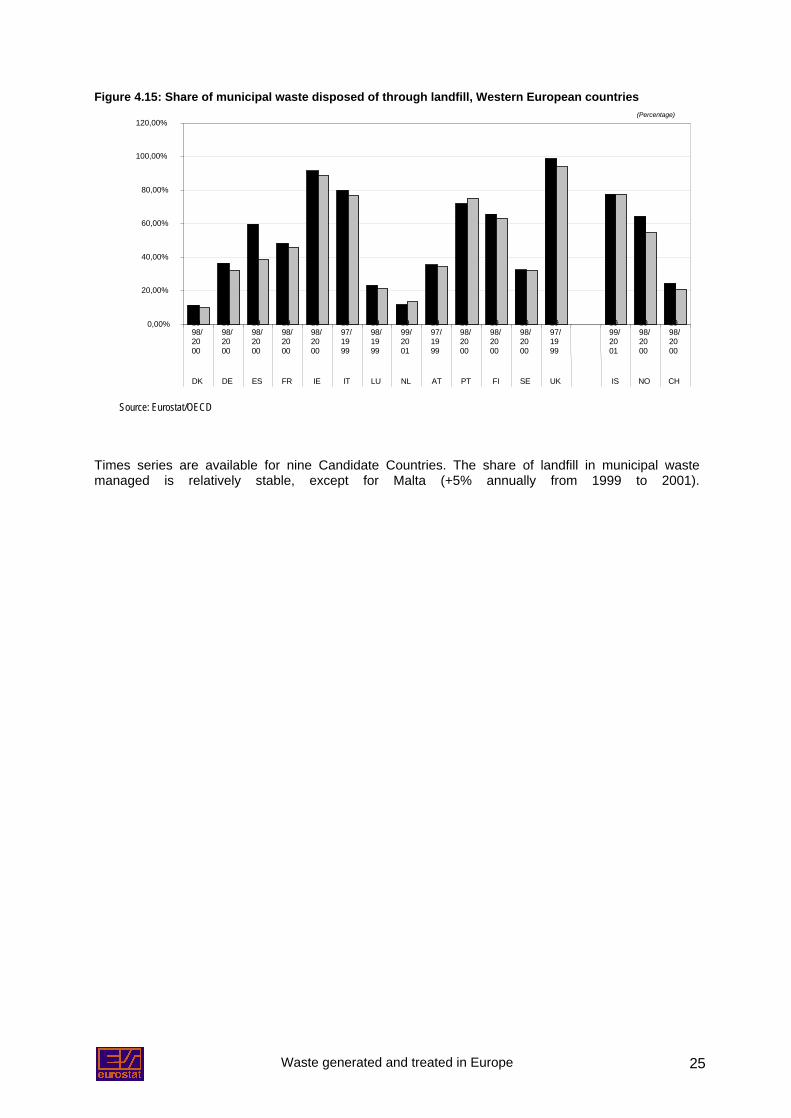
The share of municipal waste managedthrough landfill is decreasing in WesternEurope. This feature can be seen from Figure4.15 below for those countries where data areavailable. Neither the reference years nor thetime span is identical for all the countries.Nevertheless, the general trend is to adecrease.
The decline is more important in Spain (about20% per annum) but much less important forthe other countries. In Sweden and Iceland, thedecrease is relatively negligible while there hasbeen an increase of landfill as a share ofmunicipal waste managed in the Netherlandsand Portugal.
Waste generated and treated in Europe 25
Figure 4.15: Share of municipal waste disposed of through landfill, Western European countries
0,00%
20,00%
40,00%
60,00%
80,00%
100,00%
120,00%
1998/2000
1998/2000
1998/2000
1998/2000
1998/2000
1997/1999
1998/1999
1999/2001
1997/1999
1998/2000
1998/2000
1998/2000
1997/1999
1999/2001
1998/2000
1998/2000
DK DE ES FR IE IT LU NL AT PT FI SE UK IS NO CH
(Percentage)
Source: Eurostat/OECD
Times series are available for nine Candidate Countries. The share of landfill in municipal wastemanaged is relatively stable, except for Malta (+5% annually from 1999 to 2001).
Waste generated and treated in Europe26
5 Hazardous waste
Main findings:o Circa 62 million tonnes of hazardous waste were generated per annum in Western
Europe between 1997 and 2001 (estimation).o 15 million annual tonnes were generated in Candidate Countries in the same period.o On average, in Western Europe, some 6 kg of hazardous waste were generated for every
thousand Euro of value added produced.
In recent years politicians and the public havebecome aware of the threats of hazardouswaste to the environment and to the populationdue to the problem of contaminated sites andrelated health problems. Hazardoussubstances in waste, even in small quantities,can have a very negative impact on theenvironment. This section presents somequantitative information and trends on thistopic. The figures are those reported bycountries replying to the 2002 Eurostat/OECDquestionnaire on Waste.
An estimated 47 million tonnes of yearlyhazardous waste has been generated inWestern Europe between 1997 and 2001. Thisfigure is based partly on national data andpartly on some estimation. In CandidateCountries, the volume of hazardous wasteamounts to some 15 million tonnes.
In many countries national classifications anddefinitions are used; consequently, it is verydifficult to draw valid comparisons betweendata from different countries as theclassification systems can be quite different.
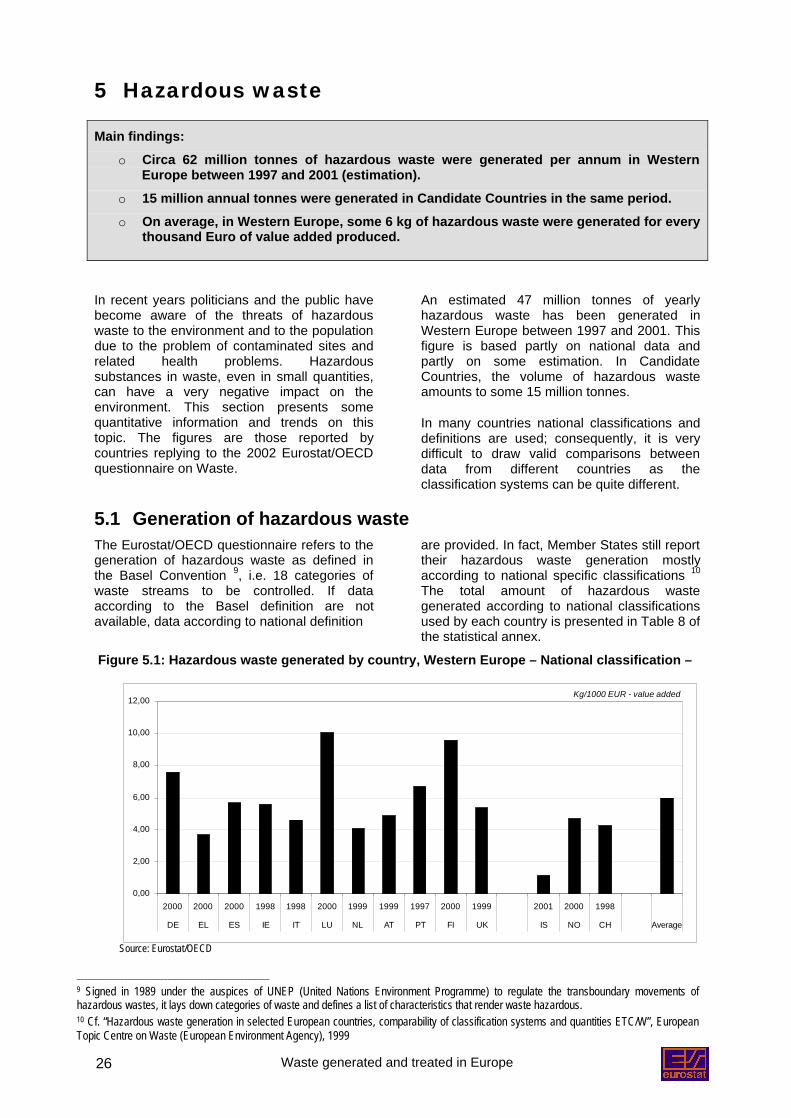
5.1 Generation of hazardous wasteThe Eurostat/OECD questionnaire refers to thegeneration of hazardous waste as defined inthe Basel Convention 9, i.e. 18 categories ofwaste streams to be controlled. If dataaccording to the Basel definition are notavailable, data according to national definition
are provided. In fact, Member States still reporttheir hazardous waste generation mostlyaccording to national specific classifications 10
The total amount of hazardous wastegenerated according to national classificationsused by each country is presented in Table 8 ofthe statistical annex.
Figure 5.1: Hazardous waste generated by country, Western Europe – National classification –
Kg/1000 EUR - value added
0,00
2,00
4,00
6,00
8,00
10,00
12,00
2000 2000 2000 1998 1998 2000 1999 1999 1997 2000 1999 2001 2000 1998
DE EL ES IE IT LU NL AT PT FI UK IS NO CH Average
Source: Eurostat/OECD
_____________________________________________________9 Signed in 1989 under the auspices of UNEP (United Nations Environment Programme) to regulate the transboundary movements ofhazardous wastes, it lays down categories of waste and defines a list of characteristics that render waste hazardous.10 Cf. “Hazardous waste generation in selected European countries, comparability of classification systems and quantities ETC/W”, EuropeanTopic Centre on Waste (European Environment Agency), 1999
Waste generated and treated in Europe 27
Luxembourg and Finland generate far morehazardous waste per 1000 Euro of GDP thanany other Western-European country. For each1000 Euro of value added, around 10 kg ofhazardous waste are generated in these twomentioned countries. The volume of waste ismuch lower in Iceland (around 1 kg/1000 Euroof value added). On average, some 6 kg ofhazardous waste are generated for every1000 Euro of value added. As the data arebased on national definitions, comparisonsbetween countries are only indicative.
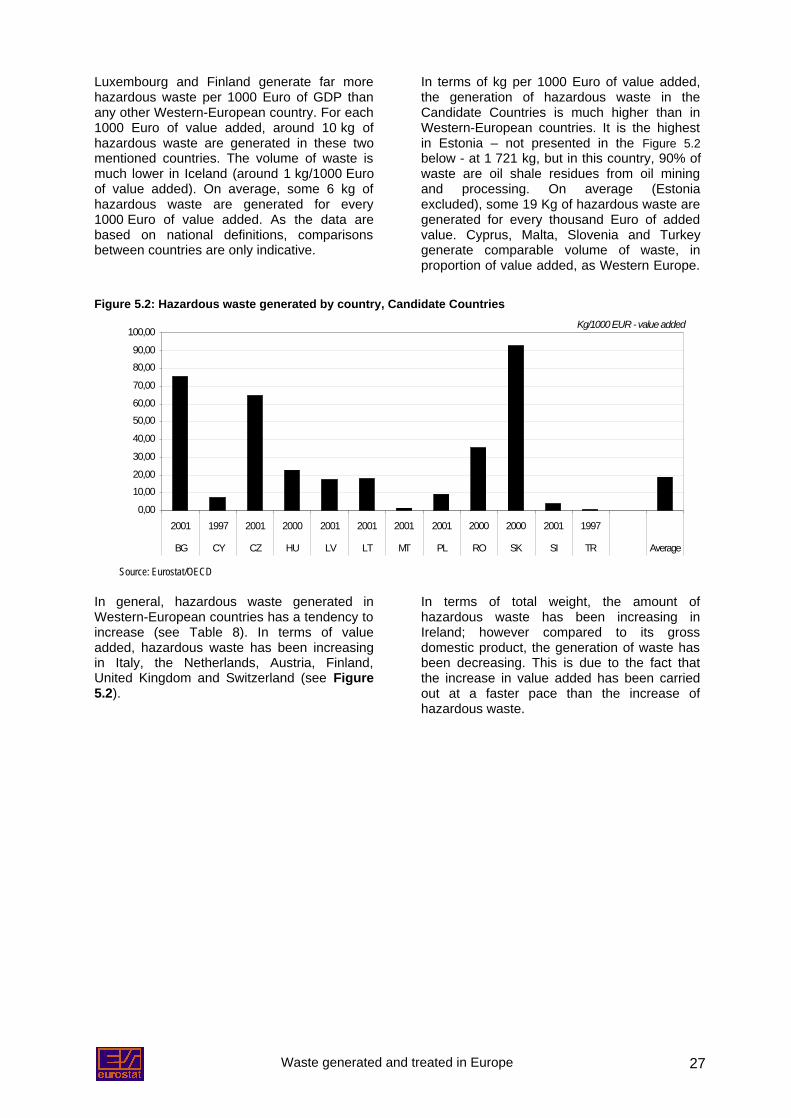
In terms of kg per 1000 Euro of value added,the generation of hazardous waste in theCandidate Countries is much higher than inWestern-European countries. It is the highestin Estonia – not presented in the Figure 5.2below - at 1 721 kg, but in this country, 90% ofwaste are oil shale residues from oil miningand processing. On average (Estoniaexcluded), some 19 Kg of hazardous waste aregenerated for every thousand Euro of addedvalue. Cyprus, Malta, Slovenia and Turkeygenerate comparable volume of waste, inproportion of value added, as Western Europe.
Figure 5.2: Hazardous waste generated by country, Candidate CountriesKg/1000 EUR - value added
0,00
10,0020,00
30,00
40,00
50,0060,00
70,00
80,0090,00
100,00
2001 1997 2001 2000 2001 2001 2001 2001 2000 2000 2001 1997
BG CY CZ HU LV LT MT PL RO SK SI TR Average
Source: Eurostat/OECD
In general, hazardous waste generated inWestern-European countries has a tendency toincrease (see Table 8). In terms of valueadded, hazardous waste has been increasingin Italy, the Netherlands, Austria, Finland,United Kingdom and Switzerland (see Figure5.2).
In terms of total weight, the amount ofhazardous waste has been increasing inIreland; however compared to its grossdomestic product, the generation of waste hasbeen decreasing. This is due to the fact thatthe increase in value added has been carriedout at a faster pace than the increase ofhazardous waste.
Waste generated and treated in Europe28
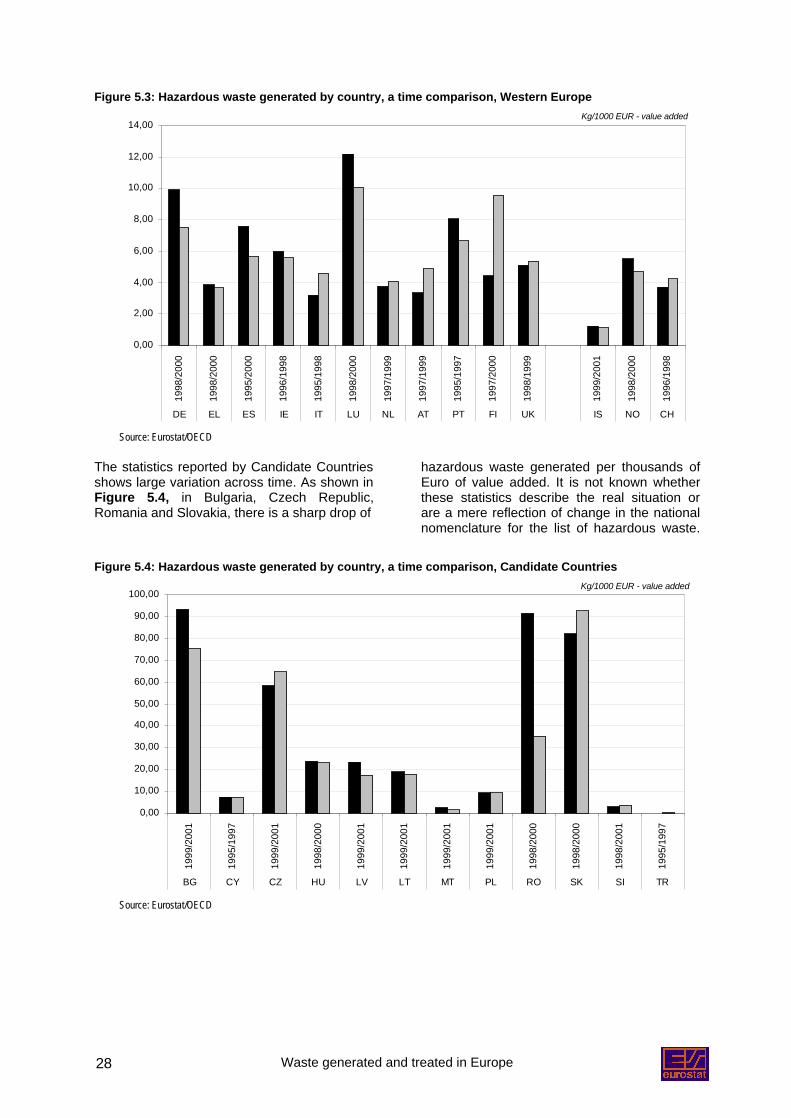
Figure 5.3: Hazardous waste generated by country, a time comparison, Western EuropeKg/1000 EUR - value added
0,00
2,00
4,00
6,00
8,00
10,00
12,00
14,00
1998
/200
0
1998
/200
0
1995
/200
0
1996
/199
8
1995
/199
8
1998
/200
0
1997
/199
9
1997
/199
9
1995
/199
7
1997
/200
0
1998
/199
9
1999
/200
1
1998
/200
0
1996
/199
8
DE EL ES IE IT LU NL AT PT FI UK IS NO CH
Source: Eurostat/OECD
The statistics reported by Candidate Countriesshows large variation across time. As shown inFigure 5.4, in Bulgaria, Czech Republic,Romania and Slovakia, there is a sharp drop of
hazardous waste generated per thousands ofEuro of value added. It is not known whetherthese statistics describe the real situation orare a mere reflection of change in the nationalnomenclature for the list of hazardous waste.
Figure 5.4: Hazardous waste generated by country, a time comparison, Candidate CountriesKg/1000 EUR - value added
0,00
10,00
20,00
30,00
40,00
50,00
60,00
70,00
80,00
90,00
100,00
1999
/200
1
1995
/199
7
1999
/200
1
1998
/200
0
1999
/200
1
1999
/200
1
1999
/200
1
1999
/200
1
1998
/200
0
1998
/200
0
1998
/200
1
1995
/199
7
BG CY CZ HU LV LT MT PL RO SK SI TR
Source: Eurostat/OECD
Waste generated and treated in Europe 29
5.2 Management of hazardous waste: Treatment and disposalThe treatment and disposal operations presented in this publication refer to those listed in the BaselConvention on the Control of Trans-boundary Movements of Hazardous Wastes and their Disposal.Countries have to report eleven operations, grouped under recovery and disposal operations. Ninemain methods are presented in Table 9.
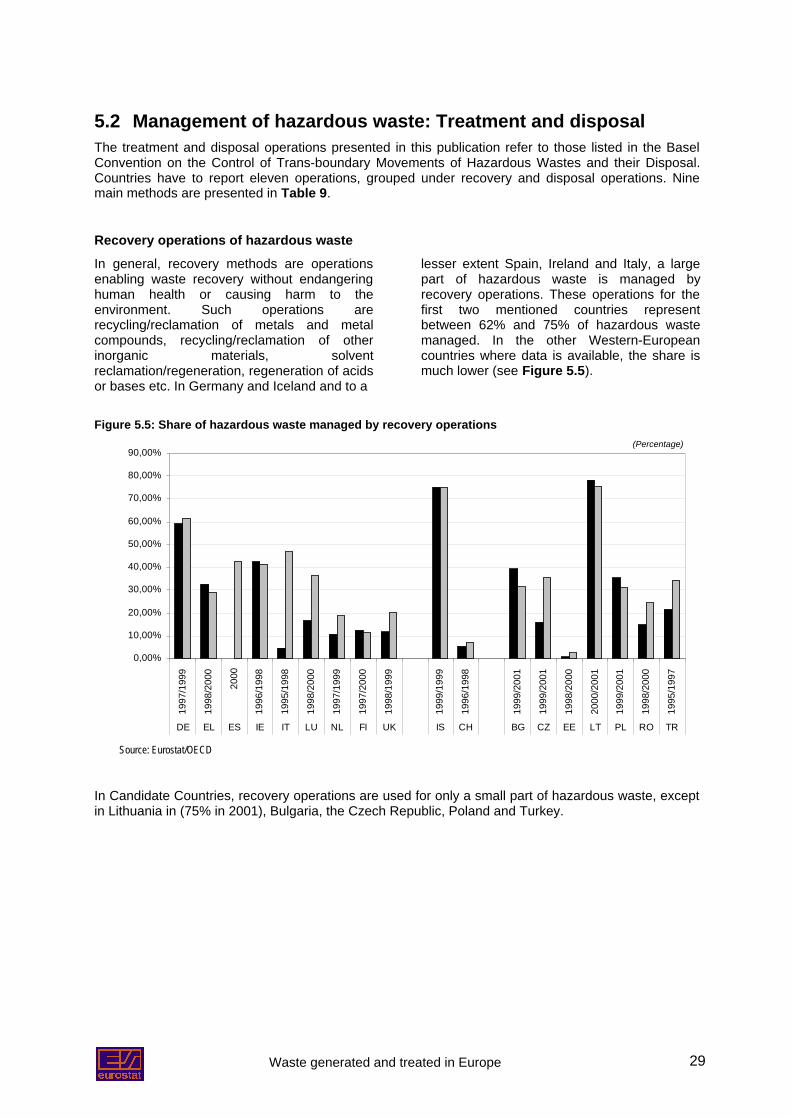
Recovery operations of hazardous wasteIn general, recovery methods are operationsenabling waste recovery without endangeringhuman health or causing harm to theenvironment. Such operations arerecycling/reclamation of metals and metalcompounds, recycling/reclamation of otherinorganic materials, solventreclamation/regeneration, regeneration of acidsor bases etc. In Germany and Iceland and to a
lesser extent Spain, Ireland and Italy, a largepart of hazardous waste is managed byrecovery operations. These operations for thefirst two mentioned countries representbetween 62% and 75% of hazardous wastemanaged. In the other Western-Europeancountries where data is available, the share ismuch lower (see Figure 5.5).
Figure 5.5: Share of hazardous waste managed by recovery operations(Percentage)
0,00%
10,00%
20,00%
30,00%
40,00%
50,00%
60,00%
70,00%
80,00%
90,00%
1997
/199
9
1998
/200
0
2000
1996
/199
8
1995
/199
8
1998
/200
0
1997
/199
9
1997
/200
0
1998
/199
9
1999
/199
9
1996
/199
8
1999
/200
1
1999
/200
1
1998
/200
0
2000
/200
1
1999
/200
1
1998
/200
0
1995
/199
7
DE EL ES IE IT LU NL FI UK IS CH BG CZ EE LT PL RO TR
Source: Eurostat/OECD
In Candidate Countries, recovery operations are used for only a small part of hazardous waste, exceptin Lithuania in (75% in 2001), Bulgaria, the Czech Republic, Poland and Turkey.
Waste generated and treated in Europe30
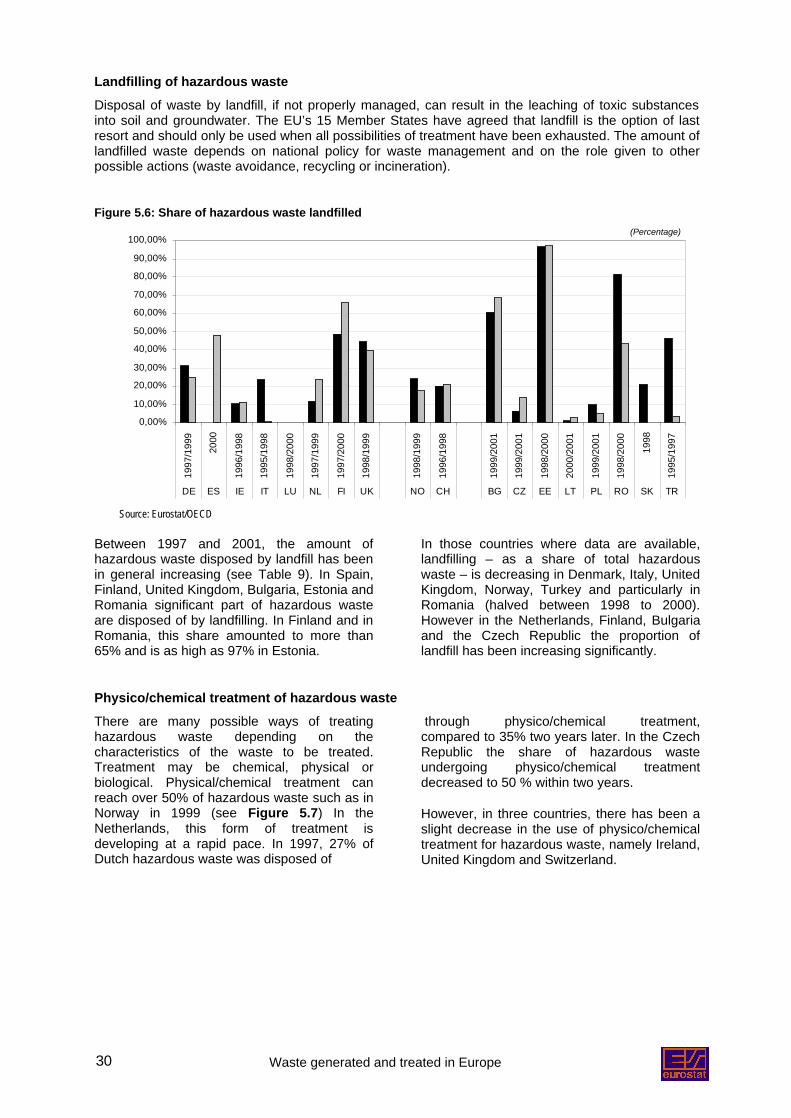
Landfilling of hazardous wasteDisposal of waste by landfill, if not properly managed, can result in the leaching of toxic substancesinto soil and groundwater. The EU’s 15 Member States have agreed that landfill is the option of lastresort and should only be used when all possibilities of treatment have been exhausted. The amount oflandfilled waste depends on national policy for waste management and on the role given to otherpossible actions (waste avoidance, recycling or incineration).
Figure 5.6: Share of hazardous waste landfilled(Percentage)
0,00%
10,00%
20,00%
30,00%
40,00%
50,00%
60,00%
70,00%
80,00%
90,00%
100,00%
1997
/199
9
2000
1996
/199
8
1995
/199
8
1998
/200
0
1997
/199
9
1997
/200
0
1998
/199
9
1998
/199
9
1996
/199
8
1999
/200
1
1999
/200
1
1998
/200
0
2000
/200
1
1999
/200
1
1998
/200
0
1998
1995
/199
7
DE ES IE IT LU NL FI UK NO CH BG CZ EE LT PL RO SK TR
Source: Eurostat/OECD
Between 1997 and 2001, the amount ofhazardous waste disposed by landfill has beenin general increasing (see Table 9). In Spain,Finland, United Kingdom, Bulgaria, Estonia andRomania significant part of hazardous wasteare disposed of by landfilling. In Finland and inRomania, this share amounted to more than65% and is as high as 97% in Estonia.
In those countries where data are available,landfilling – as a share of total hazardouswaste – is decreasing in Denmark, Italy, UnitedKingdom, Norway, Turkey and particularly inRomania (halved between 1998 to 2000).However in the Netherlands, Finland, Bulgariaand the Czech Republic the proportion oflandfill has been increasing significantly.
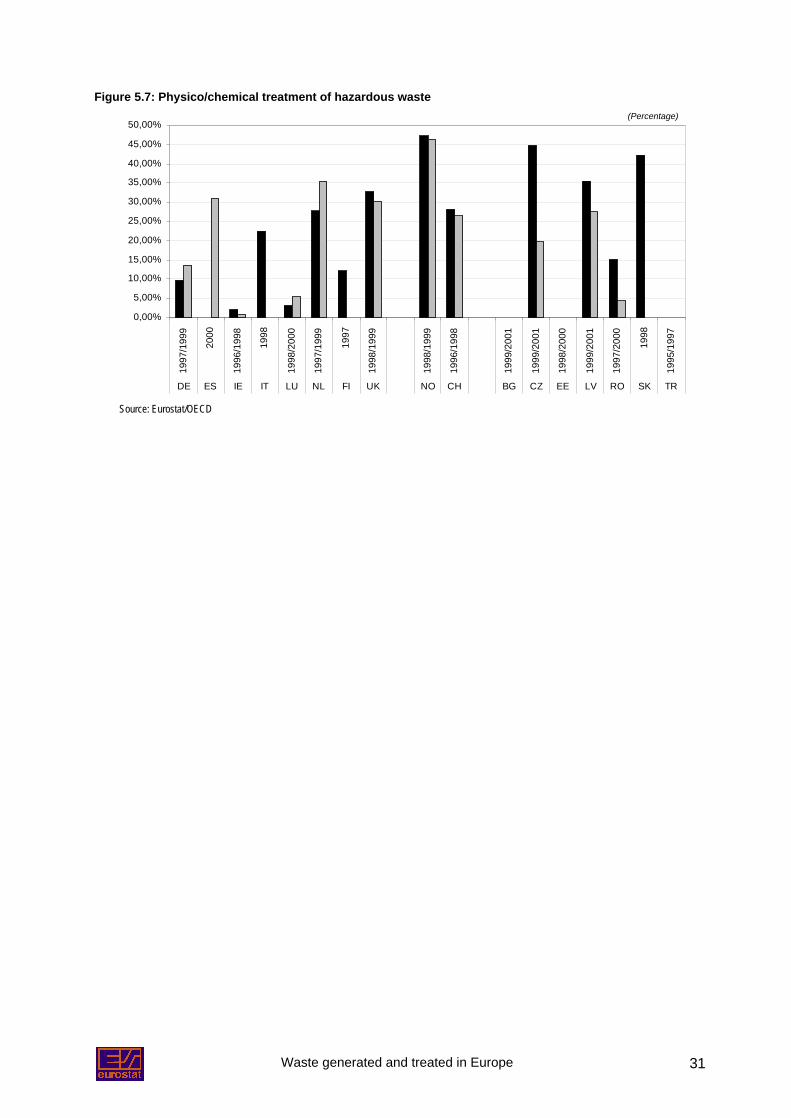
Physico/chemical treatment of hazardous wasteThere are many possible ways of treatinghazardous waste depending on thecharacteristics of the waste to be treated.Treatment may be chemical, physical orbiological. Physical/chemical treatment canreach over 50% of hazardous waste such as inNorway in 1999 (see Figure 5.7) In theNetherlands, this form of treatment isdeveloping at a rapid pace. In 1997, 27% ofDutch hazardous waste was disposed of
through physico/chemical treatment,compared to 35% two years later. In the CzechRepublic the share of hazardous wasteundergoing physico/chemical treatmentdecreased to 50 % within two years.
However, in three countries, there has been aslight decrease in the use of physico/chemicaltreatment for hazardous waste, namely Ireland,United Kingdom and Switzerland.
Waste generated and treated in Europe 31
Figure 5.7: Physico/chemical treatment of hazardous waste(Percentage)
0,00%
5,00%
10,00%
15,00%
20,00%
25,00%
30,00%
35,00%
40,00%
45,00%
50,00%
1997
/199
9
2000
1996
/199
8
1998
1998
/200
0
1997
/199
9
1997
1998
/199
9
1998
/199
9
1996
/199
8
1999
/200
1
1999
/200
1
1998
/200
0
1999
/200
1
1997
/200
0
1998
1995
/199
7
DE ES IE IT LU NL FI UK NO CH BG CZ EE LV RO SK TR
Source: Eurostat/OECD
Waste generated and treated in Europe32
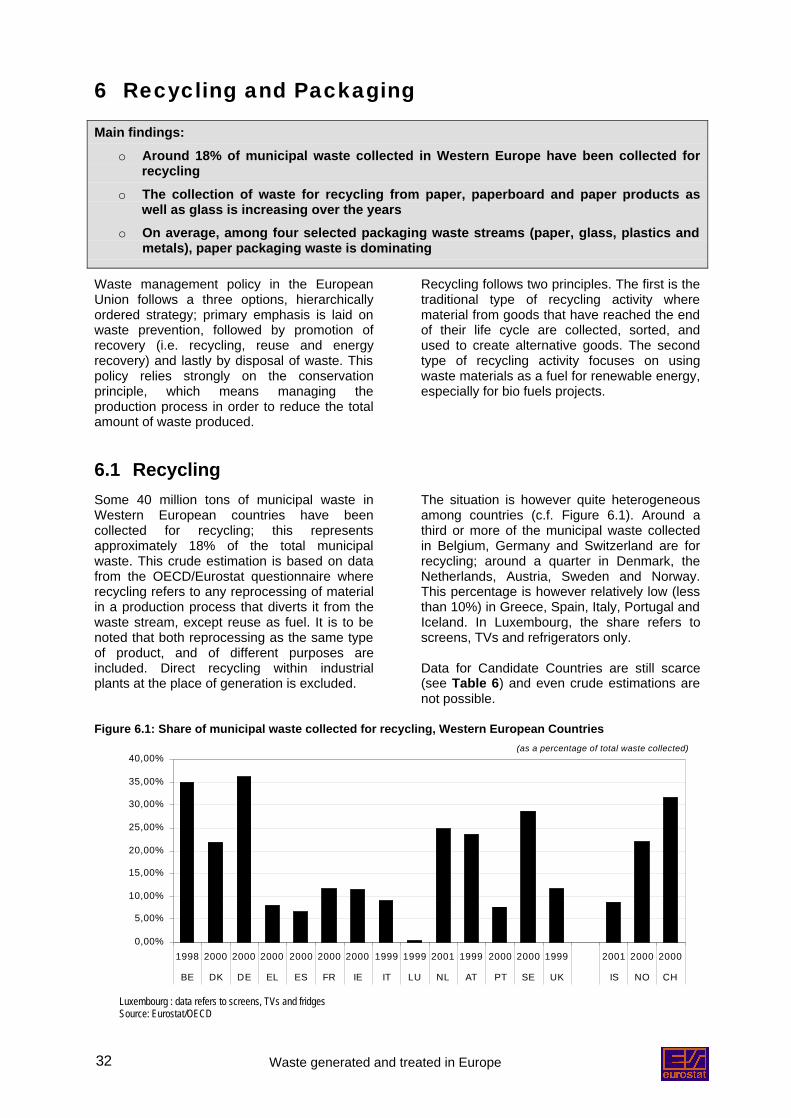
6 Recycling and Packaging
Main findings:o Around 18% of municipal waste collected in Western Europe have been collected for
recyclingo The collection of waste for recycling from paper, paperboard and paper products as
well as glass is increasing over the yearso On average, among four selected packaging waste streams (paper, glass, plastics and
metals), paper packaging waste is dominating
Waste management policy in the EuropeanUnion follows a three options, hierarchicallyordered strategy; primary emphasis is laid onwaste prevention, followed by promotion ofrecovery (i.e. recycling, reuse and energyrecovery) and lastly by disposal of waste. Thispolicy relies strongly on the conservationprinciple, which means managing theproduction process in order to reduce the totalamount of waste produced.
Recycling follows two principles. The first is thetraditional type of recycling activity wherematerial from goods that have reached the endof their life cycle are collected, sorted, andused to create alternative goods. The secondtype of recycling activity focuses on usingwaste materials as a fuel for renewable energy,especially for bio fuels projects.
6.1 RecyclingSome 40 million tons of municipal waste inWestern European countries have beencollected for recycling; this representsapproximately 18% of the total municipalwaste. This crude estimation is based on datafrom the OECD/Eurostat questionnaire whererecycling refers to any reprocessing of materialin a production process that diverts it from thewaste stream, except reuse as fuel. It is to benoted that both reprocessing as the same typeof product, and of different purposes areincluded. Direct recycling within industrialplants at the place of generation is excluded.
The situation is however quite heterogeneousamong countries (c.f. Figure 6.1). Around athird or more of the municipal waste collectedin Belgium, Germany and Switzerland are forrecycling; around a quarter in Denmark, theNetherlands, Austria, Sweden and Norway.This percentage is however relatively low (lessthan 10%) in Greece, Spain, Italy, Portugal andIceland. In Luxembourg, the share refers toscreens, TVs and refrigerators only.
Data for Candidate Countries are still scarce(see Table 6) and even crude estimations arenot possible.
Figure 6.1: Share of municipal waste collected for recycling, Western European Countries
0,00%
5,00%
10,00%
15,00%
20,00%
25,00%
30,00%
35,00%
40,00%
1998 2000 2000 2000 2000 2000 2000 1999 1999 2001 1999 2000 2000 1999 2001 2000 2000
BE DK DE EL ES FR IE IT LU NL AT PT SE UK IS NO CH
(as a percentage of total waste collected)
Luxembourg : data refers to screens, TVs and fridgesSource: Eurostat/OECD
Waste generated and treated in Europe 33
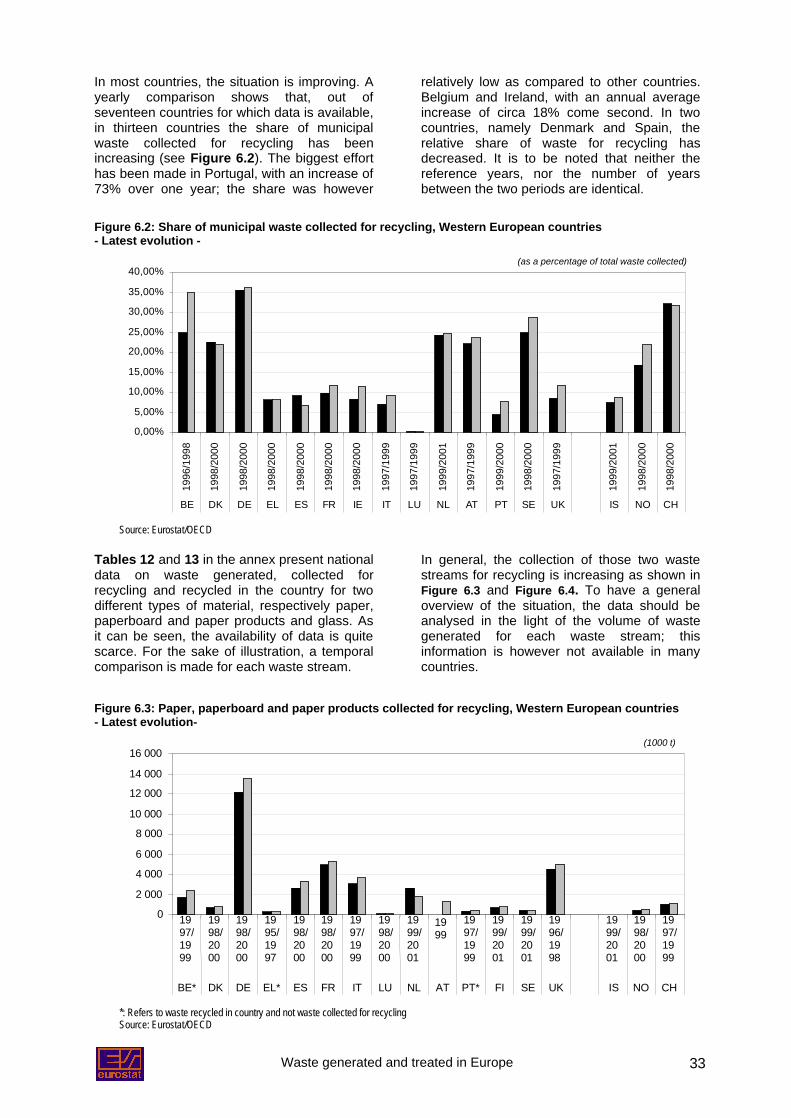
In most countries, the situation is improving. Ayearly comparison shows that, out ofseventeen countries for which data is available,in thirteen countries the share of municipalwaste collected for recycling has beenincreasing (see Figure 6.2). The biggest efforthas been made in Portugal, with an increase of73% over one year; the share was however
relatively low as compared to other countries.Belgium and Ireland, with an annual averageincrease of circa 18% come second. In twocountries, namely Denmark and Spain, therelative share of waste for recycling hasdecreased. It is to be noted that neither thereference years, nor the number of yearsbetween the two periods are identical.
Figure 6.2: Share of municipal waste collected for recycling, Western European countries- Latest evolution -
0,00%
5,00%
10,00%
15,00%
20,00%
25,00%
30,00%
35,00%
40,00%
1996
/199
8
1998
/200
0
1998
/200
0
1998
/200
0
1998
/200
0
1998
/200
0
1998
/200
0
1997
/199
9
1997
/199
9
1999
/200
1
1997
/199
9
1999
/200
0
1998
/200
0
1997
/199
9
1999
/200
1
1998
/200
0
1998
/200
0
BE DK DE EL ES FR IE IT LU NL AT PT SE UK IS NO CH
(as a percentage of total waste collected)
Source: Eurostat/OECD
Tables 12 and 13 in the annex present nationaldata on waste generated, collected forrecycling and recycled in the country for twodifferent types of material, respectively paper,paperboard and paper products and glass. Asit can be seen, the availability of data is quitescarce. For the sake of illustration, a temporalcomparison is made for each waste stream.
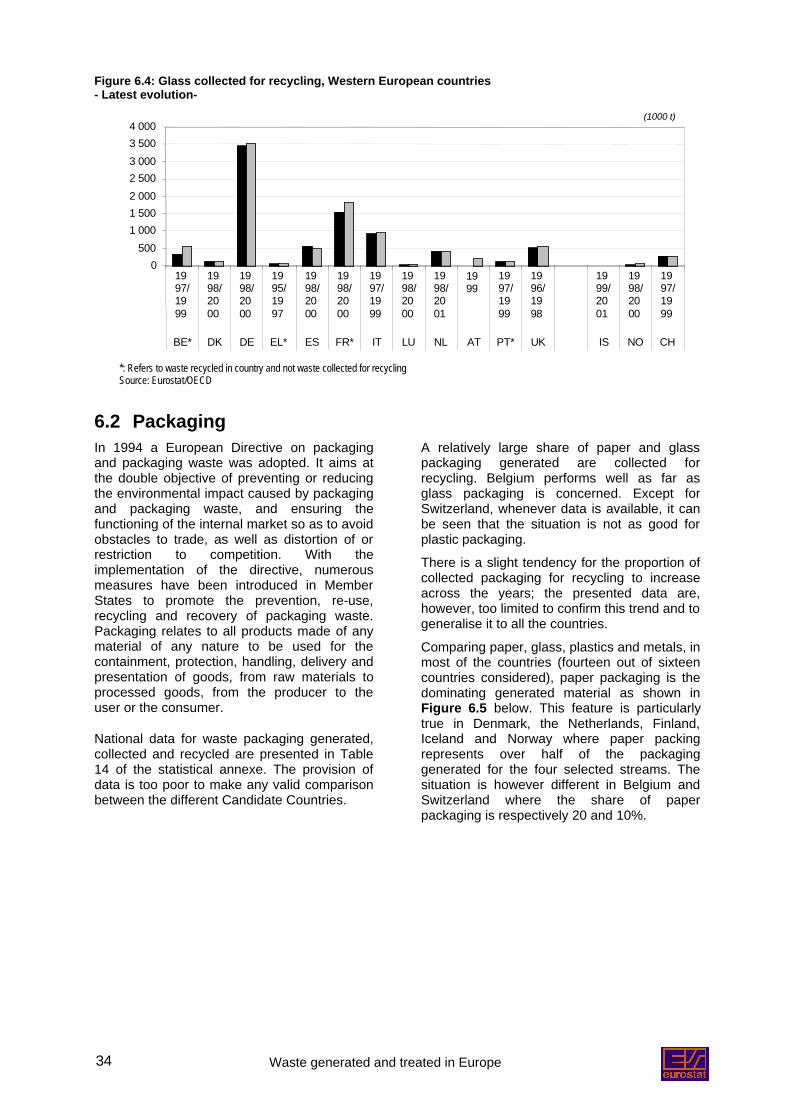
In general, the collection of those two wastestreams for recycling is increasing as shown inFigure 6.3 and Figure 6.4. To have a generaloverview of the situation, the data should beanalysed in the light of the volume of wastegenerated for each waste stream; thisinformation is however not available in manycountries.
Figure 6.3: Paper, paperboard and paper products collected for recycling, Western European countries- Latest evolution-
0
2 000
4 000
6 000
8 000
10 000
12 000
14 000
16 000
1997/1999
1998/2000
1998/2000
1995/1997
1998/2000
1998/2000
1997/1999
1998/2000
1999/2001
1999
1997/1999
1999/2001
1999/2001
1996/1998
1999/2001
1998/2000
1997/1999
BE* DK DE EL* ES FR IT LU NL AT PT* FI SE UK IS NO CH
(1000 t)
*: Refers to waste recycled in country and not waste collected for recyclingSource: Eurostat/OECD
Waste generated and treated in Europe34
Figure 6.4: Glass collected for recycling, Western European countries- Latest evolution-
0500
1 0001 5002 0002 5003 0003 5004 000
1997/1999
1998/2000
1998/2000
1995/1997
1998/2000
1998/2000
1997/1999
1998/2000
1998/2001
1999
1997/1999
1996/1998
1999/2001
1998/2000
1997/1999
BE* DK DE EL* ES FR* IT LU NL AT PT* UK IS NO CH
(1000 t)
*: Refers to waste recycled in country and not waste collected for recyclingSource: Eurostat/OECD
6.2 PackagingIn 1994 a European Directive on packagingand packaging waste was adopted. It aims atthe double objective of preventing or reducingthe environmental impact caused by packagingand packaging waste, and ensuring thefunctioning of the internal market so as to avoidobstacles to trade, as well as distortion of orrestriction to competition. With theimplementation of the directive, numerousmeasures have been introduced in MemberStates to promote the prevention, re-use,recycling and recovery of packaging waste.Packaging relates to all products made of anymaterial of any nature to be used for thecontainment, protection, handling, delivery andpresentation of goods, from raw materials toprocessed goods, from the producer to theuser or the consumer.
National data for waste packaging generated,collected and recycled are presented in Table14 of the statistical annexe. The provision ofdata is too poor to make any valid comparisonbetween the different Candidate Countries.
A relatively large share of paper and glasspackaging generated are collected forrecycling. Belgium performs well as far asglass packaging is concerned. Except forSwitzerland, whenever data is available, it canbe seen that the situation is not as good forplastic packaging.
There is a slight tendency for the proportion ofcollected packaging for recycling to increaseacross the years; the presented data are,however, too limited to confirm this trend and togeneralise it to all the countries.
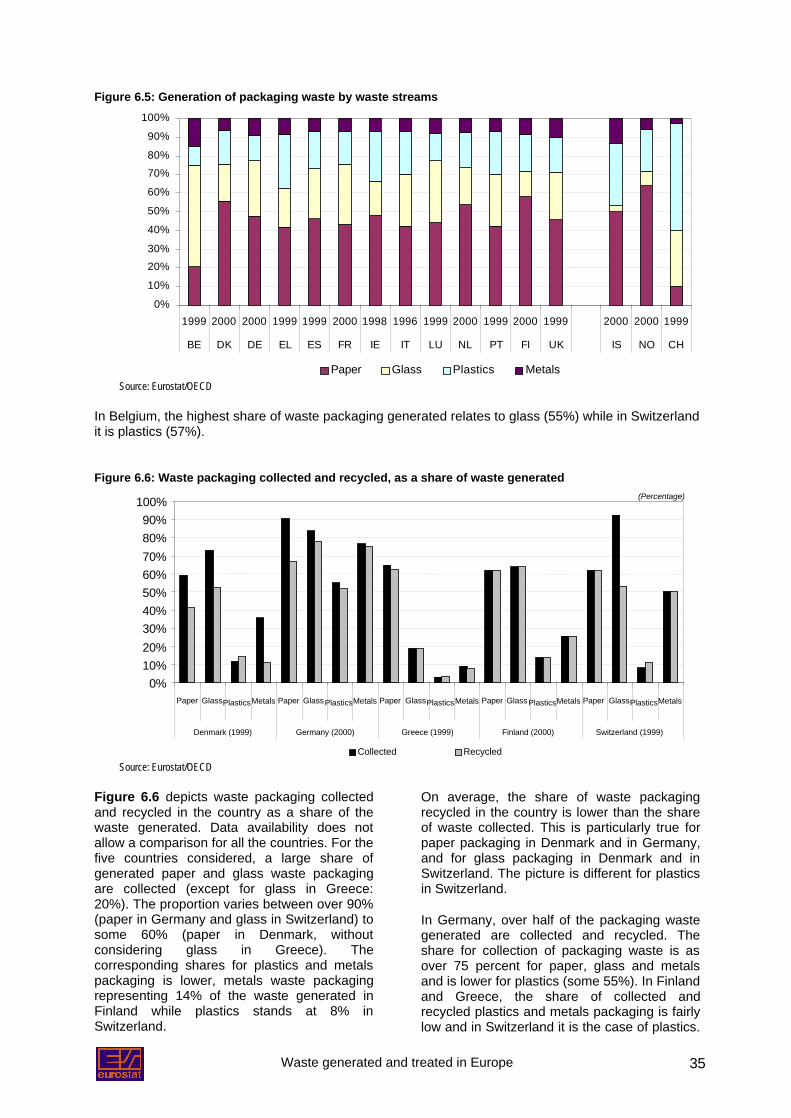
Comparing paper, glass, plastics and metals, inmost of the countries (fourteen out of sixteencountries considered), paper packaging is thedominating generated material as shown inFigure 6.5 below. This feature is particularlytrue in Denmark, the Netherlands, Finland,Iceland and Norway where paper packingrepresents over half of the packaginggenerated for the four selected streams. Thesituation is however different in Belgium andSwitzerland where the share of paperpackaging is respectively 20 and 10%.
Waste generated and treated in Europe 35
Figure 6.5: Generation of packaging waste by waste streams
0%
10%
20%30%
40%
50%
60%
70%80%
90%
100%
1999 2000 2000 1999 1999 2000 1998 1996 1999 2000 1999 2000 1999 2000 2000 1999
BE DK DE EL ES FR IE IT LU NL PT FI UK IS NO CH
Paper Glass Plastics MetalsSource: Eurostat/OECD
In Belgium, the highest share of waste packaging generated relates to glass (55%) while in Switzerlandit is plastics (57%).
Figure 6.6: Waste packaging collected and recycled, as a share of waste generated
0%10%20%30%40%50%60%70%80%90%
100%
Paper GlassPlasticsMetals Paper GlassPlasticsMetals Paper GlassPlasticsMetals Paper GlassPlasticsMetals Paper GlassPlasticsMetals
Denmark (1999) Germany (2000) Greece (1999) Finland (2000) Switzerland (1999)
(Percentage)
Collected RecycledSource: Eurostat/OECD
Figure 6.6 depicts waste packaging collectedand recycled in the country as a share of thewaste generated. Data availability does notallow a comparison for all the countries. For thefive countries considered, a large share ofgenerated paper and glass waste packagingare collected (except for glass in Greece:20%). The proportion varies between over 90%(paper in Germany and glass in Switzerland) tosome 60% (paper in Denmark, withoutconsidering glass in Greece). Thecorresponding shares for plastics and metalspackaging is lower, metals waste packagingrepresenting 14% of the waste generated inFinland while plastics stands at 8% inSwitzerland.
On average, the share of waste packagingrecycled in the country is lower than the shareof waste collected. This is particularly true forpaper packaging in Denmark and in Germany,and for glass packaging in Denmark and inSwitzerland. The picture is different for plasticsin Switzerland.
In Germany, over half of the packaging wastegenerated are collected and recycled. Theshare for collection of packaging waste is asover 75 percent for paper, glass and metalsand is lower for plastics (some 55%). In Finlandand Greece, the share of collected andrecycled plastics and metals packaging is fairlylow and in Switzerland it is the case of plastics.
Waste generated and treated in Europe36
Annex
List of figures
Figure 2.1: Origin of waste in Europe ........................................................................................................ 9Figure 3.1: . Industrial waste generated by Western European Countries.................................................. 11Figure 3.2: Industrial waste generated by Candidate Countries ............................................................... 11Figure 3.3 Waste generated in the rubber and plastic products sector.................................................... 12Figure 3.4 Waste generated in the textile, leather and leather products sector ....................................... 12Figure 3.5 Waste generated in the pulp, paper products, publishing and printing sector ........................ 13Figure 3.6 Waste generated in the coke, refined petroleum products sector........................................... 13Figure 3.7 Waste generated in the chemical and chemical products sector ............................................ 13Figure 3.8 Waste generated in the basic metals, machinery, electrical, optical and transport
equipment sector ..................................................................................................................... 14Figure 3.9 Waste generated in the non-metallic mineral products sector ................................................ 14Figure 3.10 Waste generated in the food, beverages and tobacco sector................................................. 14Figure 3.11 Waste generated in the wood and wood products sector ....................................................... 15Figure 3.12 Waste generated in the non-elsewhere comprised sector ...................................................... 15Figure 4.1: Municipal and household waste generated per capita, Western-Europe .............................. 17Figure 4.2: Municipal and household waste generated per capita, Candidate Countries ......................... 17Figure 4.3: Municipal waste generated per capita by country in Western Europe
latest evolution - ...................................................................................................................... 18Figure 4.4: Municipal waste generated per capita by country in Candidate Countries
latest evolution - ...................................................................................................................... 18Figure 4.5: Composition of municipal waste.............................................................................................. 19Figure 4.6: Composition of municipal waste, Western Europe.................................................................. 20Figure 4.7: Composition of municipal waste, Candidate Countries ........................................................... 20Figure 4.8: Municipal waste by type of collection ...................................................................................... 21Figure 4.9: Separate collection of waste fractions, as a percentage of total municipal waste .................. 21Figure 4.10: Share of waste material in municipal waste collected separately, in percentage
a country comparison .............................................................................................................. 22Figure 4.11: Share of waste material in municipal waste collected separately in percentage
a time comparison for France and Ireland ............................................................................. 22Figure 4.12: Share of waste material in municipal waste collected separately in percentage
a time comparison for Spain and The Netherlands ................................................................ 23Figure 4.13: Treatment and disposal of municipal waste in Western Europe ............................................. 23Figure 4.14: Treatment and disposal of municipal waste in Candidate Countries ...................................... 24Figure 4.15: Share of municipal waste disposed of through landfill, Western European Countries ........... 25Figure 5.1: Hazardous waste generated by country, Western Europe ..................................................... 26Figure 5.2: Hazardous waste generated by country, Candidate Countries............................................... 27Figure 5.3: Hazardous waste generated by country, a time comparison, Western Europe ...................... 28Figure 5.4: Hazardous waste generated by country, a time comparison, Candidate Countries ............... 28Figure 5.5: Share of hazardous waste managed by recovery operations ................................................. 29Figure 5.6: Share of hazardous waste landfilled ....................................................................................... 30Figure 5.7: Physico/chemical treatment of hazardous waste .................................................................... 31Figure 6.1: Share of municipal waste collected for recycling, Western European Countries ................... 32Figure 6.2: Share of municipal waste collected for recycling, Western European Countries
latest evolution ........................................................................................................................ 33
Waste generated and treated in Europe 37
Figure 6.3: Paper, paperboard and paper products collected for recycling, Western EuropeanCountries latest evolution-....................................................................................................... 33
Figure 6.4: Glass collected for recycling, Western European Countrieslatest evolution ....................................................................................................................... 34
Figure 6.5: Generation of packaging waste by waste streams ................................................................. 35Figure 6.6: Waste packaging collected and recycled, as a share of waste generated ............................. 35
Waste generated and treated in Europe38
List of tablesTable 1: Total amount of waste generated ......................................................................... 46
Table 2: Waste generated by economic sector .................................................................. 48
Table 3: Industrial waste generated by branch .................................................................. 54
Table 4: Generation of waste by selected streams ............................................................ 59
Table 5: Generation and collection of municipal waste ...................................................... 68
Table 6: Treatment and disposal of municipal waste, by method ...................................... 78
Table 7: Composition of municipal waste ........................................................................... 87
Table 8: Hazardous waste generated................................................................................. 95
Table 9: Treatment and disposal of hazardous waste, by method..................................... 97
Table 10hw: Waste treatment and disposal facilities for hazardous waste .............................. 107
Table 10nhwhw: Waste treatment and disposal facilities for hazardous & non-hazardous waste.. 111
Table 10nhw: Waste treatment and disposal facilities for non-hazardous waste ....................... 115
Table 11: Hazardous waste generated by economic sector ................................................ 120
Table 12: Collection and recycling of paper, paperboard and paper products..................... 123
Table 13: Collection and recycling of glass .......................................................................... 127
Table14: Collection and recycling of packaging waste........................................................ 131
Table15: Generation, treatment and disposal of non-hazardous industrial waste,by method ............................................................................................................. 137
Waste generated and treated in Europe 39
Community legislation(Source: New Cronos, 25/06/2003, Environment and energy, domain MILIEU)
- Council Directive 75/439/EEC of 16 June 1975 on the disposal of waste oils
- Council Directive 75/442/EEC of 15 July 1975 on waste
- Council Directive 78/176/EEC of 20 February 1978 on waste from the titanium dioxide industry
- Council Recommendation 81/972/EEC of 3 December 1981 concerning reuse of waste paper anduse of recycled paper
- Council Directive 86/278/EEC of 12 June 1986 on the protection of the environment, and inparticular of the soil, when sewage sludge is used in agriculture
- Council Directive 91/157/EEC of 18 March 1991 on batteries and accumulators containing certaindangerous substances
- Council Directive 91/156/EEC of 18 March 1991 amending Directive 75/442/EEC
- Council Directive 91/689/EEC of 12 December 1991 on hazardous waste
- Council Directive 91/692/EEC of 23 December 1991 standardising and rationalising reports on theimplementation of certain Directives relating to the environment
- Council Regulation (EEC) No 259/93 of 1 February 1993 on the supervision and control ofshipments of waste within, into and out of the European Community
- Council Regulation (EEC) No 793/93 of 23 March 1993 on the evaluation and control of the risks ofexisting substances
- Commission Decision 94/3/EC of 20 December 1993 establishing a list of wastes pursuant toArticle 1 (a) of Council Directive 75/442/EEC on waste
- Commission Decision 94/741/EC of 24 October 1994 concerning questionnaires for MemberStates reports on the implementation of certain Directives in the waste sector (implementation ofCouncil Directive 91/692/EEC)
- Council Decision 94/904/EC of 22 December 1994 establishing a list of hazardous waste pursuantto Article 1 (4) of Council Directive 91/689/EEC on hazardous waste
- Council Directive 94/67/EC of 16 December 1994 on the incineration of hazardous waste
- European Parliament and Council Directive 94/62/EC of 20 December 1994 on packaging andpackaging waste
- Council Directive 96/59/EC of 16 September 1996 on the disposal of polychlorinated biphenyls andpolychlorinated terphenyls (PCB/PCT)
- Commission Decision 97/138/EC of 3 February 1997 establishing the formats relating to thedatabase system pursuant to European Parliament and Council Directive 94/62/EC on packagingand packaging waste (Text with EEA relevance)
- Commission Decision 97/622/EC of 27 May 1997 concerning questionnaires for Member Statesreports on the implementation of certain Directives in the waste sector (implementation of CouncilDirective 91/692/EEC)
Waste generated and treated in Europe40
- Council Decision 97/640/EC of 22 September 1997 on the approval, on behalf of the Community,of the amendment to the Convention on the control of transboundary movements of hazardouswastes and their disposal (Basel Convention), as laid down in Decision III/1 of the Conference ofthe Parties.
- Council Resolution of 24 February 1997 on a Community strategy for waste management
- Commission Decision 98/184/EC of 25 February 1998 concerning a questionnaire for MemberStates' reports on the implementation of Council Directive 94/67/EC on the incineration ofhazardous waste (implementation of Council Directive 91/692/EEC) (Text with EEA relevance)
- Commission Decision 1999/177/EC of 8 February 1999 establishing the conditions for aderogation for plastic crates and plastic pallets in relation to the heavy metal concentration levelsestablished in Directive 94/62/EC on packaging and packaging waste (notified under documentnumber C(1999)246) (Text with EEA relevance)
- Commission Decision 1999/412/EC of 3 June 1999 concerning a questionnaire for the reportingobligation of Member States pursuant to Article 41(2) of Council Regulation (EEC) No 259/93(notified under document number C(1999)1456)
- Council Directive 1999/31/EC of 26 April 1999 on the landfill of waste
- Council Regulation (EC) No 1547/1999 of 12 July 1999 determining the control procedures underCouncil Regulation (EEC) No 259/93 to apply to shipments of certain types of waste to certaincountries to which OECD Decision C(92)39 final does not apply (Text with EEA relevance)
- Council and Parliament Directive 2000/76/EC on the incineration of waste
- Commission Decision 2000/532/EC of 3 May 2000 replacing Decision 94/3/EC establishing a list ofwastes pursuant to Article 1(a) of Council Directive 75/442/EEC on waste and Council Decision94/904/EC establishing a list of hazardous waste pursuant to Article 1(4) of Council Directive91/689/EEC on hazardous waste (notified under document number C(2000) 1147) (Text with EEArelevance)
- Commission's proposal COM/2001/0137 final Amended proposal for a Regulation of the EuropeanParliament and of the Council on waste statistics (presented by the Commission pursuant to Article250 (2) of the EC-Treaty)
- Regulation (EC) No 2150/2002 of the European Parliament and of the Council of 25 November2002 on waste statistics
Waste generated and treated in Europe 41
Basel Convention, list of waste streams
The Eurostat/OECD questionnaire refers to the generation of hazardous waste as defined in the BaselConvention 11, i.e. 18 categories of waste streams to be controlled. These categories are:
- clinical wastes;- wastes from the production of pharmaceutical products;- waste pharmaceuticals, drugs, medicines;- wastes from production of biocides and phytopharmaceuticals;- wastes from the manufacture and used of wood preserving chemicals;- wastes from the production and use of organic solvents;- wastes from heat treatment and operations containing cyanides;- waste mineral oils;- waste oil emulsions, mixtures;- waste containing PCBs, and/or PCTs, and/or PBBs;- waste tarry residues from refining, distillation, and any pyrolytic treatment;- wastes from production and use of inks, dyes, pigments, paints, lacquers, varnish;- wastes from the production and use of resins, latex, plasticizers, glues,/adhesives;- waste chemical substances (not identified and/or new) from R&D or teaching activities;- waste of explosive nature, not subject to other legislation;- waste from the production and use of photographic chemicals and processing materials;- waste from surface treatment of metals and plastics;- residues from industrial waste disposal operations.
_____________________________________________________11 Signed in 1989 under the auspices of UNEP (United Nations Environment Programme) to regulate the transboundary movements ofhazardous wastes, it lays down categories of waste and defines a list of characteristics which render waste hazardous.
Waste generated and treated in Europe42
“Environment 2010: Our future, Our choice”Waste in the Sixth Environment Action Programme
of the European Community
Objectives • To de-couple the generation of waste from economic growth and achieve a significant overallreduction in the volumes of waste generated through improved waste prevention initiatives, betterresource efficiency, and a shift to more sustainable consumption patterns;
For wastes that are still generated, to achieve a situation where:• the wastes are non-hazardous or at least present only very low risks to the environment and our
health;• the majority of the wastes are either reintroduced into the economic cycle, especially by recycling,
or are returned to the environment in a useful (e.g. composting) or harmless form;• the quantities of waste that still need to go to final disposal are reduced to an absolute minimum
and are safely destroyed or disposed of.• Waste is treated as closely as possible to where it is generated.
Targets Within a general strategy of waste prevention and increased recycling, to achieve in the lifetime of theprogramme a significant reduction in the quantity of waste going to final disposal and in the volumes ofhazardous waste generated.• Reduce the quantity of waste going to final disposal by around 20% by 2010 compared to 2000,
and in the order of 50% by 2050;• Reduce the volumes of hazardous waste generated by around 20% by 2010 compared to 2000
and in the order of 50% by 2020
Policyapproach
The Community’s approach to waste management policy is based on the guiding principle of thewaste hierarchy which gives preference first to waste prevention, then to waste recovery (whichincludes reuse, recycling and energy recovery, with preference being given to material recovery), andlastly to waste disposal (which includes incineration without energy recovery and landfilling). Thecurrent architecture of Community waste policy and legislation comprises three main elements:• framework legislation on waste definitions, site permitting, waste shipments controls, etc;• legislation governing the operating standards of waste facilities such as landfills and incinerators;• legislation targeted at specific priority waste streams such as end-of-life vehicles with the primary
aim of increasing recovery, and in particular recycling levels and reducing the hazardousness ofthese wastes.
Actions • Integrate waste prevention objectives and criteria into the Community’s Integrated Product Policyand the Community strategy on Chemicals.
• Revised Directive on sludges• Recommendation on construction and demolitions wastes• Legislative initiative on biodegradable wastes.• A Thematic Strategy on waste recycling to include the following types of actions:
o Identify which wastes should be recycled as a priority, based on criteria which are linked tothe resource management priorities, to the results of analyses that identify where recyclingproduces an obvious net environmental benefit, and to the ease and cost of recycling thewastes
o Formulate policies and measures that ensure the collection and recycling of these prioritywaste streams occurs, including indicative recycling targets and monitoring systems to trackand compare progress by Member States
Identify policies and instruments to encourage the creation of markets for recycled materials.
Waste generated and treated in Europe 43
Main elements of the EU Waste Management Strategy
Strategy Legal action in force Considered legal and political action
Prevent waste generation andreduce its hazardous content
Treaty, Art. 130RMember States are required to:
Possible proposals to set quantitative targets forreducing and recovering waste (COM(96) 399)
Hierarchy of principles:
preventionmaterial recoveryenergy recoverysafe disposal
• encourage firstly, the prevention or reduction of waste,secondly the recovery of waste by means of recycling, re-use or the use of waste as a source of energy (FrameworkDir, Art 3)
• ensure that waste is recovered or disposed of safely, andprohibit the dumping or uncontrolled disposal of waste(Framework Directive, Art. 4)
• draw up waste management plans (Framework Directive,Art. 7)
Prevention of waste generation Community Regulations on eco-audit and eco-labels (Regulation1836/93 and 880/92)
Member States required to take measures to prevent generationof packaging waste, limit the heavy metal content of packaging,and inform consumers (Directive 94/62, Art. 4, 11 and 13)
In particular cases EU-wide rules to limit or ban thepresence of heavy metals or specific substances inproducts to prevent hazardous waste to generate(COM (96) 399)
Integrate the principle of producer responsibility in allfuture measures on a case-by-case basis (COM (96)399)
Improve environmental dimensions of technicalstandards (Council Resolution 97/C76/o1)
Prevention of impact onenvironment
Prevent the negative impact on theenvironment
Member States required to take measures:• to reduce the heavy-metal content of batteries and
accumulators, ensure separate collection, informconsumers, and prohibit marketing of certain batteries(Directive 91/157)
• to collect and dispose of waste oils safely and prohibit anddischarge of waste oils into inland surface waters,groundwaters, etc. (Directive 75/439, Art 2. and 4)
• for the use of sewage sludge in agriculture in order toprevent harmful effects on soil, vegetation, animals andman (Directive 86/278)
• to implement common emission standards and operationcriteria for incinerators for MSW and hazardous waste(Directive 89/369 and 94/67)
Proposed specific requirements for Member States toensure that measures aiming at reducing the negativeimpact on the environment from end-of-life vehiclesare implemented (Com(97) 358)
Proposed directive on landfills setting minimumtechnical and administrative standards for landfills(Com (97) 105)
Recovery
Where generation of waste cannotbe avoided, waste shall be re-usedor recovered for its material orenergy. Where environmentallysound, re-use shall be furtherencouraged in order to avoidgeneration. Preference to be givento recovery of materials overenergy recovery operations.
Specific requirements for Member States to:• encourage re-use systems of packaging, to take the
necessary measures in order to attain certain targets ofrecovery and recycling of packaging, and to ensure thatsystems are set up to provide for the return and/orcollection of packaging waste (Directive 94/62, Art. 5-7)
• to give priority to the processing of waste oils byregeneration (Directive 75/439, Art. 3)
Consider EU quality requirements to define when agiven incineration operation is a recovery or a disposaloperation (COM (96) 399)
Proposed specific targets of re-use, recycling andrecovery for end-of-life vehicles, and demands forestablishing systems for the collection of all ELVs(COM (97) 358)
Development of a recycling industry based on moderntechnologies and methods and promote recyclability ofmaterials and products (COM (98) 463)
Final disposalAvoidance of incineration withoutenergy recovery and landfilling
Incineration with energy recoveryto be promoted for all incinerationinstallations, leaving landfilling inprinciple as the last solution. In themid-term, only non-recoverableand inert waste to be accepted inlandfills
• Disposal costs must be borne by the producer of the waste(Framework Directive, Art. 15)
• Member States required to make appropriate measures to:o establish an integrated and adequate network of
disposal installations (Framework Directive, Art. 5)o dispose of batteries and accumulators containing
dangerous substances separately (Directive 91/157,Art. 6)
o ensure safe combustion of waste oils, and whereneither regeneration nor combustion is feasible, toensure safe destruction or controlled storage or tipping(Directive 75/439, Art.4 )
o prohibit the uncontrolled discharge, dumping andtipping of PCBs/PCTs, making environmentally safedisposal compulsor (Directive 96/59)
Proposed requirement for Member States to ensurethat all costs are covered by the price to be chargedby the operator for the disposal of any type of waste inthat site and to set up a national strategy for reductionof biodegradable waste going to landfills ensuringcertain targets to be met (COM (97) 107)
Encourage Member States to make serious efforts toprevent and to minimise quantities of waste that go tolandfills, and in the long run to ensure that the price ofdisposal is make more transparent (CPM (96 399)
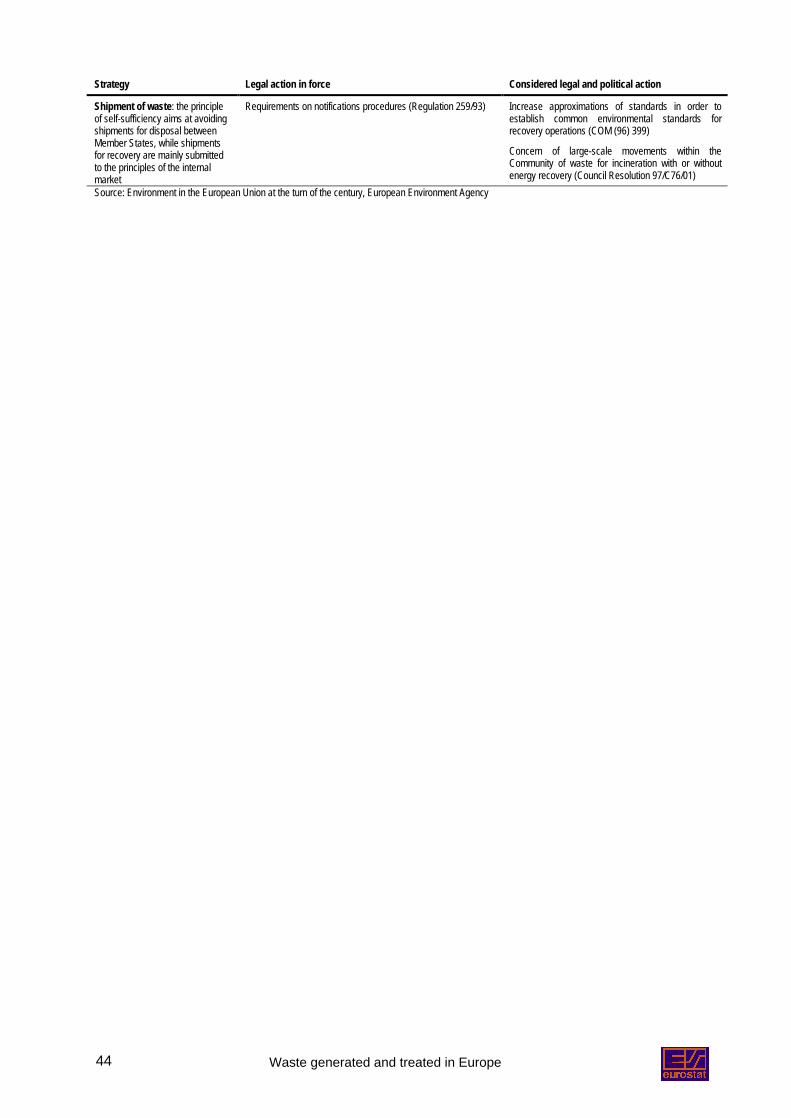
Waste generated and treated in Europe44
Strategy Legal action in force Considered legal and political action
Shipment of waste: the principleof self-sufficiency aims at avoidingshipments for disposal betweenMember States, while shipmentsfor recovery are mainly submittedto the principles of the internalmarket
Requirements on notifications procedures (Regulation 259/93) Increase approximations of standards in order toestablish common environmental standards forrecovery operations (COM (96) 399)
Concern of large-scale movements within theCommunity of waste for incineration with or withoutenergy recovery (Council Resolution 97/C76/01)
Source: Environment in the European Union at the turn of the century, European Environment Agency
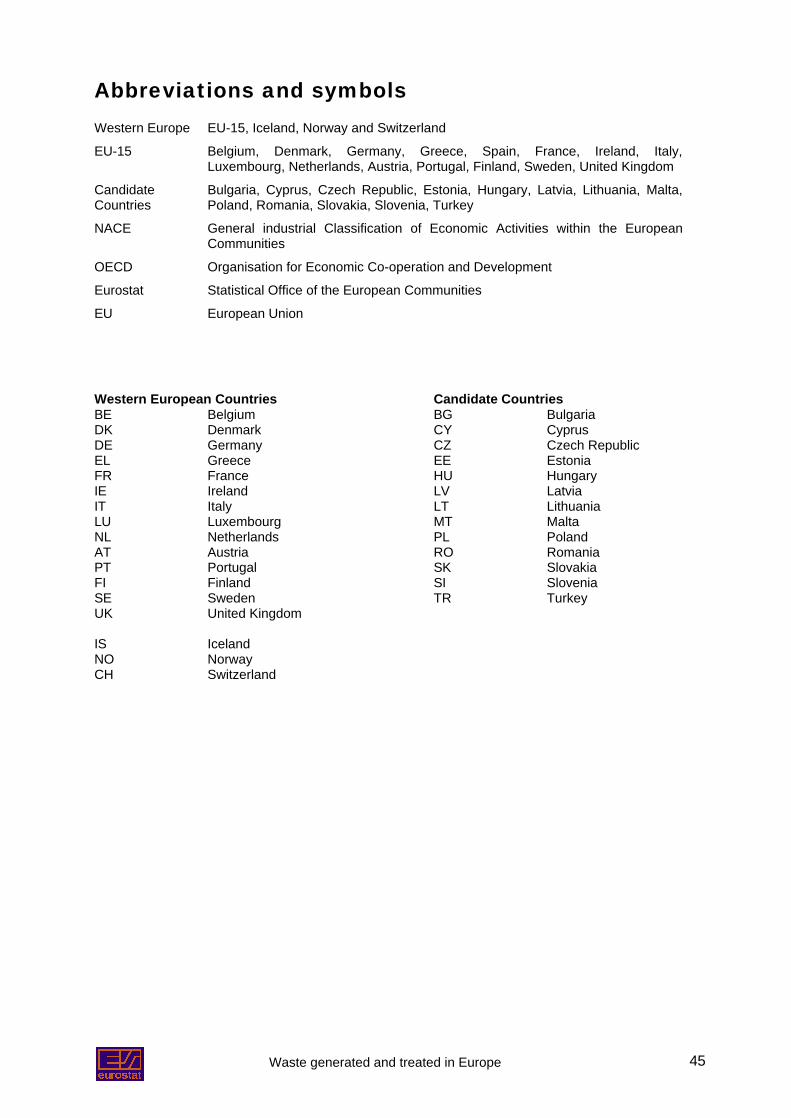
Waste generated and treated in Europe 45
Abbreviations and symbolsWestern Europe EU-15, Iceland, Norway and Switzerland
EU-15 Belgium, Denmark, Germany, Greece, Spain, France, Ireland, Italy,Luxembourg, Netherlands, Austria, Portugal, Finland, Sweden, United Kingdom
CandidateCountries
Bulgaria, Cyprus, Czech Republic, Estonia, Hungary, Latvia, Lithuania, Malta,Poland, Romania, Slovakia, Slovenia, Turkey
NACE General industrial Classification of Economic Activities within the EuropeanCommunities
OECD Organisation for Economic Co-operation and Development
Eurostat Statistical Office of the European Communities
EU European Union
Western European Countries Candidate CountriesBE Belgium BG BulgariaDK Denmark CY CyprusDE Germany CZ Czech RepublicEL Greece EE EstoniaFR France HU HungaryIE Ireland LV LatviaIT Italy LT LithuaniaLU Luxembourg MT MaltaNL Netherlands PL PolandAT Austria RO RomaniaPT Portugal SK SlovakiaFI Finland SI SloveniaSE Sweden TR TurkeyUK United Kingdom
IS IcelandNO NorwayCH Switzerland
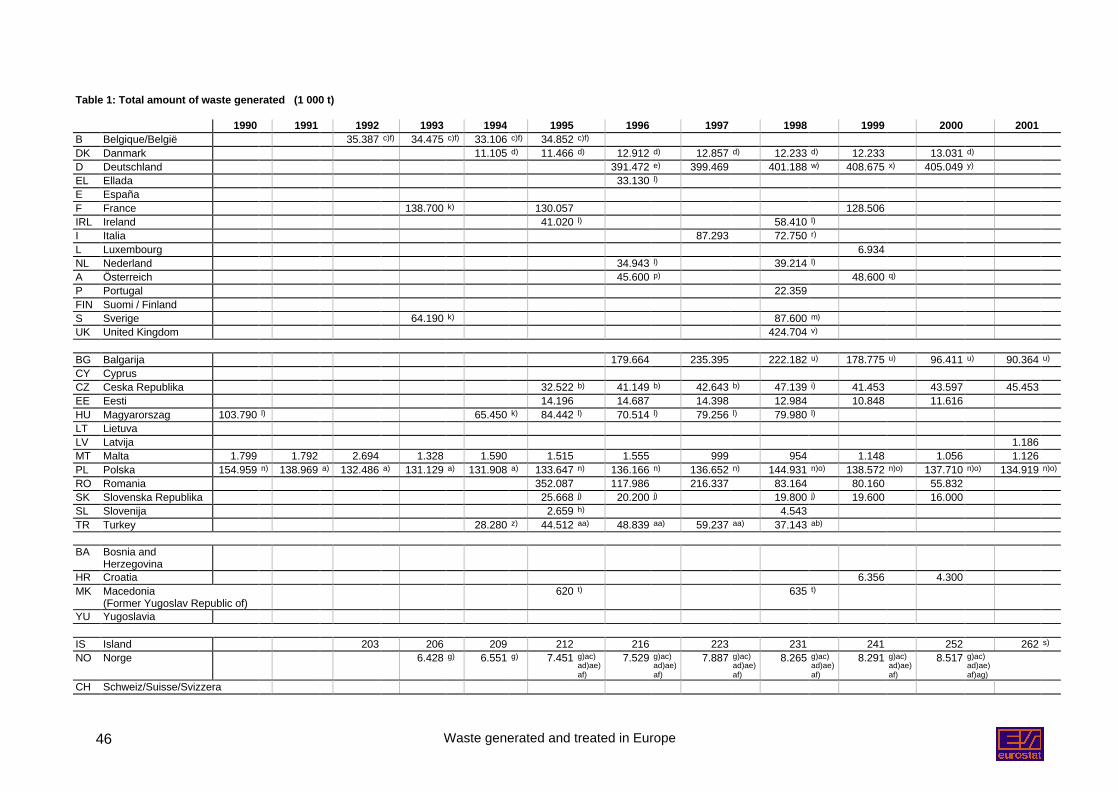
Waste generated and treated in Europe46
Table 1: Total amount of waste generated (1 000 t)
1990 1991 1992 1993 1994 1995 1996 1997 1998 1999 2000 2001B Belgique/België 35.387 c)f) 34.475 c)f) 33.106 c)f) 34.852 c)f)
DK Danmark 11.105 d) 11.466 d) 12.912 d) 12.857 d) 12.233 d) 12.233 13.031 d)
D Deutschland 391.472 e) 399.469 401.188 w) 408.675 x) 405.049 y)
EL Ellada 33.130 l)
E EspañaF France 138.700 k) 130.057 128.506IRL Ireland 41.020 l) 58.410 l)
I Italia 87.293 72.750 r)
L Luxembourg 6.934NL Nederland 34.943 l) 39.214 l)
A Österreich 45.600 p) 48.600 q)
P Portugal 22.359FIN Suomi / FinlandS Sverige 64.190 k) 87.600 m)
UK United Kingdom 424.704 v)
BG Balgarija 179.664 235.395 222.182 u) 178.775 u) 96.411 u) 90.364 u)
CY CyprusCZ Ceska Republika 32.522 b) 41.149 b) 42.643 b) 47.139 i) 41.453 43.597 45.453EE Eesti 14.196 14.687 14.398 12.984 10.848 11.616HU Magyarorszag 103.790 l) 65.450 k) 84.442 l) 70.514 l) 79.256 l) 79.980 l)
LT LietuvaLV Latvija 1.186MT Malta 1.799 1.792 2.694 1.328 1.590 1.515 1.555 999 954 1.148 1.056 1.126PL Polska 154.959 n) 138.969 a) 132.486 a) 131.129 a) 131.908 a) 133.647 n) 136.166 n) 136.652 n) 144.931 n)o) 138.572 n)o) 137.710 n)o) 134.919 n)o)
RO Romania 352.087 117.986 216.337 83.164 80.160 55.832SK Slovenska Republika 25.668 j) 20.200 j) 19.800 j) 19.600 16.000SL Slovenija 2.659 h) 4.543TR Turkey 28.280 z) 44.512 aa) 48.839 aa) 59.237 aa) 37.143 ab)
BA Bosnia andHerzegovina
HR Croatia 6.356 4.300MK Macedonia
(Former Yugoslav Republic of)620 t) 635 t)
YU Yugoslavia
IS Island 203 206 209 212 216 223 231 241 252 262 s)
NO Norge 6.428 g) 6.551 g) 7.451 g)ac)ad)ae)af)
7.529 g)ac)ad)ae)af)
7.887 g)ac)ad)ae)af)
8.265 g)ac)ad)ae)af)
8.291 g)ac)ad)ae)af)
8.517 g)ac)ad)ae)af)ag)
CH Schweiz/Suisse/Svizzera
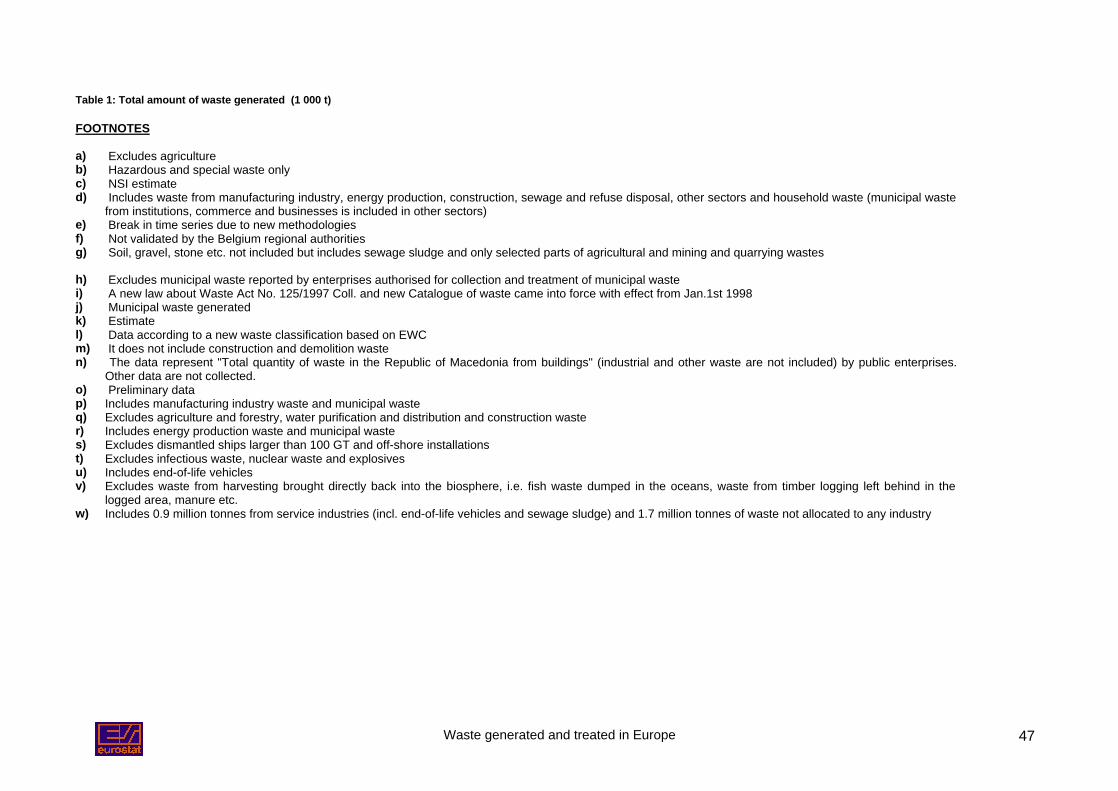
Waste generated and treated in Europe 47
Table 1: Total amount of waste generated (1 000 t)
FOOTNOTES
a) Excludes agricultureb) Hazardous and special waste onlyc) NSI estimated) Includes waste from manufacturing industry, energy production, construction, sewage and refuse disposal, other sectors and household waste (municipal waste
from institutions, commerce and businesses is included in other sectors)e) Break in time series due to new methodologiesf) Not validated by the Belgium regional authoritiesg) Soil, gravel, stone etc. not included but includes sewage sludge and only selected parts of agricultural and mining and quarrying wastes
h) Excludes municipal waste reported by enterprises authorised for collection and treatment of municipal wastei) A new law about Waste Act No. 125/1997 Coll. and new Catalogue of waste came into force with effect from Jan.1st 1998j) Municipal waste generatedk) Estimatel) Data according to a new waste classification based on EWCm) It does not include construction and demolition wasten) The data represent "Total quantity of waste in the Republic of Macedonia from buildings" (industrial and other waste are not included) by public enterprises.
Other data are not collected.o) Preliminary datap) Includes manufacturing industry waste and municipal wasteq) Excludes agriculture and forestry, water purification and distribution and construction waster) Includes energy production waste and municipal wastes) Excludes dismantled ships larger than 100 GT and off-shore installationst) Excludes infectious waste, nuclear waste and explosivesu) Includes end-of-life vehiclesv) Excludes waste from harvesting brought directly back into the biosphere, i.e. fish waste dumped in the oceans, waste from timber logging left behind in the
logged area, manure etc.w) Includes 0.9 million tonnes from service industries (incl. end-of-life vehicles and sewage sludge) and 1.7 million tonnes of waste not allocated to any industry
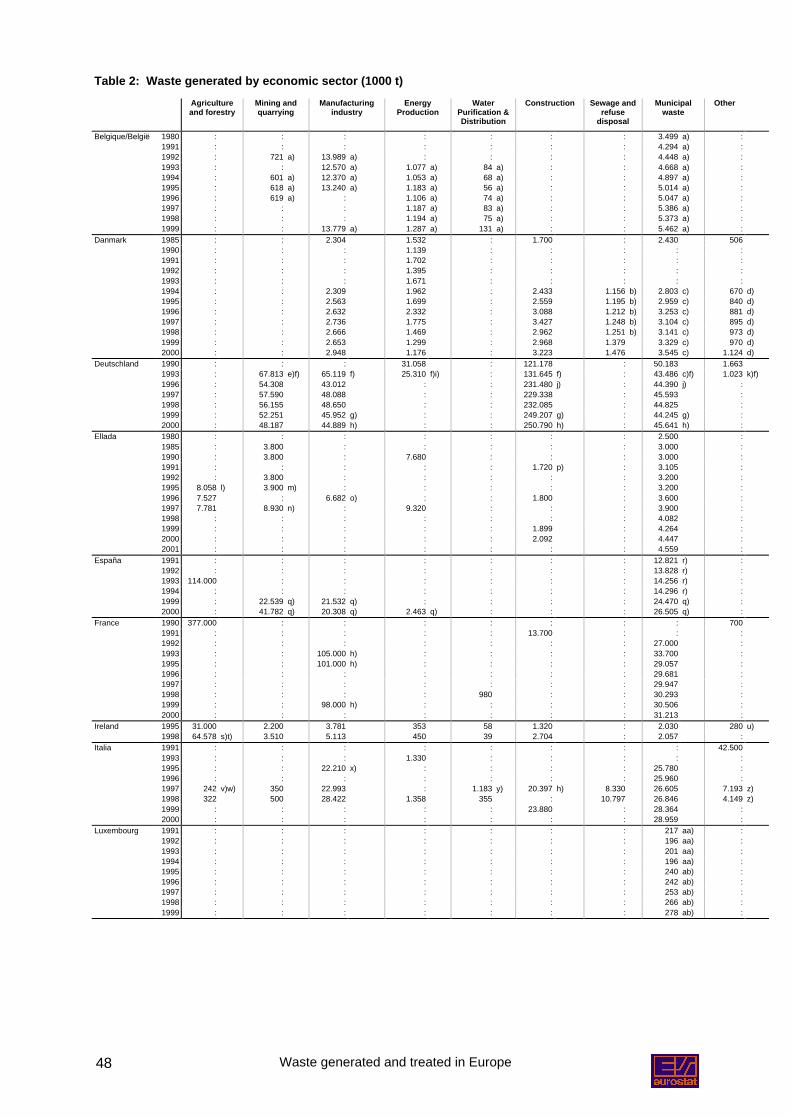
Waste generated and treated in Europe48
Table 2: Waste generated by economic sector (1000 t)Agricultureand forestry
Mining andquarrying
Manufacturingindustry
EnergyProduction
WaterPurification &Distribution
Construction Sewage andrefuse
disposal
Municipalwaste
Other
Belgique/België 1980 : : : : : : : 3.499 a) :1991 : : : : : : : 4.294 a) :1992 : 721 a) 13.989 a) : : : : 4.448 a) :1993 : : 12.570 a) 1.077 a) 84 a) : : 4.668 a) :1994 : 601 a) 12.370 a) 1.053 a) 68 a) : : 4.897 a) :1995 : 618 a) 13.240 a) 1.183 a) 56 a) : : 5.014 a) :1996 : 619 a) : 1.106 a) 74 a) : : 5.047 a) :1997 : : : 1.187 a) 83 a) : : 5.386 a) :1998 : : : 1.194 a) 75 a) : : 5.373 a) :1999 : : 13.779 a) 1.287 a) 131 a) : : 5.462 a) :
Danmark 1985 : : 2.304 1.532 : 1.700 : 2.430 5061990 : : : 1.139 : : : : :1991 : : : 1.702 : : : : :1992 : : : 1.395 : : : : :1993 : : : 1.671 : : : : :1994 : : 2.309 1.962 : 2.433 1.156 b) 2.803 c) 670 d)1995 : : 2.563 1.699 : 2.559 1.195 b) 2.959 c) 840 d)1996 : : 2.632 2.332 : 3.088 1.212 b) 3.253 c) 881 d)1997 : : 2.736 1.775 : 3.427 1.248 b) 3.104 c) 895 d)1998 : : 2.666 1.469 : 2.962 1.251 b) 3.141 c) 973 d)1999 : : 2.653 1.299 : 2.968 1.379 3.329 c) 970 d)2000 : : 2.948 1.176 : 3.223 1.476 3.545 c) 1.124 d)
Deutschland 1990 : : : 31.058 : 121.178 : 50.183 1.6631993 : 67.813 e)f) 65.119 f) 25.310 f)i) : 131.645 f) : 43.486 c)f) 1.023 k)f)1996 : 54.308 43.012 : : 231.480 j) : 44.390 j) :1997 : 57.590 48.088 : : 229.338 : 45.593 :1998 : 56.155 48.650 : : 232.085 : 44.825 :1999 : 52.251 45.952 g) : : 249.207 g) : 44.245 g) :2000 : 48.187 44.889 h) : : 250.790 h) : 45.641 h) :
Ellada 1980 : : : : : : : 2.500 :1985 : 3.800 : : : : : 3.000 :1990 : 3.800 : 7.680 : : : 3.000 :1991 : : : : : 1.720 p) : 3.105 :1992 : 3.800 : : : : : 3.200 :1995 8.058 l) 3.900 m) : : : : : 3.200 :1996 7.527 : 6.682 o) : : 1.800 : 3.600 :1997 7.781 8.930 n) : 9.320 : : : 3.900 :1998 : : : : : : : 4.082 :1999 : : : : : 1.899 : 4.264 :2000 : : : : : 2.092 : 4.447 :2001 : : : : : : : 4.559 :
España 1991 : : : : : : : 12.821 r) :1992 : : : : : : : 13.828 r) :1993 114.000 : : : : : : 14.256 r) :1994 : : : : : : : 14.296 r) :1999 : 22.539 q) 21.532 q) : : : : 24.470 q) :2000 : 41.782 q) 20.308 q) 2.463 q) : : : 26.505 q) :
France 1990 377.000 : : : : : : : 7001991 : : : : : 13.700 : : :1992 : : : : : : : 27.000 :1993 : : 105.000 h) : : : : 33.700 :1995 : : 101.000 h) : : : : 29.057 :1996 : : : : : : : 29.681 :1997 : : : : : : : 29.947 :1998 : : : : 980 : : 30.293 :1999 : : 98.000 h) : : : : 30.506 :2000 : : : : : : : 31.213 :
Ireland 1995 31.000 2.200 3.781 353 58 1.320 : 2.030 280 u)1998 64.578 s)t) 3.510 5.113 450 39 2.704 : 2.057 :
Italia 1991 : : : : : : : : 42.5001993 : : : 1.330 : : : : :1995 : : 22.210 x) : : : : 25.780 :1996 : : : : : : : 25.960 :1997 242 v)w) 350 22.993 : 1.183 y) 20.397 h) 8.330 26.605 7.193 z)1998 322 500 28.422 1.358 355 : 10.797 26.846 4.149 z)1999 : : : : : 23.880 : 28.364 :2000 : : : : : : : 28.959 :
Luxembourg 1991 : : : : : : : 217 aa) :1992 : : : : : : : 196 aa) :1993 : : : : : : : 201 aa) :1994 : : : : : : : 196 aa) :1995 : : : : : : : 240 ab) :1996 : : : : : : : 242 ab) :1997 : : : : : : : 253 ab) :1998 : : : : : : : 266 ab) :1999 : : : : : : : 278 ab) :
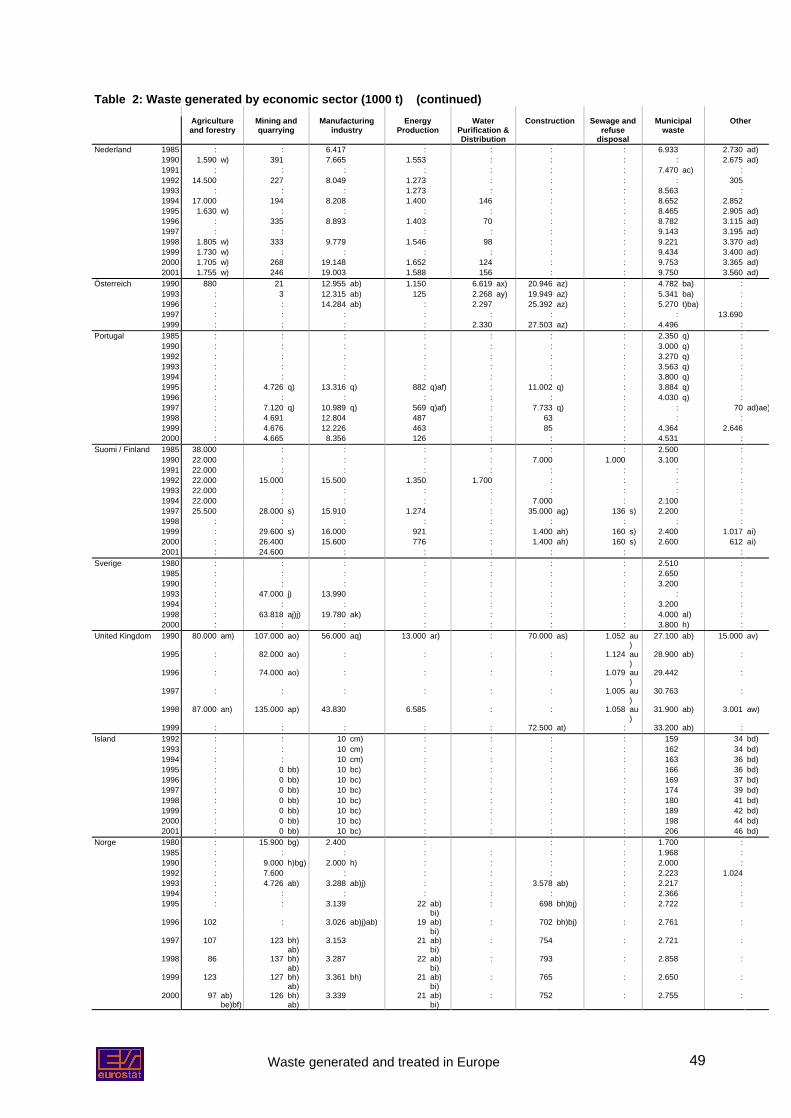
Waste generated and treated in Europe 49
Table 2: Waste generated by economic sector (1000 t) (continued)Agricultureand forestry
Mining andquarrying
Manufacturingindustry
EnergyProduction
WaterPurification &Distribution
Construction Sewage andrefuse
disposal
Municipalwaste
Other
Nederland 1985 : : 6.417 : : : : 6.933 2.730 ad)1990 1.590 w) 391 7.665 1.553 : : : : 2.675 ad)1991 : : : : : : : 7.470 ac) :1992 14.500 227 8.049 1.273 : : : : 3051993 : : : 1.273 : : : 8.563 :1994 17.000 194 8.208 1.400 146 : : 8.652 2.8521995 1.630 w) : : : : : : 8.465 2.905 ad)1996 : 335 8.893 1.403 70 : : 8.782 3.115 ad)1997 : : : : : : 9.143 3.195 ad)1998 1.805 w) 333 9.779 1.546 98 : : 9.221 3.370 ad)1999 1.730 w) : : : : : : 9.434 3.400 ad)2000 1.705 w) 268 19.148 1.652 124 : : 9.753 3.365 ad)2001 1.755 w) 246 19.003 1.588 156 : : 9.750 3.560 ad)
Österreich 1990 880 21 12.955 ab) 1.150 6.619 ax) 20.946 az) : 4.782 ba) :1993 : 3 12.315 ab) 125 2.268 ay) 19.949 az) : 5.341 ba) :1996 : : 14.284 ab) : 2.297 25.392 az) : 5.270 t)ba) :1997 : : : : : : : : 13.6901999 : : : : 2.330 27.503 az) : 4.496 :
Portugal 1985 : : : : : : : 2.350 q) :1990 : : : : : : : 3.000 q) :1992 : : : : : : : 3.270 q) :1993 : : : : : : : 3.563 q) :1994 : : : : : : : 3.800 q) :1995 : 4.726 q) 13.316 q) 882 q)af) : 11.002 q) : 3.884 q) :1996 : : : : : : : 4.030 q) :1997 : 7.120 q) 10.989 q) 569 q)af) : 7.733 q) : : 70 ad)ae)1998 : 4.691 12.804 487 : 63 : : :1999 : 4.676 12.226 463 : 85 : 4.364 2.6462000 : 4.665 8.356 126 : : : 4.531 :
Suomi / Finland 1985 38.000 : : : : : : 2.500 :1990 22.000 : : : : 7.000 1.000 3.100 :1991 22.000 : : : : : : : :1992 22.000 15.000 15.500 1.350 1.700 : : : :1993 22.000 : : : : : : : :1994 22.000 : : : : 7.000 : 2.100 :1997 25.500 28.000 s) 15.910 1.274 : 35.000 ag) 136 s) 2.200 :1998 : : : : : : : : :1999 : 29.600 s) 16.000 921 : 1.400 ah) 160 s) 2.400 1.017 ai)2000 : 26.400 15.600 776 : 1.400 ah) 160 s) 2.600 612 ai)2001 : 24.600 : : : : : :
Sverige 1980 : : : : : : : 2.510 :1985 : : : : : : : 2.650 :1990 : : : : : : : 3.200 :1993 : 47.000 j) 13.990 : : : : : :1994 : : : : : : : 3.200 :1998 : 63.818 aj)j) 19.780 ak) : : : : 4.000 al) :2000 : : : : : : : 3.800 h) :
United Kingdom 1990 80.000 am) 107.000 ao) 56.000 aq) 13.000 ar) : 70.000 as) 1.052 au)
27.100 ab) 15.000 av)
1995 : 82.000 ao) : : : : 1.124 au)
28.900 ab) :
1996 : 74.000 ao) : : : : 1.079 au)
29.442 :
1997 : : : : : : 1.005 au)
30.763 :
1998 87.000 an) 135.000 ap) 43.830 6.585 : : 1.058 au)
31.900 ab) 3.001 aw)
1999 : : : : : 72.500 at) : 33.200 ab) :Island 1992 : : 10 cm) : : : : 159 34 bd)
1993 : : 10 cm) : : : : 162 34 bd)1994 : : 10 cm) : : : : 163 36 bd)1995 : 0 bb) 10 bc) : : : : 166 36 bd)1996 : 0 bb) 10 bc) : : : : 169 37 bd)1997 : 0 bb) 10 bc) : : : : 174 39 bd)1998 : 0 bb) 10 bc) : : : : 180 41 bd)1999 : 0 bb) 10 bc) : : : : 189 42 bd)2000 : 0 bb) 10 bc) : : : : 198 44 bd)2001 : 0 bb) 10 bc) : : : : 206 46 bd)
Norge 1980 : 15.900 bg) 2.400 : : : 1.700 :1985 : : : : : : : 1.968 :1990 : 9.000 h)bg) 2.000 h) : : : : 2.000 :1992 : 7.600 : : : : : 2.223 1.0241993 : 4.726 ab) 3.288 ab)j) : : 3.578 ab) : 2.217 :1994 : : : : : : : 2.366 :1995 : : 3.139 22 ab)
bi): 698 bh)bj) : 2.722 :
1996 102 : 3.026 ab)j)ab) 19 ab)bi)
: 702 bh)bj) : 2.761 :
1997 107 123 bh)ab)
3.153 21 ab)bi)
: 754 : 2.721 :
1998 86 137 bh)ab)
3.287 22 ab)bi)
: 793 : 2.858 :
1999 123 127 bh)ab)
3.361 bh) 21 ab)bi)
: 765 : 2.650 :
2000 97 ab)be)bf)
126 bh)ab)
3.339 21 ab)bi)
: 752 : 2.755 :
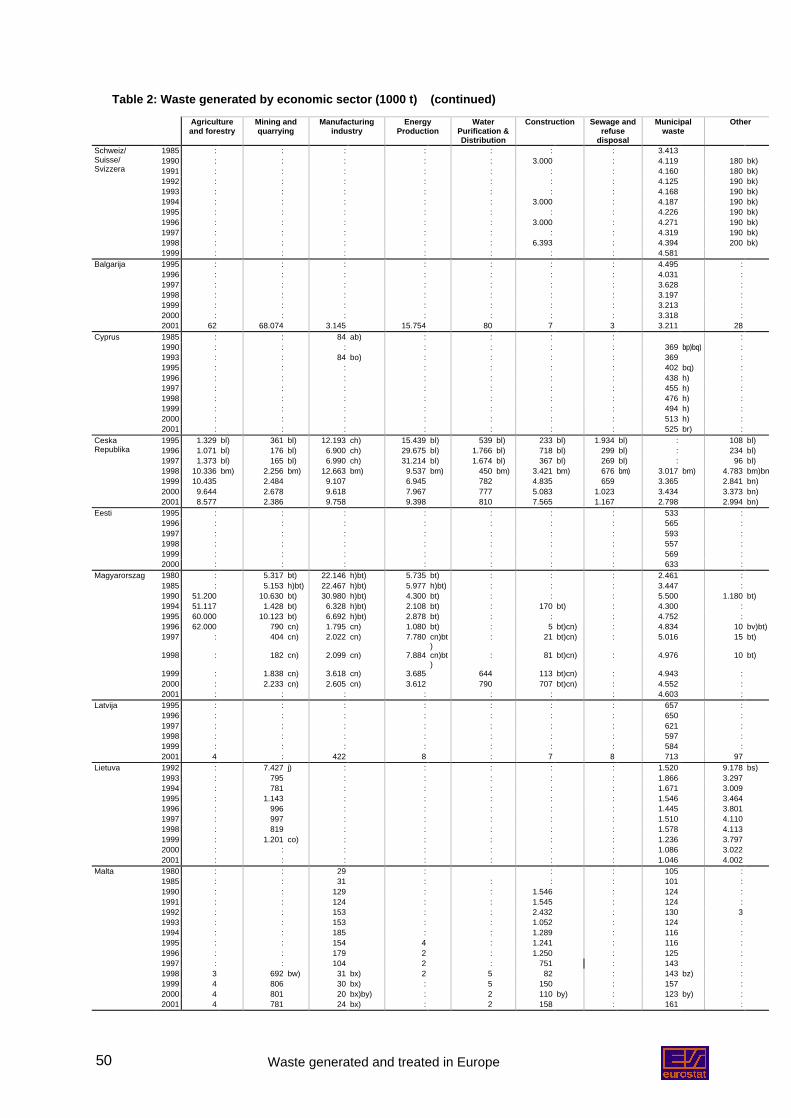
Waste generated and treated in Europe50
Table 2: Waste generated by economic sector (1000 t) (continued)Agricultureand forestry
Mining andquarrying
Manufacturingindustry
EnergyProduction
WaterPurification &Distribution
Construction Sewage andrefuse
disposal
Municipalwaste
Other
1985 : : : : : : : 3.4131990 : : : : : 3.000 : 4.119 180 bk)1991 : : : : : : : 4.160 180 bk)
Schweiz/Suisse/Svizzera
1992 : : : : : : : 4.125 190 bk)1993 : : : : : : : 4.168 190 bk)1994 : : : : : 3.000 : 4.187 190 bk)1995 : : : : : : : 4.226 190 bk)1996 : : : : : 3.000 : 4.271 190 bk)1997 : : : : : : : 4.319 190 bk)1998 : : : : : 6.393 : 4.394 200 bk)1999 : : : : : : : 4.581
Balgarija 1995 : : : : : : : 4.495 :1996 : : : : : : : 4.031 :1997 : : : : : : : 3.628 :1998 : : : : : : : 3.197 :1999 : : : : : : : 3.213 :2000 : : : : : : : 3.318 :2001 62 68.074 3.145 15.754 80 7 3 3.211 28
Cyprus 1985 : : 84 ab) : : : : :1990 : : : : : : : 369 bp)bq) :1993 : : 84 bo) : : : : 369 :1995 : : : : : : : 402 bq) :1996 : : : : : : : 438 h) :1997 : : : : : : : 455 h) :1998 : : : : : : : 476 h) :1999 : : : : : : : 494 h) :2000 : : : : : : : 513 h) :2001 : : : : : : : 525 br) :1995 1.329 bl) 361 bl) 12.193 ch) 15.439 bl) 539 bl) 233 bl) 1.934 bl) : 108 bl)1996 1.071 bl) 176 bl) 6.900 ch) 29.675 bl) 1.766 bl) 718 bl) 299 bl) : 234 bl)
CeskaRepublika
1997 1.373 bl) 165 bl) 6.990 ch) 31.214 bl) 1.674 bl) 367 bl) 269 bl) : 96 bl)1998 10.336 bm) 2.256 bm) 12.663 bm) 9.537 bm) 450 bm) 3.421 bm) 676 bm) 3.017 bm) 4.783 bm)bn)1999 10.435 2.484 9.107 6.945 782 4.835 659 3.365 2.841 bn)2000 9.644 2.678 9.618 7.967 777 5.083 1.023 3.434 3.373 bn)2001 8.577 2.386 9.758 9.398 810 7.565 1.167 2.798 2.994 bn)
Eesti 1995 : : : : : : : 533 :1996 : : : : : : : 565 :1997 : : : : : : : 593 :1998 : : : : : : : 557 :1999 : : : : : : : 569 :2000 : : : : : : : 633 :
Magyarorszag 1980 : 5.317 bt) 22.146 h)bt) 5.735 bt) : : : 2.461 :1985 : 5.153 h)bt) 22.467 h)bt) 5.977 h)bt) : : : 3.447 :1990 51.200 10.630 bt) 30.980 h)bt) 4.300 bt) : : : 5.500 1.180 bt)1994 51.117 1.428 bt) 6.328 h)bt) 2.108 bt) : 170 bt) : 4.300 :1995 60.000 10.123 bt) 6.692 h)bt) 2.878 bt) : : : 4.752 :1996 62.000 790 cn) 1.795 cn) 1.080 bt) : 5 bt)cn) : 4.834 10 bv)bt)1997 : 404 cn) 2.022 cn) 7.780 cn)bt
): 21 bt)cn) : 5.016 15 bt)
1998 : 182 cn) 2.099 cn) 7.884 cn)bt)
: 81 bt)cn) : 4.976 10 bt)
1999 : 1.838 cn) 3.618 cn) 3.685 644 113 bt)cn) : 4.943 :2000 : 2.233 cn) 2.605 cn) 3.612 790 707 bt)cn) : 4.552 :2001 : : : : : : : 4.603 :
Latvija 1995 : : : : : : : 657 :1996 : : : : : : : 650 :1997 : : : : : : : 621 :1998 : : : : : : : 597 :1999 : : : : : : : 584 :2001 4 : 422 8 : 7 8 713 97
Lietuva 1992 : 7.427 j) : : : : : 1.520 9.178 bs)1993 : 795 : : : : : 1.866 3.2971994 : 781 : : : : : 1.671 3.0091995 : 1.143 : : : : : 1.546 3.4641996 : 996 : : : : : 1.445 3.8011997 : 997 : : : : : 1.510 4.1101998 : 819 : : : : : 1.578 4.1131999 : 1.201 co) : : : : : 1.236 3.7972000 : : : : : : : 1.086 3.0222001 : : : : : : : 1.046 4.002
Malta 1980 : : 29 : : : 105 :1985 : : 31 : : : : 101 :1990 : : 129 : : 1.546 : 124 :1991 : : 124 : : 1.545 : 124 :1992 : : 153 : : 2.432 : 130 31993 : : 153 : : 1.052 : 124 :1994 : : 185 : : 1.289 : 116 :1995 : : 154 4 : 1.241 : 116 :1996 : : 179 2 : 1.250 : 125 :1997 : : 104 2 : 751 : 143 :1998 3 692 bw) 31 bx) 2 5 82 : 143 bz) :1999 4 806 30 bx) : 5 150 : 157 :2000 4 801 20 bx)by) : 2 110 by) : 123 by) :2001 4 781 24 bx) : 2 158 : 161 :
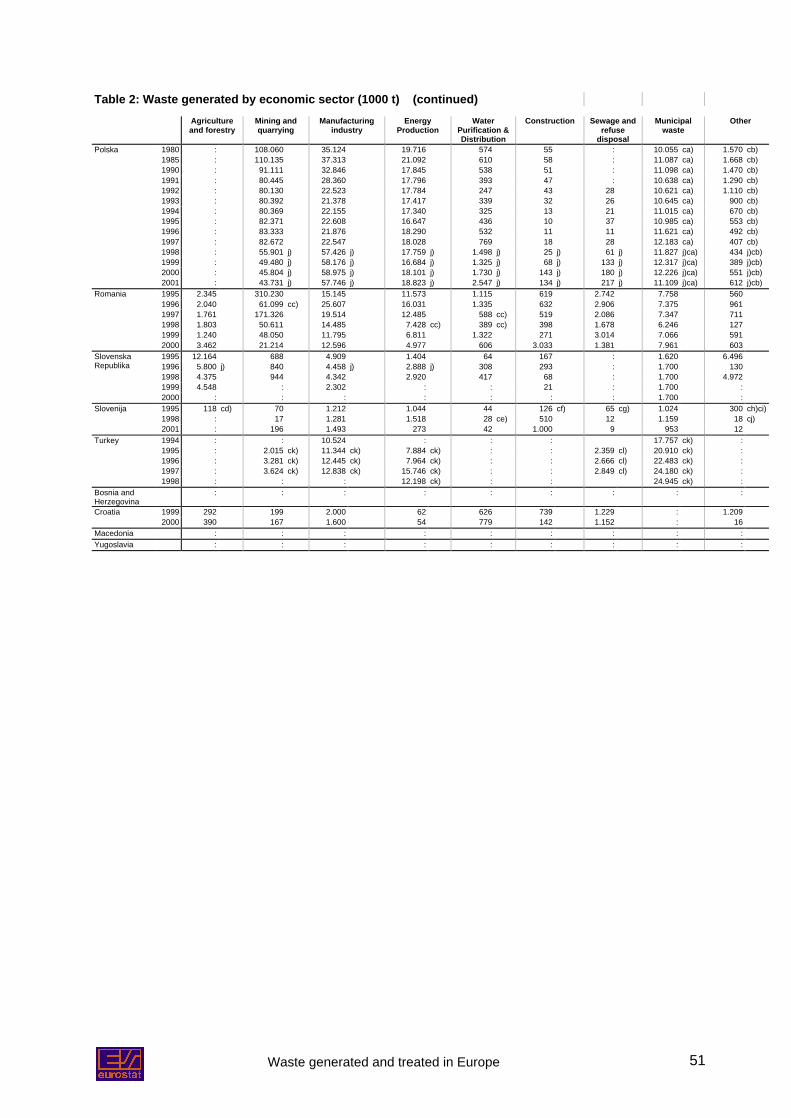
Waste generated and treated in Europe 51
Table 2: Waste generated by economic sector (1000 t) (continued)Agricultureand forestry
Mining andquarrying
Manufacturingindustry
EnergyProduction
WaterPurification &Distribution
Construction Sewage andrefuse
disposal
Municipalwaste
Other
Polska 1980 : 108.060 35.124 19.716 574 55 : 10.055 ca) 1.570 cb)1985 : 110.135 37.313 21.092 610 58 : 11.087 ca) 1.668 cb)1990 : 91.111 32.846 17.845 538 51 : 11.098 ca) 1.470 cb)1991 : 80.445 28.360 17.796 393 47 : 10.638 ca) 1.290 cb)1992 : 80.130 22.523 17.784 247 43 28 10.621 ca) 1.110 cb)1993 : 80.392 21.378 17.417 339 32 26 10.645 ca) 900 cb)1994 : 80.369 22.155 17.340 325 13 21 11.015 ca) 670 cb)1995 : 82.371 22.608 16.647 436 10 37 10.985 ca) 553 cb)1996 : 83.333 21.876 18.290 532 11 11 11.621 ca) 492 cb)1997 : 82.672 22.547 18.028 769 18 28 12.183 ca) 407 cb)1998 : 55.901 j) 57.426 j) 17.759 j) 1.498 j) 25 j) 61 j) 11.827 j)ca) 434 j)cb)1999 : 49.480 j) 58.176 j) 16.684 j) 1.325 j) 68 j) 133 j) 12.317 j)ca) 389 j)cb)2000 : 45.804 j) 58.975 j) 18.101 j) 1.730 j) 143 j) 180 j) 12.226 j)ca) 551 j)cb)2001 : 43.731 j) 57.746 j) 18.823 j) 2.547 j) 134 j) 217 j) 11.109 j)ca) 612 j)cb)
Romania 1995 2.345 310.230 15.145 11.573 1.115 619 2.742 7.758 5601996 2.040 61.099 cc) 25.607 16.031 1.335 632 2.906 7.375 9611997 1.761 171.326 19.514 12.485 588 cc) 519 2.086 7.347 7111998 1.803 50.611 14.485 7.428 cc) 389 cc) 398 1.678 6.246 1271999 1.240 48.050 11.795 6.811 1.322 271 3.014 7.066 5912000 3.462 21.214 12.596 4.977 606 3.033 1.381 7.961 6031995 12.164 688 4.909 1.404 64 167 : 1.620 6.4961996 5.800 j) 840 4.458 j) 2.888 j) 308 293 : 1.700 130
SlovenskaRepublika
1998 4.375 944 4.342 2.920 417 68 : 1.700 4.9721999 4.548 : 2.302 : : 21 : 1.700 :2000 : : : : : : : 1.700 :
Slovenija 1995 118 cd) 70 1.212 1.044 44 126 cf) 65 cg) 1.024 300 ch)ci)1998 : 17 1.281 1.518 28 ce) 510 12 1.159 18 cj)2001 : 196 1.493 273 42 1.000 9 953 12
Turkey 1994 : : 10.524 : : : 17.757 ck) :1995 : 2.015 ck) 11.344 ck) 7.884 ck) : : 2.359 cl) 20.910 ck) :1996 : 3.281 ck) 12.445 ck) 7.964 ck) : : 2.666 cl) 22.483 ck) :1997 : 3.624 ck) 12.838 ck) 15.746 ck) : : 2.849 cl) 24.180 ck) :1998 : : : 12.198 ck) : : 24.945 ck) :
Bosnia andHerzegovina
: : : : : : : : :
Croatia 1999 292 199 2.000 62 626 739 1.229 : 1.2092000 390 167 1.600 54 779 142 1.152 : 16
Macedonia : : : : : : : : :Yugoslavia : : : : : : : : :
Waste generated and treated in Europe52
Table 2: Waste generated by economic sector (1000 t)
FOOTNOTES
a) Not validated by the Belgium regional authorities. NSI estimate.b) Sewage only.c) Municipal waste consists of all types of wastes from households, domestic waste, bulky waste, garden waste, hospital
waste and separately collected fractions from institutions, commerce and offices.d) Data refer to institutions, wholesale, retail trade business service and other.e) Excavation material only.f) Source: Statistisches Bundesamt, Germanyg) Preliminaryh) Estimatei) Includes water purification and distribution and rest of mining.j) Break in time series due to new methodologies or classifications.k) Hospital waste.l) Agriculture waste includes 200 000 tonnes from forestry and the rest are discarded fruits.m) Mining includes only asbestos quarrying. Some other wastes are included in industrial wastes due to the classification of
the registry.n) Value refers to waste generated by extractive industry(mining and quarrying) inclunding wastes from extraction of basic
metals, non metalic, industrial minerals. Wastes resulting from energy generation projects are not included.o) Industry covers only establishments over 30 persons.p) Construction covers only private building activity.q) Source: INEr) Household and similar waste.s) Dry weightt) Dirty water included which gives rise to 20 million tonnes increase.u) Other industrial/trade w. collected by or on behalf of local authorities.v) Includes NACE from 01 to 05.w) Excludes Manure and excess manure.x) May include some mining and quarrying waste.y) Includes NACE 40, 41.z) Includes NACE from 91 to 99, NACE from 50 to 55 and NACE from 60 to 85.aa) Excludes separately collected fraction.ab) National estimate.ac) Underestimation of separately collected paper.ad) Waste from commerce and services.ae) Includes fabricated metalic products (except machinery and equipment); fabricated electrical machinery and equipment;
fabricated radio, television and communication equipment; fabricated medical and surgical equipment, orthopaedic, ofprecision, optical a
af) Production and distribution of energy, gas and water.ag) Includes construction waste and surplus soil from building sites, civil engineering sites and dredging, and from all sectorsah) Includes waste from housebuilding, including renovation and demolition. Does not contain surplus soil and stones. For
the year 1999 estimation for surplus soil and stones from house building sites is 8,5 million tonnes and from civilengineering sites 25
ai) Includes certain plants from NACE 42-89 which have granted an environmental permit, it is a rough estimaterepresenting incompletely these economics activities.
aj) Excludes NACE 10-12.ak) Excludes NACE 37.al) Amount of waste treated.am) Manure from housed livestock only, wet weight. Estimated in 1991, not updatedan) Figures come from a survey commissioned by the DETR and are for Great Britain only.ao) Includes waste from china clay and clay extraction, deep and open cast coal extraction, slate and quarryingap) UK estimates based on production data from the UK Minerals Yearbook includes dredgingaq) Includes 6 million tonnes from basic metal industries. The remaining 50 million tonnes is a broad estimate of wastes from
manufacturing industry.ar) Ash from power stations, data from Digest of Envrionmental Statisticsas) Includes excavated soil and miscellaneous materials as well as hard materials, e.g. brick, concrete and road planings.
Estimated in 1990, not updatedat) Figures for England and Wales only, from Environment Agency survey of Construction and Demolition Wasteau) Sewage sludge, dry weight, UK data from Water UKav) Commercial wasteaw) NACE sectors 50-52, 55, 60-67, 70-75, 80, 85ax) Wet mass - dry matter estimated at 5%.ay) Wet mass - dry matter estimated at 30%.az) Includes excavated soil, excludes construction site waste collected by municipalities
Waste generated and treated in Europe 53
FOOTNOTES (continued)
ba) Includes construction site wastebb) Mining not existent, very small quantities of quarrying activities usually recovered.bc) Slaughterhouse waste only. Waste from textile industries; leather industries; wood and wood products; paper products;
printing and publishing; chemical industries; rubber and plastics; and fabricated metal products and machinery are smallamounts of varyi
bd) Scrap metal collection activities, the metals being exported for recycling.be) Excludes end-of-life vehiclesbf) Excludes waste from harvesting brought directly back into the biosphere, i.e. fish waste dumped in the oceans, waste
from timber logging left behind in the logged area, manure etc.bg) Includes stone, gravel, sand etc.bh) Excludes soil, gravel, stone, etc.bi) Includes water purification etc.bj) Calculated from building statistics. Includes waste from construction, rehabilitation and demolition of buildings, but not
other infrastructure.bk) sewage sludge, dry weight.bl) hazardous and special waste only.bm) A new law about Waste Act No. 125/1997 Coll. and new Catalogue of waste came into force with effect from Jan.1st
1998bn) cover NACE 51, 55, 60, 64, 74, 85, 93bo) Data on industrial waste refer to the year 1985bp) Data refer to the year 1993 and are derived from an ad-hoc survey carried out at the landfill sites.bq) Data refer to municipal waste delivered to landfills. There may exist a small proportion of recycling before disposal to
landfills.br) Data are derived from a survey among municipalities conducted by the Statistical Service of Cyprus.bs) Break in time series due to an important decrease in the amount of organic waste generated as from 1993bt) Fluctuations in time series are due to structural changes in industriesbu) 1997 and 1998 figures include a mass amount of waste generated in a coal mine of a power station.bv) Data excluding hazardous waste; waste from privatised enterprises may not be fully covered.bw) Includes construction & demolition, & roads/streets debrisbx) Commercial/Industrial wasteby) Covers from April to December onlybz) Exclude commercial wasteca) Data on municipal waste refer to collection of municipal waste.cb) ISIC: 90; 93 and othercc) Break in time series due to inconsistencies in production and economic situationcd) Excludes private sectorce) Amount of sewage sludge is reported in the coresponding activities of its generation.cf) Includes waste from the main operators by contractcg) Includes secondary wastech) Includes G, H, I, K, L, M, N, and O without O 90.ci) no data available for 1991; figures for 1990 are provided.cj) Excludes municipal waste reported by enterprises authorised for collection and treatment of municipal waste.
Excludes private sector.Includes waste from the main operators by contract.Includes secondary waste.Includes G, H, I, K, L, M, N, and O without
ck) Refers to the amount of solid wastecl) Refers to the amount of sewage sludge of 439 establishments for 1995, 478 establishments for 1996 and 540
establishments for 1997. These amounts are originated from manufacturing industry establishments which have beenusing waste water treatment plant.
cm) Waste from textile industries; leather industries; wood and wood products; paper products; printing and publishing;chemical industries; rubber and plastics; and fabricated metal products and machinery are small amounts of varyingquantity collected as mu
cn) Data based on firms with more than 10 employees.co) Recovery of industry
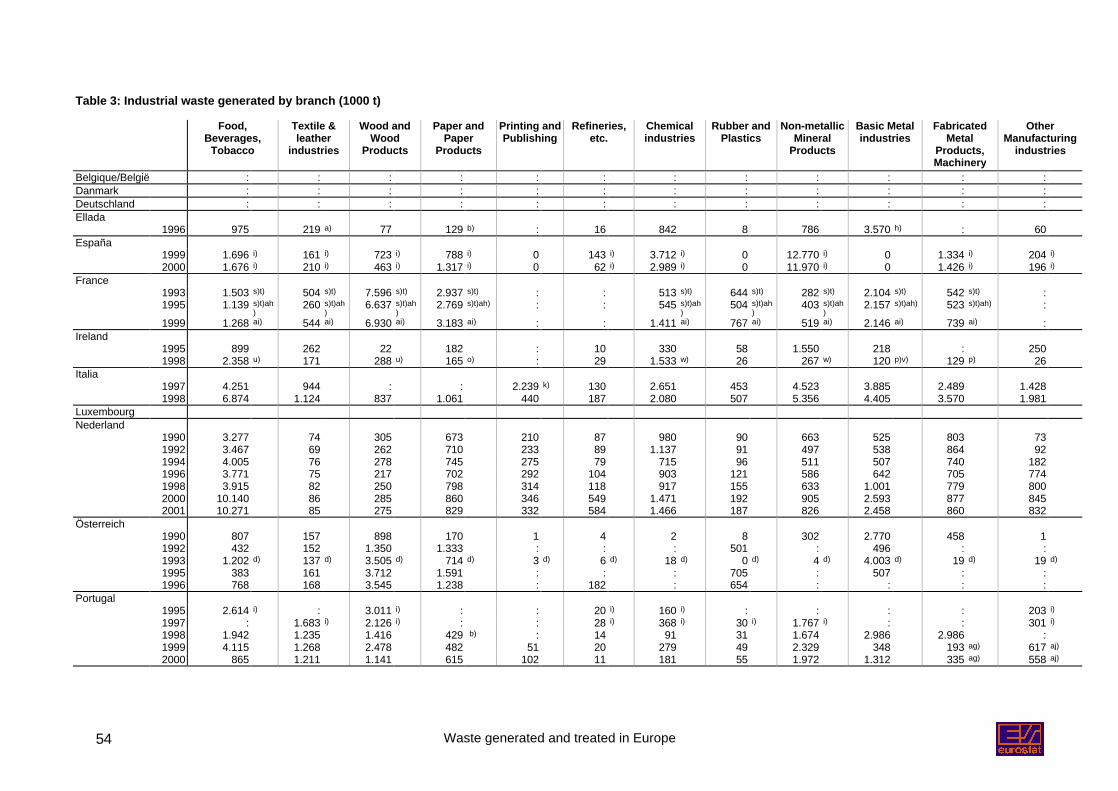
Waste generated and treated in Europe54
Table 3: Industrial waste generated by branch (1000 t)
Food,Beverages,
Tobacco
Textile &leather
industries
Wood andWood
Products
Paper andPaper
Products
Printing andPublishing
Refineries,etc.
Chemicalindustries
Rubber andPlastics
Non-metallicMineral
Products
Basic Metalindustries
FabricatedMetal
Products,Machinery
OtherManufacturing
industries
Belgique/België : : : : : : : : : : : :Danmark : : : : : : : : : : : :Deutschland : : : : : : : : : : : :Ellada
1996 975 219 a) 77 129 b) : 16 842 8 786 3.570 h) : 60España
1999 1.696 i) 161 i) 723 i) 788 i) 0 143 i) 3.712 i) 0 12.770 i) 0 1.334 i) 204 i)
2000 1.676 i) 210 i) 463 i) 1.317 i) 0 62 i) 2.989 i) 0 11.970 i) 0 1.426 i) 196 i)
France1993 1.503 s)t) 504 s)t) 7.596 s)t) 2.937 s)t) : : 513 s)t) 644 s)t) 282 s)t) 2.104 s)t) 542 s)t) :1995 1.139 s)t)ah
)260 s)t)ah
)6.637 s)t)ah
)2.769 s)t)ah) : : 545 s)t)ah
)504 s)t)ah
)403 s)t)ah
)2.157 s)t)ah) 523 s)t)ah) :
1999 1.268 ai) 544 ai) 6.930 ai) 3.183 ai) : : 1.411 ai) 767 ai) 519 ai) 2.146 ai) 739 ai) :Ireland
1995 899 262 22 182 : 10 330 58 1.550 218 : 2501998 2.358 u) 171 288 u) 165 o) : 29 1.533 w) 26 267 w) 120 p)v) 129 p) 26
Italia1997 4.251 944 : : 2.239 k) 130 2.651 453 4.523 3.885 2.489 1.4281998 6.874 1.124 837 1.061 440 187 2.080 507 5.356 4.405 3.570 1.981
LuxembourgNederland
1990 3.277 74 305 673 210 87 980 90 663 525 803 731992 3.467 69 262 710 233 89 1.137 91 497 538 864 921994 4.005 76 278 745 275 79 715 96 511 507 740 1821996 3.771 75 217 702 292 104 903 121 586 642 705 7741998 3.915 82 250 798 314 118 917 155 633 1.001 779 8002000 10.140 86 285 860 346 549 1.471 192 905 2.593 877 8452001 10.271 85 275 829 332 584 1.466 187 826 2.458 860 832
Österreich1990 807 157 898 170 1 4 2 8 302 2.770 458 11992 432 152 1.350 1.333 : : : 501 : 496 : :1993 1.202 d) 137 d) 3.505 d) 714 d) 3 d) 6 d) 18 d) 0 d) 4 d) 4.003 d) 19 d) 19 d)
1995 383 161 3.712 1.591 : : : 705 : 507 : :1996 768 168 3.545 1.238 : 182 : 654 : : : :
Portugal1995 2.614 i) : 3.011 i) : : 20 i) 160 i) : : : : 203 i)
1997 : 1.683 i) 2.126 i) : : 28 i) 368 i) 30 i) 1.767 i) : : 301 i)
1998 1.942 1.235 1.416 429 b) : 14 91 31 1.674 2.986 2.986 :1999 4.115 1.268 2.478 482 51 20 279 49 2.329 348 193 ag) 617 aj)
2000 865 1.211 1.141 615 102 11 181 55 1.972 1.312 335 ag) 558 aj)
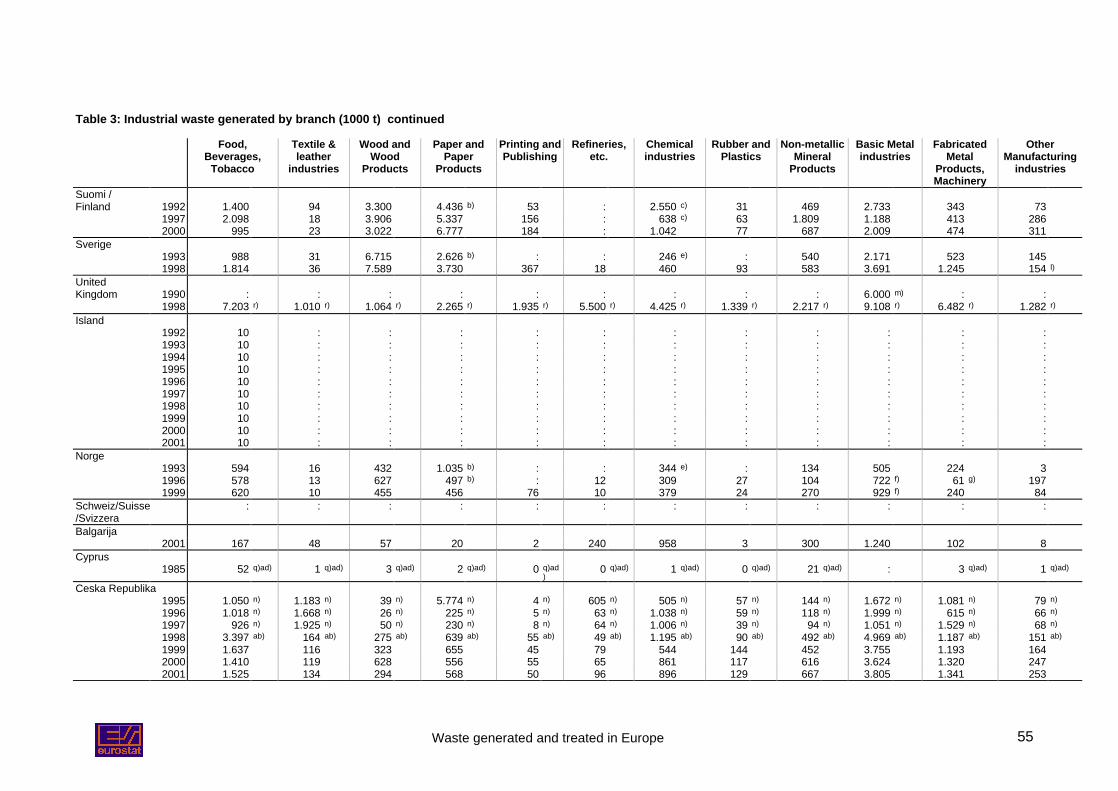
Waste generated and treated in Europe 55
Table 3: Industrial waste generated by branch (1000 t) continued
Food,Beverages,
Tobacco
Textile &leather
industries
Wood andWood
Products
Paper andPaper
Products
Printing andPublishing
Refineries,etc.
Chemicalindustries
Rubber andPlastics
Non-metallicMineral
Products
Basic Metalindustries
FabricatedMetal
Products,Machinery
OtherManufacturing
industries
Suomi /Finland 1992 1.400 94 3.300 4.436 b) 53 : 2.550 c) 31 469 2.733 343 73
1997 2.098 18 3.906 5.337 156 : 638 c) 63 1.809 1.188 413 2862000 995 23 3.022 6.777 184 : 1.042 77 687 2.009 474 311
Sverige1993 988 31 6.715 2.626 b) : : 246 e) : 540 2.171 523 1451998 1.814 36 7.589 3.730 367 18 460 93 583 3.691 1.245 154 l)
UnitedKingdom 1990 : : : : : : : : : 6.000 m) : :
1998 7.203 r) 1.010 r) 1.064 r) 2.265 r) 1.935 r) 5.500 r) 4.425 r) 1.339 r) 2.217 r) 9.108 r) 6.482 r) 1.282 r)
Island1992 10 : : : : : : : : : : :1993 10 : : : : : : : : : : :1994 10 : : : : : : : : : : :1995 10 : : : : : : : : : : :1996 10 : : : : : : : : : : :1997 10 : : : : : : : : : : :1998 10 : : : : : : : : : : :1999 10 : : : : : : : : : : :2000 10 : : : : : : : : : : :2001 10 : : : : : : : : : : :
Norge1993 594 16 432 1.035 b) : : 344 e) : 134 505 224 31996 578 13 627 497 b) : 12 309 27 104 722 f) 61 g) 1971999 620 10 455 456 76 10 379 24 270 929 f) 240 84
Schweiz/Suisse/Svizzera
: : : : : : : : : : : :
Balgarija2001 167 48 57 20 2 240 958 3 300 1.240 102 8
Cyprus1985 52 q)ad) 1 q)ad) 3 q)ad) 2 q)ad) 0 q)ad
)0 q)ad) 1 q)ad) 0 q)ad) 21 q)ad) : 3 q)ad) 1 q)ad)
Ceska Republika1995 1.050 n) 1.183 n) 39 n) 5.774 n) 4 n) 605 n) 505 n) 57 n) 144 n) 1.672 n) 1.081 n) 79 n)
1996 1.018 n) 1.668 n) 26 n) 225 n) 5 n) 63 n) 1.038 n) 59 n) 118 n) 1.999 n) 615 n) 66 n)
1997 926 n) 1.925 n) 50 n) 230 n) 8 n) 64 n) 1.006 n) 39 n) 94 n) 1.051 n) 1.529 n) 68 n)
1998 3.397 ab) 164 ab) 275 ab) 639 ab) 55 ab) 49 ab) 1.195 ab) 90 ab) 492 ab) 4.969 ab) 1.187 ab) 151 ab)
1999 1.637 116 323 655 45 79 544 144 452 3.755 1.193 1642000 1.410 119 628 556 55 65 861 117 616 3.624 1.320 2472001 1.525 134 294 568 50 96 896 129 667 3.805 1.341 253
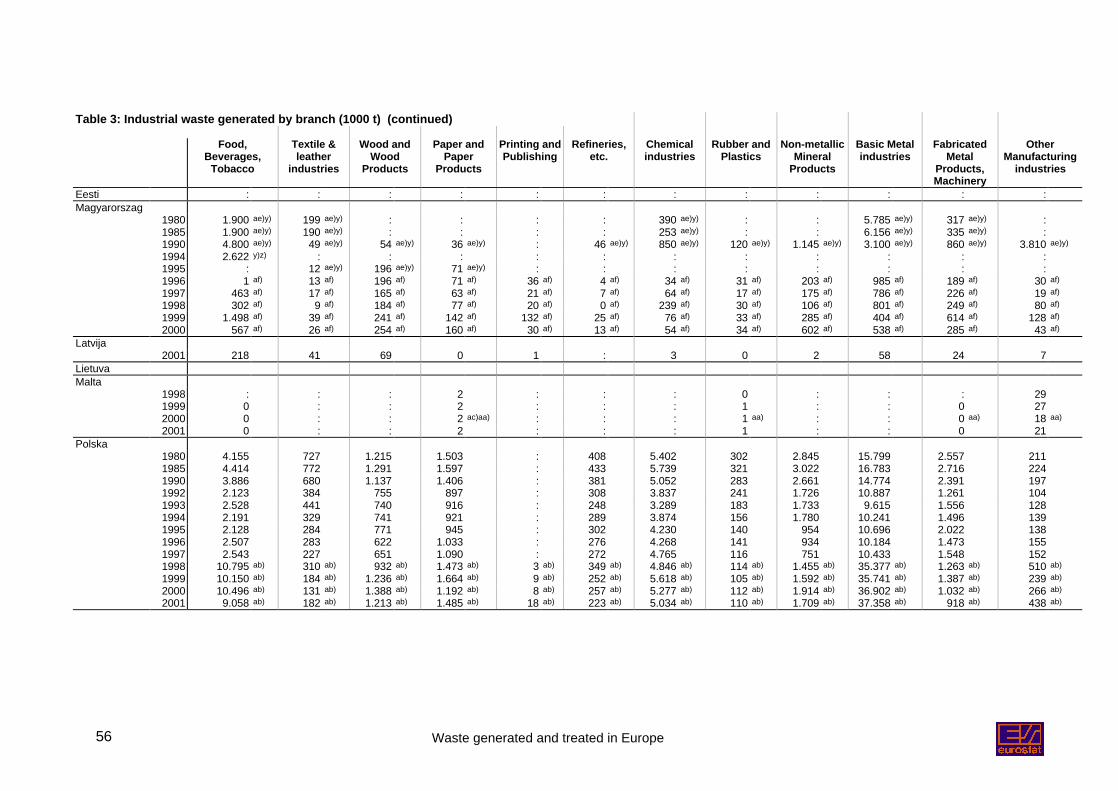
Waste generated and treated in Europe56
Table 3: Industrial waste generated by branch (1000 t) (continued)
Food,Beverages,
Tobacco
Textile &leather
industries
Wood andWood
Products
Paper andPaper
Products
Printing andPublishing
Refineries,etc.
Chemicalindustries
Rubber andPlastics
Non-metallicMineral
Products
Basic Metalindustries
FabricatedMetal
Products,Machinery
OtherManufacturing
industries
Eesti : : : : : : : : : : : :Magyarorszag
1980 1.900 ae)y) 199 ae)y) : : : : 390 ae)y) : : 5.785 ae)y) 317 ae)y) :1985 1.900 ae)y) 190 ae)y) : : : : 253 ae)y) : : 6.156 ae)y) 335 ae)y) :1990 4.800 ae)y) 49 ae)y) 54 ae)y) 36 ae)y) : 46 ae)y) 850 ae)y) 120 ae)y) 1.145 ae)y) 3.100 ae)y) 860 ae)y) 3.810 ae)y)
1994 2.622 y)z) : : : : : : : : : : :1995 : 12 ae)y) 196 ae)y) 71 ae)y) : : : : : : : :1996 1 af) 13 af) 196 af) 71 af) 36 af) 4 af) 34 af) 31 af) 203 af) 985 af) 189 af) 30 af)
1997 463 af) 17 af) 165 af) 63 af) 21 af) 7 af) 64 af) 17 af) 175 af) 786 af) 226 af) 19 af)
1998 302 af) 9 af) 184 af) 77 af) 20 af) 0 af) 239 af) 30 af) 106 af) 801 af) 249 af) 80 af)
1999 1.498 af) 39 af) 241 af) 142 af) 132 af) 25 af) 76 af) 33 af) 285 af) 404 af) 614 af) 128 af)
2000 567 af) 26 af) 254 af) 160 af) 30 af) 13 af) 54 af) 34 af) 602 af) 538 af) 285 af) 43 af)
Latvija2001 218 41 69 0 1 : 3 0 2 58 24 7
LietuvaMalta
1998 : : : 2 : : : 0 : : : 291999 0 : : 2 : : : 1 : : 0 272000 0 : : 2 ac)aa) : : : 1 aa) : : 0 aa) 18 aa)
2001 0 : : 2 : : : 1 : : 0 21Polska
1980 4.155 727 1.215 1.503 : 408 5.402 302 2.845 15.799 2.557 2111985 4.414 772 1.291 1.597 : 433 5.739 321 3.022 16.783 2.716 2241990 3.886 680 1.137 1.406 : 381 5.052 283 2.661 14.774 2.391 1971992 2.123 384 755 897 : 308 3.837 241 1.726 10.887 1.261 1041993 2.528 441 740 916 : 248 3.289 183 1.733 9.615 1.556 1281994 2.191 329 741 921 : 289 3.874 156 1.780 10.241 1.496 1391995 2.128 284 771 945 : 302 4.230 140 954 10.696 2.022 1381996 2.507 283 622 1.033 : 276 4.268 141 934 10.184 1.473 1551997 2.543 227 651 1.090 : 272 4.765 116 751 10.433 1.548 1521998 10.795 ab) 310 ab) 932 ab) 1.473 ab) 3 ab) 349 ab) 4.846 ab) 114 ab) 1.455 ab) 35.377 ab) 1.263 ab) 510 ab)
1999 10.150 ab) 184 ab) 1.236 ab) 1.664 ab) 9 ab) 252 ab) 5.618 ab) 105 ab) 1.592 ab) 35.741 ab) 1.387 ab) 239 ab)
2000 10.496 ab) 131 ab) 1.388 ab) 1.192 ab) 8 ab) 257 ab) 5.277 ab) 112 ab) 1.914 ab) 36.902 ab) 1.032 ab) 266 ab)
2001 9.058 ab) 182 ab) 1.213 ab) 1.485 ab) 18 ab) 223 ab) 5.034 ab) 110 ab) 1.709 ab) 37.358 ab) 918 ab) 438 ab)
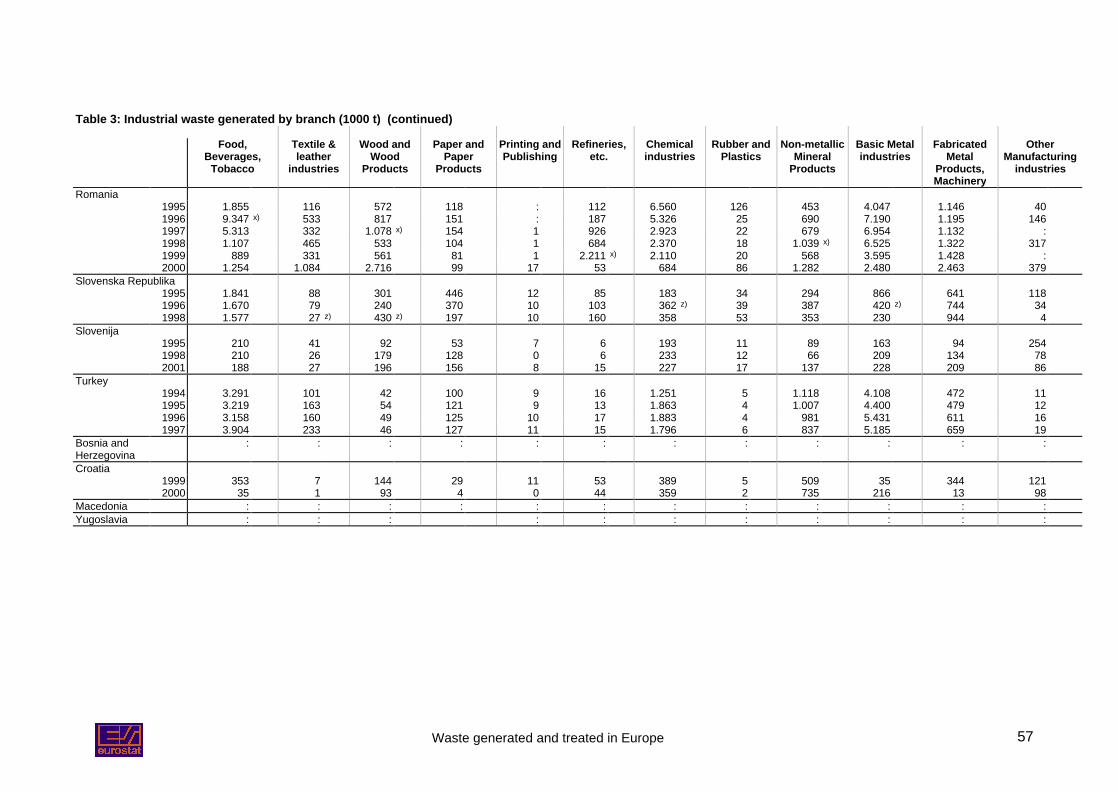
Waste generated and treated in Europe 57
Table 3: Industrial waste generated by branch (1000 t) (continued)
Food,Beverages,
Tobacco
Textile &leather
industries
Wood andWood
Products
Paper andPaper
Products
Printing andPublishing
Refineries,etc.
Chemicalindustries
Rubber andPlastics
Non-metallicMineral
Products
Basic Metalindustries
FabricatedMetal
Products,Machinery
OtherManufacturing
industries
Romania1995 1.855 116 572 118 : 112 6.560 126 453 4.047 1.146 401996 9.347 x) 533 817 151 : 187 5.326 25 690 7.190 1.195 1461997 5.313 332 1.078 x) 154 1 926 2.923 22 679 6.954 1.132 :1998 1.107 465 533 104 1 684 2.370 18 1.039 x) 6.525 1.322 3171999 889 331 561 81 1 2.211 x) 2.110 20 568 3.595 1.428 :2000 1.254 1.084 2.716 99 17 53 684 86 1.282 2.480 2.463 379
Slovenska Republika1995 1.841 88 301 446 12 85 183 34 294 866 641 1181996 1.670 79 240 370 10 103 362 z) 39 387 420 z) 744 341998 1.577 27 z) 430 z) 197 10 160 358 53 353 230 944 4
Slovenija1995 210 41 92 53 7 6 193 11 89 163 94 2541998 210 26 179 128 0 6 233 12 66 209 134 782001 188 27 196 156 8 15 227 17 137 228 209 86
Turkey1994 3.291 101 42 100 9 16 1.251 5 1.118 4.108 472 111995 3.219 163 54 121 9 13 1.863 4 1.007 4.400 479 121996 3.158 160 49 125 10 17 1.883 4 981 5.431 611 161997 3.904 233 46 127 11 15 1.796 6 837 5.185 659 19
Bosnia andHerzegovina
: : : : : : : : : : : :
Croatia1999 353 7 144 29 11 53 389 5 509 35 344 1212000 35 1 93 4 0 44 359 2 735 216 13 98
Macedonia : : : : : : : : : : : :Yugoslavia : : : : : : : : : : :
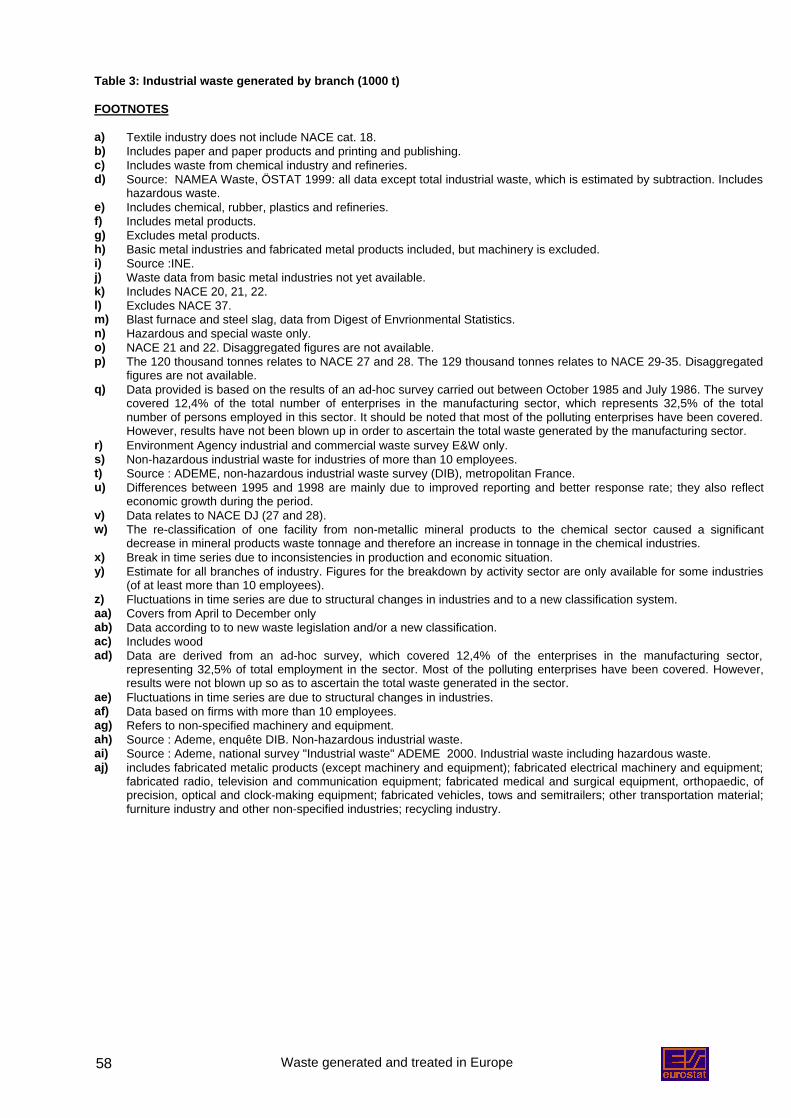
Waste generated and treated in Europe58
Table 3: Industrial waste generated by branch (1000 t)
FOOTNOTES
a) Textile industry does not include NACE cat. 18.b) Includes paper and paper products and printing and publishing.c) Includes waste from chemical industry and refineries.d) Source: NAMEA Waste, ÖSTAT 1999: all data except total industrial waste, which is estimated by subtraction. Includes
hazardous waste.e) Includes chemical, rubber, plastics and refineries.f) Includes metal products.g) Excludes metal products.h) Basic metal industries and fabricated metal products included, but machinery is excluded.i) Source :INE.j) Waste data from basic metal industries not yet available.k) Includes NACE 20, 21, 22.l) Excludes NACE 37.m) Blast furnace and steel slag, data from Digest of Envrionmental Statistics.n) Hazardous and special waste only.o) NACE 21 and 22. Disaggregated figures are not available.p) The 120 thousand tonnes relates to NACE 27 and 28. The 129 thousand tonnes relates to NACE 29-35. Disaggregated
figures are not available.q) Data provided is based on the results of an ad-hoc survey carried out between October 1985 and July 1986. The survey
covered 12,4% of the total number of enterprises in the manufacturing sector, which represents 32,5% of the totalnumber of persons employed in this sector. It should be noted that most of the polluting enterprises have been covered.However, results have not been blown up in order to ascertain the total waste generated by the manufacturing sector.
r) Environment Agency industrial and commercial waste survey E&W only.s) Non-hazardous industrial waste for industries of more than 10 employees.t) Source : ADEME, non-hazardous industrial waste survey (DIB), metropolitan France.u) Differences between 1995 and 1998 are mainly due to improved reporting and better response rate; they also reflect
economic growth during the period.v) Data relates to NACE DJ (27 and 28).w) The re-classification of one facility from non-metallic mineral products to the chemical sector caused a significant
decrease in mineral products waste tonnage and therefore an increase in tonnage in the chemical industries.x) Break in time series due to inconsistencies in production and economic situation.y) Estimate for all branches of industry. Figures for the breakdown by activity sector are only available for some industries
(of at least more than 10 employees).z) Fluctuations in time series are due to structural changes in industries and to a new classification system.aa) Covers from April to December onlyab) Data according to to new waste legislation and/or a new classification.ac) Includes woodad) Data are derived from an ad-hoc survey, which covered 12,4% of the enterprises in the manufacturing sector,
representing 32,5% of total employment in the sector. Most of the polluting enterprises have been covered. However,results were not blown up so as to ascertain the total waste generated in the sector.
ae) Fluctuations in time series are due to structural changes in industries.af) Data based on firms with more than 10 employees.ag) Refers to non-specified machinery and equipment.ah) Source : Ademe, enquête DIB. Non-hazardous industrial waste.ai) Source : Ademe, national survey "Industrial waste" ADEME 2000. Industrial waste including hazardous waste.aj) includes fabricated metalic products (except machinery and equipment); fabricated electrical machinery and equipment;
fabricated radio, television and communication equipment; fabricated medical and surgical equipment, orthopaedic, ofprecision, optical and clock-making equipment; fabricated vehicles, tows and semitrailers; other transportation material;furniture industry and other non-specified industries; recycling industry.
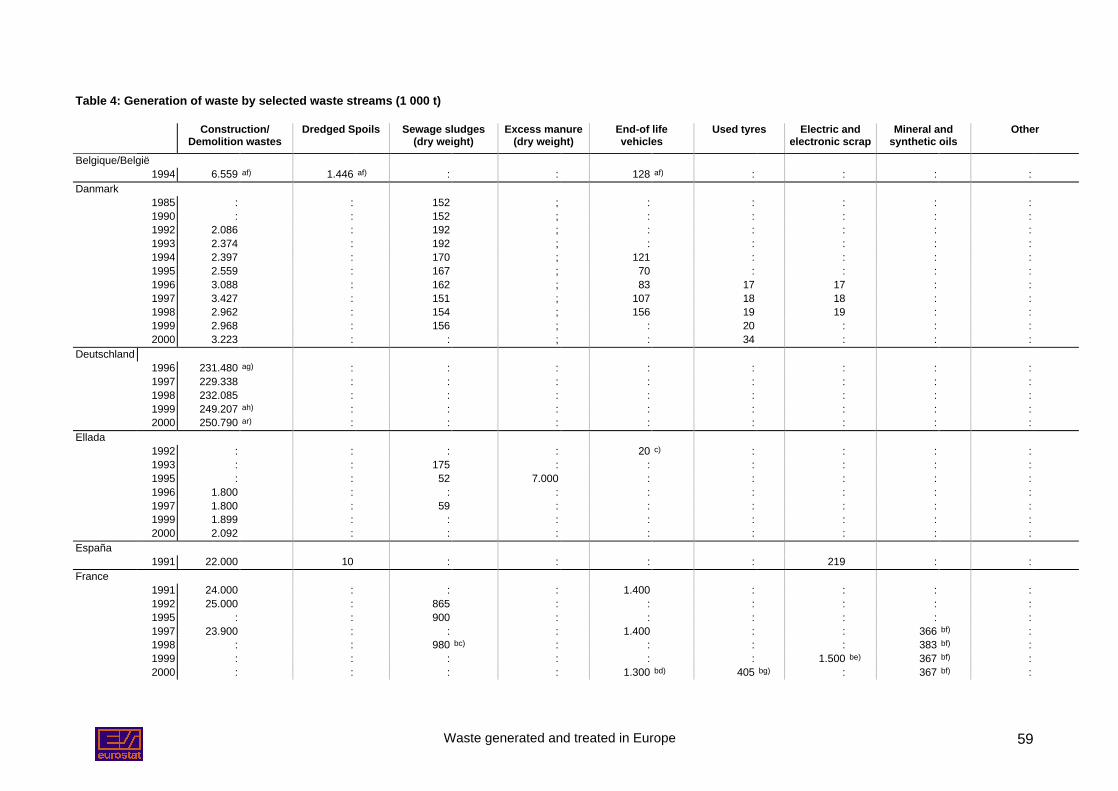
Waste generated and treated in Europe 59
Table 4: Generation of waste by selected waste streams (1 000 t)
Construction/Demolition wastes
Dredged Spoils Sewage sludges(dry weight)
Excess manure(dry weight)
End-of lifevehicles
Used tyres Electric andelectronic scrap
Mineral andsynthetic oils
Other
Belgique/België1994 6.559 af) 1.446 af) : : 128 af) : : : :
Danmark1985 : : 152 ; : : : : :1990 : : 152 ; : : : : :1992 2.086 : 192 ; : : : : :1993 2.374 : 192 ; : : : : :1994 2.397 : 170 ; 121 : : : :1995 2.559 : 167 ; 70 : : : :1996 3.088 : 162 ; 83 17 17 : :1997 3.427 : 151 ; 107 18 18 : :1998 2.962 : 154 ; 156 19 19 : :1999 2.968 : 156 ; : 20 : : :2000 3.223 : : ; : 34 : : :
Deutschland1996 231.480 ag) : : : : : : : :1997 229.338 : : : : : : : :1998 232.085 : : : : : : : :1999 249.207 ah) : : : : : : : :2000 250.790 ar) : : : : : : : :
Ellada1992 : : : : 20 c) : : : :1993 : : 175 : : : : : :1995 : : 52 7.000 : : : : :1996 1.800 : : : : : : : :1997 1.800 : 59 : : : : : :1999 1.899 : : : : : : : :2000 2.092 : : : : : : : :
España1991 22.000 10 : : : : 219 : :
France1991 24.000 : : : 1.400 : : : :1992 25.000 : 865 : : : : : :1995 : : 900 : : : : : :1997 23.900 : : : 1.400 : : 366 bf) :1998 : : 980 bc) : : : : 383 bf) :1999 : : : : : : 1.500 be) 367 bf) :2000 : : : : 1.300 bd) 405 bg) : 367 bf) :
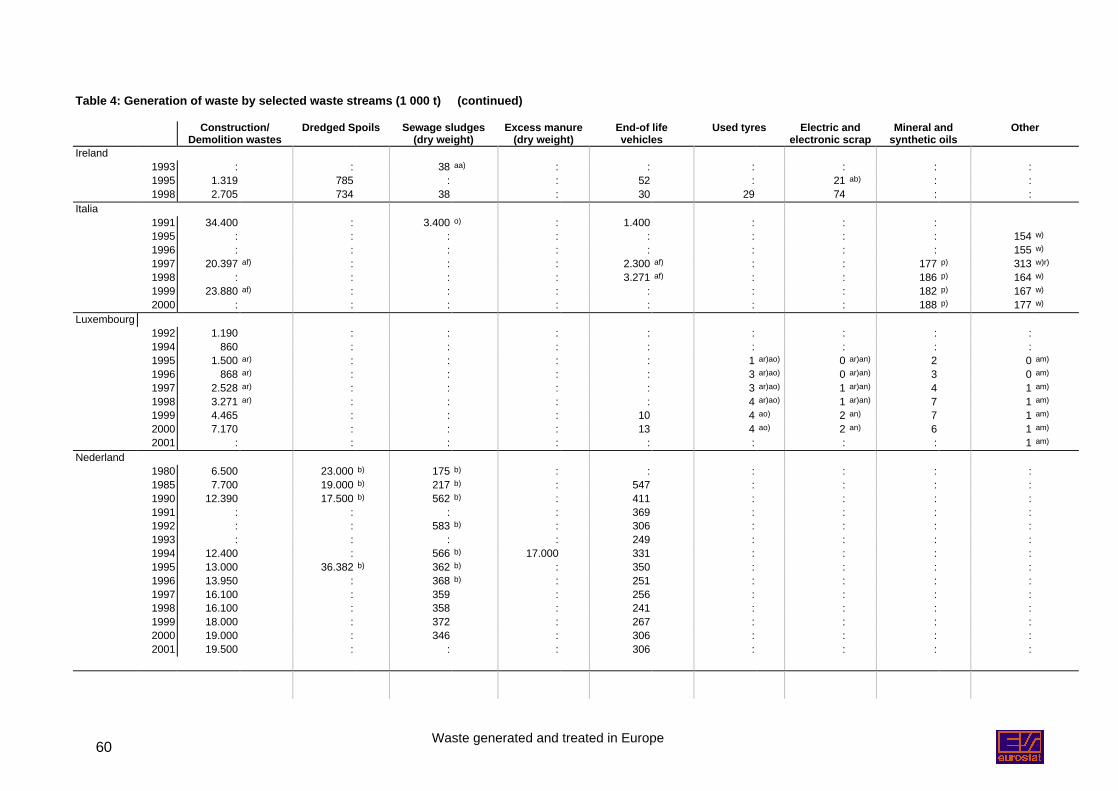
Waste generated and treated in Europe60
Table 4: Generation of waste by selected waste streams (1 000 t) (continued)
Construction/Demolition wastes
Dredged Spoils Sewage sludges(dry weight)
Excess manure(dry weight)
End-of lifevehicles
Used tyres Electric andelectronic scrap
Mineral andsynthetic oils
Other
Ireland1993 : : 38 aa) : : : : : :1995 1.319 785 : : 52 : 21 ab) : :1998 2.705 734 38 : 30 29 74 : :
Italia1991 34.400 : 3.400 o) : 1.400 : : :1995 : : : : : : : : 154 w)
1996 : : : : : : : : 155 w)
1997 20.397 af) : : : 2.300 af) : : 177 p) 313 w)r)
1998 : : : : 3.271 af) : : 186 p) 164 w)
1999 23.880 af) : : : : : : 182 p) 167 w)
2000 : : : : : : : 188 p) 177 w)
Luxembourg1992 1.190 : : : : : : : :1994 860 : : : : : : : :1995 1.500 ar) : : : : 1 ar)ao) 0 ar)an) 2 0 am)
1996 868 ar) : : : : 3 ar)ao) 0 ar)an) 3 0 am)
1997 2.528 ar) : : : : 3 ar)ao) 1 ar)an) 4 1 am)
1998 3.271 ar) : : : : 4 ar)ao) 1 ar)an) 7 1 am)
1999 4.465 : : : 10 4 ao) 2 an) 7 1 am)
2000 7.170 : : : 13 4 ao) 2 an) 6 1 am)
2001 : : : : : : : : 1 am)
Nederland1980 6.500 23.000 b) 175 b) : : : : : :1985 7.700 19.000 b) 217 b) : 547 : : : :1990 12.390 17.500 b) 562 b) : 411 : : : :1991 : : : : 369 : : : :1992 : : 583 b) : 306 : : : :1993 : : : : 249 : : : :1994 12.400 : 566 b) 17.000 331 : : : :1995 13.000 36.382 b) 362 b) : 350 : : : :1996 13.950 : 368 b) : 251 : : : :1997 16.100 : 359 : 256 : : : :1998 16.100 : 358 : 241 : : : :1999 18.000 : 372 : 267 : : : :2000 19.000 : 346 : 306 : : : :2001 19.500 : : : 306 : : : :
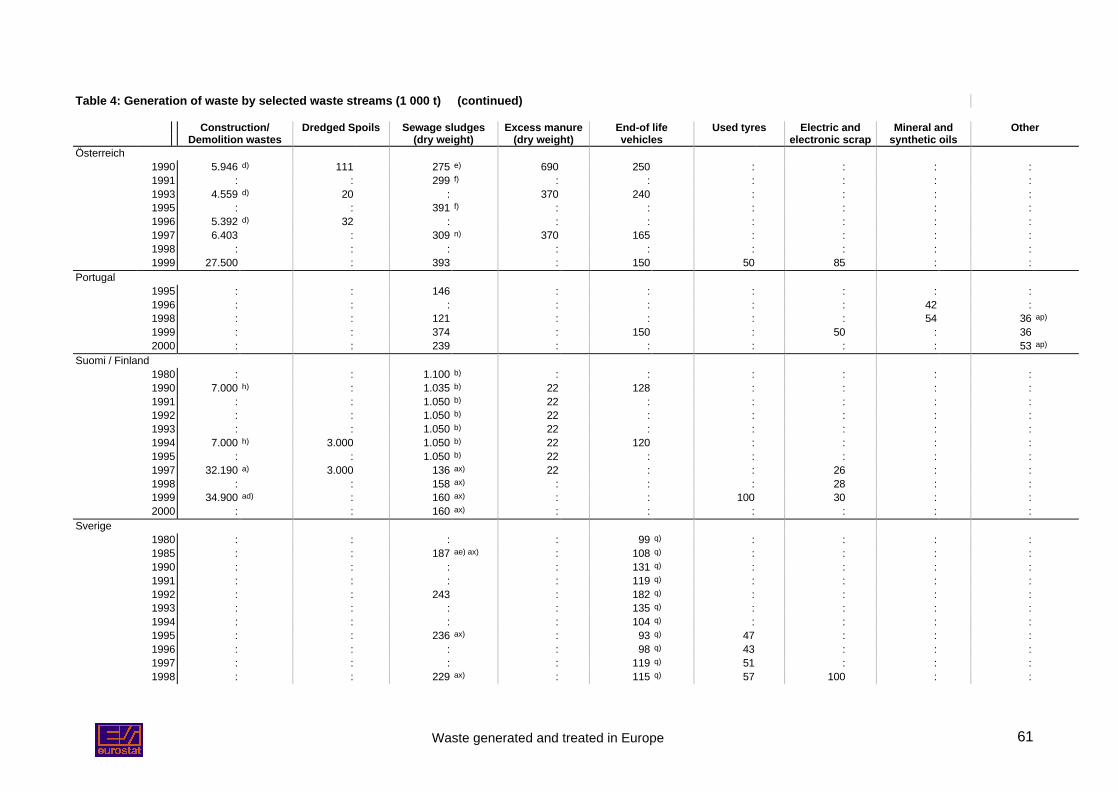
Waste generated and treated in Europe 61
Table 4: Generation of waste by selected waste streams (1 000 t) (continued)
Construction/Demolition wastes
Dredged Spoils Sewage sludges(dry weight)
Excess manure(dry weight)
End-of lifevehicles
Used tyres Electric andelectronic scrap
Mineral andsynthetic oils
Other
Österreich1990 5.946 d) 111 275 e) 690 250 : : : :1991 : : 299 f) : : : : : :1993 4.559 d) 20 : 370 240 : : : :1995 : : 391 f) : : : : : :1996 5.392 d) 32 : : : : : : :1997 6.403 : 309 n) 370 165 : : : :1998 : : : : : : : : :1999 27.500 : 393 : 150 50 85 : :
Portugal1995 : : 146 : : : : : :1996 : : : : : : : 42 :1998 : : 121 : : : : 54 36 ap)
1999 : : 374 : 150 : 50 : 362000 : : 239 : : : : : 53 ap)
Suomi / Finland1980 : : 1.100 b) : : : : : :1990 7.000 h) : 1.035 b) 22 128 : : : :1991 : : 1.050 b) 22 : : : : :1992 : : 1.050 b) 22 : : : : :1993 : : 1.050 b) 22 : : : : :1994 7.000 h) 3.000 1.050 b) 22 120 : : : :1995 : : 1.050 b) 22 : : : : :1997 32.190 a) 3.000 136 ax) 22 : : 26 : :1998 : : 158 ax) : : : 28 : :1999 34.900 ad) : 160 ax) : : 100 30 : :2000 : : 160 ax) : : : : : :
Sverige1980 : : : : 99 q) : : : :1985 : : 187 ae) ax) : 108 q) : : : :1990 : : : : 131 q) : : : :1991 : : : : 119 q) : : : :1992 : : 243 : 182 q) : : : :1993 : : : : 135 q) : : : :1994 : : : : 104 q) : : : :1995 : : 236 ax) : 93 q) 47 : : :1996 : : : : 98 q) 43 : : :1997 : : : : 119 q) 51 : : :1998 : : 229 ax) : 115 q) 57 100 : :
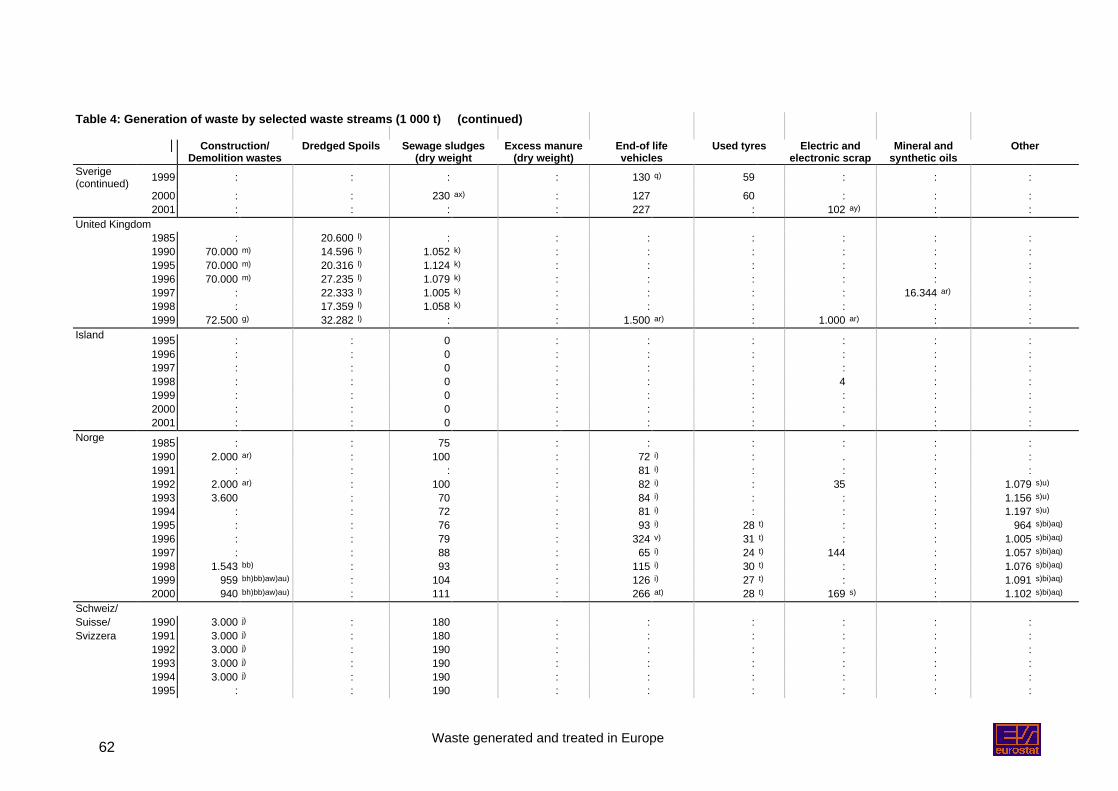
Waste generated and treated in Europe62
Table 4: Generation of waste by selected waste streams (1 000 t) (continued)
Construction/Demolition wastes
Dredged Spoils Sewage sludges(dry weight
Excess manure(dry weight)
End-of lifevehicles
Used tyres Electric andelectronic scrap
Mineral andsynthetic oils
Other
Sverige(continued) 1999 : : : : 130 q) 59 : : :
2000 : : 230 ax) : 127 60 : : :2001 : : : : 227 : 102 ay) : :
United Kingdom1985 : 20.600 l) : : : : : : :1990 70.000 m) 14.596 l) 1.052 k) : : : : : :1995 70.000 m) 20.316 l) 1.124 k) : : : : : :1996 70.000 m) 27.235 l) 1.079 k) : : : : : :1997 : 22.333 l) 1.005 k) : : : : 16.344 ar) :1998 : 17.359 l) 1.058 k) : : : : : :1999 72.500 g) 32.282 l) : : 1.500 ar) : 1.000 ar) : :
Island 1995 : : 0 : : : : : :1996 : : 0 : : : : : :1997 : : 0 : : : : : :1998 : : 0 : : : 4 : :1999 : : 0 : : : : : :2000 : : 0 : : : : : :2001 : : 0 : : : . : :
Norge 1985 : : 75 : : : : : :1990 2.000 ar) : 100 : 72 i) : . : :1991 : : : : 81 i) : : : :1992 2.000 ar) : 100 : 82 i) : 35 : 1.079 s)u)
1993 3.600 : 70 : 84 i) : : : 1.156 s)u)
1994 : : 72 : 81 i) : : : 1.197 s)u)
1995 : : 76 : 93 i) 28 t) : : 964 s)bi)aq)
1996 : : 79 : 324 v) 31 t) : : 1.005 s)bi)aq)
1997 : : 88 : 65 i) 24 t) 144 : 1.057 s)bi)aq)
1998 1.543 bb) : 93 : 115 i) 30 t) : : 1.076 s)bi)aq)
1999 959 bh)bb)aw)au) : 104 : 126 i) 27 t) : : 1.091 s)bi)aq)
2000 940 bh)bb)aw)au) : 111 : 266 at) 28 t) 169 s) : 1.102 s)bi)aq)
Schweiz/Suisse/ 1990 3.000 j) : 180 : : : : : :Svizzera 1991 3.000 j) : 180 : : : : : :
1992 3.000 j) : 190 : : : : : :1993 3.000 j) : 190 : : : : : :1994 3.000 j) : 190 : : : : : :1995 : : 190 : : : : : :
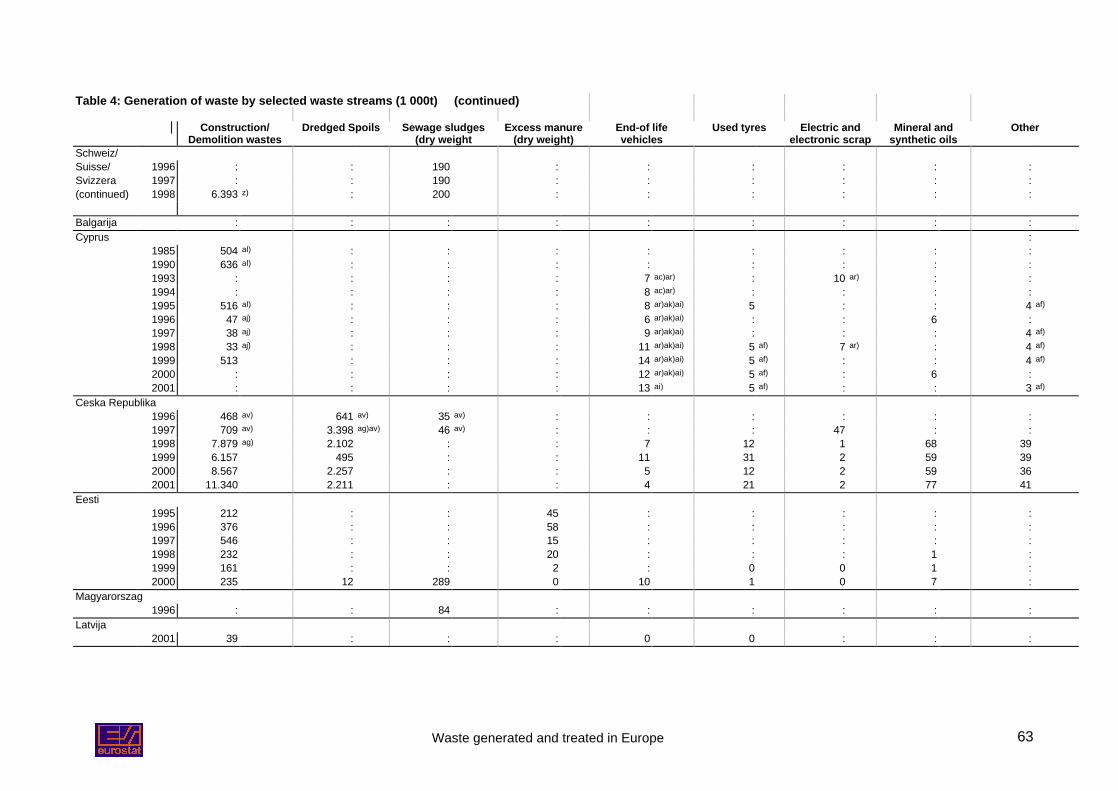
Waste generated and treated in Europe 63
Table 4: Generation of waste by selected waste streams (1 000t) (continued)
Construction/Demolition wastes
Dredged Spoils Sewage sludges(dry weight
Excess manure(dry weight)
End-of lifevehicles
Used tyres Electric andelectronic scrap
Mineral andsynthetic oils
Other
Schweiz/Suisse/ 1996 : : 190 : : : : : :Svizzera 1997 : : 190 : : : : : :(continued) 1998 6.393 z) : 200 : : : : : :
Balgarija : : : : : : : : :Cyprus :
1985 504 al) : : : : : : : :1990 636 al) : : : : : : : :1993 : : : : 7 ac)ar) : 10 ar) : :1994 : : : : 8 ac)ar) : : : :1995 516 al) : : : 8 ar)ak)ai) 5 : : 4 af)
1996 47 aj) : : : 6 ar)ak)ai) : : 6 :1997 38 aj) : : : 9 ar)ak)ai) : : : 4 af)
1998 33 aj) : : : 11 ar)ak)ai) 5 af) 7 ar) : 4 af)
1999 513 : : : 14 ar)ak)ai) 5 af) : : 4 af)
2000 : : : : 12 ar)ak)ai) 5 af) : 6 :2001 : : : : 13 ai) 5 af) : : 3 af)
Ceska Republika1996 468 av) 641 av) 35 av) : : : : : :1997 709 av) 3.398 ag)av) 46 av) : : : 47 : :1998 7.879 ag) 2.102 : : 7 12 1 68 391999 6.157 495 : : 11 31 2 59 392000 8.567 2.257 : : 5 12 2 59 362001 11.340 2.211 : : 4 21 2 77 41
Eesti1995 212 : : 45 : : : : :1996 376 : : 58 : : : : :1997 546 : : 15 : : : : :1998 232 : : 20 : : : 1 :1999 161 : : 2 : 0 0 1 :2000 235 12 289 0 10 1 0 7 :
Magyarorszag1996 : : 84 : : : : : :
Latvija2001 39 : : : 0 0 : : :
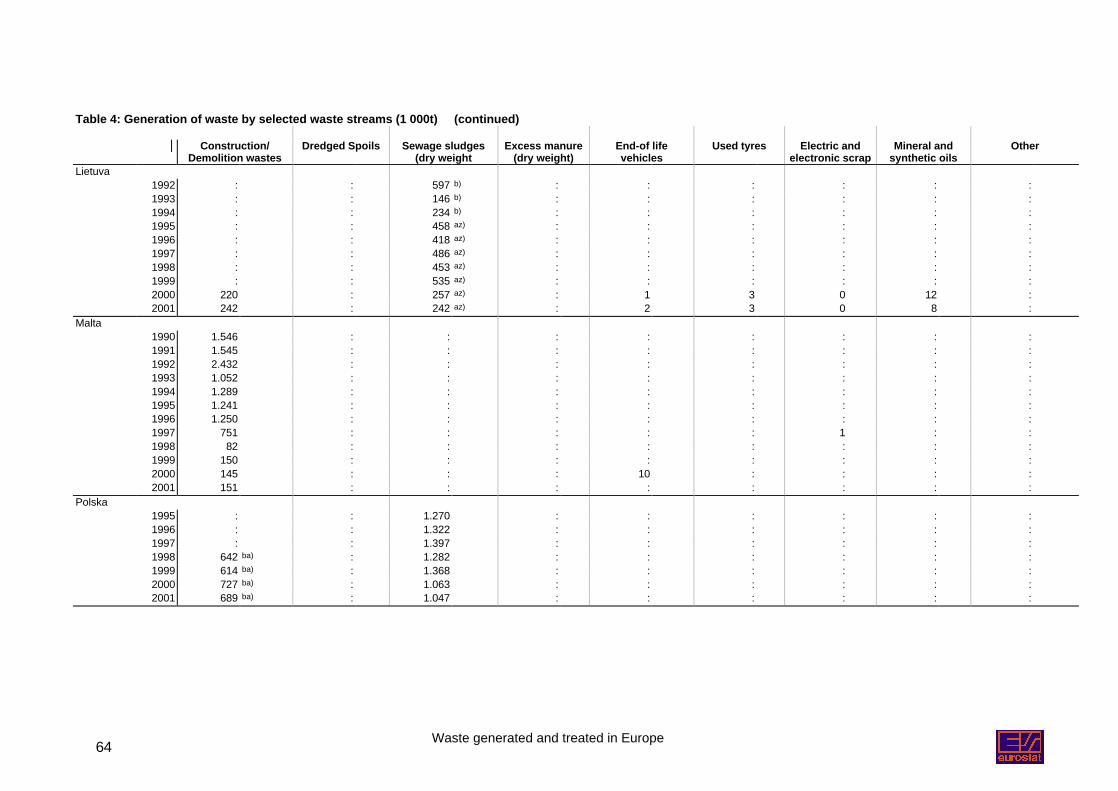
Waste generated and treated in Europe64
Table 4: Generation of waste by selected waste streams (1 000t) (continued)
Construction/Demolition wastes
Dredged Spoils Sewage sludges(dry weight
Excess manure(dry weight)
End-of lifevehicles
Used tyres Electric andelectronic scrap
Mineral andsynthetic oils
Other
Lietuva1992 : : 597 b) : : : : : :1993 : : 146 b) : : : : : :1994 : : 234 b) : : : : : :1995 : : 458 az) : : : : : :1996 : : 418 az) : : : : : :1997 : : 486 az) : : : : : :1998 : : 453 az) : : : : : :1999 : : 535 az) : : : : : :2000 220 : 257 az) : 1 3 0 12 :2001 242 : 242 az) : 2 3 0 8 :
Malta1990 1.546 : : : : : : : :1991 1.545 : : : : : : : :1992 2.432 : : : : : : : :1993 1.052 : : : : : : : :1994 1.289 : : : : : : : :1995 1.241 : : : : : : : :1996 1.250 : : : : : : : :1997 751 : : : : : 1 : :1998 82 : : : : : : : :1999 150 : : : : : : : :2000 145 : : : 10 : : : :2001 151 : : : : : : : :
Polska1995 : : 1.270 : : : : : :1996 : : 1.322 : : : : : :1997 : : 1.397 : : : : : :1998 642 ba) : 1.282 : : : : : :1999 614 ba) : 1.368 : : : : : :2000 727 ba) : 1.063 : : : : : :2001 689 ba) : 1.047 : : : : : :
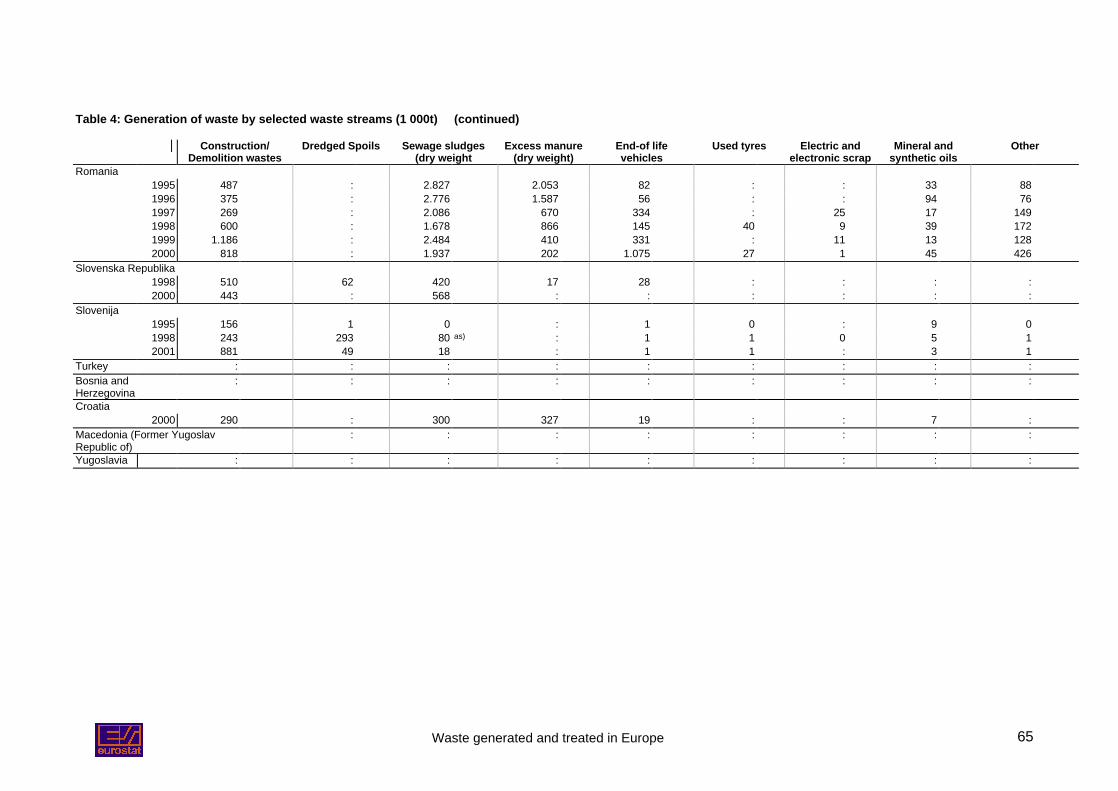
Waste generated and treated in Europe 65
Table 4: Generation of waste by selected waste streams (1 000t) (continued)
Construction/Demolition wastes
Dredged Spoils Sewage sludges(dry weight
Excess manure(dry weight)
End-of lifevehicles
Used tyres Electric andelectronic scrap
Mineral andsynthetic oils
Other
Romania1995 487 : 2.827 2.053 82 : : 33 881996 375 : 2.776 1.587 56 : : 94 761997 269 : 2.086 670 334 : 25 17 1491998 600 : 1.678 866 145 40 9 39 1721999 1.186 : 2.484 410 331 : 11 13 1282000 818 : 1.937 202 1.075 27 1 45 426
Slovenska Republika1998 510 62 420 17 28 : : : :2000 443 : 568 : : : : : :
Slovenija1995 156 1 0 : 1 0 : 9 01998 243 293 80 as) : 1 1 0 5 12001 881 49 18 : 1 1 : 3 1
Turkey : : : : : : : : :Bosnia andHerzegovina
: : : : : : : : :
Croatia2000 290 : 300 327 19 : : 7 :
Macedonia (Former YugoslavRepublic of)
: : : : : : : :
Yugoslavia : : : : : : : : :
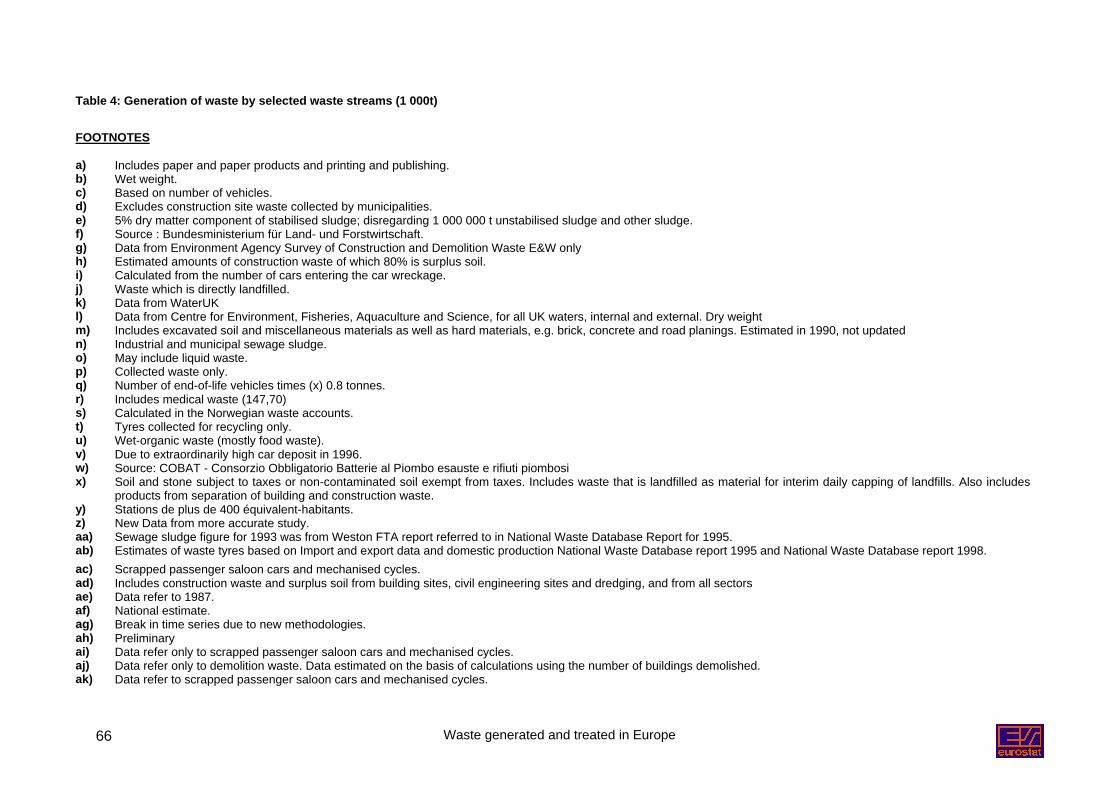
Waste generated and treated in Europe66
Table 4: Generation of waste by selected waste streams (1 000t)
FOOTNOTES
a) Includes paper and paper products and printing and publishing.b) Wet weight.c) Based on number of vehicles.d) Excludes construction site waste collected by municipalities.e) 5% dry matter component of stabilised sludge; disregarding 1 000 000 t unstabilised sludge and other sludge.f) Source : Bundesministerium für Land- und Forstwirtschaft.g) Data from Environment Agency Survey of Construction and Demolition Waste E&W onlyh) Estimated amounts of construction waste of which 80% is surplus soil.i) Calculated from the number of cars entering the car wreckage.j) Waste which is directly landfilled.k) Data from WaterUKl) Data from Centre for Environment, Fisheries, Aquaculture and Science, for all UK waters, internal and external. Dry weightm) Includes excavated soil and miscellaneous materials as well as hard materials, e.g. brick, concrete and road planings. Estimated in 1990, not updatedn) Industrial and municipal sewage sludge.o) May include liquid waste.p) Collected waste only.q) Number of end-of-life vehicles times (x) 0.8 tonnes.r) Includes medical waste (147,70)s) Calculated in the Norwegian waste accounts.t) Tyres collected for recycling only.u) Wet-organic waste (mostly food waste).v) Due to extraordinarily high car deposit in 1996.w) Source: COBAT - Consorzio Obbligatorio Batterie al Piombo esauste e rifiuti piombosix) Soil and stone subject to taxes or non-contaminated soil exempt from taxes. Includes waste that is landfilled as material for interim daily capping of landfills. Also includes
products from separation of building and construction waste.y) Stations de plus de 400 équivalent-habitants.z) New Data from more accurate study.aa) Sewage sludge figure for 1993 was from Weston FTA report referred to in National Waste Database Report for 1995.ab) Estimates of waste tyres based on Import and export data and domestic production National Waste Database report 1995 and National Waste Database report 1998.ac) Scrapped passenger saloon cars and mechanised cycles.ad) Includes construction waste and surplus soil from building sites, civil engineering sites and dredging, and from all sectorsae) Data refer to 1987.af) National estimate.ag) Break in time series due to new methodologies.ah) Preliminaryai) Data refer only to scrapped passenger saloon cars and mechanised cycles.aj) Data refer only to demolition waste. Data estimated on the basis of calculations using the number of buildings demolished.ak) Data refer to scrapped passenger saloon cars and mechanised cycles.
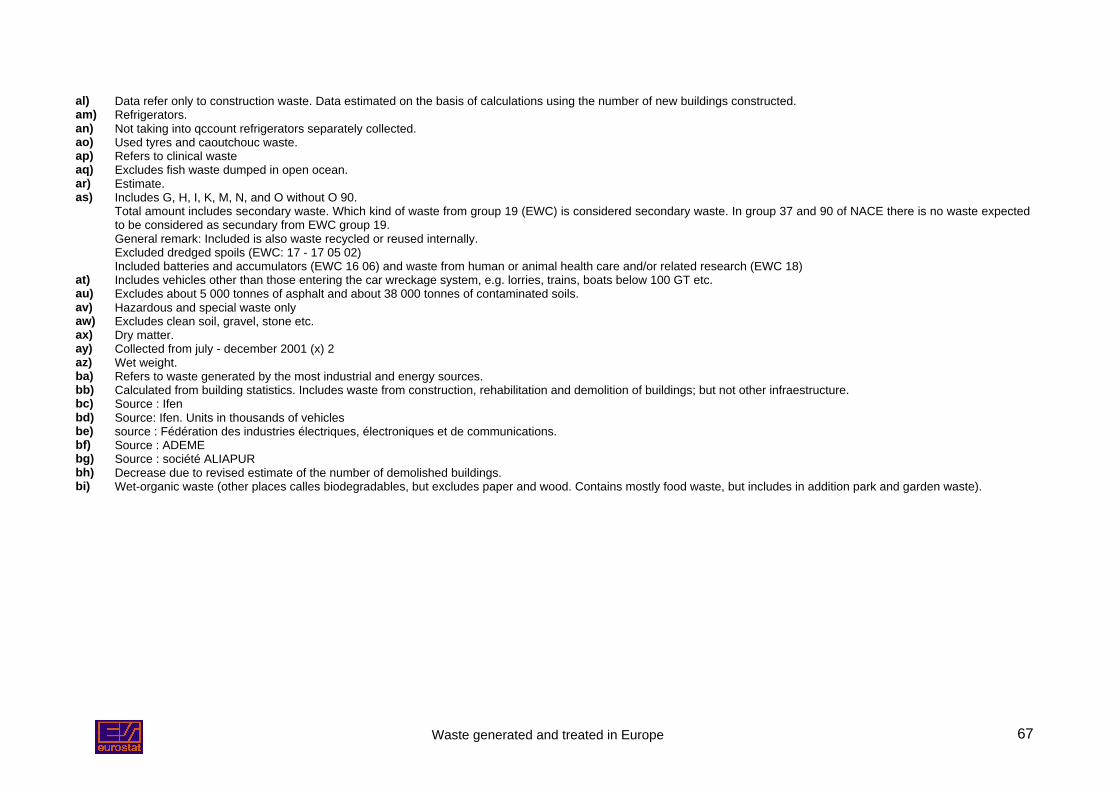
Waste generated and treated in Europe 67
al) Data refer only to construction waste. Data estimated on the basis of calculations using the number of new buildings constructed.am) Refrigerators.an) Not taking into qccount refrigerators separately collected.ao) Used tyres and caoutchouc waste.ap) Refers to clinical wasteaq) Excludes fish waste dumped in open ocean.ar) Estimate.as) Includes G, H, I, K, M, N, and O without O 90.
Total amount includes secondary waste. Which kind of waste from group 19 (EWC) is considered secondary waste. In group 37 and 90 of NACE there is no waste expectedto be considered as secundary from EWC group 19.General remark: Included is also waste recycled or reused internally.Excluded dredged spoils (EWC: 17 - 17 05 02)Included batteries and accumulators (EWC 16 06) and waste from human or animal health care and/or related research (EWC 18)
at) Includes vehicles other than those entering the car wreckage system, e.g. lorries, trains, boats below 100 GT etc.au) Excludes about 5 000 tonnes of asphalt and about 38 000 tonnes of contaminated soils.av) Hazardous and special waste onlyaw) Excludes clean soil, gravel, stone etc.ax) Dry matter.ay) Collected from july - december 2001 (x) 2az) Wet weight.ba) Refers to waste generated by the most industrial and energy sources.bb) Calculated from building statistics. Includes waste from construction, rehabilitation and demolition of buildings; but not other infraestructure.bc) Source : Ifenbd) Source: Ifen. Units in thousands of vehiclesbe) source : Fédération des industries électriques, électroniques et de communications.bf) Source : ADEMEbg) Source : société ALIAPURbh) Decrease due to revised estimate of the number of demolished buildings.bi) Wet-organic waste (other places calles biodegradables, but excludes paper and wood. Contains mostly food waste, but includes in addition park and garden waste).
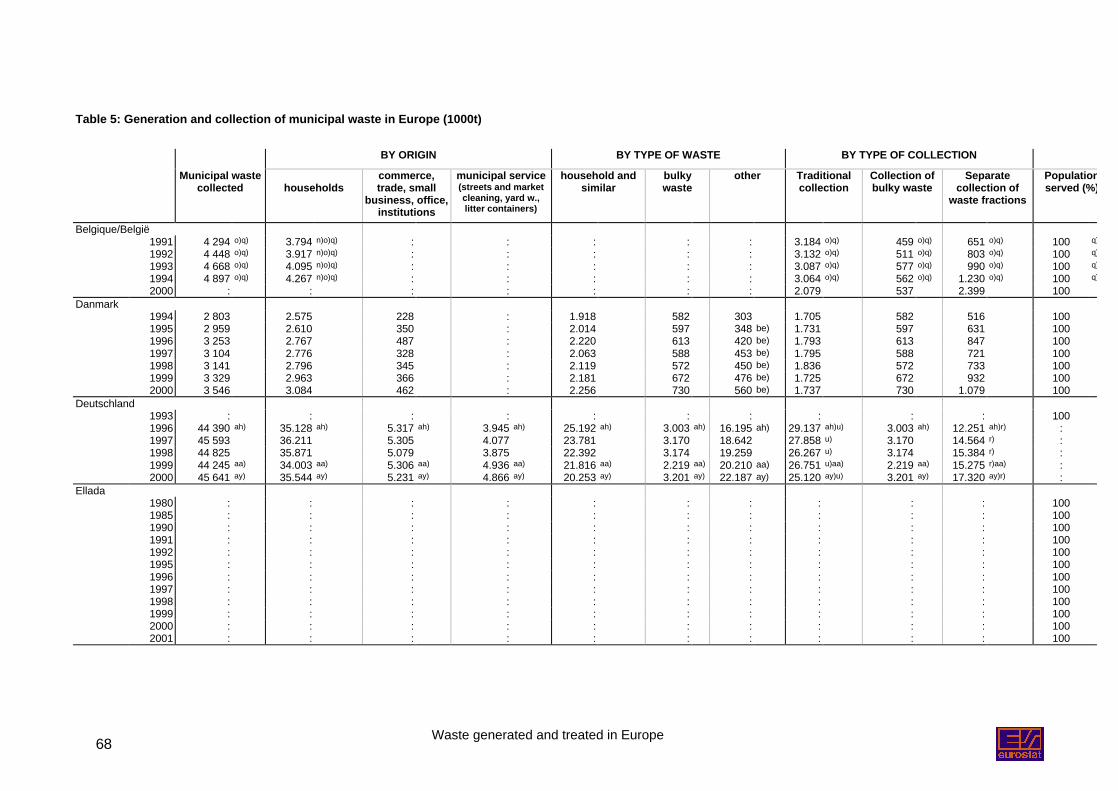
Waste generated and treated in Europe68
Table 5: Generation and collection of municipal waste in Europe (1000t)
BY ORIGIN BY TYPE OF WASTE BY TYPE OF COLLECTION
Municipal wastecollected households
commerce,trade, small
business, office,institutions
municipal service(streets and marketcleaning, yard w.,litter containers)
household andsimilar
bulkywaste
other Traditionalcollection
Collection ofbulky waste
Separatecollection of
waste fractions
Populationserved (%)
Belgique/België1991 4 294 o)q) 3.794 n)o)q) : : : : : 3.184 o)q) 459 o)q) 651 o)q) 100 q)
1992 4 448 o)q) 3.917 n)o)q) : : : : : 3.132 o)q) 511 o)q) 803 o)q) 100 q)
1993 4 668 o)q) 4.095 n)o)q) : : : : : 3.087 o)q) 577 o)q) 990 o)q) 100 q)
1994 4 897 o)q) 4.267 n)o)q) : : : : : 3.064 o)q) 562 o)q) 1.230 o)q) 100 q)
2000 : : : : : : : 2.079 537 2.399 100Danmark
1994 2 803 2.575 228 : 1.918 582 303 1.705 582 516 1001995 2 959 2.610 350 : 2.014 597 348 be) 1.731 597 631 1001996 3 253 2.767 487 : 2.220 613 420 be) 1.793 613 847 1001997 3 104 2.776 328 : 2.063 588 453 be) 1.795 588 721 1001998 3 141 2.796 345 : 2.119 572 450 be) 1.836 572 733 1001999 3 329 2.963 366 : 2.181 672 476 be) 1.725 672 932 1002000 3 546 3.084 462 : 2.256 730 560 be) 1.737 730 1.079 100
Deutschland1993 : : : : : : : : : : 1001996 44 390 ah) 35.128 ah) 5.317 ah) 3.945 ah) 25.192 ah) 3.003 ah) 16.195 ah) 29.137 ah)u) 3.003 ah) 12.251 ah)r) :1997 45 593 36.211 5.305 4.077 23.781 3.170 18.642 27.858 u) 3.170 14.564 r) :1998 44 825 35.871 5.079 3.875 22.392 3.174 19.259 26.267 u) 3.174 15.384 r) :1999 44 245 aa) 34.003 aa) 5.306 aa) 4.936 aa) 21.816 aa) 2.219 aa) 20.210 aa) 26.751 u)aa) 2.219 aa) 15.275 r)aa) :2000 45 641 ay) 35.544 ay) 5.231 ay) 4.866 ay) 20.253 ay) 3.201 ay) 22.187 ay) 25.120 ay)u) 3.201 ay) 17.320 ay)r) :
Ellada1980 : : : : : : : : : : 1001985 : : : : : : : : : : 1001990 : : : : : : : : : : 1001991 : : : : : : : : : : 1001992 : : : : : : : : : : 1001995 : : : : : : : : : : 1001996 : : : : : : : : : : 1001997 : : : : : : : : : : 1001998 : : : : : : : : : : 1001999 : : : : : : : : : : 1002000 : : : : : : : : : : 1002001 : : : : : : : : : : 100
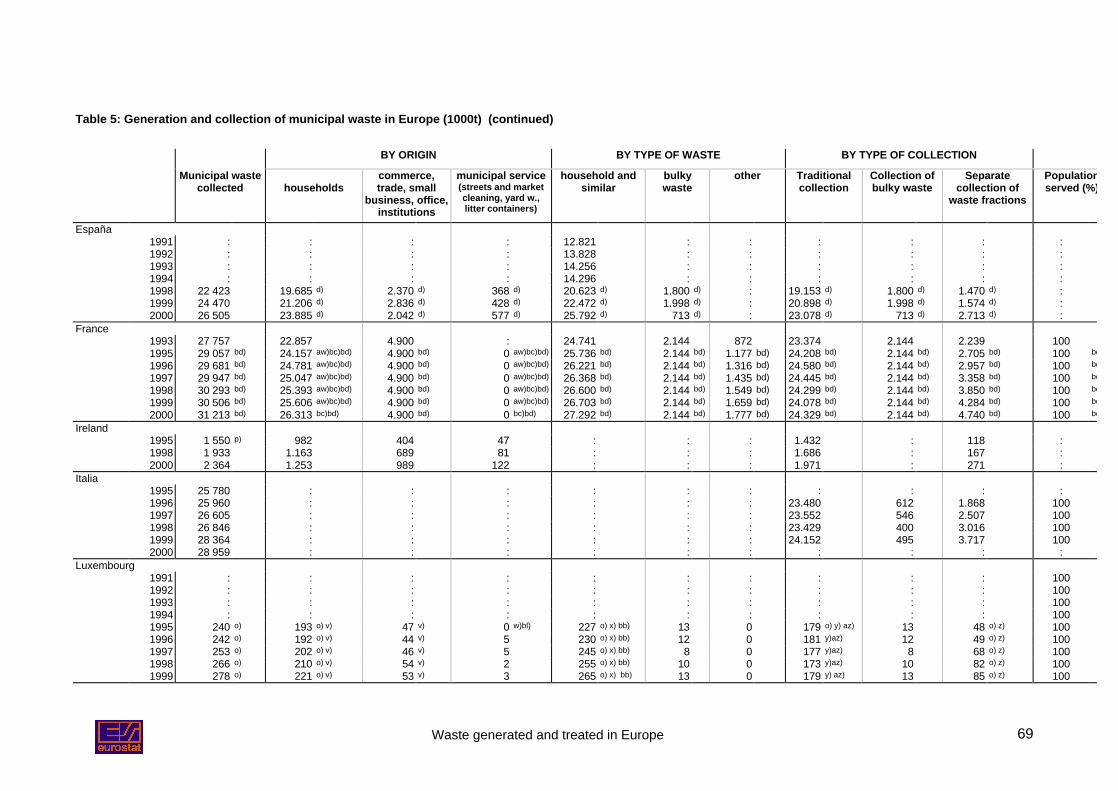
Waste generated and treated in Europe 69
Table 5: Generation and collection of municipal waste in Europe (1000t) (continued)
BY ORIGIN BY TYPE OF WASTE BY TYPE OF COLLECTION
Municipal wastecollected households
commerce,trade, small
business, office,institutions
municipal service(streets and marketcleaning, yard w.,litter containers)
household andsimilar
bulkywaste
other Traditionalcollection
Collection ofbulky waste
Separatecollection of
waste fractions
Populationserved (%)
España1991 : : : : 12.821 : : : : : :1992 : : : : 13.828 : : : : : :1993 : : : : 14.256 : : : : : :1994 : : : : 14.296 : : : : : :1998 22 423 19.685 d) 2.370 d) 368 d) 20.623 d) 1.800 d) : 19.153 d) 1.800 d) 1.470 d) :1999 24 470 21.206 d) 2.836 d) 428 d) 22.472 d) 1.998 d) : 20.898 d) 1.998 d) 1.574 d) :2000 26 505 23.885 d) 2.042 d) 577 d) 25.792 d) 713 d) : 23.078 d) 713 d) 2.713 d) :
France1993 27 757 22.857 4.900 : 24.741 2.144 872 23.374 2.144 2.239 1001995 29 057 bd) 24.157 aw)bc)bd) 4.900 bd) 0 aw)bc)bd) 25.736 bd) 2.144 bd) 1.177 bd) 24.208 bd) 2.144 bd) 2.705 bd) 100 bd)
1996 29 681 bd) 24.781 aw)bc)bd) 4.900 bd) 0 aw)bc)bd) 26.221 bd) 2.144 bd) 1.316 bd) 24.580 bd) 2.144 bd) 2.957 bd) 100 bd)
1997 29 947 bd) 25.047 aw)bc)bd) 4.900 bd) 0 aw)bc)bd) 26.368 bd) 2.144 bd) 1.435 bd) 24.445 bd) 2.144 bd) 3.358 bd) 100 bd)
1998 30 293 bd) 25.393 aw)bc)bd) 4.900 bd) 0 aw)bc)bd) 26.600 bd) 2.144 bd) 1.549 bd) 24.299 bd) 2.144 bd) 3.850 bd) 100 bd)
1999 30 506 bd) 25.606 aw)bc)bd) 4.900 bd) 0 aw)bc)bd) 26.703 bd) 2.144 bd) 1.659 bd) 24.078 bd) 2.144 bd) 4.284 bd) 100 bd)
2000 31 213 bd) 26.313 bc)bd) 4.900 bd) 0 bc)bd) 27.292 bd) 2.144 bd) 1.777 bd) 24.329 bd) 2.144 bd) 4.740 bd) 100 bd)
Ireland1995 1 550 p) 982 404 47 : : : 1.432 : 118 :1998 1 933 1.163 689 81 : : : 1.686 : 167 :2000 2 364 1.253 989 122 : : : 1.971 : 271 :
Italia1995 25 780 : : : : : : : : : :1996 25 960 : : : : : : 23.480 612 1.868 1001997 26 605 : : : : : : 23.552 546 2.507 1001998 26 846 : : : : : : 23.429 400 3.016 1001999 28 364 : : : : : : 24.152 495 3.717 1002000 28 959 : : : : : : : : : :
Luxembourg1991 : : : : : : : : : : 1001992 : : : : : : : : : : 1001993 : : : : : : : : : : 1001994 : : : : : : : : : : 1001995 240 o) 193 o) v) 47 v) 0 w)bl) 227 o) x) bb) 13 0 179 o) y) az) 13 48 o) z) 1001996 242 o) 192 o) v) 44 v) 5 230 o) x) bb) 12 0 181 y)az) 12 49 o) z) 1001997 253 o) 202 o) v) 46 v) 5 245 o) x) bb) 8 0 177 y)az) 8 68 o) z) 1001998 266 o) 210 o) v) 54 v) 2 255 o) x) bb) 10 0 173 y)az) 10 82 o) z) 1001999 278 o) 221 o) v) 53 v) 3 265 o) x) bb) 13 0 179 y) az) 13 85 o) z) 100
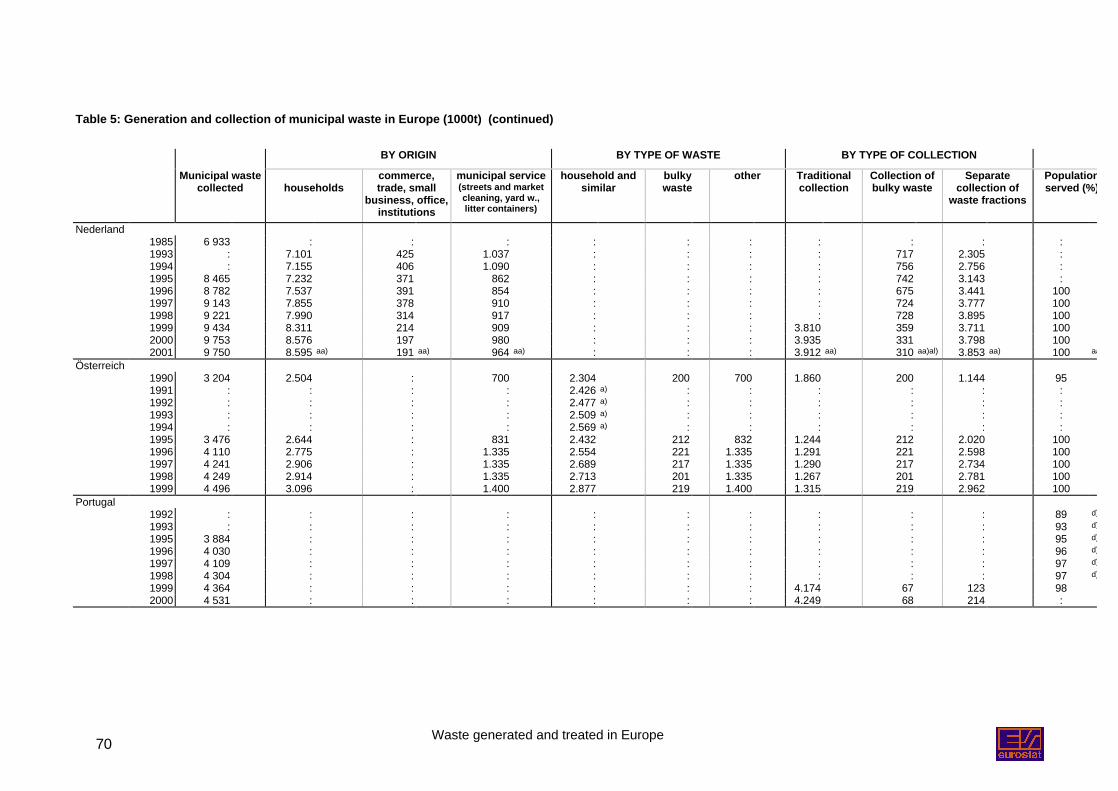
Waste generated and treated in Europe70
Table 5: Generation and collection of municipal waste in Europe (1000t) (continued)
BY ORIGIN BY TYPE OF WASTE BY TYPE OF COLLECTION
Municipal wastecollected households
commerce,trade, small
business, office,institutions
municipal service(streets and marketcleaning, yard w.,litter containers)
household andsimilar
bulkywaste
other Traditionalcollection
Collection ofbulky waste
Separatecollection of
waste fractions
Populationserved (%)
Nederland1985 6 933 : : : : : : : : : :1993 : 7.101 425 1.037 : : : : 717 2.305 :1994 : 7.155 406 1.090 : : : : 756 2.756 :1995 8 465 7.232 371 862 : : : : 742 3.143 :1996 8 782 7.537 391 854 : : : : 675 3.441 1001997 9 143 7.855 378 910 : : : : 724 3.777 1001998 9 221 7.990 314 917 : : : : 728 3.895 1001999 9 434 8.311 214 909 : : : 3.810 359 3.711 1002000 9 753 8.576 197 980 : : : 3.935 331 3.798 1002001 9 750 8.595 aa) 191 aa) 964 aa) : : : 3.912 aa) 310 aa)al) 3.853 aa) 100 aa)
Österreich1990 3 204 2.504 : 700 2.304 200 700 1.860 200 1.144 951991 : : : : 2.426 a) : : : : : :1992 : : : : 2.477 a) : : : : : :1993 : : : : 2.509 a) : : : : : :1994 : : : : 2.569 a) : : : : : :1995 3 476 2.644 : 831 2.432 212 832 1.244 212 2.020 1001996 4 110 2.775 : 1.335 2.554 221 1.335 1.291 221 2.598 1001997 4 241 2.906 : 1.335 2.689 217 1.335 1.290 217 2.734 1001998 4 249 2.914 : 1.335 2.713 201 1.335 1.267 201 2.781 1001999 4 496 3.096 : 1.400 2.877 219 1.400 1.315 219 2.962 100
Portugal1992 : : : : : : : : : : 89 d)
1993 : : : : : : : : : : 93 d)
1995 3 884 : : : : : : : : : 95 d)
1996 4 030 : : : : : : : : : 96 d)
1997 4 109 : : : : : : : : : 97 d)
1998 4 304 : : : : : : : : : 97 d)
1999 4 364 : : : : : : 4.174 67 123 982000 4 531 : : : : : : 4.249 68 214 :
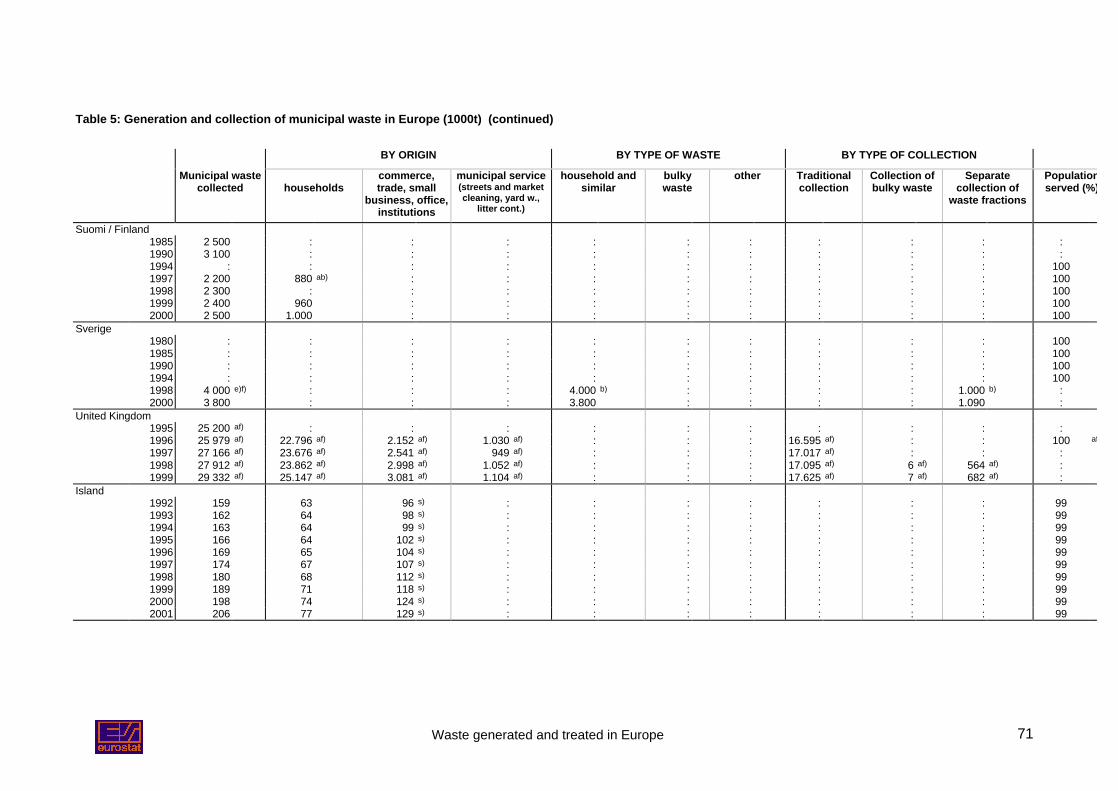
Waste generated and treated in Europe 71
Table 5: Generation and collection of municipal waste in Europe (1000t) (continued)
BY ORIGIN BY TYPE OF WASTE BY TYPE OF COLLECTION
Municipal wastecollected households
commerce,trade, small
business, office,institutions
municipal service(streets and marketcleaning, yard w.,
litter cont.)
household andsimilar
bulkywaste
other Traditionalcollection
Collection ofbulky waste
Separatecollection of
waste fractions
Populationserved (%)
Suomi / Finland1985 2 500 : : : : : : : : : :1990 3 100 : : : : : : : : : :1994 : : : : : : : : : : 1001997 2 200 880 ab) : : : : : : : : 1001998 2 300 : : : : : : : : : 1001999 2 400 960 : : : : : : : : 1002000 2 500 1.000 : : : : : : : : 100
Sverige1980 : : : : : : : : : : 1001985 : : : : : : : : : : 1001990 : : : : : : : : : : 1001994 : : : : : : : : : : 1001998 4 000 e)f) : : : 4.000 b) : : : : 1.000 b) :2000 3 800 : : : 3.800 : : : : 1.090 :
United Kingdom1995 25 200 af) : : : : : : : : : :1996 25 979 af) 22.796 af) 2.152 af) 1.030 af) : : : 16.595 af) : : 100 af)
1997 27 166 af) 23.676 af) 2.541 af) 949 af) : : : 17.017 af) : : :1998 27 912 af) 23.862 af) 2.998 af) 1.052 af) : : : 17.095 af) 6 af) 564 af) :1999 29 332 af) 25.147 af) 3.081 af) 1.104 af) : : : 17.625 af) 7 af) 682 af) :
Island1992 159 63 96 s) : : : : : : : 991993 162 64 98 s) : : : : : : : 991994 163 64 99 s) : : : : : : : 991995 166 64 102 s) : : : : : : : 991996 169 65 104 s) : : : : : : : 991997 174 67 107 s) : : : : : : : 991998 180 68 112 s) : : : : : : : 991999 189 71 118 s) : : : : : : : 992000 198 74 124 s) : : : : : : : 992001 206 77 129 s) : : : : : : : 99
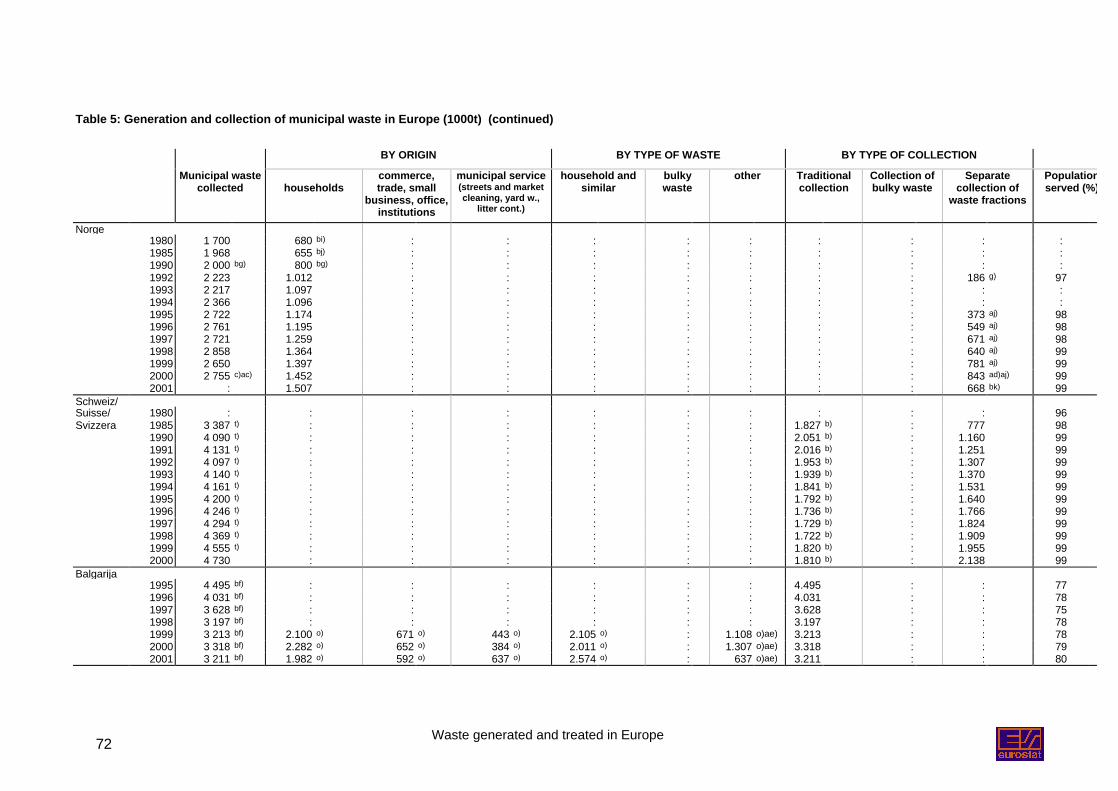
Waste generated and treated in Europe72
Table 5: Generation and collection of municipal waste in Europe (1000t) (continued)
BY ORIGIN BY TYPE OF WASTE BY TYPE OF COLLECTION
Municipal wastecollected households
commerce,trade, small
business, office,institutions
municipal service(streets and marketcleaning, yard w.,
litter cont.)
household andsimilar
bulkywaste
other Traditionalcollection
Collection ofbulky waste
Separatecollection of
waste fractions
Populationserved (%)
Norge1980 1 700 680 bi) : : : : : : : : :1985 1 968 655 bj) : : : : : : : : :1990 2 000 bg) 800 bg) : : : : : : : : :1992 2 223 1.012 : : : : : : : 186 g) 971993 2 217 1.097 : : : : : : : : :1994 2 366 1.096 : : : : : : : : :1995 2 722 1.174 : : : : : : : 373 aj) 981996 2 761 1.195 : : : : : : : 549 aj) 981997 2 721 1.259 : : : : : : : 671 aj) 981998 2 858 1.364 : : : : : : : 640 aj) 991999 2 650 1.397 : : : : : : : 781 aj) 992000 2 755 c)ac) 1.452 : : : : : : : 843 ad)aj) 992001 : 1.507 : : : : : : : 668 bk) 99
Schweiz/Suisse/ 1980 : : : : : : : : : : 96Svizzera 1985 3 387 t) : : : : : : 1.827 b) : 777 98
1990 4 090 t) : : : : : : 2.051 b) : 1.160 991991 4 131 t) : : : : : : 2.016 b) : 1.251 991992 4 097 t) : : : : : : 1.953 b) : 1.307 991993 4 140 t) : : : : : : 1.939 b) : 1.370 991994 4 161 t) : : : : : : 1.841 b) : 1.531 991995 4 200 t) : : : : : : 1.792 b) : 1.640 991996 4 246 t) : : : : : : 1.736 b) : 1.766 991997 4 294 t) : : : : : : 1.729 b) : 1.824 991998 4 369 t) : : : : : : 1.722 b) : 1.909 991999 4 555 t) : : : : : : 1.820 b) : 1.955 992000 4 730 : : : : : : 1.810 b) : 2.138 99
Balgarija1995 4 495 bf) : : : : : : 4.495 : : 771996 4 031 bf) : : : : : : 4.031 : : 781997 3 628 bf) : : : : : : 3.628 : : 751998 3 197 bf) : : : : : : 3.197 : : 781999 3 213 bf) 2.100 o) 671 o) 443 o) 2.105 o) : 1.108 o)ae) 3.213 : : 782000 3 318 bf) 2.282 o) 652 o) 384 o) 2.011 o) : 1.307 o)ae) 3.318 : : 792001 3 211 bf) 1.982 o) 592 o) 637 o) 2.574 o) : 637 o)ae) 3.211 : : 80
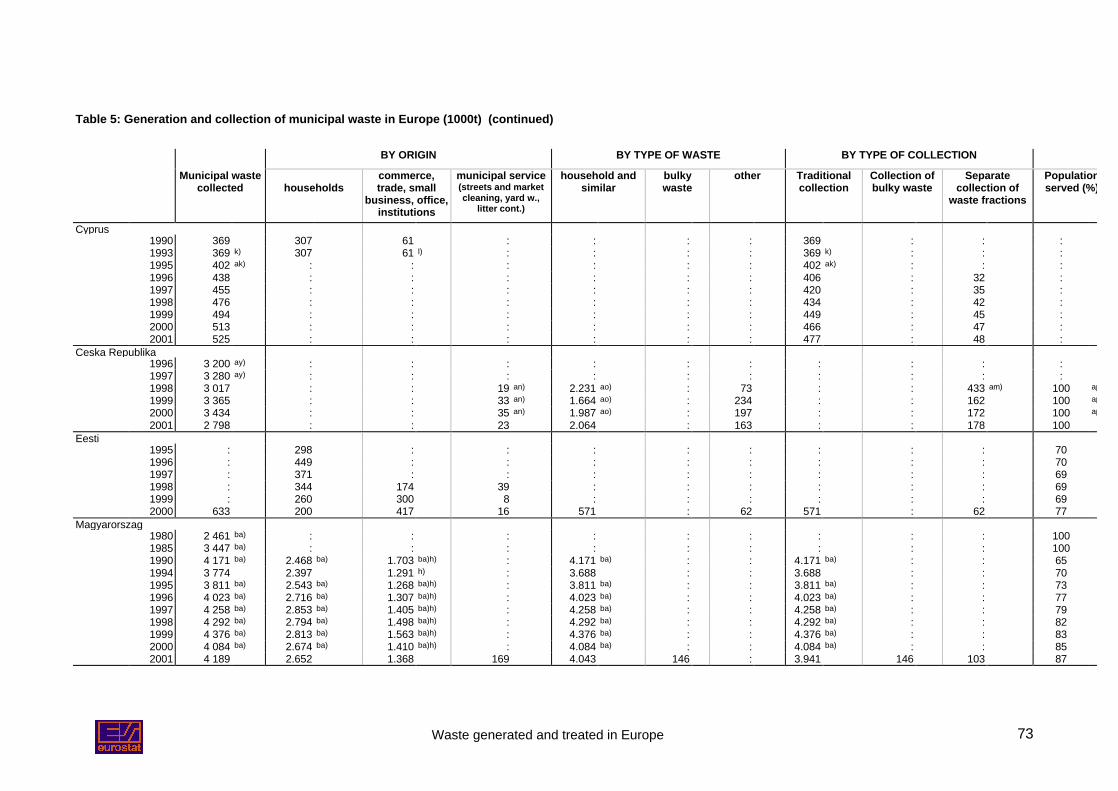
Waste generated and treated in Europe 73
Table 5: Generation and collection of municipal waste in Europe (1000t) (continued)
BY ORIGIN BY TYPE OF WASTE BY TYPE OF COLLECTION
Municipal wastecollected households
commerce,trade, small
business, office,institutions
municipal service(streets and marketcleaning, yard w.,
litter cont.)
household andsimilar
bulkywaste
other Traditionalcollection
Collection ofbulky waste
Separatecollection of
waste fractions
Populationserved (%)
Cyprus1990 369 307 61 : : : : 369 : : :1993 369 k) 307 61 l) : : : : 369 k) : : :1995 402 ak) : : : : : : 402 ak) : : :1996 438 : : : : : : 406 : 32 :1997 455 : : : : : : 420 : 35 :1998 476 : : : : : : 434 : 42 :1999 494 : : : : : : 449 : 45 :2000 513 : : : : : : 466 : 47 :2001 525 : : : : : : 477 : 48 :
Ceska Republika1996 3 200 ay) : : : : : : : : : :1997 3 280 ay) : : : : : : : : : :1998 3 017 : : 19 an) 2.231 ao) : 73 : : 433 am) 100 ap)
1999 3 365 : : 33 an) 1.664 ao) : 234 : : 162 100 ap)
2000 3 434 : : 35 an) 1.987 ao) : 197 : : 172 100 ap)
2001 2 798 : : 23 2.064 : 163 : : 178 100Eesti
1995 : 298 : : : : : : : : 701996 : 449 : : : : : : : : 701997 : 371 : : : : : : : : 691998 : 344 174 39 : : : : : : 691999 : 260 300 8 : : : : : : 692000 633 200 417 16 571 : 62 571 : 62 77
Magyarorszag1980 2 461 ba) : : : : : : : : : 1001985 3 447 ba) : : : : : : : : : 1001990 4 171 ba) 2.468 ba) 1.703 ba)h) : 4.171 ba) : : 4.171 ba) : : 651994 3 774 2.397 1.291 h) : 3.688 : : 3.688 : : 701995 3 811 ba) 2.543 ba) 1.268 ba)h) : 3.811 ba) : : 3.811 ba) : : 731996 4 023 ba) 2.716 ba) 1.307 ba)h) : 4.023 ba) : : 4.023 ba) : : 771997 4 258 ba) 2.853 ba) 1.405 ba)h) : 4.258 ba) : : 4.258 ba) : : 791998 4 292 ba) 2.794 ba) 1.498 ba)h) : 4.292 ba) : : 4.292 ba) : : 821999 4 376 ba) 2.813 ba) 1.563 ba)h) : 4.376 ba) : : 4.376 ba) : : 832000 4 084 ba) 2.674 ba) 1.410 ba)h) : 4.084 ba) : : 4.084 ba) : : 852001 4 189 2.652 1.368 169 4.043 146 : 3.941 146 103 87
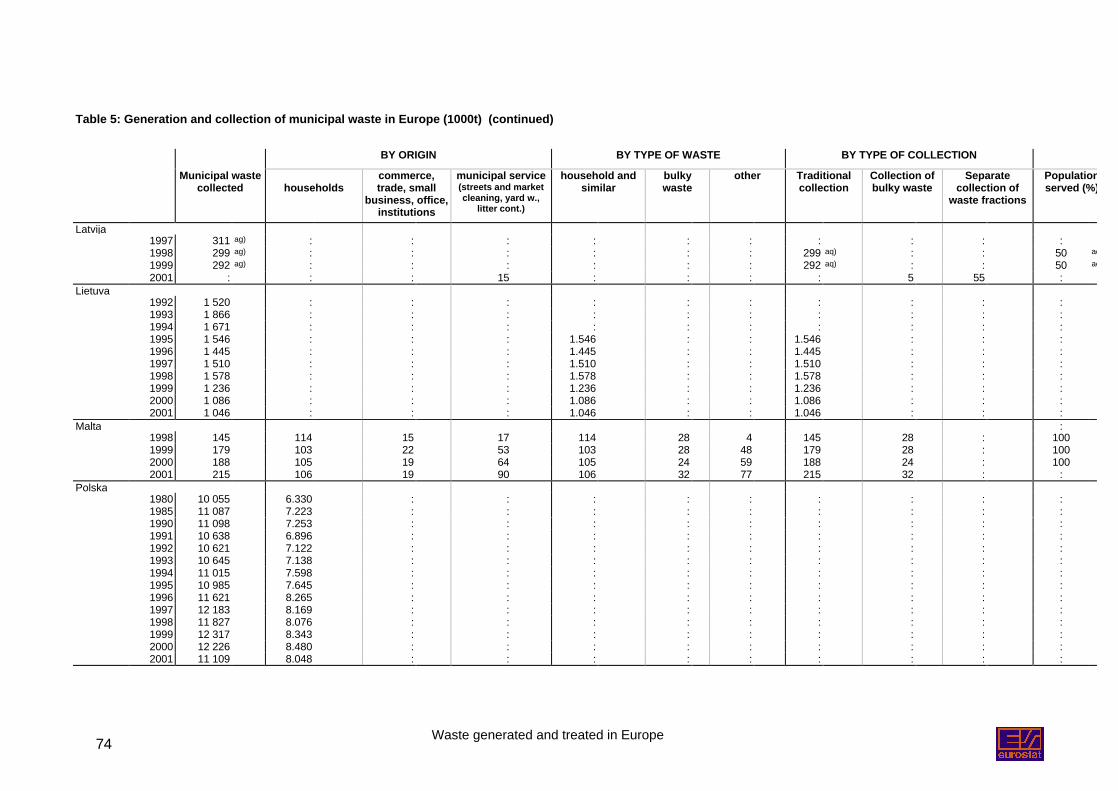
Waste generated and treated in Europe74
Table 5: Generation and collection of municipal waste in Europe (1000t) (continued)
BY ORIGIN BY TYPE OF WASTE BY TYPE OF COLLECTION
Municipal wastecollected households
commerce,trade, small
business, office,institutions
municipal service(streets and marketcleaning, yard w.,
litter cont.)
household andsimilar
bulkywaste
other Traditionalcollection
Collection ofbulky waste
Separatecollection of
waste fractions
Populationserved (%)
Latvija1997 311 ag) : : : : : : : : : :1998 299 ag) : : : : : : 299 aq) : : 50 aq)
1999 292 ag) : : : : : : 292 aq) : : 50 aq)
2001 : : : 15 : : : : 5 55 :Lietuva
1992 1 520 : : : : : : : : : :1993 1 866 : : : : : : : : : :1994 1 671 : : : : : : : : : :1995 1 546 : : : 1.546 : : 1.546 : : :1996 1 445 : : : 1.445 : : 1.445 : : :1997 1 510 : : : 1.510 : : 1.510 : : :1998 1 578 : : : 1.578 : : 1.578 : : :1999 1 236 : : : 1.236 : : 1.236 : : :2000 1 086 : : : 1.086 : : 1.086 : : :2001 1 046 : : : 1.046 : : 1.046 : : :
Malta :1998 145 114 15 17 114 28 4 145 28 : 1001999 179 103 22 53 103 28 48 179 28 : 1002000 188 105 19 64 105 24 59 188 24 : 1002001 215 106 19 90 106 32 77 215 32 : :
Polska1980 10 055 6.330 : : : : : : : : :1985 11 087 7.223 : : : : : : : : :1990 11 098 7.253 : : : : : : : : :1991 10 638 6.896 : : : : : : : : :1992 10 621 7.122 : : : : : : : : :1993 10 645 7.138 : : : : : : : : :1994 11 015 7.598 : : : : : : : : :1995 10 985 7.645 : : : : : : : : :1996 11 621 8.265 : : : : : : : : :1997 12 183 8.169 : : : : : : : : :1998 11 827 8.076 : : : : : : : : :1999 12 317 8.343 : : : : : : : : :2000 12 226 8.480 : : : : : : : : :2001 11 109 8.048 : : : : : : : : :
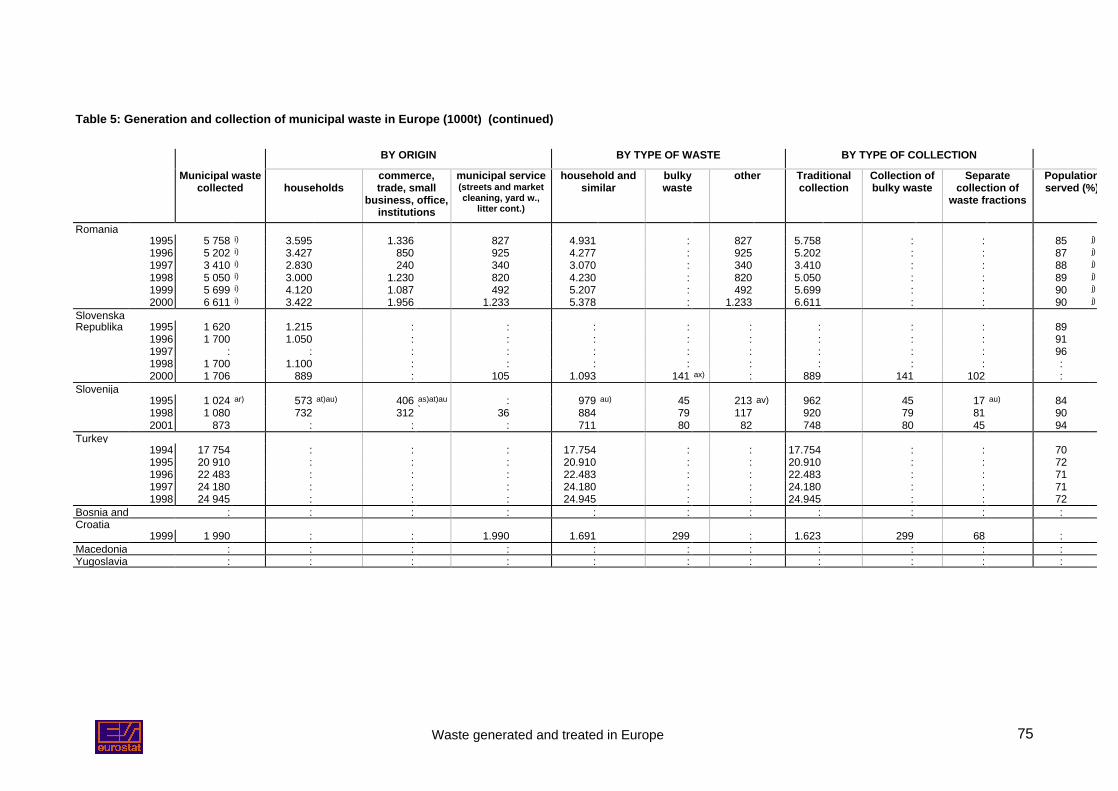
Waste generated and treated in Europe 75
Table 5: Generation and collection of municipal waste in Europe (1000t) (continued)
BY ORIGIN BY TYPE OF WASTE BY TYPE OF COLLECTION
Municipal wastecollected households
commerce,trade, small
business, office,institutions
municipal service(streets and marketcleaning, yard w.,
litter cont.)
household andsimilar
bulkywaste
other Traditionalcollection
Collection ofbulky waste
Separatecollection of
waste fractions
Populationserved (%)
Romania1995 5 758 i) 3.595 1.336 827 4.931 : 827 5.758 : : 85 j)
1996 5 202 i) 3.427 850 925 4.277 : 925 5.202 : : 87 j)
1997 3 410 i) 2.830 240 340 3.070 : 340 3.410 : : 88 j)
1998 5 050 i) 3.000 1.230 820 4.230 : 820 5.050 : : 89 j)
1999 5 699 i) 4.120 1.087 492 5.207 : 492 5.699 : : 90 j)
2000 6 611 i) 3.422 1.956 1.233 5.378 : 1.233 6.611 : : 90 j)
SlovenskaRepublika 1995 1 620 1.215 : : : : : : : : 89
1996 1 700 1.050 : : : : : : : : 911997 : : : : : : : : : : 961998 1 700 1.100 : : : : : : : : :2000 1 706 889 : 105 1.093 141 ax) : 889 141 102 :
Slovenija1995 1 024 ar) 573 at)au) 406 as)at)au
): 979 au) 45 213 av) 962 45 17 au) 84
1998 1 080 732 312 36 884 79 117 920 79 81 902001 873 : : : 711 80 82 748 80 45 94
Turkey1994 17 754 : : : 17.754 : : 17.754 : : 701995 20 910 : : : 20.910 : : 20.910 : : 721996 22 483 : : : 22.483 : : 22.483 : : 711997 24 180 : : : 24.180 : : 24.180 : : 711998 24 945 : : : 24.945 : : 24.945 : : 72
Bosnia and : : : : : : : : : : :Croatia
1999 1 990 : : 1.990 1.691 299 : 1.623 299 68 :Macedonia : : : : : : : : : : :Yugoslavia : : : : : : : : : : :
Waste generated and treated in Europe76
Table 5: Generation and collection of municipal waste in Europe (1000t)
FOOTNOTES
a) Excludes own deliveries to disposal sites.b) Includes bulky waste.c) Surveys of municipal waste in 1992 and 1995 indicate that approximately 90 000 t of waste from building and construction activities entered the municipal waste stream. This
amount is included in the Norwegian figures.d) Source :INE.e) Treatment of municipal waste.f) 900 000 tonnes collected by private enterprise and reported under Commission decision 97/138/EC included.g) Included in the total amount of municipal waste collected.h) B2 includes B3 data.i) Total quantity of waste collected by or on behalf of municipalities.j) Percentage of population served by traditional collection services.k) Data provided is based on the results of an ad-hoc survey. It refers to municipal solid waste delivered to landfills. There may exist a small proportion of recycling before disposal to
landfills.l) Waste originating from both category B2 and category B3.m) Included in category B2.n) Includes waste from small enterprises in several regionso) National estimate.p) Figure based on collected household, commercial and street cleansing and separately collected for recovery.q) Not validated by the Belgium regional authorities.r) Seperate collection (glass, paper, plastics, electronic parts) and Compostable waste from the bio-bin.s) Includes waste from municipal servicest) Includes municipal waste collected by or on behalf of municipalities and municipal waste collected by the private sectoru) Including waste from garden and parks, street sweepings and market wastev) Assumes that all fractions recovered (see line D3) are generated by households and not by retails and SMEs. It is impossible to breakdown fractions collected separately for
recovery operations for what is brought to recycling centres or collected door-to-door.
w) Included in categories B1 and B2.x) Data covers household waste (except bulky household waste), retail and small business similar to household waste, other household waste as well as fractions collected separately
for recovery operations (line D3).y) Data covers household waste (except bulky household waste), retail and small business similar to household waste and other household waste.
z) Fractions collected separately include non hazardous packaging, problematic packaging, paper & glass, other products (such as old clothes, metals, tyres, rubber,…), problematicwaste, TVs, lamps, fridge, electric & electronic devices, biological and garden waste.
aa) Preliminary data.ab) Based on estimation made in the beginning of 1990's that 40% of mw. is from households.
Waste generated and treated in Europe 77
ac) Includes B1-B3, C1-C2ad) Of which 581 from households.ae) Data about wastes from hospitals, buildings, agriculture and other are included.af) England and Wales only.ag) These are amounts from the state statistical survey 2001 on municipal waste. Data given for previous years are very disputable, because are estimated on the basis of some
provided pilot projects by the assumption that 50% of generated waste is collected. (02/10/2002 - Juris Fridmanis - Head of Statistical Data Division - Latvian Environment Agency)
ah) Time break due to new methodologies.aj) This amount is included in the total amount of municipal waste collected.ak) Data refer to the year 1993. They are based on the results of an ad-hoc survey. Data refer to municipal solid waste delivered to landfills. There may exist a small proportion of
recycling before disposal to landfills.al) Not including brought bulky waste; the whole timeseries will be revised next year.am) Source : Czech Environmental Institute.an) CZ-NACE 90, EWC code 20 03 02 + 20 03 03ao) EWC code 20 03 01ap) The Waste Act obliges Municipality authorities to provide a waste collection service.aq) The type of collection is "traditional collection".ar) Figures represent quantities collected by municipal waste collection scheme covering 84,20% of population.as) B2 also includes unknown quantities of waste that should be reported under B3 (waste from municipal services).at) Quantities under B1 and B2 do not include bulky waste for which only total amount is known (44,91), and can't be broken down by its origin.au) Quantities of separately collected fractions (16,79) are suitably included within B1 and B2.av) Inert waste and waste from waste water treatment plants are not included within the amount of 1023931 t of total municipal waste collected.aw) Waste collected from municipal services are counted in the amount of waste from households.ax) Source: Statistical Office of SR (includes bulky waste from households and municipalities - includes construction and demolition waste)ay) Estimate.az) Covers household waste (except household bulky waste), waste from commercial activities and from small business similar to household waste and other type of household waste.
ba) Data were collected in volumetric unit, for calculation up to 1999 0.22, in 2000 0.2 t/m3 coefficient of density was used.bb) Covers household waste (except household bulky waste), waste from commercial activities and from small business similar to household waste, other type of household waste, and
waste collected for recovery operations.bc) Waste collected from municipal services are counted in the amount of waste from householdsbd) Source: IFENbe) Garden waste from households and Institutions, Commerce and Officesbf) Source of information - statistical survey, NSIbg) Rough estimate based on expert opinion.bh) From 2001 the survey only covers household waste.bi) Figure refers to 1982.bj) Figure refers to 1983.bk) Household waste only.bl) Included in categories B2 and B3.
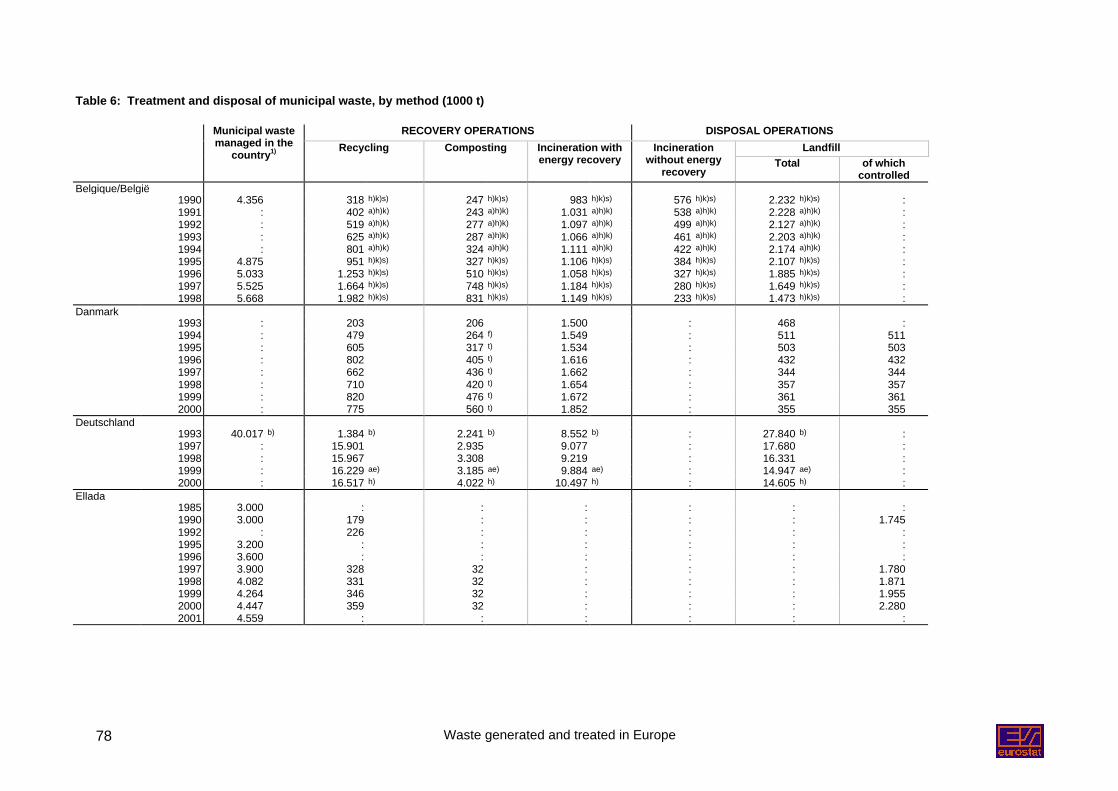
Waste generated and treated in Europe78
Table 6: Treatment and disposal of municipal waste, by method (1000 t)
RECOVERY OPERATIONS DISPOSAL OPERATIONSLandfill
Municipal wastemanaged in the
country1) Recycling Composting Incineration withenergy recovery
Incinerationwithout energy
recoveryTotal of which
controlledBelgique/België
1990 4.356 318 h)k)s) 247 h)k)s) 983 h)k)s) 576 h)k)s) 2.232 h)k)s) :1991 : 402 a)h)k) 243 a)h)k) 1.031 a)h)k) 538 a)h)k) 2.228 a)h)k) :1992 : 519 a)h)k) 277 a)h)k) 1.097 a)h)k) 499 a)h)k) 2.127 a)h)k) :1993 : 625 a)h)k) 287 a)h)k) 1.066 a)h)k) 461 a)h)k) 2.203 a)h)k) :1994 : 801 a)h)k) 324 a)h)k) 1.111 a)h)k) 422 a)h)k) 2.174 a)h)k) :1995 4.875 951 h)k)s) 327 h)k)s) 1.106 h)k)s) 384 h)k)s) 2.107 h)k)s) :1996 5.033 1.253 h)k)s) 510 h)k)s) 1.058 h)k)s) 327 h)k)s) 1.885 h)k)s) :1997 5.525 1.664 h)k)s) 748 h)k)s) 1.184 h)k)s) 280 h)k)s) 1.649 h)k)s) :1998 5.668 1.982 h)k)s) 831 h)k)s) 1.149 h)k)s) 233 h)k)s) 1.473 h)k)s) :
Danmark1993 : 203 206 1.500 : 468 :1994 : 479 264 f) 1.549 : 511 5111995 : 605 317 t) 1.534 : 503 5031996 : 802 405 t) 1.616 : 432 4321997 : 662 436 t) 1.662 : 344 3441998 : 710 420 t) 1.654 : 357 3571999 : 820 476 t) 1.672 : 361 3612000 : 775 560 t) 1.852 : 355 355
Deutschland1993 40.017 b) 1.384 b) 2.241 b) 8.552 b) : 27.840 b) :1997 : 15.901 2.935 9.077 : 17.680 :1998 : 15.967 3.308 9.219 : 16.331 :1999 : 16.229 ae) 3.185 ae) 9.884 ae) : 14.947 ae) :2000 : 16.517 h) 4.022 h) 10.497 h) : 14.605 h) :
Ellada1985 3.000 : : : : : :1990 3.000 179 : : : : 1.7451992 : 226 : : : : :1995 3.200 : : : : : :1996 3.600 : : : : : :1997 3.900 328 32 : : : 1.7801998 4.082 331 32 : : : 1.8711999 4.264 346 32 : : : 1.9552000 4.447 359 32 : : : 2.2802001 4.559 : : : : : :
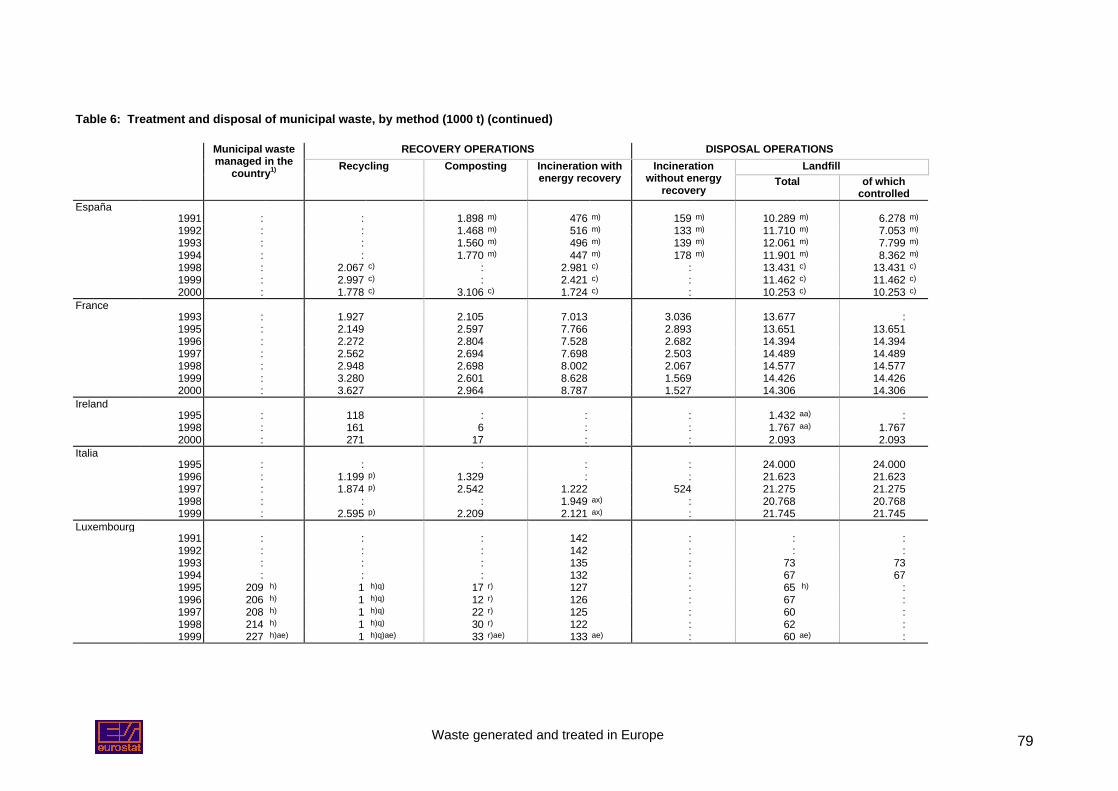
Waste generated and treated in Europe 79
Table 6: Treatment and disposal of municipal waste, by method (1000 t) (continued)
RECOVERY OPERATIONS DISPOSAL OPERATIONSLandfill
Municipal wastemanaged in the
country1) Recycling Composting Incineration withenergy recovery
Incinerationwithout energy
recoveryTotal of which
controlledEspaña
1991 : : 1.898 m) 476 m) 159 m) 10.289 m) 6.278 m)
1992 : : 1.468 m) 516 m) 133 m) 11.710 m) 7.053 m)
1993 : : 1.560 m) 496 m) 139 m) 12.061 m) 7.799 m)
1994 : : 1.770 m) 447 m) 178 m) 11.901 m) 8.362 m)
1998 : 2.067 c) : 2.981 c) : 13.431 c) 13.431 c)
1999 : 2.997 c) : 2.421 c) : 11.462 c) 11.462 c)
2000 : 1.778 c) 3.106 c) 1.724 c) : 10.253 c) 10.253 c)
France1993 : 1.927 2.105 7.013 3.036 13.677 :1995 : 2.149 2.597 7.766 2.893 13.651 13.6511996 : 2.272 2.804 7.528 2.682 14.394 14.3941997 : 2.562 2.694 7.698 2.503 14.489 14.4891998 : 2.948 2.698 8.002 2.067 14.577 14.5771999 : 3.280 2.601 8.628 1.569 14.426 14.4262000 : 3.627 2.964 8.787 1.527 14.306 14.306
Ireland1995 : 118 : : : 1.432 aa) :1998 : 161 6 : : 1.767 aa) 1.7672000 : 271 17 : : 2.093 2.093
Italia1995 : : : : : 24.000 24.0001996 : 1.199 p) 1.329 : : 21.623 21.6231997 : 1.874 p) 2.542 1.222 524 21.275 21.2751998 : : : 1.949 ax) : 20.768 20.7681999 : 2.595 p) 2.209 2.121 ax) : 21.745 21.745
Luxembourg1991 : : : 142 : : :1992 : : : 142 : : :1993 : : : 135 : 73 731994 : : : 132 : 67 671995 209 h) 1 h)q) 17 r) 127 : 65 h) :1996 206 h) 1 h)q) 12 r) 126 : 67 :1997 208 h) 1 h)q) 22 r) 125 : 60 :1998 214 h) 1 h)q) 30 r) 122 : 62 :1999 227 h)ae) 1 h)q)ae) 33 r)ae) 133 ae) : 60 ae) :
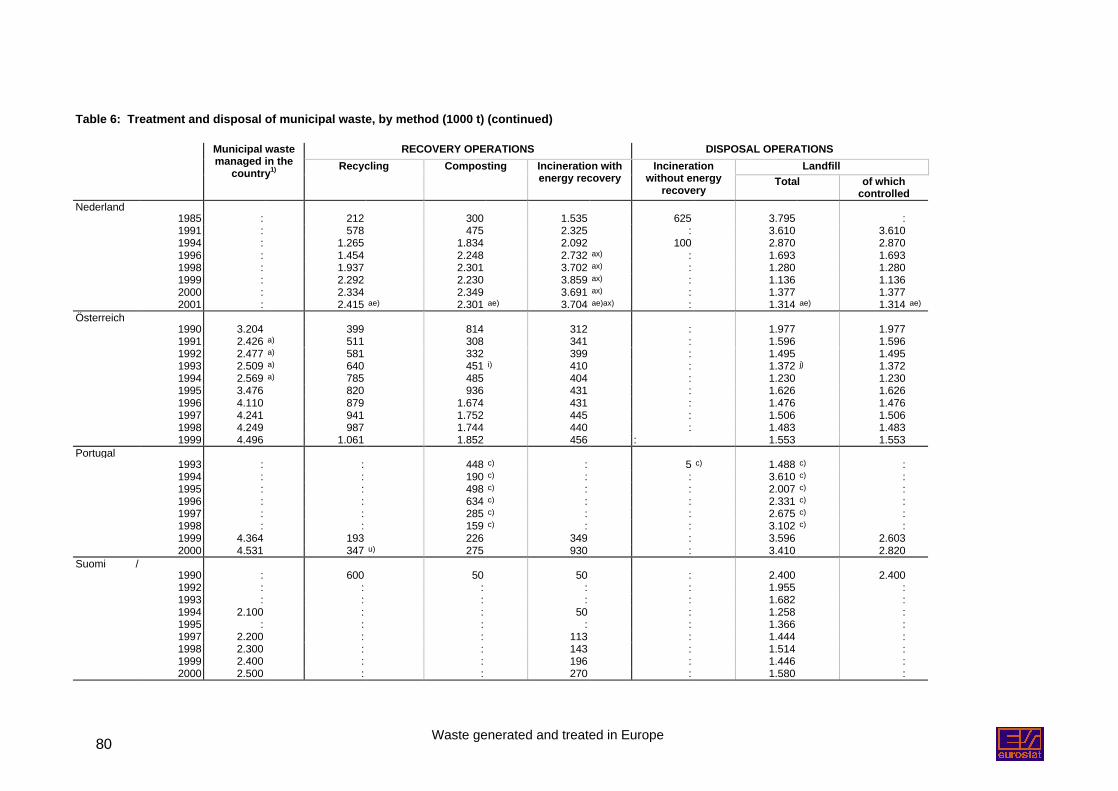
Waste generated and treated in Europe80
Table 6: Treatment and disposal of municipal waste, by method (1000 t) (continued)
RECOVERY OPERATIONS DISPOSAL OPERATIONSLandfill
Municipal wastemanaged in the
country1) Recycling Composting Incineration withenergy recovery
Incinerationwithout energy
recoveryTotal of which
controlledNederland
1985 : 212 300 1.535 625 3.795 :1991 : 578 475 2.325 : 3.610 3.6101994 : 1.265 1.834 2.092 100 2.870 2.8701996 : 1.454 2.248 2.732 ax) : 1.693 1.6931998 : 1.937 2.301 3.702 ax) : 1.280 1.2801999 : 2.292 2.230 3.859 ax) : 1.136 1.1362000 : 2.334 2.349 3.691 ax) : 1.377 1.3772001 : 2.415 ae) 2.301 ae) 3.704 ae)ax) : 1.314 ae) 1.314 ae)
Österreich1990 3.204 399 814 312 : 1.977 1.9771991 2.426 a) 511 308 341 : 1.596 1.5961992 2.477 a) 581 332 399 : 1.495 1.4951993 2.509 a) 640 451 i) 410 : 1.372 j) 1.3721994 2.569 a) 785 485 404 : 1.230 1.2301995 3.476 820 936 431 : 1.626 1.6261996 4.110 879 1.674 431 : 1.476 1.4761997 4.241 941 1.752 445 : 1.506 1.5061998 4.249 987 1.744 440 : 1.483 1.4831999 4.496 1.061 1.852 456 : 1.553 1.553
Portugal1993 : : 448 c) : 5 c) 1.488 c) :1994 : : 190 c) : : 3.610 c) :1995 : : 498 c) : : 2.007 c) :1996 : : 634 c) : : 2.331 c) :1997 : : 285 c) : : 2.675 c) :1998 : : 159 c) : : 3.102 c) :1999 4.364 193 226 349 : 3.596 2.6032000 4.531 347 u) 275 930 : 3.410 2.820
Suomi /1990 : 600 50 50 : 2.400 2.4001992 : : : : : 1.955 :1993 : : : : : 1.682 :1994 2.100 : : 50 : 1.258 :1995 : : : : : 1.366 :1997 2.200 : : 113 : 1.444 :1998 2.300 : : 143 : 1.514 :1999 2.400 : : 196 : 1.446 :2000 2.500 : : 270 : 1.580 :
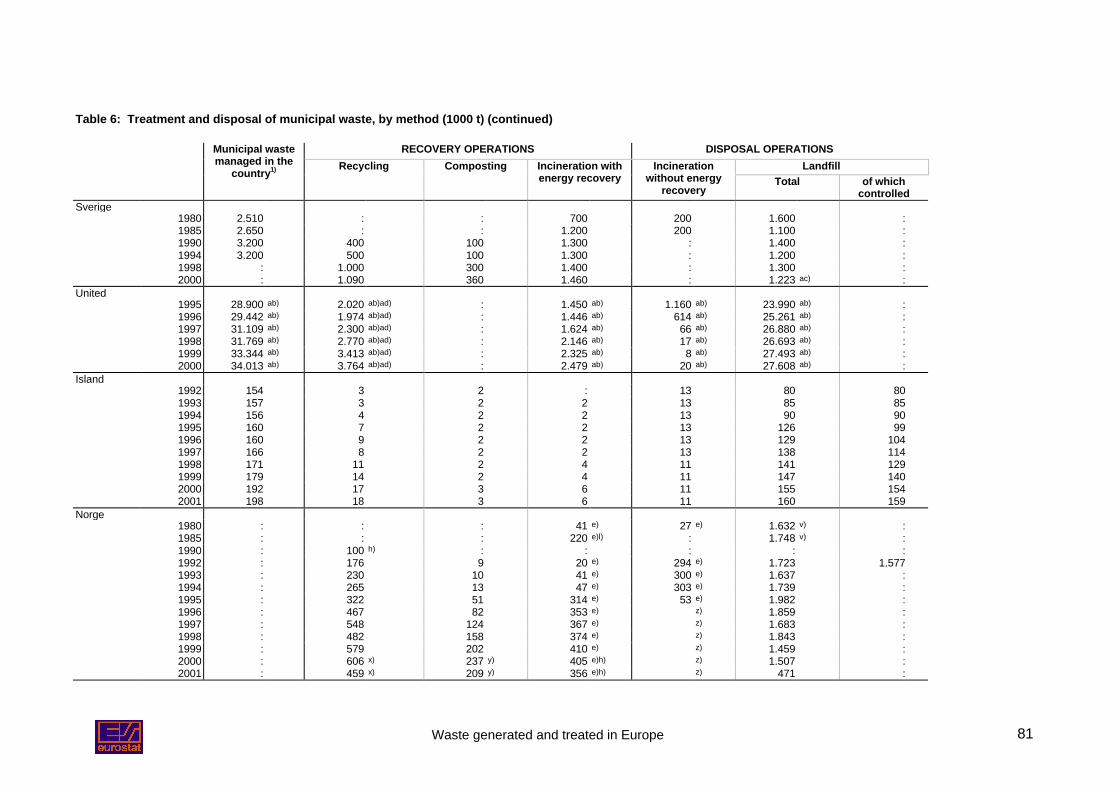
Waste generated and treated in Europe 81
Table 6: Treatment and disposal of municipal waste, by method (1000 t) (continued)
RECOVERY OPERATIONS DISPOSAL OPERATIONSLandfill
Municipal wastemanaged in the
country1) Recycling Composting Incineration withenergy recovery
Incinerationwithout energy
recoveryTotal of which
controlledSverige
1980 2.510 : : 700 200 1.600 :1985 2.650 : : 1.200 200 1.100 :1990 3.200 400 100 1.300 : 1.400 :1994 3.200 500 100 1.300 : 1.200 :1998 : 1.000 300 1.400 : 1.300 :2000 : 1.090 360 1.460 : 1.223 ac) :
United1995 28.900 ab) 2.020 ab)ad) : 1.450 ab) 1.160 ab) 23.990 ab) :1996 29.442 ab) 1.974 ab)ad) : 1.446 ab) 614 ab) 25.261 ab) :1997 31.109 ab) 2.300 ab)ad) : 1.624 ab) 66 ab) 26.880 ab) :1998 31.769 ab) 2.770 ab)ad) : 2.146 ab) 17 ab) 26.693 ab) :1999 33.344 ab) 3.413 ab)ad) : 2.325 ab) 8 ab) 27.493 ab) :2000 34.013 ab) 3.764 ab)ad) : 2.479 ab) 20 ab) 27.608 ab) :
Island1992 154 3 2 : 13 80 801993 157 3 2 2 13 85 851994 156 4 2 2 13 90 901995 160 7 2 2 13 126 991996 160 9 2 2 13 129 1041997 166 8 2 2 13 138 1141998 171 11 2 4 11 141 1291999 179 14 2 4 11 147 1402000 192 17 3 6 11 155 1542001 198 18 3 6 11 160 159
Norge1980 : : : 41 e) 27 e) 1.632 v) :1985 : : : 220 e)l) : 1.748 v) :1990 : 100 h) : : : : :1992 : 176 9 20 e) 294 e) 1.723 1.5771993 : 230 10 41 e) 300 e) 1.637 :1994 : 265 13 47 e) 303 e) 1.739 :1995 : 322 51 314 e) 53 e) 1.982 :1996 : 467 82 353 e) z) 1.859 :1997 : 548 124 367 e) z) 1.683 :1998 : 482 158 374 e) z) 1.843 :1999 : 579 202 410 e) z) 1.459 :2000 : 606 x) 237 y) 405 e)h) z) 1.507 :2001 : 459 x) 209 y) 356 e)h) z) 471 :
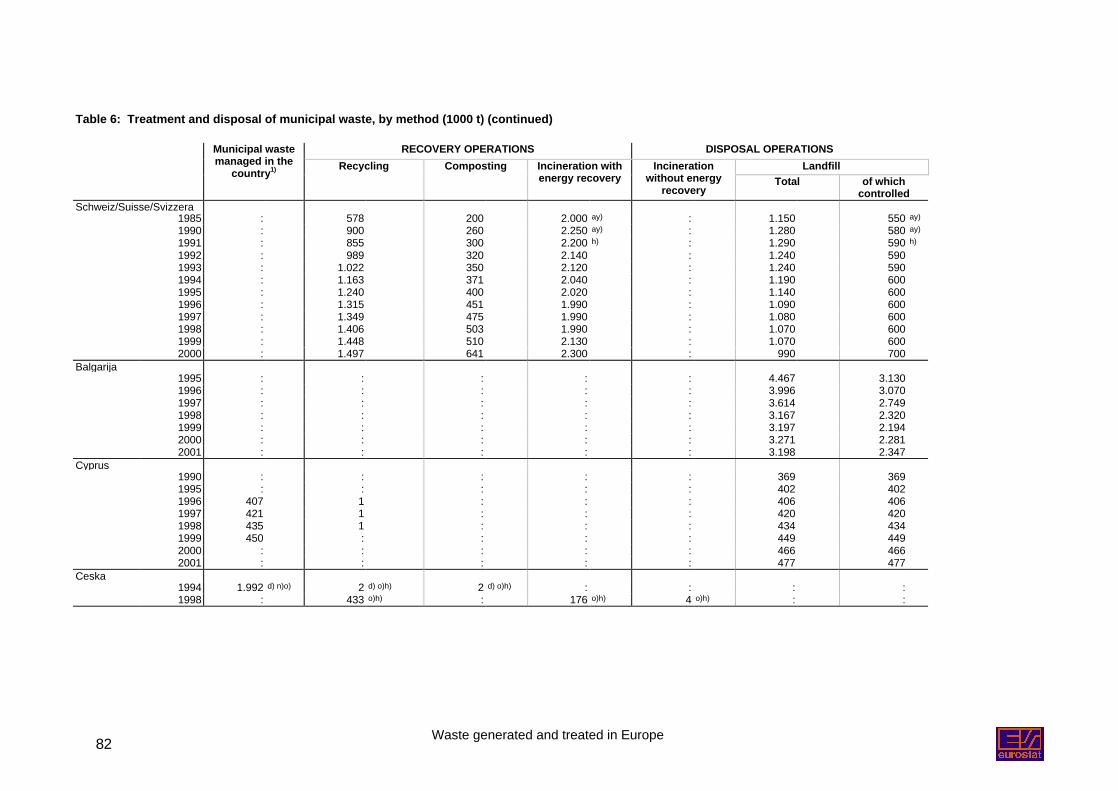
Waste generated and treated in Europe82
Table 6: Treatment and disposal of municipal waste, by method (1000 t) (continued)
RECOVERY OPERATIONS DISPOSAL OPERATIONSLandfill
Municipal wastemanaged in the
country1) Recycling Composting Incineration withenergy recovery
Incinerationwithout energy
recoveryTotal of which
controlledSchweiz/Suisse/Svizzera
1985 : 578 200 2.000 ay) : 1.150 550 ay)
1990 : 900 260 2.250 ay) : 1.280 580 ay)
1991 : 855 300 2.200 h) : 1.290 590 h)
1992 : 989 320 2.140 : 1.240 5901993 : 1.022 350 2.120 : 1.240 5901994 : 1.163 371 2.040 : 1.190 6001995 : 1.240 400 2.020 : 1.140 6001996 : 1.315 451 1.990 : 1.090 6001997 : 1.349 475 1.990 : 1.080 6001998 : 1.406 503 1.990 : 1.070 6001999 : 1.448 510 2.130 : 1.070 6002000 : 1.497 641 2.300 : 990 700
Balgarija1995 : : : : : 4.467 3.1301996 : : : : : 3.996 3.0701997 : : : : : 3.614 2.7491998 : : : : : 3.167 2.3201999 : : : : : 3.197 2.1942000 : : : : : 3.271 2.2812001 : : : : : 3.198 2.347
Cyprus1990 : : : : : 369 3691995 : : : : : 402 4021996 407 1 : : : 406 4061997 421 1 : : : 420 4201998 435 1 : : : 434 4341999 450 : : : : 449 4492000 : : : : : 466 4662001 : : : : : 477 477
Ceska1994 1.992 d) n)o) 2 d) o)h) 2 d) o)h) : : : :1998 : 433 o)h) : 176 o)h) 4 o)h) : :
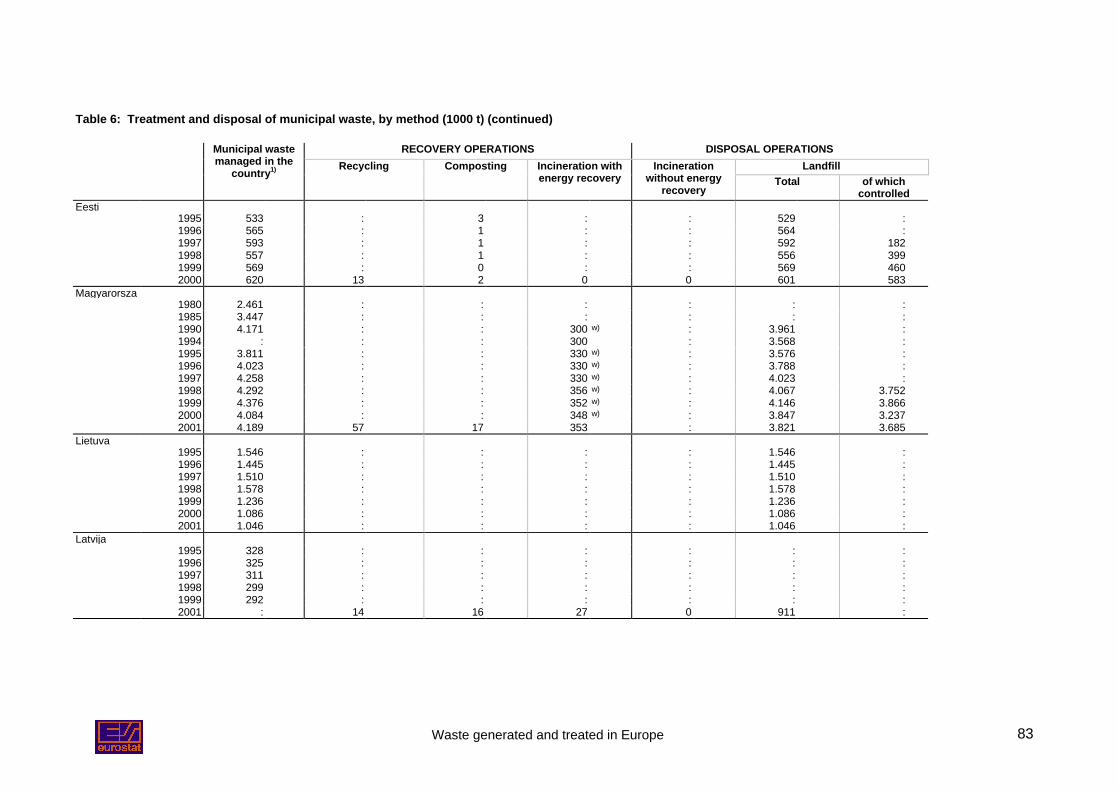
Waste generated and treated in Europe 83
Table 6: Treatment and disposal of municipal waste, by method (1000 t) (continued)
RECOVERY OPERATIONS DISPOSAL OPERATIONSLandfill
Municipal wastemanaged in the
country1) Recycling Composting Incineration withenergy recovery
Incinerationwithout energy
recoveryTotal of which
controlledEesti
1995 533 : 3 : : 529 :1996 565 : 1 : : 564 :1997 593 : 1 : : 592 1821998 557 : 1 : : 556 3991999 569 : 0 : : 569 4602000 620 13 2 0 0 601 583
Magyarorsza1980 2.461 : : : : : :1985 3.447 : : : : : :1990 4.171 : : 300 w) : 3.961 :1994 : : : 300 : 3.568 :1995 3.811 : : 330 w) : 3.576 :1996 4.023 : : 330 w) : 3.788 :1997 4.258 : : 330 w) : 4.023 :1998 4.292 : : 356 w) : 4.067 3.7521999 4.376 : : 352 w) : 4.146 3.8662000 4.084 : : 348 w) : 3.847 3.2372001 4.189 57 17 353 : 3.821 3.685
Lietuva1995 1.546 : : : : 1.546 :1996 1.445 : : : : 1.445 :1997 1.510 : : : : 1.510 :1998 1.578 : : : : 1.578 :1999 1.236 : : : : 1.236 :2000 1.086 : : : : 1.086 :2001 1.046 : : : : 1.046 :
Latvija1995 328 : : : : : :1996 325 : : : : : :1997 311 : : : : : :1998 299 : : : : : :1999 292 : : : : : :2001 : 14 16 27 0 911 :
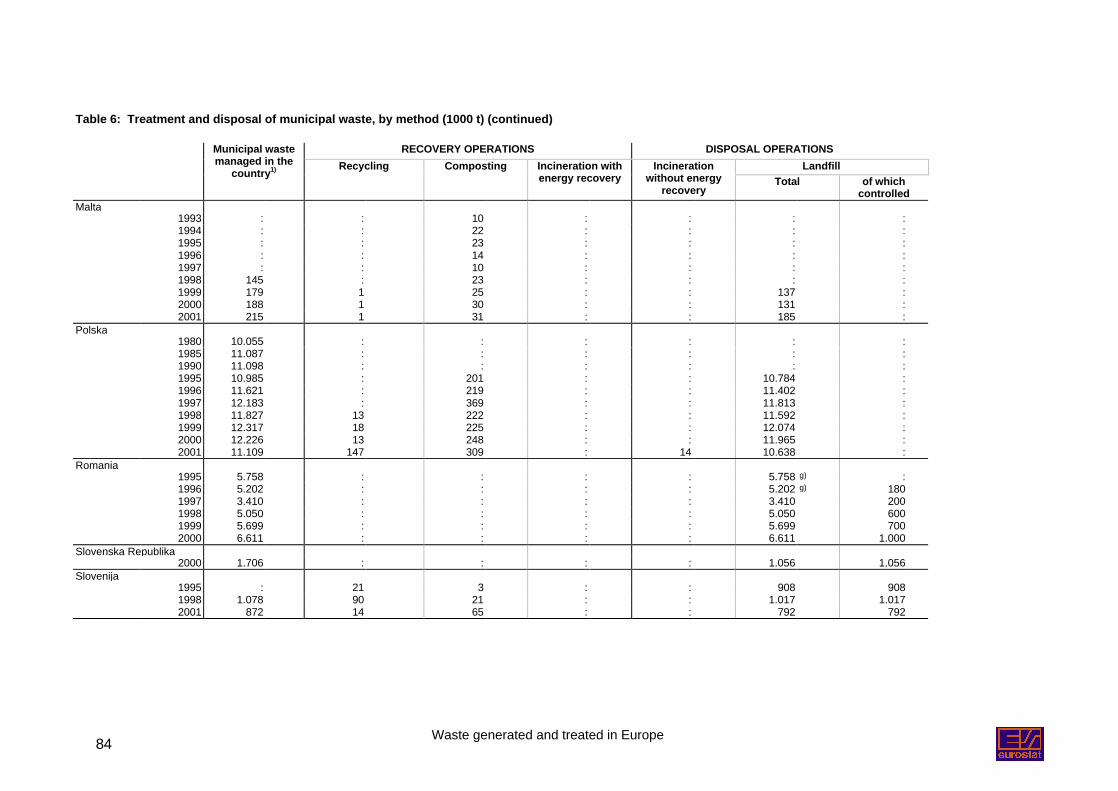
Waste generated and treated in Europe84
Table 6: Treatment and disposal of municipal waste, by method (1000 t) (continued)
RECOVERY OPERATIONS DISPOSAL OPERATIONSLandfill
Municipal wastemanaged in the
country1) Recycling Composting Incineration withenergy recovery
Incinerationwithout energy
recoveryTotal of which
controlledMalta
1993 : : 10 : : : :1994 : : 22 : : : :1995 : : 23 : : : :1996 : : 14 : : : :1997 : : 10 : : : :1998 145 : 23 : : : :1999 179 1 25 : : 137 :2000 188 1 30 : : 131 :2001 215 1 31 : : 185 :
Polska1980 10.055 : : : : : :1985 11.087 : : : : : :1990 11.098 : : : : : :1995 10.985 : 201 : : 10.784 :1996 11.621 : 219 : : 11.402 :1997 12.183 : 369 : : 11.813 :1998 11.827 13 222 : : 11.592 :1999 12.317 18 225 : : 12.074 :2000 12.226 13 248 : : 11.965 :2001 11.109 147 309 : 14 10.638 :
Romania1995 5.758 : : : : 5.758 g) :1996 5.202 : : : : 5.202 g) 1801997 3.410 : : : : 3.410 2001998 5.050 : : : : 5.050 6001999 5.699 : : : : 5.699 7002000 6.611 : : : : 6.611 1.000
Slovenska Republika2000 1.706 : : : : 1.056 1.056
Slovenija1995 : 21 3 : : 908 9081998 1.078 90 21 : : 1.017 1.0172001 872 14 65 : : 792 792
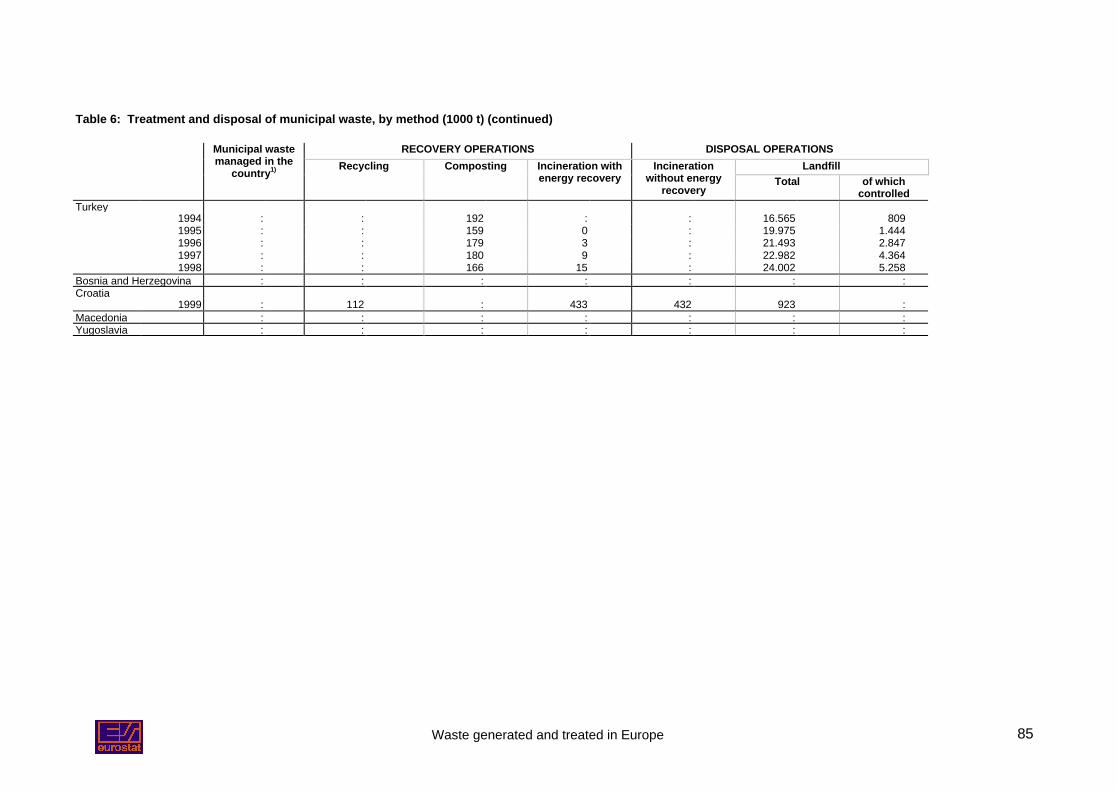
Waste generated and treated in Europe 85
Table 6: Treatment and disposal of municipal waste, by method (1000 t) (continued)
RECOVERY OPERATIONS DISPOSAL OPERATIONSLandfill
Municipal wastemanaged in the
country1) Recycling Composting Incineration withenergy recovery
Incinerationwithout energy
recoveryTotal of which
controlledTurkey
1994 : : 192 : : 16.565 8091995 : : 159 0 : 19.975 1.4441996 : : 179 3 : 21.493 2.8471997 : : 180 9 : 22.982 4.3641998 : : 166 15 : 24.002 5.258
Bosnia and Herzegovina : : : : : : :Croatia
1999 : 112 : 433 432 923 :Macedonia : : : : : : :Yugoslavia : : : : : : :
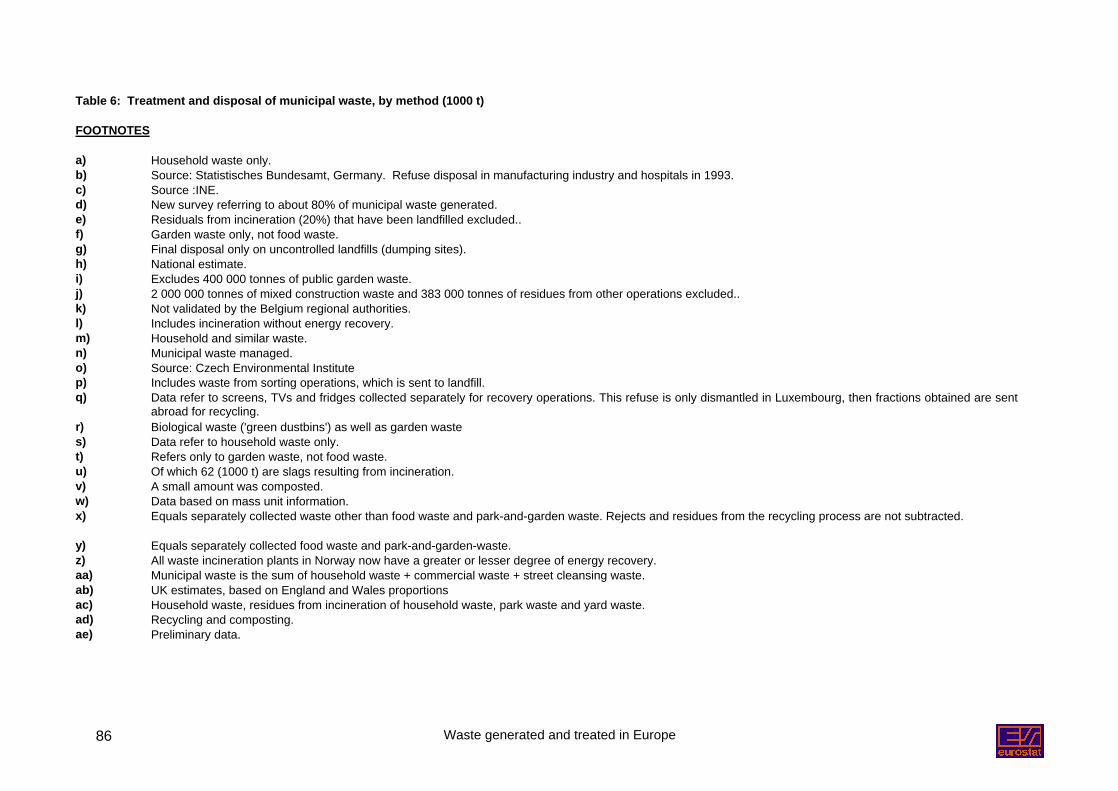
Waste generated and treated in Europe86
Table 6: Treatment and disposal of municipal waste, by method (1000 t)
FOOTNOTES
a) Household waste only.b) Source: Statistisches Bundesamt, Germany. Refuse disposal in manufacturing industry and hospitals in 1993.c) Source :INE.d) New survey referring to about 80% of municipal waste generated.e) Residuals from incineration (20%) that have been landfilled excluded..f) Garden waste only, not food waste.g) Final disposal only on uncontrolled landfills (dumping sites).h) National estimate.i) Excludes 400 000 tonnes of public garden waste.j) 2 000 000 tonnes of mixed construction waste and 383 000 tonnes of residues from other operations excluded..k) Not validated by the Belgium regional authorities.l) Includes incineration without energy recovery.m) Household and similar waste.n) Municipal waste managed.o) Source: Czech Environmental Institutep) Includes waste from sorting operations, which is sent to landfill.q) Data refer to screens, TVs and fridges collected separately for recovery operations. This refuse is only dismantled in Luxembourg, then fractions obtained are sent
abroad for recycling.r) Biological waste ('green dustbins') as well as garden wastes) Data refer to household waste only.t) Refers only to garden waste, not food waste.u) Of which 62 (1000 t) are slags resulting from incineration.v) A small amount was composted.w) Data based on mass unit information.x) Equals separately collected waste other than food waste and park-and-garden waste. Rejects and residues from the recycling process are not subtracted.
y) Equals separately collected food waste and park-and-garden-waste.z) All waste incineration plants in Norway now have a greater or lesser degree of energy recovery.aa) Municipal waste is the sum of household waste + commercial waste + street cleansing waste.ab) UK estimates, based on England and Wales proportionsac) Household waste, residues from incineration of household waste, park waste and yard waste.ad) Recycling and composting.ae) Preliminary data.
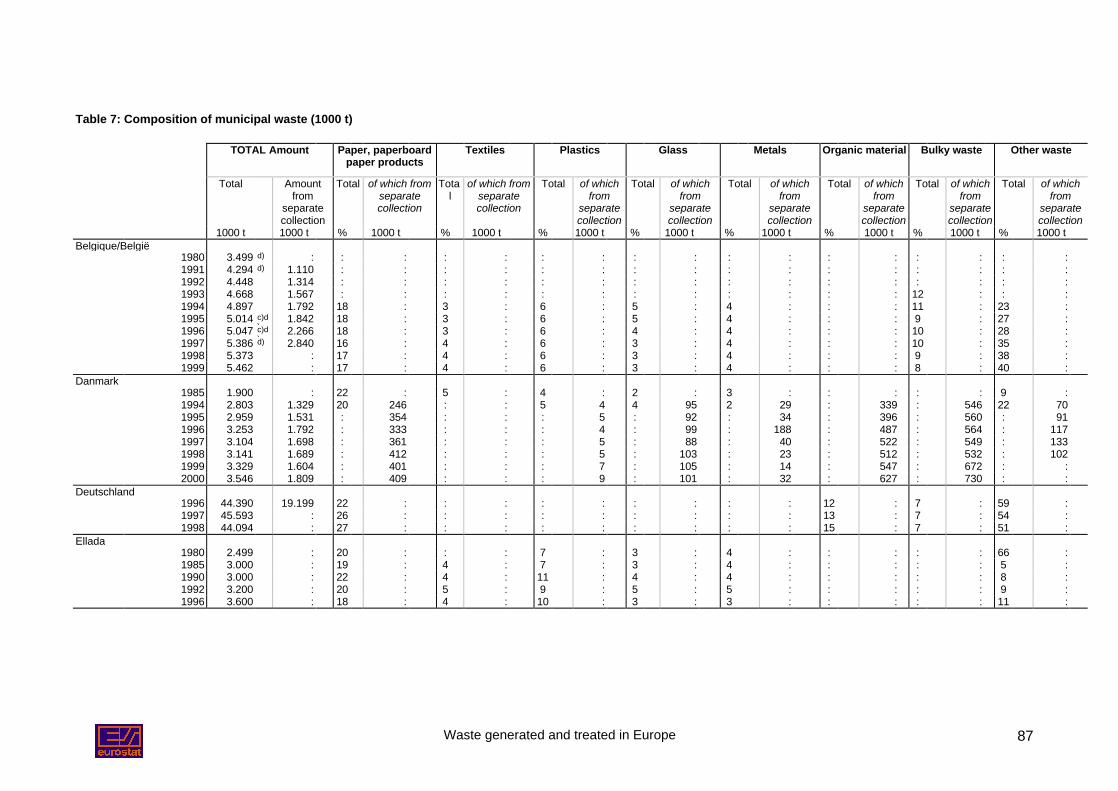
Waste generated and treated in Europe 87
Table 7: Composition of municipal waste (1000 t)
TOTAL Amount Paper, paperboardpaper products
Textiles Plastics Glass Metals Organic material Bulky waste Other waste
Total Amountfrom
separatecollection
Total of which fromseparatecollection
Total
of which fromseparatecollection
Total of whichfrom
separatecollection
Total of whichfrom
separatecollection
Total of whichfrom
separatecollection
Total of whichfrom
separatecollection
Total of whichfrom
separatecollection
Total of whichfrom
separatecollection
1000 t 1000 t % 1000 t % 1000 t % 1000 t % 1000 t % 1000 t % 1000 t % 1000 t % 1000 tBelgique/België
1980 3.499 d) : : : : : : : : : : : : : : : : :1991 4.294 d) 1.110 : : : : : : : : : : : : : : : :1992 4.448 1.314 : : : : : : : : : : : : : : : :1993 4.668 1.567 : : : : : : : : : : : : 12 : : :1994 4.897 1.792 18 : 3 : 6 : 5 : 4 : : : 11 : 23 :1995 5.014 c)d
)1.842 18 : 3 : 6 : 5 : 4 : : : 9 : 27 :
1996 5.047 c)d)
2.266 18 : 3 : 6 : 4 : 4 : : : 10 : 28 :1997 5.386 d) 2.840 16 : 4 : 6 : 3 : 4 : : : 10 : 35 :1998 5.373 : 17 : 4 : 6 : 3 : 4 : : : 9 : 38 :1999 5.462 : 17 : 4 : 6 : 3 : 4 : : : 8 : 40 :
Danmark1985 1.900 : 22 : 5 : 4 : 2 : 3 : : : : : 9 :1994 2.803 1.329 20 246 : : 5 4 4 95 2 29 : 339 : 546 22 701995 2.959 1.531 : 354 : : : 5 : 92 : 34 : 396 : 560 : 911996 3.253 1.792 : 333 : : : 4 : 99 : 188 : 487 : 564 : 1171997 3.104 1.698 : 361 : : : 5 : 88 : 40 : 522 : 549 : 1331998 3.141 1.689 : 412 : : : 5 : 103 : 23 : 512 : 532 : 1021999 3.329 1.604 : 401 : : : 7 : 105 : 14 : 547 : 672 : :2000 3.546 1.809 : 409 : : : 9 : 101 : 32 : 627 : 730 : :
Deutschland1996 44.390 19.199 22 : : : : : : : : : 12 : 7 : 59 :1997 45.593 : 26 : : : : : : : : : 13 : 7 : 54 :1998 44.094 : 27 : : : : : : : : : 15 : 7 : 51 :
Ellada1980 2.499 : 20 : : : 7 : 3 : 4 : : : : : 66 :1985 3.000 : 19 : 4 : 7 : 3 : 4 : : : : : 5 :1990 3.000 : 22 : 4 : 11 : 4 : 4 : : : : : 8 :1992 3.200 : 20 : 5 : 9 : 5 : 5 : : : : : 9 :1996 3.600 : 18 : 4 : 10 : 3 : 3 : : : : : 11 :
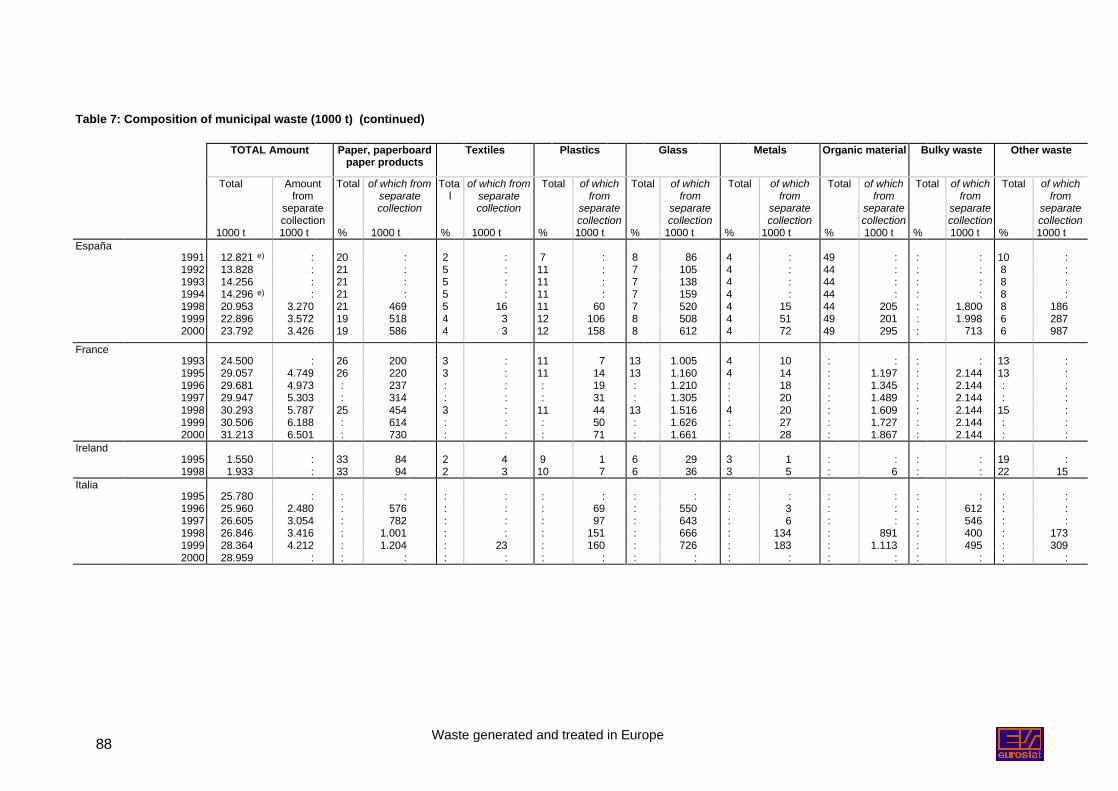
Waste generated and treated in Europe88
Table 7: Composition of municipal waste (1000 t) (continued)
TOTAL Amount Paper, paperboardpaper products
Textiles Plastics Glass Metals Organic material Bulky waste Other waste
Total Amountfrom
separatecollection
Total of which fromseparatecollection
Total
of which fromseparatecollection
Total of whichfrom
separatecollection
Total of whichfrom
separatecollection
Total of whichfrom
separatecollection
Total of whichfrom
separatecollection
Total of whichfrom
separatecollection
Total of whichfrom
separatecollection
1000 t 1000 t % 1000 t % 1000 t % 1000 t % 1000 t % 1000 t % 1000 t % 1000 t % 1000 tEspaña
1991 12.821 e) : 20 : 2 : 7 : 8 86 4 : 49 : : : 10 :1992 13.828 : 21 : 5 : 11 : 7 105 4 : 44 : : : 8 :1993 14.256 : 21 : 5 : 11 : 7 138 4 : 44 : : : 8 :1994 14.296 e) : 21 : 5 : 11 : 7 159 4 : 44 : : : 8 :1998 20.953 3.270 21 469 5 16 11 60 7 520 4 15 44 205 : 1.800 8 1861999 22.896 3.572 19 518 4 3 12 106 8 508 4 51 49 201 : 1.998 6 2872000 23.792 3.426 19 586 4 3 12 158 8 612 4 72 49 295 : 713 6 987
France1993 24.500 : 26 200 3 : 11 7 13 1.005 4 10 : : : : 13 :1995 29.057 4.749 26 220 3 : 11 14 13 1.160 4 14 : 1.197 : 2.144 13 :1996 29.681 4.973 : 237 : : : 19 : 1.210 : 18 : 1.345 : 2.144 : :1997 29.947 5.303 : 314 : : : 31 : 1.305 : 20 : 1.489 : 2.144 : :1998 30.293 5.787 25 454 3 : 11 44 13 1.516 4 20 : 1.609 : 2.144 15 :1999 30.506 6.188 : 614 : : : 50 : 1.626 : 27 : 1.727 : 2.144 : :2000 31.213 6.501 : 730 : : : 71 : 1.661 : 28 : 1.867 : 2.144 : :
Ireland1995 1.550 : 33 84 2 4 9 1 6 29 3 1 : : : : 19 :1998 1.933 : 33 94 2 3 10 7 6 36 3 5 : 6 : : 22 15
Italia1995 25.780 : : : : : : : : : : : : : : : : :1996 25.960 2.480 : 576 : : : 69 : 550 : 3 : : : 612 : :1997 26.605 3.054 : 782 : : : 97 : 643 : 6 : : : 546 : :1998 26.846 3.416 : 1.001 : : : 151 : 666 : 134 : 891 : 400 : 1731999 28.364 4.212 : 1.204 : 23 : 160 : 726 : 183 : 1.113 : 495 : 3092000 28.959 : : : : : : : : : : : : : : : : :
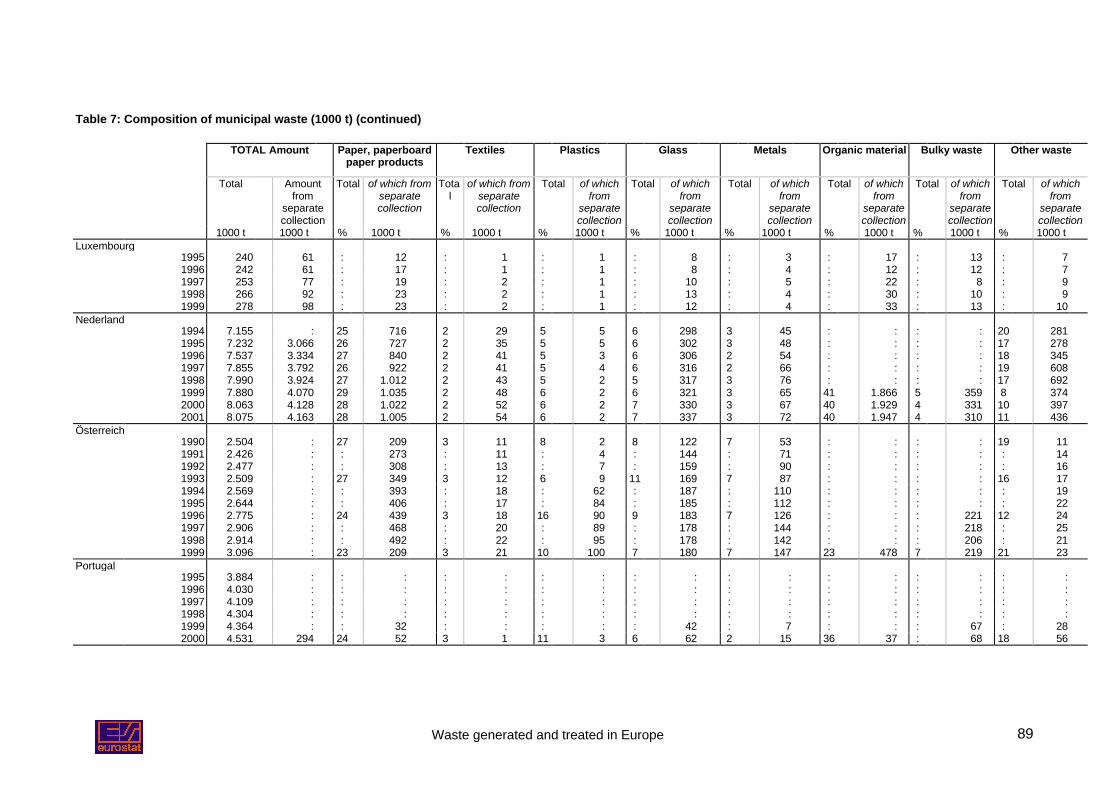
Waste generated and treated in Europe 89
Table 7: Composition of municipal waste (1000 t) (continued)
TOTAL Amount Paper, paperboardpaper products
Textiles Plastics Glass Metals Organic material Bulky waste Other waste
Total Amountfrom
separatecollection
Total of which fromseparatecollection
Total
of which fromseparatecollection
Total of whichfrom
separatecollection
Total of whichfrom
separatecollection
Total of whichfrom
separatecollection
Total of whichfrom
separatecollection
Total of whichfrom
separatecollection
Total of whichfrom
separatecollection
1000 t 1000 t % 1000 t % 1000 t % 1000 t % 1000 t % 1000 t % 1000 t % 1000 t % 1000 tLuxembourg
1995 240 61 : 12 : 1 : 1 : 8 : 3 : 17 : 13 : 71996 242 61 : 17 : 1 : 1 : 8 : 4 : 12 : 12 : 71997 253 77 : 19 : 2 : 1 : 10 : 5 : 22 : 8 : 91998 266 92 : 23 : 2 : 1 : 13 : 4 : 30 : 10 : 91999 278 98 : 23 : 2 : 1 : 12 : 4 : 33 : 13 : 10
Nederland1994 7.155 : 25 716 2 29 5 5 6 298 3 45 : : : : 20 2811995 7.232 3.066 26 727 2 35 5 5 6 302 3 48 : : : : 17 2781996 7.537 3.334 27 840 2 41 5 3 6 306 2 54 : : : : 18 3451997 7.855 3.792 26 922 2 41 5 4 6 316 2 66 : : : : 19 6081998 7.990 3.924 27 1.012 2 43 5 2 5 317 3 76 : : : : 17 6921999 7.880 4.070 29 1.035 2 48 6 2 6 321 3 65 41 1.866 5 359 8 3742000 8.063 4.128 28 1.022 2 52 6 2 7 330 3 67 40 1.929 4 331 10 3972001 8.075 4.163 28 1.005 2 54 6 2 7 337 3 72 40 1.947 4 310 11 436
Österreich1990 2.504 : 27 209 3 11 8 2 8 122 7 53 : : : : 19 111991 2.426 : : 273 : 11 : 4 : 144 : 71 : : : : : 141992 2.477 : : 308 : 13 : 7 : 159 : 90 : : : : : 161993 2.509 : 27 349 3 12 6 9 11 169 7 87 : : : : 16 171994 2.569 : : 393 : 18 : 62 : 187 : 110 : : : : : 191995 2.644 : : 406 : 17 : 84 : 185 : 112 : : : : : 221996 2.775 : 24 439 3 18 16 90 9 183 7 126 : : : 221 12 241997 2.906 : : 468 : 20 : 89 : 178 : 144 : : : 218 : 251998 2.914 : : 492 : 22 : 95 : 178 : 142 : : : 206 : 211999 3.096 : 23 209 3 21 10 100 7 180 7 147 23 478 7 219 21 23
Portugal1995 3.884 : : : : : : : : : : : : : : : : :1996 4.030 : : : : : : : : : : : : : : : : :1997 4.109 : : : : : : : : : : : : : : : : :1998 4.304 : : : : : : : : : : : : : : : : :1999 4.364 : : 32 : : : : : 42 : 7 : : : 67 : 282000 4.531 294 24 52 3 1 11 3 6 62 2 15 36 37 : 68 18 56
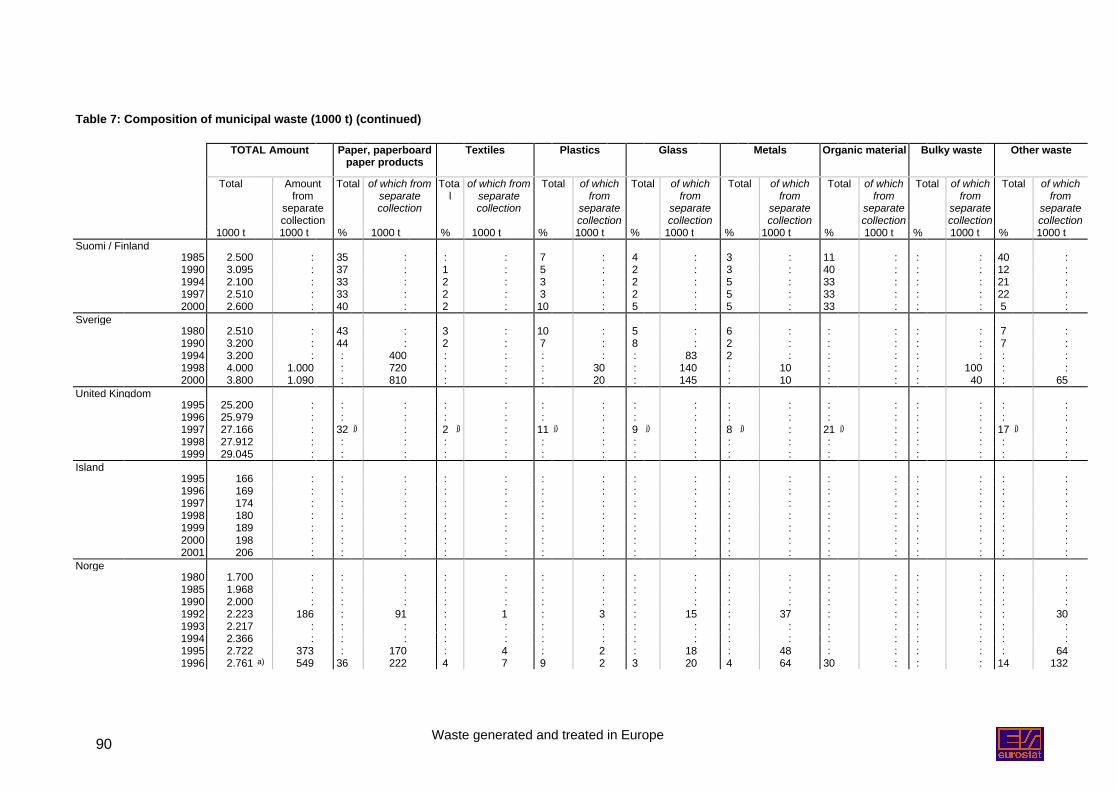
Waste generated and treated in Europe90
Table 7: Composition of municipal waste (1000 t) (continued)
TOTAL Amount Paper, paperboardpaper products
Textiles Plastics Glass Metals Organic material Bulky waste Other waste
Total Amountfrom
separatecollection
Total of which fromseparatecollection
Total
of which fromseparatecollection
Total of whichfrom
separatecollection
Total of whichfrom
separatecollection
Total of whichfrom
separatecollection
Total of whichfrom
separatecollection
Total of whichfrom
separatecollection
Total of whichfrom
separatecollection
1000 t 1000 t % 1000 t % 1000 t % 1000 t % 1000 t % 1000 t % 1000 t % 1000 t % 1000 tSuomi / Finland
1985 2.500 : 35 : : : 7 : 4 : 3 : 11 : : : 40 :1990 3.095 : 37 : 1 : 5 : 2 : 3 : 40 : : : 12 :1994 2.100 : 33 : 2 : 3 : 2 : 5 : 33 : : : 21 :1997 2.510 : 33 : 2 : 3 : 2 : 5 : 33 : : : 22 :2000 2.600 : 40 : 2 : 10 : 5 : 5 : 33 : : : 5 :
Sverige1980 2.510 : 43 : 3 : 10 : 5 : 6 : : : : : 7 :1990 3.200 : 44 : 2 : 7 : 8 : 2 : : : : : 7 :1994 3.200 : : 400 : : : : : 83 2 : : : : : : :1998 4.000 1.000 : 720 : : : 30 : 140 : 10 : : : 100 : :2000 3.800 1.090 : 810 : : : 20 : 145 : 10 : : : 40 : 65
United Kingdom1995 25.200 : : : : : : : : : : : : : : : : :1996 25.979 : : : : : : : : : : : : : : : : :1997 27.166 : 32 j) : 2 j) : 11 j) : 9 j) : 8 j) : 21 j) : : : 17 j) :1998 27.912 : : : : : : : : : : : : : : : : :1999 29.045 : : : : : : : : : : : : : : : : :
Island1995 166 : : : : : : : : : : : : : : : : :1996 169 : : : : : : : : : : : : : : : : :1997 174 : : : : : : : : : : : : : : : : :1998 180 : : : : : : : : : : : : : : : : :1999 189 : : : : : : : : : : : : : : : : :2000 198 : : : : : : : : : : : : : : : : :2001 206 : : : : : : : : : : : : : : : : :
Norge1980 1.700 : : : : : : : : : : : : : : : : :1985 1.968 : : : : : : : : : : : : : : : : :1990 2.000 : : : : : : : : : : : : : : : : :1992 2.223 186 : 91 : 1 : 3 : 15 : 37 : : : : : 301993 2.217 : : : : : : : : : : : : : : : : :1994 2.366 : : : : : : : : : : : : : : : : :1995 2.722 373 : 170 : 4 : 2 : 18 : 48 : : : : : 641996 2.761 a) 549 36 222 4 7 9 2 3 20 4 64 30 : : : 14 132
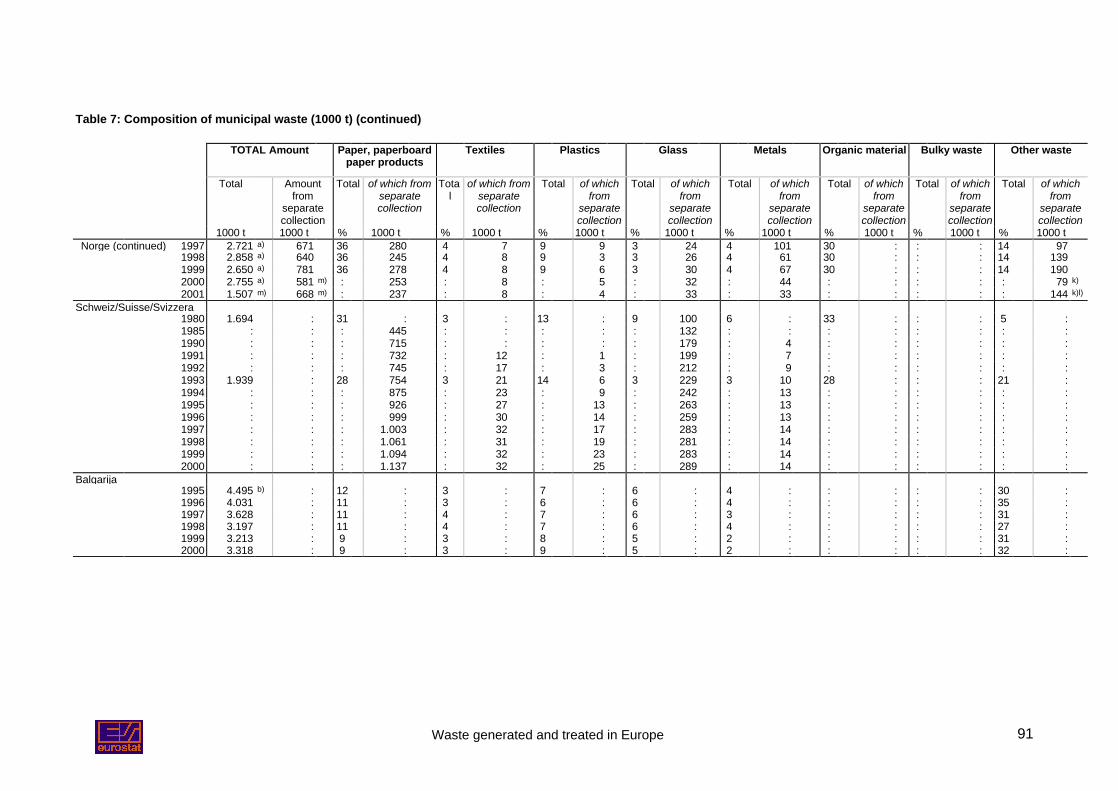
Waste generated and treated in Europe 91
Table 7: Composition of municipal waste (1000 t) (continued)
TOTAL Amount Paper, paperboardpaper products
Textiles Plastics Glass Metals Organic material Bulky waste Other waste
Total Amountfrom
separatecollection
Total of which fromseparatecollection
Total
of which fromseparatecollection
Total of whichfrom
separatecollection
Total of whichfrom
separatecollection
Total of whichfrom
separatecollection
Total of whichfrom
separatecollection
Total of whichfrom
separatecollection
Total of whichfrom
separatecollection
1000 t 1000 t % 1000 t % 1000 t % 1000 t % 1000 t % 1000 t % 1000 t % 1000 t % 1000 tNorge (continued) 1997 2.721 a) 671 36 280 4 7 9 9 3 24 4 101 30 : : : 14 97
1998 2.858 a) 640 36 245 4 8 9 3 3 26 4 61 30 : : : 14 1391999 2.650 a) 781 36 278 4 8 9 6 3 30 4 67 30 : : : 14 1902000 2.755 a) 581 m) : 253 : 8 : 5 : 32 : 44 : : : : : 79 k)
2001 1.507 m) 668 m) : 237 : 8 : 4 : 33 : 33 : : : : : 144 k)l)
Schweiz/Suisse/Svizzera1980 1.694 : 31 : 3 : 13 : 9 100 6 : 33 : : : 5 :1985 : : : 445 : : : : : 132 : : : : : : : :1990 : : : 715 : : : : : 179 : 4 : : : : : :1991 : : : 732 : 12 : 1 : 199 : 7 : : : : : :1992 : : : 745 : 17 : 3 : 212 : 9 : : : : : :1993 1.939 : 28 754 3 21 14 6 3 229 3 10 28 : : : 21 :1994 : : : 875 : 23 : 9 : 242 : 13 : : : : : :1995 : : : 926 : 27 : 13 : 263 : 13 : : : : : :1996 : : : 999 : 30 : 14 : 259 : 13 : : : : : :1997 : : : 1.003 : 32 : 17 : 283 : 14 : : : : : :1998 : : : 1.061 : 31 : 19 : 281 : 14 : : : : : :1999 : : : 1.094 : 32 : 23 : 283 : 14 : : : : : :2000 : : : 1.137 : 32 : 25 : 289 : 14 : : : : : :
Balgarija1995 4.495 b) : 12 : 3 : 7 : 6 : 4 : : : : : 30 :1996 4.031 : 11 : 3 : 6 : 6 : 4 : : : : : 35 :1997 3.628 : 11 : 4 : 7 : 6 : 3 : : : : : 31 :1998 3.197 : 11 : 4 : 7 : 6 : 4 : : : : : 27 :1999 3.213 : 9 : 3 : 8 : 5 : 2 : : : : : 31 :2000 3.318 : 9 : 3 : 9 : 5 : 2 : : : : : 32 :
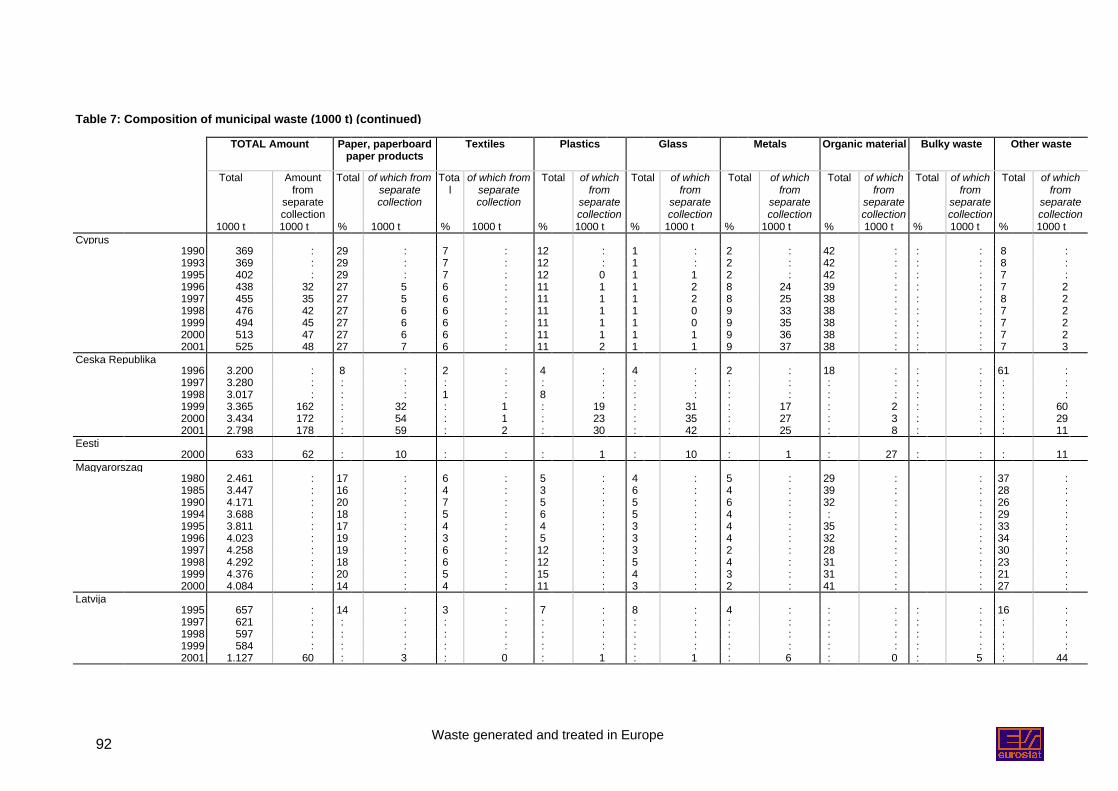
Waste generated and treated in Europe92
Table 7: Composition of municipal waste (1000 t) (continued)
TOTAL Amount Paper, paperboardpaper products
Textiles Plastics Glass Metals Organic material Bulky waste Other waste
Total Amountfrom
separatecollection
Total of which fromseparatecollection
Total
of which fromseparatecollection
Total of whichfrom
separatecollection
Total of whichfrom
separatecollection
Total of whichfrom
separatecollection
Total of whichfrom
separatecollection
Total of whichfrom
separatecollection
Total of whichfrom
separatecollection
1000 t 1000 t % 1000 t % 1000 t % 1000 t % 1000 t % 1000 t % 1000 t % 1000 t % 1000 tCyprus
1990 369 : 29 : 7 : 12 : 1 : 2 : 42 : : : 8 :1993 369 : 29 : 7 : 12 : 1 : 2 : 42 : : : 8 :1995 402 : 29 : 7 : 12 0 1 1 2 : 42 : : : 7 :1996 438 32 27 5 6 : 11 1 1 2 8 24 39 : : : 7 21997 455 35 27 5 6 : 11 1 1 2 8 25 38 : : : 8 21998 476 42 27 6 6 : 11 1 1 0 9 33 38 : : : 7 21999 494 45 27 6 6 : 11 1 1 0 9 35 38 : : : 7 22000 513 47 27 6 6 : 11 1 1 1 9 36 38 : : : 7 22001 525 48 27 7 6 : 11 2 1 1 9 37 38 : : : 7 3
Ceska Republika1996 3.200 : 8 : 2 : 4 : 4 : 2 : 18 : : : 61 :1997 3.280 : : : : : : : : : : : : : : : : :1998 3.017 : : : 1 : 8 : : : : : : : : : : :1999 3.365 162 : 32 : 1 : 19 : 31 : 17 : 2 : : : 602000 3.434 172 : 54 : 1 : 23 : 35 : 27 : 3 : : : 292001 2.798 178 : 59 : 2 : 30 : 42 : 25 : 8 : : : 11
Eesti2000 633 62 : 10 : : : 1 : 10 : 1 : 27 : : : 11
Magyarorszag1980 2.461 : 17 : 6 : 5 : 4 : 5 : 29 : : 37 :1985 3.447 : 16 : 4 : 3 : 6 : 4 : 39 : : 28 :1990 4.171 : 20 : 7 : 5 : 5 : 6 : 32 : : 26 :1994 3.688 : 18 : 5 : 6 : 5 : 4 : : : : 29 :1995 3.811 : 17 : 4 : 4 : 3 : 4 : 35 : : 33 :1996 4.023 : 19 : 3 : 5 : 3 : 4 : 32 : : 34 :1997 4.258 : 19 : 6 : 12 : 3 : 2 : 28 : : 30 :1998 4.292 : 18 : 6 : 12 : 5 : 4 : 31 : : 23 :1999 4.376 : 20 : 5 : 15 : 4 : 3 : 31 : : 21 :2000 4.084 : 14 : 4 : 11 : 3 : 2 : 41 : : 27 :
Latvija1995 657 : 14 : 3 : 7 : 8 : 4 : : : : : 16 :1997 621 : : : : : : : : : : : : : : : : :1998 597 : : : : : : : : : : : : : : : : :1999 584 : : : : : : : : : : : : : : : : :2001 1.127 60 : 3 : 0 : 1 : 1 : 6 : 0 : 5 : 44
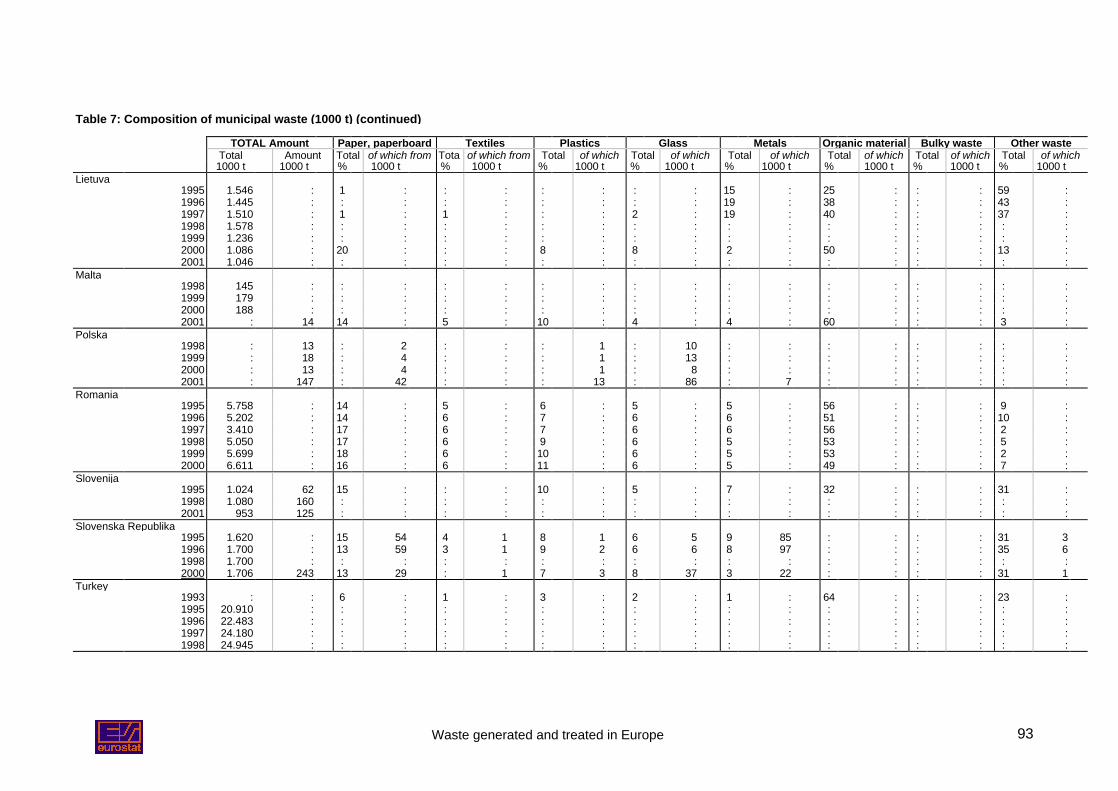
Waste generated and treated in Europe 93
Table 7: Composition of municipal waste (1000 t) (continued)
TOTAL Amount Paper, paperboard Textiles Plastics Glass Metals Organic material Bulky waste Other wasteTotal Amount Total of which from Tota of which from Total of which Total of which Total of which Total of which Total of which Total of which1000 t 1000 t % 1000 t % 1000 t % 1000 t % 1000 t % 1000 t % 1000 t % 1000 t % 1000 t
Lietuva1995 1.546 : 1 : : : : : : : 15 : 25 : : : 59 :1996 1.445 : : : : : : : : : 19 : 38 : : : 43 :1997 1.510 : 1 : 1 : : : 2 : 19 : 40 : : : 37 :1998 1.578 : : : : : : : : : : : : : : : : :1999 1.236 : : : : : : : : : : : : : : : : :2000 1.086 : 20 : : : 8 : 8 : 2 : 50 : : : 13 :2001 1.046 : : : : : : : : : : : : : : : : :
Malta1998 145 : : : : : : : : : : : : : : : : :1999 179 : : : : : : : : : : : : : : : : :2000 188 : : : : : : : : : : : : : : : : :2001 : 14 14 : 5 : 10 : 4 : 4 : 60 : : : 3 :
Polska1998 : 13 : 2 : : : 1 : 10 : : : : : : : :1999 : 18 : 4 : : : 1 : 13 : : : : : : : :2000 : 13 : 4 : : : 1 : 8 : : : : : : : :2001 : 147 : 42 : : : 13 : 86 : 7 : : : : : :
Romania1995 5.758 : 14 : 5 : 6 : 5 : 5 : 56 : : : 9 :1996 5.202 : 14 : 6 : 7 : 6 : 6 : 51 : : : 10 :1997 3.410 : 17 : 6 : 7 : 6 : 6 : 56 : : : 2 :1998 5.050 : 17 : 6 : 9 : 6 : 5 : 53 : : : 5 :1999 5.699 : 18 : 6 : 10 : 6 : 5 : 53 : : : 2 :2000 6.611 : 16 : 6 : 11 : 6 : 5 : 49 : : : 7 :
Slovenija1995 1.024 62 15 : : : 10 : 5 : 7 : 32 : : : 31 :1998 1.080 160 : : : : : : : : : : : : : : : :2001 953 125 : : : : : : : : : : : : : : : :
Slovenska Republika1995 1.620 : 15 54 4 1 8 1 6 5 9 85 : : : : 31 31996 1.700 : 13 59 3 1 9 2 6 6 8 97 : : : : 35 61998 1.700 : : : : : : : : : : : : : : : : :2000 1.706 243 13 29 : 1 7 3 8 37 3 22 : : : : 31 1
Turkey1993 : : 6 : 1 : 3 : 2 : 1 : 64 : : : 23 :1995 20.910 : : : : : : : : : : : : : : : : :1996 22.483 : : : : : : : : : : : : : : : : :1997 24.180 : : : : : : : : : : : : : : : : :1998 24.945 : : : : : : : : : : : : : : : : :
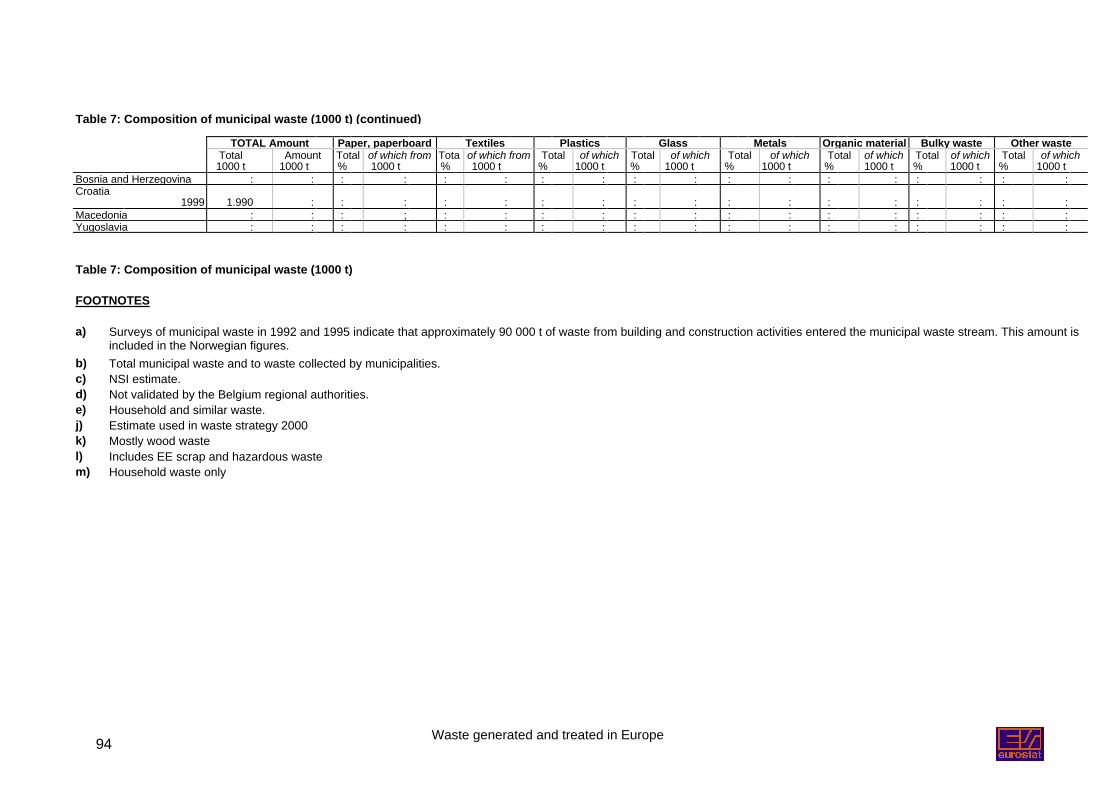
Waste generated and treated in Europe94
Table 7: Composition of municipal waste (1000 t) (continued)
TOTAL Amount Paper, paperboard Textiles Plastics Glass Metals Organic material Bulky waste Other wasteTotal Amount Total of which from Tota of which from Total of which Total of which Total of which Total of which Total of which Total of which1000 t 1000 t % 1000 t % 1000 t % 1000 t % 1000 t % 1000 t % 1000 t % 1000 t % 1000 t
Bosnia and Herzegovina : : : : : : : : : : : : : : : : : :Croatia
1999 1.990 : : : : : : : : : : : : : : : : :Macedonia : : : ; : : : : : : : : : : : : : :Yugoslavia : : : : : : : : : : : : : : : : : :
Table 7: Composition of municipal waste (1000 t)
FOOTNOTES
a) Surveys of municipal waste in 1992 and 1995 indicate that approximately 90 000 t of waste from building and construction activities entered the municipal waste stream. This amount isincluded in the Norwegian figures.
b) Total municipal waste and to waste collected by municipalities.c) NSI estimate.d) Not validated by the Belgium regional authorities.e) Household and similar waste.j) Estimate used in waste strategy 2000k) Mostly wood wastel) Includes EE scrap and hazardous wastem) Household waste only
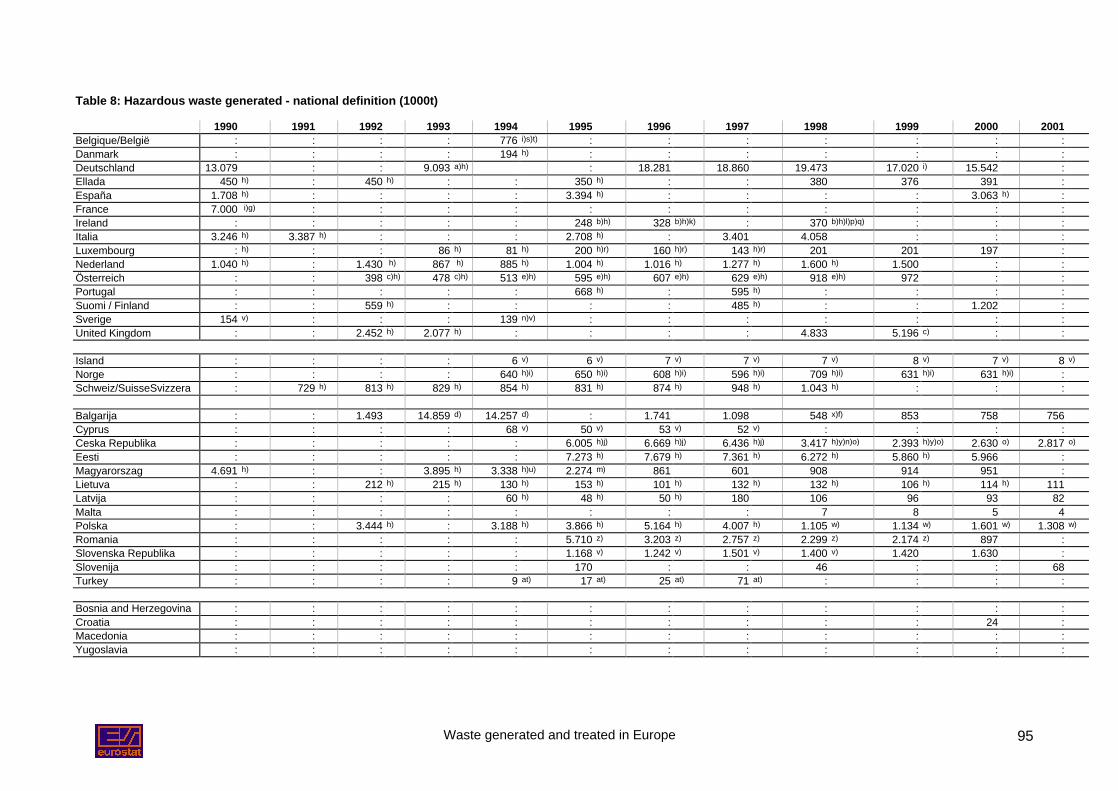
Waste generated and treated in Europe 95
Table 8: Hazardous waste generated - national definition (1000t)
1990 1991 1992 1993 1994 1995 1996 1997 1998 1999 2000 2001Belgique/België : : : : 776 i)s)t) : : : : : : :Danmark : : : : 194 h) : : : : : : :Deutschland 13.079 : : 9.093 a)h) : 18.281 18.860 19.473 17.020 i) 15.542 :Ellada 450 h) : 450 h) : : 350 h) : : 380 376 391 :España 1.708 h) : : : : 3.394 h) : : : : 3.063 h) :France 7.000 i)g) : : : : : : : : : : :Ireland : : : : : 248 b)h) 328 b)h)k) : 370 b)h)l)p)q) : : :Italia 3.246 h) 3.387 h) : : : 2.708 h) : 3.401 4.058 : : :Luxembourg : h) : : 86 h) 81 h) 200 h)r) 160 h)r) 143 h)r) 201 201 197 :Nederland 1.040 h) : 1.430 h) 867 h) 885 h) 1.004 h) 1.016 h) 1.277 h) 1.600 h) 1.500 : :Österreich : : 398 c)h) 478 c)h) 513 e)h) 595 e)h) 607 e)h) 629 e)h) 918 e)h) 972 : :Portugal : : : : : 668 h) : 595 h) : : : :Suomi / Finland : : 559 h) : : : : 485 h) : : 1.202 :Sverige 154 v) : : : 139 n)v) : : : : : : :United Kingdom : : 2.452 h) 2.077 h) : : : : 4.833 5.196 c) : :
Island : : : : 6 v) 6 v) 7 v) 7 v) 7 v) 8 v) 7 v) 8 v)
Norge : : : : 640 h)i) 650 h)i) 608 h)i) 596 h)i) 709 h)i) 631 h)i) 631 h)i) :Schweiz/SuisseSvizzera : 729 h) 813 h) 829 h) 854 h) 831 h) 874 h) 948 h) 1.043 h) : : :
Balgarija : : 1.493 14.859 d) 14.257 d) : 1.741 1.098 548 x)f) 853 758 756Cyprus : : : : 68 v) 50 v) 53 v) 52 v) : : : :Ceska Republika : : : : : 6.005 h)j) 6.669 h)j) 6.436 h)j) 3.417 h)y)n)o) 2.393 h)y)o) 2.630 o) 2.817 o)
Eesti : : : : : 7.273 h) 7.679 h) 7.361 h) 6.272 h) 5.860 h) 5.966 :Magyarorszag 4.691 h) : : 3.895 h) 3.338 h)u) 2.274 m) 861 601 908 914 951 :Lietuva : : 212 h) 215 h) 130 h) 153 h) 101 h) 132 h) 132 h) 106 h) 114 h) 111Latvija : : : : 60 h) 48 h) 50 h) 180 106 96 93 82Malta : : : : : : : : 7 8 5 4Polska : : 3.444 h) : 3.188 h) 3.866 h) 5.164 h) 4.007 h) 1.105 w) 1.134 w) 1.601 w) 1.308 w)
Romania : : : : : 5.710 z) 3.203 z) 2.757 z) 2.299 z) 2.174 z) 897 :Slovenska Republika : : : : : 1.168 v) 1.242 v) 1.501 v) 1.400 v) 1.420 1.630 :Slovenija : : : : : 170 : : 46 : : 68Turkey : : : : 9 at) 17 at) 25 at) 71 at) : : : :
Bosnia and Herzegovina : : : : : : : : : : : :Croatia : : : : : : : : : : 24 :Macedonia : : : : : : : : : : : :Yugoslavia : : : : : : : : : : : :
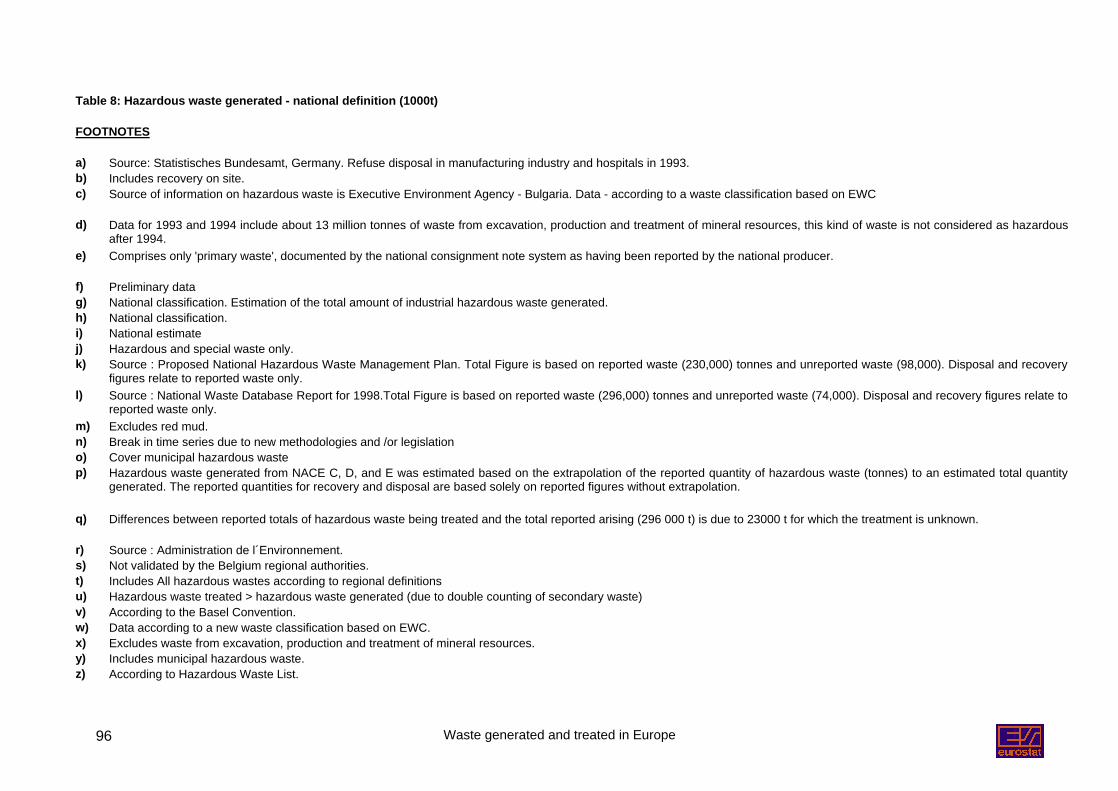
Waste generated and treated in Europe96
Table 8: Hazardous waste generated - national definition (1000t)
FOOTNOTES
a) Source: Statistisches Bundesamt, Germany. Refuse disposal in manufacturing industry and hospitals in 1993.b) Includes recovery on site.c) Source of information on hazardous waste is Executive Environment Agency - Bulgaria. Data - according to a waste classification based on EWC
d) Data for 1993 and 1994 include about 13 million tonnes of waste from excavation, production and treatment of mineral resources, this kind of waste is not considered as hazardousafter 1994.
e) Comprises only 'primary waste', documented by the national consignment note system as having been reported by the national producer.
f) Preliminary datag) National classification. Estimation of the total amount of industrial hazardous waste generated.h) National classification.i) National estimatej) Hazardous and special waste only.k) Source : Proposed National Hazardous Waste Management Plan. Total Figure is based on reported waste (230,000) tonnes and unreported waste (98,000). Disposal and recovery
figures relate to reported waste only.l) Source : National Waste Database Report for 1998.Total Figure is based on reported waste (296,000) tonnes and unreported waste (74,000). Disposal and recovery figures relate to
reported waste only.m) Excludes red mud.n) Break in time series due to new methodologies and /or legislationo) Cover municipal hazardous wastep) Hazardous waste generated from NACE C, D, and E was estimated based on the extrapolation of the reported quantity of hazardous waste (tonnes) to an estimated total quantity
generated. The reported quantities for recovery and disposal are based solely on reported figures without extrapolation.
q) Differences between reported totals of hazardous waste being treated and the total reported arising (296 000 t) is due to 23000 t for which the treatment is unknown.
r) Source : Administration de l´Environnement.s) Not validated by the Belgium regional authorities.t) Includes All hazardous wastes according to regional definitionsu) Hazardous waste treated > hazardous waste generated (due to double counting of secondary waste)v) According to the Basel Convention.w) Data according to a new waste classification based on EWC.x) Excludes waste from excavation, production and treatment of mineral resources.y) Includes municipal hazardous waste.z) According to Hazardous Waste List.
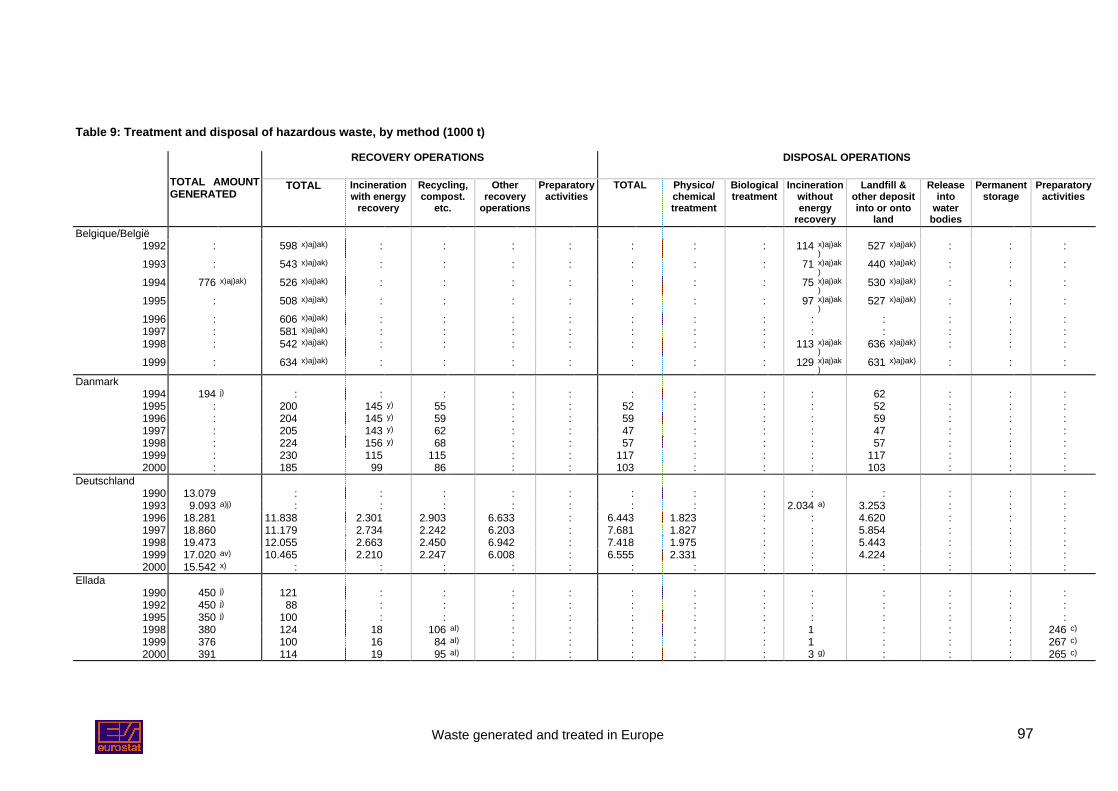
Waste generated and treated in Europe 97
Table 9: Treatment and disposal of hazardous waste, by method (1000 t)
RECOVERY OPERATIONS DISPOSAL OPERATIONS
TOTAL AMOUNTGENERATED
TOTAL Incinerationwith energy
recovery
Recycling,compost.
etc.
Otherrecovery
operations
Preparatoryactivities
TOTAL Physico/chemicaltreatment
Biologicaltreatment
Incinerationwithoutenergy
recovery
Landfill &other depositinto or onto
land
Releaseinto
waterbodies
Permanentstorage
Preparatoryactivities
Belgique/België1992 : 598 x)aj)ak) : : : : : : : 114 x)aj)ak
)527 x)aj)ak) : : :
1993 : 543 x)aj)ak) : : : : : : : 71 x)aj)ak)
440 x)aj)ak) : : :
1994 776 x)aj)ak) 526 x)aj)ak) : : : : : : : 75 x)aj)ak)
530 x)aj)ak) : : :
1995 : 508 x)aj)ak) : : : : : : : 97 x)aj)ak)
527 x)aj)ak) : : :
1996 : 606 x)aj)ak) : : : : : : : : : : : :1997 : 581 x)aj)ak) : : : : : : : : : : : :1998 : 542 x)aj)ak) : : : : : : : 113 x)aj)ak
)636 x)aj)ak) : : :
1999 : 634 x)aj)ak) : : : : : : : 129 x)aj)ak)
631 x)aj)ak) : : :
Danmark1994 194 j) : : : : : : : : : 62 : : :1995 : 200 145 y) 55 : : 52 : : : 52 : : :1996 : 204 145 y) 59 : : 59 : : : 59 : : :1997 : 205 143 y) 62 : : 47 : : : 47 : : :1998 : 224 156 y) 68 : : 57 : : : 57 : : :1999 : 230 115 115 : : 117 : : : 117 : : :2000 : 185 99 86 : : 103 : : : 103 : : :
Deutschland1990 13.079 : : : : : : : : : : : : :1993 9.093 a)j) : : : : : : : : 2.034 a) 3.253 : : :1996 18.281 11.838 2.301 2.903 6.633 : 6.443 1.823 : : 4.620 : : :1997 18.860 11.179 2.734 2.242 6.203 : 7.681 1.827 : : 5.854 : : :1998 19.473 12.055 2.663 2.450 6.942 : 7.418 1.975 : : 5.443 : : :1999 17.020 av) 10.465 2.210 2.247 6.008 : 6.555 2.331 : : 4.224 : : :2000 15.542 x) : : : : : : : : : : : : :
Ellada1990 450 j) 121 : : : : : : : : : : : :1992 450 j) 88 : : : : : : : : : : : :1995 350 j) 100 : : : : : : : : : : : :1998 380 124 18 106 al) : : : : : 1 : : : 246 c)
1999 376 100 16 84 al) : : : : : 1 : : : 267 c)
2000 391 114 19 95 al) : : : : : 3 g) : : : 265 c)
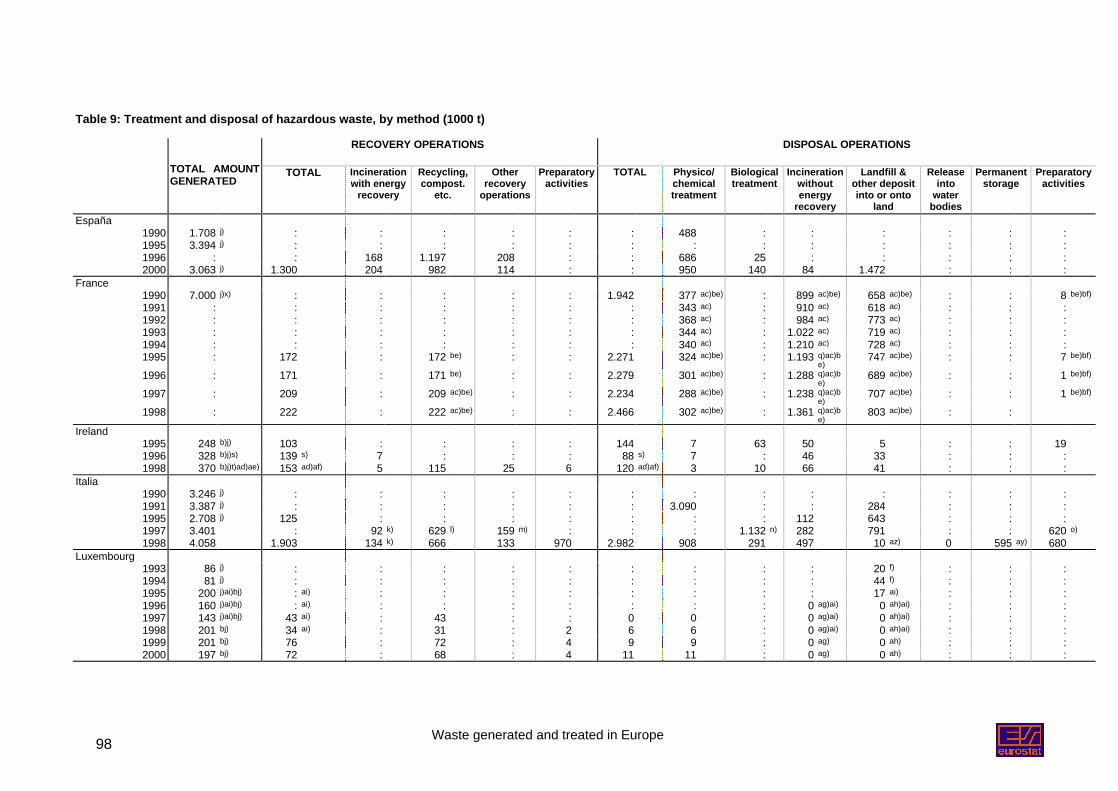
Waste generated and treated in Europe98
Table 9: Treatment and disposal of hazardous waste, by method (1000 t)
RECOVERY OPERATIONS DISPOSAL OPERATIONS
TOTAL AMOUNTGENERATED
TOTAL Incinerationwith energy
recovery
Recycling,compost.
etc.
Otherrecovery
operations
Preparatoryactivities
TOTAL Physico/chemicaltreatment
Biologicaltreatment
Incinerationwithoutenergy
recovery
Landfill &other depositinto or onto
land
Releaseinto
waterbodies
Permanentstorage
Preparatoryactivities
España1990 1.708 j) : : : : : : 488 : : : : : :1995 3.394 j) : : : : : : : : : : : : :1996 : : 168 1.197 208 : : 686 25 : : : : :2000 3.063 j) 1.300 204 982 114 : : 950 140 84 1.472 : : :
France1990 7.000 j)x) : : : : : 1.942 377 ac)be) : 899 ac)be) 658 ac)be) : : 8 be)bf)
1991 : : : : : : : 343 ac) : 910 ac) 618 ac) : : :1992 : : : : : : : 368 ac) : 984 ac) 773 ac) : : :1993 : : : : : : : 344 ac) : 1.022 ac) 719 ac) : : :1994 : : : : : : : 340 ac) : 1.210 ac) 728 ac) : : :1995 : 172 : 172 be) : : 2.271 324 ac)be) : 1.193 q)ac)b
e)747 ac)be) : : 7 be)bf)
1996 : 171 : 171 be) : : 2.279 301 ac)be) : 1.288 q)ac)be)
689 ac)be) : : 1 be)bf)
1997 : 209 : 209 ac)be) : : 2.234 288 ac)be) : 1.238 q)ac)be)
707 ac)be) : : 1 be)bf)
1998 : 222 : 222 ac)be) : : 2.466 302 ac)be) : 1.361 q)ac)be)
803 ac)be) : :
Ireland1995 248 b)j) 103 : : : : 144 7 63 50 5 : : 191996 328 b)j)s) 139 s) 7 : : : 88 s) 7 : 46 33 : : :1998 370 b)j)t)ad)ae) 153 ad)af) 5 115 25 6 120 ad)af) 3 10 66 41 : : :
Italia1990 3.246 j) : : : : : : : : : : : : :1991 3.387 j) : : : : : : 3.090 : : 284 : : :1995 2.708 j) 125 : : : : : : : 112 643 : : :1997 3.401 : 92 k) 629 l) 159 m) : : : 1.132 n) 282 791 : : 620 o)
1998 4.058 1.903 134 k) 666 133 970 2.982 908 291 497 10 az) 0 595 ay) 680Luxembourg
1993 86 j) : : : : : : : : : 20 f) : : :1994 81 j) : : : : : : : : : 44 f) : : :1995 200 j)ai)bj) : ai) : : : : : : : : 17 ai) : : :1996 160 j)ai)bj) : ai) : : : : : : : 0 ag)ai) 0 ah)ai) : : :1997 143 j)ai)bj) 43 ai) : 43 : : 0 0 : 0 ag)ai) 0 ah)ai) : : :1998 201 bj) 34 ai) : 31 : 2 6 6 : 0 ag)ai) 0 ah)ai) : : :1999 201 bj) 76 : 72 : 4 9 9 : 0 ag) 0 ah) : : :2000 197 bj) 72 : 68 : 4 11 11 : 0 ag) 0 ah) : : :
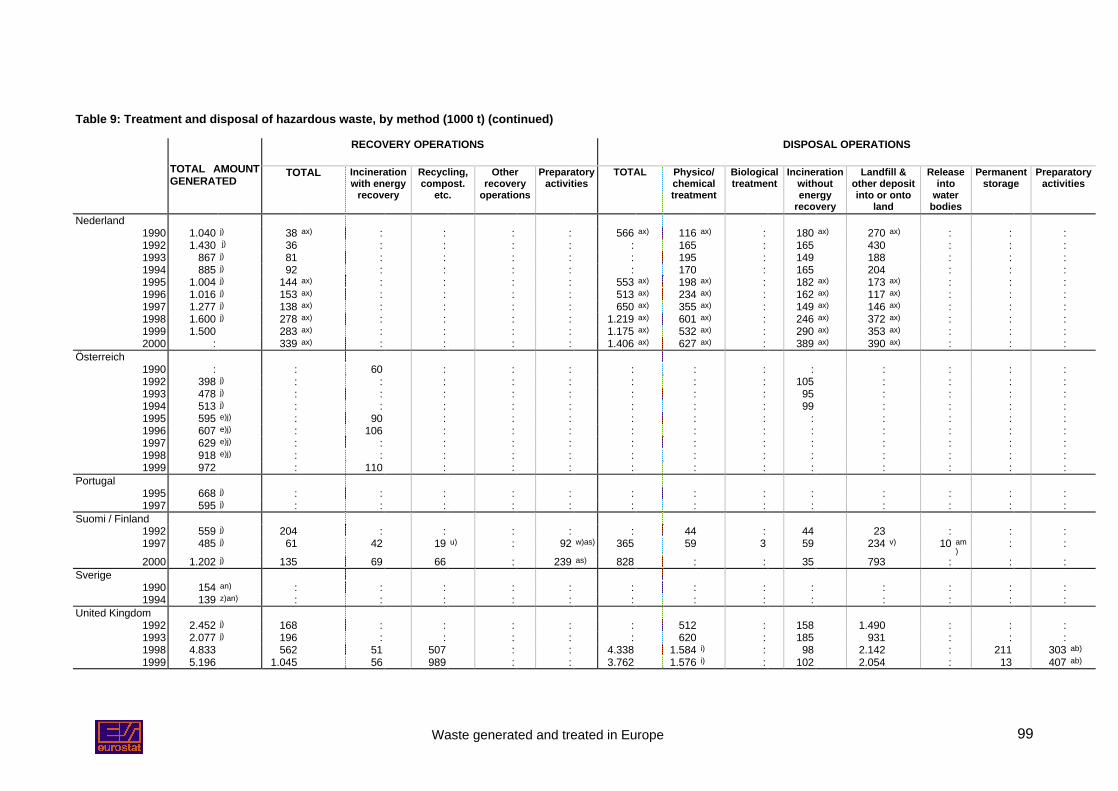
Waste generated and treated in Europe 99
Table 9: Treatment and disposal of hazardous waste, by method (1000 t) (continued)
RECOVERY OPERATIONS DISPOSAL OPERATIONS
TOTAL AMOUNTGENERATED
TOTAL Incinerationwith energy
recovery
Recycling,compost.
etc.
Otherrecovery
operations
Preparatoryactivities
TOTAL Physico/chemicaltreatment
Biologicaltreatment
Incinerationwithoutenergy
recovery
Landfill &other depositinto or onto
land
Releaseinto
waterbodies
Permanentstorage
Preparatoryactivities
Nederland1990 1.040 j) 38 ax) : : : : 566 ax) 116 ax) : 180 ax) 270 ax) : : :1992 1.430 j) 36 : : : : : 165 : 165 430 : : :1993 867 j) 81 : : : : : 195 : 149 188 : : :1994 885 j) 92 : : : : : 170 : 165 204 : : :1995 1.004 j) 144 ax) : : : : 553 ax) 198 ax) : 182 ax) 173 ax) : : :1996 1.016 j) 153 ax) : : : : 513 ax) 234 ax) : 162 ax) 117 ax) : : :1997 1.277 j) 138 ax) : : : : 650 ax) 355 ax) : 149 ax) 146 ax) : : :1998 1.600 j) 278 ax) : : : : 1.219 ax) 601 ax) : 246 ax) 372 ax) : : :1999 1.500 283 ax) : : : : 1.175 ax) 532 ax) : 290 ax) 353 ax) : : :2000 : 339 ax) : : : : 1.406 ax) 627 ax) : 389 ax) 390 ax) : : :
Österreich1990 : : 60 : : : : : : : : : : :1992 398 j) : : : : : : : : 105 : : : :1993 478 j) : : : : : : : : 95 : : : :1994 513 j) : : : : : : : : 99 : : : :1995 595 e)j) : 90 : : : : : : : : : : :1996 607 e)j) : 106 : : : : : : : : : : :1997 629 e)j) : : : : : : : : : : : : :1998 918 e)j) : : : : : : : : : : : : :1999 972 : 110 : : : : : : : : : : :
Portugal1995 668 j) : : : : : : : : : : : : :1997 595 j) : : : : : : : : : : : : :
Suomi / Finland1992 559 j) 204 : : : : : 44 : 44 23 : : :1997 485 j) 61 42 19 u) : 92 w)as) 365 59 3 59 234 v) 10 am
): :
2000 1.202 j) 135 69 66 : 239 as) 828 : : 35 793 : : :Sverige
1990 154 an) : : : : : : : : : : : : :1994 139 z)an) : : : : : : : : : : : : :
United Kingdom1992 2.452 j) 168 : : : : : 512 : 158 1.490 : : :1993 2.077 j) 196 : : : : : 620 : 185 931 : : :1998 4.833 562 51 507 : : 4.338 1.584 i) : 98 2.142 : 211 303 ab)
1999 5.196 1.045 56 989 : : 3.762 1.576 i) : 102 2.054 : 13 407 ab)
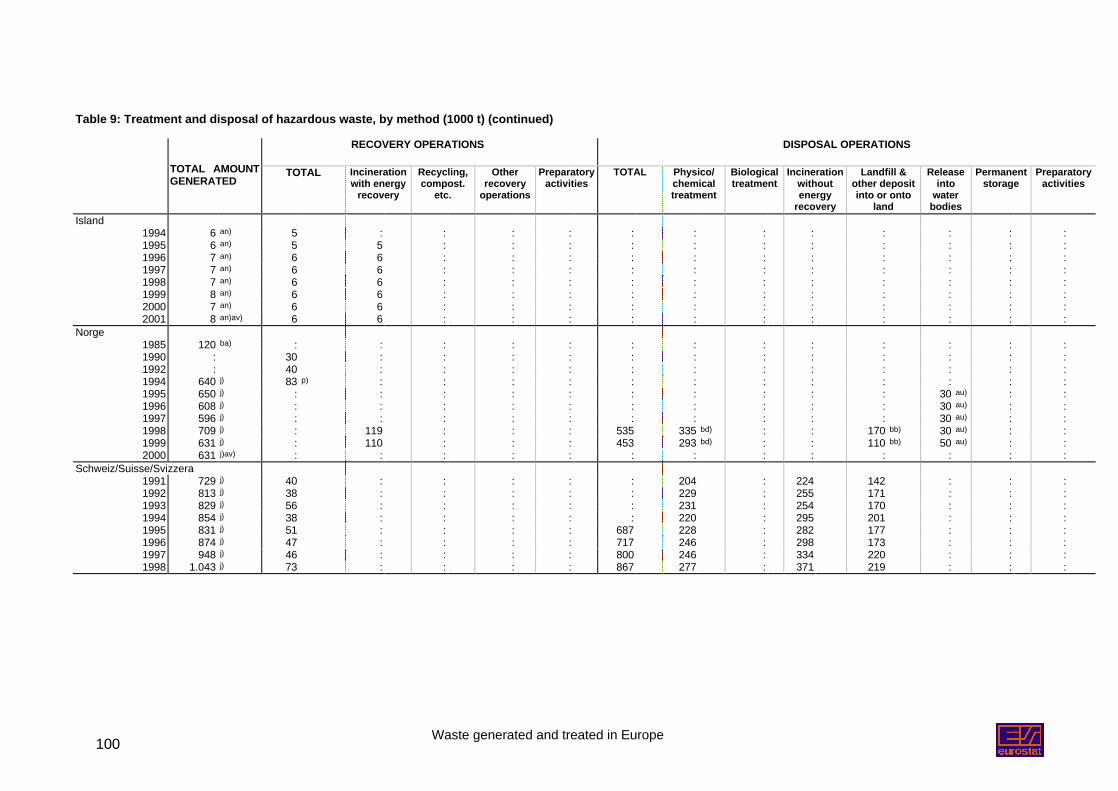
Waste generated and treated in Europe100
Table 9: Treatment and disposal of hazardous waste, by method (1000 t) (continued)
RECOVERY OPERATIONS DISPOSAL OPERATIONS
TOTAL AMOUNTGENERATED
TOTAL Incinerationwith energy
recovery
Recycling,compost.
etc.
Otherrecovery
operations
Preparatoryactivities
TOTAL Physico/chemicaltreatment
Biologicaltreatment
Incinerationwithoutenergy
recovery
Landfill &other depositinto or onto
land
Releaseinto
waterbodies
Permanentstorage
Preparatoryactivities
Island1994 6 an) 5 : : : : : : : : : : : :1995 6 an) 5 5 : : : : : : : : : : :1996 7 an) 6 6 : : : : : : : : : : :1997 7 an) 6 6 : : : : : : : : : : :1998 7 an) 6 6 : : : : : : : : : : :1999 8 an) 6 6 : : : : : : : : : : :2000 7 an) 6 6 : : : : : : : : : : :2001 8 an)av) 6 6 : : : : : : : : : : :
Norge1985 120 ba) : : : : : : : : : : : : :1990 : 30 : : : : : : : : : : : :1992 : 40 : : : : : : : : : : : :1994 640 j) 83 p) : : : : : : : : : : : :1995 650 j) : : : : : : : : : : 30 au) : :1996 608 j) : : : : : : : : : : 30 au) : :1997 596 j) : : : : : : : : : : 30 au) : :1998 709 j) : 119 : : : 535 335 bd) : : 170 bb) 30 au) : :1999 631 j) : 110 : : : 453 293 bd) : : 110 bb) 50 au) : :2000 631 j)av) : : : : : : : : : : : : :
Schweiz/Suisse/Svizzera1991 729 j) 40 : : : : : 204 : 224 142 : : :1992 813 j) 38 : : : : : 229 : 255 171 : : :1993 829 j) 56 : : : : : 231 : 254 170 : : :1994 854 j) 38 : : : : : 220 : 295 201 : : :1995 831 j) 51 : : : : 687 228 : 282 177 : : :1996 874 j) 47 : : : : 717 246 : 298 173 : : :1997 948 j) 46 : : : : 800 246 : 334 220 : : :1998 1.043 j) 73 : : : : 867 277 : 371 219 : : :
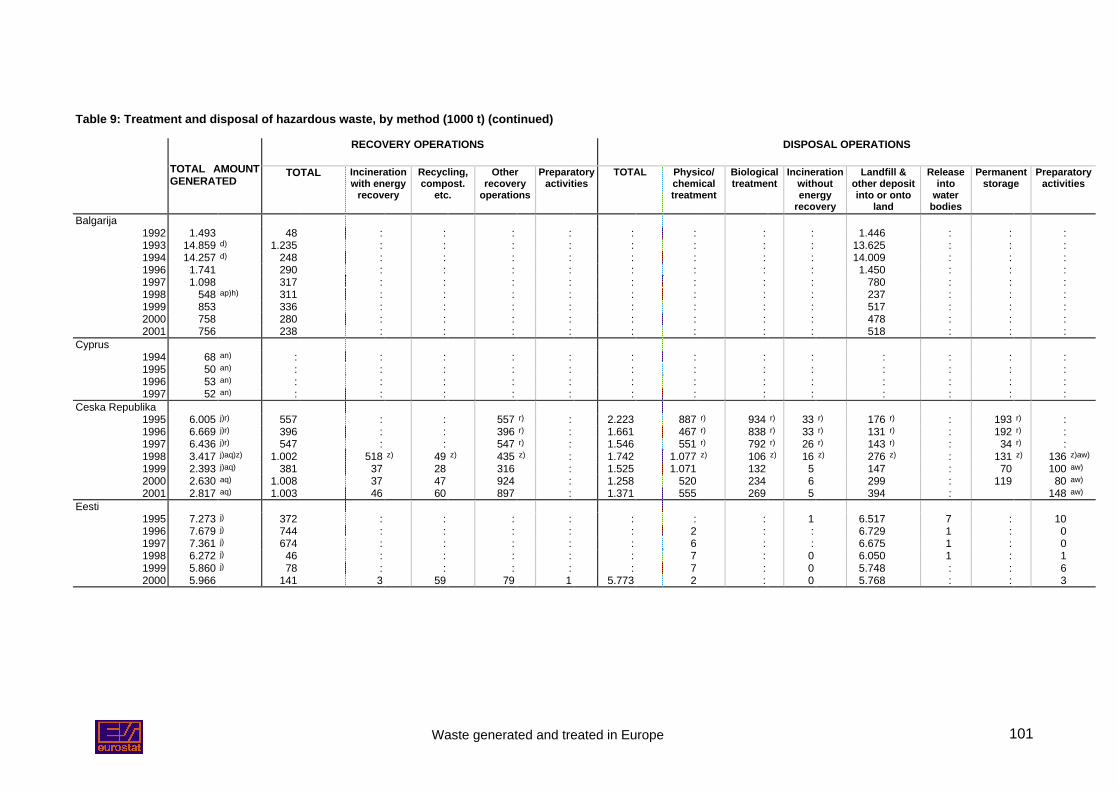
Waste generated and treated in Europe 101
Table 9: Treatment and disposal of hazardous waste, by method (1000 t) (continued)
RECOVERY OPERATIONS DISPOSAL OPERATIONS
TOTAL AMOUNTGENERATED
TOTAL Incinerationwith energy
recovery
Recycling,compost.
etc.
Otherrecovery
operations
Preparatoryactivities
TOTAL Physico/chemicaltreatment
Biologicaltreatment
Incinerationwithoutenergy
recovery
Landfill &other depositinto or onto
land
Releaseinto
waterbodies
Permanentstorage
Preparatoryactivities
Balgarija1992 1.493 48 : : : : : : : : 1.446 : : :1993 14.859 d) 1.235 : : : : : : : : 13.625 : : :1994 14.257 d) 248 : : : : : : : : 14.009 : : :1996 1.741 290 : : : : : : : : 1.450 : : :1997 1.098 317 : : : : : : : : 780 : : :1998 548 ap)h) 311 : : : : : : : : 237 : : :1999 853 336 : : : : : : : : 517 : : :2000 758 280 : : : : : : : : 478 : : :2001 756 238 : : : : : : : : 518 : : :
Cyprus1994 68 an) : : : : : : : : : : : : :1995 50 an) : : : : : : : : : : : : :1996 53 an) : : : : : : : : : : : : :1997 52 an) : : : : : : : : : : : : :
Ceska Republika1995 6.005 j)r) 557 : : 557 r) : 2.223 887 r) 934 r) 33 r) 176 r) : 193 r) :1996 6.669 j)r) 396 : : 396 r) : 1.661 467 r) 838 r) 33 r) 131 r) : 192 r) :1997 6.436 j)r) 547 : : 547 r) : 1.546 551 r) 792 r) 26 r) 143 r) : 34 r) :1998 3.417 j)aq)z) 1.002 518 z) 49 z) 435 z) : 1.742 1.077 z) 106 z) 16 z) 276 z) : 131 z) 136 z)aw)
1999 2.393 j)aq) 381 37 28 316 : 1.525 1.071 132 5 147 : 70 100 aw)
2000 2.630 aq) 1.008 37 47 924 : 1.258 520 234 6 299 : 119 80 aw)
2001 2.817 aq) 1.003 46 60 897 : 1.371 555 269 5 394 : 148 aw)
Eesti1995 7.273 j) 372 : : : : : : : 1 6.517 7 : 101996 7.679 j) 744 : : : : : 2 : : 6.729 1 : 01997 7.361 j) 674 : : : : : 6 : : 6.675 1 : 01998 6.272 j) 46 : : : : : 7 : 0 6.050 1 : 11999 5.860 j) 78 : : : : : 7 : 0 5.748 : : 62000 5.966 141 3 59 79 1 5.773 2 : 0 5.768 : : 3
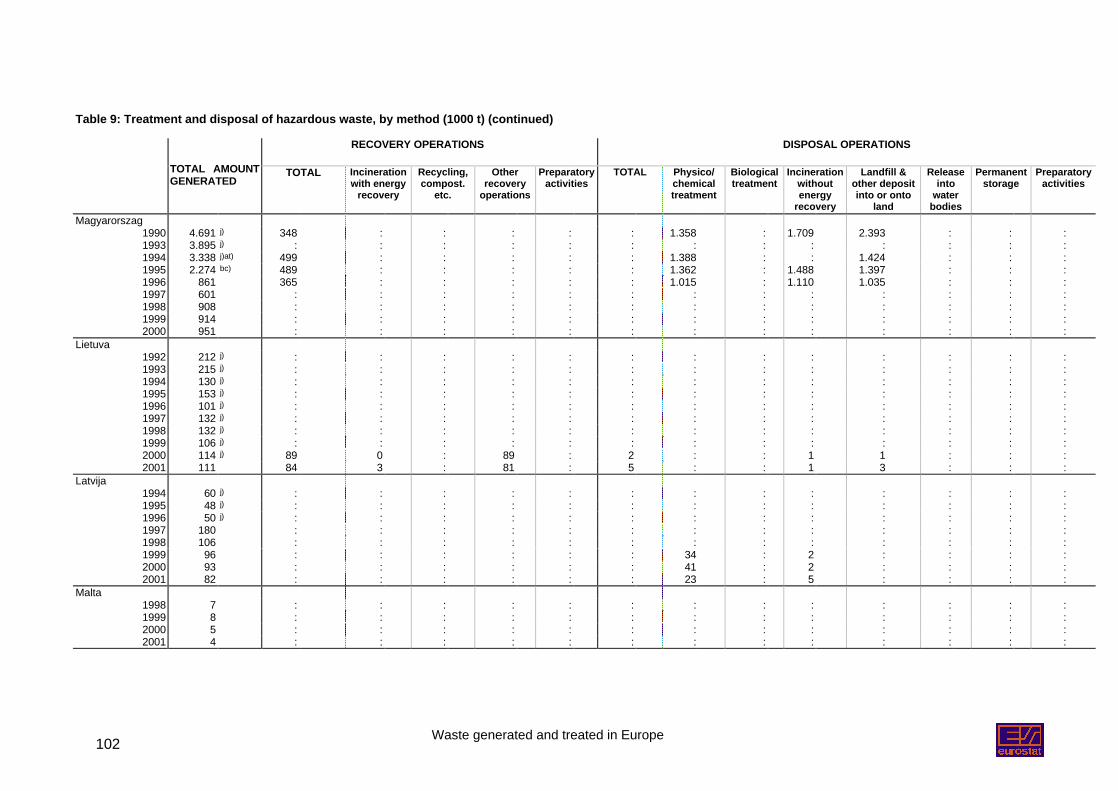
Waste generated and treated in Europe102
Table 9: Treatment and disposal of hazardous waste, by method (1000 t) (continued)
RECOVERY OPERATIONS DISPOSAL OPERATIONS
TOTAL AMOUNTGENERATED
TOTAL Incinerationwith energy
recovery
Recycling,compost.
etc.
Otherrecovery
operations
Preparatoryactivities
TOTAL Physico/chemicaltreatment
Biologicaltreatment
Incinerationwithoutenergy
recovery
Landfill &other depositinto or onto
land
Releaseinto
waterbodies
Permanentstorage
Preparatoryactivities
Magyarorszag1990 4.691 j) 348 : : : : : 1.358 : 1.709 2.393 : : :1993 3.895 j) : : : : : : : : : : : : :1994 3.338 j)at) 499 : : : : : 1.388 : : 1.424 : : :1995 2.274 bc) 489 : : : : : 1.362 : 1.488 1.397 : : :1996 861 365 : : : : : 1.015 : 1.110 1.035 : : :1997 601 : : : : : : : : : : : : :1998 908 : : : : : : : : : : : : :1999 914 : : : : : : : : : : : : :2000 951 : : : : : : : : : : : : :
Lietuva1992 212 j) : : : : : : : : : : : : :1993 215 j) : : : : : : : : : : : : :1994 130 j) : : : : : : : : : : : : :1995 153 j) : : : : : : : : : : : : :1996 101 j) : : : : : : : : : : : : :1997 132 j) : : : : : : : : : : : : :1998 132 j) : : : : : : : : : : : : :1999 106 j) : : : : : : : : : : : : :2000 114 j) 89 0 : 89 : 2 : : 1 1 : : :2001 111 84 3 : 81 : 5 : : 1 3 : : :
Latvija1994 60 j) : : : : : : : : : : : : :1995 48 j) : : : : : : : : : : : : :1996 50 j) : : : : : : : : : : : : :1997 180 : : : : : : : : : : : : :1998 106 : : : : : : : : : : : : :1999 96 : : : : : : 34 : 2 : : : :2000 93 : : : : : : 41 : 2 : : : :2001 82 : : : : : : 23 : 5 : : : :
Malta1998 7 : : : : : : : : : : : : :1999 8 : : : : : : : : : : : : :2000 5 : : : : : : : : : : : : :2001 4 : : : : : : : : : : : : :
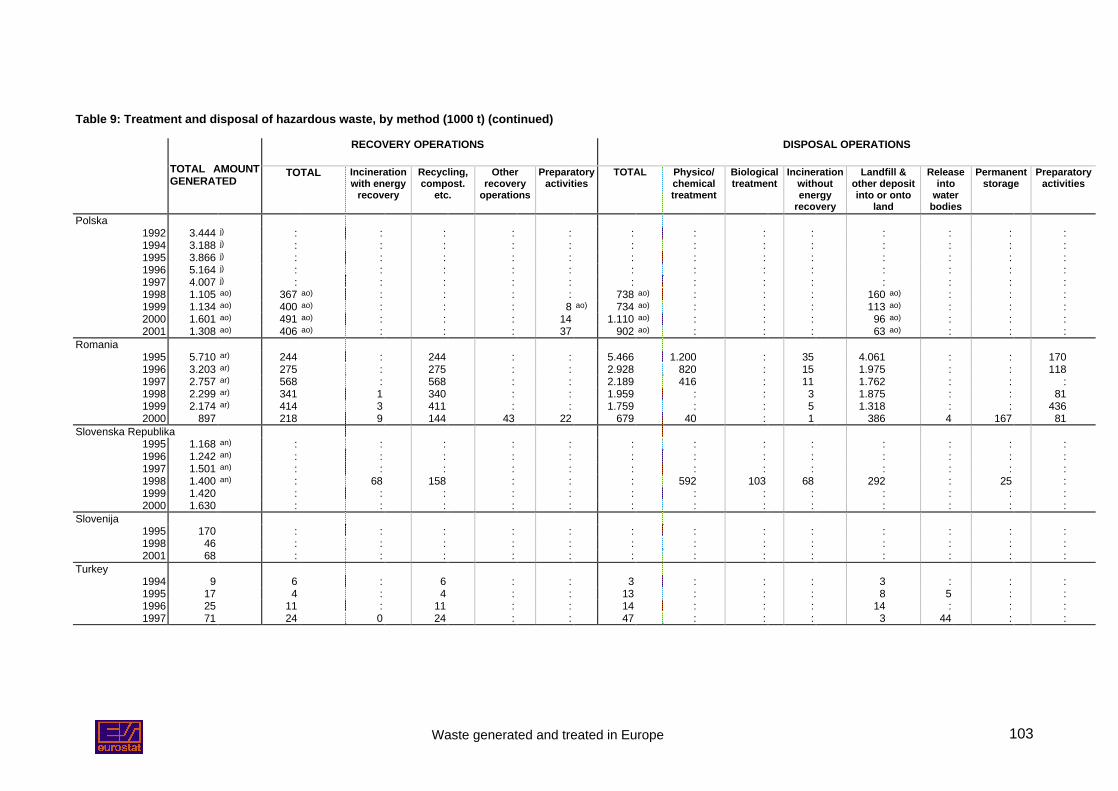
Waste generated and treated in Europe 103
Table 9: Treatment and disposal of hazardous waste, by method (1000 t) (continued)
RECOVERY OPERATIONS DISPOSAL OPERATIONS
TOTAL AMOUNTGENERATED
TOTAL Incinerationwith energy
recovery
Recycling,compost.
etc.
Otherrecovery
operations
Preparatoryactivities
TOTAL Physico/chemicaltreatment
Biologicaltreatment
Incinerationwithoutenergy
recovery
Landfill &other depositinto or onto
land
Releaseinto
waterbodies
Permanentstorage
Preparatoryactivities
Polska1992 3.444 j) : : : : : : : : : : : : :1994 3.188 j) : : : : : : : : : : : : :1995 3.866 j) : : : : : : : : : : : : :1996 5.164 j) : : : : : : : : : : : : :1997 4.007 j) : : : : : : : : : : : : :1998 1.105 ao) 367 ao) : : : : 738 ao) : : : 160 ao) : : :1999 1.134 ao) 400 ao) : : : 8 ao) 734 ao) : : : 113 ao) : : :2000 1.601 ao) 491 ao) : : : 14 1.110 ao) : : : 96 ao) : : :2001 1.308 ao) 406 ao) : : : 37 902 ao) : : : 63 ao) : : :
Romania1995 5.710 ar) 244 : 244 : : 5.466 1.200 : 35 4.061 : : 1701996 3.203 ar) 275 : 275 : : 2.928 820 : 15 1.975 : : 1181997 2.757 ar) 568 : 568 : : 2.189 416 : 11 1.762 : : :1998 2.299 ar) 341 1 340 : : 1.959 : : 3 1.875 : : 811999 2.174 ar) 414 3 411 : : 1.759 : : 5 1.318 : : 4362000 897 218 9 144 43 22 679 40 : 1 386 4 167 81
Slovenska Republika1995 1.168 an) : : : : : : : : : : : : :1996 1.242 an) : : : : : : : : : : : : :1997 1.501 an) : : : : : : : : : : : : :1998 1.400 an) : 68 158 : : : 592 103 68 292 : 25 :1999 1.420 : : : : : : : : : : : : :2000 1.630 : : : : : : : : : : : : :
Slovenija1995 170 : : : : : : : : : : : : :1998 46 : : : : : : : : : : : : :2001 68 : : : : : : : : : : : : :
Turkey1994 9 6 : 6 : : 3 : : : 3 : : :1995 17 4 : 4 : : 13 : : : 8 5 : :1996 25 11 : 11 : : 14 : : : 14 : : :1997 71 24 0 24 : : 47 : : : 3 44 : :
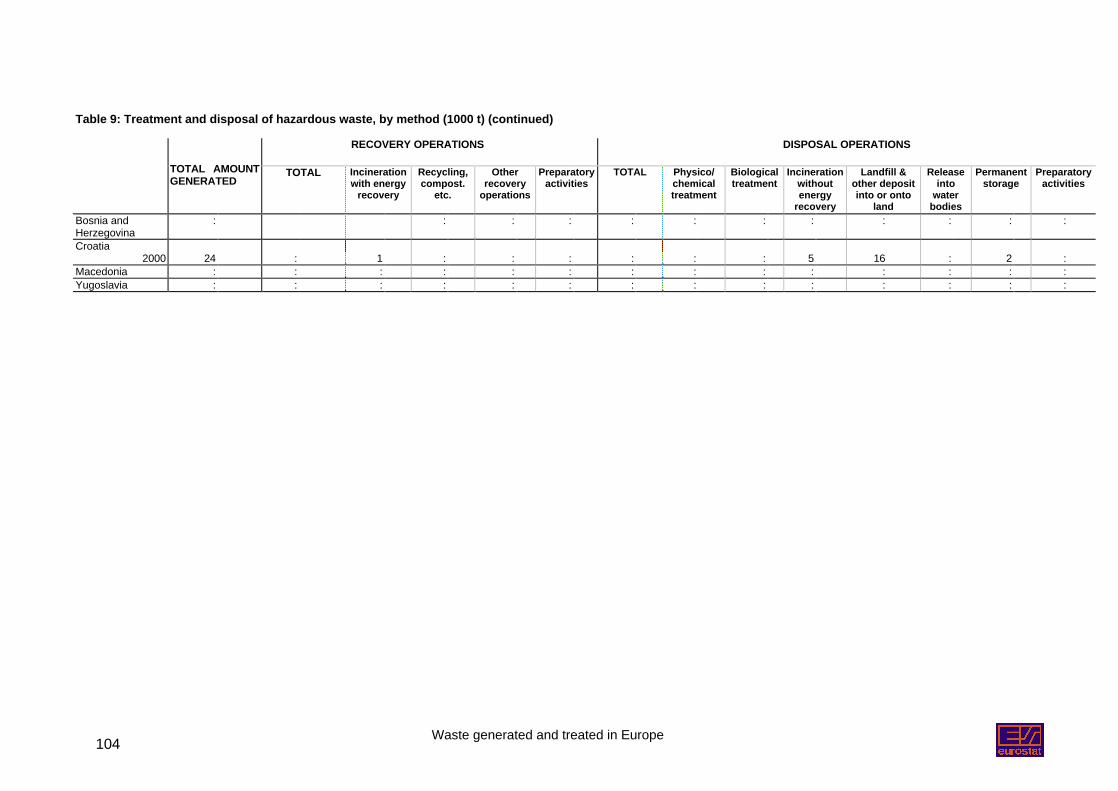
Waste generated and treated in Europe104
Table 9: Treatment and disposal of hazardous waste, by method (1000 t) (continued)
RECOVERY OPERATIONS DISPOSAL OPERATIONS
TOTAL AMOUNTGENERATED
TOTAL Incinerationwith energy
recovery
Recycling,compost.
etc.
Otherrecovery
operations
Preparatoryactivities
TOTAL Physico/chemicaltreatment
Biologicaltreatment
Incinerationwithoutenergy
recovery
Landfill &other depositinto or onto
land
Releaseinto
waterbodies
Permanentstorage
Preparatoryactivities
Bosnia andHerzegovina
: : : : : : : : : : : :
Croatia2000 24 : 1 : : : : : : 5 16 : 2 :
Macedonia : : : : : : : : : : : : : :Yugoslavia : : : : : : : : : : : : : :
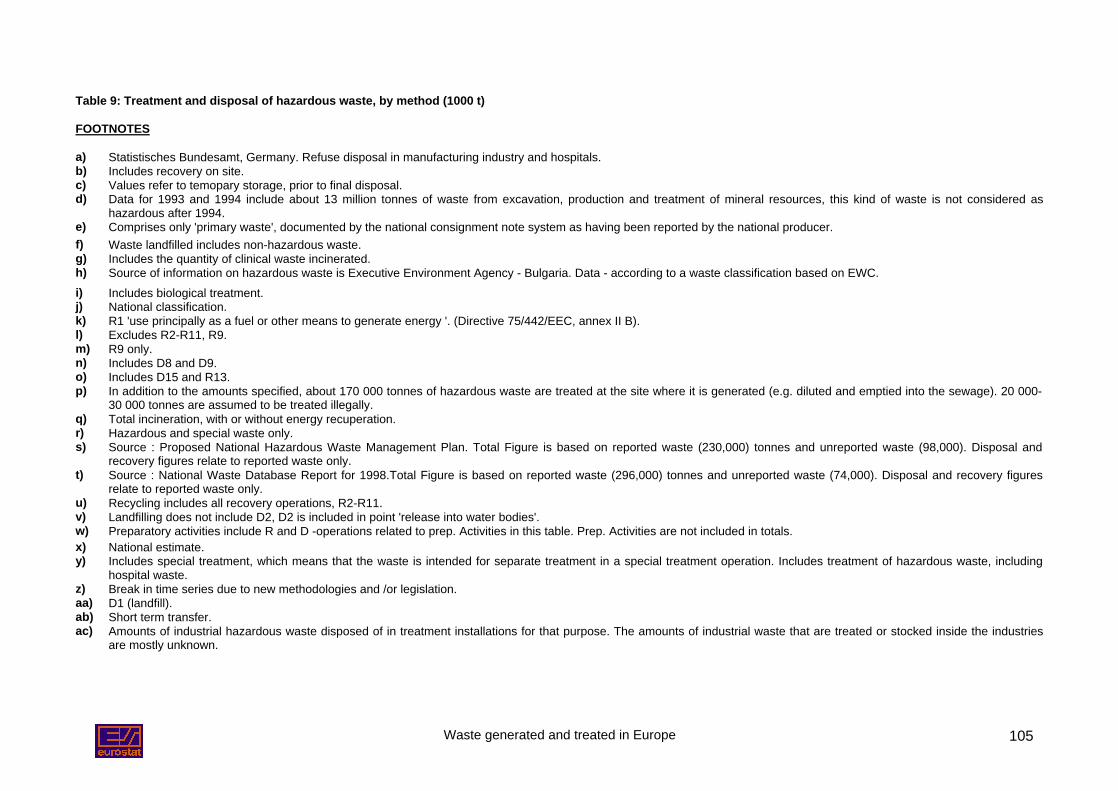
Waste generated and treated in Europe 105
Table 9: Treatment and disposal of hazardous waste, by method (1000 t)
FOOTNOTES
a) Statistisches Bundesamt, Germany. Refuse disposal in manufacturing industry and hospitals.b) Includes recovery on site.c) Values refer to temopary storage, prior to final disposal.d) Data for 1993 and 1994 include about 13 million tonnes of waste from excavation, production and treatment of mineral resources, this kind of waste is not considered as
hazardous after 1994.e) Comprises only 'primary waste', documented by the national consignment note system as having been reported by the national producer.f) Waste landfilled includes non-hazardous waste.g) Includes the quantity of clinical waste incinerated.h) Source of information on hazardous waste is Executive Environment Agency - Bulgaria. Data - according to a waste classification based on EWC.i) Includes biological treatment.j) National classification.k) R1 'use principally as a fuel or other means to generate energy '. (Directive 75/442/EEC, annex II B).l) Excludes R2-R11, R9.m) R9 only.n) Includes D8 and D9.o) Includes D15 and R13.p) In addition to the amounts specified, about 170 000 tonnes of hazardous waste are treated at the site where it is generated (e.g. diluted and emptied into the sewage). 20 000-
30 000 tonnes are assumed to be treated illegally.q) Total incineration, with or without energy recuperation.r) Hazardous and special waste only.s) Source : Proposed National Hazardous Waste Management Plan. Total Figure is based on reported waste (230,000) tonnes and unreported waste (98,000). Disposal and
recovery figures relate to reported waste only.t) Source : National Waste Database Report for 1998.Total Figure is based on reported waste (296,000) tonnes and unreported waste (74,000). Disposal and recovery figures
relate to reported waste only.u) Recycling includes all recovery operations, R2-R11.v) Landfilling does not include D2, D2 is included in point 'release into water bodies'.w) Preparatory activities include R and D -operations related to prep. Activities in this table. Prep. Activities are not included in totals.x) National estimate.y) Includes special treatment, which means that the waste is intended for separate treatment in a special treatment operation. Includes treatment of hazardous waste, including
hospital waste.z) Break in time series due to new methodologies and /or legislation.aa) D1 (landfill).ab) Short term transfer.ac) Amounts of industrial hazardous waste disposed of in treatment installations for that purpose. The amounts of industrial waste that are treated or stocked inside the industries
are mostly unknown.
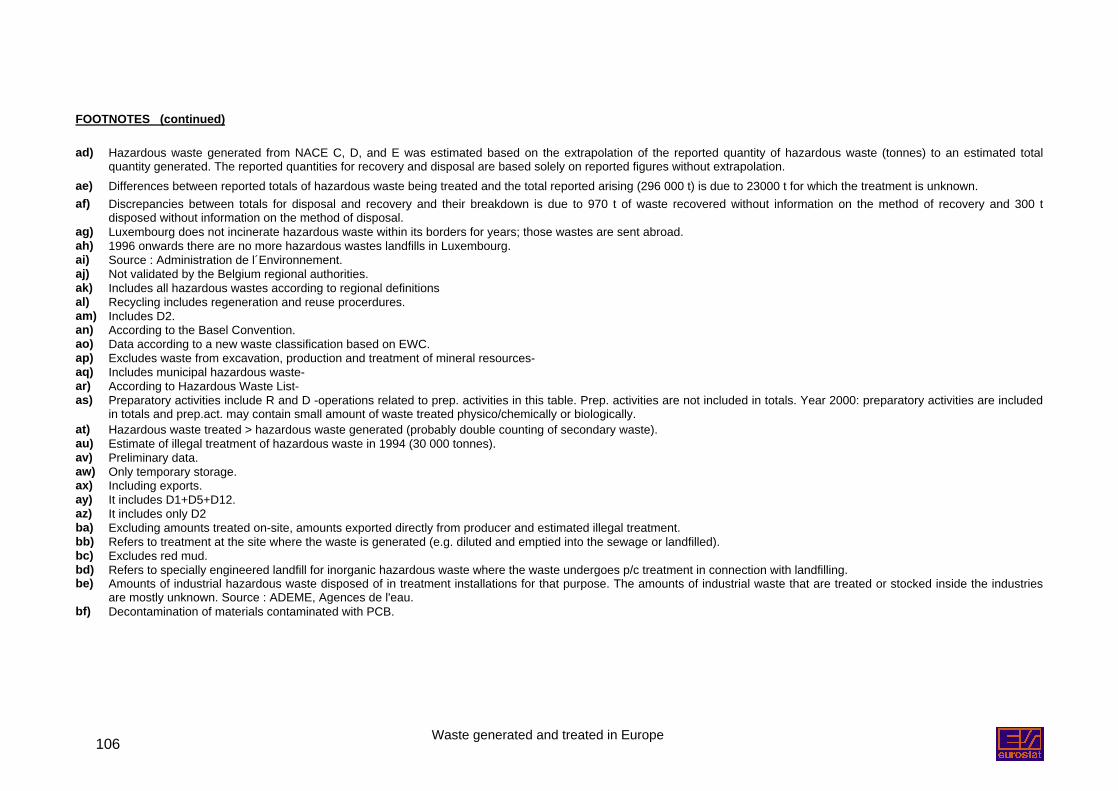
Waste generated and treated in Europe106
FOOTNOTES (continued)
ad) Hazardous waste generated from NACE C, D, and E was estimated based on the extrapolation of the reported quantity of hazardous waste (tonnes) to an estimated totalquantity generated. The reported quantities for recovery and disposal are based solely on reported figures without extrapolation.
ae) Differences between reported totals of hazardous waste being treated and the total reported arising (296 000 t) is due to 23000 t for which the treatment is unknown.af) Discrepancies between totals for disposal and recovery and their breakdown is due to 970 t of waste recovered without information on the method of recovery and 300 t
disposed without information on the method of disposal.ag) Luxembourg does not incinerate hazardous waste within its borders for years; those wastes are sent abroad.ah) 1996 onwards there are no more hazardous wastes landfills in Luxembourg.ai) Source : Administration de l´Environnement.aj) Not validated by the Belgium regional authorities.ak) Includes all hazardous wastes according to regional definitionsal) Recycling includes regeneration and reuse procerdures.am) Includes D2.an) According to the Basel Convention.ao) Data according to a new waste classification based on EWC.ap) Excludes waste from excavation, production and treatment of mineral resources-aq) Includes municipal hazardous waste-ar) According to Hazardous Waste List-as) Preparatory activities include R and D -operations related to prep. activities in this table. Prep. activities are not included in totals. Year 2000: preparatory activities are included
in totals and prep.act. may contain small amount of waste treated physico/chemically or biologically.at) Hazardous waste treated > hazardous waste generated (probably double counting of secondary waste).au) Estimate of illegal treatment of hazardous waste in 1994 (30 000 tonnes).av) Preliminary data.aw) Only temporary storage.ax) Including exports.ay) It includes D1+D5+D12.az) It includes only D2ba) Excluding amounts treated on-site, amounts exported directly from producer and estimated illegal treatment.bb) Refers to treatment at the site where the waste is generated (e.g. diluted and emptied into the sewage or landfilled).bc) Excludes red mud.bd) Refers to specially engineered landfill for inorganic hazardous waste where the waste undergoes p/c treatment in connection with landfilling.be) Amounts of industrial hazardous waste disposed of in treatment installations for that purpose. The amounts of industrial waste that are treated or stocked inside the industries
are mostly unknown. Source : ADEME, Agences de l'eau.bf) Decontamination of materials contaminated with PCB.
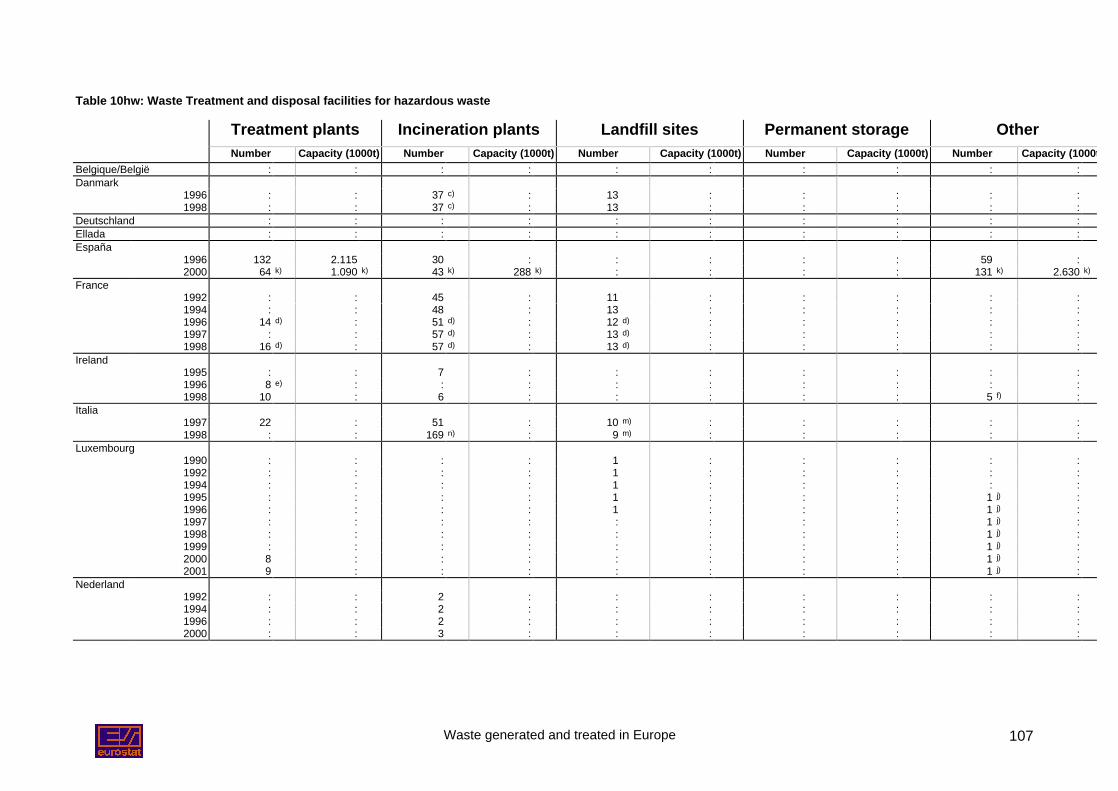
Waste generated and treated in Europe 107
Table 10hw: Waste Treatment and disposal facilities for hazardous waste
Treatment plants Incineration plants Landfill sites Permanent storage OtherNumber Capacity (1000t) Number Capacity (1000t) Number Capacity (1000t) Number Capacity (1000t) Number Capacity (1000t)
Belgique/België : : : : : : : : : :Danmark
1996 : : 37 c) : 13 : : : : :1998 : : 37 c) : 13 : : : : :
Deutschland : : : : : : : : : :Ellada : : : : : : : : : :España
1996 132 2.115 30 : : : : : 59 :2000 64 k) 1.090 k) 43 k) 288 k) : : : : 131 k) 2.630 k)
France1992 : : 45 : 11 : : : : :1994 : : 48 : 13 : : : : :1996 14 d) : 51 d) : 12 d) : : : : :1997 : : 57 d) : 13 d) : : : : :1998 16 d) : 57 d) : 13 d) : : : : :
Ireland1995 : : 7 : : : : : : :1996 8 e) : : : : : : : : :1998 10 : 6 : : : : : 5 f) :
Italia1997 22 : 51 : 10 m) : : : : :1998 : : 169 n) : 9 m) : : : : :
Luxembourg1990 : : : : 1 : : : : :1992 : : : : 1 : : : : :1994 : : : : 1 : : : : :1995 : : : : 1 : : : 1 j) :1996 : : : : 1 : : : 1 j) :1997 : : : : : : : : 1 j) :1998 : : : : : : : : 1 j) :1999 : : : : : : : : 1 j) :2000 8 : : : : : : : 1 j) :2001 9 : : : : : : : 1 j) :
Nederland1992 : : 2 : : : : : : :1994 : : 2 : : : : : : :1996 : : 2 : : : : : : :2000 : : 3 : : : : : : :
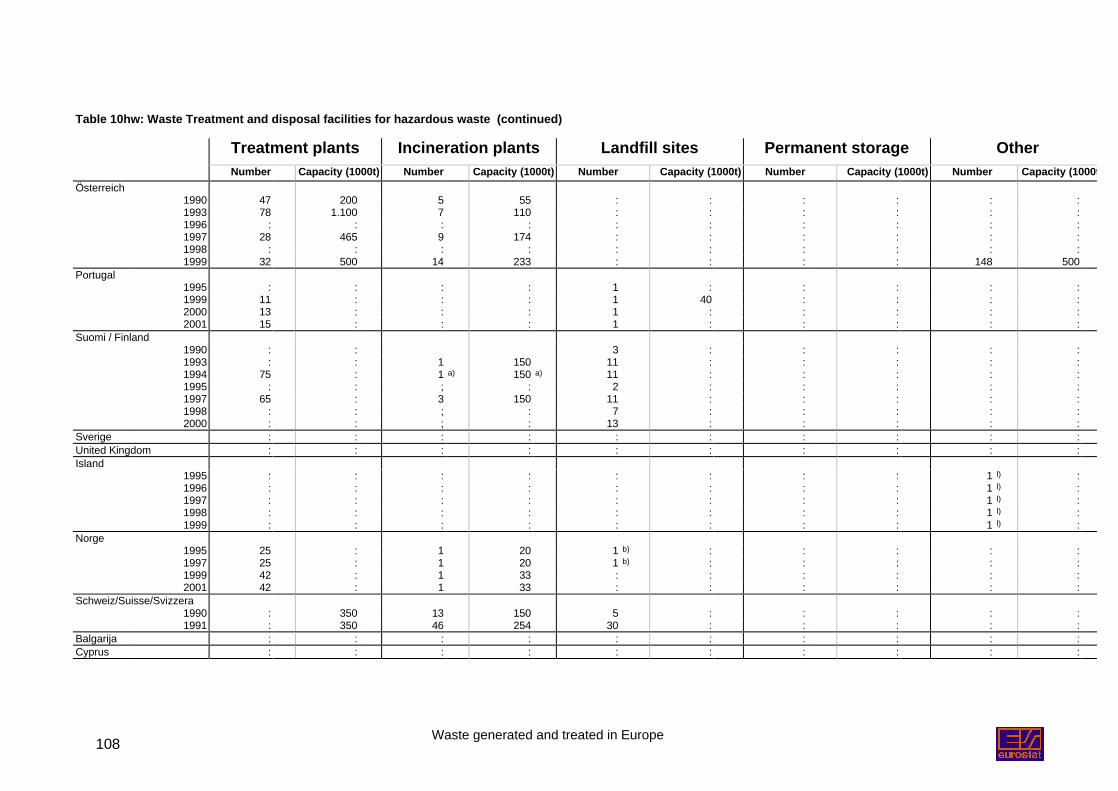
Waste generated and treated in Europe108
Table 10hw: Waste Treatment and disposal facilities for hazardous waste (continued)
Treatment plants Incineration plants Landfill sites Permanent storage OtherNumber Capacity (1000t) Number Capacity (1000t) Number Capacity (1000t) Number Capacity (1000t) Number Capacity (1000t)
Österreich1990 47 200 5 55 : : : : : :1993 78 1.100 7 110 : : : : : :1996 : : : : : : : : : :1997 28 465 9 174 : : : : : :1998 : : : : : : : : : :1999 32 500 14 233 : : : : 148 500
Portugal1995 : : : : 1 : : : : :1999 11 : : : 1 40 : : : :2000 13 : : : 1 : : : : :2001 15 : : : 1 : : : : :
Suomi / Finland1990 : : 3 : : : : :1993 : : 1 150 11 : : : : :1994 75 : 1 a) 150 a) 11 : : : : :1995 : : ; : 2 : : : : :1997 65 : 3 150 11 : : : : :1998 : : ; : 7 : : : : :2000 : : ; : 13 : : : : :
Sverige : : : : : : : : : :United Kingdom : : : : : : : : : :Island
1995 : : : : : : : : 1 l) :1996 : : : : : : : : 1 l) :1997 : : : : : : : : 1 l) :1998 : : : : : : : : 1 l) :1999 : : : : : : : : 1 l) :
Norge1995 25 : 1 20 1 b) : : : : :1997 25 : 1 20 1 b) : : : : :1999 42 : 1 33 : : : : : :2001 42 : 1 33 : : : : : :
Schweiz/Suisse/Svizzera1990 : 350 13 150 5 : : : : :1991 : 350 46 254 30 : : : : :
Balgarija : : : : : : : : : :Cyprus : : : : : : : : : :
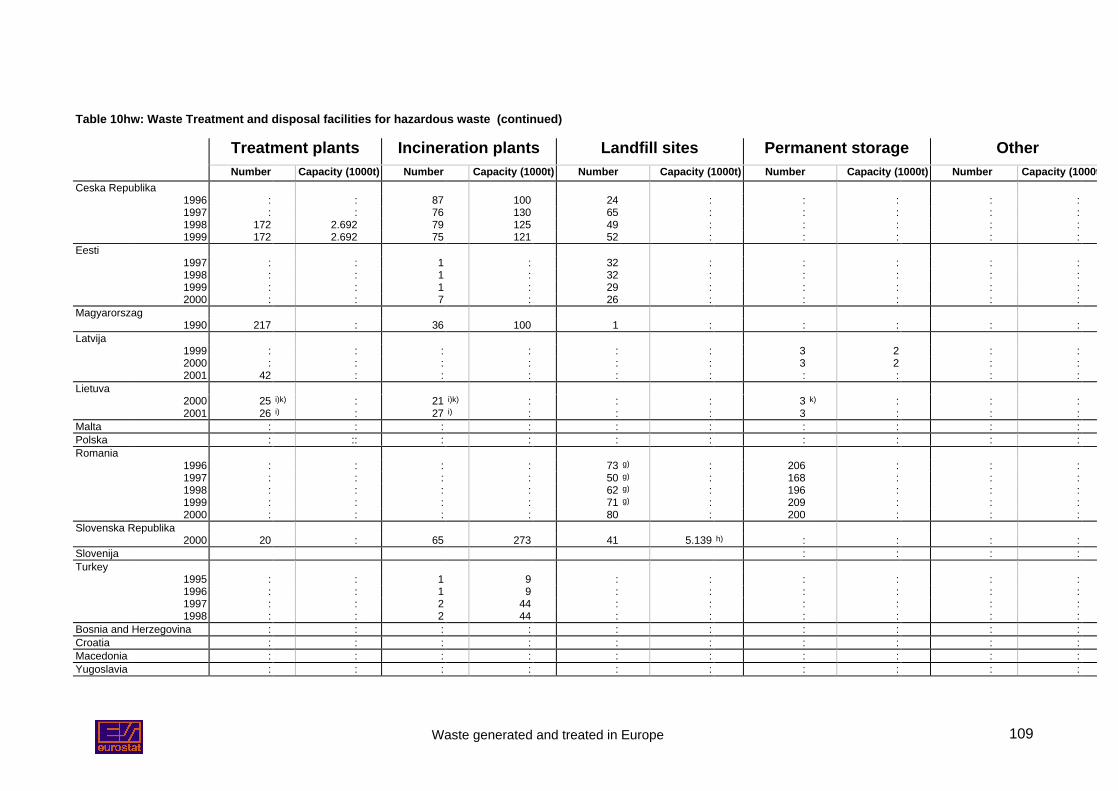
Waste generated and treated in Europe 109
Table 10hw: Waste Treatment and disposal facilities for hazardous waste (continued)
Treatment plants Incineration plants Landfill sites Permanent storage OtherNumber Capacity (1000t) Number Capacity (1000t) Number Capacity (1000t) Number Capacity (1000t) Number Capacity (1000t)
Ceska Republika1996 : : 87 100 24 : : : : :1997 : : 76 130 65 : : : : :1998 172 2.692 79 125 49 : : : : :1999 172 2.692 75 121 52 : : : : :
Eesti1997 : : 1 : 32 : : : : :1998 : : 1 : 32 : : : : :1999 : : 1 : 29 : : : : :2000 : : 7 : 26 : : : : :
Magyarorszag1990 217 : 36 100 1 : : : : :
Latvija1999 : : : : : : 3 2 : :2000 : : : : : : 3 2 : :2001 42 : : : : : : : : :
Lietuva2000 25 i)k) : 21 i)k) : : : 3 k) : : :2001 26 i) : 27 i) : : : 3 : : :
Malta : : : : : : : : : :Polska : :: : : : : : : : :Romania
1996 : : : : 73 g) : 206 : : :1997 : : : : 50 g) : 168 : : :1998 : : : : 62 g) : 196 : : :1999 : : : : 71 g) : 209 : : :2000 : : : : 80 : 200 : : :
Slovenska Republika2000 20 : 65 273 41 5.139 h) : : : :
Slovenija : : : :Turkey
1995 : : 1 9 : : : : : :1996 : : 1 9 : : : : : :1997 : : 2 44 : : : : : :1998 : : 2 44 : : : : : :
Bosnia and Herzegovina : : : : : : : : : :Croatia : : : : : : : : : :Macedonia : : : : : : : : : :Yugoslavia : : : : : : : : : :
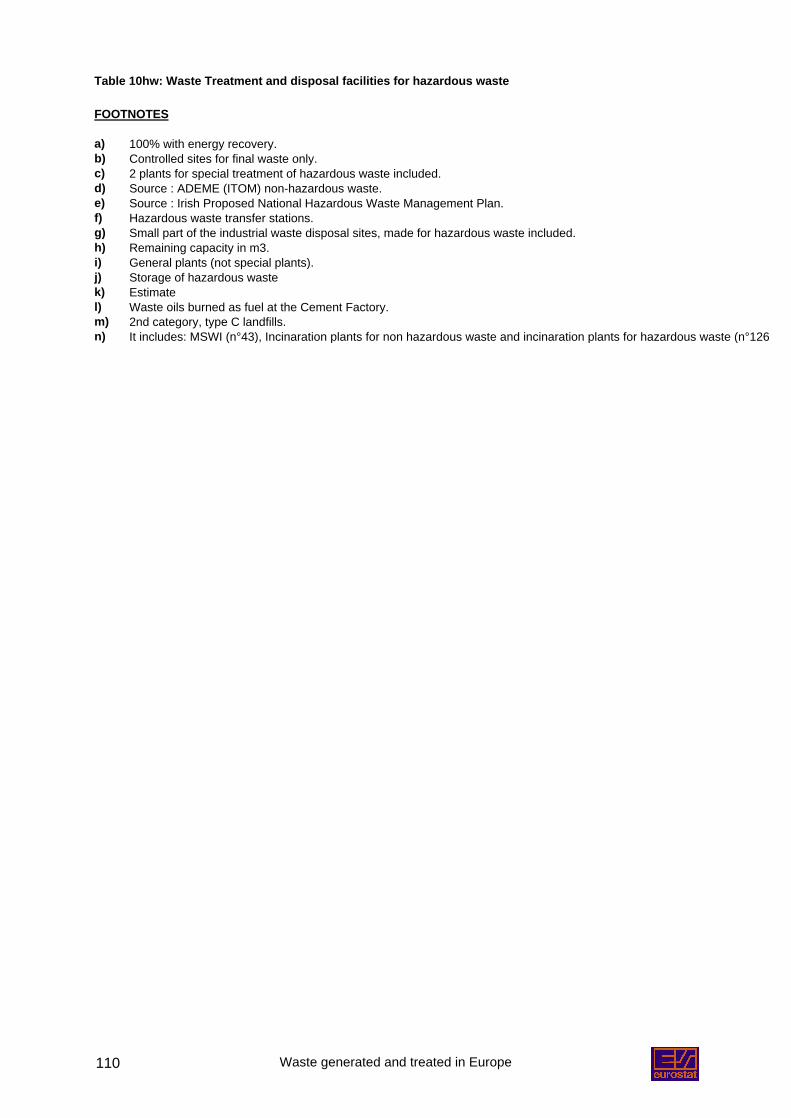
Waste generated and treated in Europe110
Table 10hw: Waste Treatment and disposal facilities for hazardous waste
FOOTNOTES
a) 100% with energy recovery.b) Controlled sites for final waste only.c) 2 plants for special treatment of hazardous waste included.d) Source : ADEME (ITOM) non-hazardous waste.e) Source : Irish Proposed National Hazardous Waste Management Plan.f) Hazardous waste transfer stations.g) Small part of the industrial waste disposal sites, made for hazardous waste included.h) Remaining capacity in m3.i) General plants (not special plants).j) Storage of hazardous wastek) Estimatel) Waste oils burned as fuel at the Cement Factory.m) 2nd category, type C landfills.n) It includes: MSWI (n°43), Incinaration plants for non hazardous waste and incinaration plants for hazardous waste (n°126)
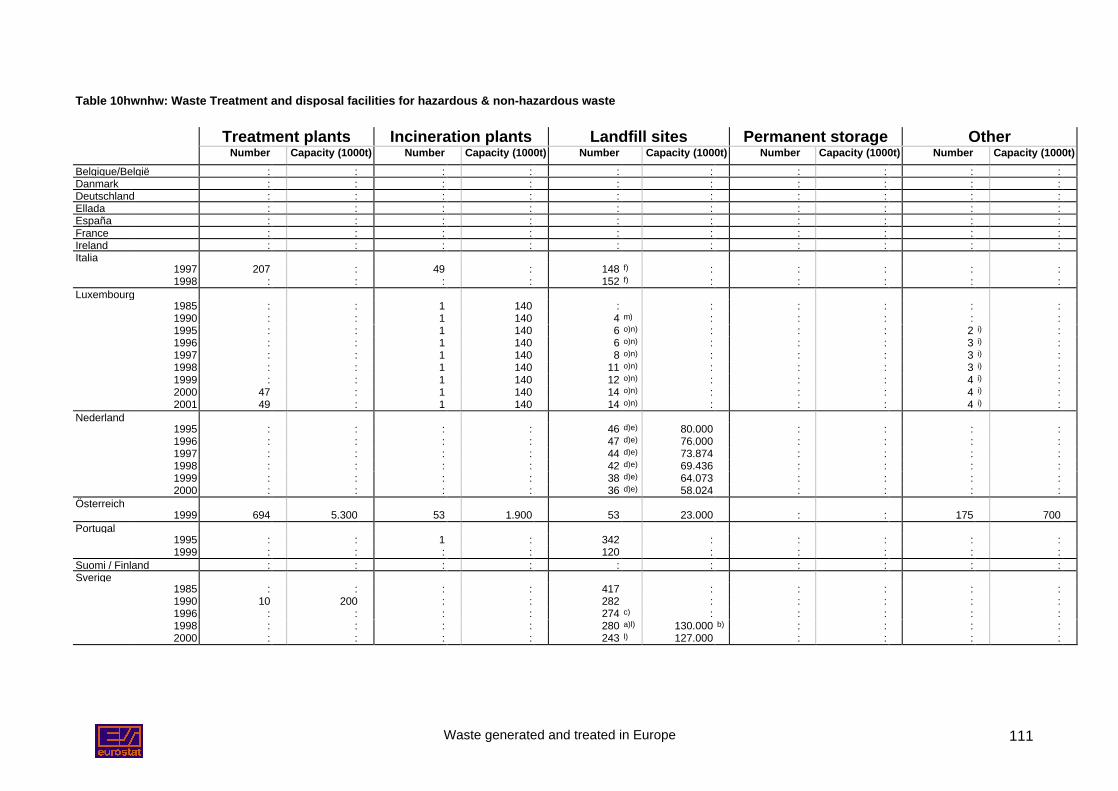
Waste generated and treated in Europe 111
Table 10hwnhw: Waste Treatment and disposal facilities for hazardous & non-hazardous waste
Treatment plants Incineration plants Landfill sites Permanent storage OtherNumber Capacity (1000t) Number Capacity (1000t) Number Capacity (1000t) Number Capacity (1000t) Number Capacity (1000t)
Belgique/België : : : : : : : : : :Danmark : : : : : : : : : :Deutschland : : : : : : : : : :Ellada : : : : : : : : : :España : : : : : : : : : :France : : : : : : : : : :Ireland : : : : : : : : : :Italia
1997 207 : 49 : 148 f) : : : : :1998 : : : : 152 f) : : : : :
Luxembourg1985 : : 1 140 : : : : : :1990 : : 1 140 4 m) : : : : :1995 : : 1 140 6 o)n) : : : 2 i) :1996 : : 1 140 6 o)n) : : : 3 i) :1997 : : 1 140 8 o)n) : : : 3 i) :1998 : : 1 140 11 o)n) : : : 3 i) :1999 : : 1 140 12 o)n) : : : 4 i) :2000 47 : 1 140 14 o)n) : : : 4 i) :2001 49 : 1 140 14 o)n) : : : 4 i) :
Nederland1995 : : : : 46 d)e) 80.000 : : : :1996 : : : : 47 d)e) 76.000 : : : :1997 : : : : 44 d)e) 73.874 : : : :1998 : : : : 42 d)e) 69.436 : : : :1999 : : : : 38 d)e) 64.073 : : : :2000 : : : : 36 d)e) 58.024 : : : :
Österreich1999 694 5.300 53 1.900 53 23.000 : : 175 700
Portugal1995 : : 1 : 342 : : : : :1999 : : : : 120 : : : : :
Suomi / Finland : : : : : : : : : :Sverige
1985 : : : : 417 : : : : :1990 10 200 : : 282 : : : : :1996 : : : : 274 c) : : : : :1998 : : : : 280 a)l) 130.000 b) : : : :2000 : : : : 243 l) 127.000 : : : :
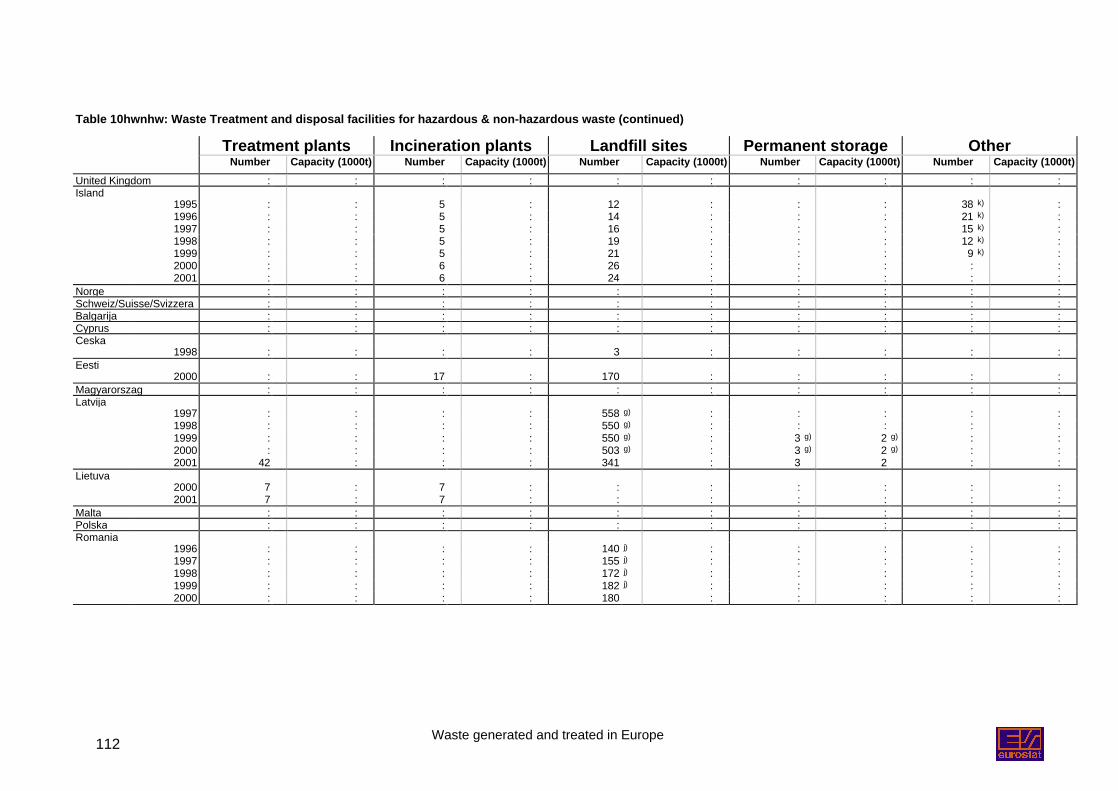
Waste generated and treated in Europe112
Table 10hwnhw: Waste Treatment and disposal facilities for hazardous & non-hazardous waste (continued)
Treatment plants Incineration plants Landfill sites Permanent storage OtherNumber Capacity (1000t) Number Capacity (1000t) Number Capacity (1000t) Number Capacity (1000t) Number Capacity (1000t)
United Kingdom : : : : : : : : : :Island
1995 : : 5 : 12 : : : 38 k) :1996 : : 5 : 14 : : : 21 k) :1997 : : 5 : 16 : : : 15 k) :1998 : : 5 : 19 : : : 12 k) :1999 : : 5 : 21 : : : 9 k) :2000 : : 6 : 26 : : : : :2001 : : 6 : 24 : : : : :
Norge : : : : : : : : : :Schweiz/Suisse/Svizzera : : : : : : : : : :Balgarija : : : : : : : : : :Cyprus : : : : : : : : : :Ceska
1998 : : : : 3 : : : : :Eesti
2000 : : 17 : 170 : : : : :Magyarorszag : : : : : : : : : :Latvija
1997 : : : : 558 g) : : : : :1998 : : : : 550 g) : : : : :1999 : : : : 550 g) : 3 g) 2 g) : :2000 : : : : 503 g) : 3 g) 2 g) : :2001 42 : : : 341 : 3 2 : :
Lietuva2000 7 : 7 : : : : : : :2001 7 : 7 : : : : : : :
Malta : : : : : : : : : :Polska : : : : : : : : : :Romania
1996 : : : : 140 j) : : : : :1997 : : : : 155 j) : : : : :1998 : : : : 172 j) : : : : :1999 : : : : 182 j) : : : : :2000 : : : : 180 : : : : :
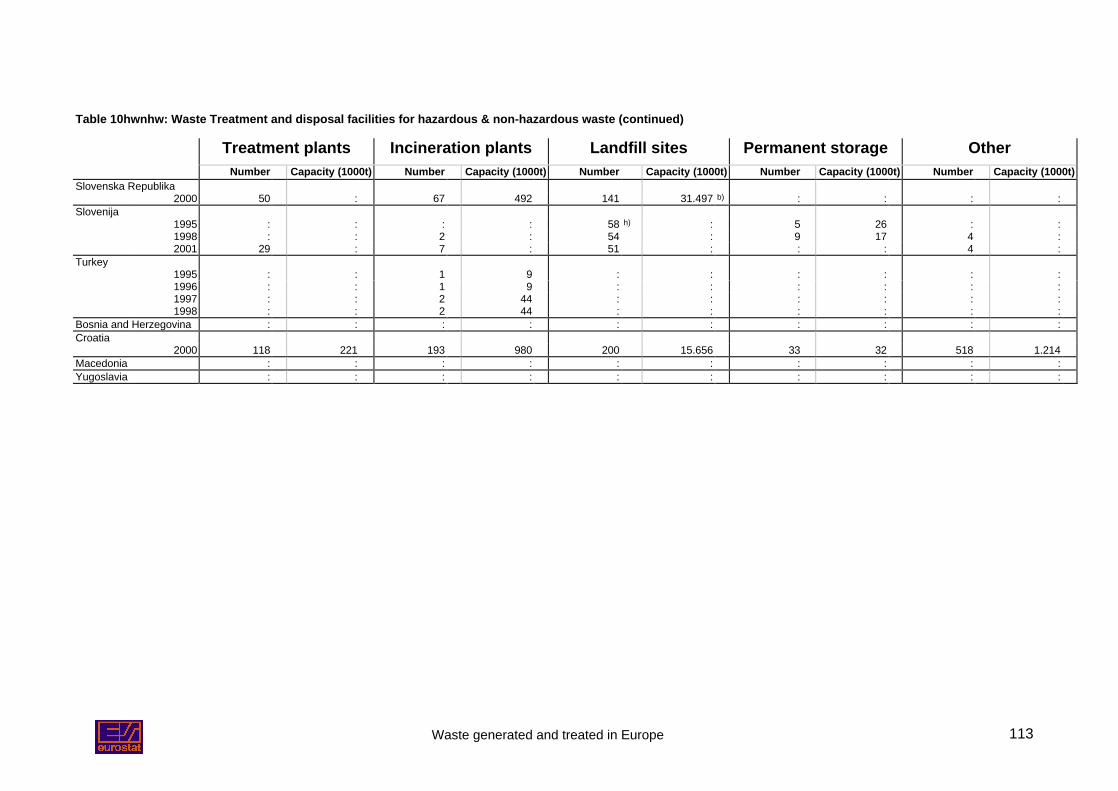
Waste generated and treated in Europe 113
Table 10hwnhw: Waste Treatment and disposal facilities for hazardous & non-hazardous waste (continued)
Treatment plants Incineration plants Landfill sites Permanent storage OtherNumber Capacity (1000t) Number Capacity (1000t) Number Capacity (1000t) Number Capacity (1000t) Number Capacity (1000t)
Slovenska Republika2000 50 : 67 492 141 31.497 b) : : : :
Slovenija1995 : : : : 58 h) : 5 26 : :1998 : : 2 : 54 : 9 17 4 :2001 29 : 7 : 51 : : : 4 :
Turkey1995 : : 1 9 : : : : : :1996 : : 1 9 : : : : : :1997 : : 2 44 : : : : : :1998 : : 2 44 : : : : : :
Bosnia and Herzegovina : : : : : : : : : :Croatia
2000 118 221 193 980 200 15.656 33 32 518 1.214Macedonia : : : : : : : : : :Yugoslavia : : : : : : : : : :
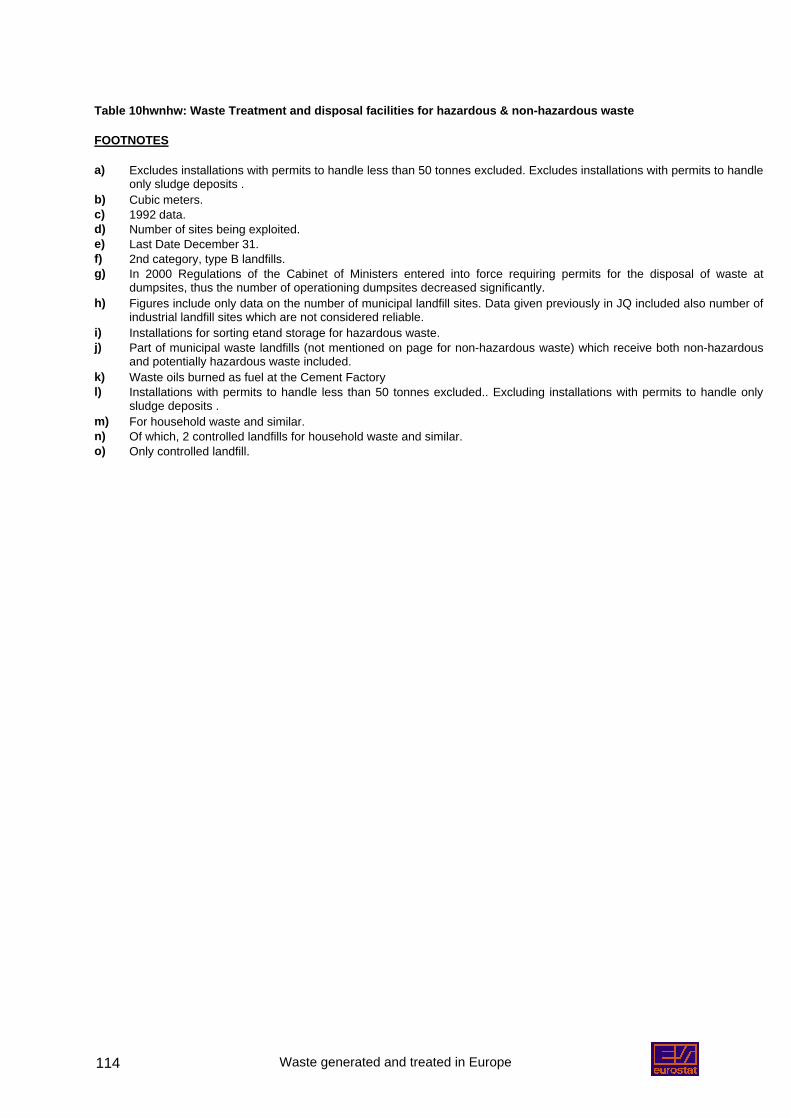
Waste generated and treated in Europe114
Table 10hwnhw: Waste Treatment and disposal facilities for hazardous & non-hazardous waste
FOOTNOTES
a) Excludes installations with permits to handle less than 50 tonnes excluded. Excludes installations with permits to handleonly sludge deposits .
b) Cubic meters.c) 1992 data.d) Number of sites being exploited.e) Last Date December 31.f) 2nd category, type B landfills.g) In 2000 Regulations of the Cabinet of Ministers entered into force requiring permits for the disposal of waste at
dumpsites, thus the number of operationing dumpsites decreased significantly.h) Figures include only data on the number of municipal landfill sites. Data given previously in JQ included also number of
industrial landfill sites which are not considered reliable.i) Installations for sorting etand storage for hazardous waste.j) Part of municipal waste landfills (not mentioned on page for non-hazardous waste) which receive both non-hazardous
and potentially hazardous waste included.k) Waste oils burned as fuel at the Cement Factoryl) Installations with permits to handle less than 50 tonnes excluded.. Excluding installations with permits to handle only
sludge deposits .m) For household waste and similar.n) Of which, 2 controlled landfills for household waste and similar.o) Only controlled landfill.
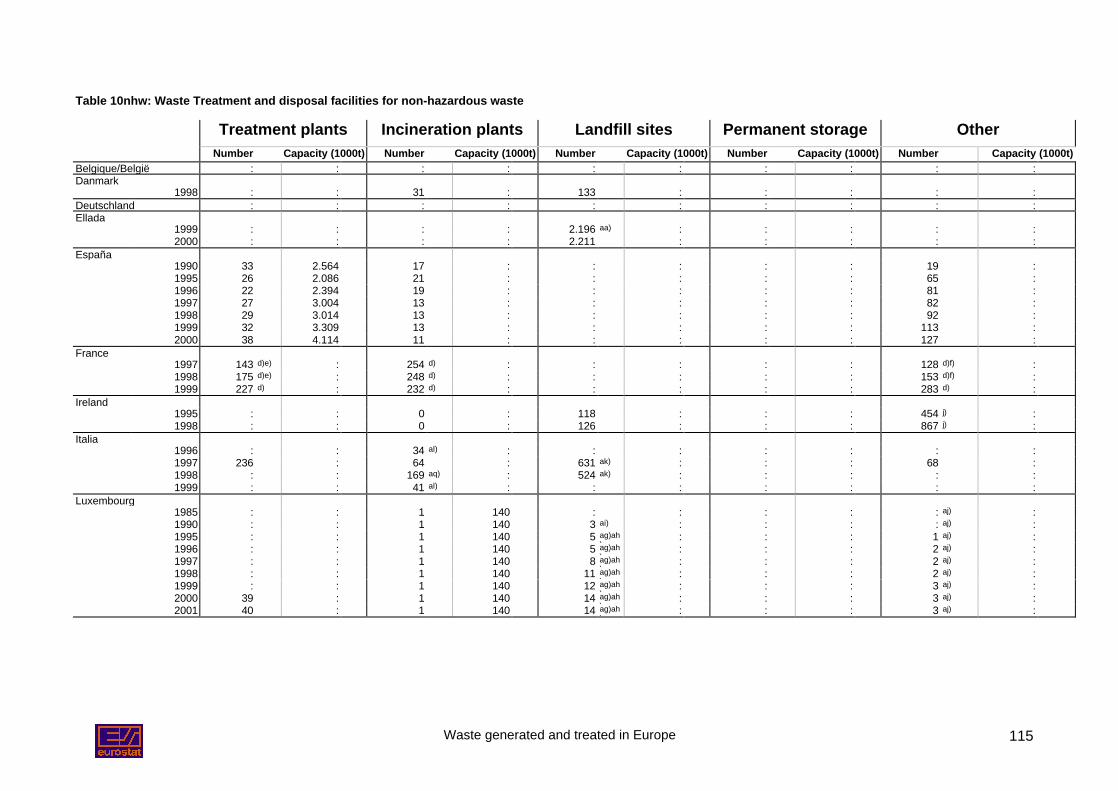
Waste generated and treated in Europe 115
Table 10nhw: Waste Treatment and disposal facilities for non-hazardous waste
Treatment plants Incineration plants Landfill sites Permanent storage OtherNumber Capacity (1000t) Number Capacity (1000t) Number Capacity (1000t) Number Capacity (1000t) Number Capacity (1000t)
Belgique/België : : : : : : : : : :Danmark
1998 : : 31 : 133 : : : : :Deutschland : : : : : : : : : :Ellada
1999 : : : : 2.196 aa) : : : : :2000 : : : : 2.211 : : : : :
España1990 33 2.564 17 : : : : : 19 :1995 26 2.086 21 : : : : : 65 :1996 22 2.394 19 : : : : : 81 :1997 27 3.004 13 : : : : : 82 :1998 29 3.014 13 : : : : : 92 :1999 32 3.309 13 : : : : : 113 :2000 38 4.114 11 : : : : : 127 :
France1997 143 d)e) : 254 d) : : : : : 128 d)f) :1998 175 d)e) : 248 d) : : : : : 153 d)f) :1999 227 d) : 232 d) : : : : : 283 d) :
Ireland1995 : : 0 : 118 : : : 454 j) :1998 : : 0 : 126 : : : 867 j) :
Italia1996 : : 34 al) : : : : : : :1997 236 : 64 : 631 ak) : : : 68 :1998 : : 169 aq) : 524 ak) : : : : :1999 : : 41 al) : : : : : : :
Luxembourg1985 : : 1 140 : : : : : aj) :1990 : : 1 140 3 ai) : : : : aj) :1995 : : 1 140 5 ag)ah
): : : 1 aj) :
1996 : : 1 140 5 ag)ah)
: : : 2 aj) :1997 : : 1 140 8 ag)ah
): : : 2 aj) :
1998 : : 1 140 11 ag)ah)
: : : 2 aj) :1999 : : 1 140 12 ag)ah
): : : 3 aj) :
2000 39 : 1 140 14 ag)ah)
: : : 3 aj) :2001 40 : 1 140 14 ag)ah
): : : 3 aj) :
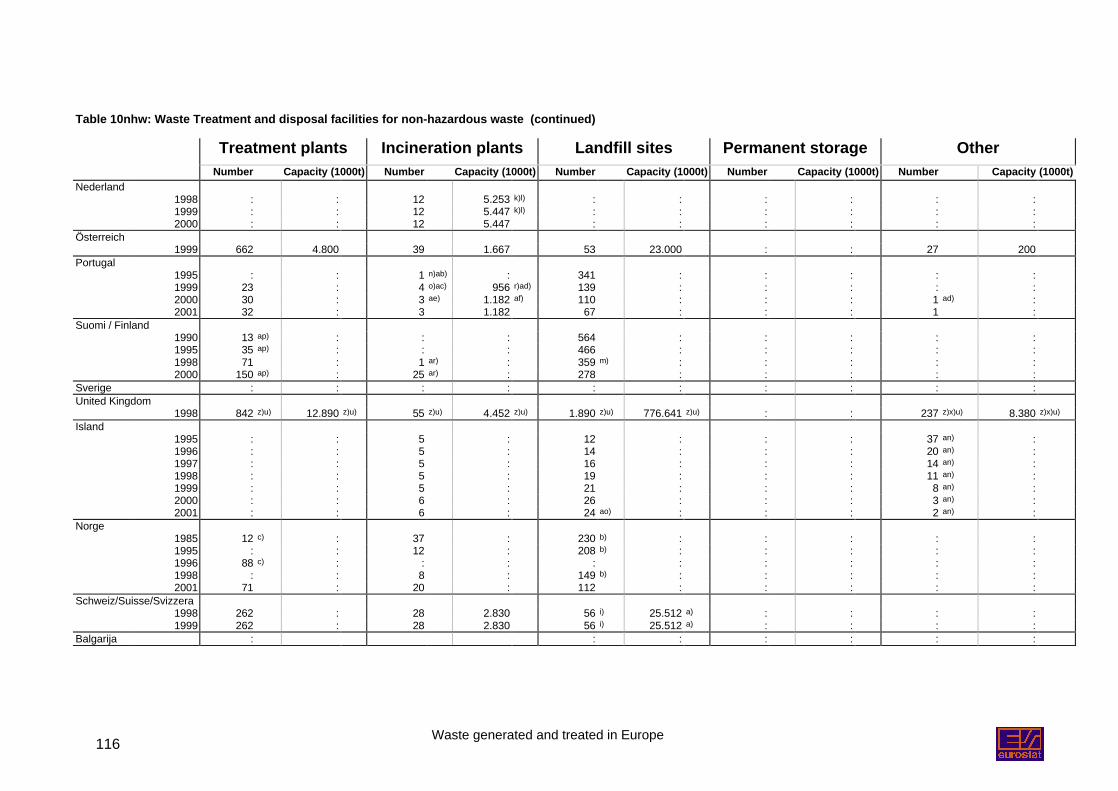
Waste generated and treated in Europe116
Table 10nhw: Waste Treatment and disposal facilities for non-hazardous waste (continued)
Treatment plants Incineration plants Landfill sites Permanent storage OtherNumber Capacity (1000t) Number Capacity (1000t) Number Capacity (1000t) Number Capacity (1000t) Number Capacity (1000t)
Nederland1998 : : 12 5.253 k)l) : : : : : :1999 : : 12 5.447 k)l) : : : : : :2000 : : 12 5.447 : : : : : :
Österreich1999 662 4.800 39 1.667 53 23.000 : : 27 200
Portugal1995 : : 1 n)ab) : 341 : : : : :1999 23 : 4 o)ac) 956 r)ad) 139 : : : : :2000 30 : 3 ae) 1.182 af) 110 : : : 1 ad) :2001 32 : 3 1.182 67 : : : 1 :
Suomi / Finland1990 13 ap) : : : 564 : : : : :1995 35 ap) : : : 466 : : : : :1998 71 : 1 ar) : 359 m) : : : : :2000 150 ap) : 25 ar) : 278 : : : : :
Sverige : : : : : : : : : :United Kingdom
1998 842 z)u) 12.890 z)u) 55 z)u) 4.452 z)u) 1.890 z)u) 776.641 z)u) : : 237 z)x)u) 8.380 z)x)u)
Island1995 : : 5 : 12 : : : 37 an) :1996 : : 5 : 14 : : : 20 an) :1997 : : 5 : 16 : : : 14 an) :1998 : : 5 : 19 : : : 11 an) :1999 : : 5 : 21 : : : 8 an) :2000 : : 6 : 26 : : : 3 an) :2001 : : 6 : 24 ao) : : : 2 an) :
Norge1985 12 c) : 37 : 230 b) : : : : :1995 : : 12 : 208 b) : : : : :1996 88 c) : : : : : : : : :1998 : : 8 : 149 b) : : : : :2001 71 : 20 : 112 : : : : :
Schweiz/Suisse/Svizzera1998 262 : 28 2.830 56 i) 25.512 a) : : : :1999 262 : 28 2.830 56 i) 25.512 a) : : : :
Balgarija : : : : : : :
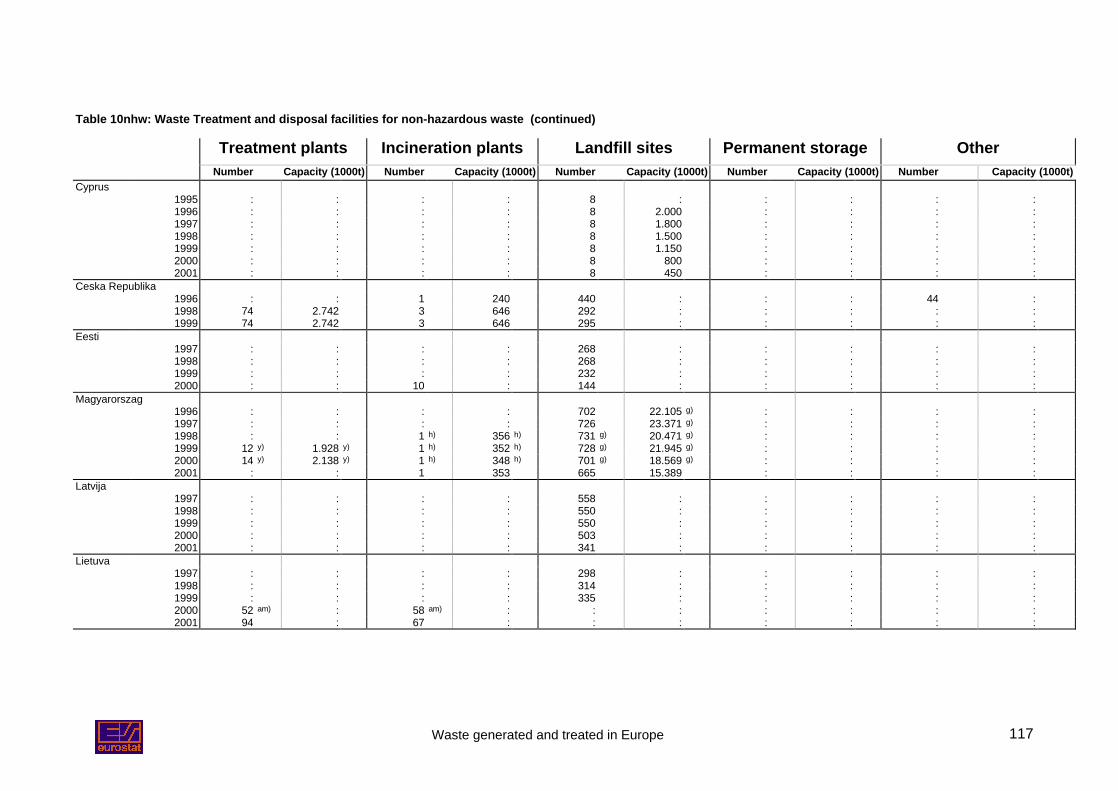
Waste generated and treated in Europe 117
Table 10nhw: Waste Treatment and disposal facilities for non-hazardous waste (continued)
Treatment plants Incineration plants Landfill sites Permanent storage OtherNumber Capacity (1000t) Number Capacity (1000t) Number Capacity (1000t) Number Capacity (1000t) Number Capacity (1000t)
Cyprus1995 : : : : 8 : : : : :1996 : : : : 8 2.000 : : : :1997 : : : : 8 1.800 : : : :1998 : : : : 8 1.500 : : : :1999 : : : : 8 1.150 : : : :2000 : : : : 8 800 : : : :2001 : : : : 8 450 : : : :
Ceska Republika1996 : : 1 240 440 : : : 44 :1998 74 2.742 3 646 292 : : : : :1999 74 2.742 3 646 295 : : : : :
Eesti1997 : : : : 268 : : : : :1998 : : : : 268 : : : : :1999 : : : : 232 : : : : :2000 : : 10 : 144 : : : : :
Magyarorszag1996 : : : : 702 22.105 g) : : : :1997 : : : : 726 23.371 g) : : : :1998 : : 1 h) 356 h) 731 g) 20.471 g) : : : :1999 12 y) 1.928 y) 1 h) 352 h) 728 g) 21.945 g) : : : :2000 14 y) 2.138 y) 1 h) 348 h) 701 g) 18.569 g) : : : :2001 : : 1 353 665 15.389 : : : :
Latvija1997 : : : : 558 : : : : :1998 : : : : 550 : : : : :1999 : : : : 550 : : : : :2000 : : : : 503 : : : : :2001 : : : : 341 : : : : :
Lietuva1997 : : : : 298 : : : : :1998 : : : : 314 : : : : :1999 : : : : 335 : : : : :2000 52 am) : 58 am) : : : : : : :2001 94 : 67 : : : : : : :
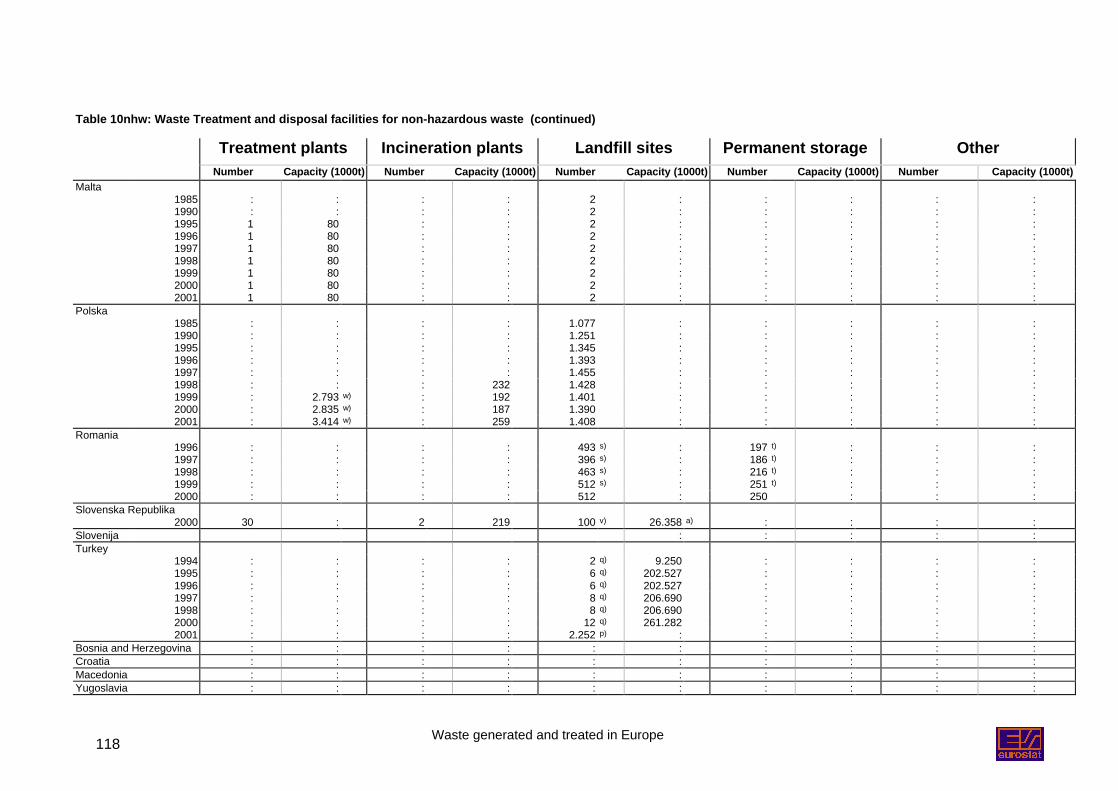
Waste generated and treated in Europe118
Table 10nhw: Waste Treatment and disposal facilities for non-hazardous waste (continued)
Treatment plants Incineration plants Landfill sites Permanent storage OtherNumber Capacity (1000t) Number Capacity (1000t) Number Capacity (1000t) Number Capacity (1000t) Number Capacity (1000t)
Malta1985 : : : : 2 : : : : :1990 : : : : 2 : : : : :1995 1 80 : : 2 : : : : :1996 1 80 : : 2 : : : : :1997 1 80 : : 2 : : : : :1998 1 80 : : 2 : : : : :1999 1 80 : : 2 : : : : :2000 1 80 : : 2 : : : : :2001 1 80 : : 2 : : : : :
Polska1985 : : : : 1.077 : : : : :1990 : : : : 1.251 : : : : :1995 : : : : 1.345 : : : : :1996 : : : : 1.393 : : : : :1997 : : : : 1.455 : : : : :1998 : : : 232 1.428 : : : : :1999 : 2.793 w) : 192 1.401 : : : : :2000 : 2.835 w) : 187 1.390 : : : : :2001 : 3.414 w) : 259 1.408 : : : : :
Romania1996 : : : : 493 s) : 197 t) : : :1997 : : : : 396 s) : 186 t) : : :1998 : : : : 463 s) : 216 t) : : :1999 : : : : 512 s) : 251 t) : : :2000 : : : : 512 : 250 : : :
Slovenska Republika2000 30 : 2 219 100 v) 26.358 a) : : : :
Slovenija : : : : :Turkey
1994 : : : : 2 q) 9.250 : : : :1995 : : : : 6 q) 202.527 : : : :1996 : : : : 6 q) 202.527 : : : :1997 : : : : 8 q) 206.690 : : : :1998 : : : : 8 q) 206.690 : : : :2000 : : : : 12 q) 261.282 : : : :2001 : : : : 2.252 p) : : : : :
Bosnia and Herzegovina : : : : : : : : : :Croatia : : : : : : : : : :Macedonia : : : : : : : : : :Yugoslavia : : : : : : : : : :
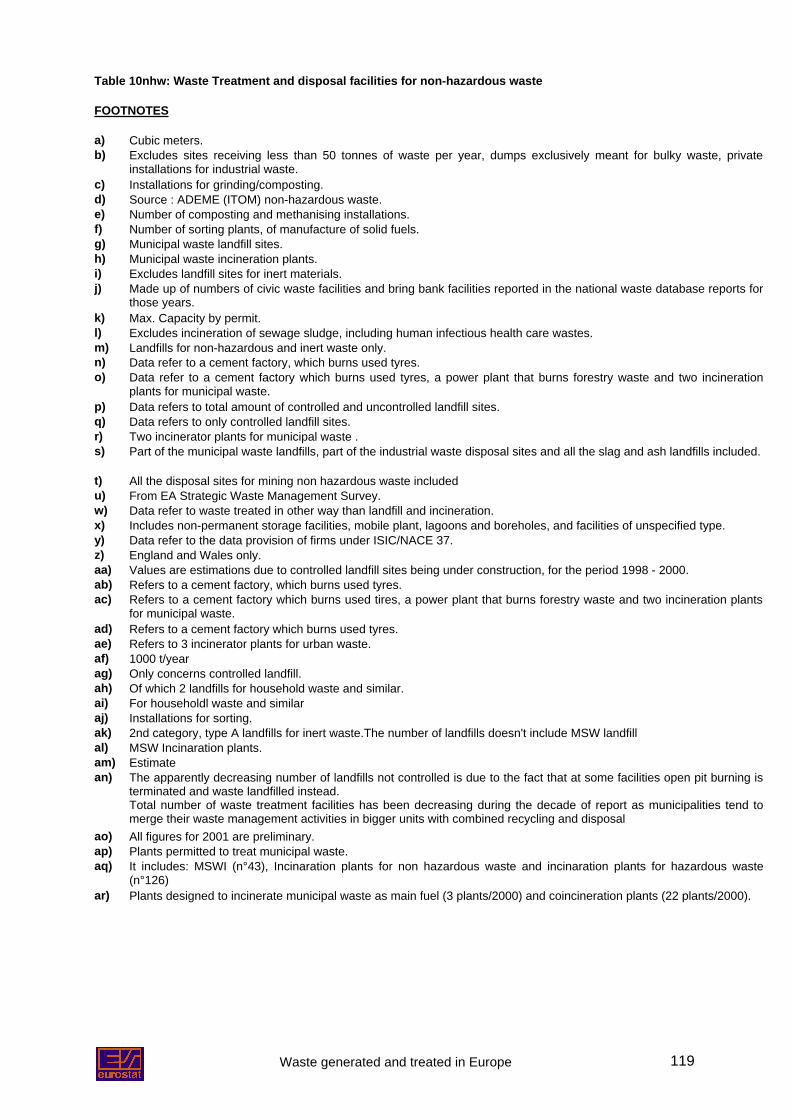
Waste generated and treated in Europe 119
Table 10nhw: Waste Treatment and disposal facilities for non-hazardous waste
FOOTNOTES
a) Cubic meters.b) Excludes sites receiving less than 50 tonnes of waste per year, dumps exclusively meant for bulky waste, private
installations for industrial waste.c) Installations for grinding/composting.d) Source : ADEME (ITOM) non-hazardous waste.e) Number of composting and methanising installations.f) Number of sorting plants, of manufacture of solid fuels.g) Municipal waste landfill sites.h) Municipal waste incineration plants.i) Excludes landfill sites for inert materials.j) Made up of numbers of civic waste facilities and bring bank facilities reported in the national waste database reports for
those years.k) Max. Capacity by permit.l) Excludes incineration of sewage sludge, including human infectious health care wastes.m) Landfills for non-hazardous and inert waste only.n) Data refer to a cement factory, which burns used tyres.o) Data refer to a cement factory which burns used tyres, a power plant that burns forestry waste and two incineration
plants for municipal waste.p) Data refers to total amount of controlled and uncontrolled landfill sites.q) Data refers to only controlled landfill sites.r) Two incinerator plants for municipal waste .s) Part of the municipal waste landfills, part of the industrial waste disposal sites and all the slag and ash landfills included.
t) All the disposal sites for mining non hazardous waste includedu) From EA Strategic Waste Management Survey.w) Data refer to waste treated in other way than landfill and incineration.x) Includes non-permanent storage facilities, mobile plant, lagoons and boreholes, and facilities of unspecified type.y) Data refer to the data provision of firms under ISIC/NACE 37.z) England and Wales only.aa) Values are estimations due to controlled landfill sites being under construction, for the period 1998 - 2000.ab) Refers to a cement factory, which burns used tyres.ac) Refers to a cement factory which burns used tires, a power plant that burns forestry waste and two incineration plants
for municipal waste.ad) Refers to a cement factory which burns used tyres.ae) Refers to 3 incinerator plants for urban waste.af) 1000 t/yearag) Only concerns controlled landfill.ah) Of which 2 landfills for household waste and similar.ai) For householdl waste and similaraj) Installations for sorting.ak) 2nd category, type A landfills for inert waste.The number of landfills doesn't include MSW landfillal) MSW Incinaration plants.am) Estimatean) The apparently decreasing number of landfills not controlled is due to the fact that at some facilities open pit burning is
terminated and waste landfilled instead.Total number of waste treatment facilities has been decreasing during the decade of report as municipalities tend tomerge their waste management activities in bigger units with combined recycling and disposal
ao) All figures for 2001 are preliminary.ap) Plants permitted to treat municipal waste.aq) It includes: MSWI (n°43), Incinaration plants for non hazardous waste and incinaration plants for hazardous waste
(n°126)ar) Plants designed to incinerate municipal waste as main fuel (3 plants/2000) and coincineration plants (22 plants/2000).
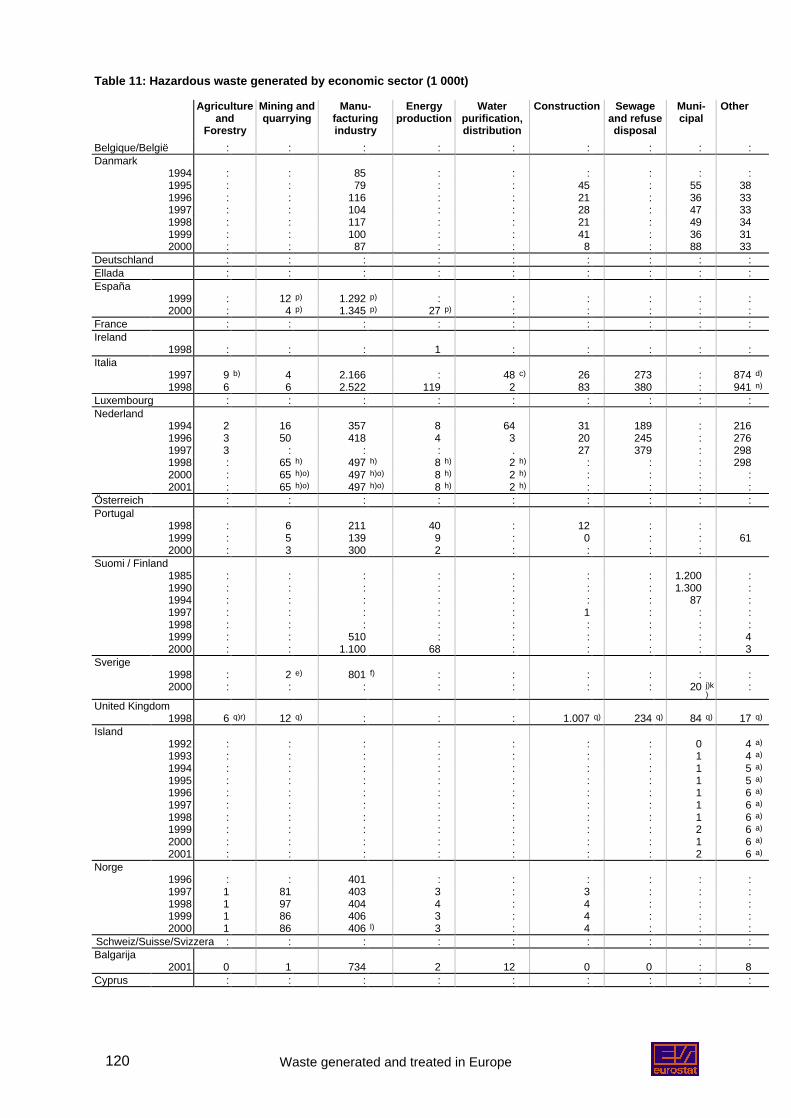
Waste generated and treated in Europe120
Table 11: Hazardous waste generated by economic sector (1 000t)
Agricultureand
Forestry
Mining andquarrying
Manu-facturingindustry
Energyproduction
Waterpurification,distribution
Construction Sewageand refusedisposal
Muni-cipal
Other
Belgique/België : : : : : : : : :Danmark
1994 : : 85 : : : : : :1995 : : 79 : : 45 : 55 381996 : : 116 : : 21 : 36 331997 : : 104 : : 28 : 47 331998 : : 117 : : 21 : 49 341999 : : 100 : : 41 : 36 312000 : : 87 : : 8 : 88 33
Deutschland : : : : : : : : :Ellada : : : : : : : : :España
1999 : 12 p) 1.292 p) : : : : : :2000 : 4 p) 1.345 p) 27 p) : : : : :
France : : : : : : : : :Ireland
1998 : : : 1 : : : : :Italia
1997 9 b) 4 2.166 : 48 c) 26 273 : 874 d)
1998 6 6 2.522 119 2 83 380 : 941 n)
Luxembourg : : : : : : : : :Nederland
1994 2 16 357 8 64 31 189 : 2161996 3 50 418 4 3 20 245 : 2761997 3 : : : . 27 379 : 2981998 : 65 h) 497 h) 8 h) 2 h) : : : 2982000 : 65 h)o) 497 h)o) 8 h) 2 h) : : : :2001 : 65 h)o) 497 h)o) 8 h) 2 h) : : : :
Österreich : : : : : : : : :Portugal
1998 : 6 211 40 : 12 : :1999 : 5 139 9 : 0 : : 612000 : 3 300 2 : : : :
Suomi / Finland1985 : : : : : : : 1.200 :1990 : : : : : : : 1.300 :1994 : : : : : : : 87 :1997 : : : : : 1 : : :1998 : : : : : : : : :1999 : : 510 : : : : : 42000 : : 1.100 68 : : : : 3
Sverige1998 : 2 e) 801 f) : : : : : :2000 : : : : : : : 20 j)k
):
United Kingdom1998 6 q)r) 12 q) : : : 1.007 q) 234 q) 84 q) 17 q)
Island1992 : : : : : : : 0 4 a)
1993 : : : : : : : 1 4 a)
1994 : : : : : : : 1 5 a)
1995 : : : : : : : 1 5 a)
1996 : : : : : : : 1 6 a)
1997 : : : : : : : 1 6 a)
1998 : : : : : : : 1 6 a)
1999 : : : : : : : 2 6 a)
2000 : : : : : : : 1 6 a)
2001 : : : : : : : 2 6 a)
Norge1996 : : 401 : : : : : :1997 1 81 403 3 : 3 : : :1998 1 97 404 4 : 4 : : :1999 1 86 406 3 : 4 : : :2000 1 86 406 l) 3 : 4 : : :
Schweiz/Suisse/Svizzera : : : : : : : : :Balgarija
2001 0 1 734 2 12 0 0 : 8Cyprus : : : : : : : : :
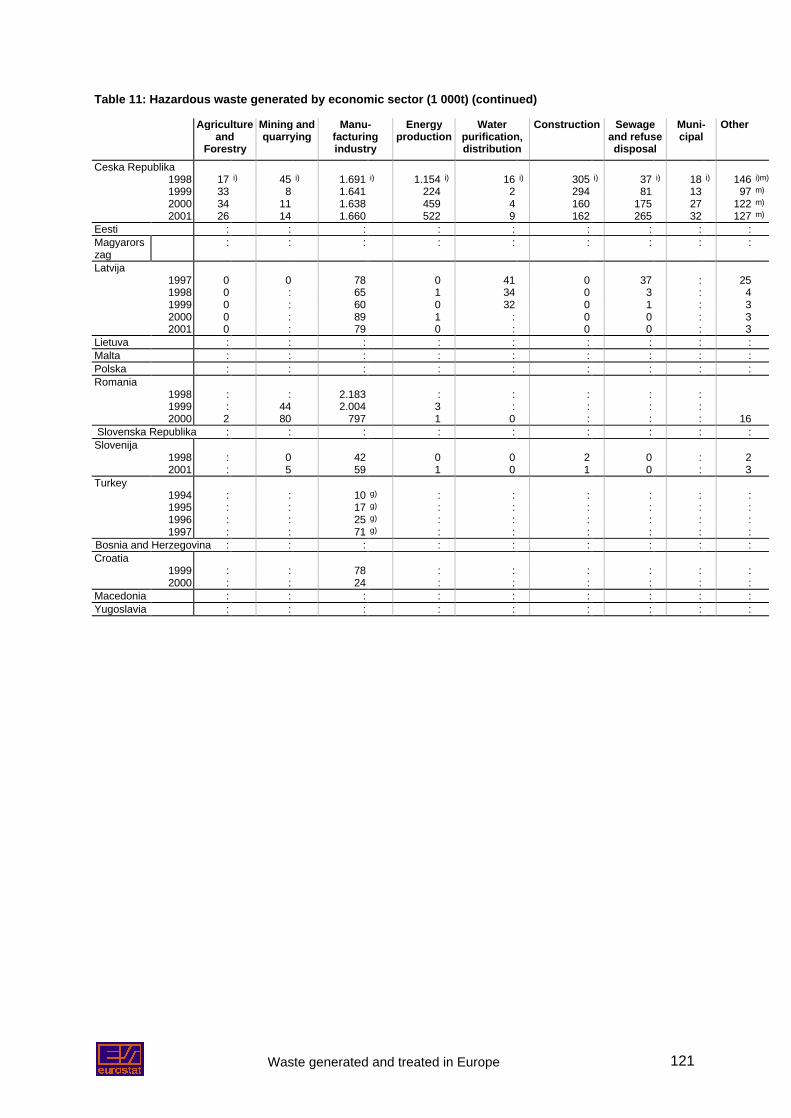
Waste generated and treated in Europe 121
Table 11: Hazardous waste generated by economic sector (1 000t) (continued)
Agricultureand
Forestry
Mining andquarrying
Manu-facturingindustry
Energyproduction
Waterpurification,distribution
Construction Sewageand refusedisposal
Muni-cipal
Other
Ceska Republika1998 17 i) 45 i) 1.691 i) 1.154 i) 16 i) 305 i) 37 i) 18 i) 146 i)m)
1999 33 8 1.641 224 2 294 81 13 97 m)
2000 34 11 1.638 459 4 160 175 27 122 m)
2001 26 14 1.660 522 9 162 265 32 127 m)
Eesti : : : : : : : : :Magyarorszag
: : : : : : : : :
Latvija1997 0 0 78 0 41 0 37 : 251998 0 : 65 1 34 0 3 : 41999 0 : 60 0 32 0 1 : 32000 0 : 89 1 : 0 0 : 32001 0 : 79 0 : 0 0 : 3
Lietuva : : : : : : : : :Malta : : : : : : : : :Polska : : : : : : : : :Romania
1998 : : 2.183 : : : : :1999 : 44 2.004 3 : : : :2000 2 80 797 1 0 : : : 16
Slovenska Republika : : : : : : : : :Slovenija
1998 : 0 42 0 0 2 0 : 22001 : 5 59 1 0 1 0 : 3
Turkey1994 : : 10 g) : : : : : :1995 : : 17 g) : : : : : :1996 : : 25 g) : : : : : :1997 : : 71 g) : : : : : :
Bosnia and Herzegovina : : : : : : : : :Croatia
1999 : : 78 : : : : : :2000 : : 24 : : : : : :
Macedonia : : : : : : : : :Yugoslavia : : : : : : : : :
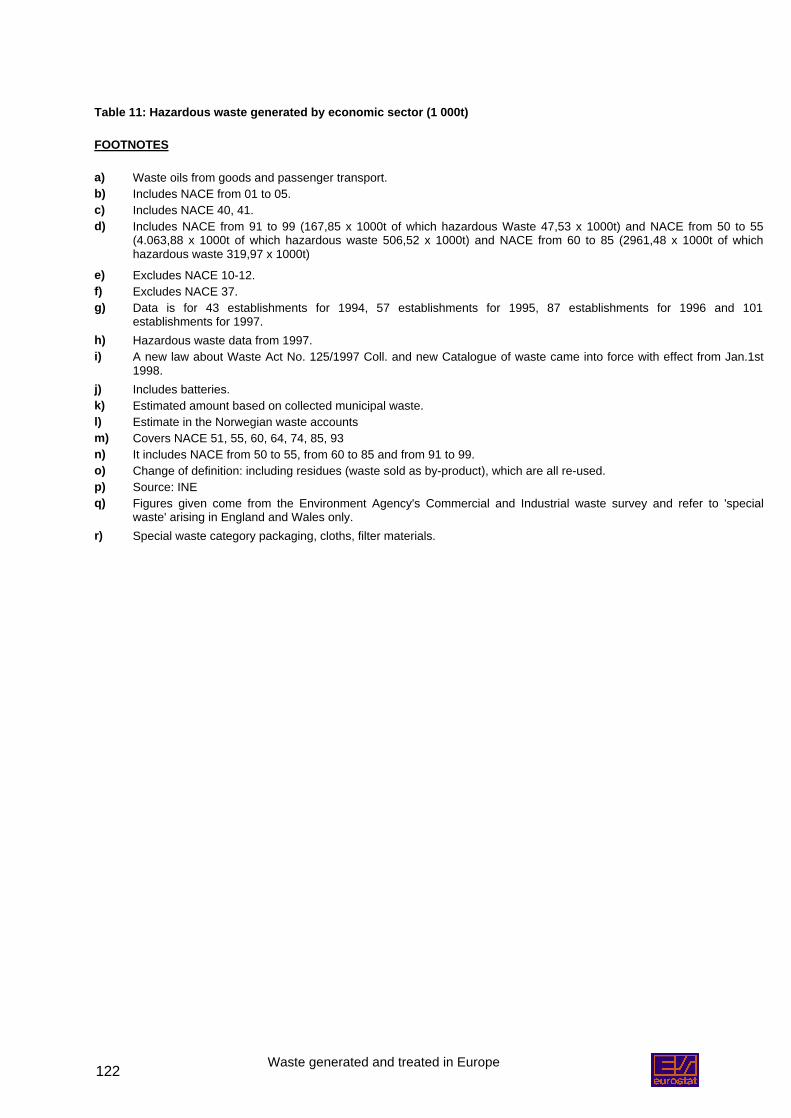
Waste generated and treated in Europe122
Table 11: Hazardous waste generated by economic sector (1 000t)
FOOTNOTES
a) Waste oils from goods and passenger transport.b) Includes NACE from 01 to 05.c) Includes NACE 40, 41.d) Includes NACE from 91 to 99 (167,85 x 1000t of which hazardous Waste 47,53 x 1000t) and NACE from 50 to 55
(4.063,88 x 1000t of which hazardous waste 506,52 x 1000t) and NACE from 60 to 85 (2961,48 x 1000t of whichhazardous waste 319,97 x 1000t)
e) Excludes NACE 10-12.f) Excludes NACE 37.g) Data is for 43 establishments for 1994, 57 establishments for 1995, 87 establishments for 1996 and 101
establishments for 1997.h) Hazardous waste data from 1997.i) A new law about Waste Act No. 125/1997 Coll. and new Catalogue of waste came into force with effect from Jan.1st
1998.j) Includes batteries.k) Estimated amount based on collected municipal waste.l) Estimate in the Norwegian waste accountsm) Covers NACE 51, 55, 60, 64, 74, 85, 93n) It includes NACE from 50 to 55, from 60 to 85 and from 91 to 99.o) Change of definition: including residues (waste sold as by-product), which are all re-used.p) Source: INEq) Figures given come from the Environment Agency's Commercial and Industrial waste survey and refer to 'special
waste' arising in England and Wales only.r) Special waste category packaging, cloths, filter materials.
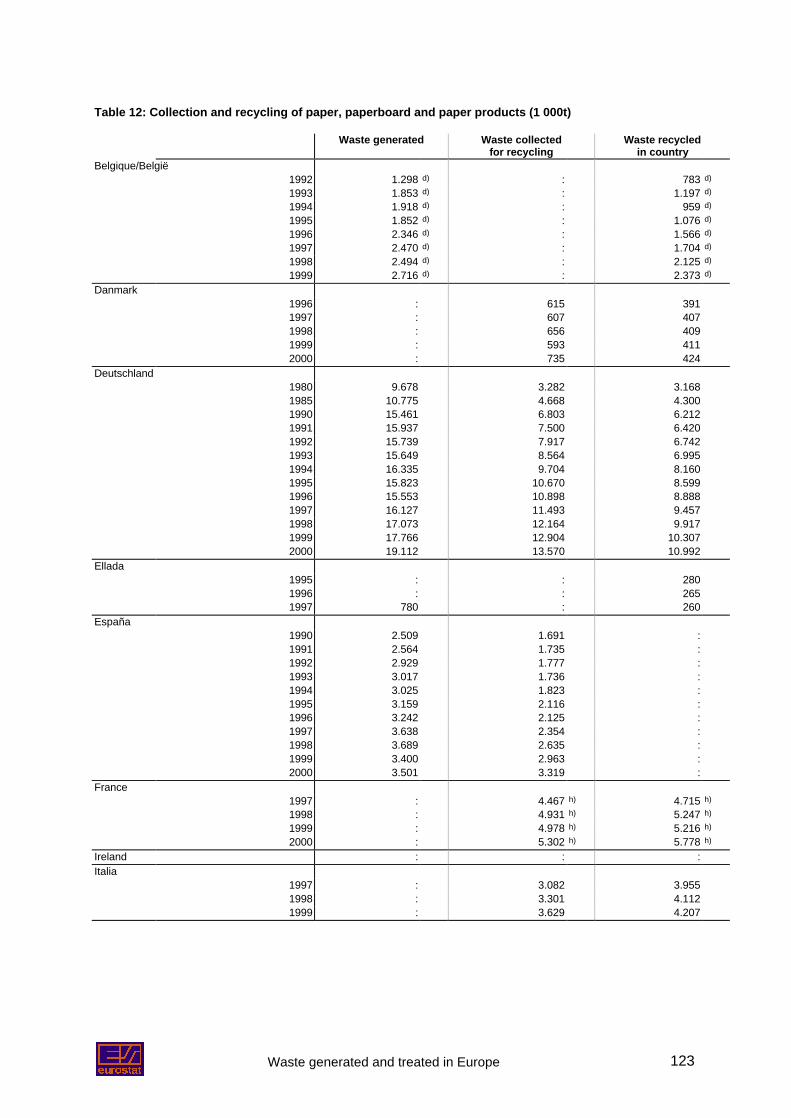
Waste generated and treated in Europe 123
Table 12: Collection and recycling of paper, paperboard and paper products (1 000t)
Waste generated Waste collectedfor recycling
Waste recycledin country
Belgique/België1992 1.298 d) : 783 d)
1993 1.853 d) : 1.197 d)
1994 1.918 d) : 959 d)
1995 1.852 d) : 1.076 d)
1996 2.346 d) : 1.566 d)
1997 2.470 d) : 1.704 d)
1998 2.494 d) : 2.125 d)
1999 2.716 d) : 2.373 d)
Danmark1996 : 615 3911997 : 607 4071998 : 656 4091999 : 593 4112000 : 735 424
Deutschland1980 9.678 3.282 3.1681985 10.775 4.668 4.3001990 15.461 6.803 6.2121991 15.937 7.500 6.4201992 15.739 7.917 6.7421993 15.649 8.564 6.9951994 16.335 9.704 8.1601995 15.823 10.670 8.5991996 15.553 10.898 8.8881997 16.127 11.493 9.4571998 17.073 12.164 9.9171999 17.766 12.904 10.3072000 19.112 13.570 10.992
Ellada1995 : : 2801996 : : 2651997 780 : 260
España1990 2.509 1.691 :1991 2.564 1.735 :1992 2.929 1.777 :1993 3.017 1.736 :1994 3.025 1.823 :1995 3.159 2.116 :1996 3.242 2.125 :1997 3.638 2.354 :1998 3.689 2.635 :1999 3.400 2.963 :2000 3.501 3.319 :
France1997 : 4.467 h) 4.715 h)
1998 : 4.931 h) 5.247 h)
1999 : 4.978 h) 5.216 h)
2000 : 5.302 h) 5.778 h)
Ireland : : :Italia
1997 : 3.082 3.9551998 : 3.301 4.1121999 : 3.629 4.207
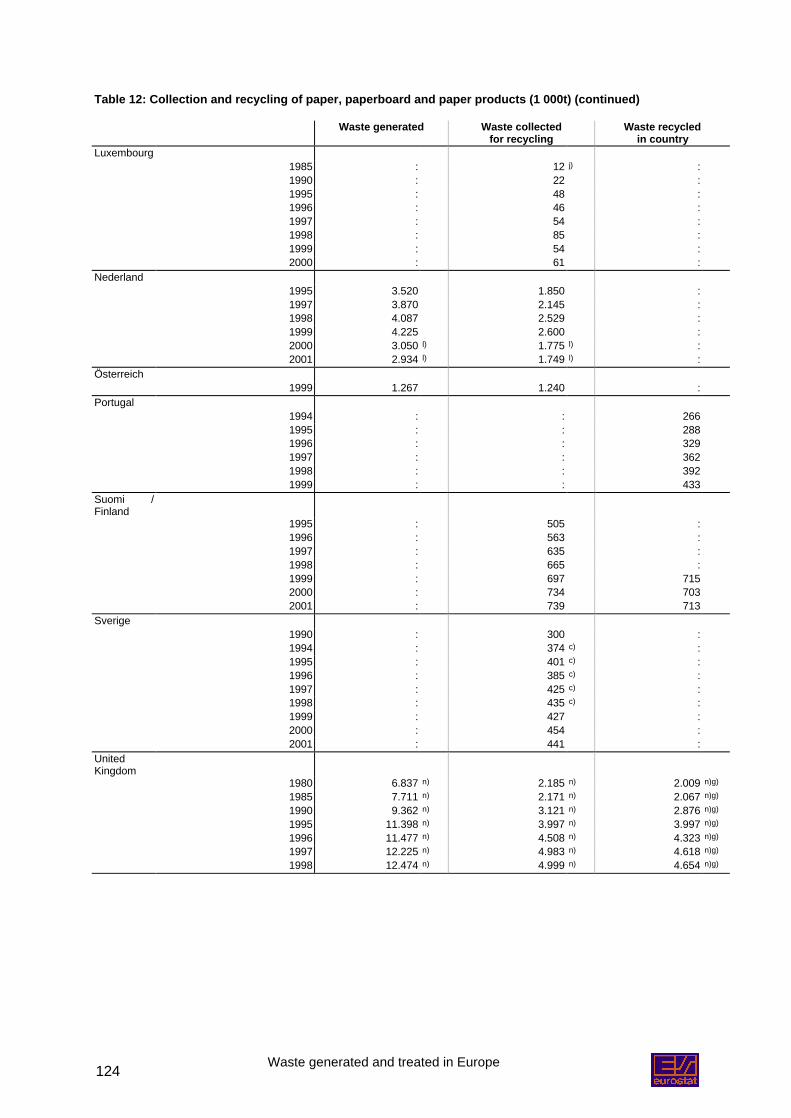
Waste generated and treated in Europe124
Table 12: Collection and recycling of paper, paperboard and paper products (1 000t) (continued)
Waste generated Waste collectedfor recycling
Waste recycledin country
Luxembourg1985 : 12 j) :1990 : 22 :1995 : 48 :1996 : 46 :1997 : 54 :1998 : 85 :1999 : 54 :2000 : 61 :
Nederland1995 3.520 1.850 :1997 3.870 2.145 :1998 4.087 2.529 :1999 4.225 2.600 :2000 3.050 l) 1.775 l) :2001 2.934 l) 1.749 l) :
Österreich1999 1.267 1.240 :
Portugal1994 : : 2661995 : : 2881996 : : 3291997 : : 3621998 : : 3921999 : : 433
Suomi /Finland
1995 : 505 :1996 : 563 :1997 : 635 :1998 : 665 :1999 : 697 7152000 : 734 7032001 : 739 713
Sverige1990 : 300 :1994 : 374 c) :1995 : 401 c) :1996 : 385 c) :1997 : 425 c) :1998 : 435 c) :1999 : 427 :2000 : 454 :2001 : 441 :
UnitedKingdom
1980 6.837 n) 2.185 n) 2.009 n)g)
1985 7.711 n) 2.171 n) 2.067 n)g)
1990 9.362 n) 3.121 n) 2.876 n)g)
1995 11.398 n) 3.997 n) 3.997 n)g)
1996 11.477 n) 4.508 n) 4.323 n)g)
1997 12.225 n) 4.983 n) 4.618 n)g)
1998 12.474 n) 4.999 n) 4.654 n)g)
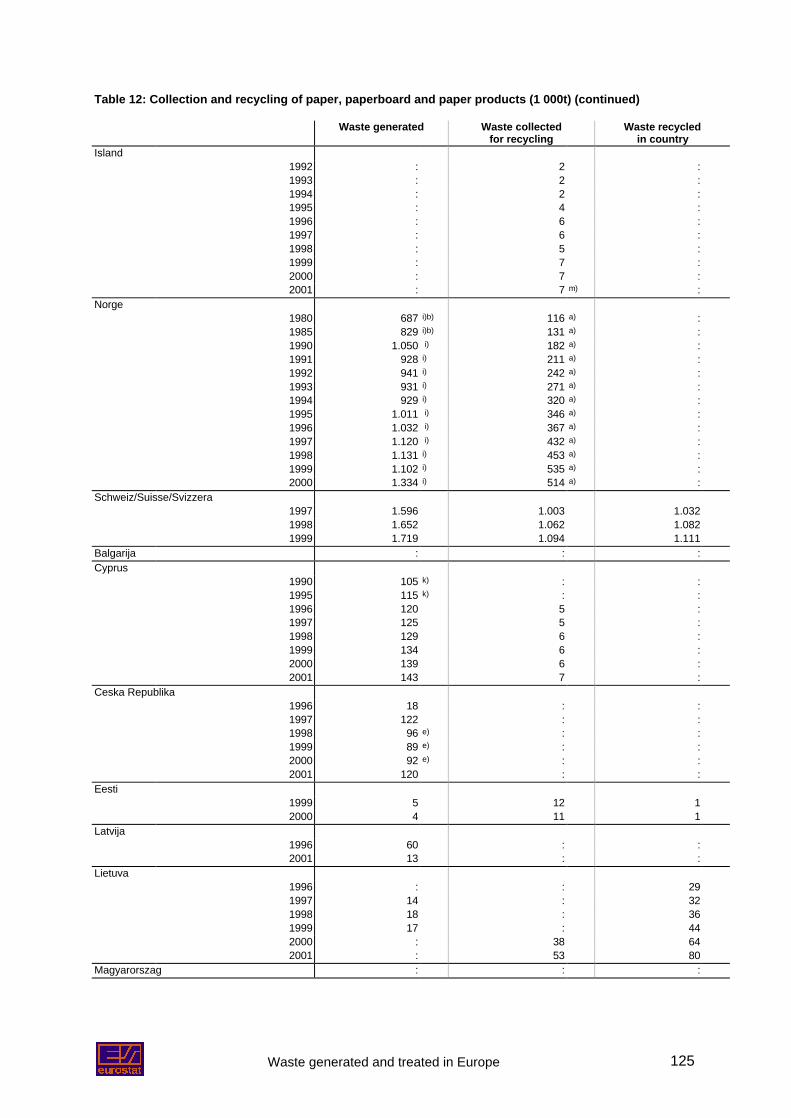
Waste generated and treated in Europe 125
Table 12: Collection and recycling of paper, paperboard and paper products (1 000t) (continued)
Waste generated Waste collectedfor recycling
Waste recycledin country
Island1992 : 2 :1993 : 2 :1994 : 2 :1995 : 4 :1996 : 6 :1997 : 6 :1998 : 5 :1999 : 7 :2000 : 7 :2001 : 7 m) :
Norge1980 687 i)b) 116 a) :1985 829 i)b) 131 a) :1990 1.050 i) 182 a) :1991 928 i) 211 a) :1992 941 i) 242 a) :1993 931 i) 271 a) :1994 929 i) 320 a) :1995 1.011 i) 346 a) :1996 1.032 i) 367 a) :1997 1.120 i) 432 a) :1998 1.131 i) 453 a) :1999 1.102 i) 535 a) :2000 1.334 i) 514 a) :
Schweiz/Suisse/Svizzera1997 1.596 1.003 1.0321998 1.652 1.062 1.0821999 1.719 1.094 1.111
Balgarija : : :Cyprus
1990 105 k) : :1995 115 k) : :1996 120 5 :1997 125 5 :1998 129 6 :1999 134 6 :2000 139 6 :2001 143 7 :
Ceska Republika1996 18 : :1997 122 : :1998 96 e) : :1999 89 e) : :2000 92 e) : :2001 120 : :
Eesti1999 5 12 12000 4 11 1
Latvija1996 60 : :2001 13 : :
Lietuva1996 : : 291997 14 : 321998 18 : 361999 17 : 442000 : 38 642001 : 53 80
Magyarorszag : : :
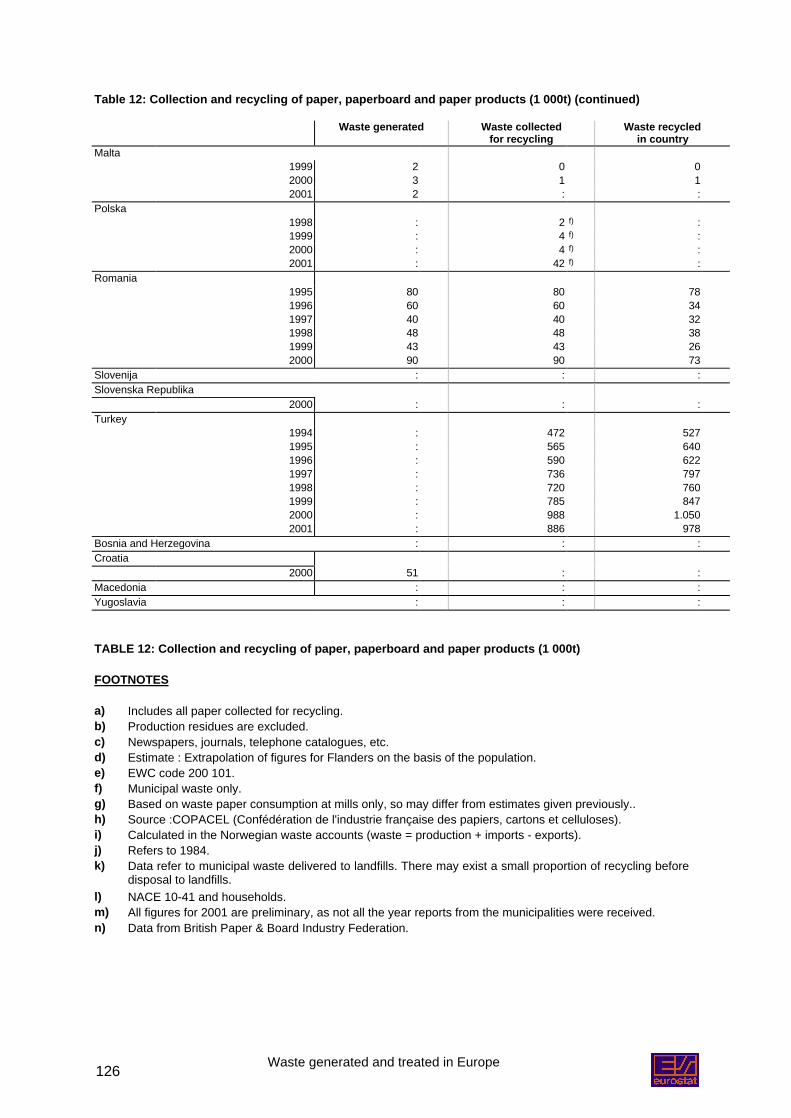
Waste generated and treated in Europe126
Table 12: Collection and recycling of paper, paperboard and paper products (1 000t) (continued)
Waste generated Waste collectedfor recycling
Waste recycledin country
Malta1999 2 0 02000 3 1 12001 2 : :
Polska1998 : 2 f) :1999 : 4 f) :2000 : 4 f) :2001 : 42 f) :
Romania1995 80 80 781996 60 60 341997 40 40 321998 48 48 381999 43 43 262000 90 90 73
Slovenija : : :Slovenska Republika
2000 : : :Turkey
1994 : 472 5271995 : 565 6401996 : 590 6221997 : 736 7971998 : 720 7601999 : 785 8472000 : 988 1.0502001 : 886 978
Bosnia and Herzegovina : : :Croatia
2000 51 : :Macedonia : : :Yugoslavia : : :
TABLE 12: Collection and recycling of paper, paperboard and paper products (1 000t)
FOOTNOTES
a) Includes all paper collected for recycling.b) Production residues are excluded.c) Newspapers, journals, telephone catalogues, etc.d) Estimate : Extrapolation of figures for Flanders on the basis of the population.e) EWC code 200 101.f) Municipal waste only.g) Based on waste paper consumption at mills only, so may differ from estimates given previously..h) Source :COPACEL (Confédération de l'industrie française des papiers, cartons et celluloses).i) Calculated in the Norwegian waste accounts (waste = production + imports - exports).j) Refers to 1984.k) Data refer to municipal waste delivered to landfills. There may exist a small proportion of recycling before
disposal to landfills.l) NACE 10-41 and households.m) All figures for 2001 are preliminary, as not all the year reports from the municipalities were received.n) Data from British Paper & Board Industry Federation.

Waste generated and treated in Europe 127
Table 13: Collection and recycling of glass (1 000t)
Waste generated Waste collected forrecycling
Waste recycled incountry
Belgique/België1992 383 d) : 245 d)
1993 388 d) : 243 d)
1994 493 d) : 320 d)
1995 445 d) : 335 d)
1996 481 d) : 398 d)
1997 400 d) : 338 d)
1998 534 d) : 476 d)
1999 658 d) : 570 d)
Danmark1996 : 126 781997 : 115 801998 : 126 821999 : 126 852000 : 129 83
Deutschland1990 4.205 : :1991 4.637 2.495 :1992 4.426 2.576 :1993 4.223 2.809 :1994 4.127 2.857 :1995 3.954 3.004 :1996 3.811 3.145 :1997 3.750 3.147 2.9241998 4.165 3.460 3.2622000 4.147 3.530 3.317
Ellada1995 : : 401996 : : 391997 176 : 40
España1990 981 304 :1991 1.003 310 :1992 958 312 :1993 981 328 :1994 984 371 :1995 1.033 402 :1996 1.060 456 :1997 1.190 521 :1998 1.207 567 :1999 1.397 575 :2000 1.438 481 :
France1997 : : 1.400 d)
1998 : : 1.550 d)
1999 : : 1.650 d)
2000 : : 1.840 d)
Ireland : : :Italia
1997 : 920 1.0001998 : 920 1.0201999 : 960 1.060
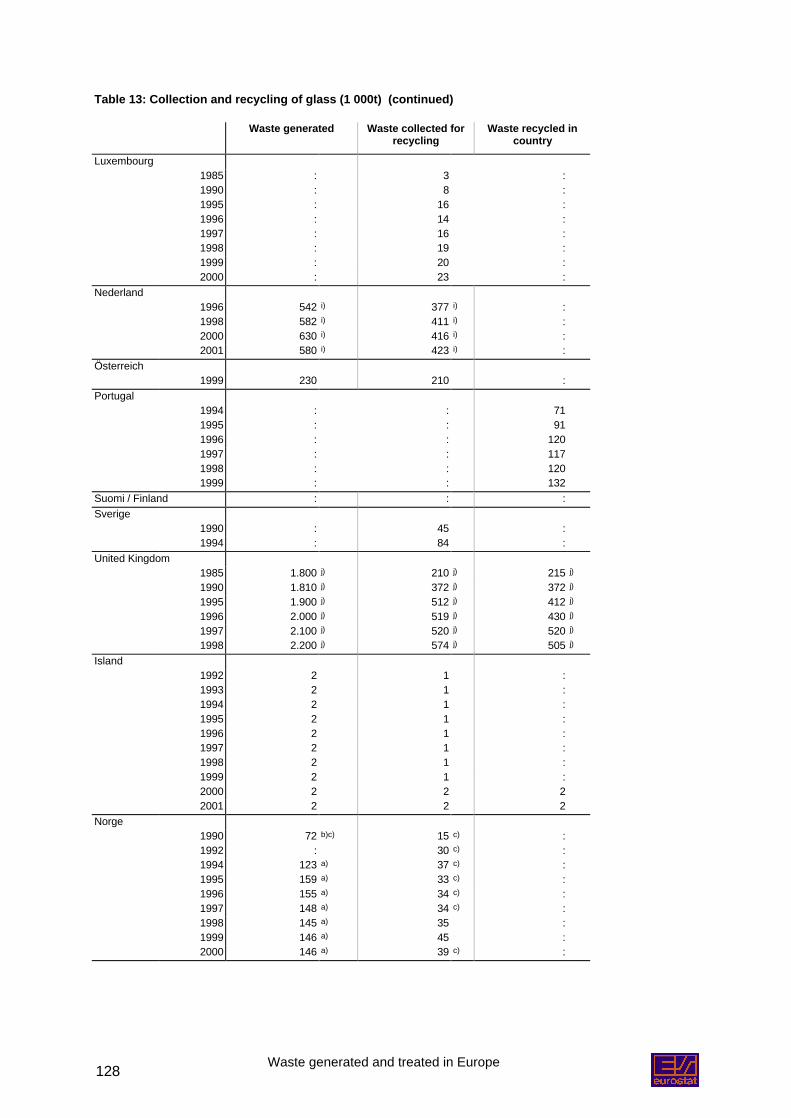
Waste generated and treated in Europe128
Table 13: Collection and recycling of glass (1 000t) (continued)
Waste generated Waste collected forrecycling
Waste recycled incountry
Luxembourg1985 : 3 :1990 : 8 :1995 : 16 :1996 : 14 :1997 : 16 :1998 : 19 :1999 : 20 :2000 : 23 :
Nederland1996 542 i) 377 i) :1998 582 i) 411 i) :2000 630 i) 416 i) :2001 580 i) 423 i) :
Österreich1999 230 210 :
Portugal1994 : : 711995 : : 911996 : : 1201997 : : 1171998 : : 1201999 : : 132
Suomi / Finland : : :Sverige
1990 : 45 :1994 : 84 :
United Kingdom1985 1.800 j) 210 j) 215 j)
1990 1.810 j) 372 j) 372 j)
1995 1.900 j) 512 j) 412 j)
1996 2.000 j) 519 j) 430 j)
1997 2.100 j) 520 j) 520 j)
1998 2.200 j) 574 j) 505 j)
Island1992 2 1 :1993 2 1 :1994 2 1 :1995 2 1 :1996 2 1 :1997 2 1 :1998 2 1 :1999 2 1 :2000 2 2 22001 2 2 2
Norge1990 72 b)c) 15 c) :1992 : 30 c) :1994 123 a) 37 c) :1995 159 a) 33 c) :1996 155 a) 34 c) :1997 148 a) 34 c) :1998 145 a) 35 :1999 146 a) 45 :2000 146 a) 39 c) :
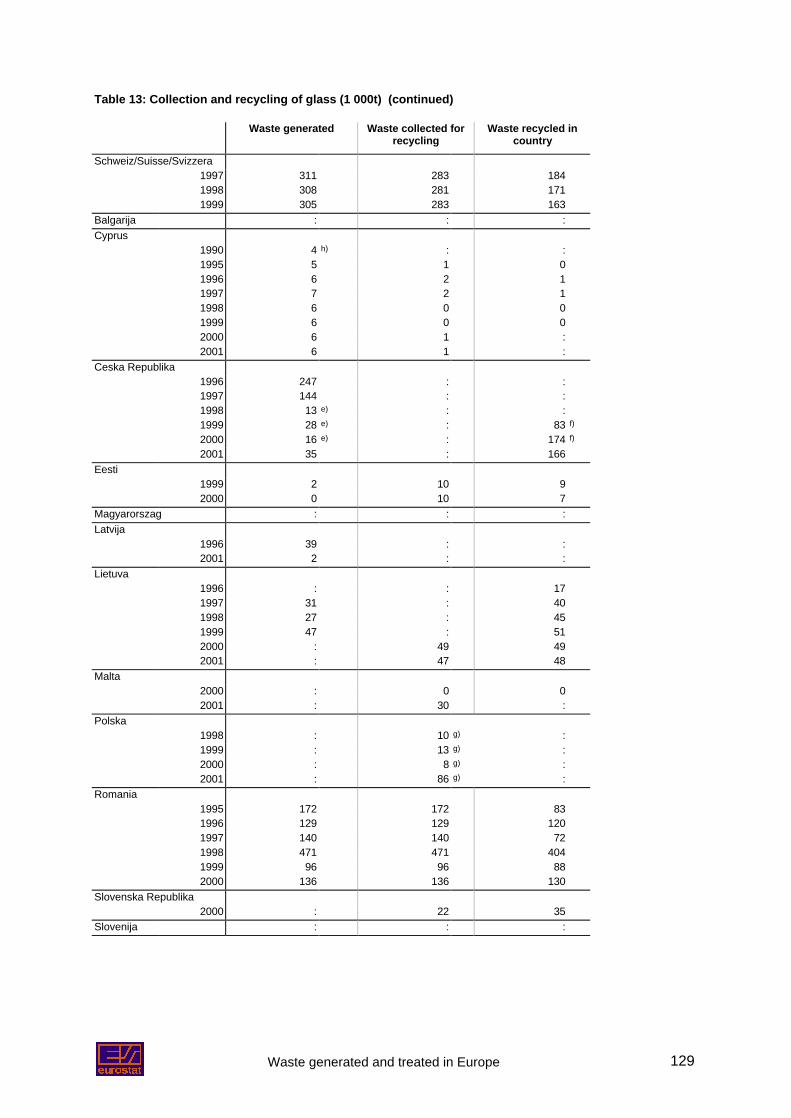
Waste generated and treated in Europe 129
Table 13: Collection and recycling of glass (1 000t) (continued)
Waste generated Waste collected forrecycling
Waste recycled incountry
Schweiz/Suisse/Svizzera1997 311 283 1841998 308 281 1711999 305 283 163
Balgarija : : :Cyprus
1990 4 h) : :1995 5 1 01996 6 2 11997 7 2 11998 6 0 01999 6 0 02000 6 1 :2001 6 1 :
Ceska Republika1996 247 : :1997 144 : :1998 13 e) : :1999 28 e) : 83 f)
2000 16 e) : 174 f)
2001 35 : 166Eesti
1999 2 10 92000 0 10 7
Magyarorszag : : :Latvija
1996 39 : :2001 2 : :
Lietuva1996 : : 171997 31 : 401998 27 : 451999 47 : 512000 : 49 492001 : 47 48
Malta2000 : 0 02001 : 30 :
Polska1998 : 10 g) :1999 : 13 g) :2000 : 8 g) :2001 : 86 g) :
Romania1995 172 172 831996 129 129 1201997 140 140 721998 471 471 4041999 96 96 882000 136 136 130
Slovenska Republika2000 : 22 35
Slovenija : : :
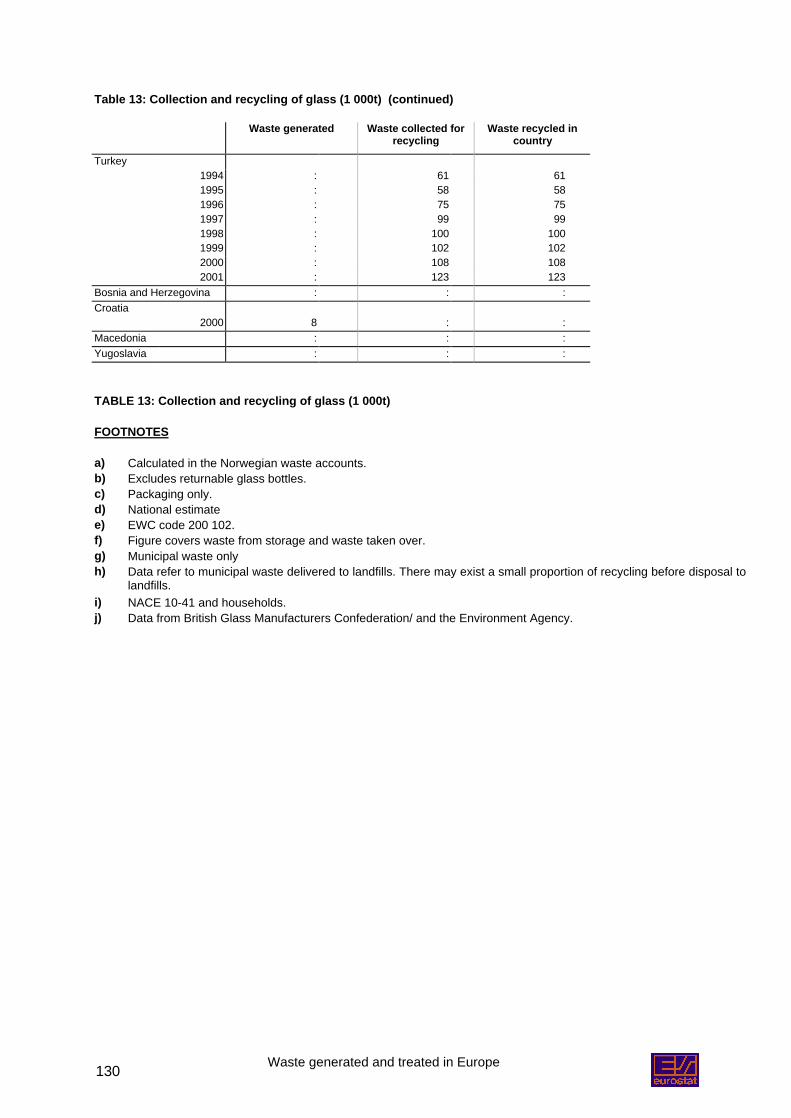
Waste generated and treated in Europe130
Table 13: Collection and recycling of glass (1 000t) (continued)
Waste generated Waste collected forrecycling
Waste recycled incountry
Turkey1994 : 61 611995 : 58 581996 : 75 751997 : 99 991998 : 100 1001999 : 102 1022000 : 108 1082001 : 123 123
Bosnia and Herzegovina : : :Croatia
2000 8 : :Macedonia : : :Yugoslavia : : :
TABLE 13: Collection and recycling of glass (1 000t)
FOOTNOTES
a) Calculated in the Norwegian waste accounts.b) Excludes returnable glass bottles.c) Packaging only.d) National estimatee) EWC code 200 102.f) Figure covers waste from storage and waste taken over.g) Municipal waste onlyh) Data refer to municipal waste delivered to landfills. There may exist a small proportion of recycling before disposal to
landfills.i) NACE 10-41 and households.j) Data from British Glass Manufacturers Confederation/ and the Environment Agency.
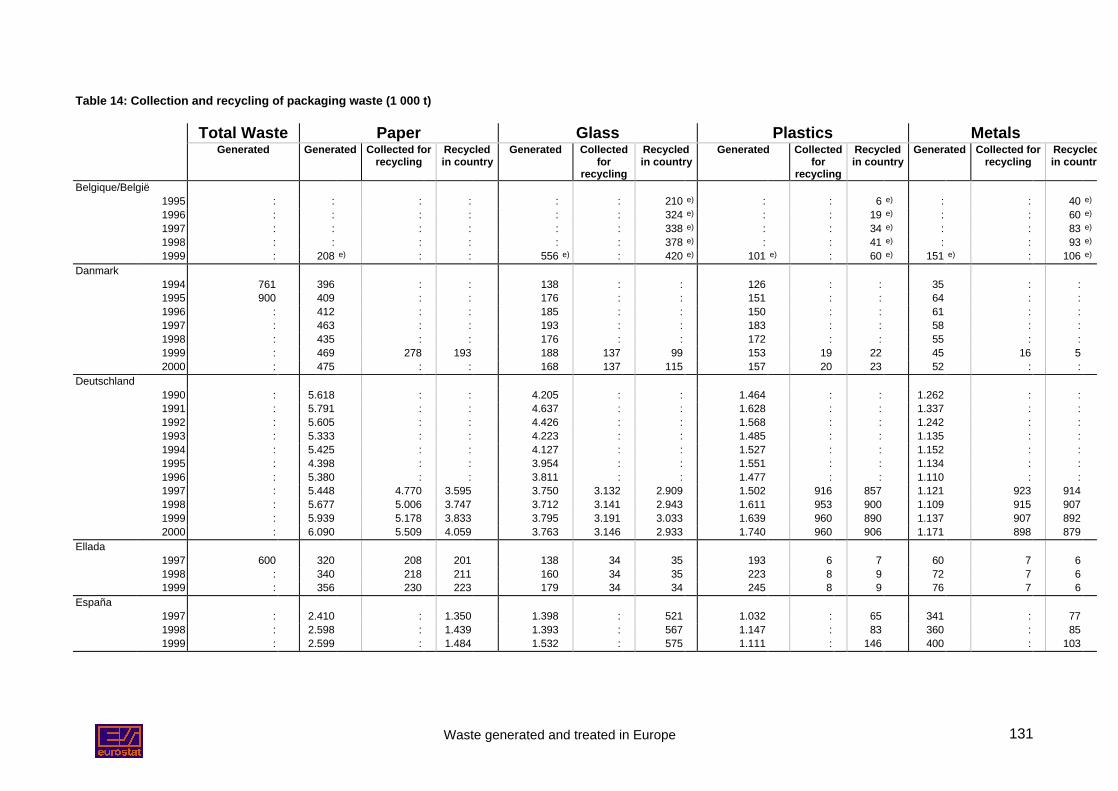
Waste generated and treated in Europe 131
Table 14: Collection and recycling of packaging waste (1 000 t)
Total Waste Paper Glass Plastics MetalsGenerated Generated Collected for
recyclingRecycledin country
Generated Collectedfor
recycling
Recycledin country
Generated Collectedfor
recycling
Recycledin country
Generated Collected forrecycling
Recycledin country
Belgique/België1995 : : : : : : 210 e) : : 6 e) : : 40 e)
1996 : : : : : : 324 e) : : 19 e) : : 60 e)
1997 : : : : : : 338 e) : : 34 e) : : 83 e)
1998 : : : : : : 378 e) : : 41 e) : : 93 e)
1999 : 208 e) : : 556 e) : 420 e) 101 e) : 60 e) 151 e) : 106 e)
Danmark1994 761 396 : : 138 : : 126 : : 35 : :1995 900 409 : : 176 : : 151 : : 64 : :1996 : 412 : : 185 : : 150 : : 61 : :1997 : 463 : : 193 : : 183 : : 58 : :1998 : 435 : : 176 : : 172 : : 55 : :1999 : 469 278 193 188 137 99 153 19 22 45 16 52000 : 475 : : 168 137 115 157 20 23 52 : :
Deutschland1990 : 5.618 : : 4.205 : : 1.464 : : 1.262 : :1991 : 5.791 : : 4.637 : : 1.628 : : 1.337 : :1992 : 5.605 : : 4.426 : : 1.568 : : 1.242 : :1993 : 5.333 : : 4.223 : : 1.485 : : 1.135 : :1994 : 5.425 : : 4.127 : : 1.527 : : 1.152 : :1995 : 4.398 : : 3.954 : : 1.551 : : 1.134 : :1996 : 5.380 : : 3.811 : : 1.477 : : 1.110 : :1997 : 5.448 4.770 3.595 3.750 3.132 2.909 1.502 916 857 1.121 923 9141998 : 5.677 5.006 3.747 3.712 3.141 2.943 1.611 953 900 1.109 915 9071999 : 5.939 5.178 3.833 3.795 3.191 3.033 1.639 960 890 1.137 907 8922000 : 6.090 5.509 4.059 3.763 3.146 2.933 1.740 960 906 1.171 898 879
Ellada1997 600 320 208 201 138 34 35 193 6 7 60 7 61998 : 340 218 211 160 34 35 223 8 9 72 7 61999 : 356 230 223 179 34 34 245 8 9 76 7 6
España1997 : 2.410 : 1.350 1.398 : 521 1.032 : 65 341 : 771998 : 2.598 : 1.439 1.393 : 567 1.147 : 83 360 : 851999 : 2.599 : 1.484 1.532 : 575 1.111 : 146 400 : 103
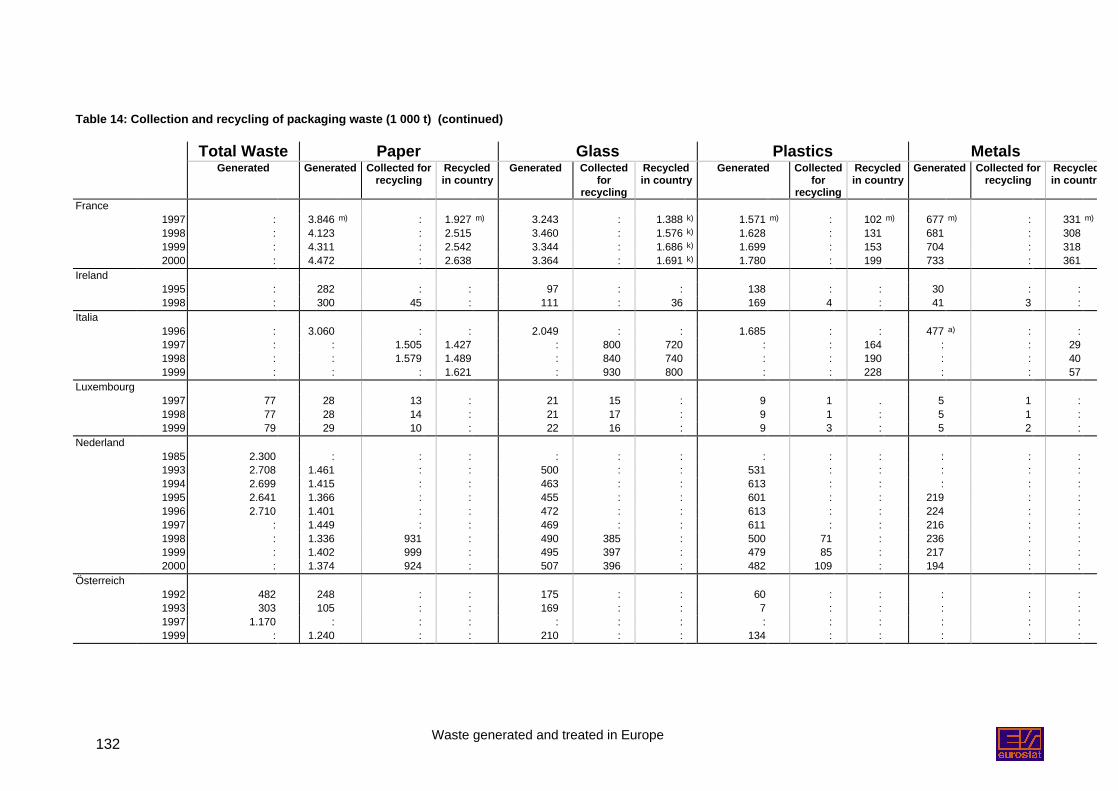
Waste generated and treated in Europe132
Table 14: Collection and recycling of packaging waste (1 000 t) (continued)
Total Waste Paper Glass Plastics MetalsGenerated Generated Collected for
recyclingRecycledin country
Generated Collectedfor
recycling
Recycledin country
Generated Collectedfor
recycling
Recycledin country
Generated Collected forrecycling
Recycledin country
France1997 : 3.846 m) : 1.927 m) 3.243 : 1.388 k) 1.571 m) : 102 m) 677 m) : 331 m)
1998 : 4.123 : 2.515 3.460 : 1.576 k) 1.628 : 131 681 : 3081999 : 4.311 : 2.542 3.344 : 1.686 k) 1.699 : 153 704 : 3182000 : 4.472 : 2.638 3.364 : 1.691 k) 1.780 : 199 733 : 361
Ireland1995 : 282 : : 97 : : 138 : : 30 : :1998 : 300 45 : 111 : 36 169 4 : 41 3 :
Italia1996 : 3.060 : : 2.049 : : 1.685 : : 477 a) : :1997 : : 1.505 1.427 : 800 720 : : 164 : : 291998 : : 1.579 1.489 : 840 740 : : 190 : : 401999 : : : 1.621 : 930 800 : : 228 : : 57
Luxembourg1997 77 28 13 : 21 15 : 9 1 . 5 1 :1998 77 28 14 : 21 17 : 9 1 : 5 1 :1999 79 29 10 : 22 16 : 9 3 : 5 2 :
Nederland1985 2.300 : : : : : : : : : : : :1993 2.708 1.461 : : 500 : : 531 : : : : :1994 2.699 1.415 : : 463 : : 613 : : : : :1995 2.641 1.366 : : 455 : : 601 : : 219 : :1996 2.710 1.401 : : 472 : : 613 : : 224 : :1997 : 1.449 : : 469 : : 611 : : 216 : :1998 : 1.336 931 : 490 385 : 500 71 : 236 : :1999 : 1.402 999 : 495 397 : 479 85 : 217 : :2000 : 1.374 924 : 507 396 : 482 109 : 194 : :
Österreich1992 482 248 : : 175 : : 60 : : : : :1993 303 105 : : 169 : : 7 : : : : :1997 1.170 : : : : : : : : : : : :1999 : 1.240 : : 210 : : 134 : : : : :
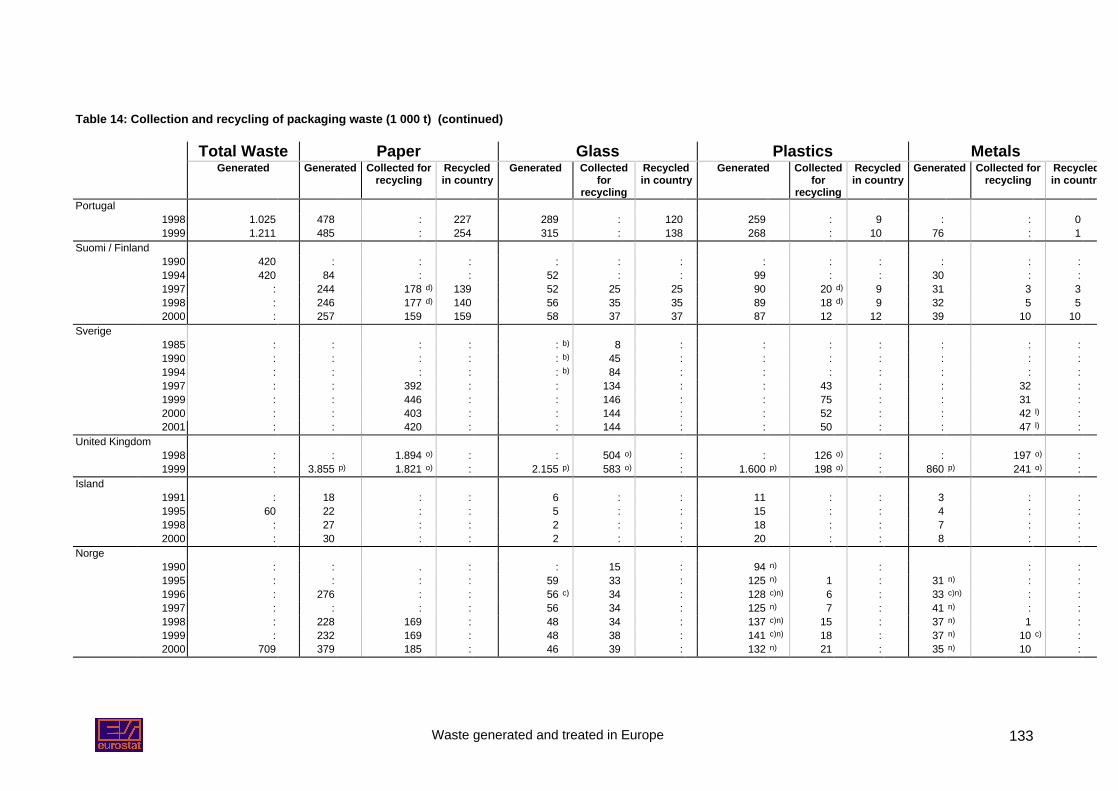
Waste generated and treated in Europe 133
Table 14: Collection and recycling of packaging waste (1 000 t) (continued)
Total Waste Paper Glass Plastics MetalsGenerated Generated Collected for
recyclingRecycledin country
Generated Collectedfor
recycling
Recycledin country
Generated Collectedfor
recycling
Recycledin country
Generated Collected forrecycling
Recycledin country
Portugal1998 1.025 478 : 227 289 : 120 259 : 9 : : 01999 1.211 485 : 254 315 : 138 268 : 10 76 : 1
Suomi / Finland1990 420 : : : : : : : : : : : :1994 420 84 : : 52 : : 99 : : 30 : :1997 : 244 178 d) 139 52 25 25 90 20 d) 9 31 3 31998 : 246 177 d) 140 56 35 35 89 18 d) 9 32 5 52000 : 257 159 159 58 37 37 87 12 12 39 10 10
Sverige1985 : : : : : b) 8 : : : : : : :1990 : : : : : b) 45 : : : : : : :1994 : : : : : b) 84 : : : : : : :1997 : : 392 : : 134 : : 43 : : 32 :1999 : : 446 : : 146 : : 75 : : 31 :2000 : : 403 : : 144 : : 52 : : 42 l) :2001 : : 420 : : 144 : : 50 : : 47 l) :
United Kingdom1998 : : 1.894 o) : : 504 o) : : 126 o) : : 197 o) :1999 : 3.855 p) 1.821 o) : 2.155 p) 583 o) : 1.600 p) 198 o) : 860 p) 241 o) :
Island1991 : 18 : : 6 : : 11 : : 3 : :1995 60 22 : : 5 : : 15 : : 4 : :1998 : 27 : : 2 : : 18 : : 7 : :2000 : 30 : : 2 : : 20 : : 8 : :
Norge1990 : : . : : 15 : 94 n) : : :1995 : : : : 59 33 : 125 n) 1 : 31 n) : :1996 : 276 : : 56 c) 34 : 128 c)n) 6 : 33 c)n) : :1997 : : : : 56 34 : 125 n) 7 : 41 n) : :1998 : 228 169 : 48 34 : 137 c)n) 15 : 37 n) 1 :1999 : 232 169 : 48 38 : 141 c)n) 18 : 37 n) 10 c) :2000 709 379 185 : 46 39 : 132 n) 21 : 35 n) 10 :
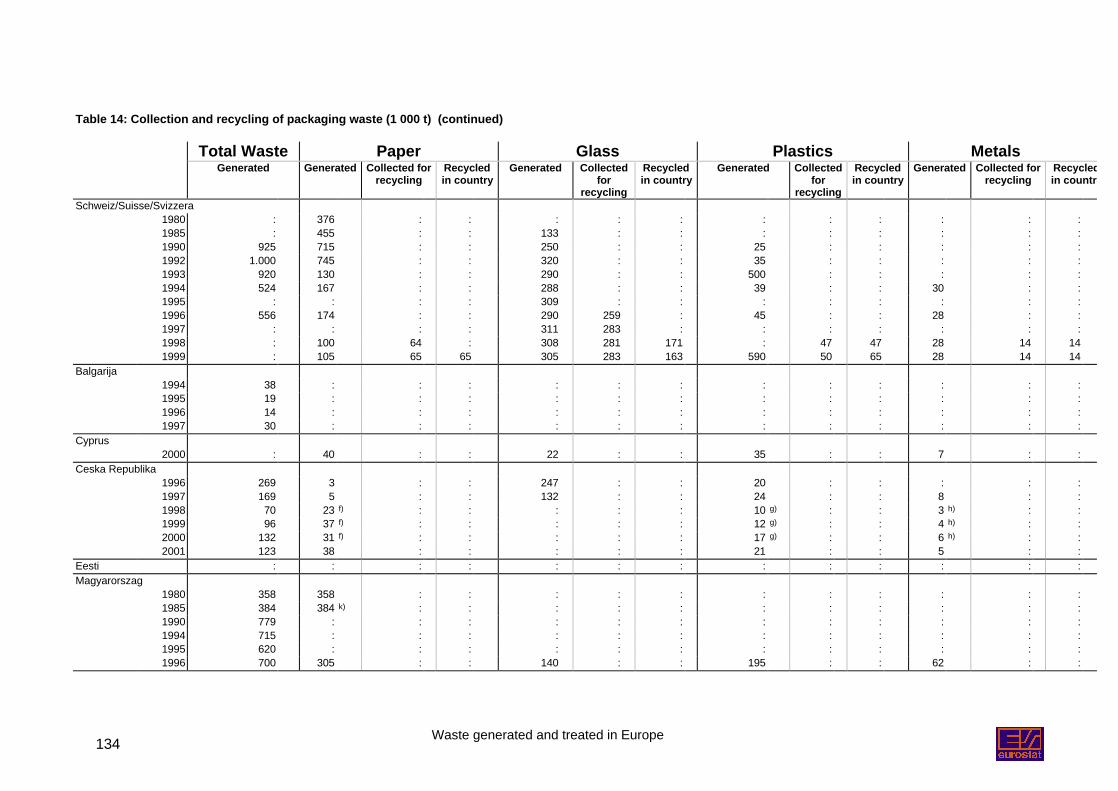
Waste generated and treated in Europe134
Table 14: Collection and recycling of packaging waste (1 000 t) (continued)
Total Waste Paper Glass Plastics MetalsGenerated Generated Collected for
recyclingRecycledin country
Generated Collectedfor
recycling
Recycledin country
Generated Collectedfor
recycling
Recycledin country
Generated Collected forrecycling
Recycledin country
Schweiz/Suisse/Svizzera1980 : 376 : : : : : : : : : : :1985 : 455 : : 133 : : : : : : : :1990 925 715 : : 250 : : 25 : : : : :1992 1.000 745 : : 320 : : 35 : : : : :1993 920 130 : : 290 : : 500 : : : : :1994 524 167 : : 288 : : 39 : : 30 : :1995 : : : : 309 : : : : : : : :1996 556 174 : : 290 259 : 45 : : 28 : :1997 : : : : 311 283 : : : : : : :1998 : 100 64 : 308 281 171 : 47 47 28 14 141999 : 105 65 65 305 283 163 590 50 65 28 14 14
Balgarija1994 38 : : : : : : : : : : : :1995 19 : : : : : : : : : : : :1996 14 : : : : : : : : : : : :1997 30 : : : : : : : : : : : :
Cyprus2000 : 40 : : 22 : : 35 : : 7 : :
Ceska Republika1996 269 3 : : 247 : : 20 : : : : :1997 169 5 : : 132 : : 24 : : 8 : :1998 70 23 f) : : : : : 10 g) : : 3 h) : :1999 96 37 f) : : : : : 12 g) : : 4 h) : :2000 132 31 f) : : : : : 17 g) : : 6 h) : :2001 123 38 : : : : : 21 : : 5 : :
Eesti : : : : : : : : : : : : :Magyarorszag
1980 358 358 : : : : : : : : : : :1985 384 384 k) : : : : : : : : : : :1990 779 : : : : : : : : : : : :1994 715 : : : : : : : : : : : :1995 620 : : : : : : : : : : : :1996 700 305 : : 140 : : 195 : : 62 : :
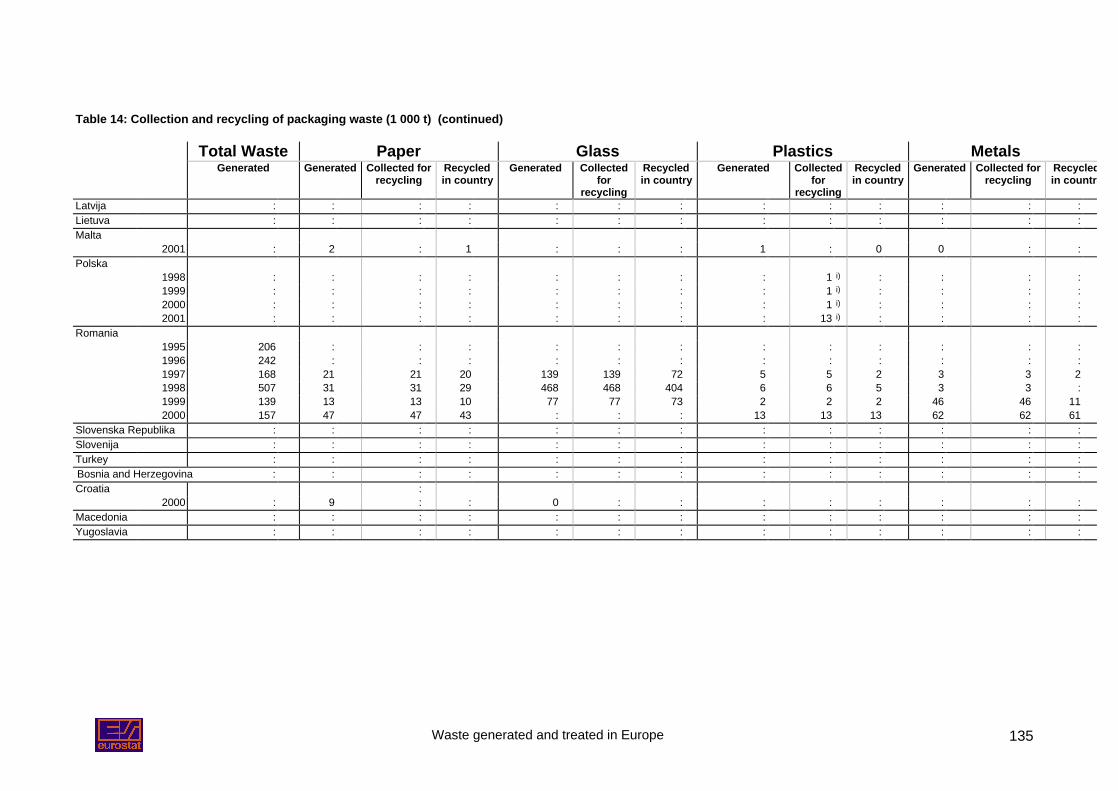
Waste generated and treated in Europe 135
Table 14: Collection and recycling of packaging waste (1 000 t) (continued)
Total Waste Paper Glass Plastics MetalsGenerated Generated Collected for
recyclingRecycledin country
Generated Collectedfor
recycling
Recycledin country
Generated Collectedfor
recycling
Recycledin country
Generated Collected forrecycling
Recycledin country
Latvija : : : : : : : : : : : : :Lietuva : : : : : : : : : : : : :Malta
2001 : 2 : 1 : : : 1 : 0 0 : :Polska
1998 : : : : : : : : 1 i) : : : :1999 : : : : : : : : 1 i) : : : :2000 : : : : : : : : 1 i) : : : :2001 : : : : : : : : 13 i) : : : :
Romania1995 206 : : : : : : : : : : : :1996 242 : : : : : : : : : : : :1997 168 21 21 20 139 139 72 5 5 2 3 3 21998 507 31 31 29 468 468 404 6 6 5 3 3 :1999 139 13 13 10 77 77 73 2 2 2 46 46 112000 157 47 47 43 : : : 13 13 13 62 62 61
Slovenska Republika : : : : : : : : : : : : :Slovenija : : : : : : . : : : : : :Turkey : : : : : : : : : : : : :Bosnia and Herzegovina : : : : : : : : : : : : :Croatia :
2000 : 9 : : 0 : : : : : : : :Macedonia : : : : : : : : : : : : :Yugoslavia : : : : : : : : : : : : :
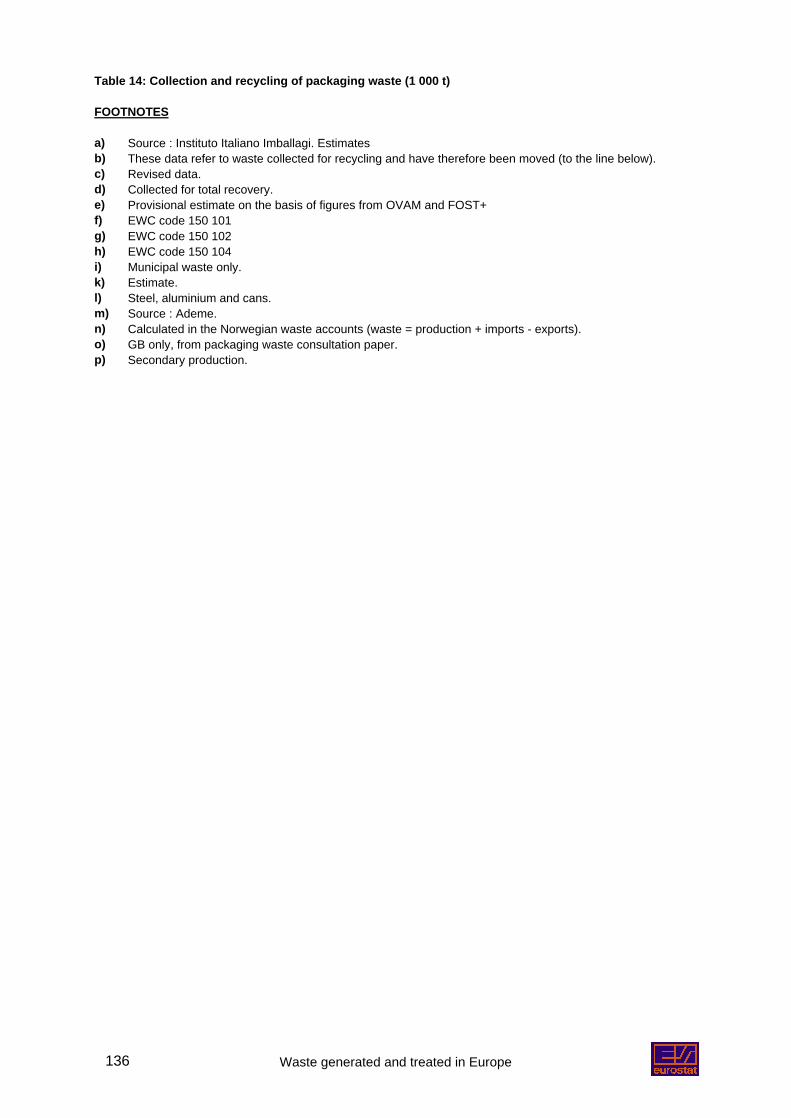
Waste generated and treated in Europe136
Table 14: Collection and recycling of packaging waste (1 000 t)
FOOTNOTES
a) Source : Instituto Italiano Imballagi. Estimatesb) These data refer to waste collected for recycling and have therefore been moved (to the line below).c) Revised data.d) Collected for total recovery.e) Provisional estimate on the basis of figures from OVAM and FOST+f) EWC code 150 101g) EWC code 150 102h) EWC code 150 104i) Municipal waste only.k) Estimate.l) Steel, aluminium and cans.m) Source : Ademe.n) Calculated in the Norwegian waste accounts (waste = production + imports - exports).o) GB only, from packaging waste consultation paper.p) Secondary production.
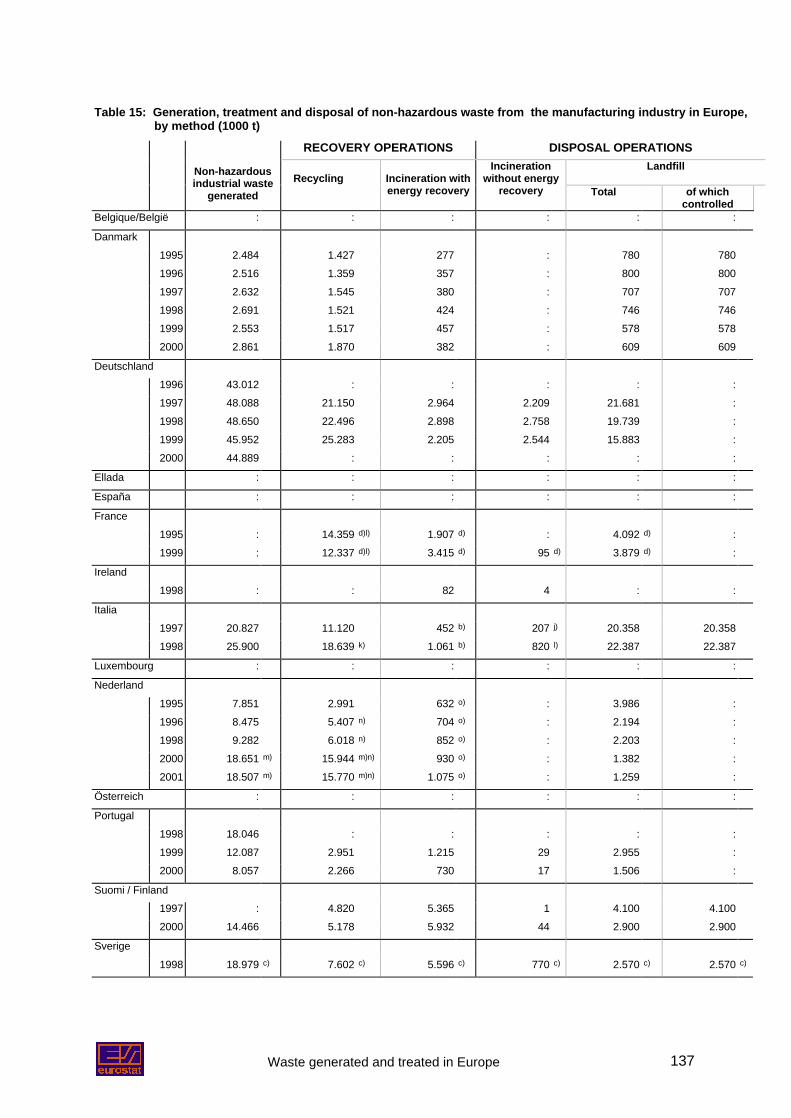
Waste generated and treated in Europe 137
Table 15: Generation, treatment and disposal of non-hazardous waste from the manufacturing industry in Europe, by method (1000 t)
RECOVERY OPERATIONS DISPOSAL OPERATIONSLandfillNon-hazardous
industrial wastegenerated
Recycling Incineration withenergy recovery
Incinerationwithout energy
recovery Total of whichcontrolled
Belgique/België : : : : : :
Danmark
1995 2.484 1.427 277 : 780 780
1996 2.516 1.359 357 : 800 800
1997 2.632 1.545 380 : 707 707
1998 2.691 1.521 424 : 746 746
1999 2.553 1.517 457 : 578 578
2000 2.861 1.870 382 : 609 609
Deutschland
1996 43.012 : : : : :
1997 48.088 21.150 2.964 2.209 21.681 :
1998 48.650 22.496 2.898 2.758 19.739 :
1999 45.952 25.283 2.205 2.544 15.883 :
2000 44.889 : : : : :
Ellada : : : : : :
España : : : : : :
France
1995 : 14.359 d)l) 1.907 d) : 4.092 d) :
1999 : 12.337 d)l) 3.415 d) 95 d) 3.879 d) :
Ireland
1998 : : 82 4 : :
Italia
1997 20.827 11.120 452 b) 207 j) 20.358 20.358
1998 25.900 18.639 k) 1.061 b) 820 l) 22.387 22.387
Luxembourg : : : : : :
Nederland
1995 7.851 2.991 632 o) : 3.986 :
1996 8.475 5.407 n) 704 o) : 2.194 :
1998 9.282 6.018 n) 852 o) : 2.203 :
2000 18.651 m) 15.944 m)n) 930 o) : 1.382 :
2001 18.507 m) 15.770 m)n) 1.075 o) : 1.259 :
Österreich : : : : : :
Portugal
1998 18.046 : : : : :
1999 12.087 2.951 1.215 29 2.955 :
2000 8.057 2.266 730 17 1.506 :
Suomi / Finland
1997 : 4.820 5.365 1 4.100 4.100
2000 14.466 5.178 5.932 44 2.900 2.900
Sverige
1998 18.979 c) 7.602 c) 5.596 c) 770 c) 2.570 c) 2.570 c)
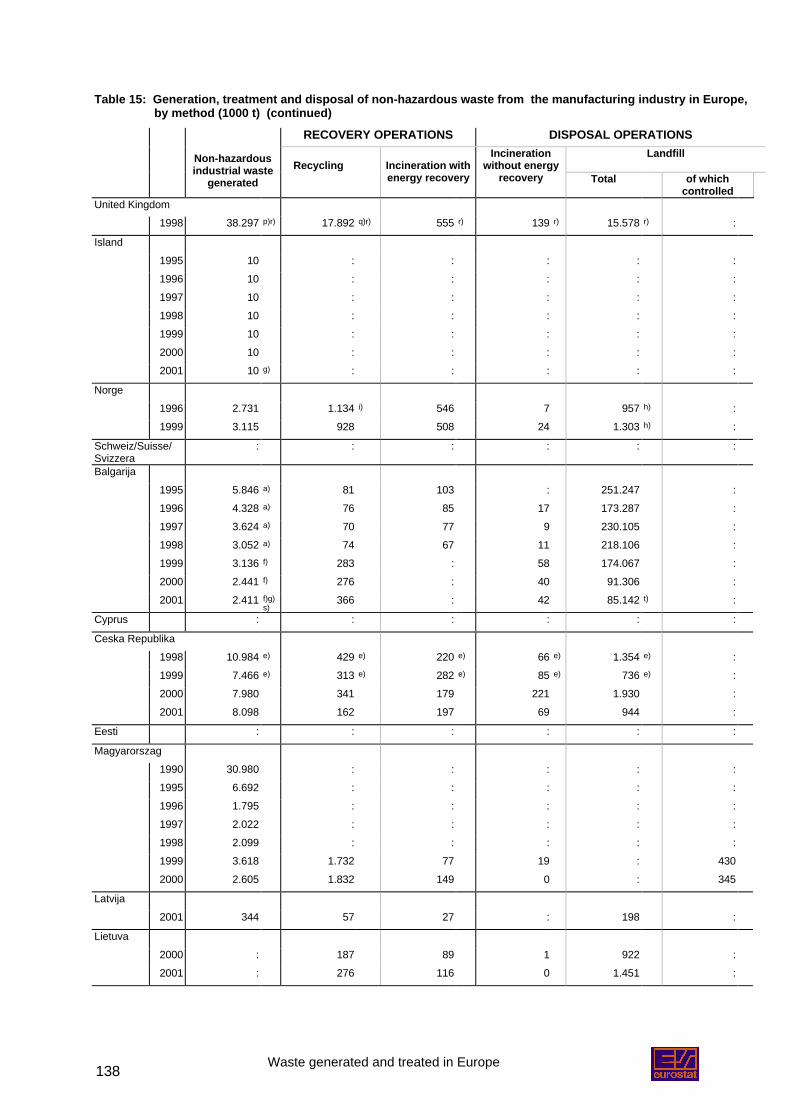
Waste generated and treated in Europe138
Table 15: Generation, treatment and disposal of non-hazardous waste from the manufacturing industry in Europe, by method (1000 t) (continued)
RECOVERY OPERATIONS DISPOSAL OPERATIONSLandfillNon-hazardous
industrial wastegenerated
Recycling Incineration withenergy recovery
Incinerationwithout energy
recovery Total of whichcontrolled
United Kingdom
1998 38.297 p)r) 17.892 q)r) 555 r) 139 r) 15.578 r) :
Island
1995 10 : : : : :
1996 10 : : : : :
1997 10 : : : : :
1998 10 : : : : :
1999 10 : : : : :
2000 10 : : : : :
2001 10 g) : : : : :
Norge
1996 2.731 1.134 i) 546 7 957 h) :
1999 3.115 928 508 24 1.303 h) :
Schweiz/Suisse/Svizzera
: : : : : :
Balgarija
1995 5.846 a) 81 103 : 251.247 :
1996 4.328 a) 76 85 17 173.287 :
1997 3.624 a) 70 77 9 230.105 :
1998 3.052 a) 74 67 11 218.106 :
1999 3.136 f) 283 : 58 174.067 :
2000 2.441 f) 276 : 40 91.306 :
2001 2.411 f)g)s)
366 : 42 85.142 t) :
Cyprus : : : : : :
Ceska Republika
1998 10.984 e) 429 e) 220 e) 66 e) 1.354 e) :
1999 7.466 e) 313 e) 282 e) 85 e) 736 e) :
2000 7.980 341 179 221 1.930 :
2001 8.098 162 197 69 944 :
Eesti : : : : : :
Magyarorszag
1990 30.980 : : : : :
1995 6.692 : : : : :
1996 1.795 : : : : :
1997 2.022 : : : : :
1998 2.099 : : : : :
1999 3.618 1.732 77 19 : 430
2000 2.605 1.832 149 0 : 345
Latvija
2001 344 57 27 : 198 :
Lietuva
2000 : 187 89 1 922 :
2001 : 276 116 0 1.451 :
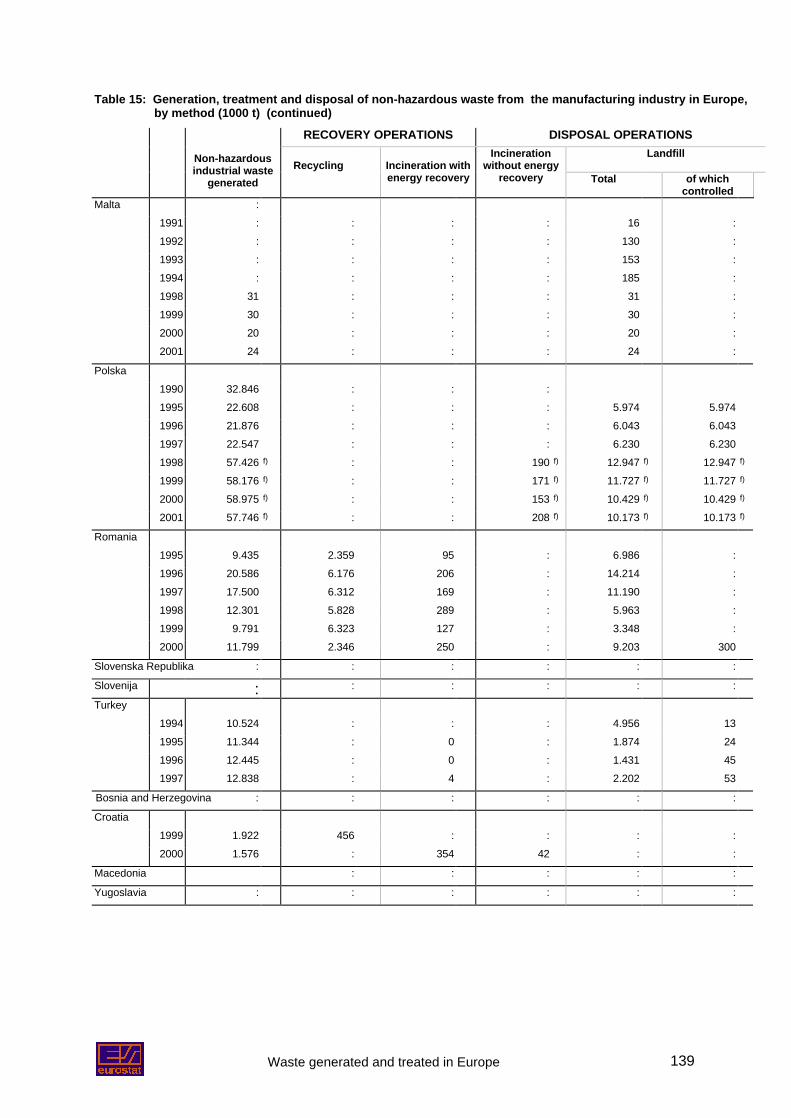
Waste generated and treated in Europe 139
Table 15: Generation, treatment and disposal of non-hazardous waste from the manufacturing industry in Europe, by method (1000 t) (continued)
RECOVERY OPERATIONS DISPOSAL OPERATIONSLandfillNon-hazardous
industrial wastegenerated
Recycling Incineration withenergy recovery
Incinerationwithout energy
recovery Total of whichcontrolled
Malta :
1991 : : : : 16 :
1992 : : : : 130 :
1993 : : : : 153 :
1994 : : : : 185 :
1998 31 : : : 31 :
1999 30 : : : 30 :
2000 20 : : : 20 :
2001 24 : : : 24 :
Polska
1990 32.846 : : :
1995 22.608 : : : 5.974 5.974
1996 21.876 : : : 6.043 6.043
1997 22.547 : : : 6.230 6.230
1998 57.426 f) : : 190 f) 12.947 f) 12.947 f)
1999 58.176 f) : : 171 f) 11.727 f) 11.727 f)
2000 58.975 f) : : 153 f) 10.429 f) 10.429 f)
2001 57.746 f) : : 208 f) 10.173 f) 10.173 f)
Romania
1995 9.435 2.359 95 : 6.986 :
1996 20.586 6.176 206 : 14.214 :
1997 17.500 6.312 169 : 11.190 :
1998 12.301 5.828 289 : 5.963 :
1999 9.791 6.323 127 : 3.348 :
2000 11.799 2.346 250 : 9.203 300
Slovenska Republika : : : : : :
Slovenija : : : : : :
Turkey
1994 10.524 : : : 4.956 13
1995 11.344 : 0 : 1.874 24
1996 12.445 : 0 : 1.431 45
1997 12.838 : 4 : 2.202 53
Bosnia and Herzegovina : : : : : :
Croatia
1999 1.922 456 : : : :
2000 1.576 : 354 42 : :
Macedonia : : : : :
Yugoslavia : : : : : :
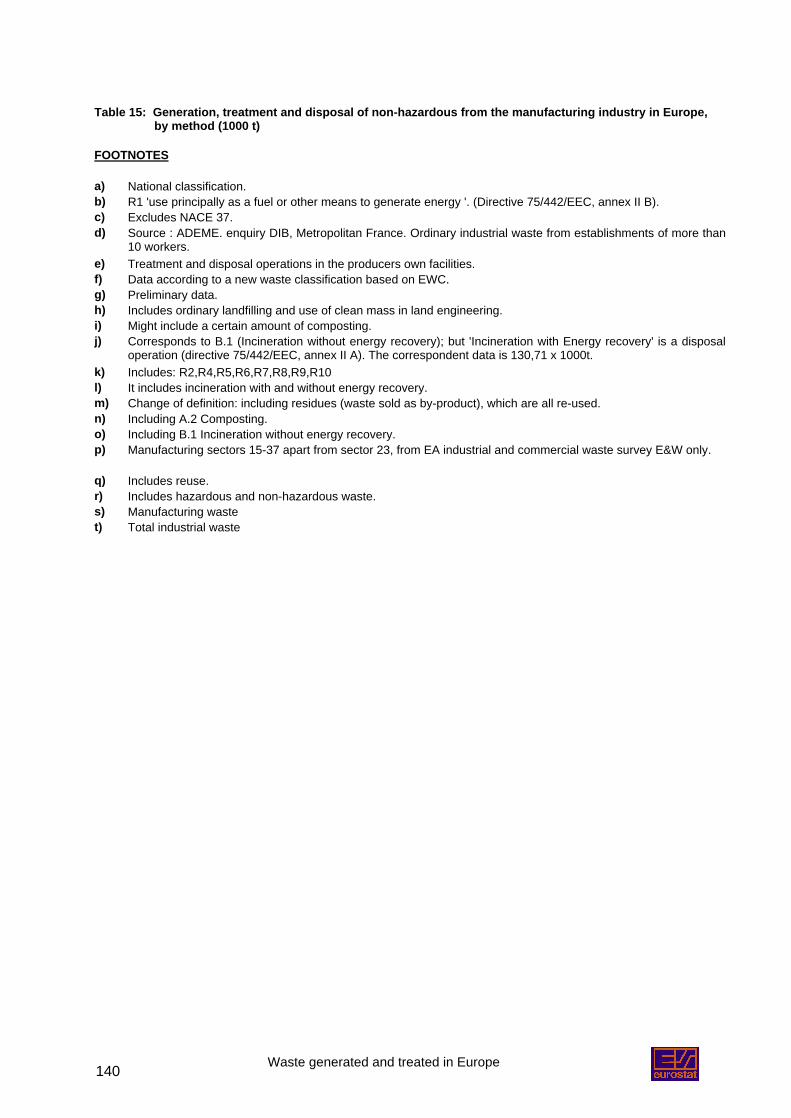
Waste generated and treated in Europe140
Table 15: Generation, treatment and disposal of non-hazardous from the manufacturing industry in Europe, by method (1000 t)
FOOTNOTES
a) National classification.b) R1 'use principally as a fuel or other means to generate energy '. (Directive 75/442/EEC, annex II B).c) Excludes NACE 37.d) Source : ADEME. enquiry DIB, Metropolitan France. Ordinary industrial waste from establishments of more than
10 workers.e) Treatment and disposal operations in the producers own facilities.f) Data according to a new waste classification based on EWC.g) Preliminary data.h) Includes ordinary landfilling and use of clean mass in land engineering.i) Might include a certain amount of composting.j) Corresponds to B.1 (Incineration without energy recovery); but 'Incineration with Energy recovery' is a disposal
operation (directive 75/442/EEC, annex II A). The correspondent data is 130,71 x 1000t.k) Includes: R2,R4,R5,R6,R7,R8,R9,R10l) It includes incineration with and without energy recovery.m) Change of definition: including residues (waste sold as by-product), which are all re-used.n) Including A.2 Composting.o) Including B.1 Incineration without energy recovery.p) Manufacturing sectors 15-37 apart from sector 23, from EA industrial and commercial waste survey E&W only.
q) Includes reuse.r) Includes hazardous and non-hazardous waste.s) Manufacturing wastet) Total industrial waste