Waste Energy Driven Air Conditioning System (WEDACS) · losses over the throttle valve. The need...
16
2009-24-0063 Waste Energy Driven Air Conditioning System (WEDACS) R.H.L. Eichhorn, M.D. Boot, C.C.M. Luijten Eindhoven University of Technology Copyright © 2009 SAE International ABSTRACT In the port injected Spark Ignition (SI) engine, the single greatest part load efficiency reducing factor are energy losses over the throttle valve. The need for this throttle valve arises from the fact that engine power is controlled by the amount of air in the cylinders, since combustion occurs stoichiometrically in this type of engine. In WEDACS (Waste Energy Driven Air Conditioning System), a technology patented by the Eindhoven University of Technology, the throttle valve is replaced by a turbine-generator combination. The turbine is used to control engine power. Throttling losses are recovered by the turbine and converted to electrical energy. Additionally, when air expands in the turbine, its temperature decreases and it can be used to cool air conditioning fluid. As a result, load of the alternator and air conditioning compressor on the engine is decreased or even eliminated, which increases overall engine efficiency. A model and validating experiment both indicate throttle losses of about 1.25 kW in a modern 2 liter engine at common operating points. On the same engine in a different operating point, an automotive turbocharger is used in another experiment to recover 1.1 kW of these throttling losses. Based on these measurements, a simulated MVEG-A drive cycle predicts a fuel efficiency improvement of 15 to 19 %. INTRODUCTION The most predominantly used engine for passenger transport is the port injected SI engine, in which a premixed charge is ignited by a spark plug. The best compromise of efficiency and emissions is found around stoichiometric combustion. As a consequence, engine power is controlled by the amount of air in the cylinders. Usually this is done by partially closing a throttle valve in the inlet manifold. Along with the air mass flow rate, the pressure is reduced over this valve, resulting in negative work of the engine during intake (called throttling loss). At part load, when the throttle valve is closed, throttling losses are high. So when the engine has to deliver low output power, it has to overcome high throttling losses, decreasing the efficiency at part load considerably. A number of attempts have been made to address this problem. The most well-known solution is direct injection, where engine power is controlled by injecting less fuel, resulting in a lean charge [1]. BMW’s Valvetronic is a less drastic solution [2]. It can vary valve lift and control engine power in this way, retaining stoichiometric combustion. It makes the throttle valve obsolete and reduces throttle losses to some extent. At idle, losses are reduced by 23 %. Also a turbine-generator combination replacing the throttle valve has been investigated before [3]. At the Swiss Federal Institute of Technology, an axial turbine with adjustable stator blades coupled to an electric generator is used. The cooled air is heated again using engine coolant. During the experiment, electrical energy produced by the system was 1.6% of energy consumed by the vehicle over an MVEG-95 drive cycle. WEDACS is different in using cold air behind the turbine to cool air conditioning fluid, resulting in a further increase in overall fuel efficiency. This paper is based on research that was carried out with two goals in mind. The first is to quantify throttling losses for a given engine. A simple model will be introduced and validated by a throttle loss experiment. The second goal is to prove the WEDACS concept. An energy recovery experiment is conducted and its results are used to simulate an MVEG-A drive cycle with and without WEDACS in place. SAE Int. J. Engines | Volume 2 | Issue 2 477 Licensed to Technical University of Eindhoven Licensed from the SAE Digital Library Copyright 2010 SAE International E-mailing, copying and internet posting are prohibited Downloaded Monday, October 04, 2010 3:46:10 AM Author:Gilligan-SID:13440-GUID:37752499-131.155.56.78
Transcript of Waste Energy Driven Air Conditioning System (WEDACS) · losses over the throttle valve. The need...
2009-24-0063
Waste Energy Driven Air Conditioning System (WEDACS)
R.H.L. Eichhorn, M.D. Boot, C.C.M. Luijten Eindhoven University of Technology
Copyright © 2009 SAE International
ABSTRACT
In the port injected Spark Ignition (SI) engine, the single greatest part load efficiency reducing factor are energy losses over the throttle valve. The need for this throttle valve arises from the fact that engine power is controlled by the amount of air in the cylinders, since combustion occurs stoichiometrically in this type of engine.
In WEDACS (Waste Energy Driven Air Conditioning System), a technology patented by the Eindhoven University of Technology, the throttle valve is replaced by a turbine-generator combination. The turbine is used to control engine power. Throttling losses are recovered by the turbine and converted to electrical energy. Additionally, when air expands in the turbine, its temperature decreases and it can be used to cool air conditioning fluid. As a result, load of the alternator and air conditioning compressor on the engine is decreased or even eliminated, which increases overall engine efficiency.
A model and validating experiment both indicate throttle losses of about 1.25 kW in a modern 2 liter engine at common operating points. On the same engine in a different operating point, an automotive turbocharger is used in another experiment to recover 1.1 kW of these throttling losses. Based on these measurements, a simulated MVEG-A drive cycle predicts a fuel efficiency improvement of 15 to 19 %.
INTRODUCTION
The most predominantly used engine for passenger transport is the port injected SI engine, in which a premixed charge is ignited by a spark plug. The best compromise of efficiency and emissions is found around stoichiometric combustion. As a consequence, engine
power is controlled by the amount of air in the cylinders. Usually this is done by partially closing a throttle valve in the inlet manifold. Along with the air mass flow rate, the pressure is reduced over this valve, resulting in negative work of the engine during intake (called throttling loss). At part load, when the throttle valve is closed, throttling losses are high. So when the engine has to deliver low output power, it has to overcome high throttling losses, decreasing the efficiency at part load considerably.
A number of attempts have been made to address this problem. The most well-known solution is direct injection, where engine power is controlled by injecting less fuel, resulting in a lean charge [1]. BMW’s Valvetronic is a less drastic solution [2]. It can vary valve lift and control engine power in this way, retaining stoichiometric combustion. It makes the throttle valve obsolete and reduces throttle losses to some extent. At idle, losses are reduced by 23 %. Also a turbine-generator combination replacing the throttle valve has been investigated before [3]. At the Swiss Federal Institute of Technology, an axial turbine with adjustable stator blades coupled to an electric generator is used. The cooled air is heated again using engine coolant. During the experiment, electrical energy produced by the system was 1.6% of energy consumed by the vehicle over an MVEG-95 drive cycle. WEDACS is different in using cold air behind the turbine to cool air conditioning fluid, resulting in a further increase in overall fuel efficiency.
This paper is based on research that was carried out with two goals in mind. The first is to quantify throttling losses for a given engine. A simple model will be introduced and validated by a throttle loss experiment. The second goal is to prove the WEDACS concept. An energy recovery experiment is conducted and its results are used to simulate an MVEG-A drive cycle with and without WEDACS in place.
SAE Int. J. Engines | Volume 2 | Issue 2 477
Licensed to Technical University of EindhovenLicensed from the SAE Digital Library Copyright 2010 SAE International
E-mailing, copying and internet posting are prohibitedDownloaded Monday, October 04, 2010 3:46:10 AM
Author:Gilligan-SID:13440-GUID:37752499-131.155.56.78

In the first section the WEDACS system is introduced. Next, the theory behind the model, experiments and drive cycle is addressed, followed by a description of the experiments themselves. Finally, results are presented and discussed.
SYSTEM DESCRIPTION
WASTE ENERGY DRIVEN AIR CONDITIONING SYSTEM (WEDACS) - WEDACS is an engine load control system that as an addition provides electrical energy and cooling power, driven by energy that is otherwise lost in throttling. As explained in the introduction, at part load operation the engine has to do extra work to keep running and maintain a partial vacuum behind the partially closed throttle valve. These throttling losses form the waste energy WEDACS uses.
The throttling valve is replaced by a turbine which, in contrast with the throttling valve, is able to produce work from the pressure drop across it. This work is transferred through a shaft to a compressor or alternator. In the case of an alternator, work is turned into electrical energy. This means that, at part load, the conventional alternator can be disconnected from the engine.
By expansion across the turbine, the air is cooled down substantially. This air can flow through a heat exchanger and cool the air conditioning fluid. This reduces the power consumed by the compressor in the air conditioning system, which is 1.5 to 3.5 kW for a full size passenger car [4, pg. 231].
Disconnecting the conventional alternator and lower power consumption by the air conditioning compressor means that the engine can produce less power. Now these accessories are driven by power produced by the conversion of throttling losses. The engine has to burn fuel to overcome these losses anyway, so now this fuel is put to good use, at the same time saving the fuel that would otherwise be burnt to drive the alternator and air conditioning compressor.
The elegance of this system is contained in the fact that by rerouting one stream of energy, two sources of extra efficiency are created: first, energy is extracted from the air and transferred to an alternator; and second, the cold (less energetic) air is used to cool air conditioning fluid.
An extra advantage would be the following (although this is not further substantiated in the present paper). When cold air passes through the heat exchanger, it not just cools the air conditioning fluid, but also the heat exchanger itself. The result is a cold mass. When the car suddenly accelerates, air does not move through the turbine anymore. It moves through a bypass, but still passes the heat exchanger. Being cold, the heat exchanger cools down the air. This temporarily increases the engine’s volumetric efficiency (thus power), up to the point where the heat exchanger mass has warmed up to ambient air temperature again.
The main components of the system (the turbine and the alternator) are described below.
Figure 1: Schematic view of WEDACS operation. Red
denotes “ambient”, blue denotes “cold”; yellow is electricity.
TURBINE - The turbine is the core component of WEDACS, it extracts energy from the intake air. The turbine is of the radial inflow type to be able to handle the low and diverse air mass flow rates encountered in the intake of the engine. This type is also found in turbochargers, where it extracts energy from the engine’s exhaust gases to drive a compressor. One can imagine that the turbine is in a much more friendly environment in the engine’s inlet. In the exhaust it has to withstand temperatures of over 800 °C and soot deposits. Therefore, a turbine in the inlet can be made much cheaper than an exhaust turbine.
For every mass flow within a certain range, the turbine can produce one pressure ratio. By varying the rotational speed at this mass flow rate, the pressure ratio can be varied a little. This can be seen in the turbine characteristic map in figure 2, where lines are plotted for several values of rotational speeds. These speeds can vary from 50.000 to 150.000 rpm. When mass flow increases, rotational speed increases and higher pressure ratios are possible. Another graph is plotted in figure 3 indicating turbine efficiency for the same operating points. It is clear that at a certain rotational speed, the efficiency decreases when the pressure ratio increases. Generally, efficiency also decreases when rotational speed increases. When rotational speed can be controlled, air mass flow rate and turbine efficiency may be varied to some extent for a single pressure ratio.
SAE Int. J. Engines | Volume 2 | Issue 2478
Licensed to Technical University of EindhovenLicensed from the SAE Digital Library Copyright 2010 SAE International
E-mailing, copying and internet posting are prohibitedDownloaded Monday, October 04, 2010 3:46:10 AM
Author:Gilligan-SID:13440-GUID:37752499-131.155.56.78

1 1.5 2 2.5min
max
Pressure ratio
Mas
s flo
w ra
teTypical turbine charactaristic map
Increasing rotational speed
Figure 2: Turbine characteristic map, every line denotes
a single rotational speed
1 1.5 2 2.5Pressure ratio [-]
Effi
cien
cy [-
]
Typical turbine efficiency
Increasing rotational speed
Figure 3: Turbine efficiency map, every line denotes a
single rotational speed
ALTERNATOR - The most straightforward use for the mechanical energy coming from the turbine is to convert it to electrical energy. This is done using an alternator. The alternator is a common part on every internal combustion engine, where it produces electrical energy e.g. for the ignition system and engine control system. This alternator runs at speeds of around 10.000 rpm and typically has a low efficiency. For these reasons, it is not suitable to be coupled to a turbine, which can run at speeds in excess of 100.000 rpm. An alternative is found in DC motors, which can also be used as alternators. These motors consist of a permanent magnet rotor and a stator containing coils. High speed alternators of this type are available with maximum speeds of over 100.000 rpm. In addition these are very small, lightweight and have an efficiency of 90 to 97 % [5].
WEDACS/ENGINE INTERACTION - In the complete system, the components treated above will be coupled to each other in one single housing. The turbine and alternator will run on a common axis that is suspended in bearings. The turbine cannot provide the right air mass flow and pressure drop in the entire engine operating
range. For example, the air mass flow at idle might be out of range for the turbine. This is why a throttle valve might have to be mounted in series with the turbine. Another problem is the engine’s wide open throttle operating point. To make this possible, the air should be led around the turbine. A bypass with a throttle valve in parallel with the turbine would have to be made. The air flow paths of the system introduced above are shown in figure 4.
Figure 4: Air flow paths in the WEDACS system
The system of turbine and throttle valves has to replace a single throttle valve. When installed in a car the driver should not notice the presence of the system. This is accomplished by sizing and calibration. Air mass flow and pressure drop across the system are equivalent to that over the single throttle valve. There is another effect however, caused by the turbine. The air going into the engine is much colder and can be well below freezing point of water. This causes water in the air to condense and even freeze. The water drops that are formed absorb injected fuel and can change the air/fuel ratio in the cylinders. This can have a negative effect on combustion. In modern engines, fuel is injected directly on the intake valve or inside the cylinder, so condensation of water does not seem to have an effect. Special attention has to be paid to temperatures of moving components that are exposed to the cold air. For example throttle valves can get stuck by freezing.
The cooling of air does not only have negative effects; it also reduces the tendency of knocking. The temperature of the mixture in the cylinder before combustion is directly related to its intake temperature. Lowering the latter directly reduces the risk of knocking. This can be put to an advantage in several ways.
First, ignition can be advanced, resulting in an optimized combustion phasing and hence higher efficiency.
Second, WEDACS can have an advantage in variable compression ratio engines. When these engines become available in the near future, WEDACS allows an additional increase in compression ratio at part load because of lower intake temperature. This increase in compression ratio raises the engine efficiency.
SAE Int. J. Engines | Volume 2 | Issue 2 479
Licensed to Technical University of EindhovenLicensed from the SAE Digital Library Copyright 2010 SAE International
E-mailing, copying and internet posting are prohibitedDownloaded Monday, October 04, 2010 3:46:10 AM
Author:Gilligan-SID:13440-GUID:37752499-131.155.56.78

THEORY
In this section, throttling losses over the engine operating range are quantified. A model is made to predict these losses. The model aims to predict air mass flow rate, pressure drop and losses over the throttle valve. Next, equations used to process data from the throttle loss experiment are introduced. Theory used to process data from the energy recovery experiment is treated and finally the drive cycle simulation is explained.
THROTTLE LOSS MODEL - A very simple model is made to quickly predict throttling losses for a specific engine. In the process of calculating throttling losses, also air mass flow and pressure drop over the throttle valve are calculated, which are very important variables when matching a turbine to an engine.
The starting point of this model is a brake specific fuel consumption (BSFC) map of a 2 liter gasoline engine. This reference map belongs to a 2 liter Ford engine [6]. An impression of this map is made in Matlab to be able to use it for the following calculations. The real map and the digital impression can be seen in figures 5 and 6.
Figure 5: BSFC map of 2 liter Ford engine, y-axis is a mean effective pressure [6].
240 240
240240 240
250 250
250
25025
260 260
260
260
2
280 280
280
280
300 300
300
300
50 350 350400 400
600 6006
1000 10001000
Engine speed [rpm]
Torq
ue [N
m]
Brake specific fuel consumption [g/kWh]
1000 2000 3000 4000 5000 60000
50
100
150
200
Figure 6: Digitalized “reconstruced” BSFC map, y-axis is converted to engine torque
When looking at the values of fuel consumption on the contour lines, it can be seen that the digital map is a fair representation of the original map. At low engine speeds near the maximum torque line, the reconstructed map deviates by at most 16 %, caused by the nature of the function used to generate the curves. At part load, which is the area of interest, the maps are almost identical.
Air mass flow rate - To calculate the air mass flow in every point in the BSFC-map, the assumption is made that combustion is always stoichiometric. First, fuel consumption is calculated by multiplying specific fuel consumption by engine power,
6106.3 ���� �ef TBSFCm� , (1)
where fm� is fuel mass flow in g/s, BSFC is brake specific fuel consumption in g/kWh, Te is torque in Nm and ω is engine speed in rad/s. From fuel mass flow, air mass flow is calculated assuming stoichiometric combustion,
fsa mAFm �� �� , (2)
where am� is air mass flow in g/s and AFs is the stoichiometric air-fuel ratio, which is 14.5 for gasoline.
Pressure drop - To calculate the pressure drop over the throttle valve, the following formula can be used,
���
4�
� dvol
VV� , (3)
where V� is the air volumetric flow rate in m3/s, Vd is the engine swept cylinder volume in m3 and vol� is the volumetric efficiency. To calculate the volumetric flow, an assumption has to be made for volumetric efficiency. A correlation for volumetric efficiency of various multi-cylinder Otto engines [7, pg. 192] is plotted as a function of engine speed in figure 7, and used in the model. The air density behind the throttle valve can be calculated using,
Vma
bv ��
��, (4)
where bv� is the density of air behind the throttle valve in kg/m3. Using this air density, the pressure in the inlet manifold can be calculated using the ideal gas law,
RTp bvbv �� , (5)
where pbv is the pressure behind the throttle valve in Pa, R is the gas constant of air (287 J/kg/K) andT is the intake temperature in K, assumed to be 300 K.
SAE Int. J. Engines | Volume 2 | Issue 2480
Licensed to Technical University of EindhovenLicensed from the SAE Digital Library Copyright 2010 SAE International
E-mailing, copying and internet posting are prohibitedDownloaded Monday, October 04, 2010 3:46:10 AM
Author:Gilligan-SID:13440-GUID:37752499-131.155.56.78

Figure 7: Volumetric efficiency versus engine speed [6].
Throttling losses - The power that is lost in the throttling process and thus available to the turbine is,
� VpVppP bvatmthrot�� ����� , (6)
where patm is atmospheric pressure in bar and Pthrot is the power that is dissipated by the throttling process.
THROTTLE LOSS EXPERIMENT - Power lost in the throttling process can be calculated in a way similar to that in the simulation.
athrot mvpVpP �� ����� , (7)
where the pressure drop p can be calculated with
bvfv ppp ��, (8)
and v , the specific volume in m3/kg, can be calculated by the ideal gas law:
bv
bv
pRT
v ���1
, (9)
where Tbv is the temperature behind the valve. The density in this formula, and thus the pressure and temperature, is that of the air behind the throttle valve. These pressures, temperatures and air mass flow rate are all measured variables.
ENERGY RECOVERY EXPERIMENT - The amount of power recovered by the turbine can be calculated from the temperature drop and air mass flow rate through the turbine with:
tpat TCmP ��� �, (10)
where Cp is the specific heat of air (1005 J/kg/K) and ΔTt is the temperature drop over the turbine.
Effect of condensation - The turbine extracts a fixed amount of energy from a certain pressure drop and a certain mass flow rate of air. This causes a temperature drop over the turbine, the value of which depends on the energy extracted by the turbine. At some point water present in the air will condense, releasing thermal energy (latent heat). This energy heats up the air again and thus compensates part of the temperature drop. Therefore, when looking at the temperature drop during condensation, the energy recovered by the turbine seems to be lower than it actually is.
How large the energy involved in condensation is, depends on the amount of water vapor present in the air and how much of that condenses. To specify how much water is present in the air, two variables are used; specific (ξ) and relative humidity (�. The relative humidity on the days of the measurements was about 60 %. To calculate the mass of water present in the air, first the specific humidity is calculated:
g
g
ppp
��
���
��
622.0
, (11)
where p is the total pressure and pg is the saturated vapor pressure. The number 0.622 comes from the ratio of gas constants from air and water vapor. Next the mass of water present in the air can be calculated:
avav mmmm �� ����� , (12)
where mv is the mass of water vapor and ma is the mass of air. At a temperature of 20 °C, the saturated vapor pressure of water is 2.34 kPa and with a relative humidity of 60 %, one kg of air contains 8.8 g of water vapor.
The saturation pressure drops with decreasing temperature. Initially, the mass of water vapor in the air will be constant, so the relative humidity will rise as the saturated vapor pressure drops (see equation 11). When the relative humidity reaches 100%, a further temperature drop will cause water vapor to condense. It is assumed that the relative humidity will stay at 100%.
The specific humidity, i.e. kg’s of water vapor in one kg of air, is plotted as a function of decreasing temperature in figure 8. The starting point is 20 °C with a relative humidity of 60 %.
1400 1800 2200 2600 3000 3400 0.82
0.825
0.83
0.835
0.84
0.845
0.85
0.855
0.86
0.865
Engine speed [1/min]
Vol
umet
ric e
ffici
ency
[-]
SAE Int. J. Engines | Volume 2 | Issue 2 481
Licensed to Technical University of EindhovenLicensed from the SAE Digital Library Copyright 2010 SAE International
E-mailing, copying and internet posting are prohibitedDownloaded Monday, October 04, 2010 3:46:10 AM
Author:Gilligan-SID:13440-GUID:37752499-131.155.56.78

Figure 8: Humidity during cooling of air
As predicted, relative humidity starts at 60 %, then rises to 100 % and stays there. Specific humidity is initially constant, but starts dropping when the relative humidity reaches 100%. This indicates that water vapor is removed from the air by condensation.
The air mass flow rate and its specific humidity are now known, to calculate the water vapor mass that condenses per unit of time, the difference of the initial (ξi) and instantaneous (ξ) specific humidity is multiplied by the air mass flow rate:
� aicondv mm �� ��� , (13)
During a phase change, a substance rejects or absorbs a certain amount of energy. For condensation of water vapor the latent heat of condensation Lv is 2257 kJ/kg.
When going back to the situation of expansion in a turbine, it is assumed that condensation and the associated heat exchange processes are infinitely fast. In this way the heat released by condensation partly compensates for the cooling effect of the turbine. This keeps the relative humidity at 100%. The energy released by condensation can be added to the power recovered by the turbine above. When only temperature is measured and condensation is neglected, power recovery by the turbine can seem lower than it actually is. Equation 10 becomes:
errethrotcondvvtpat PmLTCmP cov, �������� ��,(14)
where the last term of the formulation in the middle is Pcond, the power released by condensation and ηrecover is the efficiency with which throttle losses are recovered.
Turbine map - From the data collected, a turbine map can be drawn. Usually, the corrected mass flow rate with respect to normal conditions (288.15 K and 101.325 kPa) is used:
ft
ftacorra p
Tmm 325.101
15.288, ��� ��
, (15)
where temperature is in K and pressure in kPa.
Power saved - As mentioned before, moving an energy stream from one place (stream of intake air) to the other (electrical circuit/battery) yields more than the power recovered by the turbine. The engine does not have to drive the alternator and air conditioning compressor as much, so the power of these sources combined is the total power saved.
acalttot PPP �� (16)
A typical alternator installed on a car engine has an efficiency of 42 to 60 %, with the latter occurring at typical operating speed [8, pg. 813], so here an efficiency of 60 % is assumed. The engine has to provide almost twice the power that the alternator delivers. Since the high speed alternator efficiency is 90 - 97 % [5]. The power the engine has to deliver for the same electrical power is 1.5 times the turbine power.
5.16.09.0
������ ttalt
hsalttalt PPPP
��
(17)
In air conditioning systems a coefficient of performance (COP) of 2.5 is common [9, pg. 260]. Therefore, air conditioning compressor power that would be required to provide the same amount of cooling as the turbine is assumed to be 0.4 times that of the turbine power.
5.2t
acPP � (18)
DRIVE CYCLE SIMULATION - Real world performance of WEDACS is predicted by an MVEG-A drive cycle simulation. For this simulation, data from the experiments will be used wherever possible. Since it is still unknown how much of the throttling losses can be recovered, this value will be varied.
The model consist of loading drive cycle data, calculating engine operating points by simulating a Nissan Primera with a manual gearbox on the drive cycle. Finally, fuel consumption and throttling losses are looked up in tables from data measured earlier. Relevant vehicle parameters are presented in table 1.
-10-505101520
20
40
60
80
100
Temperature [�C]
Hum
idity
Humidity during cooling of air
Relative humidity, � [%]Specific humidity * 104, � [-]
SAE Int. J. Engines | Volume 2 | Issue 2482
Licensed to Technical University of EindhovenLicensed from the SAE Digital Library Copyright 2010 SAE International
E-mailing, copying and internet posting are prohibitedDownloaded Monday, October 04, 2010 3:46:10 AM
Author:Gilligan-SID:13440-GUID:37752499-131.155.56.78

Table 1: Vehicle parameters of Nissan Primera
Parameter Value
Vehicle mass 1400 kg
Tire friction constant 0.015
Aerodynamic constant 0.6 m2
Transmission efficiency 0.95
When engine operating points are known, it is possible to determine fuel consumption by interpolating from a lookup table. Such a table can be made from the air mass flow rate data from the first experiment shown in figure 14. Under the assumption of stoichiometric combustion, fuel consumption can be calculated from air mass flow rate using equation 2. Throttling losses are readily available from experiments. The same data is used that is plotted in figure 19. Now both lookup tables are available. Depending on the state of the car, data has to be retrieved from a different source. In table 2 the states and corresponding actions are listed.
Table 2: Vehicle states and corresponding actions
State Car speed
Engine speed
Engine torque
Action
Engine driving car
> 0 > 1000 > 0 Lookup fuel consumption and throttling losses in tables
Idling 0 1000 0 Fuel consumption is 3.5/14.7 g/s and throttling losses are zero
Coasting / braking
> 0 > 1000 < 0 Fuel consumption is zero and throttling losses are zero
Fuel consumption at idle is measured air mass flow rate at idle divided by the stoichiometric air/fuel ratio. Throttling losses at idle are not considered, because it is unlikely that a turbine can cope with such a small air mass flow rate. Also it is assumed that while coasting or braking, the engine is in gear and is driven by the car. The possibility of generating power from the driven engine while (engine) braking is not considered in this simulation. The test bench did not allow the engine to be
driven, so conducting this experiment was impossible. To have an idea of throttling losses during engine braking, one can look at figure 20 at engine operation where no torque is produced.
Fuel consumption for the standard car can just be added for every point (taken equal to one second) of the drive cycle to get the total fuel consumption.
��
�1220
0,
ttff mm �
(19)
In case of a car equipped with WEDACS, a part of the throttling losses will be used to generate electrical energy and cool air. How large this part is depends on the efficiency with which the throttling losses are recovered. In practice this efficiency will vary over the engine operating range but as a first approximation it is assumed to be constant. It is also assumed that the turbine can provide the right pressure ratios and air mass flow rates so no additional throttling is required. The energy recovered from throttling losses does not have to be produced by the engine anymore, so it has to do less work, this situation is comparable to that of a car with air conditioning and full electrics switched on. So it is assumed that all energy recovered is used. This energy is calculated using equations 16, 17 and 18. The fuel consumption with WEDACS can be calculated by:
��
���
����
���
��1220
0
cov,, 1
t e
throterretfWEDACSf T
Pmm
��
�
. (20)
SAE Int. J. Engines | Volume 2 | Issue 2 483
Licensed to Technical University of EindhovenLicensed from the SAE Digital Library Copyright 2010 SAE International
E-mailing, copying and internet posting are prohibitedDownloaded Monday, October 04, 2010 3:46:10 AM
Author:Gilligan-SID:13440-GUID:37752499-131.155.56.78

EXPERIMENTAL APPARATUS
Below, first the throttle loss experiment is introduced. After that, the energy recovery experiment is described.
THROTTLE LOSS - To confirm the throttle loss model, an experiment has to be conducted. Compared to the model, air mass flow and pressure drop over the throttle valve can be measured directly. Power lost by throttling are calculated in a way similar to that in the model, using measured variables as much as possible.
An existing gasoline engine test bench was fitted with extra sensors to study the throttle losses induced by the throttle valve. This test bench, which is shown in figure 9, is a power train from a 2000 Nissan Primera, consisting of a 2 liter gasoline engine, see table 3, and CVT transaxle, coupled to an eddy current brake. Controllers adjust the brake energy dissipation and a throttle valve position to reach a user specified engine operating point.
Table 3: Engine data of Nissan Primera engine
Parameter Symbol Value
Engine type 4 stroke SI
Fuel Gasoline
Displacement volume Vd 2 liter
Number of cylinders 4
Bore x stroke 86 x 88 mm
Maximum engine power 103 kW @ 5800 rpm
Maximum engine torque
181 Nm @ 4800 rpm
Pressure and temperature before and after and air mass flow rate through the throttle valve are measured. To be prepared for more in depth modeling, in addition the lambda value, pressure and temperature of the exhaust gases is measured. This data is required to validate the above model and to select a suitable turbine. In the schematic view in figure 10, it is indicated where sensors are located and which variable they measure.
Figure 9: Photograph of test bench
Figure 10: Schematic overview of experimental
apparatus
ENERGY RECOVERY – This experiment is conducted to prove the cooling and work producing effect of a turbine in the system described above. Also these effects are quantified. Another goal is to investigate control of turbine rotational speed as a possibility of engine control. A small turbocharger is installed on the set up used in the throttle loss experiment. For a range of operating points, the temperature drops and recovered powers are measured.
For the energy recovery experiment, the test setup from the throttle loss experiment was extended. The cheapest and quickest way to add a turbine to the test setup was by using a turbocharger from a car. Coincidently, automotive turbochargers also contain the smallest radial turbines available from mass production. The smallest turbo is found on the Smart car’s 700 cc gasoline and 800 cc Diesel engines. It is a Garrett GT1238 with a turbine wheel diameter of 35.5 mm. The bypass of the turbine is disabled. The turbo shaft is suspended in journal bearings. A dedicated oil circuit was built and the turbo’s water cooling passage was blocked off. The location of the turbo on the test setup can be seen in figure 11.
SAE Int. J. Engines | Volume 2 | Issue 2484
Licensed to Technical University of EindhovenLicensed from the SAE Digital Library Copyright 2010 SAE International
E-mailing, copying and internet posting are prohibitedDownloaded Monday, October 04, 2010 3:46:10 AM
Author:Gilligan-SID:13440-GUID:37752499-131.155.56.78

To have some control over the rotational speed of the turbo, a throttle valve was installed on the compressor exhaust side. This valve would provide back pressure to slow down the compressor wheel, and thus the turbine. In figure 11 this throttle valve can be seen on the test setup. Note that the compressor is not part of the intake system as it would in a turbocharged engine.
Figure 11: Turbocharger installed on inlet side of engine: 1. Turbine, 2. Throttle valve to control turbine rotational
speed, 3. Compressor
Since the turbine has a fixed pressure ratio for every air mass flow rate, it is not possible to reach every operating point of the engine. Let us assume the engine’s throttle valve is wide open. Then for every rotational speed of the engine, there is a combination of air mass flow rate and pressure drop that matches with that of the turbine. In these circumstances, the engine produces a certain amount of torque. When this is measured for all rotational speeds of the engine, a new maximum torque line can be drawn, this is done in figure 12 (thick line). Because the bypass is not available, this is the maximum torque the engine can produce when the turbocharger is installed. It is possible to close the engine’s throttle valve and reach different operating points, but this is not useful in the experiment.
During the experiment, the engine will only operate on the bold line in figure 12. Therefore the vertical axis in graphs are not indicating torque anymore, instead the position of the throttle valve behind the compressor will be on the vertical axis. Initially, the idea was to slow down the rotational speed of the turbocharger by closing the valve.
During the experiments, it turned out that closing the valve sped up the turbocharger, see figure 13. The reason for these higher turbocharger speeds is the following; when the throttle valve behind the compressor is closed, the compressor is building up more pressure and air mass flow rate decreases. This increases the efficiency of the compressor and inherently creates an unbalance in the energy flow between the turbine and compressor, because the latter is suddenly dissipating less energy. A new balance is found at a higher rotational speed.
00
0250
250
250
500
500
500
750
750
750
1000
1000
1000
10
1250
1250
1250
1500
1500
Power lost by throttling in engine operating range [W]
Engine speed [rpm]
Torq
ue [N
m]
1500 2000 2500 30000
50
100
150
Figure 12: New maximum torque line (bold) drawn in
engine throttle loss map
4000
0 6000
0
8000
0
8000
0
10000
0
1000
0010
0000
1200
00
1200
00
1200
00
140000
140000
160000
Turbocharger rotational speed [rpm]
Engine speed [rpm]
Thro
ttle
open
ing
[%]
2000 2500 3000 3500 4000 4500 5000 55000
20
40
60
80
100
Figure 13: Turbocharger rotational speed as a function of
engine speed and (behind compressor) throttle valve opening.
Another problem encountered during the experiments was oil leaking from the turbocharger’s journal bearings. This is a consequence of the lower pressures in both the turbine and compressor. During the experiments, pressure in the turbine was between 0.5 and 1 bar.
It is important to make sure that all throttling was done by the turbine, so it was made sure that the throttling valve did not further decrease inlet pressure.
1
2
3
SAE Int. J. Engines | Volume 2 | Issue 2 485
Licensed to Technical University of EindhovenLicensed from the SAE Digital Library Copyright 2010 SAE International
E-mailing, copying and internet posting are prohibitedDownloaded Monday, October 04, 2010 3:46:10 AM
Author:Gilligan-SID:13440-GUID:37752499-131.155.56.78
RESULTS
In this section, results from the above described models and experiments are presented and discussed. First, results from the throttle loss model and experiment are compared. Next results from the energy recovery experiment are treated and finally the drive cycle simulation results are presented.
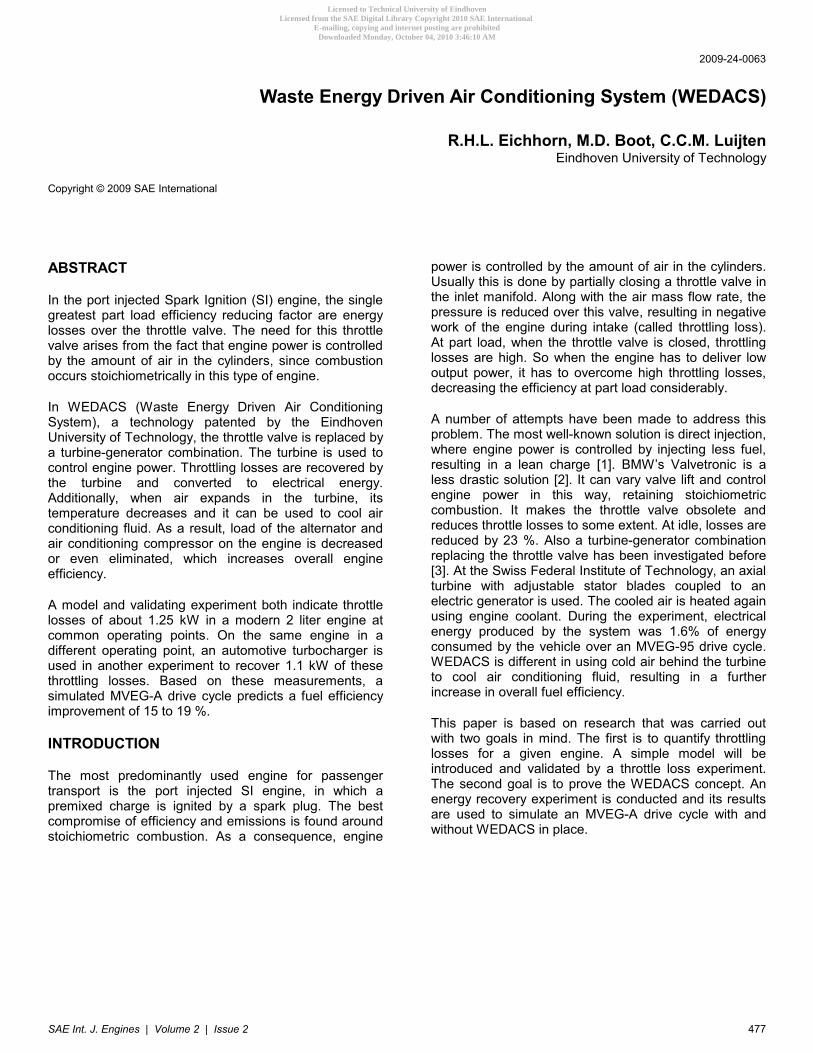
THROTTLE LOSS - Below, for every relevant variable, simulation results are compared to measurement results.
Figure 14: Air mass flow rate predicted by the model
Figure 16: Pressure behind the throttle valve predicted by the model
Some adaptations have been made to the model to get a closer match to the engine from the test bench: The volumetric efficiency was lowered slightly (5 %) because the inlet duct on the test bench is longer than it would be in a car. Also, since the Nissan engine has a longer stroke than the reference Ford engine (88 vs. 83 mm), the specific fuel consumption map had to be scaled using Willan’s line method [10].
In figure 14 and 15 the air mass flow rates are shown. Air mass flow from the model was calculated using equation 2. The most important difference is the shape of the contour lines at the lowest torques. In the measurement graph, the 5 g/s line is less smooth and the 10 g/s line is higher at high engine speeds. Apart from that, the model corresponds well with the measurement results. In the lower left end of the graphs, the difference is 50 %, but in the rest of the graph the difference is below 30 %.
Figure 15: Measured air mass flow rate from experiment
Figure 17: Pressure behind the throttle valve measured from the experiment
In figure 16 and 17 the pressure behind the throttle valve is shown. The pressure from the model was calculated using equation 5. When comparing this result to the simulation results, it is obvious that the lines are more curved than those in the simulation results. The 0.3 bar line of the model is a little bit too low, but overall, the model prediction and the measurements for the pressure correspond fairly well, the maximum difference between both graphs is 25 %.
5 5
5
5 5 5
10
101
10
10
10
15 15
15
15
15
15
20 20
20
20
20
20
25 25
25
25
30 30
30
35
35
40 40
Air mass flow [g/s]
Engine speed [rpm] 1600 2000 2400 2800 3200
0 20
40
60
80
100
120
140
160
180
Torq
ue [N
m]
0.3 0.3
0.3 0.3
0.4 0.4
0.4 0.4 0.4
0.5 0.5
0.5
0.5 0.5 0.5
0.6 0.6
0.6
0.6 0.6 0.6
0.7 0.7
0.7
0.7 0.7 0.7
0.8 0.8
0.8
0.8 0.8 0.8
0.9 0.9
0.9
0.9 0.9 0.9
1 1
1 1
Pressure behind throttle valve [bar]
Engine speed [rpm]
Torq
ue [N
m]
1600 2000 2400 2800 3200 0
20
40
60
80
100
120
140
160
180
5
55
1010
10
15
1515
20
20
20
2
25
25
25
30
30
30
35
35
40
40
45
45
50Air mass flow rate through inlet [g/s]
Engine speed [rpm]
Torq
ue [N
m]
1500 2000 2500 30000
50
100
150
0.3 0.3 0.3
0.3 0.3 0.3
0.3
0.4 0.4
0.4 0.4
0.4 0.4 0.4 0.4
0.5 0.5
0.5 0.5
0.5 0.5 0.5 0.5
0.6 0.6
0.6 0.6
0.6
0.6 0.6 0.6
0.7 0.7
0.7 0.7
0.7
0.7 0.7 0.7
0.8 0.8 0.8
0.8
0.8 0.8 0.8 0.8
0.9
0.9
0.9 0.9
0.9 0.9
0.9
1 1
1 1
Pressure behind throttle [bar]
Engine speed [rpm]
Torq
ue [N
m]
1600 2000 2400 2800 3200
20
40
60
80
100
120
140
160
180
SAE Int. J. Engines | Volume 2 | Issue 2486
Licensed to Technical University of EindhovenLicensed from the SAE Digital Library Copyright 2010 SAE International
E-mailing, copying and internet posting are prohibitedDownloaded Monday, October 04, 2010 3:46:10 AM
Author:Gilligan-SID:13440-GUID:37752499-131.155.56.78

100 100
100
250
250 250 250
500
500 500
500
750
750
750
750
1000
1000
1000
1000
1250
1250
1250
1500
1500
1500
Torq
ue [N
m]
1600 2000 2400 2800 3200
20
40
60
80
100
120
140
160
180
50 km/h
80 km/h
120 km/h
Engine speed [rpm]
Power lost by throttling process [W]
100 100 250 250 250
500
500 500
750
750 750
1000
1000
1000
1250
1250
1250
1500
1500 1500
20002000
2500
Power lost in throttling process [W]
Engine speed [rpm]
Torq
ue [N
m]
1600 2000 2400 2800 3200 0
20
40
60
80
100
120
140
160
180
In case of a throttle valve, one would expect the temperatures before and after the valve to be equal. Subtracting the measured temperature before the valve from the temperature after the valve yields the figure 18. Apparently, the temperature rises over the throttle valve. In this case, the air is heated because cooling fluid is passing through the throttle body. The temperature rise depends on the air mass flow, which can be seen in figure 14 and 15. When the air mass flow is low, at low torque and engine speeds, the temperature rise is high. At high engine speeds and torques, when the air mass flow is higher, the temperature rise is much lower. This information is not crucial to the proof of principle, but it shows that cool air can easily be warmed up before going into the engine, improving evaporation of the injected fuel. This means it is easy to heat up the air again in case the cold air causes problems.
5
510
1010
15
1515
1520
Temperature rise over throttle valve [�C]
Engine speed [rpm]
Torq
ue [N
m]
1500 2000 2500 30000
50
100
150
Figure 18: Measured temperature rise over the throttle
valve
In figure 19 and 20 power lost by throttling is plotted. The data is calculated using equation 6 and 7 for the model and experiment respectively. When comparing the measurement data to the simulation results, it can be seen that the model is a little bit more optimistic than the
Figure 19: Throttle losses predicted by the model
calculation from measurement results. This difference is caused by small differences in the air mass flow and pressure maps, added and amplified in the formulas for calculating power. At high engine speed and low torque, the power calculated from the measurement results is going down again, with increasing engine speed and decreasing torque while the power calculated by the model is going up. Apart from this, the model seems to correspond reasonably well to the measurement results, the maximum difference is 25 %.
Although there are some small differences, the measurement results confirm that the model is useful for predicting air mass flow, pressure drop and energy lost over the throttling valve. Care should be taken when simulating a different engine by scaling the above engine map. Techniques like fuel injection, turbo- or supercharging and variable valve timing have a significant influence on the shape of this map, so that simple scaling can no longer be used.
It is interesting to see what the throttling loss is at different vehicle speeds, for example at 50, 80 and 120 km/h. In table 4, the relevant variables are shown, and in figure 20, the engine operating points are indicated in the throttling loss map. At 50 and 80 km/h, more than 1kW is lost, and at 120 km/h it is even 1.25 kW.
Table 4: Throttling losses at three operating points
Variable 50 km/h 80 km/h 120 km/h
Engine torque / speed
25 Nm / 2000 rpm
40 Nm / 2000 rpm
50 Nm / 2500 rpm
Engine power 5 kW 8 kW 15 kW
Throttle loss 1.2 kW 1.1 kW 1.25 kW
Percentage of engine power
24 % 14 % 8 %
Figure 20: Measured throttling losses
Torq
ue [N
m]
SAE Int. J. Engines | Volume 2 | Issue 2 487
Licensed to Technical University of EindhovenLicensed from the SAE Digital Library Copyright 2010 SAE International
E-mailing, copying and internet posting are prohibitedDownloaded Monday, October 04, 2010 3:46:10 AM
Author:Gilligan-SID:13440-GUID:37752499-131.155.56.78
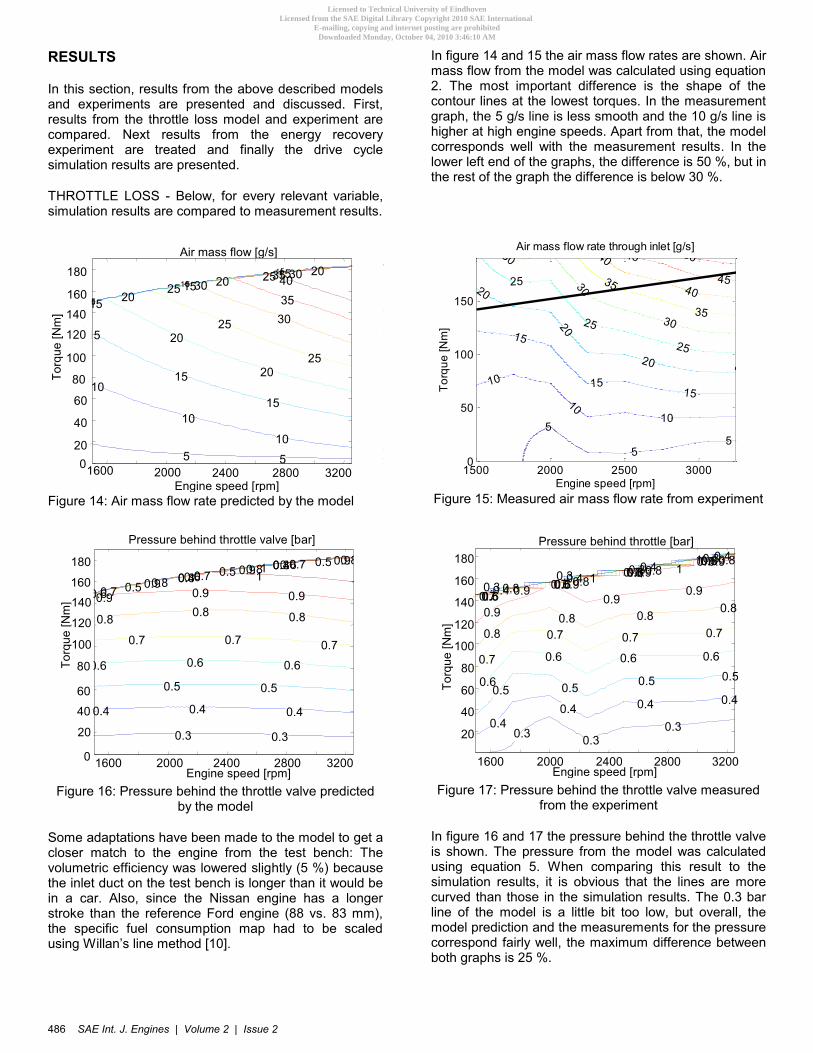
ENERGY RECOVERY - Below, the results from the energy recovery experiment are presented. The temperature drop over and power recovered by the turbine are shown to assess energy recovery. Also the turbine map is shown to determine if the turbine size is right. Finally two engine operating points are chosen to show efficiency improvement of the engine.
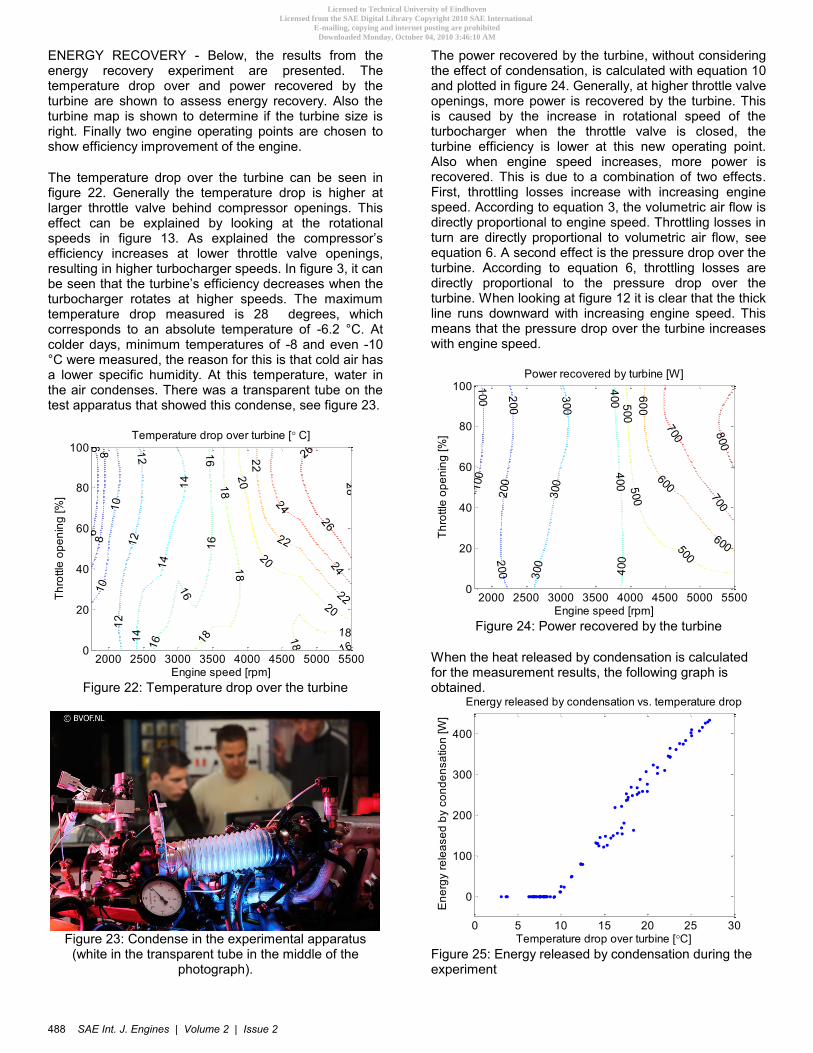
The temperature drop over the turbine can be seen in figure 22. Generally the temperature drop is higher at larger throttle valve behind compressor openings. This effect can be explained by looking at the rotational speeds in figure 13. As explained the compressor’s efficiency increases at lower throttle valve openings, resulting in higher turbocharger speeds. In figure 3, it can be seen that the turbine’s efficiency decreases when the turbocharger rotates at higher speeds. The maximum temperature drop measured is 28 degrees, which corresponds to an absolute temperature of -6.2 °C. At colder days, minimum temperatures of -8 and even -10 °C were measured, the reason for this is that cold air has a lower specific humidity. At this temperature, water in the air condenses. There was a transparent tube on the test apparatus that showed this condense, see figure 23.
6
6
8
810
1012
12
12
14
14
14
16
16
16
16
1618
1818
18
18
2020
20
22
22
22
24
24
26
26
28
Temperature drop over turbine [� C]
Engine speed [rpm]
Thro
ttle
open
ing
[%]
2000 2500 3000 3500 4000 4500 5000 55000
20
40
60
80
100
Figure 22: Temperature drop over the turbine
Figure 23: Condense in the experimental apparatus (white in the transparent tube in the middle of the
photograph).
The power recovered by the turbine, without considering the effect of condensation, is calculated with equation 10 and plotted in figure 24. Generally, at higher throttle valve openings, more power is recovered by the turbine. This is caused by the increase in rotational speed of the turbocharger when the throttle valve is closed, the turbine efficiency is lower at this new operating point. Also when engine speed increases, more power is recovered. This is due to a combination of two effects. First, throttling losses increase with increasing engine speed. According to equation 3, the volumetric air flow is directly proportional to engine speed. Throttling losses in turn are directly proportional to volumetric air flow, see equation 6. A second effect is the pressure drop over the turbine. According to equation 6, throttling losses are directly proportional to the pressure drop over the turbine. When looking at figure 12 it is clear that the thick line runs downward with increasing engine speed. This means that the pressure drop over the turbine increases with engine speed.
100
100
200
200
200
300
300
300
400400
400
500500
500
600
600
600
700
700800
Power recovered by turbine [W]
Engine speed [rpm]
Thro
ttle
open
ing
[%]
2000 2500 3000 3500 4000 4500 5000 55000
20
40
60
80
100
Figure 24: Power recovered by the turbine
When the heat released by condensation is calculated for the measurement results, the following graph is obtained.
0 5 10 15 20 25 30
0
100
200
300
400
Energy released by condensation vs. temperature drop
Temperature drop over turbine [�C]
Ene
rgy
rele
ased
by
cond
ensa
tion
[W]
Figure 25: Energy released by condensation during the experiment
SAE Int. J. Engines | Volume 2 | Issue 2488
Licensed to Technical University of EindhovenLicensed from the SAE Digital Library Copyright 2010 SAE International
E-mailing, copying and internet posting are prohibitedDownloaded Monday, October 04, 2010 3:46:10 AM
Author:Gilligan-SID:13440-GUID:37752499-131.155.56.78

For temperature drops up to 10 °C, no condensation occurs, so no heat is released. For higher temperature drops, the energy released increases linearly with the temperature drop. The maximum energy released by condensation for this experiment is about 435 W. At this same point, the energy from cooling the air is 830 W, so condensation is a very important feature during expansion in a turbine in these conditions.
When the effect of condensation is taken into account, the power recovered will be higher, see figure 26. This power is calculated using equation 10. Compared to figure 24, there is no difference until 2750 rpm. Above that engine speed the difference increases with engine speed. This was expected because the energy released by condensation increases with temperature drop over the turbine, see also fig. 22.
200
200
200
400
400
400
600600
600
800800
800
1000
1000
1000
1200
Power recovered by turbine, including condensation [W]
Engine speed [rpm]
Thro
ttle
open
ing
[%]
2000 2500 3000 3500 4000 4500 5000 55000
20
40
60
80
100
Figure 26: Power recovered by the turbine, including the
effect of condensation
At first glance, condensation seems to have a negative effect on the cooling capacity of the air coming out of the turbine. Water drops would flow with the air and the temperature would be higher because of condensation, which decreases the heat flux from the air conditioning fluid in the heat exchanger. When looking more closely, it is possible to catch the water drops in the heat exchanger. When these drops evaporate, the convection coefficient would be higher and so would the heat flow. However, at this moment in time such an effect has not yet been experimentally verified.
Turbine size - Two turbine maps are plotted in figure 27. The blue line is data from a Garrett GT1241 [11]. The blue stars are measurement data from the Garrett GT1238 used here and the black line is fitted on this data. Both lines have the same shape and it looks like one line is attainable by multiplying the other with a constant. The larger turbocharger can take a mass flow rate more than twice as big as the small one. This is probably due to a combination of a larger turbine wheel and different housing shape, which has a big influence on turbocharger behavior.
When comparing the GT1238 turbine map from figure 27 with the mass flow rates and pressures in figures 14 to 17 it is clear that the turbine is too large for the engine. This is the reason of the imposed engine operating line in figure 12. It is not possible to reach normal vehicle speeds with this turbocharger as an engine control device.
Figure 27: Turbine maps of two turbochargers
Engine Efficiency improvement - In the throttle loss model and experiment, throttling losses were calculated for a number of car speeds, see figure 20. At these speeds, the engine works at operating points which are not reachable with the turbine used here. Because the line in figure 12 is imposed as a working line by the turbine, two operating points are chosen from the throttle loss results found above and corresponding data from the model is recalculated for these points.
The first point is 95 Nm at an engine speed of 3000 rpm. Translated to driving this would mean accelerating when preparing to join traffic on the highway. So this is in the upper range of engine operating points that would be encountered in real life. The second operating point is 50 Nm at an engine speed of 5000 rpm, which is equivalent to driving a steady 155 km/h.
In table 5 below, some variables from the operating point data are outlined. From these data, some additional powers and efficiencies are calculated. Total power saved, alternator power and air conditioning compressor power are calculated using equations 16, 17 and 18 respectively. The percentage of throttling losses recovered indicates how much of the throttling losses are converted to turbine power. And finally the fuel consumption improvement, which is an indication of fuel savings as a result of the engine having to deliver less power.
1 1.5 2 2.5 3 10 15 20
25 30 35 40 45 50 55
Turbine maps of Garrett GT1241 and GT1238
Pressure ratio [-]
GT1241
GT1238
Cor
rect
ed m
ass
flow
rate
[g/s
]
SAE Int. J. Engines | Volume 2 | Issue 2 489
Licensed to Technical University of EindhovenLicensed from the SAE Digital Library Copyright 2010 SAE International
E-mailing, copying and internet posting are prohibitedDownloaded Monday, October 04, 2010 3:46:10 AM
Author:Gilligan-SID:13440-GUID:37752499-131.155.56.78
0 0.2 0.4 0.6 0.8 1300
350
400
450
Fuel
con
sum
ptio
n [g
]
Fuel consumption and improvement over drive cycle
Efficiency of throttling loss recovery �RECOVER [-]0 0.2 0.4 0.6 0.8 1
0
10
20
30
Fuel
con
sum
ptio
n im
prov
emen
t [%
]
Table 5: Energy recovery for two operating points
Variable Accelerate on highway
155 km/h steady state
Engine torque / speed 95 Nm / 3000 rpm
100 Nm / 5000 rpm
Engine power 28.5 kW 50 kW
Intake pressure 0.7 bar 0.55 bar
Measured/Model throttling losses
1125 W 1800 W
Max. turbine power 390 W 1100 W
Max. temperature drop over turbine
17 °C 26.5 °C
Variables calculated from above data
Alternator power 600 W 1650 W
Airco compressor power 160 W 440 W
Total power saved 760 W 2090 W
Perc. throttling losses recovered 35% 61 %
Fuel consumption improvement
3 % 4 %
It is clear from this table that only part of the throttling losses are recovered. The main reason for this is low turbine efficiency. When turbine efficiency is increased, the amount of throttling losses recovered will increase. The main reason for low turbine efficiency is a relatively large gap between the turbine housing and the wheel. This gap is caused by the low temperature the turbine operates at. This turbine was designed to heat up to a maximum of 800 °C. This temperature causes the turbine wheel to expand more (by material and operating temperature) than the housing, closing the gap between them. When this is solved, a maximum turbine efficiency of 70 to 80 % is realistic.
When looking at the fuel consumption improvement, it can be concluded that although the operating points are not ideal, there is still a substantial improvement in fuel consumption. Also if a larger part of throttling losses is recovered, fuel consumption improvement will be higher as well.
If the turbine were able to provide enough throttling to reach lower power operating points, as found in table 1, fuel consumption improvement would be higher because the ratio of engine power to power saved would be lower.
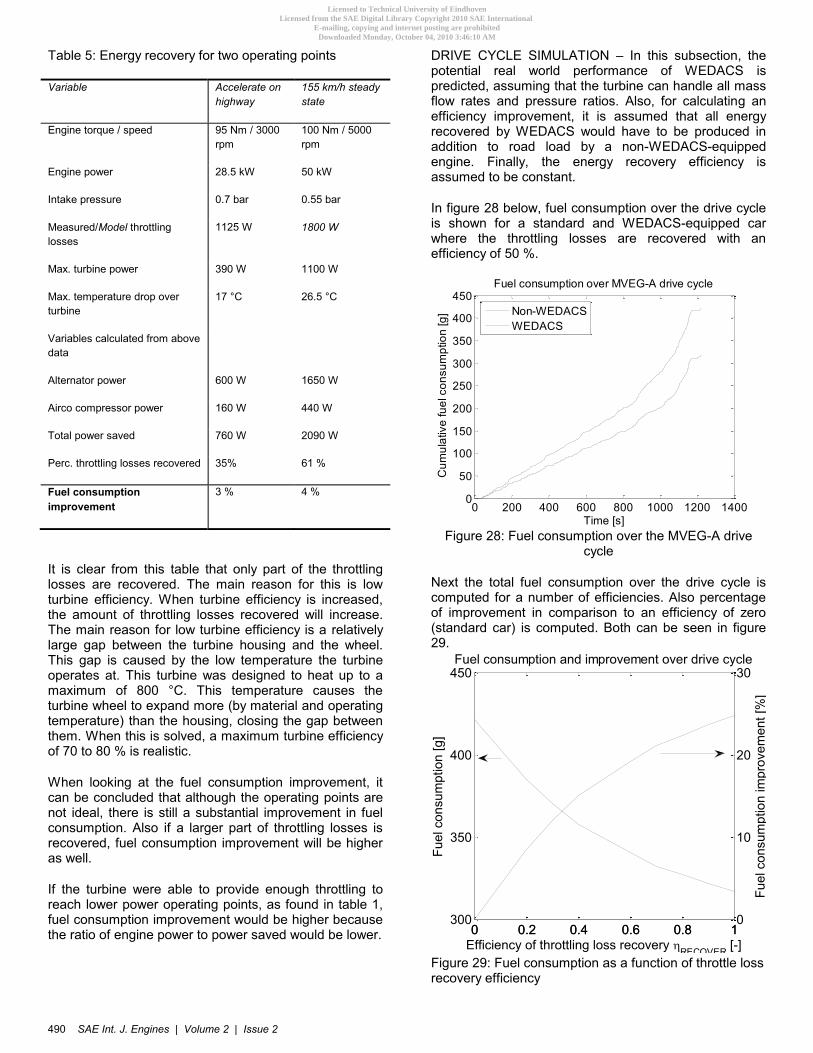
DRIVE CYCLE SIMULATION – In this subsection, the potential real world performance of WEDACS is predicted, assuming that the turbine can handle all mass flow rates and pressure ratios. Also, for calculating an efficiency improvement, it is assumed that all energy recovered by WEDACS would have to be produced in addition to road load by a non-WEDACS-equipped engine. Finally, the energy recovery efficiency is assumed to be constant.
In figure 28 below, fuel consumption over the drive cycle is shown for a standard and WEDACS-equipped car where the throttling losses are recovered with an efficiency of 50 %.
0 200 400 600 800 1000 1200 14000
50
100
150
200
250
300
350
400
450Fuel consumption over MVEG-A drive cycle
Time [s]
Cum
ulat
ive
fuel
con
sum
ptio
n [g
]
Non-WEDACSWEDACS
Figure 28: Fuel consumption over the MVEG-A drive
cycle
Next the total fuel consumption over the drive cycle is computed for a number of efficiencies. Also percentage of improvement in comparison to an efficiency of zero (standard car) is computed. Both can be seen in figure 29.
Figure 29: Fuel consumption as a function of throttle loss recovery efficiency
SAE Int. J. Engines | Volume 2 | Issue 2490
Licensed to Technical University of EindhovenLicensed from the SAE Digital Library Copyright 2010 SAE International
E-mailing, copying and internet posting are prohibitedDownloaded Monday, October 04, 2010 3:46:10 AM
Author:Gilligan-SID:13440-GUID:37752499-131.155.56.78

At efficiency values of 40 to 60 %, which appear realistic from the energy recovery experiment (table 5) an improvement of 15 to 19 % is made in fuel consumption over the MVEG-A drive cycle. This improvement is very large and is made under the assumption that the car is using all electric and cooling power the turbine produces. Also engine power is very low during the drive cycle. When looking at table 4 it can be seen that at low power operating points, throttle losses are very high relative to engine power (24 % at 50 km/h). In real life, people use more engine power than prescribed in drive cycles and don’t always use the air conditioning system. So real life performance of the system is expected to be lower.
CONCLUSION
In this paper we have introduced the new Waste Energy Driven Air Conditioning System (WEDACS). Some of its components and their requirements were treated. It was explained why a turbine and a high speed alternator can recover waste energy. Next, a model was built to predict throttling losses from a given fuel consumption map and relevant theory for the experiments was introduced. Experiments to validate the throttle loss model and the recovered energy were described. Results were shown to sufficiently validate the model. On a 2 liter gasoline engine, throttle losses were 1.2, 1.1 and 1.25 kW at 50, 80 and 120 km/h cruising, respectively. In the energy recovery experiment, it was found that the turbocharger, whilst being one of the smallest available, was too large and the measuring range had to be extended from 1500 – 3250 rpm to 1750 – 5500 rpm. Also the turbocharger was suffering from oil leakage and was not working on its usual operating temperature. Despite these problems, at a steady state vehicle speed of 155 km/h, 1.1 kW of throttling losses (61 %) were recovered, which corresponds to a fuel consumption improvement of 4 %. Additionally, the possibility of using turbine rotational speed to control engine power was investigated and discarded, because it was not useful. For a drive cycle simulation, the results from previous experiments were used to simulate a vehicle on a MVEG-A drive cycle and, assuming a turbine which can recover throttling losses in all conditions, a fuel consumption improvement of 15 to 19 % for a recovering efficiency of 40 to 60 % was found.
In the future, a different engine control strategy will have to be found and electric power conversion will have to be proven. In addition, practical cooling power in an air conditioning system must be investigated. The system will be installed in an actual car to prove practical use and drivability. This could be an issue, because the turbine needs some time to gain speed before it can control the engine at the requested operating point. Also cost of the system is a point of concern for practical introduction.
ACKNOWLEDGMENTS
The authors express their gratitude to Toon van Gils and Wietse Loor for their assistance in modification of the engine test bench; to Rick de Lange for sharing his knowledge on turbochargers; and to Frans Colombon from Coltrading B.V. for providing a rotational position controller free of charge.
REFERENCES
1. Helmut Eichlseder, Eckard Baumann, Stephan Rubbert, Peter Muller, “Gasoline Direct Injection-A Promising Engine Concept for Future Demands”, SAE-Paper 2000-01-0248, 2000.
2. Bernhard Ludwig, “Less CO2 thanks to the BMW 4-cylinder Valvetronic engine”, ATA vol. 56, 2003.
3. Lino Guzzella, et. al., “Recuperative Throttling of SI Engines for Improved Fuel Economy”, SAE-Paper 2004-01-0514, 2004.
4. J.Y. Wong, “Theory of ground vehicles”, John Whiley & sons, 2001, ISBN 0471354619.
5. W. Thaler, et al., “Design of a 100 W, 500000 rpm Permanent-Magnet Generator for Mesoscale Gas Turbines”, ATE Antriebstechnik und Entwicklungs GmbH, Leutkirch 2005.
6. Uwe Tielkes, Rudolf J. Menne, Stefan Hügen, Joachim Hansen, “Die neue Ottomotoren-Generation Duratec HE von Ford (1)”, MTZ vol. 2000-10, 2000.
7. Willard. W. Pulkrabek, “Engineering fundamentals of the internal combustion engine”, Pearson Prentice-Hall, 2004, ISBN 0131918559.
8. Horst Bauer (ed.), “Automotive Handbook 4th Edition”, Robert Bosch GmbH, Stuttgart, 1996, ISBN 0837603331.
9. Yunus A. Çengel, Micheal A. Boles, “Thermodynamics, an engineering approach”, McGraw-Hill, 2002, ISBN 007121688X.
10. Lino Guzzella, Christopher Onder, “Introduction To Modeling And Control Of Internal Combustion Engine Systems”, Springer, 2004, ISBN 9783540222743.
11. TurbobyGarrett.com (2008), The Garrett GT1241 turbocharger: the smallest in the line of Garrett turbos, consulted at 7-12-2008.
SAE Int. J. Engines | Volume 2 | Issue 2 491
Licensed to Technical University of EindhovenLicensed from the SAE Digital Library Copyright 2010 SAE International
E-mailing, copying and internet posting are prohibitedDownloaded Monday, October 04, 2010 3:46:10 AM
Author:Gilligan-SID:13440-GUID:37752499-131.155.56.78

DEFINITIONS, ACRONYMS, ABBREVIATIONS
Subscripts:
A Air ac Air conditioning compressor alt Alternator atm Atmospheric bv Behind the throttle valve corr Corrected exh Exhaust gas f Fuel ft In front of the turbine fv In front of the throttle valve g Gas hsalt High speed alternator t Turbine (or time instance) throt Throttling tot Total v (Water) vapour
Latin symbols:
AFs Stoichiometric air-fuel ratio BSFC Brake specific fuel consumption Cp Specific heat of air at constant pressure Lv Latent heat of vaporisation P Power R Gas constant of air T Temperature Te Engine torque V� Volume flow Vd Displacement volume m� Mass flow rate p Pressure v specific volume
Greek symbols:
�� Efficiency �RECOVER Recovery efficiency �vol Volumetric efficiency � Air equivalence ratio Specific humidity � Density � Relative humidity � Rotational speed
SAE Int. J. Engines | Volume 2 | Issue 2492
Licensed to Technical University of EindhovenLicensed from the SAE Digital Library Copyright 2010 SAE International
E-mailing, copying and internet posting are prohibitedDownloaded Monday, October 04, 2010 3:46:10 AM
Author:Gilligan-SID:13440-GUID:37752499-131.155.56.78