Waste Capture Systems and Benthic Oxygen Demand DRAFT
17
AQUADYNAMIC SOLUTIONS SDN BHD – FINAL REPORT Page | 1 Aquadynamic Solutions Effects of Pen Waste Capture Systems on Benthic Oxygen Consumption in Macquarie Harbour, Tasmania. Final Report Tassal Group LTD
Transcript of Waste Capture Systems and Benthic Oxygen Demand DRAFT

AQUADYNAMIC SOLUTIONS SDN BHD – FINAL REPORT
P a g e | 1
Aquadynamic Solutions
Effects of Pen Waste Capture Systems on Benthic Oxygen Consumption in Macquarie Harbour, Tasmania.
Final Report
Tassal Group LTD

Waste Capture System Effects on Benthic Oxygen Demand – Tassal Group LTD
P a g e | 2
1 CONTENTS
2 Table of figures ..................................................................................................................................... 3
3 EXECUTIVE SUMMARY .......................................................................................................................... 4
4 INTRODUCTION ..................................................................................................................................... 5
4.1 Waste Capture Systems and Benthic Oxygen Demand ................................................................ 5
4.2 Study Objectives ........................................................................................................................... 5
5 APPROACH AND METHODOLOGY ......................................................................................................... 7
6 RESULTS............................................................................................................................................... 12
7 DISCUSSION ......................................................................................................................................... 14
8 CONCLUSIONS ..................................................................................................................................... 17
9 REFERENCES ........................................................................................................................................ 17

AQUADYNAMIC SOLUTIONS SDN BHD – FINAL REPORT
P a g e | 3
2 TABLE OF FIGURES
Figure 1 - Sampling site locations for the 2018 Benthic Oxygen Demand Studies. Detailed cage sampling
on Lease MF219 can be seen in Figure 2 below. .......................................................................................... 7
Figure 2: Sampling design for time series study around Tassal Lease MF 219. Circles represent fish cage
positions on Lease MF 219. ........................................................................................................................... 8
Figure 3 - Perspex tube with intact sediment collection core (80mm inner dia. 500mm length) collected
form site Control 1 (left); note the preserved sediment water interface. ADS member displaying a
successfully transferred sediment core to the incubation core tube (80mm inner dia. 200mm length)
from Cage 15 (right). ..................................................................................................................................... 9
Figure 4 - Sediment transferred to incubation cores, during a sampling trip to on-lease sites. .................. 9
Figure 5 - Initial dissolved oxygen measurements being taken in the field lab with the Hach LDO-101
dissolved oxygen probe. Note the insulated and temperature-controlled water bath set up in the
background. ................................................................................................................................................ 10
Figure 6 - Benthic oxygen consumption (as both mg O2 m-2 h-1 and µmol m-2 h-1) with distance east of the
edge of lease MF219, and at three control sites east of lease MF219 across the main harbour basin. Note
sediments at control stations collected from the same depth as sediments from 500m. Solid red line
indicated the mean O2 consumption of control sites (91.510 µmol m-2 h-1) with 1 SE (18.298) indicated
by red dashed lines. ................................................................................................................................... 12
Figure 7 - Benthic oxygen consumption (as both mg O2 m-2 h-1 and µmol m-2 h-1) at various cages on lease
MF219. Cages are ordered based on installation date of waste capture systems (WCS). Solid red line
indicates the mean O2 consumption of all cages (596.626 µmol m-2 h-1) with 1 SE (37.904) indicated by
red dashed lines. ........................................................................................................................................ 13
Figure 8 – From MHDOWG 2014 Figure 3.6 “Rates of oxygen consumption at harbour and farm scales (2
cages at each farm) in November 2012. Note that the second of the Farm 2 (MF219 Gordon Lease)) sites
was fallowed during the survey.” Red dotted line indicates the mean oxygen consumption rate
recorded at control sites and the solid line represents mean rates under cage sites during the February
2018 survey. ............................................................................................................................................... 14
Figure 9 - From Hargrave et al 1993-Figure 3A, Pereira et al. 2004-Figure 3, and MHDOWG 2014 Figure
3.7. A) Oxygen uptake rates in Bliss Harbour, Bay of Fundy, B) Loch Creran, and at Tassal C) Farm 1
“MF214” and D) Farm 2 “MF219 Gordon Lease”. Red dotted line indicates the mean oxygen
consumption rate recorded at control sites and the solid line represents mean rates under cage sites
during the February 2018 survey. .............................................................................................................. 16

Waste Capture System Effects on Benthic Oxygen Demand – Tassal Group LTD
P a g e | 4
3 EXECUTIVE SUMMARY
Fish farming can have the potential to impact the seabed beneath cages through over-enrichment of the
benthos by deposition of organic rich faeces and uneaten food wastes. Processing organic wastes
consumes dissolved oxygen (DO). Tassal have employed a system of liners suspended under the bottom
of the salmon cages that intercept falling feed and faeces wastes before they reach the seabed.
Aquadynamic Solutions (ADS) have been asked to quantify the effectiveness of this waste capture system
project, on mitigating excess oxygen demand as a result of deposited farm wastes.
This particular study was designed to examine the effects of waste capture systems on benthic oxygen
demand and is part of a broader three-part study involving ADS, Tassal, Aquenal and Marine Solutions.
ADS has focused on pelagic oxygen demand and raw faeces consumption of dissolved oxygen with the
support of Tassal while the other companies have focused on the collection and analysis of physical and
chemical data including the collect of faeces and background seston with sediment traps. These three
components will be used to provide an understanding of the amount of oxygen consumption that is being
avoided in the harbour as a result of using the Waste Capture Systems across Tassal sites.
For this benthic oxygen demand study, a two-part experiment was conducted by ADS to 1) quantify
variations in benthic oxygen demand over large spatial scales i.e. from the cage edge to 100’s of meters
from the lease, and 2) to quantify the variation in benthic oxygen demand as a result of the length of time
waste capture systems have been installed under individual cages.
Intact sediment cores were collected in February 2018 from beneath cages on lease MF219 (Gordon
Lease) as well as sites located 100m and 500m east of the active cages. Cores were also collected from 3
control sites across the Gould Basin, from the same depth as cores collected at the 500m site. Sediment
cores were incubated in a temperature controlled water bath and benthic oxygen demand was
determined from the change in dissolved oxygen concentration in the incubation core’s water column.
Benthic oxygen demand at the control sites were relatively low compared to sites nearer the lease, but
overall comparable to benthic oxygen demand from other non-farmed sites reported in MHDOWG 2014.
Benthic oxygen demand increased with proximity to the lease, most likely due to the increased flux of
farm wastes to the seabed.
Benthic oxygen demand under cages on the lease showed no significant pattern with respect to when
waste capture systems were installed or whether a system was installed at all. The mean rate of benthic
oxygen demand under the cages (597 µmol m-2 h-1) was much lower compared to rates reported from
other systems, and also nearly 5x lower than those rates reported in MHDOWG 2014 from under the
same lease (approaching 3000 µmol m-2 h-1). While sediment transport mechanisms may be responsible
for the high between group variation in rates among the lease sites, the low relative rate of benthic
oxygen demand observed from those sites suggests that the effect of waste capture systems may be
cumulative across the entire farm footprint.
Future studies should include comparisons of BnOD between whole farms with liners and farms without
liners to see the benefit of the WCS at the lease scale.

AQUADYNAMIC SOLUTIONS SDN BHD – FINAL REPORT
P a g e | 5
4 INTRODUCTION
4.1 WASTE CAPTURE SYSTEMS AND BENTHIC OXYGEN DEMAND
Fish farming primarily impacts the seabed through over-enrichment of the benthos by deposition of
organic rich faeces and uneaten food wastes. This deposition results in a change in seabed chemistry as
these wastes are processed by the sediment microbial community. Processing organic wastes consumes
dissolved oxygen (DO) until the supply of DO is extinguished, then the process continues via anaerobic
pathways. Many of the end products of anaerobic processing of organic wastes are toxic compounds such
as H2S (hydrogen sulphide) and NH4+/NH3 (ammonium/a, the sum of which is also referred to as Total
Ammonia Nitrogen or TAN).
Extreme organic enrichment of the seabed can lead sediments to become anoxic (devoid of oxygen), and
subsequently affect the ecology (namely species composition and abundance) (Pearson and Rosenberg
1978). The severity of the impacts to the benthos is directly related to the degree of organic deposition.
Macquarie Harbour’s seabed community may be especially prone to shifts from well-oxygenated to
oxygen-poor environments due to a combination of poor bottom water flushing and organic loading from
the Gordon River. These conditions have established frequent hypoxic (DO concentrations less than 2 mg
L-1) conditions at the southern end of the harbour (the head of the system) and measured through regular
environmental monitoring since the early 1990’s. Such conditions are likely exacerbated due to organic
loading via the Gordon River during periods of high discharge (flooding) organic inputs from fish farms.
Tassal have employed a system to mitigate the amount of farm-derived organic matter inputs reaching
the seabed. This system consists of a series of liners suspended under the bottom of the salmon cages
that intercept falling feed and faeces wastes before they reach the seabed. The waste is then collected by
a specialised vacuum collection vessel (every few days) and shipped out of the harbour, to be later
processed at a waste treatment facility. In theory this system allows Tassal to farm more fish while
reducing their associated farming impacts to that of a much smaller farm.
There is As this is a new concept within this unique farming system there is a need to assess the ability of
waste capture to reduce the flux of farm-derived organic matter to the seabed as well as the rate of the
resulting benthic oxygen demand.
4.2 STUDY OBJECTIVES
ADS have been asked to quantify the effectiveness of the waste capture system, on mitigating excess
benthic oxygen demand resulting from fish farms. Two experiments were conducted in late February 2018
and the objectives were:
1. Quantify the effects of the waste capture pens on benthic oxygen demand over a spatial scale
of 100s of meters (and across the main basin of the harbour)

Waste Capture System Effects on Benthic Oxygen Demand – Tassal Group LTD
P a g e | 6
2. Quantify the effects of implementing waste capture systems on benthic oxygen demand over
monthly/ seasonal time scales.
a. In short, examining areas of seabed that have been impacted by varying organic loading
as a result of when waste capture systems were installed.
i.e. some pens have will have had waste capture systems installed for 6 months while
others may only have had them installed for 3 months. Assuming both pens have had the
same amount of fish, comparing the benthic oxygen demand below each pen may give us
insight as to how the benthos may change over time and varying rates of seabed oxygen
demand.
This study will be the first estimation of benthic oxygen demand under waste capture systems and will
build upon the findings of other research participants in the overarching Tassal Post EMP Report.

AQUADYNAMIC SOLUTIONS SDN BHD – FINAL REPORT
P a g e | 7
5 APPROACH AND METHODOLOGY
Benthic Oxygen Demand (BnOD) sampling was organized into 2 experiments:
1. BnOD with distance from cages
Sediment cores were collected in triplicate at 100m and 500m distances east of the cages at
MF219, and from 3 control sites, opposite the ridge separating the Sophia and Gould basins
(Figure 1). All samples were collected where possible at the same depth (approximately 30-34
meters).
Figure 1 - Sampling site locations for the 2018 Benthic Oxygen Demand Study. Detailed cage sampling on Lease MF219 can be seen in Figure 2 below.

Waste Capture System Effects on Benthic Oxygen Demand – Tassal Group LTD
P a g e | 8
2. Time Series BnOD –
Sediment cores were collected in triplicate adjacent to cages on Lease MF219 (Gordon Lease)
where waste capture systems have been installed since June 2017. The length of time waste
capture systems have been installed under cages varied across the lease providing a research
opportunity to test whether benthic oxygen demand under cages could be related to the
installation date of the waste capture system at cage width spatial scales (Figure 2):
a. 2 cages on Lease MF219 were sampled that had no waste capture system installed (cages
2 and 15)
b. 3 cages on Lease MF219 were sampled that had a waste capture system installed since
October 2017 (cages 8, 14, and 18)
c. 2 cages on Lease MF219 were sampled that have had a waste capture system installed
since June 2017) (pens 15A and 17A).
Figure 2: Sampling design for time series study around Tassal Lease MF 219. Circles represent fish cage positions on Lease MF 219.
Intact sediment cores were collected from the seabed using a KD Kajak corer with an 80mm inner
diameter Perspex tube (Figure 3). Sediment Columns were transferred to clear Perspex incubation cores
(Figure 4) on the boat and transported to the lab in the dark.

AQUADYNAMIC SOLUTIONS SDN BHD – FINAL REPORT
P a g e | 9
Figure 3 - Perspex tube with intact sediment collection core (80mm inner dia. 500mm length) collected from site Control 1 (left); note the preserved sediment water interface. ADS member displaying a successfully transferred sediment core to the incubation core tube (80mm inner dia. 200mm length) from Cage 15 (right).
Figure 4 - Sediment transferred to incubation cores, during a sampling trip to on-lease sites.
Once at the lab, the sediment cores were allowed to equilibrate, with tops open, in a chilled (15 ± 1
degrees) recirculating water bath in the dark (Figure 5 - left). The equilibration period lasted 5 hours.
After the equilibration period, the water column of the cores was siphoned away, with care given not to
disturb the sediment water interface. The water column was then replaced with site water that was
collected concurrently with the sediment cores (at the sediment collection site). The water columns were
replaced because DO in the sediment cores during transport and equilibration periods may have been
Waste Capture System Effects on Benthic Oxygen Demand – Tassal Group LTD
P a g e | 10
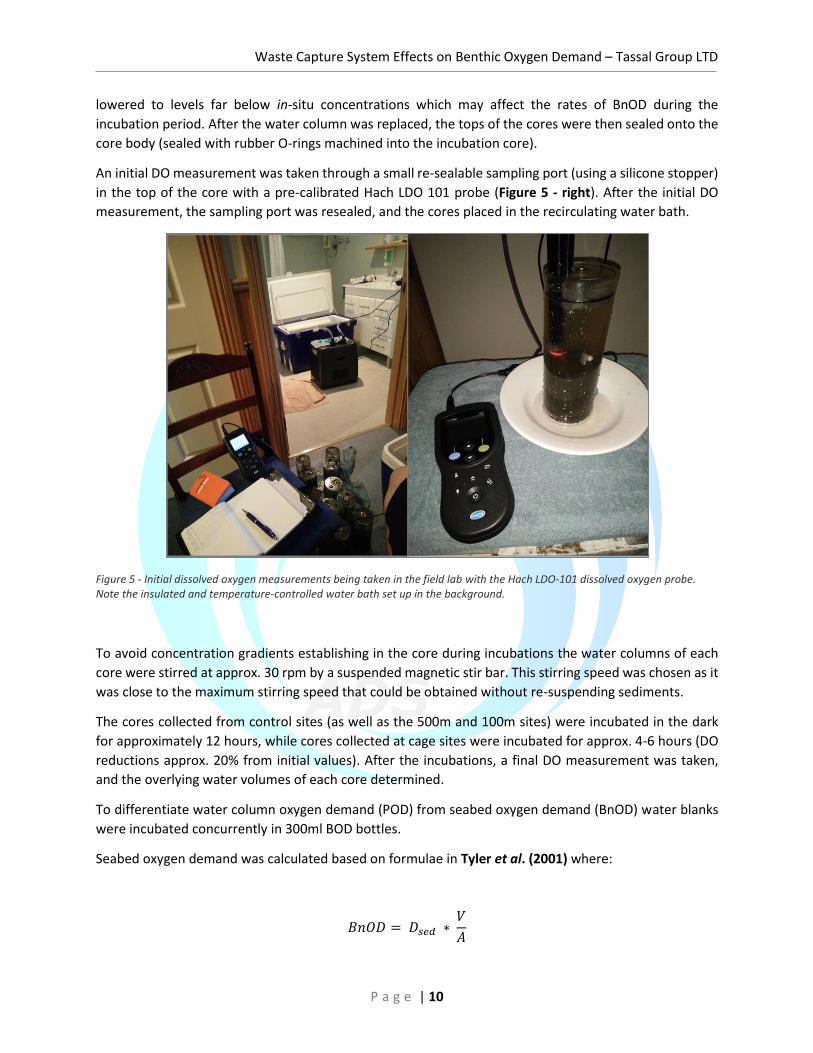
lowered to levels far below in-situ concentrations which may affect the rates of BnOD during the
incubation period. After the water column was replaced, the tops of the cores were then sealed onto the
core body (sealed with rubber O-rings machined into the incubation core).
An initial DO measurement was taken through a small re-sealable sampling port (using a silicone stopper)
in the top of the core with a pre-calibrated Hach LDO 101 probe (Figure 5 - right). After the initial DO
measurement, the sampling port was resealed, and the cores placed in the recirculating water bath.
Figure 5 - Initial dissolved oxygen measurements being taken in the field lab with the Hach LDO-101 dissolved oxygen probe. Note the insulated and temperature-controlled water bath set up in the background.
To avoid concentration gradients establishing in the core during incubations the water columns of each
core were stirred at approx. 30 rpm by a suspended magnetic stir bar. This stirring speed was chosen as it
was close to the maximum stirring speed that could be obtained without re-suspending sediments.
The cores collected from control sites (as well as the 500m and 100m sites) were incubated in the dark
for approximately 12 hours, while cores collected at cage sites were incubated for approx. 4-6 hours (DO
reductions approx. 20% from initial values). After the incubations, a final DO measurement was taken,
and the overlying water volumes of each core determined.
To differentiate water column oxygen demand (POD) from seabed oxygen demand (BnOD) water blanks
were incubated concurrently in 300ml BOD bottles.
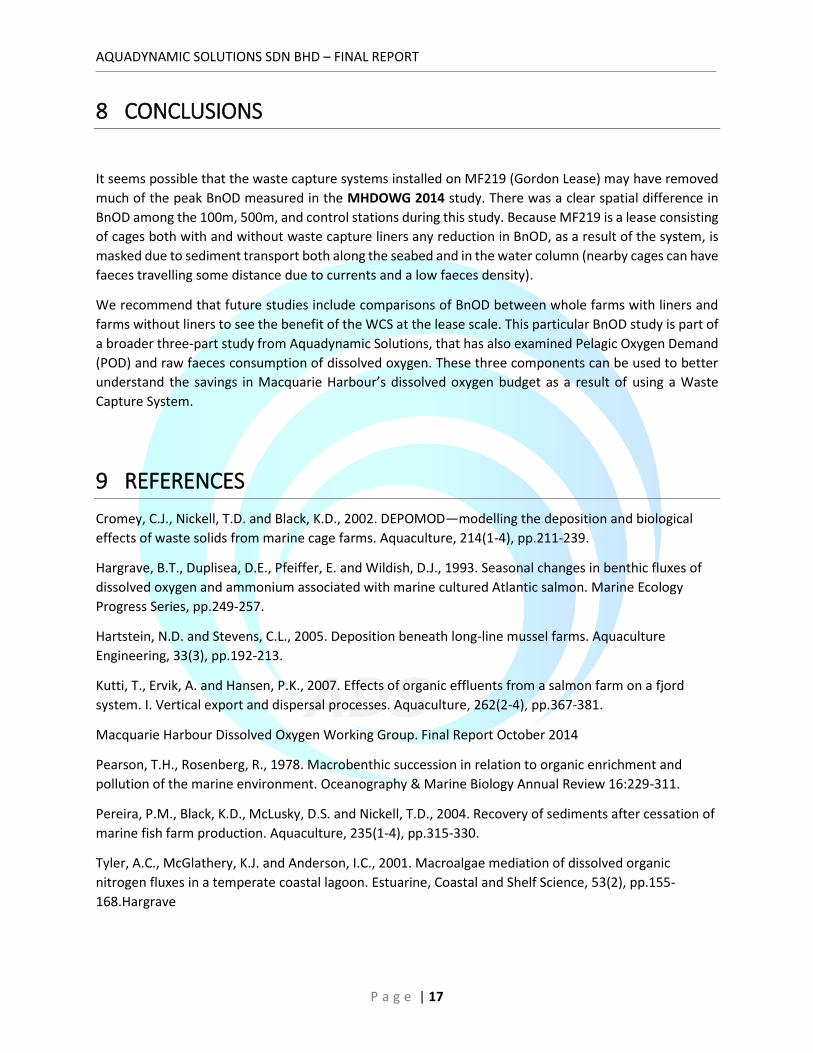
Seabed oxygen demand was calculated based on formulae in Tyler et al. (2001) where:
𝐵𝑛𝑂𝐷 = 𝐷𝑠𝑒𝑑 ∗ 𝑉
𝐴

AQUADYNAMIC SOLUTIONS SDN BHD – FINAL REPORT
P a g e | 11
𝐷𝑡𝑜𝑡 = 𝑑𝐶
𝑑𝑡−
𝑑𝑊
𝑑𝑡
Where BnOD is the seabed oxygen demand (Benthic Oxygen Demand), Dsed is the seabed contribution to
the change in the mass of oxygen over time, V is the overlying water volume in the incubation core, and
A is the surface area of the sediment in the incubation core. C is the combined contribution of the
sediment and water column to the change in oxygen mass in the core and W is the change in oxygen mass
in the incubation core due to the water column.

Waste Capture System Effects on Benthic Oxygen Demand – Tassal Group LTD
P a g e | 12
6 RESULTS
There was a clear distinction in BnOD rates between sites located on and near the lease and the off-lease
control sites. At the control stations, BnOD ranged from 1.963 (± 1.324) mg O2 m-2 h-1 (61.346 µmol m-2 h-
1) at Control 2 to 4.215 (± 0.321) mg O2 m-2 h-1 (131.716 µmol m-2 h-1) at Control 3 (Figure 6). There was no
significant difference in BnOD among the observed rates at the control sites (p = 0.304909).
Across the central harbour basin, and closer to the lease, BnOD increased slightly at the 500m site with
rates observed at 5.642 (± 0.805) mg O2 m-2 h-1 (176.314 µmol m-2 h-1). One hundred meters from the
cages, BnOD significantly increased to 11.540 (± 2.726) mg O2 m-2 h-1 (360.621 µmol m-2 h-1) (p = 0.006713).
Figure 6 - Benthic oxygen consumption (as both mg O2 m-2 h-1 and µmol m-2 h-1) with distance east of the edge of lease MF219, and at three control sites east of lease MF219. The solid red line indicates the mean O2 consumption of control sites (91.510 µmol m-2 h-1) with 1 SE (18.298) indicated by red dashed lines.
The distinctions between on-lease sites are less clear. There was no significant difference in BnOD
between cages (p = 0.111898). The range of BnOD rates observed below cages spanned from 14.430 (±
0.771) mg O2 m-2 h-1 (450.945 µmol m-2 h-1) at Cage 15 to 26.754 (± 1.795) mg O2 m-2 h-1 (836.047 µmol m-
2 h-1) at Cage 15A (Figure 7). The lowest on-lease BnOD and greatest BnOD measurements observed in
this study occurred in two cages whose centres are separated by approx. 70m and cage edges by approx.
30m. Moreover, the greatest rates observed among the cages were from a cage whose waste capture
system was installed in June 2017. The lowest BnOD was observed under a cage that never had a waste
capture system installed.

AQUADYNAMIC SOLUTIONS SDN BHD – FINAL REPORT
P a g e | 13
Figure 7 - Benthic oxygen consumption (as both mg O2 m-2 h-1 and µmol m-2 h-1) at various cages on lease MF219. Cages are ordered based on installation date of waste capture systems (WCS). The solid red line indicates the mean O2 consumption of all cages (596.626 µmol m-2 h-1) with 1 SE (37.904) indicated by red dashed lines.

Waste Capture System Effects on Benthic Oxygen Demand – Tassal Group LTD
P a g e | 14
7 DISCUSSION
The high BnOD observed on lease sites relative to the low BnOD observed at control sites is likely due to
the difference in the amount of labile organic material deposited to the seabed from the cages. The
control groups in this case represent the background level of BnOD in this portion of the harbour (mid
harbour) and are similar in magnitude to those rates reported at non-farmed sites in MHDOWG. (2014)
(Figure 8).
Approaching the lease, BnOD was observed to increase, again likely as a result of the increased organic
matter flux to the seabed from the cages, corroborating the observations of MHDOWG (2014) where the
greatest rates of BnOD were observed under farm sites.
On the lease, there were no distinct patterns in the rates of BnOD with respect to the length of time waste
capture systems had been installed, nor were there any significant differences among the cages (Figure
7). This is not surprising, since farm-derived solids would have to fall to a seabed approx. 30m deep and
would be subject to forces scattering the deposition possibly 10’s to 100’s of meters from its origin
(Cromey et al. 2002, Hartstein et al. 2005, Kutti et al. 2007) Ross (pers. comm) has observed chicken fat
compounds (a tracer of marine farm feed wastes) in sediments up to 500m from the cages highlighting
potential reworking of faeces on the seabed once initially deposited. Thus, it is probably better to consider
the effects of waste capture liners cumulatively, at the lease level, rather than on a cage by cage basis.
The observations reported here represent benthic conditions during the harvest period, and the seabed
within the farm footprint would be close to its most organically enriched state at this time of year. Yet the
highest rates of BnOD observed in 2018 fell well below the farm cage rates reported in MHDOWG (2014)
(Figure 8).
Figure 8 – From MHDOWG 2014 Figure 3.6 “Rates of oxygen consumption at harbour and farm scales (2 cages at each farm) in November 2012. Note that the second of the Farm 2 (MF219 Gordon Lease)) sites was fallowed during the survey.” Red dotted

AQUADYNAMIC SOLUTIONS SDN BHD – FINAL REPORT
P a g e | 15
line indicates the mean oxygen consumption rate recorded at control sites and the solid line represents mean rates under cage sites during the February 2018 survey.
The relatively low BnOD rates observed under the cages in this 2018 study, compared to the MHDOWG
(2014) study, may reflect the cumulative effect of waste capture liners on seabed oxygen demand. It is
worth noting that the rates reported in the 2014 study were from sediments collected in November when
cages are stocked at nearly peak biomass. Presumably the underlying seabed was not as organically
enriched as it would be post-harvest i.e. lacking two additional months of accumulated wastes from farms
at peak stocking.
Unfortunately, seasonal measurements of BnOD were beyond the scope of this study, however several
studies do provide seasonal BnOD rates such as Hargrave et al. (1993), Pereira et al. (2004), along with
MHDOWG (2014) (Figure 9). The rates observed in our study clearly fall below those rates measured in
Hargrave et al. (1993), and Pereira et al. (2004), regardless of season. However, the Bliss Harbour, Bay of
Fundy site from Hargrave et al. (1993), and the Loch Creran site from Pereira et al. (2004) may represent
sites with background levels of BnOD higher than those in the mid-harbour area of Macquarie Harbour,
and thus non-ideal comparisons. Of those studies, the MHDOWG (2014) may be the most comparable
since those observations were made on the same lease, and the adjacent lease, to the observations made
in this 2018 study. MHDOWG (2014) clearly report peak BnOD between the November and January
season, and their peak BnOD was measured at rates greater than 3x the peak BnOD observed in our 2018
study.
Without seasonal BnOD for the 2018 year it is impossible to say whether the waste capture systems
reduce the summer’s peak BnOD only, or whether BnOD is reduced year-round at the site. Clearly this has
implications for the overall dissolved oxygen budget for the harbour. Unfortunately, the 2014 study lacks
any information regarding oxygen flux between January and May (Figure 9).

Waste Capture System Effects on Benthic Oxygen Demand – Tassal Group LTD
P a g e | 16
Figure 9 - From Hargrave et al 1993-Figure 3A, Pereira et al. 2004-Figure 3, and MHDOWG 2014 Figure 3.7. A) Oxygen uptake rates in Bliss Harbour, Bay of Fundy, B) Loch Creran, and at Tassal C) Farm 1 “MF214” and D) Farm 2 “MF219 Gordon Lease”. Red dotted line indicates the mean oxygen consumption rate recorded at control sites and the solid line represents mean rates under cage sites during the February 2018 survey.
AQUADYNAMIC SOLUTIONS SDN BHD – FINAL REPORT
P a g e | 17
8 CONCLUSIONS
It seems possible that the waste capture systems installed on MF219 (Gordon Lease) may have removed
much of the peak BnOD measured in the MHDOWG 2014 study. There was a clear spatial difference in
BnOD among the 100m, 500m, and control stations during this study. Because MF219 is a lease consisting
of cages both with and without waste capture liners any reduction in BnOD, as a result of the system, is
masked due to sediment transport both along the seabed and in the water column (nearby cages can have
faeces travelling some distance due to currents and a low faeces density).
We recommend that future studies include comparisons of BnOD between whole farms with liners and
farms without liners to see the benefit of the WCS at the lease scale. This particular BnOD study is part of
a broader three-part study from Aquadynamic Solutions, that has also examined Pelagic Oxygen Demand
(POD) and raw faeces consumption of dissolved oxygen. These three components can be used to better
understand the savings in Macquarie Harbour’s dissolved oxygen budget as a result of using a Waste
Capture System.
9 REFERENCES
Cromey, C.J., Nickell, T.D. and Black, K.D., 2002. DEPOMOD—modelling the deposition and biological
effects of waste solids from marine cage farms. Aquaculture, 214(1-4), pp.211-239.
Hargrave, B.T., Duplisea, D.E., Pfeiffer, E. and Wildish, D.J., 1993. Seasonal changes in benthic fluxes of
dissolved oxygen and ammonium associated with marine cultured Atlantic salmon. Marine Ecology
Progress Series, pp.249-257.
Hartstein, N.D. and Stevens, C.L., 2005. Deposition beneath long-line mussel farms. Aquaculture
Engineering, 33(3), pp.192-213.
Kutti, T., Ervik, A. and Hansen, P.K., 2007. Effects of organic effluents from a salmon farm on a fjord
system. I. Vertical export and dispersal processes. Aquaculture, 262(2-4), pp.367-381.
Macquarie Harbour Dissolved Oxygen Working Group. Final Report October 2014
Pearson, T.H., Rosenberg, R., 1978. Macrobenthic succession in relation to organic enrichment and
pollution of the marine environment. Oceanography & Marine Biology Annual Review 16:229-311.
Pereira, P.M., Black, K.D., McLusky, D.S. and Nickell, T.D., 2004. Recovery of sediments after cessation of
marine fish farm production. Aquaculture, 235(1-4), pp.315-330.
Tyler, A.C., McGlathery, K.J. and Anderson, I.C., 2001. Macroalgae mediation of dissolved organic
nitrogen fluxes in a temperate coastal lagoon. Estuarine, Coastal and Shelf Science, 53(2), pp.155-
168.Hargrave