Washoe K-16 Data Profile - ed-alliance.org · Melisa Choroszy Associate Vice President for...
66
Truckee Meadows Community College ~ University of Nevada, Reno ~ Washoe County School District Prepared By: The Education Collaborative of Washoe County Joint Data Profile Committee October 2006 Washoe K-16 Data Profile WCSD 2005 Graduates Attending UNR and TMCC in 2005-06
Transcript of Washoe K-16 Data Profile - ed-alliance.org · Melisa Choroszy Associate Vice President for...

Truckee Meadows Community College ~ University of Nevada, Reno ~ Washoe County School District
Prepared By: The Education Collaborative of Washoe County
Joint Data Profile Committee
October 2006
Washoe K-16Data Profile
WCSD 2005 Graduates Attending UNR and TMCC in 2005-06

Truckee Meadows Community College ~ University of Nevada, Reno ~ Washoe County School District
Washoe K-16Data Profile
Prepared By: The Education Collaborative of Washoe County
Joint Data Profile Committee
October 2006
WCSD 2005 Graduates Attending UNR and TMCC in 2005-06

Washoe County School District
University of Nevada, Reno
Kendyl Depoali Superintendent, Public Policy, Accountability and Assessment
Jan Hall Data Analyst, Public Policy, Accountability and Assessment
Bill Cathey Vice Provost for Academic Affairs
Melisa Choroszy Associate Vice President for Records/Enrollment
John Mahaffy Director of Assessment
Nevada System of Higher Education Linda Heiss Director of Institutional Research
The Education Collaborative of Washoe County
Denise Hedrick Executive Director
Ginny Jackson Immediate Past President
Anne Loring Member of the Board of Directors
Truckee Meadows Community College Elena Bubnova Director of Institutional Research
Committee Members Page �
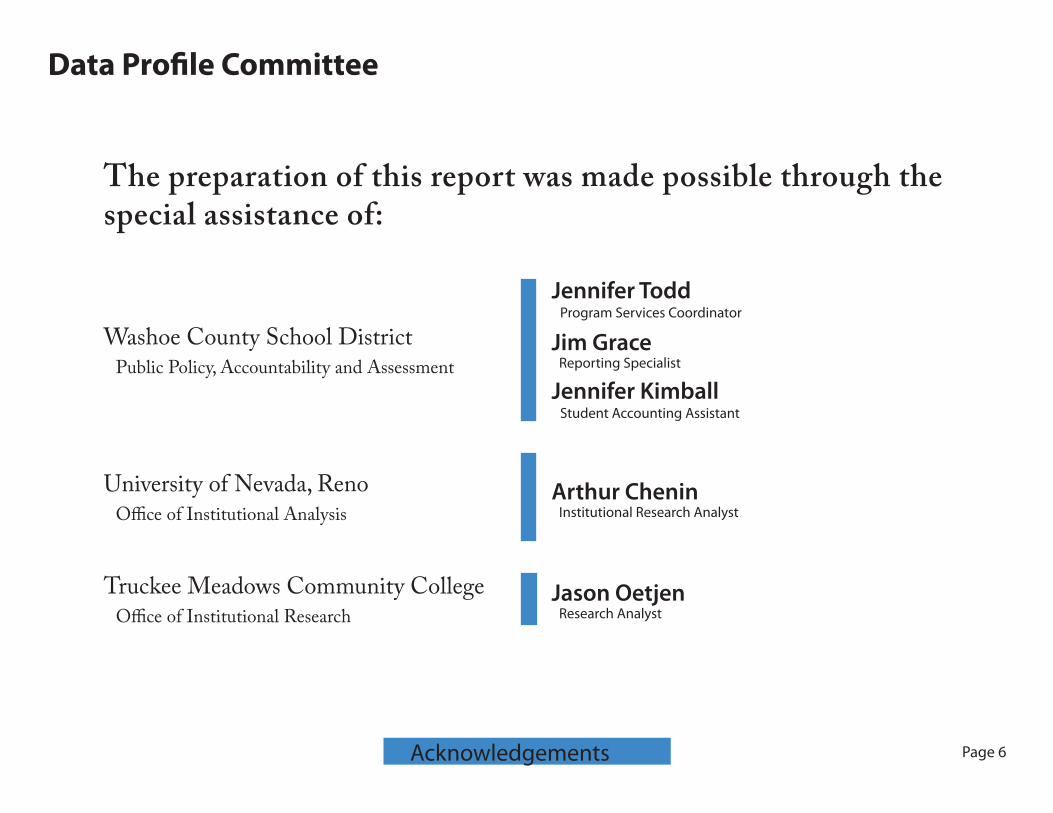
Data Profile Committee
Page �
Washoe County School District Public Policy, Accountability and Assessment
University of Nevada, Reno Office of Institutional Analysis
Jennifer Todd Program Services Coordinator
Jim Grace Reporting Specialist
Jennifer Kimball Student Accounting Assistant
Arthur Chenin Institutional Research Analyst
Acknowledgements
The preparation of this report was made possible through the special assistance of:
Data Profile Committee
Truckee Meadows Community College Office of Institutional Research
Jason Oetjen Research Analyst

Data Profile Participants
Page � Participants
WCSD High Schools1
Nevada System of Higher Education
Damonte RanchGalena
HugInclineMcQueenNorth ValleysReedRenoSpanish SpringsSparksTMCC HSWashoeWooster
Gerlach
University of Nevada, RenoTruckee Meadows Community College
1 Data are limited for high schools that opened after the initial year of this project: North Valleys (2001-02), Spanish Springs (2001-02) and Damonte Ranch (2003-04).

Tracked and analyzed data from the 199� WCSD graduating cohort
Established baseline dataCompared district trends with state and national
trends
»
»»
Page �
Introduction
First report completed in 199�
Added analyses of college admissions and college success of WCSD graduates from 199� through 200�
»
Research continued through 200�
Introduction
For the past nine years, the Washoe County School District, Truck-ee Meadows Community College and the University of Nevada, Reno have worked in concert through the Education Collaborative of Washoe County to produce the Washoe K-1� Data Profile, for-merly called the High School Data Profile. The Nevada Department of Education and the Nevada System of Higher Education have also participated in this effort. The Data Profile is the collection and presentation of data about Washoe County School District high school students and their matriculation into college, with special emphasis on the graduates who attend the University of Nevada, Reno and Truckee Meadows Community College. Through this effort, we hope to identify factors that can increase the suc-cess of our students as they proceed from high school to post-sec-ondary education. The Data Profile has expanded in scope each year. The 2002 edi-tion reported a two-year increasing trend in the percentage of Washoe County School District graduates enrolled in remedial English and/or mathematics courses at both UNR and TMCC. Con-cern about this trend and its potential impact on students led to an increased focus on the remediation issue for the 2003 through 200� editions of the Data Profile. This year’s report includes college success data for the first and second cohorts tracked by the Data Profile, the WCSD 199� and 199� graduating classes.
The Education Collaborative of Washoe County hopes that this and future issues of the Data Profile will continue to help educa-tors, parents, students, and our community better prepare our graduates for a successful transition into higher education and for continued success throughout their college careers.

Report Contents
Page 9 Contents
High School Measures
Graduation Rates
Dropout Rates
Enrollment in Higher Level Courses
College Entrance Exams
Millennium Scholarships
College Measures
Capture Rates
Remediation
College Entrance Exams
Persistence Rates
College SuccessCollege Graduation Rates
Major Areas of Study
Summary Trends in 2004-05 Data
WCSD-UNR Alumni Survey Results
Pages 13-1�
Pages 33-3�
Pages 19-32
Page 39
Pages 40-49
Pages �0-��
Pages �0-�3
Pages ��-�9
Pages �4-��
Page ��
Pages 10-12
Pages ��-��
Pages 1�-1�

Page 10 Summary
Summary of Data Trends WCSD Graduates Including the Class of 200�
High School Trends
As WCSD begins to implement the Gateway Curriculum, baseline data show that a significantly higher percentage of 200� graduates earned four math credits (4�% v. 3�%) and earned math credit beyond Algebra 3-4 (3�% v. 30%), compared to 2004 graduates. The percentage of graduates who earned three science credits and the percentage who took at least six credits in their senior year was approximately the same in 200� as in 2004 (science credits, �9% in 200� v. ��% in 2004; � credits in senior year, 4�% in 200� v. 4�% in 2004). Pages 33-34
The percentage of WCSD juniors and seniors enrolled in Advanced Placement courses increased from 1�% in the 199�-199� school year to 2�% for 2004-200�. Forty-nine percent of the 2004-200� AP students earned a score of 3 or higher on the AP test, a decrease from 2003-04, when ��% of AP students earned a score of 3 or higher. The percentage of graduates who have taken at least one AP or IB exam has risen at seven high schools since the Data Profile began tracking that information in 2003. Pages 35-37
As in previous years, the average ACT and SAT scores for the class of 200� exceeded average scores for both the state and the nation. Although slight decreases have occurred between some adjacent years, both ACT and SAT scores have demonstrated an overall increasing trend over the previous twelve years (1994-200�). Pages 19 (ACT) and 26 (SAT)
In 200�, SAT participation equaled ACT participation (both at 3�%), which is a change from previous years, when smaller proportions of students participated in the SAT compared to the ACT. The 3�% SAT participation rate for 200� nearly equaled SAT participation in 199� (39%). In contrast, 200� ACT participation (3�%) was lower than 199� ACT participation (49%). Pages 24 (ACT) and 31 (SAT)
The percentage of WCSD 200� graduates eligible for the Millennium Scholarship (�2%) dropped compared to that for 2004 gradu- ates (��%), which may reflect the increase in required GPA in 200�. Page 39
»
»
»
»
»

Page 11 Summary
College Trends
Nearly �0% of WCSD 200� graduates went on to higher education in the fall immediately following graduation. This percentage is higher than the 2004 national average of ��% (the most recent year for which national rates are available). Since 199� the percent- age of WCSD graduates going on to UNR or TMCC in the fall following graduation has risen from 3�% to ��%. Page 41
The number of WCSD graduates who attended UNR and TMCC in the fall immediately following high school graduation has in- creased from �42 in 199� to 1,�13 in 200�. Page 44
The percentage of WCSD graduates who attended UNR and TMCC in the fall immediately following high school graduation has in- creased from 4�% in 2000 – the first year of the Millennium Scholarship -- to ��% in 200�. Over this six-year span the percent- age attending UNR has remained steady at around 30% (± 2 percentage points), while the percentage attending TMCC has increased from 19% to 2�%. Page 45
With the exception of the Hispanic population, the ethnic diversity of WCSD graduates who entered UNR or TMCC as freshmen in 200� closely mirrored that of the WCSD Class of 200�. The percentage of WCSD Hispanic graduates who entered TMCC was higher than their percentage among graduates, and the percentage who entered UNR was lower than their percentage among graduates. Page 49
Almost 40% of WCSD graduates entering UNR in 200� were in need of remediation in math and almost the same percentage in English. Over three-quarters of WCSD graduates entering TMCC in 200� were in need of remediation in math and almost three-quar- ters in English. Page 51
Persistence rates of WCSD graduates at TMCC and UNR have remained steady over the past five years. Approximately �0% of WCSD graduates attending TMCC return after one semester, and about �0% return after two semesters. Approximately 90% of WCSD graduates attending UNR return after one semester, and about �9% return after two semesters. Page 57
The average composite ACT score for 200� WCSD graduates attending UNR was the same as the average score for 2004 graduates (22.4), while the mean combined SAT score was slightly lower (10�3 for 200� graduates compared to 10�� for 2004 gradu- ates). Pages 60 (ACT) and 62 (SAT)
»
»
»
»
»
»
»
WCSD Graduates Including the Class of 200�Summary of Data Trends

Page 12 Summary
Summary of Data Trends
Recommendations for Future Work
Examine Washoe County data at the four key transition points from high school to completion of a college degree: high school graduation rate, college-going rate, persistence rate after two college semesters, college graduation rate.
Continue to disaggregate selective data sets by student ethnicity.
Continue to improve the capability to identify factors that promote or retard student success in higher education.
»
»
»
College Success Trends: WCSD 199� and 199� Graduates
Twenty-eight percent of the students who graduated from WCSD in 199� (the first cohort studied by the Data Profile project) have earned a college degree. Similarly, 2�% of WCSD students who graduated in 199� have earned a college degree. Page 64
The Class of 199� had more graduates receive college Bachelor’s degrees in natural sciences and education than did the Class of 199�. Social sciences, arts/humanities and business/economics majors accounted for the largest number of Bachelor’s degrees in both years. Page 66
WCSD Graduates of UNR 2001-2004
Forty-nine percent of UNR’s graduates were WCSD high school graduates. Page 67
Fifty-eight percent of WCSD-UNR graduates are employed in Washoe County (figure includes graduate assistants at UNR). Of WCSD graduates of UNR employed in Washoe and other northern Nevada counties, the top employers are education (29%); health occupa- tions (13%); and in business, finance, real estate, or law (10%). Pages 67-68
The median salary range of WCSD-UNR graduates was $30,000-$40,000. Page 68
»
»
»
»
»

Graduation Rate1
Percentage of Graduates by Ethnicity
High School Data: Graduation Rate
2005
Page 13
1. Formula used: 100 x standard diplomas + adult diplomas completers+current year12th grade dropouts+1 year previous 11th grade dropouts+2 years previous 10th grade dropouts+3 years previous 9th grade dropouts
Where “completers” = Standard, Adult and Adjusted diplomas, plus Certificates of Attendance

HIGH SCHOOLS All Students African American
American Indian Asian Hispanic White
% N % N % N % N % N % NDamonte Ranch 76% 62 - - - - - - 70% 14 80% 43Galena 84% 306 - - - - 77% 17 49% 20 91% 261Gerlach - - - - - - - - - - - -Hug 56% 145 - - - - 38% 12 60% 78 59% 42Incline 87% 74 - - - - - - - - 97% 63McQueen 85% 359 - - - - 98% 42 61% 19 86% 281North Valleys 74% 255 - - - - 83% 10 67% 41 75% 196Reed 80% 415 54% 13 - - 81% 30 68% 41 84% 326Reno 84% 307 - - - - 84% 26 62% 18 88% 257Spanish Springs 80% 258 - - - - - - 76% 28 69% 209Sparks 57% 104 - - - - - - 41% 31 69% 59TMCC HS 93% 64 - - - - - - - - 92% 54Washoe2 32% 75 - - - - - - 33% 28 32% 38Wooster 69% 177 - - - - 80% 16 54% 51 75% 98WCSD Overall 74% 2607 61% 70 58% 43 75% 177 56% 386 81% 1931
Graduation Rate1
Percentage of Graduates by Ethnicity
High School Data: Graduation Rate
1. Formula used: 100 x standard diplomas + adult diplomas/ completers+current year 12th grade dropouts+1 year previous 11th grade dropouts+2 years previous 10th grade dropouts+3 years previous 9th grade dropouts2. Washoe High School is an alternative school.’-’ Indicates fewer than 10 students in the population category N = Number of regular, advanced, honors and adjusted diplomasDistrict averages include schools with fewer than 10 students in a population, and are therefore higher than the average of the column percentages.
2005
Page 14

Types of Diplomas AwardedPercentage of Advanced, Honors, Standard and Adjusted Diplomas by Group
Example: Of the Hispanics who graduated from a WCSD high school in 2005, 52% earned standard diplomas, 31% earned advanced or honors diplomas and 17% earned adjusted diplomas.
2005
Page 1� High School Data: Diplomas

Dropout Rates
High School Data: Dropouts
2005
Page 1�
The Nevada Department of Education (NDE) calculates annual dropout rates for Nevada high schools and publishes the rates for each school, each district, and for the state overall.
A dropout is a grade 9 through 12 student who: Withdrew at the request of the school, orWithdrew for personal reasons (i.e. employment, failing grades, incarceration), orHas been absent for ten consecutive school days and his/her whereabouts are unknown, orCompleted the previous high school year, but failed to enroll as expected the following school year, and:
»»»»
has not graduateddid not complete a state or district approved instructional program (GED recipients are not counted as dropouts)did not transfer to another schoolhas not died
»»»»
Nevada Dropout Rate Formula2
1 Source: Nevada Department of Education presentation to the Legislative Committee on Education, April 12, 20062 This formula is consistent with the National Center for Education Statistics, Annual Student rate
The Effects of Reclassification and Revised Methods for Tracking Dropouts
In the 1999-2000 school year, Nevada instituted grade reclassification of students who had insufficient credits for their current grade level. This affected the population of dropouts, and resulted in a 1999-2000 dropout rate that is not comparable to previous years.
In 2002-2003, the NDE revised the method for counting dropouts by allowing verbal reports of students enrolling in another district to replace an official records request from the other district. This decreased the number of students who met the dropout criteria, so again, the 2002-2003 dropout rate is not comparable to previous years.
In 2004-200�, WCSD implemented a comprehensive process of tracking non-returning students, to determine which were true dropouts and which had actually transferred or completed a GED. This further decreased the number of students who met the dropout criteria for the 2004-200� school year.
total number of dropouts + total number of non-returning students total enrollment + total number of non-returning students
Dropout Defined1

Dropout RatesPercentage of Grade 9-12 Students Who Dropped Out During the School Year
High School Data: Dropouts
2005
Page 1�
Nevada in-stituted reclas-sification
Verbal report of whereabouts replaced official request for re-cords
WCSD instituted comprehensive tracking of no-shows

Dropout Rates by High SchoolPercentage of Grade 9-12 Students Who Dropped Out During the School Year
High School Data: Dropouts
HIGH SCHOOLS2000-01 2001-02 2002-03 2003-04 2004-05
Dropout definition revised by NDE 2
WCSD begins to track no-shows3
% N % N % N % N % NDamonte Ranch Not Open Not Open Not Open Not Open Not Open Not Open 1.6% 9 1.1% 10
Galena 1.1% 18 2.5% 47 1.9% 38 1.2% 21 1.4% 21
Gerlach 2.7% 1 2.9% 1 0.0% 0 6.5% 2 0.0% 0
Hug 5.9% 125 5.9% 78 7.2% 92 3.5% 44 2.8% 36
Incline 0.7% 3 2.7% 11 1.2% 5 0.5% 2 1.5% 6
McQueen 2.5% 50 1.7% 33 0.9% 17 2.5% 47 1.9% 37
North Valleys Not Open Not Open 2.5% 35 2.5% 44 3.2% 63 1.7% 35
Reed 2.7% 68 1.3% 29 1.8% 40 3.7% 88 0.8% 20
Reno 2.8% 49 2.1% 35 1.7% 29 1.4% 25 1.3% 24
Spanish Springs Not Open Not Open 1.3% 15 1.7% 27 2.2% 40 1.1% 12
Sparks 1.4% 28 1.7% 23 1.9% 22 1.6% 19 0.9% 17
TMCC HS 2.4% 5 2.4% 5 0.6% 1 1.2% 2 1.7% 3
Washoe1 33.0% 224 26.2% 158 10.0% 53 13.8% 66 14.7% 97
Wooster 3.6% 55 4.0% 62 5.2% 80 1.8% 26 1.5% 231 Washoe HS is an alternative learning site. 2 In 2002-03 the NDE began allowing verbal reports of whereabouts to replace official records requests. Drop out rates are not comparable to previous years.3 Beginning with the 2004-2005 school year, WCSD instituted comprehensive tracking of no-shows, to determine which had transferred and which were true dropouts.More detail on dropout rates, including rates by ethnicity, are available at: http://www.nevadareportcard.com
Page 1�

ACT Composite Score Longitudinal TrendsWCSD, Nevada and National 1993-200�
High School Data: ACT Page 19
ACT scores are reported on a scale from 1 to 36. For purposes of this comparison, the scale has been reduced to enhance visual discrimination.

ACT Math ScoresWCSD, Nevada and National Comparisons
Page 20 High School Data: ACT
ACT scores are reported on a scale from 1 to 36. For purposes of this comparison, the scale has been reduced to enhance visual discrimination.

ACT Math Scores by High School
Page 21 High School Data: ACT
High Schools 2001 2002 2003 2004 2005Damonte Ranch Not Open Not Open Not Open Not Open -Galena 22.2 22.1 21.6 22.2 23.5Gerlach - - - - -Hug 20.9 20.6 19.8 19.5 18.7Incline 21.3 21.6 24.5 - -McQueen 23.3 23.3 23.7 23.3 22.4North Valleys Not Open Not Open 19.7 20.7 20.1Reed 21.1 21.7 22.0 21.1 21.6Reno 23.0 24.6 24.5 23.2 23.2Spanish Springs Not Open Not Open 20.2 20.4 21.6Sparks 20.4 19.9 20.5 19.9 19.4TMCC HS 22.4 20.8 - - -Washoe - - - - -Wooster 22.1 23.1 22.7 22.8 22.9WCSD Average1 21.9 22.2 22.1 21.9 21.9
1 The WCSD average is higher than the average of school scores listed in this table because Damonte Ranch, Gerlach, TMCC and Washoe had fewer than 30 students who took the ACT. Individual school test data are not published for schools with fewer than 30 ACT participants, but the participants’ scores are included in district totals.ACT-Math Scores are reported on a scale from 1 to 36‘-’ Denotes too few students tested to report.
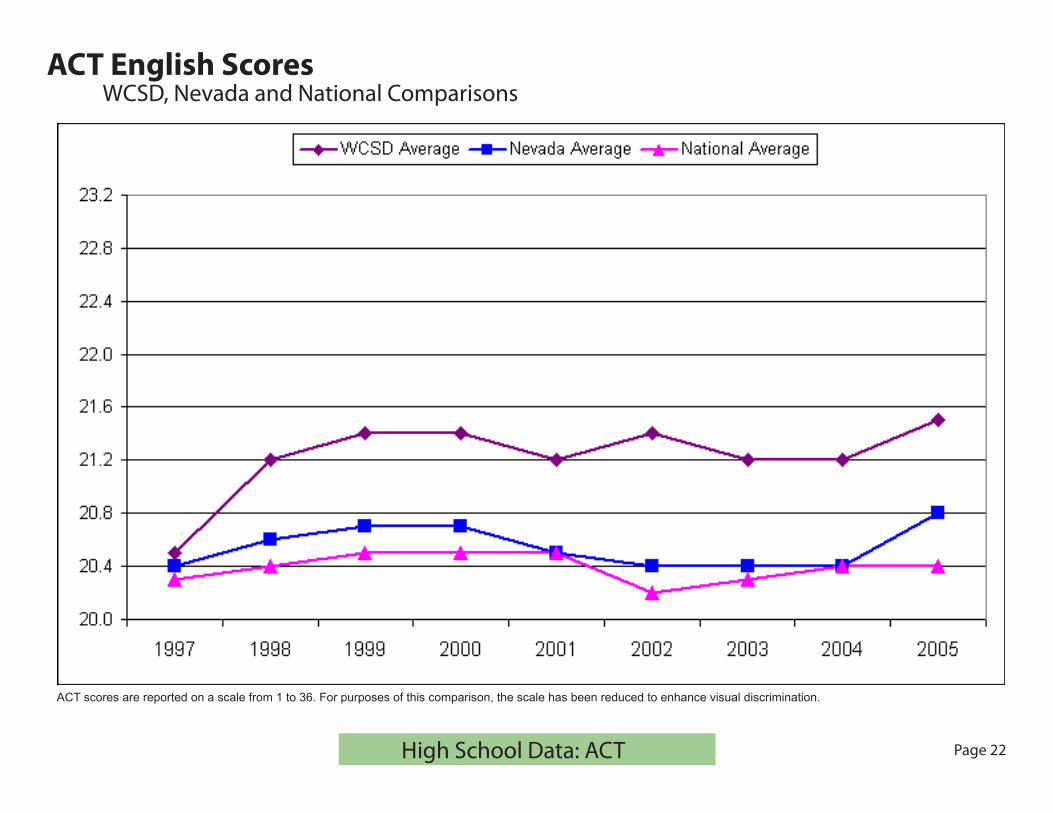
ACT English ScoresWCSD, Nevada and National Comparisons
ACT scores are reported on a scale from 1 to 36. For purposes of this comparison, the scale has been reduced to enhance visual discrimination.
Page 22 High School Data: ACT

ACT English Scores by High School
Page 23 High School Data: ACT
High Schools 2001 2002 2003 2004 2005Damonte Ranch Not Open Not Open Not Open Not Open -Galena 21.9 21.9 20.8 22.3 22.9Gerlach - - - - -Hug 19.3 18.5 18.8 17.8 17.9Incline 21.7 22.7 24.0 - -McQueen 21.7 22.0 22.0 22.3 21.8North Valleys Not Open Not Open 19.0 19.9 20.1Reed 20.3 20.7 21.3 20.1 21Reno 23.5 23.5 23.5 22.2 23.3Spanish Springs Not Open Not Open 19.1 20.2 21.4Sparks 20.3 19.9 20.5 19.1 19.8TMCC HS - - - - -Washoe - - - - -Wooster 20.9 20.5 21.5 21.3 21.8WCSD Average* 21.2 21.4 21.2 21.2 21.5
ACT-English Scores are reported on a scale from 1 to 36*The WCSD average is higher than the average of school scores listed in this table because Damonte Ranch, Gerlach, TMCC and Washoe had fewer than 10 students who took the ACT. Individual school test data are not published for schools with fewer than 30 ACT participants, but the participants’ scores are included in district totals.‘-’ Denotes too few students tested to report.

ACT ParticipationNumber and Percentage of WCSD Graduates Who Took the ACT
Page 24 High School Data: ACT

ACT ParticipationWCSD Graduates Who Took the ACT by High School
HIGH SCHOOLS
2001 2002 2003 2004 2005N % N % N % N % N %
Damonte Ranch Not Open Not Open Not Open Not Open Not Open Not Open Not Open Not Open - -Galena 133 46% 178 46% 183 55% 183 48% 164 52%Gerlach - - - - - - - - - -Hug 92 32% 78 25% 48 24% 34 23% 42 24%Incline 31 33% 27 33% 35 42% - - - -McQueen 211 57% 228 55% 229 54% 188 49% 159 42%North Valleys Not Open Not Open Not Open Not Open 103 45% 101 41% 95 35%Reed 251 56% 225 49% 223 51% 155 40% 206 45%Reno 168 52% 137 43% 124 42% 107 33% 116 36%Spanish Springs Not Open Not Open Not Open Not Open 72 37% 62 23% 110 39%Sparks 138 48% 109 39% 66 36% 55 37% 48 36%TMCC HS 40 38% 37 30% - - - - - -Washoe - - - - - - - - - -Wooster 90 42% 64 28% 71 40% 65 34% 76 38%Total1 1166 46% 1092 40% 1185 42% 996 36% 1075 38%
Page 2� High School Data: ACT
1 Total numbers are higher than the sum of individual schools because Gerlach, TMCC and Washoe had too few students tested to report. Individual school test data are not published for schools with fewer than 30 ACT participants, but the participants are included in district totals.Corrections have been made to data from previous years.‘-’ Denotes too few students tested to report.

SAT Combined Score Longitudinal TrendsWCSD, Nevada and National 1993-200�
Page 2� High School Data: SAT
The maximum combined SAT score is 1600. For the purposes of this comparison, the scale has been reduced to enhance visual discrimination.The SAT was re-centered for the 1993-1994 and 1994-1995 school years. Score comparisons from previous years are not valid.

SAT Verbal ScoresWCSD, Nevada and National Comparisons
Page 2� High School Data: SAT
SAT Verbal scores range from 200 - 800, with 500 considered average. For purposes of this comparison, the scale has been reduced to enhance visual discrimination

SAT Verbal Scores by High School
Page 2� High School Data: SAT
High Schools 2001 2002 2003 2004 2005Damonte Ranch Not Open Not Open Not Open Not Open -Galena 526 519 531 533 544Gerlach - - - - -Hug 515 479 - - 483Incline 540 526 533 545 534McQueen 530 549 564 555 535North Valleys Not Open Not Open 486 511 499Reed 510 517 534 510 525Reno 549 559 558 549 556Spanish Springs Not Open Not Open 484 486 524Sparks 492 532 - - -TMCC HS 580 571 559 534 553Washoe - - - - -Wooster 522 512 525 514 530WCSD Average1 529 533 539 530 533
1 The WCSD average is higher than the average of school scores listed in this table because Damonte Ranch, Gerlach, Sparks and Washoe had fewer than 20 students who took the SAT. Individual school test data are not published for schools with fewer than 20 SAT participants, but the participants’ scores are included in district totals.‘-’ Denotes fewer than 20 students tested

SAT Math ScoresWCSD, Nevada and National Comparisons
Page 29 High School Data: SAT
SAT-Math scores range from 200 to 800. For purposes of this comparison, the scale has been reduced to enhance visual discrimination.

SAT Math Scores by High School
Page 30 High School Data: SAT
SAT-Math scores range from 200 to 800. *The WCSD average is higher than the average of school scores listed in this table because Damonte Ranch, Gerlach, Sparks and Washoe had fewer than 20 students who took the SAT. Individual school test data are not published for schools with fewer than 20 SAT participants, but the participants’ scores are included in district totals. ‘-’ Denotes fewer than 20 students tested.
High Schools 2001 2002 2003 2004 2005Damonte Ranch Not Open Not Open Not Open Not Open -Galena 527 529 534 535 547Gerlach - - - - -Hug 523 522 - - 477Incline 549 530 564 553 544McQueen 552 562 579 564 540North Valleys Not Open Not Open 511 500 490Reed 517 533 546 526 531Reno 546 560 566 550 556Spanish Springs Not Open Not Open 500 493 515Sparks 514 536 - - -TMCC HS 549 551 550 566 530Washoe - - - - -Wooster 536 545 534 546 537WCSD Average 535 544 550 536 534

SAT ParticipationNumber and Percentage of WCSD Graduates Who Took the SAT
Page 31 High School Data: SAT

SAT Participation by High School
Page 32 High School Data: SAT
1 Total numbers are higher than the sum of individual schools because some schools had fewer than 20 students take the SAT. Individual school test data are not published for schools with fewer than 20 test participants, but the participants are included in district totals.‘-’ Denotes fewer than 20 students tested.
HIGH SCHOOLS 2001 2002 2003 2004 2005N % N % N % N % N %
Damonte Ranch Not Open Not Open Not Open Not Open Not Open Not Open Not Open Not Open - -Galena 134 46% 190 49% 163 49% 166 43% 195 62%Gerlach - - - - - - - - - -Hug 46 16% 32 10% - - - - 21 12%Incline 53 57% 48 59% 54 64% 45 55% 45 58%McQueen 121 32% 140 34% 152 36% 153 40% 172 46%North Valleys Not Open Not Open Not Open Not Open 39 17% 44 18% 67 25%Reed 125 28% 135 30% 119 27% 118 31% 162 36%Reno 191 69% 189 60% 211 72% 200 61% 192 59%Spanish Springs Not Open Not Open Not Open Not Open 23 12% 95 35% 85 30%Sparks 43 15% 23 8% - - - - - -TMCC HS 29 27% 34 28% 29 32% 21 23% 24 37%Washoe - - - - - - - - - -Wooster 63 30% 61 26% 61 35% 69 36% 81 40%Total1 810 32% 858 32% 903 32% 938 34% 1071 38%

Gateway CurriculumPercentage of 2004 and 200� Graduates Meeting Gateway Science and Math Requirements
Page 33 High School Data: Gateway Curriculum
HIGH SCHOOLS
Earned 3 Science Credits Earned 4 Math Credits Earned Math Credit Beyond Algebra 3-4
Class of 2004 Class of 2005 Class of 2004 Class of 2005 Class of 2004 Class of 2005N % N % N % N % N % N %
Damonte Ranch No Seniors No Seniors 37 51% No Seniors No Seniors 13 18% No Seniors No Seniors 13 18%Galena 305 80% 253 80% 155 40% 190 60% 123 32% 159 50%Gerlach 4 44% 2 33% 7 78% 2 33% 4 44% 1 17%Hug 68 46% 88 50% 36 24% 58 33% 18 12% 29 17%Incline 46 56% 50 65% 33 40% 32 42% 29 35% 35 45%McQueen 279 72% 306 81% 181 47% 213 56% 145 38% 152 40%North Valleys 161 65% 189 69% 86 35% 114 42% 60 24% 90 33%Reed 274 71% 351 77% 162 42% 228 50% 152 39% 196 43%Reno 272 86% 287 89% 178 56% 186 57% 162 51% 161 50%Spanish Springs 173 64% 186 66% 71 26% 104 37% 51 19% 93 33%Sparks 112 76% 80 60% 88 60% 33 25% 40 27% 28 21%TMCC HS 44 48% 35 54% 5 5% 13 20% 9 10% 29 45%Washoe1 8 9% 8 8% 2 2% 2 2% 1 1% 2 2%Wooster 103 53% 109 54% 40 21% 86 43% 35 18% 76 38%Total 1849 67% 1981 69% 1044 38% 1274 45% 829 30% 1064 37%
1 Washoe High School is an alternative school.

Senior Year Academic Load
Page 34 High School Data: Gateway Curriculum
Gateway Curriculum
HIGH SCHOOLS
Four Classes Five Classes Six or More ClassesClass of 2004 Class of 2005 Class of 2004 Class of 2005 Class of 2004 Class of 2005
N % N % N % N % N % N %Damonte Ranch No Seniors No Seniors 2 3% No Seniors No Seniors 8 11% No Seniors No Seniors 62 86%Galena 90 25% 120 38% 125 34% 95 30% 152 41% 97 31%Gerlach 0 - 0 - 0 - 0 - 8 100% 6 100%Hug 7 6% 23 15% 24 19% 34 23% 95 75% 94 62%Incline 23 29% 15 22% 26 33% 27 39% 31 39% 27 39%McQueen 46 13% 103 28% 122 34% 113 31% 195 54% 154 42%North Valleys 18 8% 59 22% 57 25% 95 36% 151 67% 113 42%Reed 106 30% 23 5% 114 32% 181 41% 136 38% 233 53%Reno 72 24% 138 44% 120 41% 98 31% 104 35% 81 26%Spanish Springs 27 18% 86 32% 41 27% 75 27% 86 56% 112 41%Sparks 70 27% 5 4% 81 31% 19 16% 108 42% 94 80%TMCC HS1 NA NA NA NA NA NA NA NA NA NA NA NA
Washoe1 NA NA NA NA NA NA NA NA NA NA NA NA
Wooster 36 20% 58 32% 66 36% 51 28% 79 44% 75 41%Total 544 22% 632 25% 776 31% 796 31% 1145 46% 1148 45%
1 Washoe and TMCC high schools have unique scheduling options, so are not included.

Enrollment in Advanced Placement CoursesPercentage of WCSD Juniors and Seniors Enrolled in Advanced Placement or IB1 Courses
Page 3� High School Data: AP/IB
1 International Baccalaureate Program2 Data on percentage scoring 3 or higher are not available prior to 2003; percentage includes IB scores of 4 or higher

Advanced Placement Course Enrollment by SchoolPercentage of Graduates Who took At Least One Advanced Placement or IB1 Exam as Juniors or Seniors
Page 3� High School Data: AP/IB
1 International Baccalaureate ProgramAP classes are not offered at Washoe or TMCC

Enrollment in Advanced Placement/IB1 Courses
Page 3� High School Data: AP/IB
1 International Baccalaureate Program2 Data are not available for 2001-2004; includes IB students scoring 4 or higherSeveral corrections have been made to data from previous years to eliminate duplicate counting of students taking more than one exam. AP courses are not offered at TMCC and Washoe high schools. ‘-’ Denotes no students enrolled or too few students to report.
High Schools
Number of AP Candidates Percentage of Juniors and Seniors Taking AP Exams
Percent-age of AP Students Scoring 3 or Higher
on AP Exams2
2001 2002 2003 2004 2005 2001 2002 2003 2004 2005 2005Damonte Ranch Not Open Not Open Not Open - 60 Not Open Not Open Not Open - 26% 21%Galena 188 205 235 290 267 24% 27% 30% 36% 39% 61%Gerlach - 3 - 4 1 - 20% - 24% 8% -Hug 62 34 41 31 56 7% 7% 11% 8% 15% 20%Incline 53 51 48 49 47 28% 29% 27% 29% 31% 70%McQueen 216 256 268 279 291 24% 29% 30% 34% 33% 58%North Valleys Not Open 30 51 80 173 Not Open 12% 10% 13% 26% 28%Reed 103 163 141 143 180 9% 17% 16% 15% 18% 47%Reno 200 219 263 251 292 25% 32% 39% 35% 39% 65%Spanish Springs Not Open 11 37 61 105 Not Open 4% 7% 10% 16% 51%Sparks 68 110 91 86 99 8% 20% 24% 23% 24% 10%TMCC HS - - - - - - - - - - -Washoe - - - - - - - - - - -Wooster 76 74 71 88 104 12% 15% 14% 15% 21% 40%WCSD 967 1156 1246 1365 1675 16% 19% 21% 21% 27% 49%

Advanced Placement Challenge IndexRatio of AP-IB1 Exams to Graduating Class Size
Page 3� High School Data: AP/IB
The Challenge Index, developed by Washington Post education writer Jay Mathews, measures a public high school’s effort to challenge its stu-dents. The Index is calculated by dividing the number of AP or IB or exams taken by the number of seniors who graduated in June. Exam scores are not included in the calculation and exams taken by all students, not just seniors, are counted. The rating is not a measurement of the overall quality of the school but illuminates one factor that many educators and researchers consider important. For purposes of this calculation, the WCSD graduating class includes all students who earned a diploma plus those students who had enough credits to graduate but failed one or more sections of a state-mandated graduation exam. A Challenge Index of 1.0 or higher meets the benchmark defined by the measure’s author.
2005
SCHOOLNumber of 2005 June Graduates
Number of AP-IB Exams in
2005
Challenge Index
National Ranking2
Damonte Ranch 73 87 1.19 Not Ranked3
Galena 315 538 1.71 531Gerlach - - - -Hug 175 119 0.68 Not Ranked
Incline 77 105 1.36 835McQueen 378 670 1.77 488North Valleys 273 322 1.18 1045Reed 456 387 0.85 Not Ranked
Reno 324 508 1.57 650Spanish Springs 281 186 0.66 Not Ranked
Sparks 134 179 1.34 868Wooster 202 330 1.63 495
1 International Baccalaureate Program2 National rankings published in Newsweek. All of the ranked schools have an index of at least 1.0 and are in the top 5 percent of the nation’s public schools on this measure. Source: The Complete List: 1,200 Top U.S. Schools; http://www.msnbc.msn.com/id/12532678/site/newsweek/3 The rankings do not include schools in the first or second year of operation, so Damonte Ranch HS was not ranked, despite having achieved an index above 1.0.‘-’ Denotes fewer than 10 students in the graduating class.AP classes are not offered at Washoe or TMCC high schools

Millennium ScholarshipPercentage of Graduates Eligible for the Millennium Scholarship by Year
Page 39 High School Data: Millennium Scholarship
High Schools 2000 2001 2002 2003 2004 20051
Damonte Ranch Not Open Not Open Not Open Not Open Not Open 37%Galena 64% 58% 65% 69% 69% 71%Gerlach 13% 67% 50% 67% 67% 67%Hug 33% 44% 42% 40% 49% 41%Incline 49% 71% 59% 59% 59% 61%McQueen 54% 59% 65% 63% 59% 58%North Valleys Not Open Not Open Not Open 51% 53% 45%Reed 49% 61% 59% 71% 61% 52%Reno 68% 67% 67% 78% 70% 63%Spanish Springs Not Open Not Open Not Open 52% 54% 53%Sparks 44% 53% 56% 58% 47% 39%TMCC 66% 74% 75% 78% 74% 75%Washoe 16% 54% 44% 31% 24% 10%Wooster 43% 60% 51% 63% 63% 57%WCSD 50% 59% 56% 63% 57% 52%
1 The eligibility requirements for the Millennium Scholarship increased in 2005 to a GPA of 3.1, with no rounding allowed. Prior to 2005, the cut off was 3.0, and rounding up from 2.95 was allowed.

WCSD Graduating Cohorts AnalysisThe Tracking of WCSD Graduates1 from High School to College
Page 40 College Data
1 Includes standard and adjusted diplomas from District schools. Does not include Washoe Adult High School or the charter high schools (Academy for Career Education, Rainshadow and I Can Do Anything).
Graduating Cohorts
2004-200� Graduates = 2�42
2003-2004 Graduates = 2�42
2002-2003 Graduates = 2�3�
2001-2002 Graduates = 2��0
2000-2001 Graduates = 2429
1999-2000 Graduates = 2243
199�-1999 Graduates = 222�
199�-199� Graduates = 20�2
199�-199� Graduates = 200�
»
»
»
»
»
»
»
»
»
College Measures
Capture Rate: The percentage of WCSD graduates enrolling at UNR, TMCC, other in-state colleges and universities and out-of-state institutions immediately fol-lowing high school graduation.
Remediation: Student enrollment in developmental English or math courses (in-termediate algebra and below).
Persistence: The rate at which a co-hort returns to college with each advancing semester.
SAT and ACT Exams: SAT and ACT scores of WCSD graduates attending the University of Nevada, Reno1.
»
»
»
»

Class of 2005 College-Going RatePercentage of 200� High School Graduates Immediately Enrolling in Post-Secondary Education1
Page 41
1 To permit comparison with state and national rates, only WCSD graduates with standard, advanced and honors diplomas are included in the percentages depicted in the college-going rate charts. Students with adjusted diplomas were excluded. Additionally, the Nevada and national rates include charter and private high schools, but the WCSD rate does not. The national rate shown here is based on census data, and differs from the national rate reported in the 2003-04 Data Profile. New data sources and calculation methods were applied this year. Therefore the college going rate reported here is not directly comparable to that reported in previous years.Sources: Postsecondary Education Opportunity; Nevada System of Higher Education January 2005 Report on Nevada College Continuation Rates, WCSD Data Profile, National Student Clearinghouse Student Tracker Service
Page 41 College Data: College-Going Rates

1 To permit comparison with state rates, only WCSD graduates with standard, advanced and honors diplomas are included in the percentages depicted in the college-going rate charts. Students with adjusted diplomas were excluded. Additionally, the Nevada rates include charter and private high schools, but the WCSD rate does not. New data sources and calculation methods were applied this year. Therefore the college going rate reported here is not directly comparable to that reported in previous years.Sources: Postsecondary Education Opportunity; Nevada System of Higher Education January 2005 Report on Nevada College Continuation Rates, WCSD Data Profile, National Student Clearinghouse Student Tracker Service
Class of 2005 College-Going RatesPercentage of 2004 Nevada and 200� WCSD High School Graduates Enrolling in Local, In-State and Out-of-State Institutions1
Page 42 Page 42 College Data: College-Going Rates

Capture Rates Based on UNR and TMCC Enrollment Counts
Page 43 College Data: Capture Rates
The college-going rate for Washoe County School District reported in the pre-vious two pages was calculated using student-matched data collected by the National Student Clearinghouse Student Tracker Service. The student-matched data generate a more precise college-going rate than the rates published in previous Data Profile reports. Using student-matched data, WCSD students who received an adjusted diploma or did not graduate (i.e. drop outs and stu-dents who received a certificate of attendance), but nevertheless enrolled in college, can be identified and excluded from the analysis. Additionally, stu-dents who are dual-enrolled (i.e. taking classes at both UNR and TMCC during the same term) can be identified so that they are only counted once in the col-lege-going rate.
The TMCC and UNR capture rates reported on the following pages differ from the college-going rates reported on pages 40 and 41 in that they may include WCSD students who received an adjusted diploma, students who did not grad-uate, and/or students dual-enrolled at UNR and TMCC.

WCSD High School Graduates Attending UNR or TMCCNumber of WCSD Graduates Enrolling by Year
Page 44 College Data: Capture Rates
Numbers may include WCSD students who did not receive a diploma and students co-enrolled at both institutions, and are not comparable to the college-going rates reported on pages 40 and 41.

Capture Rates of High School Cohorts By UNR and TMCCPercentage of WCSD Graduates Enrolling in UNR or TMCC by Year
Page 4� College Data: Capture Rates
Data have been corrected from previous years.Numbers may include WCSD students who did not receive a diploma and students co-enrolled at both institutions, and are not comparable to the college-going rates reported on pages 40 and 41.

Combined UNR and TMCC Capture Rate by High School
Page 4� College Data: Capture Rates
HIGH SCHOOLS
Fall 1999 Fall 2000 Fall 2001 Fall 2002 Fall 2003 Fall 2004 Fall 2005% N % N % N % N % N % N % N
Damonte Ranch Not Open Not Open Not Open Not Open Not Open Not Open Not Open Not Open Not Open Not Open - - 38% 28Galena 47% 134 55% 168 57% 159 52% 196 61% 197 76% 240 65% 204Gerlach 33% 3 29% 2 42% 5 - - 67% 2 67% 4 33% 2Hug 37% 90 39% 83 43% 119 36% 107 42% 79 36% 63 42% 73Incline 27% 24 33% 26 26% 23 37% 30 30% 24 31% 24 32% 25McQueen 53% 180 55% 185 61% 225 60% 240 62% 260 63% 240 62% 233North Valleys Not Open Not Open Not Open Not Open Not Open Not Open Not Open Not Open 42% 91 48% 130 55% 150Reed 49% 202 49% 204 49% 217 51% 226 55% 237 48% 218 56% 257Reno 40% 128 46% 148 52% 167 51% 161 58% 170 53% 173 66% 214Spanish Springs Not Open Not Open Not Open Not Open Not Open Not Open Not Open Not Open 51% 95 48% 134 51% 143Sparks 40% 101 45% 104 44% 121 47% 122 56% 95 56% 75 60% 81TMCC HS 51% 37 66% 51 62% 64 78% 95 80% 73 92% 60 82% 53Washoe 66% 35 78% 28 33% 29 77% 37 57% 37 59% 49 46% 38Wooster 48% 95 37% 78 52% 107 45% 94 48% 80 46% 93 55% 112Total 46% 1029 48% 1077 52% 1236 52% 1309 56% 1440 55% 1503 57% 1613
Data have been corrected from previous years.Numbers may include WCSD students who did not receive a diploma and students co-enrolled at both institutions, and are not comparable to the college-going rates reported on pages 40 and 41.‘-’ Denotes no graduates that year.

TMCC Capture Rate by High School
Page 4� College Data: Capture Rates
Data have been corrected from previous years.Numbers may include WCSD students who did not receive a diploma and students co-enrolled at both institutions, and are not comparable to the college-going rates reported on pages 40 and 41.‘-’ Denotes no graduates that year
HIGH SCHOOLSFall 1999 Fall 2000 Fall 2001 Fall 2002 Fall 2003 Fall 2004 Fall 2005
% N % N % N % N % N % N % NDamonte Ranch Not Open Not Open Not Open Not Open Not Open Not Open Not Open Not Open Not Open Not Open - - 26% 19Galena 17% 49 15% 46 25% 70 20% 74 26% 83 23% 88 24% 75Gerlach 0% 0 14% 1 25% 3 0% 0 67% 2 11% 1 0% 0Hug 23% 56 17% 40 26% 71 24% 73 29% 54 27% 40 25% 44Incline 6% 5 8% 6 10% 9 16% 13 14% 11 12% 10 13% 10McQueen 18% 62 15% 50 22% 80 18% 73 23% 97 21% 82 22% 85North Valleys Not Open Not Open Not Open Not Open Not Open Not Open Not Open Not Open 22% 48 31% 77 29% 79Reed 25% 105 23% 96 21% 92 24% 105 24% 104 27% 105 28% 129Reno 11% 34 12% 40 17% 53 18% 55 17% 51 16% 52 22% 72Spanish Springs Not Open Not Open Not Open Not Open Not Open Not Open Not Open Not Open 27% 51 27% 73 19% 52Sparks 23% 57 20% 47 21% 57 23% 60 30% 51 32% 48 39% 52TMCC HS 43% 31 53% 41 46% 48 52% 63 60% 55 46% 42 53% 35Washoe 64% 34 78% 28 33% 29 77% 37 57% 37 71% 49 43% 36Wooster 23% 45 18% 37 22% 46 24% 51 23% 38 24% 46 25% 51Total 21% 478 19% 432 23% 558 24% 604 26% 682 26% 713 25% 739
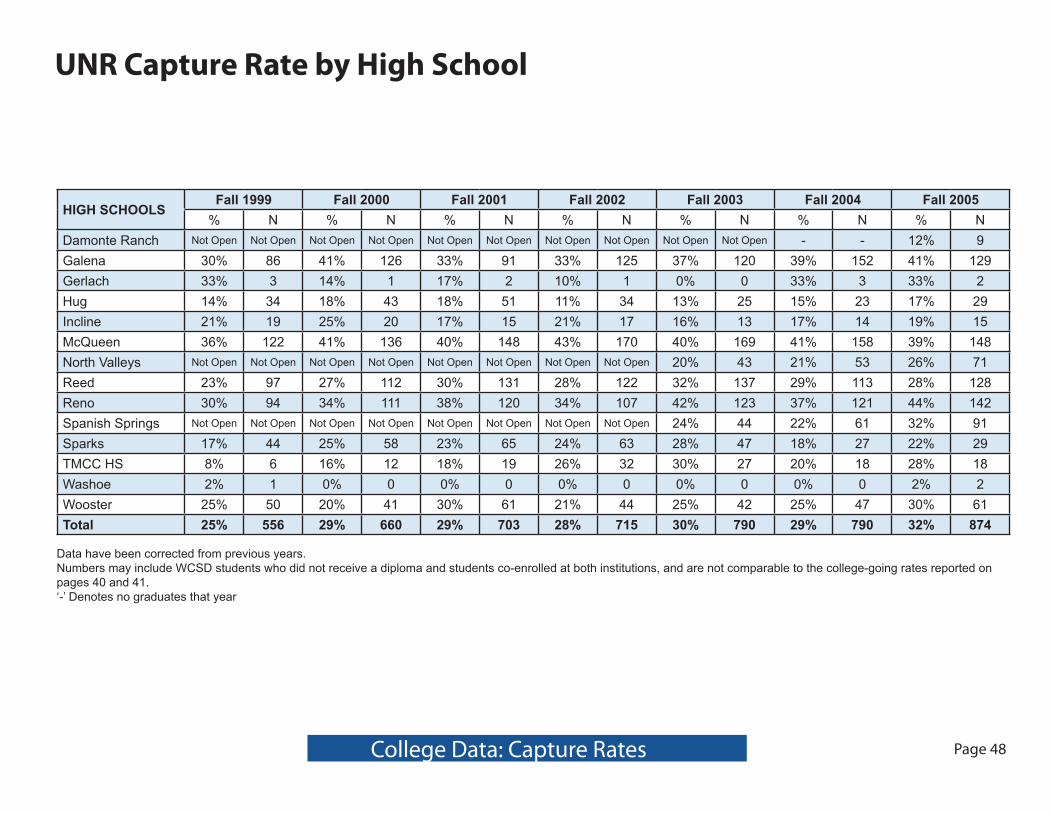
UNR Capture Rate by High School
Page 4� College Data: Capture Rates
HIGH SCHOOLSFall 1999 Fall 2000 Fall 2001 Fall 2002 Fall 2003 Fall 2004 Fall 2005
% N % N % N % N % N % N % NDamonte Ranch Not Open Not Open Not Open Not Open Not Open Not Open Not Open Not Open Not Open Not Open - - 12% 9Galena 30% 86 41% 126 33% 91 33% 125 37% 120 39% 152 41% 129Gerlach 33% 3 14% 1 17% 2 10% 1 0% 0 33% 3 33% 2Hug 14% 34 18% 43 18% 51 11% 34 13% 25 15% 23 17% 29Incline 21% 19 25% 20 17% 15 21% 17 16% 13 17% 14 19% 15McQueen 36% 122 41% 136 40% 148 43% 170 40% 169 41% 158 39% 148North Valleys Not Open Not Open Not Open Not Open Not Open Not Open Not Open Not Open 20% 43 21% 53 26% 71Reed 23% 97 27% 112 30% 131 28% 122 32% 137 29% 113 28% 128Reno 30% 94 34% 111 38% 120 34% 107 42% 123 37% 121 44% 142Spanish Springs Not Open Not Open Not Open Not Open Not Open Not Open Not Open Not Open 24% 44 22% 61 32% 91Sparks 17% 44 25% 58 23% 65 24% 63 28% 47 18% 27 22% 29TMCC HS 8% 6 16% 12 18% 19 26% 32 30% 27 20% 18 28% 18Washoe 2% 1 0% 0 0% 0 0% 0 0% 0 0% 0 2% 2Wooster 25% 50 20% 41 30% 61 21% 44 25% 42 25% 47 30% 61Total 25% 556 29% 660 29% 703 28% 715 30% 790 29% 790 32% 874
Data have been corrected from previous years.Numbers may include WCSD students who did not receive a diploma and students co-enrolled at both institutions, and are not comparable to the college-going rates reported on pages 40 and 41.‘-’ Denotes no graduates that year

Ethnic Composition of WCSD Graduates Attending UNR and TMCCFall 200� Freshmen
Page 49 College Data

WCSD Graduates Need for Remediation
The percentage of students enrolled in remedial English or math as freshmen at UNR and TMCC is lower than the percentage of stu- dents who need remedial English or math based on their placement scores.
Over �0% of students enrolled in remedial English or math as freshman are there because of their placement exam scores and not because of self-selection.
Enrollment in high school mathematics beyond the level of Algebra 3-4 dramatically reduces the likelihood that a student will need math remediation in college. Enrollment in Advanced Placement English and mathematics courses in high school also appears to reduce the likelihood that a student will need remediation in those content areas in college.
In general, students who registered for remedial math in college are characterized by not having taken four years of high school math, not having taken math beyond Algebra 3-4, and often not even having taken and passed Algebra 3-4.
Those students enrolled in remedial math in college who had completed Algebra 3-4 in high school were generally students who earned a C grade or lower in Algebra 3-4. The average cumulative math GPA in high school of these students was 2.43.
»
»
»
»
»
Prior Conclusions of 4-Year Review of Remediation Data for WCSD Graduates Enrolled as Freshmen at UNR and TMCC
Page �0 College Data: Remediation

Need for Remediation Based on Exam ScoresPercentage of WCSD 200� Graduates With ACT, SAT or Accuplacer Scores Demonstrating a Need for Remedial Math or English Placement1
Page �1 College Data: Remediation
1 This chart depicts students whose scores on placement exams were below the cut-off for college level work. Not all of these students enrolled in English or math in their first se-mester at UNR or TMCC. Placement exam cut-off scores: UNR English: ACT verbal <21; SAT verbal < 501; UNR Math: ACT math <21; SAT math <501; TMCC : Accuplacer, ACT or SAT score below cut for college level. Approximately 5% of UNR and 15% of TMCC WCSD freshmen do not have placement exam scores.

Enrollment in Remedial ClassesPercentage of Nevada and WCSD 200� High School Graduates Enrolling in Remedial Courses in Fall 200�1
Page �2 College Data: Remediation
1 Not all students who place at the remedial level enroll in English and/or math classes their freshman year. This chart depicts the percentage of high school graduates actually enrolling in remedial classes in Fall 2005. WCSD students are not included in the State (NV) percentages. The State percentages include charter schools, the WCSD percentages do not.Sources: Nevada System of Higher Education January 2006 Remedial Report, WCSD Data Profile.

Remediation Rates by InstitutionPercentage of WCSD Graduates Registered in a Remedial Course
Page �3 College Data: Remediation
Data from previous years have been corrected.Sources: Nevada System of Higher Education January 2006 Remedial Report; WCSD Data Profile.

Remediation by High School - TMCCPercentage of WCSD Graduates Registered in a TMCC Remedial Course
Page �4 College Data: Remediation
1 Total numbers include schools with fewer than 5 students attending TMCC, and are therefore higher than the sums of individual schools. ‘-’ Denotes fewer than 5 students enrolled.
HIGH SCHOOLS
Fall 1999 Fall 2000 Fall 2001 Fall 2002 Fall 2003 Fall 2004 Fall 2005% N % N % N % N % N % N % N
Damonte Ranch Not Open Not Open Not Open Not Open Not Open Not Open Not Open Not Open Not Open Not Open - - 58% 11Galena 37% 18 39% 18 49% 34 65% 48 59% 49 64% 56 65% 49Gerlach - - - - - - - - - - - - - -Hug 52% 29 63% 25 68% 48 59% 43 80% 43 65% 26 89% 39Incline - - 100% 6 - - 77% 10 55% 6 60% 6 50% 5McQueen 52% 32 56% 28 47% 38 73% 53 60% 58 55% 45 73% 62North Valleys Not Open Not Open Not Open Not Open Not Open Not Open Not Open Not Open 71% 34 66% 51 61% 48Reed 54% 57 52% 50 59% 54 69% 72 63% 65 71% 75 66% 85Reno 32% 11 55% 22 47% 25 62% 34 47% 24 46% 24 68% 49Spanish Springs Not Open Not Open Not Open Not Open Not Open Not Open Not Open Not Open 71% 36 63% 46 79% 41Sparks 61% 35 66% 31 68% 39 67% 40 65% 33 65% 31 75% 39TMCC HS 26% 8 15% 6 29% 14 24% 15 35% 19 27% 12 40% 14Washoe 53% 18 57% 16 62% 18 62% 23 57% 21 45% 22 67% 24Wooster 42% 19 84% 31 65% 30 59% 30 66% 25 65% 30 59% 30Total1 48% 230 54% 234 55% 306 61% 368 61% 414 59% 426 67% 496

Remediation by High School - UNRPercentage of WCSD Graduates Registered in a UNR Remedial Course
Page �� College Data: Remediation
1 Total numbers include schools with fewer than five students attending UNR, and are therefore higher than the sums of individual schools. ‘-’ Denotes fewer than 5 students enrolled.
HIGH SCHOOLSFall 1999 Fall 2000 Fall 2001 Fall 2002 Fall 2003 Fall 2004 Fall 2005
% N % N % N % N % N % N % NDamonte Ranch Not Open Not Open Not Open Not Open Not Open Not Open Not Open Not Open Not Open Not Open - - 22% 2Galena 20% 17 17% 22 29% 26 30% 38 28% 34 28% 42 34% 44Gerlach - - - - - - - - - - - - - -Hug 21% 7 28% 12 49% 25 47% 16 52% 13 43% 9 55% 16Incline - - 30% 6 47% 7 41% 7 38% 5 - - 47% 7McQueen 16% 20 23% 31 26% 39 23% 39 24% 41 21% 33 31% 46North Valleys Not Open Not Open Not Open Not Open Not Open Not Open Not Open Not Open 30% 13 20% 11 28% 20Reed 12% 12 20% 22 30% 39 28% 34 28% 39 28% 30 28% 36Reno 20% 19 23% 26 26% 31 27% 29 21% 26 17% 20 27% 38Spanish Springs Not Open Not Open Not Open Not Open Not Open Not Open Not Open Not Open 43% 19 31% 19 24% 22Sparks 18% 8 21% 12 23% 15 29% 18 28% 13 48% 12 24% 7TMCC HS - - - - - - - - - - - - - -Washoe - - - - - - - - - - - - - -Wooster 30% 15 17% 7 30% 18 36% 16 29% 12 27% 12 18% 11Total1 18% 100 21% 140 29% 201 28% 199 28% 215 25% 195 29% 253

Remediation Rates of UNR Feeder High SchoolsFall 199� - Spring 200�
Page �� College Data: Remediation
Source: Measuring the Need for Remediation Among New Freshmen: Reflecting on Ten Years of Data and the Millennium Years, Serge Herzog, PhD, Director of Institutional Analysis, University of Nevada, Reno, February 2005

TMCC and UNR Persistence RatesWCSD Graduating Cohorts
Page �� College Data: Persistence
Nationally, 73.5% will return after 2 semesters at Universities and 55.8% at Community Colleges (2003, ACT Institutional Data Questionnaire).

Persistence at TMCC by High SchoolPercentage Returning After One Semester
Page �� College Data: Persistence
Total numbers include schools with fewer than 5 students attending TMCC, and are therefore higher than the sums of individual schools. ‘-’ Denotes fewer than 5 students attended TMCC
HIGH SCHOOLSWCSD Class of
1999WCSD Class of
2000WCSD Class of
2001WCSD Class of
2002WCSD Class of
2003WCSD Class of
2004WCSD Class of
2005% N % N % N % N % N % N % N
Damonte Ranch Not Open Not Open Not Open Not Open Not Open Not Open Not Open Not Open Not Open Not Open - - 68% 13Galena 80% 39 65% 30 80% 56 77% 57 71% 59 77% 68 77% 58Gerlach - - - - - - - - - - - - - 0%Hug 79% 44 73% 29 68% 48 74% 54 65% 35 60% 24 59% 26Incline - - - - 78% 7 62% 8 55% 6 50% 5 60% 6McQueen 65% 40 78% 39 59% 47 73% 53 74% 72 61% 50 68% 58North Valleys Not Open Not Open Not Open Not Open Not Open Not Open Not Open Not Open 67% 32 70% 54 71% 56Reed 70% 73 74% 71 75% 69 77% 81 69% 72 75% 79 76% 98Reno 56% 19 70% 28 72% 38 80% 44 73% 37 65% 34 68% 49Spanish Springs Not Open Not Open Not Open Not Open Not Open Not Open Not Open Not Open 69% 35 100% 48 69% 36Sparks 65% 37 72% 34 82% 47 73% 44 71% 36 45% 33 65% 34TMCC HS 81% 25 66% 27 75% 36 75% 47 73% 40 79% 33 71% 25Washoe 44% 15 61% 17 48% 14 57% 21 65% 24 61% 30 42% 15Wooster 67% 30 65% 24 65% 30 73% 37 74% 28 72% 33 71% 36Total 68% 325 70% 304 71% 395 74% 446 70% 478 69% 492 69% 510

Persistence at UNR by High SchoolPercentage Returning After One Semester
Page �9 College Data: Persistence
Total numbers include schools with fewer than five students attending UNR, and are therefore higher than the sums of individual schools. ‘-’ Denotes fewer than 5 students attended UNR.
HIGH SCHOOLS
WCSD Class of 1999
WCSD Class of 2000
WCSD Class of 2001
WCSD Class of 2002
WCSD Class of 2003
WCSD Class of 2004
WCSD Class of 2005
% N % N % N % N % N % N % NDamonte Ranch Not Open Not Open Not Open Not Open Not Open Not Open Not Open Not Open Not Open Not Open - - 44% 4Galena 97% 83 90% 113 92% 84 90% 112 89% 105 91% 139 89% 115Gerlach - - - - - - - - - - - - - -Hug 94% 32 81% 35 84% 43 88% 30 84% 21 87% 20 90% 26Incline 95% 18 95% 19 93% 14 71% 12 77% 10 100% 14 100% 15McQueen 93% 113 91% 124 95% 140 95% 161 92% 158 90% 142 95% 141North Valleys Not Open Not Open Not Open Not Open Not Open Not Open Not Open Not Open 82% 36 87% 46 86% 61Reed 95% 92 89% 100 81% 106 90% 110 87% 123 81% 91 91% 117Reno 94% 88 91% 101 88% 106 96% 103 90% 111 95% 115 90% 128Spanish Springs Not Open Not Open Not Open Not Open Not Open Not Open Not Open Not Open 86% 37 84% 51 89% 81Sparks 86% 38 88% 51 85% 55 92% 58 90% 43 89% 24 83% 24TMCC HS 83% 5 92% 11 89% 17 81% 26 78% 21 89% 16 67% 12Washoe - - - - - - - - - - - - - -Wooster 92% 46 93% 38 87% 53 86% 38 93% 38 85% 40 93% 57Total 93% 518 90% 592 88% 620 91% 651 88% 703 89% 698 91% 785

ACT Scores - UNRACT Composite Scores of WCSD Graduating Cohorts Attending UNR
Page �0 College Data: ACT
The maximum composite ACT score is 36.

Average ACT Scores by High SchoolWCSD Graduating Cohorts Attending UNR
Page �1 College Data: ACT
1. Weighted mean2 Total numbers include schools with fewer than five students attending UNR, and are therefore higher than the sums of individual schools. ‘-’ Denotes fewer than 5 students attending UNR
HIGH SCHOOLSWCSD Class of
1999WCSD Class of
2000WCSD Class of
2001WCSD Class of
2002WCSD Class of
2003WCSD Class of
2004WCSD Class of
2005Score N Score N Score N Score N Score N Score N Score N
Damonte Ranch Not Open Not Open Not Open Not Open Not Open Not Open Not Open Not Open Not Open Not Open - - 22.0 2Galena 23.0 68 23.8 84 23.5 58 22.9 78 22.7 74 22.8 107 22.8 83Gerlach - - - - - - - - - - - - 20.0 2Hug 22.3 25 21.7 34 20.3 42 22.0 28 20.1 18 21.7 17 20.0 25Incline 21.9 14 22.5 10 19.5 6 20.8 9 22.0 6 25.0 8 23.7 7McQueen 24.5 107 23.5 117 22.9 124 23.0 147 23.5 132 23.1 120 22.7 91North Valleys Not Open Not Open Not Open Not Open Not Open Not Open Not Open Not Open 21.8 36 22.3 42 22.1 52Reed 23.3 83 23.2 88 22.0 117 22.6 108 23.2 123 21.6 87 22.1 95Reno 21.9 59 22.1 64 23.1 86 23.4 57 23.7 61 22.8 54 22.7 57Spanish Springs Not Open Not Open Not Open Not Open Not Open Not Open Not Open Not Open 21.5 28 20.7 27 22.6 68Sparks 22.3 44 21.6 50 22.0 64 21.3 58 21.6 42 21.5 26 21.5 29TMCC HS 23.8 5 23.2 6 23.9 14 22.5 19 23.1 11 23.2 13 23.8 11Washoe - - - - - - - - - - - - 21.0 1Wooster 21.4 33 22.7 35 23.4 48 22.4 31 23.0 32 23.0 27 23.4 39Avg Score1 | Total N 23.0 441 22.9 486 22.5 561 22.6 535 22.9 563 22.4 528 22.4 562

Page �2
SAT Scores - UNRCombined Verbal and Math SAT Scores of WCSD Graduating Cohorts Attending UNR
Page �2 College Data: SAT
The maximum combined SAT score is 1600.
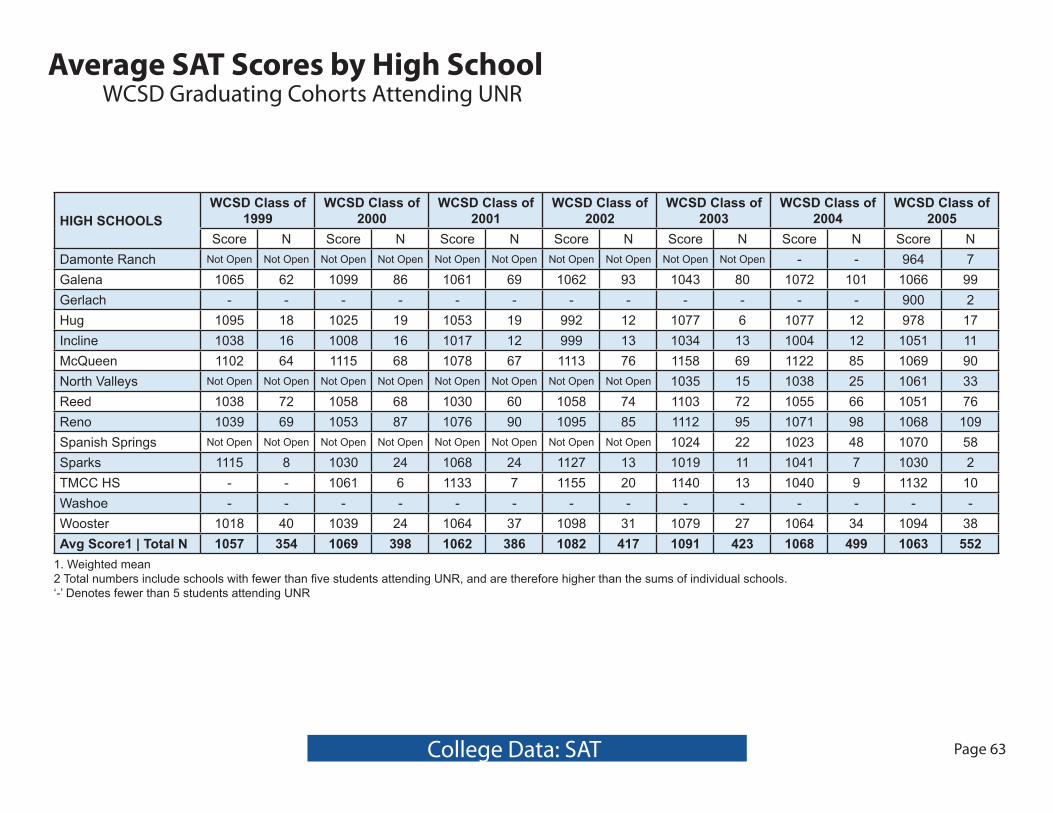
Average SAT Scores by High SchoolWCSD Graduating Cohorts Attending UNR
Page �3 College Data: SAT
1. Weighted mean2 Total numbers include schools with fewer than five students attending UNR, and are therefore higher than the sums of individual schools. ‘-’ Denotes fewer than 5 students attending UNR
HIGH SCHOOLSWCSD Class of
1999WCSD Class of
2000WCSD Class of
2001WCSD Class of
2002WCSD Class of
2003WCSD Class of
2004WCSD Class of
2005Score N Score N Score N Score N Score N Score N Score N
Damonte Ranch Not Open Not Open Not Open Not Open Not Open Not Open Not Open Not Open Not Open Not Open - - 964 7Galena 1065 62 1099 86 1061 69 1062 93 1043 80 1072 101 1066 99Gerlach - - - - - - - - - - - - 900 2Hug 1095 18 1025 19 1053 19 992 12 1077 6 1077 12 978 17Incline 1038 16 1008 16 1017 12 999 13 1034 13 1004 12 1051 11McQueen 1102 64 1115 68 1078 67 1113 76 1158 69 1122 85 1069 90North Valleys Not Open Not Open Not Open Not Open Not Open Not Open Not Open Not Open 1035 15 1038 25 1061 33Reed 1038 72 1058 68 1030 60 1058 74 1103 72 1055 66 1051 76Reno 1039 69 1053 87 1076 90 1095 85 1112 95 1071 98 1068 109Spanish Springs Not Open Not Open Not Open Not Open Not Open Not Open Not Open Not Open 1024 22 1023 48 1070 58Sparks 1115 8 1030 24 1068 24 1127 13 1019 11 1041 7 1030 2TMCC HS - - 1061 6 1133 7 1155 20 1140 13 1040 9 1132 10Washoe - - - - - - - - - - - - - -Wooster 1018 40 1039 24 1064 37 1098 31 1079 27 1064 34 1094 38Avg Score1 | Total N 1057 354 1069 398 1062 386 1082 417 1091 423 1068 499 1063 552

Page �4 College Success
College Success of WCSD GraduatesPercentage of Students Awarded College Degrees1
1 For WCSD Class of 1997, college degrees earned by March 2005; WCSD Class of 1998, college degrees earned by March 20062 “Unspecified” means the type of degree was not specified in the retrieved college dataTo avoid artificially inflating the number of degrees, only the highest degree obtained by an individual was counted.Source: National Student Clearinghouse Student Tracker Service

College Success of WCSD GraduatesPercentage of Students Awarded College Degrees1
Page �� College Success
HIGH SCHOOLSNumber of
GradsUnspecified2 Associate Bachelor Graduate Totals
Percent Percent Percent Percent Percent1997 1998 1997 1998 1997 1998 1997 1998 1997 1998 1997 1998
Galena 256 292 3% - 3% 4% 18% 27% 2% 3% 26% 34%Gerlach 5 10 - - - - - 10% - - - 10%Hug 188 238 2% 1% 5% 4% 9% 11% 1% 1% 16% 17%Incline 91 65 5% 8% 0% - 19% 26% 1% 2% 25% 35%McQueen 296 323 2% - 4% 5% 22% 28% 3% 1% 31% 34%Reed 370 392 2% - 4% 4% 17% 18% 1% 2% 25% 24%Reno 299 320 6% - 1% 1% 27% 32% 2% 10% 36% 43%Sparks 236 206 2% - 5% 2% 14% 16% 1% - 22% 18%Washoe 87 59 - 3% 1% 3% 5% 8% - 2% - 17%Wooster 178 167 1% 1% 4% 4% 14% 15% 1% 1% 20% 21%District 2006 2072 3% <1% 4% 3% 20% 22% 1% 1% 28% 27%
1 For WCSD Class of 1997, college degrees earned by March 2005; WCSD Class of 1998, college degrees earned by March 20062 “Unspecified” means the type of degree was not specified in the retrieved college dataTo avoid artificially inflating the number of degrees, only the highest degree obtained by an individual was counted.Source: National Student Clearinghouse Student Tracker Service

College Success of WCSD GraduatesMajor Areas of Study
To avoid artificially inflating the number of degrees, only the highest degree obtained by an individual was counted.Math and engineering are included in the “Physical Sciences” category.Source: National Student Clearinghouse Student Tracker Service
Page �� College Success

University of Nevada, Reno Alumni SurveyWCSD Graduates Who Graduated from UNR Between 2001 and 2004
Page �� College Success
UNR has been conducting telephone surveys of bachelor and graduate degree recipients since May of 2002. The alumni survey collects a broad range of information from UNR graduates, which includes employment status,
occupation, employer location, salary, post-graduate education, current educational enrollment and future educa- tion plans.
Of the �,392 degrees conferred between August 2000 and May 2004: 4,12� (49.2%) were awarded to WCSD high school students. o Of the 4,12� WCSD-UNR alumni 2,42� (�9%) responded to the alumni survey. o Of the 2,42� respondents �31 (2�%) had earned graduate degrees.
Selected Survey Results of UNR Alumni Who Graduated from WCSD High SchoolsAre WCSD-UNR graduates employed? (n = 242�)
o �2% (19��) were employed (FT=1���, PT=2�2, Self=104, Military=14) o �% (1�1) were employed as graduate or teaching assistants o 11% (2�9) reported not being employed (includes 4 ‘Don’t Know’ responses)
What are WCSD-UNR graduates doing? (n = 242�) o ��% work in Nevada �4% (1299) work in Washoe County �% (14�) work in other Nevada counties (2.3% Carson, 1.2% Clark, .�% Douglas, .4% Lyon & Elko) �% (121) work as graduate or teaching assistants in Nevada (4% at UNR; 1% at other Nevada institutions) o 22% (�41) work in other states o 2% (�0) work as graduate or teaching assistants in other states o 11% (2�9) are not employed
»»
»
»
»

Page �� College Success
University of Nevada, Reno Alumni SurveyWCSD Graduates Who Graduated from UNR Between 2001 and 2004
WCSD-UNR graduates working in Northern Nevada (Washoe, Carson, Churchill, Douglas, Lyon, & Storey Counties) o ��% (1103) are employed full-time o 92% (1020) of full-time employed work in a field closely related to their major degree program �2% (��9) of full-time employed bachelors degree earners work in a closely related field 100% (331) of full-time employed graduate degree earners work in a closely related field o �1% (1020) of all (full and part-time) employed graduates work in a closely related field
WCSD-UNR Graduates Careers in Northern Nevada o Education (29%) is the largest employer o Health (13%) is the 2nd largest employer o Business/Finance/Real Estate/Law (10%) is the 3rd largest employer o Human Services (�%), Sales (�%), Communication/Media/Arts/Recreation (�%) and Construction (4%) o ��% of respondents secured their first career position within three months of graduation
What do WCSD-UNR graduates earn? o 11% earn < $20,000 o 21% earn between $20 - $29,999 o 22% earn between $30 - $39,999 (median salary range) o 1�% earn between $40 - $49,999 o 9% earn between $�0 – $�9,999
o �% earn between $�0 - $�9,999
o �% earn $�0,000 or more
»
»
»