
Washington’s Teacher and Principal Evaluation System ...€¦ · Creative Commons License...
100
Washington’s Teacher and Principal Evaluation System: Examining the Implementation of a Complex Policy Final Report Prepared for the Office of Superintendent of Public Instruction Ana M. Elfers Margaret L. Plecki With the assistance of Adam Bell Michel A Riquelme Sanderson Kellie Wills Anna Van Windekens University of Washington College of Education Center for the Study of Teaching and Policy July 2017
Transcript of Washington’s Teacher and Principal Evaluation System ...€¦ · Creative Commons License...
Washington’s Teacher and Principal Evaluation System: Examining the
Implementation of a Complex Policy
Final Report
Prepared for the Office of Superintendent of Public Instruction
Ana M. Elfers Margaret L. Plecki
With the assistance of Adam Bell
Michel A Riquelme Sanderson Kellie Wills
Anna Van Windekens
University of Washington College of Education
Center for the Study of Teaching and Policy
July 2017
Creative Commons License Washington’s Teacher and Principal Evaluation System: Examining the Implementation of a Complex Policy by Ana Elfers, Margaret L. Plecki and Office of Superintendent of Public Instruction is licensed under a Creative Commons Attribution 4.0 International License. <a rel="license" href="http://creativecommons.org/licenses/by/4.0/"><img alt="Creative Commons License" style="border-width:0" src="https://i.creativecommons.org/l/by/4.0/88x31.png" /></a><br /><span xmlns:dct="http://purl.org/dc/terms/" property="dct:title">Washington’s Teacher and Principal Evaluation System: Examining the Implementation of a Complex Policy</span> by <a xmlns:cc="http://creativecommons.org/ns#" href="www.k12.wa.us" property="cc:attributionName" rel="cc:attributionURL">Ana Elfers, Margaret L. Plecki and Office of Superintendent of Public Instruction</a> is licensed under a <a rel="license" href="http://creativecommons.org/licenses/by/4.0/">Creative Commons Attribution 4.0 International License</a>.
The suggested citation for this report is: Elfers, A. M. & Plecki, M. L. (2017). Washington’s teacher and principal evaluation system: Examining the implementation of a complex policy. Seattle, WA: Center for the Study of Teaching and Policy, University of Washington.
i
Table of Contents
Executive Summary ................................................................................................................ vii
Introduction ............................................................................................................................... 1
Background on the Teacher and Principal Evaluation Project .............................................. 1
National Context ...................................................................................................................... 1
Teacher Evaluation in Washington State ................................................................................. 2
Research Questions and Methods ........................................................................................... 4
Research Questions ................................................................................................................ 4
Mixed-Methods Design ............................................................................................................ 5
Data Sources and Sampling ..................................................................................................... 6
Sampling Design, Instruments and Procedures for Statewide Surveys .................................... 6
Procedures for Statewide Surveys ....................................................................................... 6
Survey Instruments, Data Collection and Analysis ............................................................... 7
Sampling Design for Case Studies ........................................................................................ 11
Summative and Criterion Scores ........................................................................................... 11
District Participation in Teacher Training Funds (iGrant 664) ................................................. 11
Findings: Backward Mapping the Implementation of TPEP ................................................ 12
Purposes of TPEP ................................................................................................................. 13
Dual Purposes of Accountability and Professional Growth ................................................. 13
Use of Instructional Frameworks ........................................................................................ 16
School Level Supports for the Implementation of TPEP ......................................................... 17
Professional Development for Teachers ............................................................................ 17
Professional Work Under Comprehensive and Focused Evaluations .......................... 18
PLC/Department Collaborative Work .......................................................................... 19
Goal Setting ................................................................................................................ 22
Assessments .............................................................................................................. 23
School Leadership ............................................................................................................. 25
Instructional Leadership .............................................................................................. 25

ii
Supportive School Culture .......................................................................................... 25
Responsibility for Collecting Evidence ........................................................................ 26
Mediating the Workload .............................................................................................. 27
Teacher Leadership .................................................................................................... 29
Perspectives of Educators at the School Level .................................................................. 30
Teachers’ Perspectives .............................................................................................. 30
Principals’ Perspectives .............................................................................................. 31
District Leadership, Capacity Building and Supports .............................................................. 31
District and Regional Resources ........................................................................................ 32
District Approaches to Professional Development for Teachers .................................. 32
Professional Development Supports for Principals and Assistant Principals ............... 38
Use of Outside Agencies for Training and Professional Development ........................ 45
Integration and Coherence with Other Initiatives......................................................... 45
Relationship to Associations ....................................................................................... 47
Data Management and Use ............................................................................................... 48
Choice of Electronic Tools .......................................................................................... 48
Uses of Evaluation Data ............................................................................................. 51
Analysis of District and School Summative and Criterion Scores ................................ 53
District Organizational Learning ......................................................................................... 59
State Level Mandates and Supports ...................................................................................... 61
State Policy Approaches in the Implementation of TPEP ................................................... 61
TPEP’s Mandates and Flexibility ................................................................................ 61
State Inducements to Support TPEP Implementation ................................................. 62
Capacity Building Strategies ....................................................................................... 63
Strengths and Limitations of TPEP ........................................................................................ 68
Strengths .................................................................................................................... 68
Limitations .................................................................................................................. 69
Suggestions for Improvement ..................................................................................... 70
Impact of TPEP on Career Decisions ......................................................................... 72
Conclusions and Policy Implications .................................................................................... 74
Conclusions ........................................................................................................................... 75
Implications for State Policy ................................................................................................... 76
iii
References .............................................................................................................................. 79
Appendices ............................................................................................................................. 82
A1: Summary of Participating and Non-Participating iGrant 664 Districts in 2015-16 (Teacher
Training Funds) ..................................................................................................................... 82
A2: iGrant 664 Funding Usage by Region, Framework and Enrollment ................................. 83
iv
Figures
Figure 1: Teacher Perspectives on the Usefulness of Collaborating with Others on TPEP Goals .................................................................................................... 20 Figure 2: Districts that Provided Additional Staffing at the Building Level in the Last Two Years: Types of Staffing Support ............................................................ 42

v
Tables
Table 1: Survey Samples and Participation Rates by Educator Group ............................ 7 Table 2: Demographic Characteristics of Teacher Sample Compared to All Teachers Statewide .......................................................................................... 8 Table 3: Demographic Characteristics of Principal and Assistant Principal Sample Groups Compared to All Principals and Assistant Principals Statewide ............ 9 Table 4: Demographic Characteristics of Superintendent Random Sample Compared to All Superintendents Statewide ................................................... 10 Table 5: Characteristics of Case Study Districts ........................................................... 11 Table 6: School and District Leaders’ Perspectives on the Purposes of TPEP.............. 14 Table 7: Teacher Views on Collaboration and TPEP-related Activities.......................... 19 Table 8: Teacher Collaboration on Activities Related to Evaluation .............................. 20 Table 9: Teacher Confidence Regarding Goal Setting and Evidence of Student Growth.. ......................................................................................................... .22 Table 10: Views of School and District Leaders: Perceived Challenges Faced by
Teachers.. ....................................................................................................... 23 Table 11: Teacher Confidence Regarding Assessments and Measuring Student Growth .. ......................................................................................................... 24 Table 12: Principal Views on Responsibility for Collecting Evidence of Student Growth . 27 Table 13: Teacher Views of Evaluation System .............................................................. 30 Table 14: Professional Development Content and Audience……………………………….33 Table 15: Aspects of TPEP Process in District Professional Development Plans by Region, Framework, and Enrollment ............................................................... 34 Table 16: Aspects of Goal Setting and Collection of Evidence in District Professional
Development Plans by Region, Framework and Enrollment ............................ 35 Table 17: District Administrators Perceptions of the Challenges Faced by Principals with Regard to TPEP ...................................................................... 39 Table 18: Confidence in Evaluation Scores With Different Evaluators: For Teachers and Principals with More than One Evaluator in the Building: Superintendents Across Evaluators ................................................................ 43
vi
Table 19: Extent to which Elements of TPEP are Incorporated into School or District Professional Development Offerings ............................................................... 46
Table 20: Choice of Most Frequently Used Electronic Tool by Survey Participants Who Use Electronic Systems .......................................................................... 49 Table 21: Teacher and Principal/Assistant Principal Views About Electronic Tools: Percent Indicating Agreement ......................................................................... 50 Table 22: Extent to which Districts Use Evaluation Data to Help Make Decisions ........... 52 Table 23: Summative and Criterion Scores Provided by Participating Districts ............... 54 Table 24: Summative Scores by District, 2015-16 .......................................................... 55 Table 25: Summative Scores by School Level ................................................................ 55 Table 26: Criterion Scores for Two Districts .................................................................... 56 Table 27: Summary of Criterion Scores by Grade Level for One District ......................... 57 Table 28: Scores for Student Growth Criterion for One District ....................................... 58 Table 29: District Administrators Areas of Focus for TPEP, if Additional Supports were Available ................................................................................................ 63 Table 30: Views of Teachers and Principals on the Challenge of Writing Student Growth Goals by Evaluation Type ................................................................... 64 Table 31: Circumstances Under Which Student Perception Data Could be Useful for
Teacher Evaluation ......................................................................................... 66 Table 32: Usefulness of Pro-Teach/Pro-Cert and TPEP for Professional Growth ........... 67 Table 33: Views of Principals and Superintendents on Teacher Dismissal on TPEP Versus Old System ......................................................................................... 70 Table 34: Views of Teachers, Principals and Assistant Principals on the Impact of TPEP on Career Decisions ............................................................................. 73 Table 35: Views of Teachers, Principals and Assistant Principals on Future Career
Decisions ........................................................................................................ 74
vii
Executive Summary
Washington state’s new teacher and principal evaluation system (TPEP) represents one of the most substantial changes in statewide education policy in recent years. Districts and schools face distinct challenges in trying to implement a complex evaluation system like TPEP. Using a backward mapping strategy to investigate the implementation of TPEP, this study examined issues associated with an evaluation policy that seeks to serve dual purposes of accountability and instructional improvement. In this study, we investigated factors that impact the quality, substance, and sustainability of the new evaluation policies.
Research Methods and Questions Through the use of statewide surveys, district case studies, and other state and district data sources, we employed a concurrent mixed-methods research design. The major research questions included the following:
What knowledge, skills and supports are needed for teachers and principals to continue to productively engage in TPEP?
How are districts and schools building staff and system capacity for sustainability?
How and in what ways is evaluation data being used by schools and districts?
Quantitative data for this mixed-methods design was collected via statewide online surveys of school and district staff involved in teacher evaluation during the spring of 2017. Random and stratified random sampling strategies created statistically representative samples of the state’s teachers, principals, assistant principals, and superintendents for survey purposes. Qualitative data was gathered in nine purposefully-selected case study districts designed to include variation by size, region, instructional framework, implementation timeframe, and demographic characteristics of students served. Qualitative data was collected in three rounds over an 18-month period from January 2016 to June 2017, and included 178 interviews with teachers, school and district administrators and teachers’ association representatives. A subset of the case study districts provided de-identified teacher summative and criterion scores, which helped inform conversations regarding uses of evaluation data in the final round of site visits. The research team also analyzed the applications for professional development funding submitted by school districts in the 2015-16 school year (iGrant 664).
Findings: Backward Mapping the Implementation of TPEP We have chosen to use the principles of a backward mapping strategy to describe study findings about the implementation of TPEP. We began with the level of the implementation process that generates the need for the policy – in this case the school, and the need to ensure high quality instruction to support student growth. It is at the school level, with educator expertise, skill, resources and proximity to the task where the policy will have the greatest probability for success. Next, we examined district-level approaches to policy implementation, and the resource decisions and strategies used to support staff. Finally, we considered TPEP implementation at the state level, where the policy can be understood through state policy
viii
instruments such as mandates, inducements and capacity building, which were utilized to support the desired outcomes.
Purposes of TPEP
TPEP was designed to incorporate both purposes of accountability and improvement in one model, and to encourage districts to use it to support high quality instruction as a means to improve student learning. Findings from the case studies and surveys suggest that for most Washington educators, the primary focus of TPEP has been one of educator improvement, and its use as a professional growth model. When asked about the various purposes of TPEP (including both accountability and improvement), a majority of principals and superintendents surveyed identified its primary purpose as one of supporting professional growth, with less emphasis on non-renewal of contracts, dismissal of staff, or staffing changes. One of the most substantial changes to the evaluation system has been the adoption of instructional frameworks as models for effective teaching. Among teachers, there is general agreement that the instructional framework adopted in their district provides a common language to talk about teaching (89% somewhat or strongly agree). A majority of superintendents surveyed (83%) indicated that professional conversations prompted by TPEP about what constitutes effective teaching have had a positive or very positive impact on their district. Incorporation of the instructional frameworks has been among the most valuable aspects of the evaluation process because of the coherence it can provide in ongoing instructional improvement efforts.
School Level Supports for the Implementation of TPEP
TPEP-focused professional development has substantially changed since the initial years of implementation, as staff have become increasingly familiar with the processes and activities surrounding the evaluation. In many districts, training has shifted from all district or all school events, to individualized or small group meetings with teachers. A majority of teachers agreed that TPEP increased collaboration with other teachers, and that collaborating with others about their TPEP goals was useful. A majority of principals and assistant principals surveyed reported that TPEP had improved the quality of professional collaboration in their school. Examples from the case study work suggest that the extent to which TPEP had an impact on teacher collaboration at the building level may be related to whether or not the school had a well-functioning professional learning community prior to TPEP implementation. Goal setting for student growth is a cornerstone of the new evaluation policy, and survey results indicate that the majority of teachers rated themselves as highly competent or good in their ability to set goals for student growth for a whole classroom, for a sub-group of students or as part of a collaborative work group. Most teachers also rated their ability to identify appropriate forms of evidence to measure student growth as highly competent or good. However, school and district level leaders expressed less confidence in teachers’ ability to set goals for student growth, or use assessments of student growth in developing goals. Goal setting for student growth was an area of challenge identified by school leaders for continued improvement.
School Leadership
Numerous forms of evidence in the study pointed to the critical importance of school leadership in supporting teacher evaluation. A majority of principals and assistant principals agreed that
ix
TPEP has allowed them to focus more on instructional leadership and has improved their capacity to have meaningful conversations with teachers about their instruction. More than four-fifths of teachers agreed that their administrators use the instructional framework to discuss effective teaching practices and that their evaluator gives them feedback on their student growth goals. Nearly three-quarters of teachers also agreed that their evaluator gives them suggestions for improving their teaching. The use of multiple measures of student growth adds a fundamentally new and complex feature to teacher evaluation. During visitations to school sites, we observed wide variation in who bears responsibility for the collection of evidence aimed at gauging whether or not goals have been met. This variation is one of the factors that may impact the workload associated with TPEP for teachers and principals. Survey results indicated that nearly two-thirds of Washington teachers have had more than one evaluator under TPEP, with the majority having two or three evaluators. Despite having multiple evaluators, teachers indicated confidence in their principals’ ability to fairly evaluate them. More than three-quarters of teachers either strongly or somewhat agreed that they have confidence in their evaluator’s ability to rate their performance as a teacher. The majority of teachers (72%) also agreed that school leaders have created an environment that supports professional growth and risk-taking. Findings from the survey indicated that, on average, school administrators each evaluated approximately 21 teachers during the 2016-17 school year. The mean number for principals was 22.6 and the mean for assistant principals was 18.6. On average, the number of evaluations conducted by principals ranged from 14 to 30 teachers. Also on average, principals and assistant principals evaluated about three more teachers on a focused evaluation as they did on a comprehensive evaluation. This represents a substantial number of evaluations to complete. One of the most consistent themes across all the data was the challenge of managing the tensions around how to ensure that evaluations are done appropriately with depth and meaning, while also balancing all the other responsibilities that principals have, especially in schools with only one evaluator. The special circumstance of sole building principals trying to manage the workload in small schools and districts was a common theme that emerged from the data.
Views of Teachers and School Leaders
A majority of teachers (71%) agreed either strongly or somewhat that their evaluation recognized and built on their knowledge and experience, and 63% of teachers agreed that their evaluation has been directly applicable to their work. However, more than half of teachers disagreed that their evaluation improved their skills to meet the instructional needs of students from diverse backgrounds. Additionally, nearly half of teachers did not agree that their evaluation led them to make changes in their teaching. The majority of principals and assistant principals prefer TPEP to other forms of teacher evaluation. More than three-fourths of principals and assistant principals agreed that they have better interactions with teachers because of TPEP, and more than half of principals and assistant principals agreed that the majority of the time they spend on TPEP is useful. Not surprisingly, given the prominent concern about a lack of time for engaging in TPEP, the vast majority of school leaders (85%) agreed that TPEP has increased the amount of time spent working on weekends and in the evenings.

x
District Leadership, Capacity Building and Supports
Continued support and resources for professional development will be vital to sustain a focus on instructional improvement as part of the evaluation effort. Capacity building at both the district and school level is an ongoing process, and the organizational infrastructure and resources play a role in determining how effectively staff have been able to implement the initiative. Districts were able to apply for state funding (iGrant 664) to help support TPEP implementation. Over half of the districts in 2015-16 receiving funding planned to use it to pay trainers, facilitators or consultants to support teacher professional development activities. More than a third of the districts planned to use it to hire substitute teachers for training during a regular workday, or to purchase a variety of materials. Support for transportation costs to attend professional development events was most important for the smallest districts (less than 1,000 students) and those districts in Eastern Washington or in Western Washington outside of the Central Puget Sound. By far, district administrators perceived the greatest challenge faced by principals to be that of time to conduct evaluations. In addition, at least half of the superintendents surveyed identified principal knowledge about goal setting for student growth, and principal ability to assist teachers in developing measures of student learning as a moderate or great challenge. Results from the case study and survey work indicate that there is a need for ongoing professional development supports for principals and assistant principals, preferably in collaboration with other school administrators. In the survey, three quarters of principals and assistant principals agreed that they would benefit from more professional development related to TPEP. Districts are also providing other types of support for principals, including adding personnel and re-allocating the use of existing personnel. Forty-three percent of superintendents indicated that their districts have provided additional staffing to assist principals with teacher evaluations, and 26% of principals and assistant principals stated that they have received additional or re-allocated staff supports in their schools. Of the superintendents who stated that additional personnel had been provided to assist with teacher evaluation, 65% said they added full or part-time assistant principals, and 59% said they added time for instructional coaches, TPEP coaches or department heads. Half of superintendents indicated that full or part-time deans of students were added. Some of the supports for school administrators have focused on providing opportunities for work on calibration, consistency, and rater reliability. The majority of teachers either strongly or somewhat agreed (73%) that they would receive similar scores on their evaluations regardless of who evaluates them, and 60% either strongly or somewhat agreed that the quality of feedback teachers receive in their buildings is similar irrespective of who the evaluator is. Somewhat larger proportions of principals and assistant principals also agreed that teachers would receive similar scores (86%) and receive the similar quality of feedback (84%) regardless of who the evaluator is. However, superintendents expressed less confidence than principals and assistant principals in this regard, with 69% agreeing that teachers would receive similar scores and 56% agreeing that the quality of feedback would be similar regardless of who the evaluator is. In examining the extent to which districts incorporated TPEP into professional development offerings, 20% of teachers and principals reported elements of TPEP were incorporated to a great extent, and approximately half said TPEP elements were somewhat incorporated. Among superintendents surveyed, 36% reported that TPEP was incorporated to a great extent into professional development.
xi
Forty-four percent of survey respondents indicated that TPEP has had a very positive or somewhat positive impact on the relationship between the district and the teachers’ association, but another 44% reported that it has had no impact, and 13% stated it has had a somewhat or very negative impact on the relationship. Case study findings suggest that, for most districts, early conversations with teachers’ associations proved critical to productive engagement in the TPEP implementation process.
Data Management and Use
Technological tools have played a role in the initial implementation of TPEP, including the use of eVAL and other electronic tools. However, approximately one-third of teachers and 17% of school administrators responded that they did not use any electronic tools for the evaluation. Of the survey respondents who reported using electronic tools, eVAL was the most common type of tool mentioned, with Google Docs named as the second most frequently used electronic tool. Superintendents were asked about the extent to which evaluation data is used to help make a variety of decisions. Most often superintendents reported using evaluation data to inform matters of professional development, assessing progress on school improvement goals, and identifying teacher leaders rather than informing decisions about hiring and assignment. When asked about the uses of evaluation data, educators in our case study districts emphasized that data other than quantitative scores were more informative for continuous improvement and planning at all levels of the system. Several case study districts provided de-identified summative and criterion scores for the 2015-16 school year. In three districts that provided summative scores, a higher proportion of teachers on a comprehensive evaluation were rated as basic or proficient, and a lower proportion were rated as distinguished than those on a focused evaluation. Two districts provided criterion scores. These scores showed interesting variation in the percentages of low and high scores, which might be interpreted as the level of challenge of the criteria. In both districts, Criteria 2 and 3 were challenging (with relatively high percentages of evaluations below proficient), while Criteria 1 and 8 were less challenging (with relatively high percentages of distinguished ratings).
By design, TPEP allows for local decision-making at district, school, and classroom levels. These choices include matters such as instructional framework, identification of growth goals for students and professionals, use of formative and summative assessments, choice of electronic tools, relationships with professional associations, and use of evaluation data. Consequently, significant variation exists, as there are numerous and complex factors shaping the specific contours of TPEP implementation across the state’s schools and classrooms. Findings from this study point to several ways in which the analysis of TPEP implementation serves as a reflection of the capacity of individual districts to articulate a vision for improvement, support teachers and principals in substantive ways, develop supportive and trusting work environments, and integrate initiatives in a coherent way.
State Level Mandates and Supports
TPEP implementation was also examined through the lens of specific aspects of state policy. Recently, the state made a policy change regarding the focused evaluation that allows using a summative score of 3 or 4 from the prior comprehensive evaluation in subsequent years.
xii
Approximately two-thirds of districts surveyed indicated that they had implemented the change during the 2016-17 school year. The change was proposed to encourage teachers to address areas of challenge during the focused evaluation process. However, when teachers on a focused evaluation were asked if being on a focused evaluation gave them greater opportunity to stretch themselves professionally in setting goals for student growth, more than three-quarters indicated that there was no difference whether on a comprehensive or focused evaluation, and responses from principals were nearly identical. Another way in which the state has attempted to increase capacity is by examining ways in which student voice can be elevated in conversations about teaching effectiveness and other school experiences. About one quarter of teachers and administrators surveyed reported using student perception data as evidence in TPEP evaluations, and the majority of respondents indicated that student perception data should be used to gather student feedback in the classroom, understand students’ experiences in the school, and as a means for reflecting on teaching. Most teachers and administrators agreed that student perception data would be useful as an optional form of evidence for teacher evaluations. However, only about one-tenth of all respondents thought that student perception data should be a required form of evidence in teacher evaluations. Additionally, 22% of teachers indicated that student perception data should not be used under any circumstances for purposes of teacher evaluation.
The state’s teacher evaluation system also interacts with and is influenced by the broader context of teacher preparation and certification. The majority of principals interviewed stated that recent graduates of teacher preparation programs seem more aware of what is required concerning teacher evaluation, specifically with respect to setting growth goals, collecting evidence, and reflecting on their teaching. Of the teachers who completed either the Pro-Cert or the Pro-Teach process in the last five years, 22% indicated that TPEP was more useful than Pro-Teach or Pro-Cert, 19% said that Pro-Cert or Pro-Teach was more useful, while 43% responded that neither was useful for professional growth.
Strengths and Limitations
As an evaluation system, educators generally agree that TPEP has some strengths. These include the instructional framework, the conversations about instructional practice, and the focus on student and professional growth. The vast majority of teachers surveyed either strongly or somewhat agreed that the instructional framework provides a common language to talk about teaching, and that the framework is used by administrators to discuss effective teaching practices. Approximately three-fourths of teachers surveyed agreed that examining student growth is a useful part of teacher evaluation and that their TPEP evaluations have been a fair assessment of their work as a teacher. The overwhelming majority of school administrators surveyed either strongly or somewhat agreed that the TPEP process recognizes the complex nature of teaching. However, a smaller majority of teachers surveyed agreed either somewhat or strongly with this view, and a quarter of teachers somewhat disagreed. When superintendents were asked to assess how TPEP has impacted their districts, a large majority responded that TPEP had either a very positive or somewhat positive impact on student learning, the professional growth of teachers, the professional growth of administrators, and high expectations for student learning. Similarly, principals and assistant principals agreed that TPEP had a positive impact on student learning outcomes and improved the quality of instruction.
xiii
TPEP also has some limitations. Time constraints were a major concern of educators for fully implementing the evaluation system. The most common feedback from teachers described a need to better address the types of responsibilities of teachers in specialized roles (e.g., music and physical education teachers, subject matter specialists). Another frequent comment from teachers was that aspects of the student-teacher relationship were missing from the evaluation system, such as building personalized relationships with students. Some teachers also commented that TPEP doesn’t take into account work done outside of the classroom, such as extra-curricular activities and after-school tutoring. A number of school leaders mentioned that TPEP does not adequately capture a teacher’s innovations or creativity nor does it address issues of professionalism that go beyond instructional skills, such as attitude, respect for colleagues, and issues of attendance. Administrators who responded to our survey were asked whether it is easier or harder to dismiss a teacher under TPEP as compared to the previous evaluation system. Almost half (48%) of superintendents and 39% of principals and assistant principals responded that there is no difference in the challenge of dismissing a teacher under TPEP or the old system. Nearly one-third of superintendents believed it was easier to dismiss a teacher under the old system, compared to 20% of principals and 9% of assistant principals. However, more than a quarter of assistant principals, and 13% of principals, indicated that they could not judge this because they have only evaluated teachers under TPEP. The breadth of issues covered under a comprehensive evaluation within a single year was a concern for many educators. More than three-quarters of teachers, four-fifths of school administrators, and 71% of superintendents either strongly or somewhat agreed that the comprehensive evaluation attempts to cover too many aspects of teaching in a single year. More than four-fifths of principals and assistant principals (84%) identified covering all aspects of a comprehensive evaluation with a first year teacher as a major or moderate concern. Additionally, some educators in our case study districts expressed support for the idea of requiring a comprehensive evaluation every six years once a teacher has been rated as proficient or distinguished in evaluations after their probationary period. Not all educators in our case study districts supported that notion, arguing that it is important to cover all aspects, especially for novice teachers, and that there are ways for an evaluator to make it work efficiently. Study participants had other suggestions for how TPEP might be improved. Nearly three-quarters of principals and assistant principals, 69% of superintendents and 61% of teachers agreed that peer review might be useful. Educators in several of our case study districts noted that there is a potential for TPEP to become “stale” and worried that the focus on supporting continuous improvement might wane over time. Several administrators in case study districts talked about a need to have “refresher” activities that can help keep the momentum going. Educators in the case study districts also described the need for continual support from the state to improve the sustainability of TPEP over time. A frequent suggestion for improvement was for the state to acknowledge and target support to address the unique circumstances evaluators face in small districts and small schools.
Currently TPEP does not appear to have a strong influence on whether educators are considering leaving the profession. The majority of teachers surveyed either strongly disagreed (44%) or somewhat disagreed (23%) that TPEP has made then consider leaving teaching. About one tenth of teachers (12%) strongly agreed that TPEP made them consider leaving teaching. Additionally, 14% of principals strongly agreed that TPEP has made them consider leaving their position as a school leader, but only 7% of assistant principals strongly agreed.
xiv
Conclusions
1. How TPEP is implemented in schools and districts is a reflection of the organization’s
leadership capacity and belief systems. The long-term sustainability and success of the evaluation policy may be linked to the ways in which districts think and talk about teaching. According to many educators, the conversation should be centered around instruction and professional growth, rather than scoring and “checking off a box.” Districts communicate the primary purposes of TPEP, and this can influence whether or not educators see the policy as a means to continuous improvement or as simply a requirement to be met. Districts can also prioritize the creation of a trusting and collaborative culture that supports improvement efforts and coherently integrates the evaluation system into the broader set of initiatives and activities aimed at improving student and professional learning. Findings from this study support the primacy of the school leader in establishing trust, creating conditions and serving as an instructional leader for TPEP to be understood as an opportunity for continuous growth. Principals and assistant principals shoulder the majority of responsibilities for the evaluation, and the workload of school leaders can be overwhelming. In many cases, districts have added additional administrative staff and other supports to help evaluators manage these responsibilities.
2. The strength of TPEP is in its use of an instructional framework to support continuous growth of student and professional learning.
TPEP implementation is directly related to educators’ knowledge about effective instruction, and the instructional framework can help support those conversations. The evaluation process requires a deep understanding of goal setting for student and professional growth and the use of evidence to assess progress toward these goals, both on the part of teachers and administrators. Given these elements of the evaluation, the instructional framework can serve as a unifying factor and help create coherence for staff as they work together on issues of professional practice.
3. Relying on scoring to prompt improvement is not a productive strategy. The data indicates that most Washington teachers receive a summative score of proficient, and a few receive a distinguished rating. Few teachers receive a summative rating of basic or unsatisfactory. Thus, summative data is not helpful in providing educators with the kind of detailed feedback necessary to guide conversations about instructional improvement and student learning. While our examination of criterion scores in a handful of districts indicates a small amount of variation, this data alone does not provide sufficient detail to be reliable for general planning or professional development purposes. Gauging progress solely on the basis of changes in summative or criterion scores, either at the school or district level, does not provide sufficient evidence to inform strategies for improvement, nor will it necessarily help inform decisions about hiring, staffing, or contract renewal.
4. TPEP cannot be done in isolation. Collaboration is a fundamental element of the evaluation system as a means by which educators work together to improve professional practice and student learning. Collaboration applies in a very specific sense to the work of teachers with one another and their school leaders within the local context. But it also applies to the process itself, and the extent to which educators (whether at the classroom, school, district or state level) are able to create and
xv
engage in consistent procedures that generate confidence in the usefulness and fairness of the system. Teachers and administrators prioritized the provision of professional development in collaboration with others as the most important and valued aspect of TPEP. The collaborative nature of TPEP activities will need to be supported for long-term sustainability.
Policy Implications
1. There is a need for continuous professional development and collaboration to support TPEP implementation, for both teachers and administrators.
Evidence from multiple sources included in this study points to the need for ongoing professional learning opportunities for teachers and administrators. In addition to the onboarding of those teachers and administrators new to the profession or to a specific framework, educators in this study expressed a need for “refreshers” for those who have been working with TPEP for some time. This type of training may best be done in collaboration with others and may best be accomplished at the local level. In this study, educators noted the shift in providing professional development at district and school levels, using educators within a district as local experts.
2. Differentiated supports are needed to address special circumstances
This study demonstrates the differential impact of the state’s teacher evaluation policy in light of factors such as size and location of the district, grade levels served, and types of teaching responsibilities and assignments. In particular, we found that small and rural or remote districts often have no readily available opportunities for collaboration and are in need of supports that help them connect with others and mediate the workload. Similarly, schools that have only one evaluator (typically small elementary schools in districts of all sizes) are in need of supports and opportunities for calibration. In addition to characteristics of districts and schools, teachers serving in specialized roles (e.g., music, PE, instructional coaches) often feel that the evaluation is not applicable to many aspects of their work. Attention should be paid to adaptations that can mediate this problem.
3. Sustaining TPEP to support continuous improvement
An ongoing challenge for the state involves supporting and sustaining the long-term efforts of schools and districts to productively engage staff in the evaluation process. As a number of educators who participated in this study have noted, TPEP may be at risk of becoming “stale” and marginalized if workload issues are not addressed and supports are not forthcoming. Additionally, promoting the purpose of continuous improvement is a message that needs continual emphasis so that the routines established for conducting evaluation to do not devolve to a simple process of “checking the boxes.” Integrating TPEP with other state and district improvement initiatives can help support its sustainability. One example for consideration would be for teacher certification systems to become more integrated with TPEP. Narrow views of the purposes of TPEP, for example, viewing its primary purpose as one of “firing bad teachers,” fails to recognize the complexities and potential involved in building a system that supports continuous growth. TPEP is not causing a large proportion of educators to consider leaving the profession, but principals are most at risk, given their significant workloads. Efforts to streamline some TPEP processes should be considered, including ways to be strategic about focusing on critical aspects of the comprehensive evaluation based on teacher needs. Maintaining a focus on building professional capacity of educators at all levels in the system seems warranted for TPEP to realize its full potential.
1
Introduction
Washington state’s new teacher and principal evaluation system (TPEP) represents one of the most substantial changes in statewide education policy in recent years. Districts and schools face distinct challenges in trying to implement a complex evaluation model like TPEP. Over the past five years, the University of Washington research team has been engaged in efforts to understand the implementation of the new evaluation system. This research has brought to light substantial issues associated with an evaluation system that seeks to serve dual purposes of accountability and instructional improvement. Through this implementation research, we examined factors that impact the quality, substance, and sustainability of the new policies surrounding the educator evaluation system in Washington.
Background on the Teacher and Principal Evaluation Project
National Context
A confluence of recent federal and state policies has resulted in substantial changes to teacher evaluation practices in many states. Educators and policymakers have long described traditional teacher evaluation systems as inadequate to identify teachers as unsatisfactory, and rarely did the process support instructional improvement (Darling-Hammond, Amrein-Beardsley, Haertel, & Rothstein, 2012; Gitomer et al., 2014; Isore, 2009). While a consensus has emerged that teacher evaluation needed fundamental change, there are widely disparate views about both the purposes of teacher evaluation and the approaches to designing and implementing an improved system. Teacher evaluation is commonly understood to serve dual purposes of accountability and improvement (Hargreaves & Braun, 2013; Papay, 2012). Evaluation for accountability has focused on using teacher evaluation to make decisions about hiring, firing, tenure, or salary. In recent years, the means for conducting evaluation for accountability purposes includes determining how a teacher’s performance in the classroom contributes to student learning. This implies a high-stakes system of evaluation, and one that is currently being debated, designed or implemented in numerous states (Braun, 2015; Lavigne, 2014). In contrast, evaluation for improvement examines the extent to which both the process and the results can inform decisions about professional learning opportunities needed to help teachers and schools engage in continuous improvement (Danielson, 2011; Goe, Biggers, & Kroft, 2012; Looney, 2011). A recent study of six high-performing high-poverty schools in Massachusetts examined how teacher evaluation was approached in these schools. All six schools had received the state’s highest accountability rating. The researchers found that all of these schools prioritized the goal of developing teachers and focused on improvement over holding teachers accountable (Reinhorn, Moore Johnson & Simon, 2017). A growing body of literature examines the changing landscape of educator evaluation, particularly as it pertains to measuring the impact that teachers have on student learning and the use of teacher value-added scores (Goldring, et al., 2015; Grissom & Youngs, 2015; Hargreaves & Braun, 2013; Harris & Herrington, 2015; Papay, 2012). Other studies have focused on educator perspectives of the reform and concerns about its impact on school collaboration and improvement initiatives (e.g., Jiang, Sporte & Luppeascu, 2015; Moore Johnson, 2015). Fullan and Hargreaves (2015) suggest that policymakers should focus on
2
building professional capital as a means of developing internal accountability for educational systems, which they describe in terms of individual human capital, social capital and decisional capital. Donaldson (2013) considers human capital management by school principals and their role as developers of human capital by simultaneously considering their experiences with teacher hiring, assignment, evaluation, and professional development. But there has been a lack of research regarding the actual human resource impact on schools and districts attempting to implement ambitious new evaluation policies, though the concern has been raised (e.g., Herlihy et al., 2014). An exception is the work of Malen and Rice, and their colleagues in examining a district’s implementation of the teacher evaluation component of a federal Teacher Incentive Fund (TIF) grant (Malen et al., 2015). Recent research has examined the variation in scores obtained from teacher evaluations in states that have recently revised their systems. Kraft and Gilmour (2017) note that in the majority of the 24 states they examined, the percentage of teachers rated unsatisfactory was less than one percent. However, these researchers found more variation across states in ratings of teachers identified as being above proficiency (ranging from 0.7% to 28.7%) and below proficiency (ranging from 6% to 62%). The researchers then conducted a survey in one urban district and found that evaluators perceived more teachers to be below proficient than those who received actual ratings of below proficient, citing factors such as time constraints, perceptions of teacher’s potential to improve, and personal discomfort on the part of the evaluator as possible explanations for the difference (Kraft & Gilmour, 2017). Research by Grissom and Loeb (2017) in one urban district found differences in principals’ ratings of teachers in high versus low stakes environments, with principals using lower rating categories more often in the low stakes condition. Of particular relevance to teacher evaluation policy is implementation in the context of converging initiatives. While Malen et al. (2015) provide an illustrative case of a single district’s implementation of a teacher evaluation model, our study expands on these themes by taking a broader statewide perspective. In this regard, education implementation literature that focuses on state policy mandates accompanied by state-funded supports, local decision-making discretion, and a phased implementation design can inform aspects of the work (e.g., Cohen & Hill, 2008; McDonnell & Elmore, 1987; McLaughlin, 1987; Spillane, Reiser & Reimer, 2002). Washington state illustrates such a case where some support is provided to districts, including local discretion in the selection of an instructional framework, phased-in implementation, and selection of student growth measures.
Teacher Evaluation in Washington State In 2010, the Washington state legislature adopted Senate Bill 6696 which authorized the change from a two-tier system of satisfactory/unsatisfactory teacher evaluation to a four-tier system called the Teacher and Principal Evaluation Project (TPEP). The legislation created eight new criteria on which teachers were to be evaluated, and required that districts select one of three approved instructional frameworks1 to help align instruction with state standards and to provide a common language for quality teaching. The eight state teacher evaluation criteria
1 The three instructional frameworks are: Charlotte Danielson’s Framework for Teaching, the Marzano Teacher Evaluation Model, and the Center for Educational Leadership’s 5D+ Evaluation Rubric (CEL). Descriptions of these frameworks can be found at: http://tpep-wa.org/the-model/framework-and-rubrics/
3
descriptors include: high expectations, instructional practice, differentiation, content knowledge, learning environment, assessment, families and community, and professional practice.2 The state identified two types of evaluation: comprehensive and focused. Teachers on provisional or probationary status must be evaluated annually on the comprehensive evaluation, meaning that the evaluation must assess all of the state’s eight criteria in developing the rating. All classroom teachers must receive a comprehensive summative evaluation at least once every four years, otherwise teachers are evaluated annually on a focused plan which addresses at least three of the eight state criteria. Principals are required to gather or provide evidence of the teacher’s practice on each of the criteria for which they are evaluated. A key component of the evaluation system is evidence of student growth on multiple measures as identified in three of the eight criteria. It is student growth in subject-matter knowledge, understandings, and skill between two points in time, not student achievement that is relevant as a form of evidence for use in the state’s teacher evaluation system. According to the legislation, state tests can be used to measure student growth, but districts are not required to use them.3 The use of multiple measures of student growth in teacher evaluation adds a fundamentally new and complex feature to teacher evaluation. While most administrators welcome this flexibility, it also presents challenges with regard to the choice, use and interpretation of these measures. States that use multiple measures of student performance in the design of their evaluation systems are exploring ways to ensure the validity and reliability of their scoring systems. Even though a uniform set of strategies to establish reliability, validity, and consistent training for evaluators has not yet emerged (Accomplished California Teachers, 2015; Herlihy et al., 2014), the collaboration between teachers and school administrators is often cited as a way of ensuring fairness, trust and accuracy (Hargreaves & Braun, 2013). Washington’s new model requires substantially more time than the prior evaluation system as principals are required to meet with teachers to create individualized professional and student growth goals, and identify ways of measuring progress toward achieving them. Unlike states that now use value-added student test scores as a percentage of the teacher’s evaluation, Washington’s process places an emphasis on professional conversations around specific student growth goals and the instructional practices designed to achieve them. Principals conduct formal observations with requisite pre- and post-conferences, gather various forms of evidence, and create written records. For most districts, the number and duration of classroom observations across the school year, scripting, evidence gathering and documentation to create a formal record represents a significant increase in workload for principals. In Washington state, this grassroots approach – the variety and discretion districts are allowed in the use of student growth measures, and implementation of the evaluation system overall – makes it a particularly interesting case for examining the variation in implementation strategies and the role that local choice may play.
2 Washington’s Teacher Evaluation Criteria include: 1) Centering instruction on high expectations for student achievement, 2) Demonstrating effective teaching practices, 3) Recognizing individual student learning needs and developing strategies to address those needs, 4) Providing clear and intentional focus on subject matter content and curriculum, 5) Fostering and managing a safe, positive learning environment, 6) Using multiple student data elements to modify instruction and improve student learning, 7) Communicating and collaborating with parents and the school community, and 8) Exhibiting collaborative and collegial practices focused on improving instructional practice and student learning. 3 Washington lost its federal waiver under No Child Left Behind for not mandating the use of state tests in teacher evaluations.
4
Development of a new system for teacher evaluation in Washington state began in 2010, with a small group of districts that volunteered to develop and pilot possible models, and received state funding to support these efforts. By 2011-12, an additional 70 districts received Regional Implementation Grants (RIGs) to help them learn about the work of the pilot districts and prepare for the adoption of a new model. Over the next two years, a total of 208 of the state’s 295 districts received some type of support to prepare for implementation. By 2013-14, all districts were required to begin formal implementation, with discretion to phase it in over three years.
TPEP Implementation During the three years of formal implementation, the Washington Legislature provided funding to districts in the form of grants to support teacher training. The 2013 Legislature appropriated $10 million to be used that year. In both of the following years, $5 million was authorized in grant funding to districts “solely for the provision of training for teachers in the performance-based teacher principal evaluation program” (OSPI, 2014). Grants were based on the percentage of the state’s total teachers employed in the district at a rate of approximately $85 per teacher, and districts were encouraged to focus on evidence gathering, formative assessment, and student growth. Districts could choose to augment these funds with other locally available resources, which many did. Recently the state legislature made adjustments to the evaluation policy. One change involved the ability to carry the score from a comprehensive evaluation in the prior year to the focused evaluation in the subsequent year. This applies only to teachers and principals who have received a score of proficient (level 3) or distinguished (level 4) and have been moved to the focused evaluation. The change was made to encourage teachers and principals to address areas of challenge during the focused evaluation. A second change set the deadline for moving a teacher or principal from a focused evaluation to a comprehensive within the school year to December 15. A third change involved expanding the definition of an observation to include activities that may take place outside of the classroom or school day. Districts were allowed to implement these changes in either the 2016-17 or the 2017-18 school years. Introducing an ambitious statewide evaluation system necessarily impacts educators across multiple levels of the system. By design, there has been considerable variation in implementation strategies at district and school levels. In this study, we focus on several aspects of the new system, including the use of an instructional framework, two different evaluation plans (comprehensive and focused), student growth goals, multiple measures of evidence, time needed for evaluation activities, and data collection and management. These elements have impacted the role of the principal, the allocation of staff, professional development for teachers and administrators, and time to manage the workload.
Research Questions and Methods
Research Questions We used a mixed-methods research design to study the implementation of the teacher and principal evaluation model in Washington state. Through statewide surveys and district case studies, we identify issues that teachers and school and district leaders have faced in the implementation process. We also describe and analyze how teacher professional development

5
resources have supported TPEP implementation. To do so, the following topical areas and research questions were examined:
Professional Development Supports for TPEP Implementation What knowledge, skills and supports are needed for teachers and principals to continue to productively engage in TPEP?
What actions have educational leaders taken to support authentic engagement with their staff in the evaluation process?
In what ways have teacher training grant funds (iGrant 664) been leveraged to support the investments districts are making to help teachers with the evaluation process?
How have teachers been supported to write challenging student growth goals and collect evidence in support of those goals?
Organizational Learning and Capacity to Support TPEP Implementation
How are districts and schools building staff and system capacity for sustainability?
How do districts and schools understand the purposes of TPEP and build support systems for its implementation?
What kinds of capacity – financial, personnel, technical – have schools and districts added to support the work of TPEP? What kind of capacity is still lacking?
How have relationships with external support organizations facilitated or otherwise activated the district’s learning?
How has the evaluation process been connected to overall instructional improvement efforts at district and school levels?
Given divergent district needs around implementation support, how might state agencies
differentiate support to districts?
Uses and Management of Teacher and Principal Evaluation Data
How and in what ways is evaluation data being used by schools and districts?
In what ways are districts using summative and criterion scores to inform decisions about professional development, staffing and continuous instructional improvement?
How do school and district leaders negotiate scoring expectations and internal and external pressures associated with the evaluation?
How are electronic tools being used to support the evaluation process?
In what ways are districts considering the use of student perception data in the evaluation process?
Mixed-Methods Design To address these questions, we employed a concurrent mixed-methods research design (Creswell & Plano Clark, 2011). Specifically, we collected quantitative data via a statewide stratified random sample of educators involved with TPEP implementation, and qualitative data via a strategic sample of nine districts for case study work. A subset of the case study districts provided de-identified teacher summative and criterion scores, which was analyzed for patterns and trends. In addition, we conducted a statewide analysis of districts’ teacher training grant applications (iGrant 664) for the 2015-16 year.
6
The statistically representative surveys offer a broad source of information concerning TPEP implementation efforts and challenges. Our survey design was informed by a review of other similar surveys and our prior research, as well as consultation with knowledgeable practitioners. The surveys feature a common set of items for all participants, but also include items targeted to the participant’s professional role (e.g., teacher, principal, district administrator). The primary qualitative strategy involved semi-structured interviews or focus groups with teachers, principals, assistant principals, district staff, and teachers’ association representatives. The interviews were conducted in three rounds beginning in spring/summer 2016, in fall/winter of 2016/17 and wrapping up in spring/summer 2017. Overall, 24 district staff, 38 school administrators, 108 teachers and instructional staff, and 4 association representatives participated, as part of the 178 interviews conducted (some school and district leaders were interviewed more than once, and some staff were interviewed together). Audio recordings were transcribed and coded, and categorical aggregation was used to establish initial themes and patterns. Analytic memos were developed for the case study districts and examined for cross-cutting and divergent themes. In addition, a variety of archival sources (e.g., district and school implementation plans, collective bargaining agreements) were collected to offer both qualitative and quantitative information pertinent to the research questions. We triangulated the findings from the descriptive analysis of districts’ applications for funding in the 2015-16 year, data from the case study work, and items on the statewide TPEP surveys for a comprehensive analysis.
Data Sources and Sampling
Sampling Design, Instruments and Procedures for Statewide Surveys
Procedures for Statewide Surveys Quantitative data was collected via online surveys of school and district staff involved in teacher evaluation. Stratified random sampling was the most robust and appropriate method for deriving a sample of teachers and school administrators for the statewide surveys. Potential teacher participants were placed in stratified groups by regional location, school poverty level and years of teaching experience. The use of a stratified random sample design ensures the representativeness of the sample by reducing the risk of losing certain subgroups when simple random sampling is used, and supports analyses that are generalizable to the educator population statewide. A stratified random sampling design was used for teacher and principal and assistant principal groups. Due to the comparatively smaller number of superintendents, a simple random sample was used for this group. The sampling frames were generated from state administrative datasets for the 2016-17 school year.4 Based on the population of each group within the state during the 2016-17 school year, desired completed sample sizes were determined to be 500 teachers (from the total population of 60,081), 200 principals (from a total of 1,886), 100 assistant principals (from a total of 1,314), and 100 superintendents (from a total of 274). Anticipating nonresponse, we invited participation from double the desired sample in each group; for example, 1000 teachers were invited to participate. Each group was stratified into different cells. For teachers, the stratification variables included region of the state, years of teaching experience, and school poverty level. For
4 Preliminary S-275 data for the 2016-17 school year was combined with school and district demographic
data to create sampling frames for the state’s educator workforce.
7
principals and assistant principals, the variables included school size and poverty level.5 The proportionate allocation method was used to determine the distribution of overall sample size into each cell; that is, the proportion of total sample size in a particular cell was designed to be the same as the proportion of the population in that cell.6 To encourage participation, survey participants were offered a $40 gift card.7
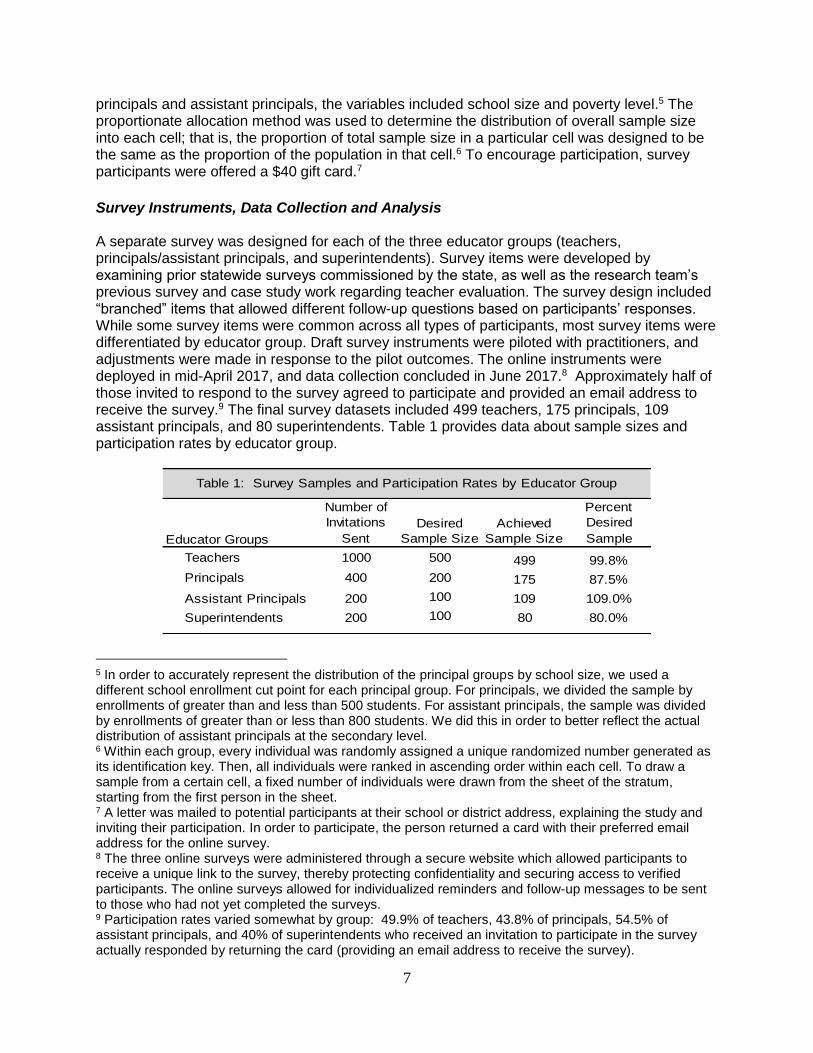
Survey Instruments, Data Collection and Analysis A separate survey was designed for each of the three educator groups (teachers, principals/assistant principals, and superintendents). Survey items were developed by examining prior statewide surveys commissioned by the state, as well as the research team’s previous survey and case study work regarding teacher evaluation. The survey design included “branched” items that allowed different follow-up questions based on participants’ responses. While some survey items were common across all types of participants, most survey items were differentiated by educator group. Draft survey instruments were piloted with practitioners, and adjustments were made in response to the pilot outcomes. The online instruments were deployed in mid-April 2017, and data collection concluded in June 2017.8 Approximately half of those invited to respond to the survey agreed to participate and provided an email address to receive the survey.9 The final survey datasets included 499 teachers, 175 principals, 109 assistant principals, and 80 superintendents. Table 1 provides data about sample sizes and participation rates by educator group.
Educator Groups
Number of
Invitations
Sent
Desired
Sample Size
Achieved
Sample Size
Percent
Desired
Sample
Teachers 1000 500 499 99.8%
Principals 400 200 175 87.5%
Assistant Principals 200 100 109 109.0%
Superintendents 200 100 80 80.0%
Table 1: Survey Samples and Participation Rates by Educator Group
5 In order to accurately represent the distribution of the principal groups by school size, we used a different school enrollment cut point for each principal group. For principals, we divided the sample by enrollments of greater than and less than 500 students. For assistant principals, the sample was divided by enrollments of greater than or less than 800 students. We did this in order to better reflect the actual distribution of assistant principals at the secondary level. 6 Within each group, every individual was randomly assigned a unique randomized number generated as its identification key. Then, all individuals were ranked in ascending order within each cell. To draw a sample from a certain cell, a fixed number of individuals were drawn from the sheet of the stratum, starting from the first person in the sheet. 7 A letter was mailed to potential participants at their school or district address, explaining the study and inviting their participation. In order to participate, the person returned a card with their preferred email address for the online survey. 8 The three online surveys were administered through a secure website which allowed participants to receive a unique link to the survey, thereby protecting confidentiality and securing access to verified participants. The online surveys allowed for individualized reminders and follow-up messages to be sent to those who had not yet completed the surveys. 9 Participation rates varied somewhat by group: 49.9% of teachers, 43.8% of principals, 54.5% of assistant principals, and 40% of superintendents who received an invitation to participate in the survey actually responded by returning the card (providing an email address to receive the survey).

8
To assess the statistical representativeness of the samples, we compared distributions of variables in the samples to their distributions in the population (Tables 2-4). We used Kolmogorov-Smirnov tests to compare continuous variables (experience, poverty levels, and enrollment), and chi-square tests to compare categorical variables (region, school level, and instructional framework).
Teacher
Sample
(n=499)
All Teachers
Statewide
(N=60,081)
Sampling Criteria
Region of State**
Eastern WA 23% 26%
Central Puget Sound (ESD 121) 42% 39%
Western WA (outside ESD 121) 36% 36%
p-value (chi-square) 0.22
Teacher Experience (years)
<= 10 48% 45%
10.1 - 20 30% 32%
20.1 - 30 15% 17%
> 30 7% 6%
p-value (Kolmogorov-Smirnov) 0.45
School Poverty Level (FRPL)
<= 25% 22% 22%
25.1% - 50% 38% 36%
50.1% - 75% 28% 29%
>75% 12% 13%
p-value (Kolmogorov-Smirnov) 0.62
Non-Sampling Criteria
School Level
Elementary (K-5 or K-6) 49% 50%
Middle School (6-9) 21% 18%
High School (9-12 or 10-12) 27% 26%
Multiple/Other (e.g., K-8, K-12) 2% 6%
p-value (chi-square) 0.002
Table 2: Demographic Characteristics of Teacher Sample*
Compared to All Teachers Statewide
*Teacher as defined by duty root 31, 32 or 33 in 2016-17
Preliminary S275.
**Region as represented by Educational Service Districts. Central
Puget Sound is represented by ESD 121. Western WA (not
including ESD 121) is represented by ESDs 112, 113, 114 and
189. Eastern WA is represented by ESDs 101, 105, 123 and 171. For the teacher sample, the non-significant p-values (> .05) indicate that the distribution in the sample closely parallels the distribution in the population for variables in the sampling criteria.10 Among the non-sampling criteria of school level, teachers also closely reflect the population with
10 While 499 teachers responded to the survey, seven participants indicated they were not evaluated under TPEP in the 2016-17 school year. Branching items in the survey removed these participants from responding to some items, leaving a sample of 492 teachers who responded to TPEP-related items.
9
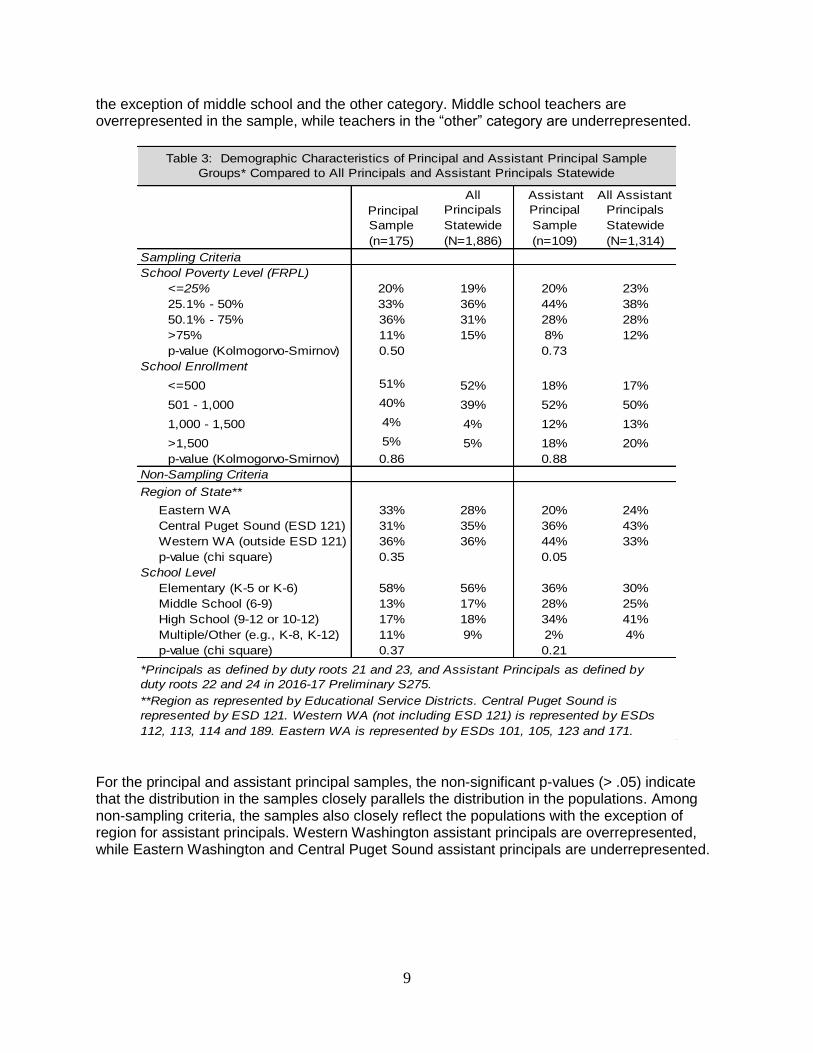
the exception of middle school and the other category. Middle school teachers are overrepresented in the sample, while teachers in the “other” category are underrepresented.
Principal
Sample
(n=175)
All
Principals
Statewide
(N=1,886)
Assistant
Principal
Sample
(n=109)
All Assistant
Principals
Statewide
(N=1,314)
Sampling Criteria
School Poverty Level (FRPL)
<=25% 20% 19% 20% 23%
25.1% - 50% 33% 36% 44% 38%
50.1% - 75% 36% 31% 28% 28%
>75% 11% 15% 8% 12%
p-value (Kolmogorvo-Smirnov) 0.50 0.73
School Enrollment
<=500 51% 52% 18% 17%
501 - 1,000 40% 39% 52% 50%
1,000 - 1,500 4% 4% 12% 13%
>1,500 5% 5% 18% 20%
p-value (Kolmogorvo-Smirnov) 0.86 0.88
Non-Sampling Criteria
Region of State**
Eastern WA 33% 28% 20% 24%
Central Puget Sound (ESD 121) 31% 35% 36% 43%
Western WA (outside ESD 121) 36% 36% 44% 33%
p-value (chi square) 0.35 0.05
School Level
Elementary (K-5 or K-6) 58% 56% 36% 30%
Middle School (6-9) 13% 17% 28% 25%
High School (9-12 or 10-12) 17% 18% 34% 41%
Multiple/Other (e.g., K-8, K-12) 11% 9% 2% 4%
p-value (chi square) 0.37 0.21
Table 3: Demographic Characteristics of Principal and Assistant Principal Sample
Groups* Compared to All Principals and Assistant Principals Statewide
*Principals as defined by duty roots 21 and 23, and Assistant Principals as defined by
duty roots 22 and 24 in 2016-17 Preliminary S275.
**Region as represented by Educational Service Districts. Central Puget Sound is
represented by ESD 121. Western WA (not including ESD 121) is represented by ESDs
112, 113, 114 and 189. Eastern WA is represented by ESDs 101, 105, 123 and 171. For the principal and assistant principal samples, the non-significant p-values (> .05) indicate that the distribution in the samples closely parallels the distribution in the populations. Among non-sampling criteria, the samples also closely reflect the populations with the exception of region for assistant principals. Western Washington assistant principals are overrepresented, while Eastern Washington and Central Puget Sound assistant principals are underrepresented.
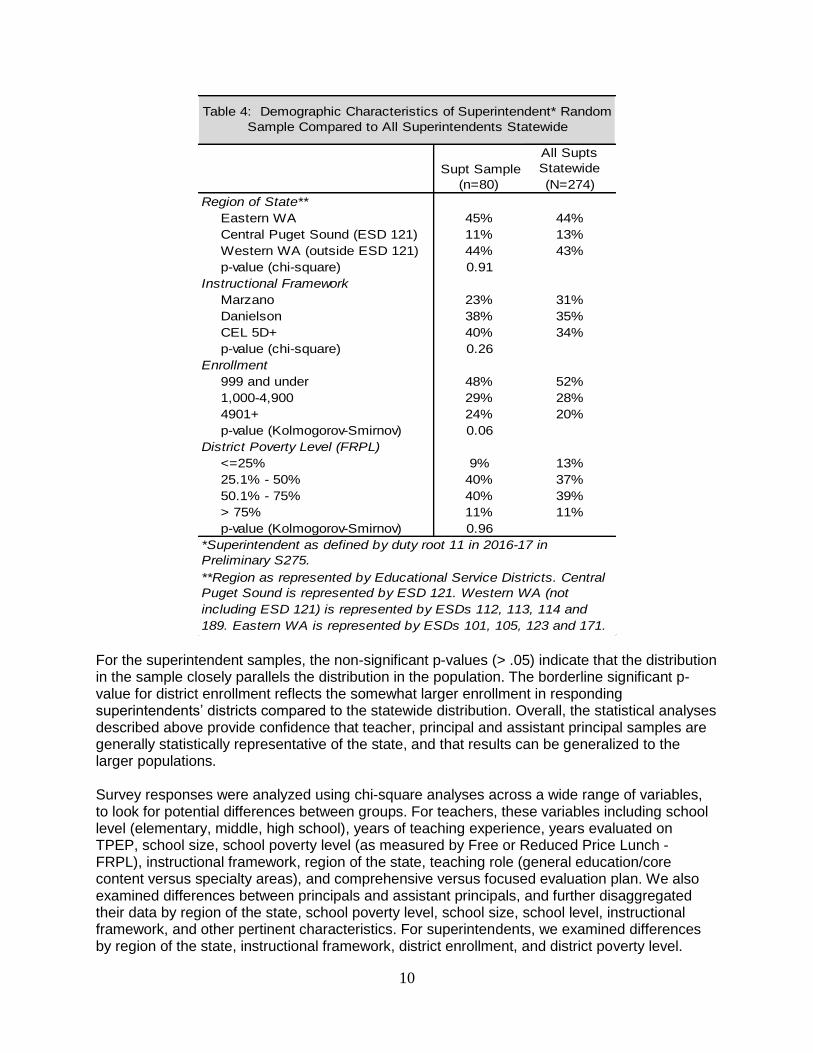
10
Supt Sample
(n=80)
All Supts
Statewide
(N=274)
Region of State**
Eastern WA 45% 44%
Central Puget Sound (ESD 121) 11% 13%
Western WA (outside ESD 121) 44% 43%
p-value (chi-square) 0.91
Instructional Framework
Marzano 23% 31%
Danielson 38% 35%
CEL 5D+ 40% 34%
p-value (chi-square) 0.26
Enrollment
999 and under 48% 52%
1,000-4,900 29% 28%
4901+ 24% 20%
p-value (Kolmogorov-Smirnov) 0.06
District Poverty Level (FRPL)
<=25% 9% 13%
25.1% - 50% 40% 37%
50.1% - 75% 40% 39%
> 75% 11% 11%
p-value (Kolmogorov-Smirnov) 0.96
Table 4: Demographic Characteristics of Superintendent* Random
Sample Compared to All Superintendents Statewide
*Superintendent as defined by duty root 11 in 2016-17 in
Preliminary S275.
**Region as represented by Educational Service Districts. Central
Puget Sound is represented by ESD 121. Western WA (not
including ESD 121) is represented by ESDs 112, 113, 114 and
189. Eastern WA is represented by ESDs 101, 105, 123 and 171. For the superintendent samples, the non-significant p-values (> .05) indicate that the distribution in the sample closely parallels the distribution in the population. The borderline significant p-value for district enrollment reflects the somewhat larger enrollment in responding superintendents’ districts compared to the statewide distribution. Overall, the statistical analyses described above provide confidence that teacher, principal and assistant principal samples are generally statistically representative of the state, and that results can be generalized to the larger populations. Survey responses were analyzed using chi-square analyses across a wide range of variables, to look for potential differences between groups. For teachers, these variables including school level (elementary, middle, high school), years of teaching experience, years evaluated on TPEP, school size, school poverty level (as measured by Free or Reduced Price Lunch - FRPL), instructional framework, region of the state, teaching role (general education/core content versus specialty areas), and comprehensive versus focused evaluation plan. We also examined differences between principals and assistant principals, and further disaggregated their data by region of the state, school poverty level, school size, school level, instructional framework, and other pertinent characteristics. For superintendents, we examined differences by region of the state, instructional framework, district enrollment, and district poverty level.
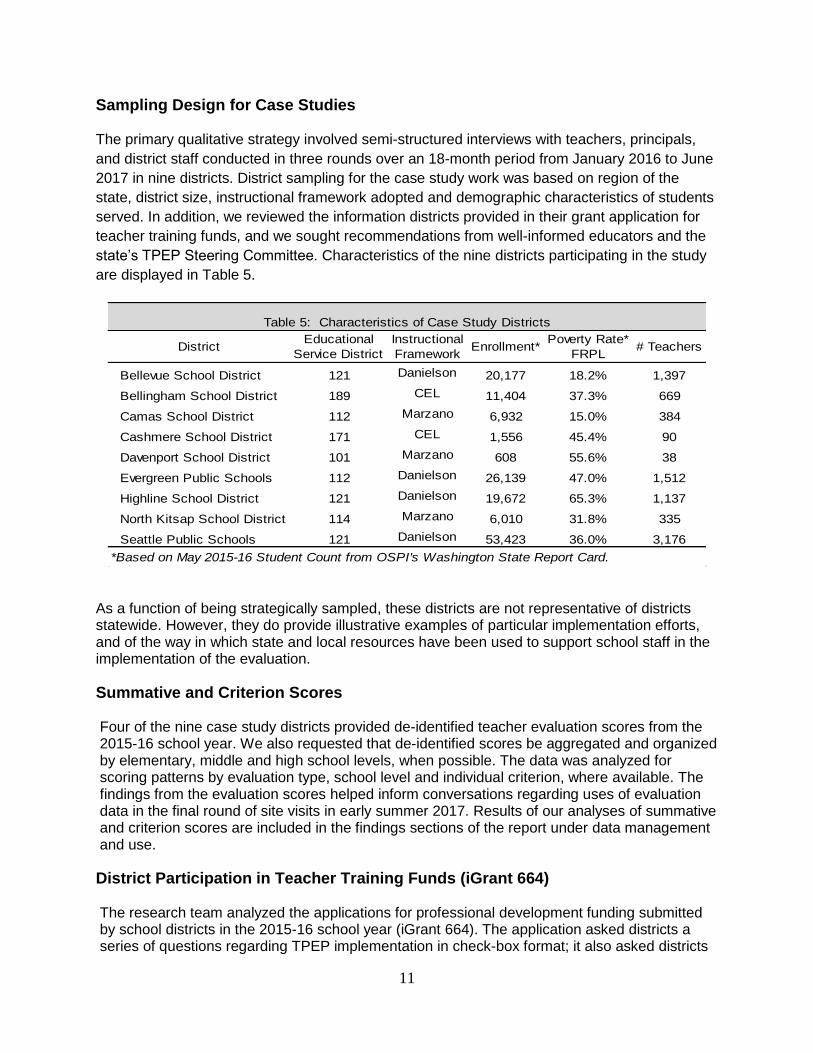
11
Sampling Design for Case Studies The primary qualitative strategy involved semi-structured interviews with teachers, principals,
and district staff conducted in three rounds over an 18-month period from January 2016 to June
2017 in nine districts. District sampling for the case study work was based on region of the
state, district size, instructional framework adopted and demographic characteristics of students
served. In addition, we reviewed the information districts provided in their grant application for
teacher training funds, and we sought recommendations from well-informed educators and the
state’s TPEP Steering Committee. Characteristics of the nine districts participating in the study
are displayed in Table 5.
DistrictEducational
Service District
Instructional
FrameworkEnrollment*
Poverty Rate*
FRPL# Teachers
Bellevue School District 121 Danielson 20,177 18.2% 1,397
Bellingham School District 189 CEL 11,404 37.3% 669
Camas School District 112 Marzano 6,932 15.0% 384
Cashmere School District 171 CEL 1,556 45.4% 90
Davenport School District 101 Marzano 608 55.6% 38
Evergreen Public Schools 112 Danielson 26,139 47.0% 1,512
Highline School District 121 Danielson 19,672 65.3% 1,137
North Kitsap School District 114 Marzano 6,010 31.8% 335
Seattle Public Schools 121 Danielson 53,423 36.0% 3,176
*Based on May 2015-16 Student Count from OSPI's Washington State Report Card.
Table 5: Characteristics of Case Study Districts
As a function of being strategically sampled, these districts are not representative of districts statewide. However, they do provide illustrative examples of particular implementation efforts, and of the way in which state and local resources have been used to support school staff in the implementation of the evaluation.
Summative and Criterion Scores Four of the nine case study districts provided de-identified teacher evaluation scores from the 2015-16 school year. We also requested that de-identified scores be aggregated and organized by elementary, middle and high school levels, when possible. The data was analyzed for scoring patterns by evaluation type, school level and individual criterion, where available. The findings from the evaluation scores helped inform conversations regarding uses of evaluation data in the final round of site visits in early summer 2017. Results of our analyses of summative and criterion scores are included in the findings sections of the report under data management and use.
District Participation in Teacher Training Funds (iGrant 664) The research team analyzed the applications for professional development funding submitted by school districts in the 2015-16 school year (iGrant 664). The application asked districts a series of questions regarding TPEP implementation in check-box format; it also asked districts
12
to describe their TPEP learning plan for teachers in long-form, written answers. Finally, districts were asked to explain their planned expenditures, and how these supported their TPEP implementation plans. In our analysis, we focused on training priorities identified by the state – such as evidence gathering, formative assessment, and student growth – but also report other trends and patterns. We begin by examining the characteristics of Washington districts that completed one or more sections of the iGrant application for 2015-16 with those that did not. Data from the grant application was linked to state datasets such as demographic information on OSPI’s Washington State Report Card website. It should be noted that not all districts responded to all the questions in the application, such that total numbers and reported outcomes vary by item. Of the 295 school districts in Washington State, 223 completed at least one section of the funding application (76%). More information is located in Appendix A1. Non-participation is disproportionately associated with smaller Eastern Washington districts. Eighty-five percent of the 72 non-participating districts have enrollments under 1000 students, while only 40% of the participating districts have similar enrollments. Non-participation is also associated with a geographic location in Eastern Washington: 64% of the non-participating districts are located in the Eastern Washington ESDs (101, 105, 123, and 171), while only 39% of participating districts are in Eastern Washington. As a partial consequence of these two factors, non-participating districts are also more heavily associated with the use of the Marzano Teacher Evaluation Model: 44% of non-participating districts use Marzano, while only 26% of participating districts employ this same framework. Statewide, districts were roughly split in thirds on the selection of the instructional framework, with approximately 35% of districts using Danielson’s Framework for Teaching, 34% selecting the CEL 5D+ Teacher Evaluation Rubric, and 31% using the Marzano model in 2015-16. Many of the state’s larger districts selected the Danielson Framework, while a sizeable portion of smaller districts adopted the Marzano model. Because of this variation by district size, a majority of the state’s students are in districts using Danielson’s Framework (53%) and proportionately fewer are in Marzano districts (14%). We also examined the districts’ participation by student poverty, race/ethnicity, and transitional bilingual and migrant status, but did not find notable differences in participation rates by these demographic factors. In the findings section of the report, we present an analysis of the district applications, with illustrative examples from the case study districts of how the funding has been used for teacher training.
Findings: Backward Mapping the Implementation of TPEP
The findings in this report are organized conceptually around a “backward mapping” strategy developed by Dr. Richard Elmore. While the most common way to approach policy implementation is through a process that begins with an objective statement of the policymaker’s intent, and proceeds through a series of steps to define what is expected at each stage of the process to the final outcomes against which the original intent is to be measured (forward mapping), Elmore suggests that there are serious weaknesses and limitations with this analytic approach. In Elmore’s words, “The most serious problem with forward mapping is its implicit and unquestioned assumption that policymakers control the organizational, political and technological processes that affect implementation… Neither policymakers nor policy analysts
13
are very comfortable with the possibility that most of what happens in the implementation process cannot be explained by the intentions and directions of policymakers” (1980, p. 603). Elmore instead puts forward a logic of “backward mapping,” as a strategy for understanding the process of policy implementation. Rather than starting at the top of the process, backward mapping begins at the level closest to implementation, in a statement of the behavior that generates the need for the policy. With a precise objective at the level of the system closest to implementation, one then moves up through the system to determine the ability of the organizational unit to affect change. In this way, the policymaker can direct resources at the unit which is likely to have the greatest effect. Elmore explains, “the closer one is to the source of the problem, the greater is one’s ability to influence it; and the problem-solving ability of complex systems depends not on hierarchical control but on maximizing discretion at the point where the problem is most immediate” (1980, p. 605). We have chosen to use the principles of backward mapping to describe our findings about TPEP implementation. We begin, as Elmore would suggest, with identifying the closest level of the implementation process that generates the need for the policy – in this case the school, and the need to ensure high quality instruction supporting student growth. It is at the school level, with educator expertise, skill, resources and proximity to the task, that the policy will have the greatest probability for success. Therefore, we begin with a discussion of the nature of the problem prompting the policy as understood by educators in schools and districts.
Purposes of TPEP Teacher evaluation is typically understood to serve the fundamental purposes of accountability and instructional improvement. These dual purposes represent distinctly different educator viewpoints, and both surface questions regarding the extent to which an evaluation system is valid, reliable, and fair. Both purposes assume the collection of evidence, though the forms of evidence used and the role that evidence plays in shaping the process of evaluation is under debate.
Dual Purposes of Accountability and Professional Growth TPEP is seen by some Washington policymakers as an attempt to incorporate both purposes of accountability and improvement in one model, and to encourage districts to use it to support professional growth and high quality instruction as a means to improve student learning. In the design of TPEP, these elements can be seen in various ways, such as the state mandate to select an instructional framework, the use of student growth goals, as well as where TPEP is housed within the organization of larger districts. While there is general agreement around the dual purposes underlying the evaluation policy, most Washington school and district administrators see its central purpose as supporting staff growth and improvement. The survey and case study findings presented here suggest that for most Washington educators, the primary focus for TPEP has been one of educator improvement and its use as a professional growth model. When asked about the various purposes of TPEP (including both

14
accountability and improvement), a majority of principals11 and superintendents12 identify its purpose to be one of supporting professional growth. Over 70% of principals indicated that supporting teachers’ professional growth, instructional improvement, or improving student learning were very important purposes of TPEP. Only 37% of principals considered non-renewal of contracts or dismissing ineffective teachers to be a very important purpose of TPEP, and only 12% considered changes in staffing assignments to be very important (see Table 6). Development of teacher leaders was considered a somewhat important purpose of the evaluation for 37% of principals and 40% of superintendents. Similarly, superintendents indicated that supporting teachers’ professional growth (85%), instructional improvement (86%) and improving student learning (85%) were very important purposes of TPEP; while non-renewal of contracts or dismissing ineffective teachers, conversion from provisional to continuing status or changes in staffing assignments were less important. It should be noted that beyond general oversight for the implementation of TPEP, the majority of superintendents participating in the survey were also directly involved in evaluating principals (60%) and 20% of them in evaluating teachers.
Principals
District
Admin Principals
District
Admin Principals
District
Admin
Supporting teachers'
professional growth 3% 1% 26% 14% 71% 85%
Instructional improvement 4% 3% 22% 11% 75% 86%
Improving student learning 5% 3% 23% 11% 72% 85%
Non-renewal of contracts or
dismissing ineffective
teachers 18% 21% 45% 54% 37% 25%
Development of teacher
leaders 18% 11% 45% 49% 37% 40%
Consideration of changes in
staffing assignments 36% 29% 51% 55% 12% 16%
Table 6: School and District Leaders' Perspectives on the Purposes of TPEP (Principals and
Assistant Principals n=282, Superintendents and District Administrators n = 80)
Not Important Somewhat Important Very Important
Perspectives of Case Study Districts Conversations with educators in the case study districts confirmed this primary emphasis on professional growth, though for some districts, the initial focus in TPEP implementation was on accountability. Indeed, there have been differences in how the initiative was perceived and taken up by districts depending on the leadership focus, and orientation of educator groups. In
11 In this report, principals includes assistant principals, unless differences between the two groups are noted. 12 The majority of individuals participating in the superintendent survey were superintendents (89%). A small percentage identified as assistant or associate superintendents (6%), or TPEP leads/coordinators (5%). All had been involved with TPEP for two or more years.
15
one case study district, a district administrator shared how they shifted from an early focus on accountability to one of professional growth. He explained the change from, “every conversation being based on the premise of how do we use the system to perhaps lead to non-renewal. Instead to… we've got 98% of the people that are basic and proficient. We really want to maximize this, so that they can grow their professional practice, and do it as a system. … I think that it had the unintended consequence, in the early days of TPEP, [of] heightening the concern around the decision making made around continued contracts for provisional employees…. I think we learned from that.” This district, like others, came to understand that teachers in their current employment would likely be with them for many years to come, and that the best overall strategy was one of supporting their professional growth and improvement. This district administrator continued: “…TPEP is first and foremost about professional growth, and I think I've raised
the concern fairly consistently that it's easy for that most essential part to get lost…. I just can’t underestimate how important I think it is to have that fundamental orientation of the growth plan, set a growth model around that. …It is also an evaluation system and I think a disproportionate amount of energy goes into the evaluative, rather than nurturing and growing. It is an exit tool based on performance. And I think healthy systems do need an exit tool based on performance. I'm not saying they don't, but getting the emphasis right and the culture of education in Washington state is important.”
In another district, an elementary principal described the shift in focus originally from compliance to growth, particularly around supporting teachers as they develop student growth goals: “I think we've seen over the past five or six years, the change from initially was
compliance. So we were learning what the law said, making sure that our student growth goals and our data met that compliance mechanism that was provided to us. And I think we shifted to a true growth mindset… I think that's where the biggest shift from compliance to true growth mindset has happened when we started to implement things like collaboration during the day and started really looking at data more specifically than just, what does the state requirement say?”
A district administrator in a case study site discussed the potential of principals to lead continuous improvement through TPEP:
“I think there's an evolution in which principals are looking at their faculty as a composition of various teams, and their leadership as a principal is a function of harnessing the power, and the energy, and the wisdom of those teams toward organizational goals. And TPEP, again for a growth mindset, is a way to harness that. I think that's the state of the art right now. I don't think we've arrived on that yet, but I think that's also the promising work.”
With regard to accountability and the purposes of TPEP, a district administrator in yet another case study district explained: “If I was going to give advice to somebody, the focus on growth and development
has really been important for us making this thing tick. We started out with that focus and we stayed on that. We really downplayed the accountability dimensions of it because… The scoring process – as calibrated as you might want to think you are – it is a very subjective thing to attach a number to a
16
complex practice. And it just doesn't make any sense to me. We do it, we comply on that side, but it's not really helping us fire anybody. The processes that we had before were perfectly adequate for that function. And usually when you’ve got somebody that's in trouble, when you're working on a dismissal case, it's not going to be that you are a three, and now you're a two. It's going to be a whole host of other complicated things, and working with that person to get them a point where they start to see the same thing that you're seeing. And the numbers don't really help you with that.”
Among the nine case study districts, several in particular saw TPEP not only as a professional growth model but also as a mechanism for teacher leadership and empowerment. TPEP and opportunities for teacher leadership will be discussed later in this report.
Use of Instructional Frameworks To support the professional growth of educators, the evaluation system was designed around instructional and leadership frameworks. One of the most substantial changes to the evaluation system has been the adoption of instructional frameworks as models for effective teaching. Teaching involves a very complex set of tasks which the instructional frameworks have attempted to conceptualize and organize. Districts have spent considerable time walking through the expectations and procedures of the evaluation with staff, including how the instructional framework fits within the context of the evaluation model. In several of the case study districts, the evaluation was known by the name of the instructional framework rather than TPEP. A superintendent who was asked about not using TPEP-specific language responded: “What you will find is our principals are looking at and having the conversation with teachers around how they're engaging students… But we don't say, ‘Well, the TPEP stuff says.’ You might hear us talk about the Danielson rubrics much more. And our people are pretty darn familiar now with the rubrics.” In a CEL 5D district that didn’t emphasize the TPEP acronym with their staff, framework language was embedded in their initiatives, and served as a “through line” for leadership planning. A district administrator explained, “We've tried really hard to make it a structural through line in all the work we do with our leadership team around the instructional framework. This is year five now and we've taken one of the dimensions each year and we've made that a focus. We'll be focused next year on classroom environment, culture.” Use of instructional frameworks to support teacher professional growth preceded TPEP in several of the case study districts. A district administrator explained how central the framework was for their professional development work: “We have made the CEL framework a cornerstone of everything we're doing in
PD. From the building base work, to the work we are doing with instructional rounds, to the work we are doing with job-alike days and the content areas, and the grade levels… We've used it as a central organizing piece and I think the thing that is valuable is the fact that it gives us a common language about instruction, a common definition to start with.”
Similarly, a superintendent in a Danielson district that had introduced the framework many years prior to TPEP explained its value: “I think it really gave our principals and our teachers a platform to have more in depth and meaningful discussions around instruction. And I also think it gave our principals and teachers more guidance on what it meant to cooperate and be a part of

17
a PLC [professional learning community].” An elementary principal in a Marzano district also praised the framework, “I think as a growth model it's great. I think the Marzano framework and all of the best practices and everything is excellent. I would never want to go back to the old model.” Irrespective of which instructional framework the district adopted, for some it became the anchor for other aspects of professional work. For a majority of the case study districts, the instructional framework has provided a foundational grounding for professional development efforts. However, making the instructional framework a central feature in professional development and planning was not uniform across all the districts. As one district staff member explained, “I think we still have some ways to go in emphasizing the importance of our instructional framework, and moving towards, obviously a growth oriented practice, which has been something that we've been working on for the last few years.” While Washington educators understand the intended dual purposes of accountability and instructional improvement within the evaluation system, most educators have focused on the evaluation as a formal mechanism to support professional growth. Nevertheless, significant variation exists regarding where the responsibility for educator evaluation resides within a district’s organizational structure. In smaller districts, the superintendent or an administrative team often share these duties. In districts with an enrollment of 1,000 or more, 38% of the superintendents surveyed located responsibilities for staff evaluation within teaching and learning or professional development, 33% in human resources or employment services, and 21% indicated that responsibilities were shared between the organizational structures. For some districts, negotiating shared responsibilities can be challenging. A TPEP coordinator explained: “I do think we've made some headway working really closely with curriculum and instruction because I don't sit in curriculum and instruction, I sit in HR. So I've had to do a lot of work with curriculum and instruction, with the math department, the ELA department to really make sure that when they're offering courses, they're at least talking about how the courses relate to the Danielson framework.” In the next section, we focus on TPEP implementation at the school level, since schools are the center of teachers’ professional practice and growth.
School Level Supports for the Implementation of TPEP Schools are the units in closest proximity to the implementation of the evaluation policy. It is here that teacher and principal expertise and skill reside and where professional growth is typically experienced and supervised. It is also the level where the resources necessary to support professional growth are often delivered. In Elmore’s theory of backward mapping of the implementation of policy, this is where essential tasks are undertaken and change has the greatest chance of occurring. Given the wide variation that exists within schools and their staff, and the students they serve, this diversity would argue for maximizing discretion for decision making at the school level, when possible.
Professional Development for Teachers As a new policy, TPEP impacted nearly all school staff. Initially school and district administrators spent considerable time learning about the requirements of the policy, developing internal systems to support new processes, and then determining how to introduce it to their teaching staff. For many districts, TPEP prompted the introduction of an instructional framework, as well
18
as helping staff understand the technical elements of the evaluation rubrics and scoring within the context of the framework for both comprehensive and focused evaluation plans. Some districts opted to move all instructional staff to TPEP in the first year of statewide implementation. Others staggered staff transition to the new system over multiple years. Different implementation decisions and strategies had an impact on the types of professional development activities schools and districts provided. TPEP-focused professional development has substantially changed since those early years, as staff have become increasingly familiar with the processes and activities surrounding the evaluation. Professional development in many districts has shifted from all district or all school events, to individualized or small group meetings with teachers at the school level. In addition, the focus of professional work on the evaluation depends to some extent on the type of evaluation a teacher has in a given year – whether or not they are on a comprehensive or focused plan – and teachers’ experience with it.
Professional Work under Comprehensive and Focused Evaluations Survey findings indicate that two-thirds of Washington’s teachers (67%) have experienced other forms of evaluation prior to TPEP. For about a third of the Washington teacher workforce (32%), TPEP is the only evaluation system they have known. Among survey participants evaluated on TPEP, 61% were on a focused evaluation and 39% were on a comprehensive evaluation during the 2016-17 school year. As one might expect, a higher proportion of novice teachers were evaluated on a comprehensive evaluation (66%). Overall, nearly all teachers (93%) indicated they had experienced at least one year on a comprehensive evaluation, and 77% had experienced at least one year on a focused plan. Teachers on the focused evaluation must include the student growth component from one of the three criteria with this focus. As established under the criteria, goal setting for student growth can address a subgroup of students, a whole class, or can be done as a collaborative effort in working on shared goals within grade levels, Professional Learning Communities (PLCs), subject matter teams, or school-wide improvement teams. According to teachers surveyed on a focused evaluation, over three-fourths worked on student goals for a subgroup (36%) or whole class (40%), rather than as part of a collaborative effort with their peers (23%) in the 2016-17 school year.13 However, the percentage of teachers who selected a subgroup goal varied by school poverty level, and it represents a statistically significant difference (p=.003). For instance, 51% of teachers from high-poverty schools (59% or more students receiving FRPL) selected student growth goals for a subgroup of students, compared with only 24% of teachers in low poverty schools (<35% FRPL). Since the focused evaluation includes an assessment of only one of the eight criteria and professional growth activities specifically linked to it, some have suggested that being on a focused evaluation might give greater opportunity for teachers to stretch themselves professionally in setting goals for student growth. However, teachers themselves report this is not the case. Seventy-seven percent of teachers on a focused evaluation reported that there is no difference in the student growth goals they write whether on a focused or a comprehensive evaluation. Only 18% reported setting more ambitious goals for student growth on a focused
13 This finding is nearly identical to statewide survey findings from 2014-15 when 36% of teachers selected student goals for a subgroup, 41% a whole class, and 23% chose to work with their peers as part of a collaborative effort.
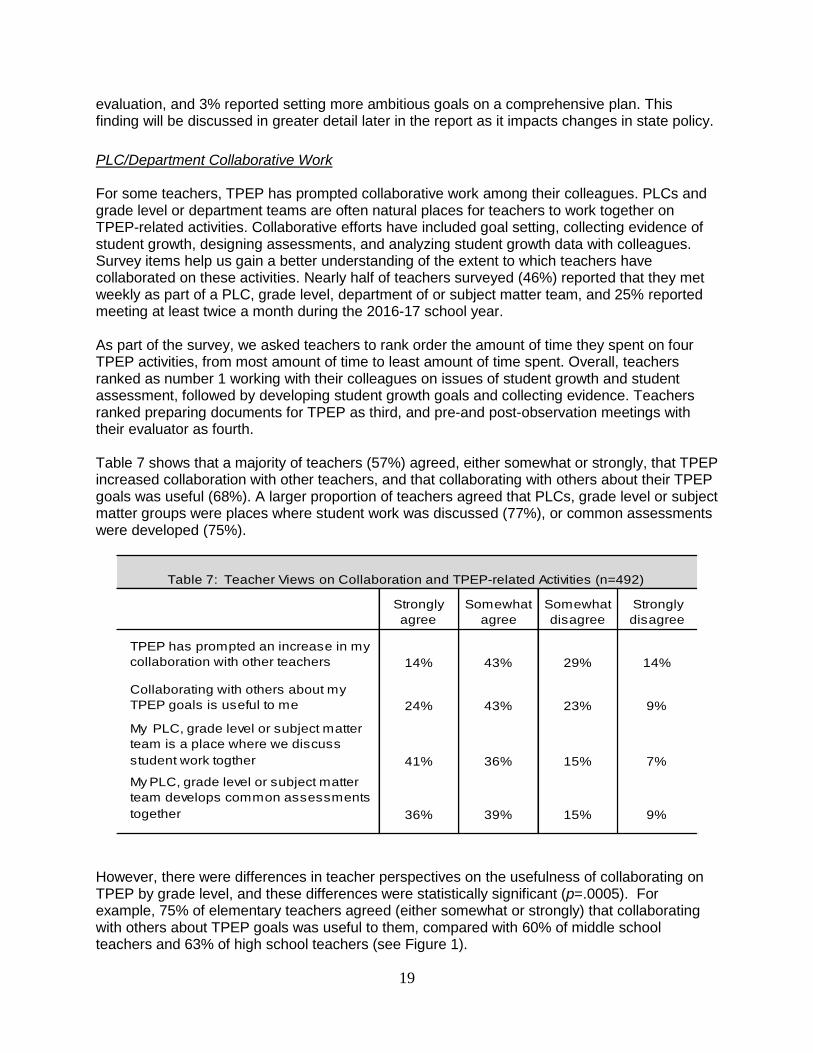
19
evaluation, and 3% reported setting more ambitious goals on a comprehensive plan. This finding will be discussed in greater detail later in the report as it impacts changes in state policy.
PLC/Department Collaborative Work
For some teachers, TPEP has prompted collaborative work among their colleagues. PLCs and grade level or department teams are often natural places for teachers to work together on TPEP-related activities. Collaborative efforts have included goal setting, collecting evidence of student growth, designing assessments, and analyzing student growth data with colleagues. Survey items help us gain a better understanding of the extent to which teachers have collaborated on these activities. Nearly half of teachers surveyed (46%) reported that they met weekly as part of a PLC, grade level, department of or subject matter team, and 25% reported meeting at least twice a month during the 2016-17 school year. As part of the survey, we asked teachers to rank order the amount of time they spent on four TPEP activities, from most amount of time to least amount of time spent. Overall, teachers ranked as number 1 working with their colleagues on issues of student growth and student assessment, followed by developing student growth goals and collecting evidence. Teachers ranked preparing documents for TPEP as third, and pre-and post-observation meetings with their evaluator as fourth. Table 7 shows that a majority of teachers (57%) agreed, either somewhat or strongly, that TPEP increased collaboration with other teachers, and that collaborating with others about their TPEP goals was useful (68%). A larger proportion of teachers agreed that PLCs, grade level or subject matter groups were places where student work was discussed (77%), or common assessments were developed (75%).
TPEP has prompted an increase in my
collaboration with other teachers 14% 43% 29% 14%
Collaborating with others about my
TPEP goals is useful to me 24% 43% 23% 9%
My PLC, grade level or subject matter
team is a place where we discuss
student work togther 41% 36% 15% 7%
My PLC, grade level or subject matter
team develops common assessments
together 36% 39% 15% 9%
Table 7: Teacher Views on Collaboration and TPEP-related Activities (n=492)
Strongly
agree
Somewhat
agree
Somewhat
disagree
Strongly
disagree
However, there were differences in teacher perspectives on the usefulness of collaborating on TPEP by grade level, and these differences were statistically significant (p=.0005). For example, 75% of elementary teachers agreed (either somewhat or strongly) that collaborating with others about TPEP goals was useful to them, compared with 60% of middle school teachers and 63% of high school teachers (see Figure 1).
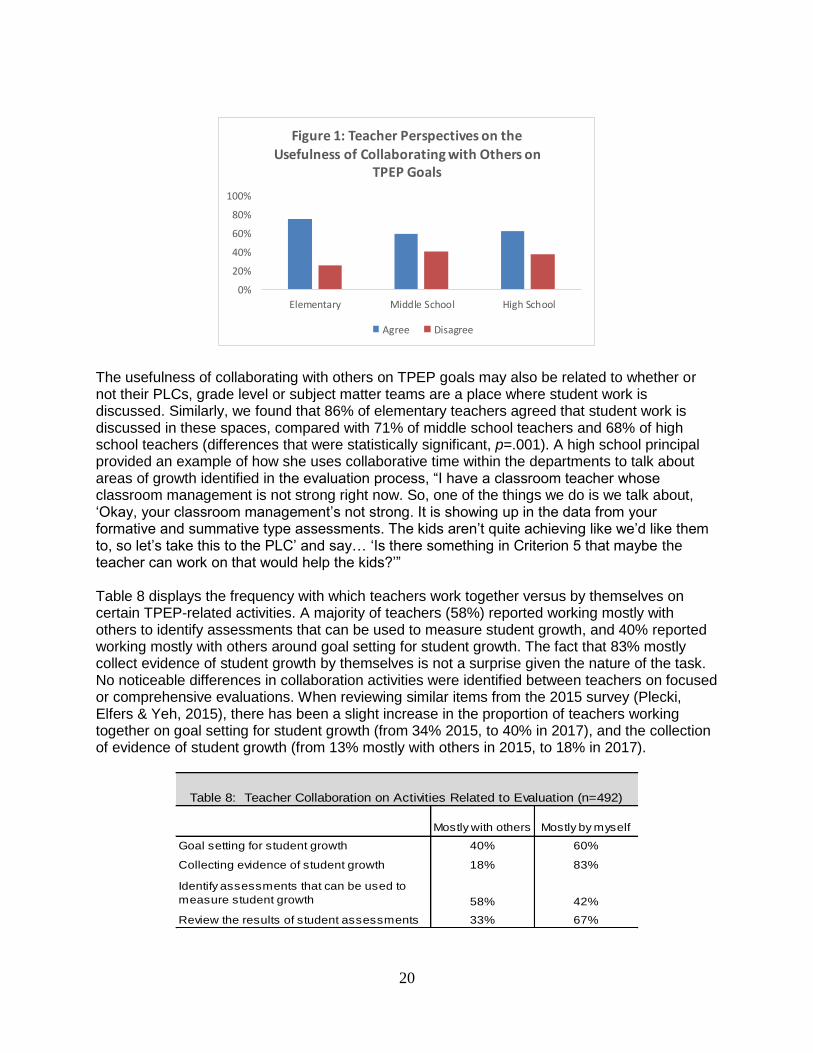
20
0%
20%
40%
60%
80%
100%
Elementary Middle School High School
Figure 1: Teacher Perspectives on the Usefulness of Collaborating with Others on
TPEP Goals
Agree Disagree
The usefulness of collaborating with others on TPEP goals may also be related to whether or not their PLCs, grade level or subject matter teams are a place where student work is discussed. Similarly, we found that 86% of elementary teachers agreed that student work is discussed in these spaces, compared with 71% of middle school teachers and 68% of high school teachers (differences that were statistically significant, p=.001). A high school principal provided an example of how she uses collaborative time within the departments to talk about areas of growth identified in the evaluation process, “I have a classroom teacher whose classroom management is not strong right now. So, one of the things we do is we talk about, ‘Okay, your classroom management’s not strong. It is showing up in the data from your formative and summative type assessments. The kids aren’t quite achieving like we’d like them to, so let’s take this to the PLC’ and say… ‘Is there something in Criterion 5 that maybe the teacher can work on that would help the kids?’” Table 8 displays the frequency with which teachers work together versus by themselves on certain TPEP-related activities. A majority of teachers (58%) reported working mostly with others to identify assessments that can be used to measure student growth, and 40% reported working mostly with others around goal setting for student growth. The fact that 83% mostly collect evidence of student growth by themselves is not a surprise given the nature of the task. No noticeable differences in collaboration activities were identified between teachers on focused or comprehensive evaluations. When reviewing similar items from the 2015 survey (Plecki, Elfers & Yeh, 2015), there has been a slight increase in the proportion of teachers working together on goal setting for student growth (from 34% 2015, to 40% in 2017), and the collection of evidence of student growth (from 13% mostly with others in 2015, to 18% in 2017).
Mostly with others Mostly by myself
Goal setting for student growth 40% 60%
Collecting evidence of student growth 18% 83%
Identify assessments that can be used to
measure student growth 58% 42%
Review the results of student assessments 33% 67%
Table 8: Teacher Collaboration on Activities Related to Evaluation (n=492)
21
Further analyses showed that non-core content teachers (e.g., physical education, art, music) and those in specialist roles such as ELL teacher, special education or teachers on special assignment, were statistically significantly more likely to work by themselves on goal setting (75%) as compared to general education and core content teachers (53%; p=.001). This finding was expected as these teachers may not have counterparts in their building with whom to collaborate.
Quality of Professional Collaboration A majority of principals and assistant principals surveyed agreed (either somewhat 52%, or strongly, 15%) that TPEP had improved the quality of professional collaboration in their school. Examples from the case study work suggest that the extent to which TPEP impacted teacher collaboration at the building level may be related to whether or not the school had a well-functioning professional learning community prior to TPEP implementation. An elementary principal explained that because PLCs were working well early on in the process, over time and side by side, “I think that's where they drop their shield [from something that] isn’t evaluative, to something they actually believe in and know is going to change student growth…. The collaborative nature of the building promotes growth versus compliance.” A secondary principal in another district didn’t necessarily attribute changes in teacher collaboration to TPEP, but did find that it supported their work: “I'm not sure if it's necessarily Criterion 8 that has helped that. I think [our] professional learning community model in general, and just the focus on… how Criterion 8 fits into those four questions [from the model] has helped us.” A district TPEP coach in a large urban district explained, “I think really it is the dynamic of the school…. I will go into one school and the dynamic is very collaborative across grade levels, and then I'll go into another building and people just keep to themselves… I do see a lot of collaboration in buildings, especially... with people who are on Criterion 8. They do try to use that collaboration time to maximize the scoring that they have there, and their student growth goals.” Many Washington superintendents also have been directly involved in the implementation of TPEP beyond general oversight. Over a third of superintendents (35%) surveyed indicated they were involved in planning professional development activities related to TPEP, and 21% were responsible for TPEP’s day-to-day implementation. Over two-thirds of superintendents (68%), indicated that TPEP had a somewhat (51%) or very positive (16%) impact on the quality of professional collaboration among teachers in their district. Time for collaboration on TPEP-related activities was the challenge most frequently identified by principals, assistant principals and superintendents surveyed in supporting teachers with TPEP. Sixty-three percent of superintendents indicated that time for collaboration with others in setting goals for student growth was a great or moderate challenge, and if additional resources were available for TPEP, 65% would have additional time for teachers to work in PLCs as a major focus. Fifty-nine percent of principals identified this as a great (30%) or moderate (29%) challenge. Open-ended survey responses suggest that many teachers see the value in collaboration, but may not have time to fully engage in it. When asked what kinds of training or support related to TPEP would be most beneficial, illustrative comments included: “More work within PLC to support others and share ideas on measuring student
growth as well as developing assessments that accurately measure student growth.”
“A training on how our department can and should work together within the framework and collect the evidence in order to be able to analyze as a team.”

22
“Working collaboratively with others to increase student growth.” Overall, 65% of teachers indicated they would not necessarily benefit from more professional development on TPEP. However, not surprisingly, 51% teachers with 4 or fewer years of experience indicated they would benefit from more TPEP-related professional development, and the difference is statistically significant difference (p = .04). In the next section, we discuss specific elements of TPEP that teachers engage in, either collectively or individually, within their schools.
Goal Setting Goal setting for student growth is a cornerstone of the new evaluation policy, and 75% of teachers agree, either somewhat or strongly, that examining student growth is a useful part of their evaluation. Survey results indicate that over 85% of teachers rate themselves as highly competent or good in their ability to set goals for student growth for a whole classroom, for a subgroup of students or as part of a collaborative work group. Most teachers (87%) also rate their ability to identify appropriate forms of evidence to measure student growth as highly competent or good (see Table 9).14 A majority of teachers somewhat (52%) or strongly agreed (21%) that the instructional framework was helpful in writing instructional goals. And over half of teachers surveyed (57%) either somewhat or strongly agreed that their school or district provided useful examples of student growth goals.
Set student growth goals for a whole
classroom 47% 44% 9% 1%
Set student growth goals for a subgroup of
students 45% 43% 10% 1%
Set student growth goals as part of a PLC,
grade level or subject matter team 42% 44% 11% 2%
Identify appropriate forms of evidence to
measure student growth 43% 45% 11% 2%
Table 9: Teacher Confidence Regarding Goal Setting and Evidence of Student Growth (n=492)
Highly
competent Good Fair
Need Some
Improvement
School and district level leaders expressed less confidence in teachers’ ability to set goals for student growth, or use assessments of student growth in developing goals. Indeed, nearly half of principals (49%) indicated teacher knowledge about goal setting for student growth was a moderate challenge, and another 15% considered it a great challenge (see Table 10). Nearly half of superintendents (46%) identified knowledge of goal setting for student growth to be a moderate challenge, and 28% found it to be a great challenge in their district. Similarly, 39% of principals indicated teacher ability to use formative or summative measures of student growth in developing goals a moderate challenge (and for 7% it was a great challenge), compared with district leaders who considered it a moderate challenge (48%) or great challenge (21%).
14 In comparing these same items from the 2015 survey, teachers have increased in confidence with over 75% of teachers rating themselves as highly competent or good.

23
Principals
District
Admin Principals
District
Admin Principals
District
Admin Principals
District
Admin
Teacher knowledge about
goal setting for student
growth 6% 5% 31% 19% 49% 46% 15% 28%
Teacher ability to use
formative or summative
measures of student growth
in developing goals 16% 5% 37% 24% 39% 48% 7% 21%
Percentages may not add up to 100% due to rounding.
Table 10: Views of School and District Leaders: Perceived Challenges Faced By Teachers (Principals and
Assistant Principals n=282, Superintendents n=80)
Not a challenge A small challenge
A moderate
challenge A great challenge
The case study districts provide important context for understanding the process of goal setting. A superintendent explained how at first glance the process of setting goals for student growth seems straightforward, but is actually a very complex process: “I know I experienced this all the time when I was doing trainings – I would say
‘Oh yeah, it's easy to write a student growth goal. Then I would say ‘Well I'm going to actually write one then try to pretend like I'm carrying it out through this training’… Then it starts to get really complicated. I’m okay with people saying that it's not too tough to write the goal, but I would think an indicator of a healthy system would be, ‘Boy, I had to change my goal three times’… It is pretty nuanced… We really need to be comfortable with that [the messiness of the work]… There's just so many nuances and depths to it… with things that look not quite so neat. If we see goals that say ‘58 percent and now I raised it to 63 percent, and feel really good about that,’ then I would be like "Ah, they're missing the point."
One case study district encouraged instructional staff to select student growth goals aligned with the district’s larger mission statement and specific outcomes, and encouraged creation of assessments that supported this. Another case study district had created a formal process for supporting teachers’ work around writing student growth goals. District leaders described how teachers can draft growth goals and submit them to their evaluator in advance for review and feedback at an early stage of evaluation process. “Their job is to coach you on that goal… so that you're going into it knowing that your goal is at least proficient. We didn't want anybody collecting data on goals that were not proficient…. It's an optional thing but most people take advantage of it. It helps to make that conversation stronger because we built in an automatic feedback system from the front end.”
Assessments The statewide survey asked teachers to rate their ability to identify or design student assessments for measuring student growth goals, as well as skill in interpreting results and how this information could be used to modify or inform their instruction. As with teachers’ ratings of their ability to set student growth goals, teachers also expressed confidence in their knowledge and skills about assessments and measuring student growth. Over 87% of teachers surveyed rated themselves as either highly competent or good in their professional practices regarding assessments in these areas (see Table 11).
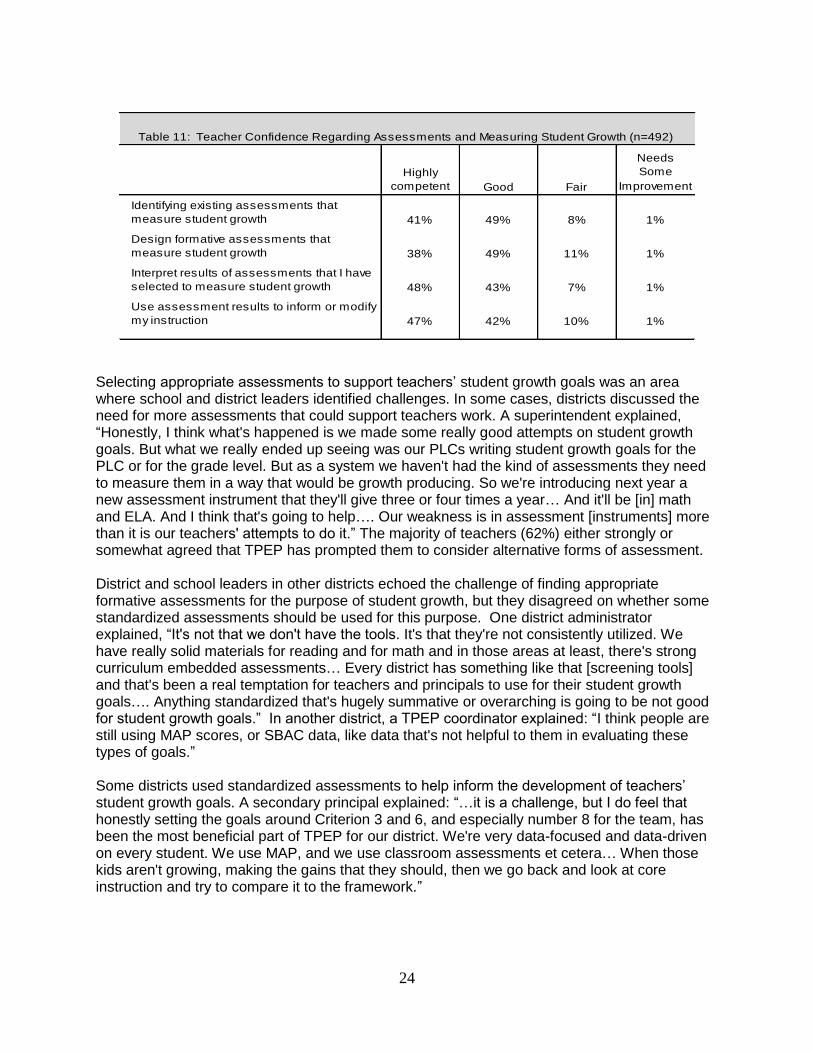
24
Identifying existing assessments that
measure student growth 41% 49% 8% 1%
Design formative assessments that
measure student growth 38% 49% 11% 1%
Interpret results of assessments that I have
selected to measure student growth 48% 43% 7% 1%
Use assessment results to inform or modify
my instruction 47% 42% 10% 1%
Table 11: Teacher Confidence Regarding Assessments and Measuring Student Growth (n=492)
Highly
competent Good Fair
Needs
Some
Improvement
Selecting appropriate assessments to support teachers’ student growth goals was an area where school and district leaders identified challenges. In some cases, districts discussed the need for more assessments that could support teachers work. A superintendent explained, “Honestly, I think what's happened is we made some really good attempts on student growth goals. But what we really ended up seeing was our PLCs writing student growth goals for the PLC or for the grade level. But as a system we haven't had the kind of assessments they need to measure them in a way that would be growth producing. So we're introducing next year a new assessment instrument that they'll give three or four times a year… And it'll be [in] math and ELA. And I think that's going to help…. Our weakness is in assessment [instruments] more than it is our teachers' attempts to do it.” The majority of teachers (62%) either strongly or somewhat agreed that TPEP has prompted them to consider alternative forms of assessment. District and school leaders in other districts echoed the challenge of finding appropriate formative assessments for the purpose of student growth, but they disagreed on whether some standardized assessments should be used for this purpose. One district administrator explained, “It's not that we don't have the tools. It's that they're not consistently utilized. We have really solid materials for reading and for math and in those areas at least, there's strong curriculum embedded assessments… Every district has something like that [screening tools] and that's been a real temptation for teachers and principals to use for their student growth goals…. Anything standardized that's hugely summative or overarching is going to be not good for student growth goals.” In another district, a TPEP coordinator explained: “I think people are still using MAP scores, or SBAC data, like data that's not helpful to them in evaluating these types of goals.” Some districts used standardized assessments to help inform the development of teachers’ student growth goals. A secondary principal explained: “…it is a challenge, but I do feel that honestly setting the goals around Criterion 3 and 6, and especially number 8 for the team, has been the most beneficial part of TPEP for our district. We're very data-focused and data-driven on every student. We use MAP, and we use classroom assessments et cetera… When those kids aren't growing, making the gains that they should, then we go back and look at core instruction and try to compare it to the framework.”
25
School Leadership Numerous forms of evidence from all of our case study districts point to the critical importance of school leadership in supporting teacher evaluation. In this section we discuss a variety of ways in which school leaders influence the TPEP process and how factors such as instructional leadership, school culture, responsibility for collecting evidence, mediation of workload, and teacher leadership shape how both teachers and evaluators experience the evaluation process.
Instructional Leadership
Evidence from survey data points to the shift that principals have made to focus their work more centrally on instructional leadership. A majority of principals (70%) and assistant principals (79%) agree that TPEP has allowed them to focus more on instructional leadership. An even larger proportion of principals and assistant principals (90%) agree that TPEP has improved their capacity to have meaningful conversations with teachers about their instruction. More than three-quarters of principals (78%) and 87% of assistant principals agree that TPEP has helped them better support teachers who are in need of improvement. Teachers also note the engagement of principals in their instructional leadership. More than four-fifths of teachers (82%) agree that their administrators use the instructional framework to discuss effective teaching practices. A large proportion of teachers (84%) agree that their evaluator gives them feedback on their student growth goals. Nearly three-quarters of teachers (73%) also agree that their evaluator gives them suggestions as to how to improve their teaching. However, a smaller majority of teachers (59%) agree that after the post-observation conversation, their evaluator follows up to see what changes were made in teachers’ instructional practice. Some principals and assistant principals who were surveyed (12%) indicated that this is an area where they believe they need improvement. Teachers’ responses to whether or not they agree that their evaluator is an instructional leader were more mixed, as 65% agreed that their evaluator is an instructional leader and 12% strongly disagreed. A district administrator in a case study district articulated why this may be the case: “We've made some provisions to clear some space for principals to do their work.
I think what's needed though is, they have been in their careers, they haven't been purely instructional leaders… They've been managers of all that other stuff and they're really, really good at that. What they need is some training and some time to really get really good at the instructional leadership now, and that's hard because they're still locked up all day and all year. It's just hard to get that group into intensive and meaningful professional learning.”
When asked to rate their ability as instructional leaders, one third of principals and assistant principals rated themselves as very good, more than half (55%) rated themselves as good, and 12% responded that they needed some improvement.
Supportive School Culture Nearly two-thirds of Washington teachers have had more than one evaluator under TPEP (65%) according to survey results, with the majority (58%) having two or three evaluators. Perhaps, this is not surprising given that TPEP implementation has occurred in various forms over six years, including pilot and RIG activities. Teachers may have experienced more than one evaluator by being in a building with more than one principal, or as a result of changing schools

26
(either teachers or principals) or by having someone else in the district assigned to evaluate them. For example, of the teachers who had been evaluated four or more years on TPEP, 77% had more than one evaluator. Despite having multiple evaluators, teachers indicated a confidence in their principals’ ability to fairly evaluate them. More than three-quarters of teachers (77%) either strongly or somewhat agree that they have confidence in their evaluator’s ability to rate their performance as a teacher. The majority of teachers (72%) also agreed that school leaders have created an environment that supports professional growth and risk-taking. A superintendent in a case study district emphasized the importance of building productive relationships in helping teachers stretch themselves professionally:
“I tend to think that the conditions that would make somebody want to take a risk
have more to do with their relationships at the school and where they are has more to do with that [trust] than something procedural because I don't know how much time teachers really even spend speaking about the procedural parts of TPEP. I hope that our teachers will set high goals because they have a great relationship with their principal and with their colleagues and because they're ready to just do that professionally.”
When asked if they have better interactions with their principal because of TPEP, only 40% of teachers agreed. This may suggest that teachers’ experiences with TPEP are, in part, a reflection of the kind of relationship that was already in place between teachers and school leaders. One principal who responded to the survey described the importance of building trust and productive culture in a school: “TPEP as other evaluations systems are only as good as the trust and culture
you build around the system. It takes a few years to create an atmosphere where everyone understands TPEP is about developing teachers and helping each other succeed.”
Responsibility for Collecting Evidence An important part of the TPEP process is the collection of evidence aimed at assessing the level of teachers’ professional practice in a number of areas. Data from surveys and case studies indicate that there is wide variation in who assumes responsibility for the collection of various forms of evidence. One form of evidence is around student growth goals. Principals and assistant principals surveyed were asked specifically to gauge how the collection of evidence of student growth occurred in their schools. Three-quarters of school leaders indicated that teachers collect most forms of evidence of student growth by themselves, either somewhat or to a great extent. More than half of school leaders (58%) indicated that they share responsibility with teachers to collect forms of evidence of student growth, either somewhat or to a great extent. Only 8% of principals and assistant principals said that they assume responsibility for collecting most of the evidence of student growth for teachers to a great extent (see Table 12).
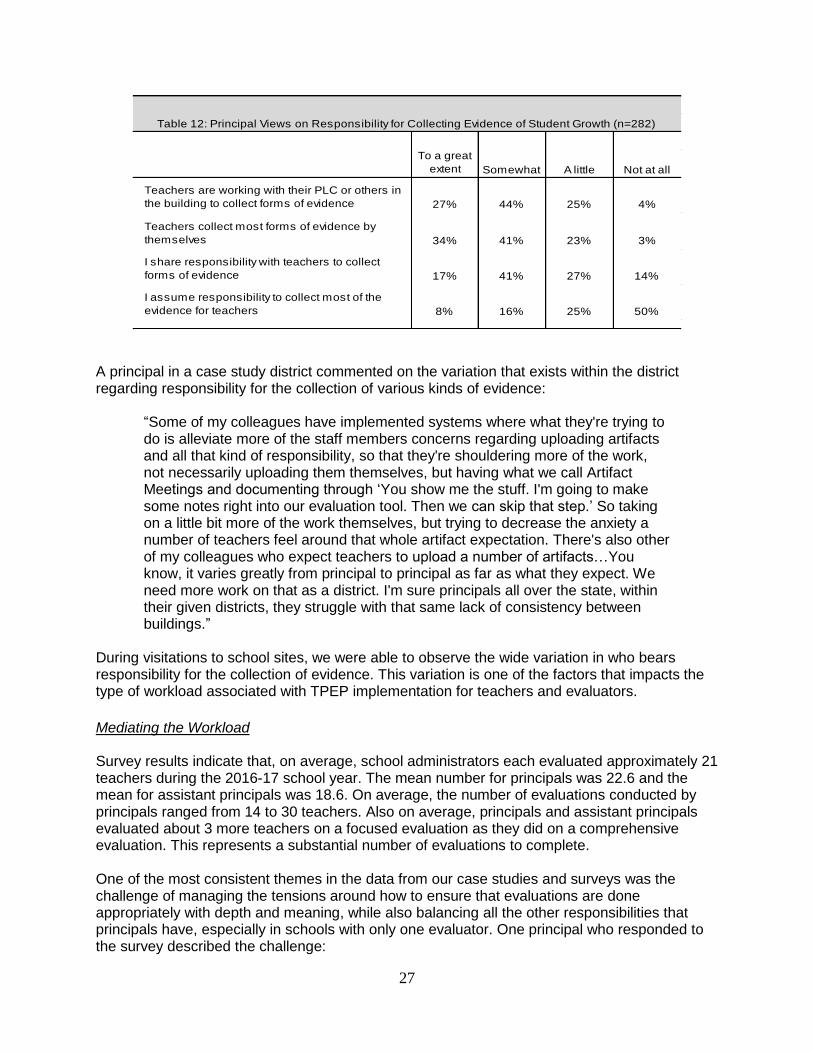
27
Teachers are working with their PLC or others in
the building to collect forms of evidence 27% 44% 25% 4%
Teachers collect most forms of evidence by
themselves 34% 41% 23% 3%
I share responsibility with teachers to collect
forms of evidence 17% 41% 27% 14%
I assume responsibility to collect most of the
evidence for teachers 8% 16% 25% 50%
Table 12: Principal Views on Responsibility for Collecting Evidence of Student Growth (n=282)
To a great
extent Somewhat A little Not at all
A principal in a case study district commented on the variation that exists within the district regarding responsibility for the collection of various kinds of evidence: “Some of my colleagues have implemented systems where what they're trying to
do is alleviate more of the staff members concerns regarding uploading artifacts and all that kind of responsibility, so that they're shouldering more of the work, not necessarily uploading them themselves, but having what we call Artifact Meetings and documenting through ‘You show me the stuff. I'm going to make some notes right into our evaluation tool. Then we can skip that step.’ So taking on a little bit more of the work themselves, but trying to decrease the anxiety a number of teachers feel around that whole artifact expectation. There's also other of my colleagues who expect teachers to upload a number of artifacts…You know, it varies greatly from principal to principal as far as what they expect. We need more work on that as a district. I'm sure principals all over the state, within their given districts, they struggle with that same lack of consistency between buildings.”
During visitations to school sites, we were able to observe the wide variation in who bears responsibility for the collection of evidence. This variation is one of the factors that impacts the type of workload associated with TPEP implementation for teachers and evaluators.
Mediating the Workload
Survey results indicate that, on average, school administrators each evaluated approximately 21 teachers during the 2016-17 school year. The mean number for principals was 22.6 and the mean for assistant principals was 18.6. On average, the number of evaluations conducted by principals ranged from 14 to 30 teachers. Also on average, principals and assistant principals evaluated about 3 more teachers on a focused evaluation as they did on a comprehensive evaluation. This represents a substantial number of evaluations to complete. One of the most consistent themes in the data from our case studies and surveys was the challenge of managing the tensions around how to ensure that evaluations are done appropriately with depth and meaning, while also balancing all the other responsibilities that principals have, especially in schools with only one evaluator. One principal who responded to the survey described the challenge:
28
“In order to implement TPEP effectively and fairly, it takes an incredible amount
of time. My duties as a school administrator have increased this year. School safety, student discipline, parent issues, staff issues, facilities, board reports, ASB activities, athletic directing, testing, attendance, etc. take up a large amount of my time. I’ve had several formal observations scheduled, only to be pulled away to deal with more pressing issues. Schools that have selected administrators solely as “instructional leaders” seem to be having more success with TPEP. Under our district’s current model where administrators wear every hat, it makes it very difficult to do TPEP justice.”
When asked to rank order the amount of time spent on specific TPEP activities, 47% of principals and assistant principals who responded to the survey ranked observing teachers in the classroom first, followed by 44% who ranked completing documentation and report writing first. Discussing evaluations with individual teachers, including pre- and post- conferences was most often ranked third by school leaders. A common theme from conversations with teachers in our case study districts was the recognition that school administrators are trying to manage what they saw as an overwhelming workload, and many teachers expressed concern for their principals and assistant principals. In some cases, teachers noted that they felt their principal was generally less accessible in the building and in interactions with students. About three-quarters of principals and assistant principals who responded to the survey agreed that TPEP has reduced their ability to perform other essential duties (76%) and reduced the amount of time spent interacting with students (73%).This theme was echoed among survey participants as well. A teacher described the situation as follows: “I do have an issue with TPEP in regards to the time it takes my principal to
evaluate all of the certificated teachers in our building. He is the only evaluator and a large amount of time is spent on TPEP because our school of 650 students and 24-plus teachers does not have a vice principal.”
A secondary principal in a case study district explained the challenge of time and how, even after starting off well, he felt the evaluation of his teachers wasn’t as in depth as he thought it should be. “I think at the beginning of the year we started off really well. Our PLC teams set
their Criterion 8 goals, and then individually they set their goals around 3 and 6. We have some nice documents built into Google for them, and we did a good job of going through those. The results coming in on the SBAC are, I guess, a positive. I think there's some connection there. We did some good work at the beginning of the year with observations. I don't feel necessarily that we ended or that I personally ended with my staff in a very positive way in regards to the connection with TPEP… I'm just going to say time. Obviously all the observations were done, and we did what you would call pre-conference and a post-conference, but with time everything kind of goes with it. They weren't probably as in depth as needed to really, I guess, move the dial.”
On the other hand, some school leaders in case study districts noted that there is a “learning curve” with TPEP. A principal said, “As I have grown in my own awareness and professional practice I now feel that being in classes regularly to monitor and observe is my primary role and
29
I have no problem getting more than the required time for each of my employees.” Others mentioned that TPEP is more manageable if they approach the task as something to attend to throughout the year. One elementary principal noted, “I do like the process. I think I told you in the fall, while my staff went around and told you, ‘Oh, it's too much work for my principal.’ And then I told you, ‘No, actually, I think it's less work for me in the end because I'm doing a more measured amount of work throughout the whole year.’" The special circumstance of building principals trying to manage the workload in small schools and districts was a common theme that emerged from our data. One superintendent who responded to the survey noted:
“Building principals, especially in small and rural districts, wear so many hats and
have so many demands placed on them that they need more support to really do TPEP well. Something has to be done to help principals—they want to be instructional leaders but they are just so overwhelmed.”
Teacher Leadership Approximately half (52%) of principals and assistant principals who responded to the survey agreed that TPEP has increased opportunities for teacher leadership. Teacher leaders were involved in TPEP in a variety of ways in the case study districts. In one district, teachers on special assignment (TOSAs) were trained as framework specialists and collaborated in various capacities at the building level. A district administrator described the work of TOSAs: “So we've got teachers on a special assignment that are district assigned TOSAs.
They're all trained on the rubric and they use that consistently. One of those people, this year, was in charge of our instructional rounds work, actually two people shared it, one who had our beginning teacher mentoring group was also leading rounds… that been kind of a grassroots teacher-led effort from the beginning. That's strictly and solely focused on helping teachers get smarter about the use of the rubrics as they are looking at instruction. So that's been a concerted effort for sure.”
In another case study district, a TPEP coach also describes how teachers were part of the TPEP process from the beginning, “I think the teacher leader role in this whole process has been huge. We started off with a joint committee that had equal powers on both sides for designing the entire system. It really made the transition less cumbersome because people felt like they had an equal voice in the new system and not that it was just completely thrust upon them.” In another case study district, teacher leaders have prominent roles in designing and delivering district-wide training to both teachers and administrators. In several case study districts, the involvement of teacher leaders was often specifically cited as a reason why the TPEP process is viewed positively. Survey data also reveal that a majority of principals and assistant principals (59%) state that the feedback they receive from conducting TPEP evaluations helps to identify teacher leaders in their schools. Evidence from surveys indicate that TPEP has not consistently increased opportunities for teacher leadership across schools. A little more than a third of teachers (38%) agreed that TPEP has given them opportunities to use their skills as a teacher leader, with a similar proportion (37%) stating that TPEP did not provide them with leadership opportunities at all. This finding might be reflective of the extent to which teacher leadership opportunities were already present prior to TPEP implementation.
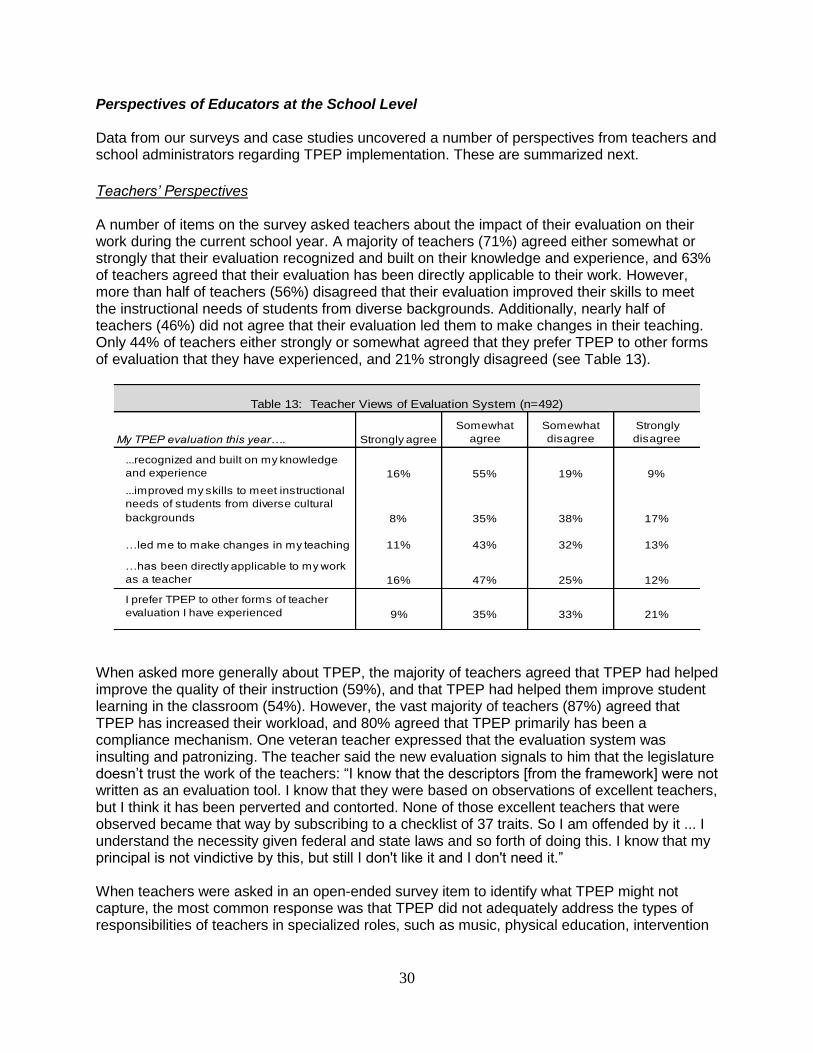
30
Perspectives of Educators at the School Level Data from our surveys and case studies uncovered a number of perspectives from teachers and school administrators regarding TPEP implementation. These are summarized next.
Teachers’ Perspectives A number of items on the survey asked teachers about the impact of their evaluation on their work during the current school year. A majority of teachers (71%) agreed either somewhat or strongly that their evaluation recognized and built on their knowledge and experience, and 63% of teachers agreed that their evaluation has been directly applicable to their work. However, more than half of teachers (56%) disagreed that their evaluation improved their skills to meet the instructional needs of students from diverse backgrounds. Additionally, nearly half of teachers (46%) did not agree that their evaluation led them to make changes in their teaching. Only 44% of teachers either strongly or somewhat agreed that they prefer TPEP to other forms of evaluation that they have experienced, and 21% strongly disagreed (see Table 13).
...recognized and built on my knowledge
and experience 16% 55% 19% 9%
...improved my skills to meet instructional
needs of students from diverse cultural
backgrounds 8% 35% 38% 17%
…led me to make changes in my teaching 11% 43% 32% 13%
…has been directly applicable to my work
as a teacher 16% 47% 25% 12%
I prefer TPEP to other forms of teacher
evaluation I have experienced 9% 35% 33% 21%
Table 13: Teacher Views of Evaluation System (n=492)
My TPEP evaluation this year…. Strongly agree
Somewhat
agree
Somewhat
disagree
Strongly
disagree
When asked more generally about TPEP, the majority of teachers agreed that TPEP had helped improve the quality of their instruction (59%), and that TPEP had helped them improve student learning in the classroom (54%). However, the vast majority of teachers (87%) agreed that TPEP has increased their workload, and 80% agreed that TPEP primarily has been a compliance mechanism. One veteran teacher expressed that the evaluation system was insulting and patronizing. The teacher said the new evaluation signals to him that the legislature doesn’t trust the work of the teachers: “I know that the descriptors [from the framework] were not written as an evaluation tool. I know that they were based on observations of excellent teachers, but I think it has been perverted and contorted. None of those excellent teachers that were observed became that way by subscribing to a checklist of 37 traits. So I am offended by it ... I understand the necessity given federal and state laws and so forth of doing this. I know that my principal is not vindictive by this, but still I don't like it and I don't need it.” When teachers were asked in an open-ended survey item to identify what TPEP might not capture, the most common response was that TPEP did not adequately address the types of responsibilities of teachers in specialized roles, such as music, physical education, intervention
31
specialists, and instructional coaches. In one case study district, separate rubrics have been collaboratively developed for use by educators in specialist roles. The superintendent explained: “We have separated them [the specialists] and we have a different evaluation
system for them that's rubric driven. And they developed it. Whether it was our coaches, our media specialist, our counselors or [others], we sat down and worked with each of those groups to develop rubrics around their specific jobs and the standards we want them to meet. And I think that's worked really well for us because we're not trying to plug into the rubric something that doesn't fit… So we agreed with our [teachers] association back when we started and we developed these. And they seem to be working pretty well.”
Despite the challenges of a new evaluation system, some teachers agreed that it helped them discover new areas of growth. A high school math teacher and teachers’ association representative, explained, “My first year, I went in pretty skeptical. Like I think everybody always feels like you are a pretty good teacher already and you're like ‘Come on, I can't grow that much.’ I remember writing and at least assessing where I was… and I just haven't found a lot of success over the years trying to engage parents... So it's been fantastic. Whereas before, I kind of ignored that area, but it was only because of TPEP that I made the decision you know, I wanted to get better in that area, so I figured out a way. And I don't think the old evaluation system would have had me examine that.’”
Principals’ Perspectives School leaders surveyed were asked to respond to several questions about their general views of TPEP. The majority of principals (79%) prefer TPEP to other forms of teacher evaluation. More than three-fourths of principals (77%) agreed that they have better interactions with teachers because of TPEP. A smaller majority of principals (56%) agreed that the majority of the time they spend on TPEP is useful, and 12% strongly disagreed. A similar proportion of principals (58%) agreed that the feedback they receive on their own evaluation is useful, and 15% strongly disagreed. Not surprisingly, given the prominent concern about a lack of time for engaging in TPEP, the vast majority of school leaders (85%) agreed that TPEP has increased the amount of time spent working on weekends and in the evenings. When principals were asked to comment on the kinds of training and support that would be most beneficial to them, the vast majority of comments made concerned the need for time for collaboration with peers so that they could improve their skills in working with teachers and learn how to manage the workload. An assistant principal summed it up by saying, “We do not spend enough time looking at teaching and discussing what we saw with others.” Another suggestion from school administrators, and particularly from assistant principals, was a desire to engage in training with teachers. One assistant principal said that “side-by-side training with teachers” was needed so that “I can focus on my responsibilities related to TPEP and they can focus on theirs. Doing this collaboratively so that we can learn together would be helpful.”
District Leadership, Capacity Building and Supports When TPEP was initially approved by the Legislature, there were a number of elements that required clarification by state agencies. Given the complexity of the evaluation system and variation among districts across the state, certain elements of the policy were allowed to be sorted out at the district level as part of the implementation process. Some district leaders
32
viewed this with frustration in that they wanted more direction from the state in their negotiations with teachers’ associations. Conversely, others saw the flexibility as an opportunity to maximize how the policy was implemented at the local level. By most accounts, it took districts several years to navigate the process, working with local teachers’ associations in developing memos of understanding and in contract negotiations, to create structures and supporting documentation. Several case study districts exemplified the ability to live with ambiguity during the transition process. These districts created space for the relevant parties to discuss issues before putting more permanent structures in place. District leaders described not letting the structures define the process. Speaking of one of these districts, a leader from another district explained, “They chose to live with that kind of ambiguity on the tactical side because they were saying yes to teacher growth, to principal growth.” In contrast, an administrator in a different district suggested that they initially engaged in the process by focusing on documentation: “People were spending hours and hours and hours on the forms. We had lost any semblance about how this could be about the growth of professional practice.” Within a short period of time, the district subsequently reframed TPEP as a growth model. In this section of the report, we examine district-level decision making and capacity building to support TPEP implementation. We begin by examining professional development resources necessary to support both teachers and principals.
District and Regional Resources Districts have been clear that continued support and resources for professional development will be vital to sustaining a focus on instructional improvement as part of the evaluation effort. Capacity building at both the district and school level is an ongoing process, and organizational infrastructure and resources play a role in determining how effectively staff have been able to implement the initiative. In some cases, internal capacity building involves ongoing and differentiated supports for teachers and building administrators to ensure changes in instructional and leadership practices. It may also require that principals delegate tasks to other staff, as time is a critical resource in carrying out the evaluations with rigor.
District Approaches to Professional Development for Teachers A central issue for districts in the implementation of TPEP has been an ongoing plan to introduce staff to the technical aspects of the new evaluation process, and then support staff with appropriate ongoing professional development. Considerable variation exists across districts in the extent to which district staff and building level leaders organize and coordinate these efforts. To date, most districts have established the foundational elements of the evaluation process, and now the focus has shifted to deeper and more targeted approaches to professional learning. While the state has provided training grants to support TPEP implementation, many districts have invested substantial local resources to ensure adequate support for their staff. Given Washington’s unique and complex evaluation model, the need for training does not end when the formal implementation period is over.
a. State Support for TPEP Implementation (Teacher Training Funds) The Washington State Legislature provided $5 million in grant funding for districts in the 2015-16 year to support professional development for teacher training (iGrant 664). However, districts face substantially different implementation challenges based on their enrollment size, regional
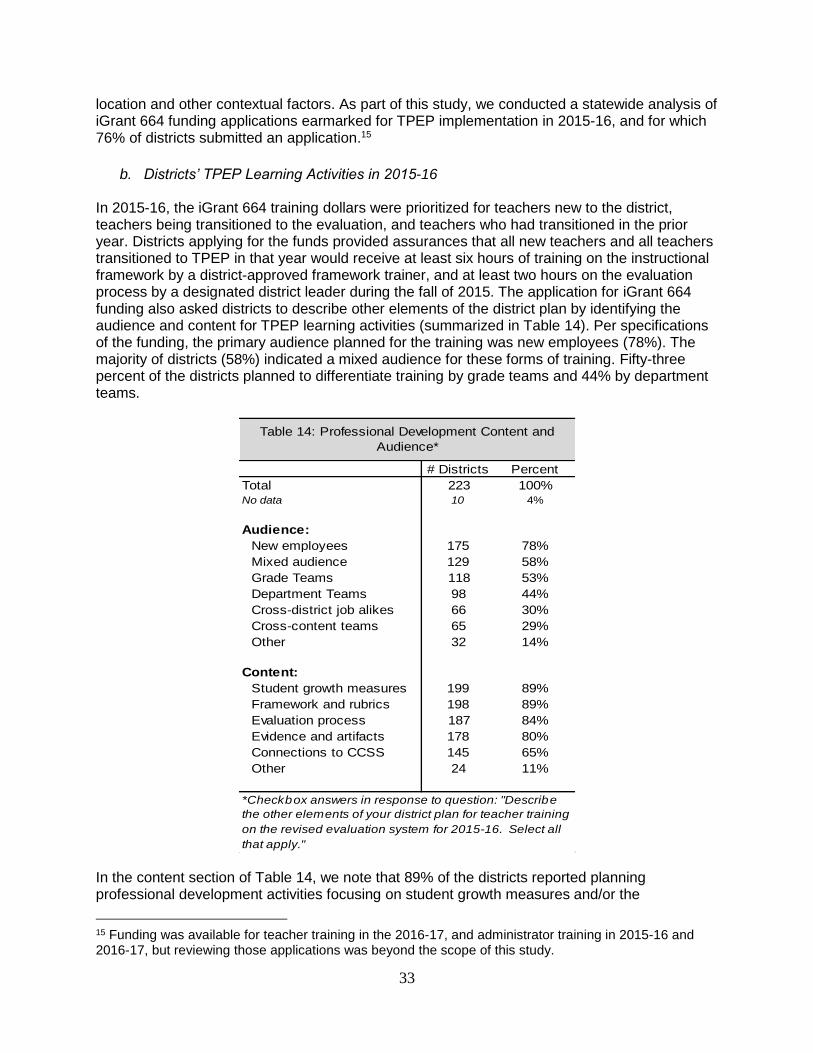
33
location and other contextual factors. As part of this study, we conducted a statewide analysis of iGrant 664 funding applications earmarked for TPEP implementation in 2015-16, and for which 76% of districts submitted an application.15
b. Districts’ TPEP Learning Activities in 2015-16 In 2015-16, the iGrant 664 training dollars were prioritized for teachers new to the district, teachers being transitioned to the evaluation, and teachers who had transitioned in the prior year. Districts applying for the funds provided assurances that all new teachers and all teachers transitioned to TPEP in that year would receive at least six hours of training on the instructional framework by a district-approved framework trainer, and at least two hours on the evaluation process by a designated district leader during the fall of 2015. The application for iGrant 664 funding also asked districts to describe other elements of the district plan by identifying the audience and content for TPEP learning activities (summarized in Table 14). Per specifications of the funding, the primary audience planned for the training was new employees (78%). The majority of districts (58%) indicated a mixed audience for these forms of training. Fifty-three percent of the districts planned to differentiate training by grade teams and 44% by department teams.
# Districts Percent
Total 223 100%No data 10 4%
Audience:
New employees 175 78%
Mixed audience 129 58%
Grade Teams 118 53%
Department Teams 98 44%
Cross-district job alikes 66 30%
Cross-content teams 65 29%
Other 32 14%
Content:
Student growth measures 199 89%
Framework and rubrics 198 89%
Evaluation process 187 84%
Evidence and artifacts 178 80%
Connections to CCSS 145 65%
Other 24 11%
Table 14: Professional Development Content and
Audience*
*Checkbox answers in response to question: "Describe
the other elements of your district plan for teacher training
on the revised evaluation system for 2015-16. Select all
that apply." In the content section of Table 14, we note that 89% of the districts reported planning professional development activities focusing on student growth measures and/or the
15 Funding was available for teacher training in the 2016-17, and administrator training in 2015-16 and 2016-17, but reviewing those applications was beyond the scope of this study.
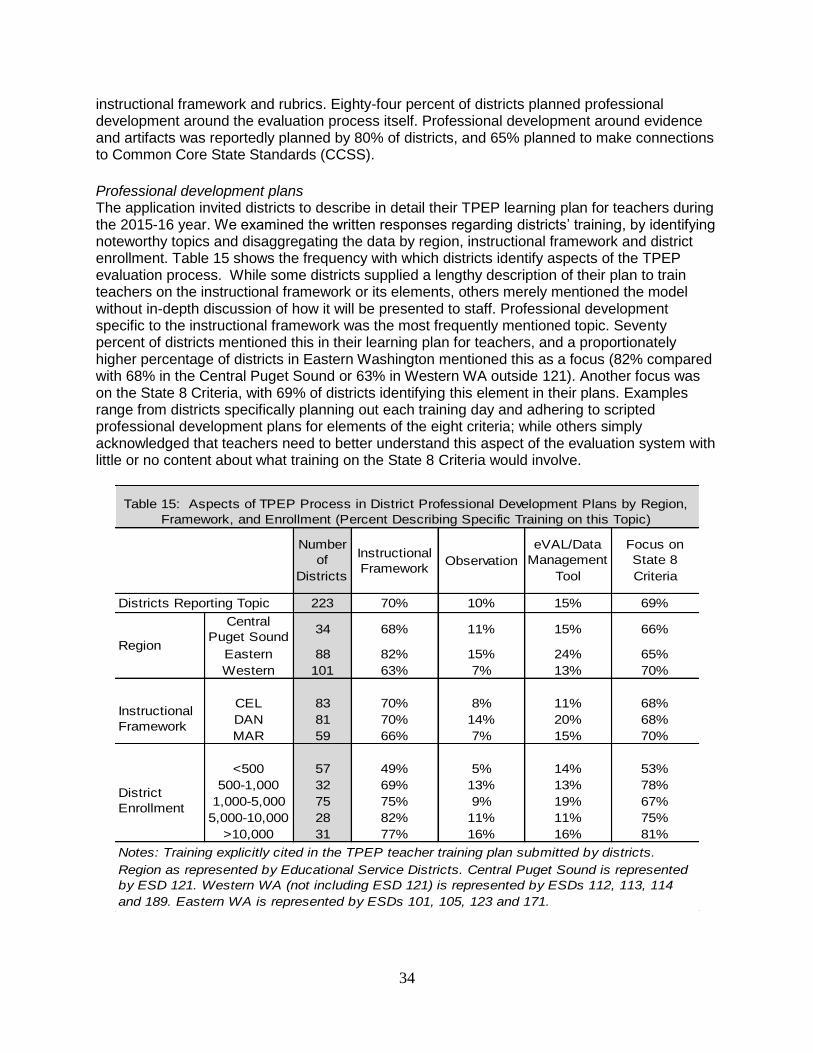
34
instructional framework and rubrics. Eighty-four percent of districts planned professional development around the evaluation process itself. Professional development around evidence and artifacts was reportedly planned by 80% of districts, and 65% planned to make connections to Common Core State Standards (CCSS).
Professional development plans The application invited districts to describe in detail their TPEP learning plan for teachers during the 2015-16 year. We examined the written responses regarding districts’ training, by identifying noteworthy topics and disaggregating the data by region, instructional framework and district enrollment. Table 15 shows the frequency with which districts identify aspects of the TPEP evaluation process. While some districts supplied a lengthy description of their plan to train teachers on the instructional framework or its elements, others merely mentioned the model without in-depth discussion of how it will be presented to staff. Professional development specific to the instructional framework was the most frequently mentioned topic. Seventy percent of districts mentioned this in their learning plan for teachers, and a proportionately higher percentage of districts in Eastern Washington mentioned this as a focus (82% compared with 68% in the Central Puget Sound or 63% in Western WA outside 121). Another focus was on the State 8 Criteria, with 69% of districts identifying this element in their plans. Examples range from districts specifically planning out each training day and adhering to scripted professional development plans for elements of the eight criteria; while others simply acknowledged that teachers need to better understand this aspect of the evaluation system with little or no content about what training on the State 8 Criteria would involve.
Number
of
Districts
Instructional
FrameworkObservation
eVAL/Data
Management
Tool
Focus on
State 8
Criteria
Districts Reporting Topic 223 70% 10% 15% 69%
Central
Puget Sound34 68% 11% 15% 66%
Eastern 88 82% 15% 24% 65%
Western 101 63% 7% 13% 70%
CEL 83 70% 8% 11% 68%
DAN 81 70% 14% 20% 68%
MAR 59 66% 7% 15% 70%
<500 57 49% 5% 14% 53%
500-1,000 32 69% 13% 13% 78%
1,000-5,000 75 75% 9% 19% 67%
5,000-10,000 28 82% 11% 11% 75%
>10,000 31 77% 16% 16% 81%
Region as represented by Educational Service Districts. Central Puget Sound is represented
by ESD 121. Western WA (not including ESD 121) is represented by ESDs 112, 113, 114
and 189. Eastern WA is represented by ESDs 101, 105, 123 and 171.
Table 15: Aspects of TPEP Process in District Professional Development Plans by Region,
Framework, and Enrollment (Percent Describing Specific Training on this Topic)
Region
Instructional
Framework
District
Enrollment
Notes: Training explicitly cited in the TPEP teacher training plan submitted by districts.
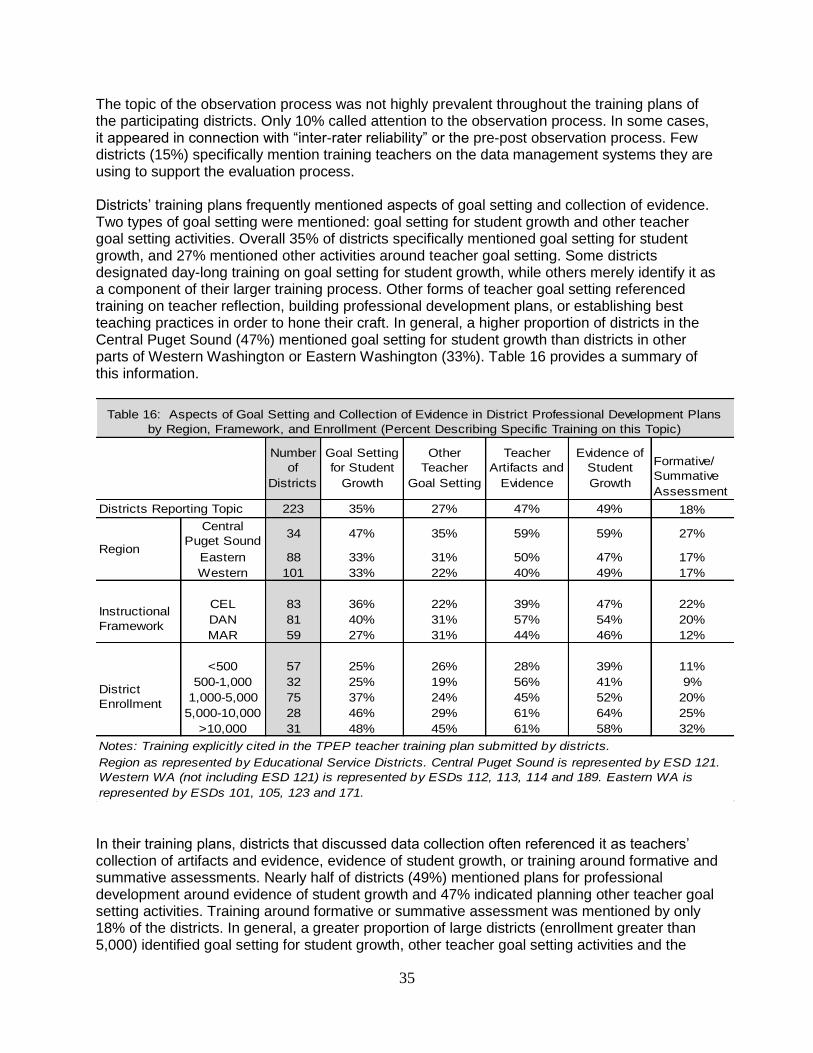
35
The topic of the observation process was not highly prevalent throughout the training plans of the participating districts. Only 10% called attention to the observation process. In some cases, it appeared in connection with “inter-rater reliability” or the pre-post observation process. Few districts (15%) specifically mention training teachers on the data management systems they are using to support the evaluation process. Districts’ training plans frequently mentioned aspects of goal setting and collection of evidence. Two types of goal setting were mentioned: goal setting for student growth and other teacher goal setting activities. Overall 35% of districts specifically mentioned goal setting for student growth, and 27% mentioned other activities around teacher goal setting. Some districts designated day-long training on goal setting for student growth, while others merely identify it as a component of their larger training process. Other forms of teacher goal setting referenced training on teacher reflection, building professional development plans, or establishing best teaching practices in order to hone their craft. In general, a higher proportion of districts in the Central Puget Sound (47%) mentioned goal setting for student growth than districts in other parts of Western Washington or Eastern Washington (33%). Table 16 provides a summary of this information.
Number
of
Districts
Goal Setting
for Student
Growth
Other
Teacher
Goal Setting
Teacher
Artifacts and
Evidence
Evidence of
Student
Growth
Formative/
Summative
Assessment
Districts Reporting Topic 223 35% 27% 47% 49% 18%
Central
Puget Sound34 47% 35% 59% 59% 27%
Eastern 88 33% 31% 50% 47% 17%
Western 101 33% 22% 40% 49% 17%
CEL 83 36% 22% 39% 47% 22%
DAN 81 40% 31% 57% 54% 20%
MAR 59 27% 31% 44% 46% 12%
<500 57 25% 26% 28% 39% 11%
500-1,000 32 25% 19% 56% 41% 9%
1,000-5,000 75 37% 24% 45% 52% 20%
5,000-10,000 28 46% 29% 61% 64% 25%
>10,000 31 48% 45% 61% 58% 32%
Region as represented by Educational Service Districts. Central Puget Sound is represented by ESD 121.
Western WA (not including ESD 121) is represented by ESDs 112, 113, 114 and 189. Eastern WA is
represented by ESDs 101, 105, 123 and 171.
Table 16: Aspects of Goal Setting and Collection of Evidence in District Professional Development Plans
by Region, Framework, and Enrollment (Percent Describing Specific Training on this Topic)
Region
Instructional
Framework
District
Enrollment
Notes: Training explicitly cited in the TPEP teacher training plan submitted by districts.
In their training plans, districts that discussed data collection often referenced it as teachers’ collection of artifacts and evidence, evidence of student growth, or training around formative and summative assessments. Nearly half of districts (49%) mentioned plans for professional development around evidence of student growth and 47% indicated planning other teacher goal setting activities. Training around formative or summative assessment was mentioned by only 18% of the districts. In general, a greater proportion of large districts (enrollment greater than 5,000) identified goal setting for student growth, other teacher goal setting activities and the
36
collection of evidence and artifacts than the state’s smallest districts (enrollment less than 1,000). We also examined the extent to which districts referenced a differentiation of training by types of teachers, grades, subjects and student populations in their learning plans. Most frequently, districts mentioned differentiated training for teachers new to the profession (44%). A fifth of the districts (20%) discussed differentiated training by comprehensive or focused evaluation plan. Few districts (11%) described training by grade level, school subjects or job alikes. Even fewer districts (5%) mentioned training for teachers who work with special populations (e.g., special education or vocational education). Finally, since collaboration is an integral part of the TPEP process, we examined the extent to which the district TPEP training plans identified these kinds of opportunities as part of the learning plan. More than 35% of the participating districts included descriptions of teachers working in teacher teams or with teacher mentors or teacher leaders. Teacher/administrator collaboration was mentioned in 39% of the district training plans. Less than 15% of district applications mentioned collaborating with other districts to conduct the training. However, the data in this section should be interpreted with caution as districts may have planned training in these subjects or areas, but may not have reported so in the application materials.
c. Districts’ Use of Funding from iGrant 664 In describing districts’ plans for the use of iGrant 664 monies, there is a level of ambiguity, because it isn’t explicitly clear where the “funding” is coming from. Most likely, the funding is coming from the iGrant 664 monies applied for. But other sources of funding are discussed by districts (most often local district funding), and it is not always clear what funding streams are funding which activities, and to what degree. Furthermore, all but 5 of the 223 participating districts (98%) report that they used some amount of local funding in addition to the iGrant 664 monies to support TPEP implementation. With that caveat in mind, we proceed with describing the most commonly planned uses of funding from iGrant 664 in 2015-16. The most frequently cited use of funding by districts was teacher compensation for extra time outside the normal workday for the training. Nearly three-quarters of participating districts (73%) reported this use of funding in their TPEP training plans. This included after-hours work, extended day pay, and extra time for teachers at curriculum rate. Over half of the 223 districts (52%) planned to use the funding to pay trainers, facilitators or consultants to support teacher professional development activities. This included contracting, paying for training and purchasing services. More than a third of the districts (37%) plan to use the funding to hire substitute teachers for training during a regular workday. Thirty-seven percent of districts also planned to use their iGrant 664 funding to purchase a variety of things such materials, books, videos, and photocopying. Approximately half of the largest districts (enrollment greater than 10,000) and districts in the Central Puget Sound (50%) planned to use the funding in this way, compared with 40% of districts in Eastern Washington and 31% in Western Washington outside ESD 121. Support for transportation costs to attend professional development events was most important for the smallest districts and those districts in Eastern Washington or in Western Washington outside of the Central Puget Sound. None of the districts in ESD 121 indicated they would use the funding for travel. Appendix A2 provides further details.

37
This overview of districts’ professional development priorities and plans, based on the teacher training applications (iGrant 664) in 2015-16 are similar to findings from the 2017 statewide survey, and case study district work, which we discuss next.
d. District Participation in Teacher and Principal Training Funds in 2016-17 Superintendents participating in the survey were asked if their district applied for and received state funding to support TPEP implementation in 2016-17 through iGrants 664 or 773. Eighty percent of the responding districts indicated that they had received funding. For districts that did not apply, superintendents were asked to explain why: a third indicated that the there was too little money for the amount of work involved in applying and a third indicated it was due to the amount of paperwork required. An example of written comments included the following: “Use of funds are very restrictive. Smaller districts do not have PD coordinators or others that can just focus on professional development. This grant in no way is conducive to smaller schools.” As previously discussed, district and school size can be a notable challenge for TPEP implementation. Among the case study districts that applied for professional development funding, one district used the funding to create online video modules for TPEP trainings. They designed and filmed elementary, middle, and high school teams of an evaluator and a teacher going through the entire evaluation cycle from goal setting, to observations, pre and post conferences, and the summative evaluation cycles. Another district took a more individualized approach by offering paid instructional development time (iGrant 664 funding) for teachers to go deeper on specific topics within TPEP. A TPEP coach provided an example, “At the elementary level, there were four 2 hour sessions that looked at culturally responsive teaching, and everything was tied each time to the Danielson framework.” This type of individualized training provided extended time for teachers to work on an area of focus within their evaluation. Yet another case study district provided resources to the building administrators to use at their own discretion for staff training. Each case study district has approached professional development for TPEP somewhat differently, though a common thread in recent years has been the shift away from training organized or led by the central office staff to more site-based training conducted by principals and building level staff. The intent behind this strategy has been to support a deeper contextualized approach to professional development with greater alignment to individual and building goals. A high school principal explained how they used TPEP data from a prior year to help inform the professional development for the current year, “I pulled all of their TPEP evals from last year, and we [principal and assistant principals] went through and tracked, ‘where did we see strengths, and where did we see weaknesses across our staff?’ That’s how we set out PD for the year. It was based off of where staff members said that they struggled. One of the things that we saw consistently for two years was the conversation around differentiation and differentiation strategies, so we built that in as one of our major focuses.” Most case study districts include TPEP-specific training in the induction of new staff, which is targeted both toward novice teachers and those new to the district. Several have connected TPEP training for beginning teachers through funding from the Beginning Educator Support Team (BEST) program. In some of the case study districts, mentors funded through BEST are expected to support beginning teachers with TPEP. A new high school teacher expressed how helpful it was to have this kind of professional development both before the school year started and throughout the year: “I think the professional development before school is really, really helpful…. it gave us some time to work ahead of time. Then having building-based professional development where we touch back on it again. I think being new, I really needed the multiple
38
touch points to make sure I was understanding, as it was a new system for me.” In an effort to deepen learning for administrators, in one case study district, building principals were required to go through the TPEP training alongside their new teachers.
However, it isn’t just new staff who may need extra support with TPEP. Administrators continue to provide guidance and support for all teachers, particularly those who may not remember the initial training they received years earlier, or learn about implementation approaches and policies that have since changed. Some teachers just need a refresher on TPEP. A middle school principal explained, “I'm always amazed at the amount of guidance, the continual guidance that folks need through the [TPEP] process….It's just that learning process, and continually checking in with folks. If you don't have that built in as your leadership style, it probably makes it a lot more difficult.” A principal responding to the survey wrote, “The biggest area of support I need is in supporting teachers with identifying targeted growth areas that stretch their normal practice, particularly with veteran teachers. In my experience the newer teachers are open and expecting to need to rise up to ambitious goals. Some of my veteran staff try to rely on growth for routine standards or previous practices.” While there is an expectation that new staff will need TPEP-specific training and support, there will continue to be a need to support others also.
Professional Development and Supports for Principals and Assistant Principals As described in previous sections, the availability of particular kinds of resources can influence the implementation of TPEP at the school level. Given the central role that principals and assistant principals play in the implementation of TPEP, some districts have been implementing strategies to support school leaders with their responsibilities for conducting teacher evaluations. This includes both the provision of professional development opportunities, opportunities for collaboration with other administrators, and additional resources, including time and personnel. One superintendent of a case study district explained the importance of the school administrator in this way: “I think the biggest difference…is the gap in the abilities of the principal. I can tell
you right now as a superintendent that the variance [in the quality of TPEP implementation] is proportionate to the instructional ability of our principals. How do I, as a superintendent, improve the instructional leadership capacity of our principals? Because …it's not the mechanical work, it's down to the principal.”
In our survey work, superintendents were asked about challenges they perceive that principals face with regard to TPEP implementation. By far, district administrators perceive the greatest challenge faced by principals to be that of time to conduct evaluations, with 66% identifying that as a great challenge. In addition, at least half of superintendents identified principal knowledge about goal setting for student growth as a moderate or great challenge (41% a moderate challenge and 9% a great challenge), and principal ability to assist teachers in developing measures of student learning (43% a moderate challenge and 10% a great challenge). A fraction of superintendents identified principal knowledge of the instructional framework as a great challenge (3%). Table 17 displays these survey results.
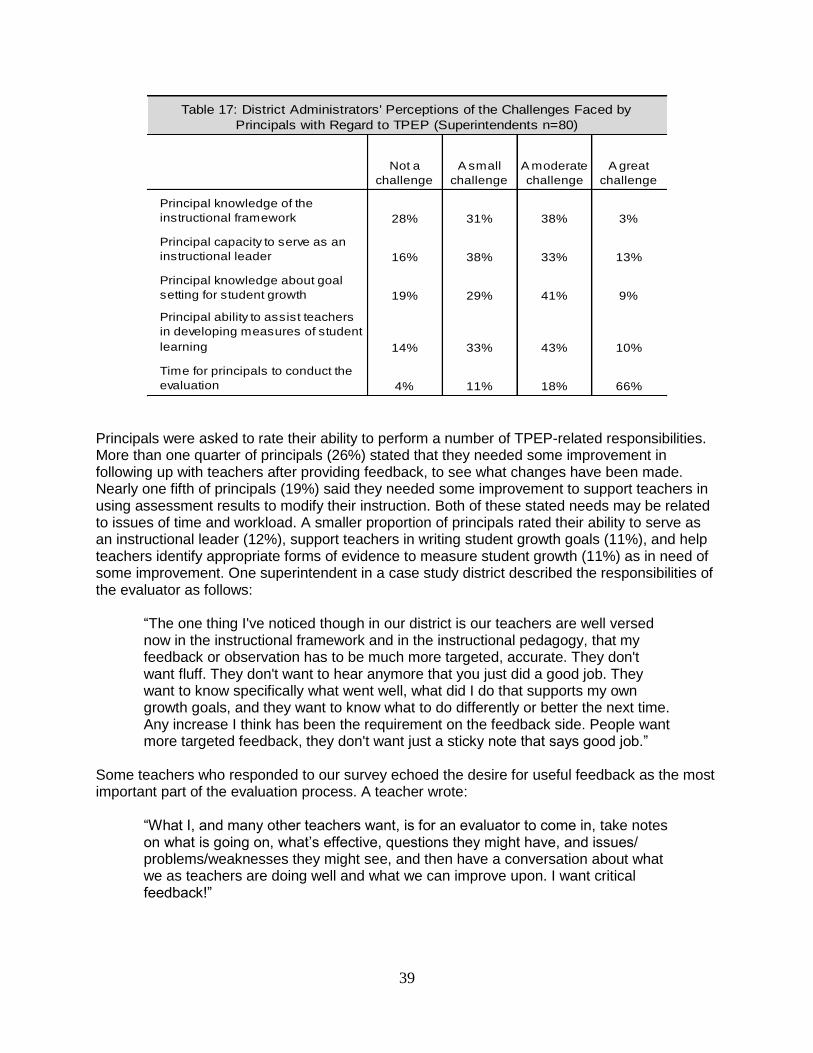
39
Principal knowledge of the
instructional framework 28% 31% 38% 3%
Principal capacity to serve as an
instructional leader 16% 38% 33% 13%
Principal knowledge about goal
setting for student growth 19% 29% 41% 9%
Principal ability to assist teachers
in developing measures of student
learning 14% 33% 43% 10%
Time for principals to conduct the
evaluation 4% 11% 18% 66%
Table 17: District Administrators' Perceptions of the Challenges Faced by
Principals with Regard to TPEP (Superintendents n=80)
Not a
challenge
A small
challenge
A moderate
challenge
A great
challenge
Principals were asked to rate their ability to perform a number of TPEP-related responsibilities. More than one quarter of principals (26%) stated that they needed some improvement in following up with teachers after providing feedback, to see what changes have been made. Nearly one fifth of principals (19%) said they needed some improvement to support teachers in using assessment results to modify their instruction. Both of these stated needs may be related to issues of time and workload. A smaller proportion of principals rated their ability to serve as an instructional leader (12%), support teachers in writing student growth goals (11%), and help teachers identify appropriate forms of evidence to measure student growth (11%) as in need of some improvement. One superintendent in a case study district described the responsibilities of the evaluator as follows: “The one thing I've noticed though in our district is our teachers are well versed
now in the instructional framework and in the instructional pedagogy, that my feedback or observation has to be much more targeted, accurate. They don't want fluff. They don't want to hear anymore that you just did a good job. They want to know specifically what went well, what did I do that supports my own growth goals, and they want to know what to do differently or better the next time. Any increase I think has been the requirement on the feedback side. People want more targeted feedback, they don't want just a sticky note that says good job.”
Some teachers who responded to our survey echoed the desire for useful feedback as the most important part of the evaluation process. A teacher wrote: “What I, and many other teachers want, is for an evaluator to come in, take notes
on what is going on, what’s effective, questions they might have, and issues/ problems/weaknesses they might see, and then have a conversation about what we as teachers are doing well and what we can improve upon. I want critical feedback!”
40
Professional development supports Results from our case study and survey work indicate that there is a need for ongoing professional development supports for principals, preferably in collaboration with other school administrators. In our survey, three quarters of principals agreed that they would benefit from more professional development related to TPEP. When asked to rate the usefulness of various supports for teacher evaluation, more than three quarters of principals said that collaborating with other administrators on TPEP issues (76%) and ongoing training to continue their growth as a teacher evaluator (79%) was either somewhat or very useful. A majority of principals rated training to support rater reliability (57%) and supports for working on their own evaluations (51%) as either somewhat or very useful to them. One fifth of principals said that supports for working on their own evaluations were not available to them. Additionally, 41% of principals either strongly or somewhat disagreed that the feedback they receive on their own evaluations is useful. One superintendent in a case study district expressed concern about the lack of support for principals as follows: “…given the amount of support and time that's put into the teacher side of the
evaluation across this reflection versus truly talking about the role of the principal in developing inquiry cycles for principals, I don't think we've done as much here. To be honest with you, I don't think that we have supported the principals from a system side.”
District administrators in our case study districts engaged in efforts to discuss TPEP-related matters, including instructional leadership issues, with principals and assistant principals during their regularly scheduled staff meetings. A district administrator described this: “We're constantly referencing the framework as we're doing our regular leadership team meetings our principal level meetings. We try to hold half of each of those meetings for instructional issues.” Another superintendent said: “I think just intentional, professional learning that embeds the work that they need to do into the learning has been critical for us.” Some district administrators also implemented strategies for supporting principals and assistant principals in deepening their skills, including conducting observations of principals interacting with teachers. A district administrator describes the work that the district is striving to accomplish:
“We're in schools a lot, we're walking into classrooms, we're having instructional conversations but there's a level of intentionality that I want to get to... How we schedule our visits to schools and what kinds of visits we do, should be more intentionally connected to the principal area of focus than it is right now. ‘Let's make sure that I'm scheduled in to see you [a school principal] doing some of these things that you're working on so I can get kind of firsthand view of it and then engage you in conversation about it.’ It's taking what we do, which is, I would say good practice, and trying to make it better by being more intentional about how we use our time when we're in schools with principals...So much more of their time is focused on the instructional process, and teacher feedback, and engaging with observations in classrooms, and what I see is principals struggling to do the rest of the job and to do that really important big part of it well.”
Districts are also providing other types of support for principals, including providing additional personnel and re-allocating the use of existing personnel. Forty-three percent of superintendents responding to our survey indicated that their districts have provided additional staffing to assist principals with teacher evaluations, and more than a quarter of principals (26%) stated that they have received additional or re-allocated supports in their schools. Not surprisingly, a higher proportion of assistant principals in schools with enrollments less than 800
41
students (43%) reported receiving additional supports compared to assistant principals in schools with enrollments greater than 800 students (21%), a difference that is statistically significant (p=.02). This is likely due to the fact that schools with lower enrollments were less likely to already have a full or part-time principal in place. The addition of assistant principals at the elementary school level to provide additional support for the responsibilities associated with teacher evaluation was a common theme in our case study districts. A superintendent described the district's approach:
“I want to add two new ones [assistant principals] next year at the elementary level. I added one already. I'd like to make it three total new ones for next year at the elementary level. But I see within three or four years us having an AP at every elementary school full time. Because our staffs are about 28 to 32 people. And when you're talking 28 to 32 people, and if you get very much out of balance on your staggering of comprehensive and focused, you can wear out a principal. And I've got great principals. I don't want to lose them because they just can't do this job.”
Personnel Supports The greatest proportion of superintendents (65%) who stated in our survey that they had added additional staffing reported that they added full or part-time assistant principals in the last two years, and 56% of principals and assistant principals who reported receiving additional staffing said that their school received an addition of a full or part-time principal. Data from our survey and case study work is also corroborated by another data source. A separate study using Washington state personnel datasets was conducted by our research team and examined the characteristics of principals and assistant principals. We found that the increase in the number of assistant principals was much greater than the increase in the number of principals during the time period from 2010-11 to 2015-16. The number of principals in Washington state grew by 4% during this time period, compared to an increase of 29% for assistant principals. The vast majority of the increase in assistant principals was at the elementary level, where the number of elementary assistant principal positions more than doubled (see Plecki, Elfers, & Wills, 2017). In addition to an increase in the number of assistant principals, survey respondents also reported other types of additional personnel supports to help with teacher evaluations. Of the district and school administrators in our survey who stated that additional personnel has been provided to assist with teacher evaluation, 59% of superintendents and 15% of school administrators said they added time from instructional coaches, TPEP coaches or department heads. Half of superintendents and 19% of principals and assistant principals indicated that full or part-time deans of students were added. About a third of superintendents said that district administrators have conducted some teacher evaluations (38%) or duties of assistant principals have been re-assigned to support TPEP evaluations (32%). A smaller proportion of principals who reported receiving additional staffing indicated that district administers conducted some teacher evaluations (15%), and a third (33%) reported that the duties of an assistant principal had been reassigned to support TPEP evaluations. Figure 2 provides details.
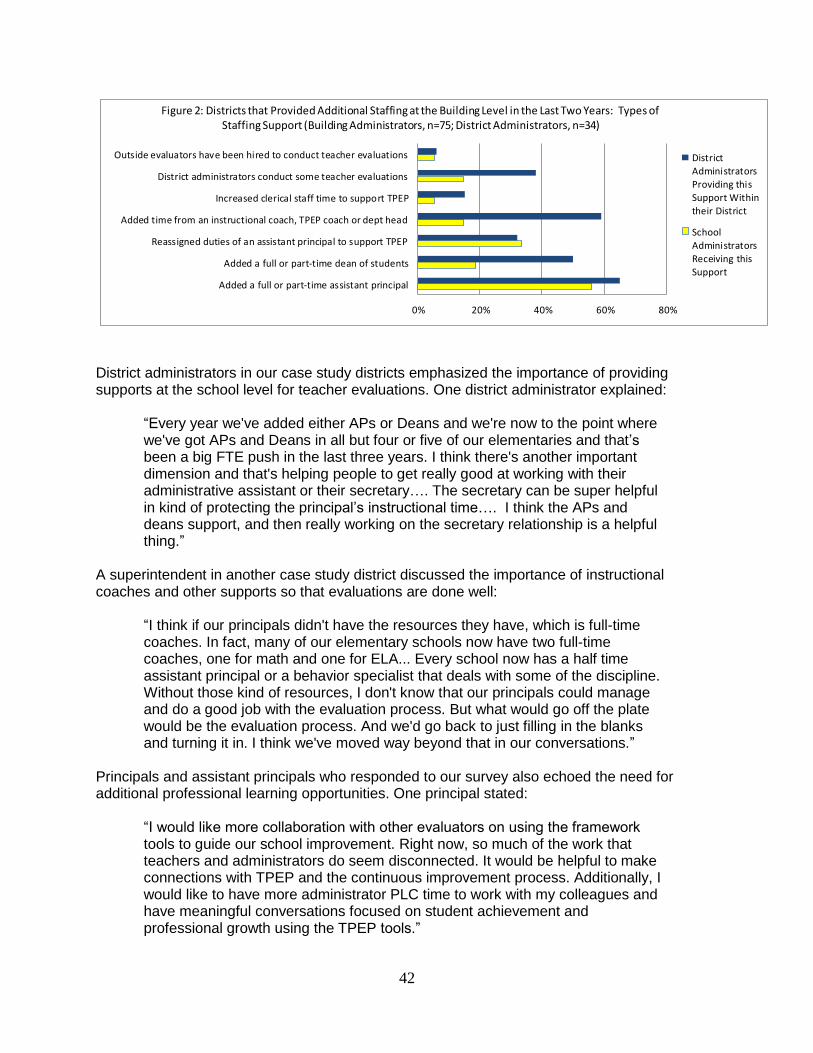
42
0% 20% 40% 60% 80%
Added a full or part-time assistant principal
Added a full or part-time dean of students
Reassigned duties of an assistant principal to support TPEP
Added time from an instructional coach, TPEP coach or dept head
Increased clerical staff time to support TPEP
District administrators conduct some teacher evaluations
Outside evaluators have been hired to conduct teacher evaluations
Figure 2: Districts that Provided Additional Staffing at the Building Level in the Last Two Years: Types of Staffing Support (Building Administrators, n=75; District Administrators, n=34)
District
Administrators
Providing this
Support Within
their District
School
Administrators
Receiving this
Support
District administrators in our case study districts emphasized the importance of providing supports at the school level for teacher evaluations. One district administrator explained: “Every year we've added either APs or Deans and we're now to the point where
we've got APs and Deans in all but four or five of our elementaries and that’s been a big FTE push in the last three years. I think there's another important dimension and that's helping people to get really good at working with their administrative assistant or their secretary…. The secretary can be super helpful in kind of protecting the principal’s instructional time…. I think the APs and deans support, and then really working on the secretary relationship is a helpful thing.”
A superintendent in another case study district discussed the importance of instructional coaches and other supports so that evaluations are done well: “I think if our principals didn't have the resources they have, which is full-time
coaches. In fact, many of our elementary schools now have two full-time coaches, one for math and one for ELA... Every school now has a half time assistant principal or a behavior specialist that deals with some of the discipline. Without those kind of resources, I don't know that our principals could manage and do a good job with the evaluation process. But what would go off the plate would be the evaluation process. And we'd go back to just filling in the blanks and turning it in. I think we've moved way beyond that in our conversations.”
Principals and assistant principals who responded to our survey also echoed the need for additional professional learning opportunities. One principal stated: “I would like more collaboration with other evaluators on using the framework
tools to guide our school improvement. Right now, so much of the work that teachers and administrators do seem disconnected. It would be helpful to make connections with TPEP and the continuous improvement process. Additionally, I would like to have more administrator PLC time to work with my colleagues and have meaningful conversations focused on student achievement and professional growth using the TPEP tools.”

43
A type of collaborative professional development that principals are receiving in some case study districts involves visiting schools and learning from other colleagues. An elementary school principal reported: “One of the things that [our district] is doing this year is invite principals into the
‘deep dive’…where administrators, main office, central office folks, directors were coming around at least once during the school year, and spending like three hours here. They’re visiting classrooms, they’re having conversations with me about what’s going on. This year they invited principals to join at another elementary school. We’re starting to get to see living, breathing school happening. We’re not just sitting in a confined room somewhere talking about how we do it, we’re going out and seeing it and then joining the debrief afterwards.”
Some of the supports for school administrators have focused on providing opportunities for work on calibration, consistency, and rater reliability. The issue of inter-rater agreement becomes increasingly important as more assistant principals are taking on roles as evaluators and teachers receive evaluations from more than one person. In the majority of schools, there is more than one evaluator. Nearly three-quarters (73%) of principals and assistant principals and 64% of teachers in our surveys reported having more than one evaluator in their buildings.
Consistency in evaluation scoring Differences emerge when asking teachers, principals and superintendents about their perceptions of the consistency in evaluation processes across schools. The majority of teachers either strongly or somewhat agreed (73%) that they were confident that they would receive similar scores on their evaluations regardless of who evaluates them, and 60% either strongly or somewhat agreed that the quality of feedback teachers receive in their buildings is similar irrespective of who the evaluator is. Somewhat larger proportions of principals also agree that teachers would receive similar scores (86%) and receive the similar quality of feedback (84%) regardless of who the evaluator is. However, superintendents expressed less confidence than principals in this regard, with 69% agreeing that teachers would receive similar scores and 56% agreeing that the quality of feedback would be similar regardless of who the evaluator is. These differences between school administrators and superintendents are statistically significant (p=.001 and p=.0005, respectively).Table 18 compares responses of among these three groups of survey respondents.
Tchrs Princ Supts Tchrs Princ Supts Tchrs Princ Supts Tchrs Princ Supts
I am confident that I/teachers
would receive similar scores [on
my evaluation] regardless of who
evaluates me/them 38% 37% 20% 35% 50% 49% 18% 11% 28% 9% 2% 4%
The quality of the feedback
teachers receive [in my building]
is similar regardless of who the
evaluator is/ 22% 30% 11% 38% 54% 46% 27% 13% 35% 12% 3% 8%
Table 18: Confidence in Evaluation Scores With Different Evaluators: For Teachers and Principals With More Than
One Evaluator in the Building: Superintendents Across Evaluators (Teachers n = 320, Principals and Assistant
Principals n=205, Superintendents n=80)
Extent to which you agree or
disagree with the following
statements
Strongly Agree Somewhat Agree Somewhat Disagree Strongly Disagree
44
In our surveys, principals and assistant principals were less confident about the consistency of TPEP implementation than superintendents, with 58% of school administrators either somewhat or strongly agreeing that TPEP implementation was very consistent across schools within their districts, compared to 79% of superintendents, a difference that is statistically significant (p=.001). Over half of superintendents (55%) reported that reliability was a major or moderate concern (30% indicated it was a small concern), and 89% of superintendents indicated that work on rater reliability and calibration would be either a major or minor area of focus should additional supports be available for TPEP implementation. One district administrator from a case study district described the challenge of consistency across the district with TPEP implementation: “There is disparity from building to building and I feel even within the building
there's disparity in some cases between evaluators. We have that as a work area… You've got administrators who've been involved in TPEP from the beginning so they think they have it down instead of digging deeper into the framework and having a better understanding. But then we have a lot of new administrators coming in and they're not quite calibrated yet because they've got an abundance of responsibilities beyond evaluation and they're just starting the training. So they have to manage more than two days of stage 1 that they have to do before they can get into a class to evaluate but they’re writing up the evaluations without the total 6 days of training…. I find the disparities between the young and the veterans but then there is a disparity in, I don't know, personality. Between evaluators where I see some evaluators really use it as a professional growth model and really have those in depth conversations where teachers feel safe to take risks and growth in their practice to have those conversations. There are other teachers that don't get to have that similar experience.”
A district administrator in another case study district discussed calibration and inter-rater reliability in terms of improving the abilities of evaluators to focus on instruction: “Calibration, inter-rater reliability, I think that's just going to continue to be an
important issue. I think that we will strengthen the observational skills of principals by engaging in exercises that press upon inter-rater reliability. I think that our administrative skill and practice gets better by the degree in which we're focused on our descriptive skills of the phenomena of teaching and learning, and we do better when we see teaching and learning, rather than exclusively our rating and judgmental skill. I'm much more interested in strengthening the ability of principals to observe and describe instruction.”
Use of Outside Agencies for Training and Professional Development Nearly all of the case study districts had intentionally sought out resources and engagement with like-minded districts. One superintendent explained how they continued to stay engaged with their ESD as a way to share ideas: “That support from the state that first couple of years was really good and really helpful. We have stayed connected with a group at the ESD that has helped. We can continue to have that cross pollination of conversations with other districts. And I think that's been healthy for us.” Other districts found themselves isolated within their region, either because of the framework or an inability to find like-minded districts. In such cases,
45
district outreach often included work with framework sponsors or specialists, but it wasn’t excusive to the framework. Rather, district leaders expressed a desire to interact with their counterparts who were thinking hard about issues of instructional improvement, regardless of the framework. A superintendent explained his perspective: “[Staff] from CEL are leading a group of five or six pretty progressive districts in
our region that are not all CEL districts. What we have in common though, is creating this capacity, system coherence, sustainability. … I think we have to look beyond the framework, and we can learn some things and have a common practice and yet be on Marzano or Danielson or CEL… I need to talk to other people who are currently trying to put in this system coherence or capacity [in place].”
Other case study districts invited others in the region to join them for their training: “We have [a framework trainer] on staff, and she's able to lead sections both for the ESD but also for our folks. The one we had yesterday was a CEL-coach but we invited the county schools to join us if they wanted to do a rater reliability training.” Another district described working with colleagues on a similar grant, and that opened opportunities for staff collaboration on TPEP-related activities also.
One district mentioned the usefulness of engaging with others at state-sponsored colloquium events. A district administrator explained: “We have become pretty involved with the Colloquia and we've got another team going this year to present at that... We've made relationships with some districts that are not local to us because we're one of the only Marzano districts here… we've gotten into visits at these school districts and conversations with their staff about all the things they do to serve their kids. Of course, TPEP is all encompassing of that, but it's grown bigger than the acronym really describes it.” The common thread among these districts was taking the initiative to search out opportunities beyond their borders to engage with other districts around TPEP-related issues.
Integration and Coherence with Other Initiatives Introducing TPEP concurrently with other major statewide initiatives, such as the Common Core State Standards and new assessments under the Smarter Balanced Assessment Consortium (SBAC) has been challenging for many districts.16 In addition, districts often have other local initiatives underway to improve teaching and learning. While the initiatives were implemented during the same time period, for some districts, the work of TPEP has been compartmentalized among the specialized district staff who hold responsibilities for specific initiatives. Research suggests that integration and prioritization of implementation reforms can help reduce stress on staff (Kim, Youngs & Frank, 2017). Yet integration of TPEP implementation with other initiatives was in some cases challenging due to the timing of moving staff to the new evaluation. A high school English teacher explained, “The same year I was on the comprehensive evaluation, I was also part of a team working with professional development in the building. We were kind of trying to connect 5D and Common Core, but that was really difficult because so many people weren’t on the evaluation system yet.”
16 Common Core State Standards (CCSS) and Next Generation Science Standards (NGSS) initiatives had a similar implementation timeline to TPEP. While 65% of the 223 districts participating in iGrant 664 Funding in 2015-15 indicated in their application that content plans included connections between TPEP and CCSS, only 12% specifically called this out in the written description of their plans.
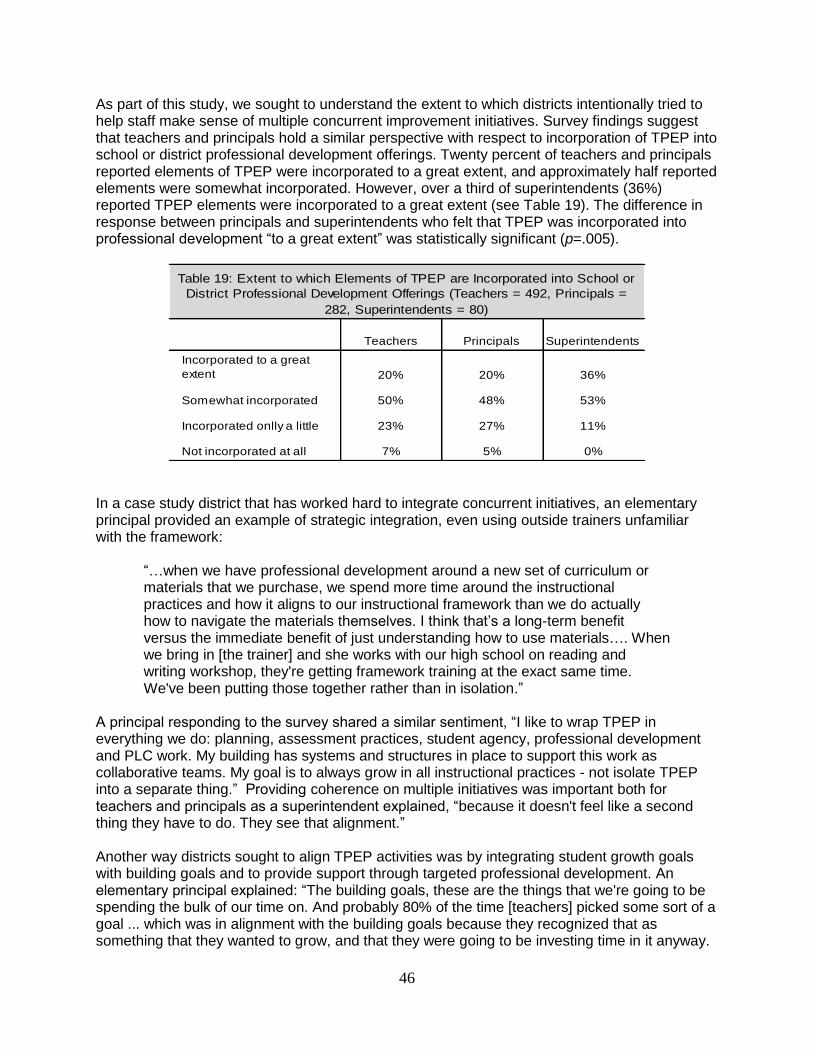
46
As part of this study, we sought to understand the extent to which districts intentionally tried to help staff make sense of multiple concurrent improvement initiatives. Survey findings suggest that teachers and principals hold a similar perspective with respect to incorporation of TPEP into school or district professional development offerings. Twenty percent of teachers and principals reported elements of TPEP were incorporated to a great extent, and approximately half reported elements were somewhat incorporated. However, over a third of superintendents (36%) reported TPEP elements were incorporated to a great extent (see Table 19). The difference in response between principals and superintendents who felt that TPEP was incorporated into professional development “to a great extent” was statistically significant (p=.005).
Teachers Principals Superintendents
Incorporated to a great
extent 20% 20% 36%
Somewhat incorporated 50% 48% 53%
Incorporated onlly a little 23% 27% 11%
Not incorporated at all 7% 5% 0%
Table 19: Extent to which Elements of TPEP are Incorporated into School or
District Professional Development Offerings (Teachers = 492, Principals =
282, Superintendents = 80)
In a case study district that has worked hard to integrate concurrent initiatives, an elementary principal provided an example of strategic integration, even using outside trainers unfamiliar with the framework: “…when we have professional development around a new set of curriculum or
materials that we purchase, we spend more time around the instructional practices and how it aligns to our instructional framework than we do actually how to navigate the materials themselves. I think that’s a long-term benefit versus the immediate benefit of just understanding how to use materials…. When we bring in [the trainer] and she works with our high school on reading and writing workshop, they're getting framework training at the exact same time. We've been putting those together rather than in isolation.”
A principal responding to the survey shared a similar sentiment, “I like to wrap TPEP in everything we do: planning, assessment practices, student agency, professional development and PLC work. My building has systems and structures in place to support this work as collaborative teams. My goal is to always grow in all instructional practices - not isolate TPEP into a separate thing.” Providing coherence on multiple initiatives was important both for teachers and principals as a superintendent explained, “because it doesn't feel like a second thing they have to do. They see that alignment.” Another way districts sought to align TPEP activities was by integrating student growth goals with building goals and to provide support through targeted professional development. An elementary principal explained: “The building goals, these are the things that we're going to be spending the bulk of our time on. And probably 80% of the time [teachers] picked some sort of a goal ... which was in alignment with the building goals because they recognized that as something that they wanted to grow, and that they were going to be investing time in it anyway.

47
So there was more alignment of staff goals with building goals. And our building goals are developed very collaboratively... it increased the follow-through all year long with what our work was for the year.” Other districts continued to struggle to integrate the instructional framework with other initiatives. A district coordinator explained: “I feel like I am constantly in an uphill battle to make sure that every initiative that comes out has TPEP as part of it. I'm always like that broken record, ‘Wait, wait, what about TPEP?’ Or even like, ‘What about Danielson? Danielson learning, instructional framework, why is that not our umbrella?’ So I would say I don't feel like as a district we've gotten to the point where we've said Danielson is our umbrella, this is our instructional framework, any new initiative we have connects back to Danielson.” An important aspect of integration was working with the teachers’ association.
Relationship to Associations Given the critical role that teachers’ associations play in the teacher evaluation process, superintendents surveyed were asked about the impact that the new evaluation system has had on the relationship between their district and the teachers’ association. Forty-four percent of survey respondents indicated that TPEP has had a very positive or somewhat positive impact on this relationship. Another 44% reported that it has had no impact, and 13% stated it has had a somewhat or very negative impact on the relationship. Case study findings suggest that, for most districts, early conversations with teachers’ associations proved critical to productive engagement in the TPEP implementation process. As one superintendent shared, “We had some really good conversations about how we wanted to roll this out.
And it also brought to the table with us at the time, our union president and two or three teachers that they had picked. So it helped us get through that initial, ‘The district's trying to do this to us.’ Instead, it was the district and the association working together to improve what we do to support teachers. And we really approached that from a growth perspective rather than a, ‘Here's a way to get rid of some teachers.’ And I think that was really important.”
One case study district had an unusual relationship to the teachers’ association. The superintendent describes it in the following way: “We're unique because of our relationship with our union and the union president
being our trainer for our administrators, I don't know how many districts have that. If you can have that it's been wonderful, I think. Principals learning from teachers and teachers learning from principals. TPEP has given the opportunity for us to do that and it's been really, really powerful. I think teachers have learned a lot more about what it means to be a principal and principals have learned a lot about what it means to be a teacher now. There's some mutual respect between the two that – it wasn't like it wasn't there before but there is an opportunity, if done right, to really develop that respect.”
Another example of collaborative efforts between the district and the teachers’ association is found in a case study district that uses a joint professional development committee run by a district administrator and the leader of the teachers’ association. Through this committee, professional development offerings are evaluated and recommendations about possible changes and modifications made. The majority of the professional development offerings are

48
created and offered by teachers, many of which are connected to issues related to TPEP, such as goal setting and evidence collection. Generally speaking, the case study districts have developed a number of ways to work productively with their teachers’ associations regarding TPEP-related matters. However, it is important to note that these districts are not statistically representative of all districts in the state, and our survey findings described about indicate that some districts have not experienced positive impacts on the relationship with teachers’ associations as a result of TPEP implementation.
Data Management and Use The teacher and principal evaluation process generates a considerable number of documents and data, which districts need to efficiently manage, store and share for a variety of purposes. These purposes include complying with state and district requirements, informing professional development and human resource decisions, and informing progress on meeting district and school goals aimed at improving student learning. Technological tools have played a role in the initial implementation of TPEP, including the use of eVAL and other electronic tools that have been made available. In this section, we examine the ongoing development and use of eVAL and other electronic tools to support the evaluation process, and describe district practices regarding data management and use. We also sought to understand the ways in which some districts have been able to integrate TPEP data with other district data for professional development and human resource purposes. Washington districts and schools have made a variety of decisions with regard to which electronic tools are used and where evaluation data is stored and managed. Districts vary in their selection of tools, with some districts adopting particular electronic tools that are used consistently across the district, while other districts allow for flexibility in this regard. It is also the case that in some schools and districts, some kinds of data are not primarily managed electronically. Additionally, in some districts, documents are stored and data managed at the building and individual level. In other districts, at least a portion of the data is managed at the district office.
Choice of Electronic Tools All of our survey respondents were asked about their use of electronic tools to support the evaluation process this year. Approximately one-third (34%) of teachers and 17% of principals responded that they did not use any electronic tools for the evaluation. A higher proportion of teachers who reported that they did not use any electronic tools were more experienced, as 40% of teachers with 15 or more years of experience stating they did not use any electronic tools compared to only 27% of teachers with 4 years of experience or less. Responses to the same survey item in 2015 indicate that the percentage of teachers and school administrators who did not use any electronic tools has decreased. In 2015, 44% of teachers and 26% of principals reported not using any electronic tools. Data from the School Employee Evaluation Survey (SEES) also points to a decrease in the proportion of districts that do not use electronic systems for managing evaluation data. In the 2013-14 school year, 45% of districts reported that they did not use an electronic system, compared to 39% in 2014-15 and 35% in 2015-16 (Elfers & Achberger, 2017). Among the
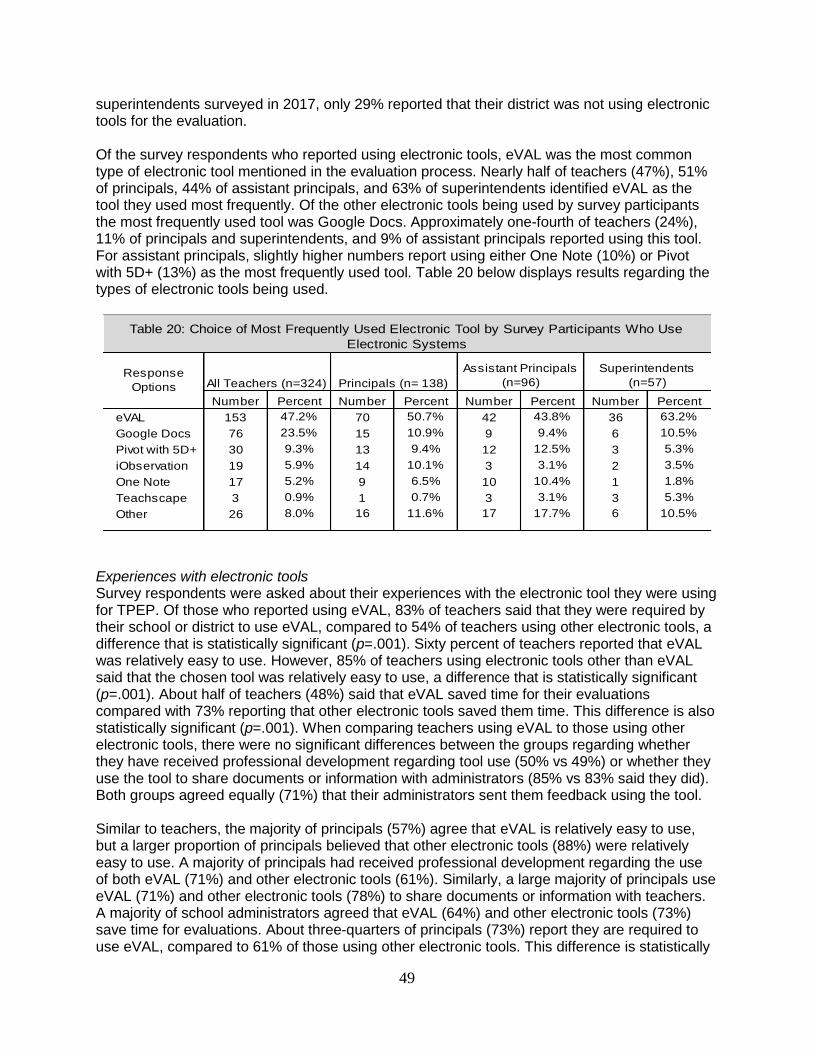
49
superintendents surveyed in 2017, only 29% reported that their district was not using electronic tools for the evaluation. Of the survey respondents who reported using electronic tools, eVAL was the most common type of electronic tool mentioned in the evaluation process. Nearly half of teachers (47%), 51% of principals, 44% of assistant principals, and 63% of superintendents identified eVAL as the tool they used most frequently. Of the other electronic tools being used by survey participants the most frequently used tool was Google Docs. Approximately one-fourth of teachers (24%), 11% of principals and superintendents, and 9% of assistant principals reported using this tool. For assistant principals, slightly higher numbers report using either One Note (10%) or Pivot with 5D+ (13%) as the most frequently used tool. Table 20 below displays results regarding the types of electronic tools being used.
Number Percent Number Percent Number Percent Number Percent
eVAL 153 47.2% 70 50.7% 42 43.8% 36 63.2%
Google Docs 76 23.5% 15 10.9% 9 9.4% 6 10.5%
Pivot with 5D+ 30 9.3% 13 9.4% 12 12.5% 3 5.3%
iObservation 19 5.9% 14 10.1% 3 3.1% 2 3.5%
One Note 17 5.2% 9 6.5% 10 10.4% 1 1.8%
Teachscape 3 0.9% 1 0.7% 3 3.1% 3 5.3%
Other 26 8.0% 16 11.6% 17 17.7% 6 10.5%
Table 20: Choice of Most Frequently Used Electronic Tool by Survey Participants Who Use
Electronic Systems
Response
Options All Teachers (n=324) Principals (n= 138)
Assistant Principals
(n=96)
Superintendents
(n=57)
Experiences with electronic tools Survey respondents were asked about their experiences with the electronic tool they were using for TPEP. Of those who reported using eVAL, 83% of teachers said that they were required by their school or district to use eVAL, compared to 54% of teachers using other electronic tools, a difference that is statistically significant (p=.001). Sixty percent of teachers reported that eVAL was relatively easy to use. However, 85% of teachers using electronic tools other than eVAL said that the chosen tool was relatively easy to use, a difference that is statistically significant (p=.001). About half of teachers (48%) said that eVAL saved time for their evaluations compared with 73% reporting that other electronic tools saved them time. This difference is also statistically significant (p=.001). When comparing teachers using eVAL to those using other electronic tools, there were no significant differences between the groups regarding whether they have received professional development regarding tool use (50% vs 49%) or whether they use the tool to share documents or information with administrators (85% vs 83% said they did). Both groups agreed equally (71%) that their administrators sent them feedback using the tool. Similar to teachers, the majority of principals (57%) agree that eVAL is relatively easy to use, but a larger proportion of principals believed that other electronic tools (88%) were relatively easy to use. A majority of principals had received professional development regarding the use of both eVAL (71%) and other electronic tools (61%). Similarly, a large majority of principals use eVAL (71%) and other electronic tools (78%) to share documents or information with teachers. A majority of school administrators agreed that eVAL (64%) and other electronic tools (73%) save time for evaluations. About three-quarters of principals (73%) report they are required to use eVAL, compared to 61% of those using other electronic tools. This difference is statistically
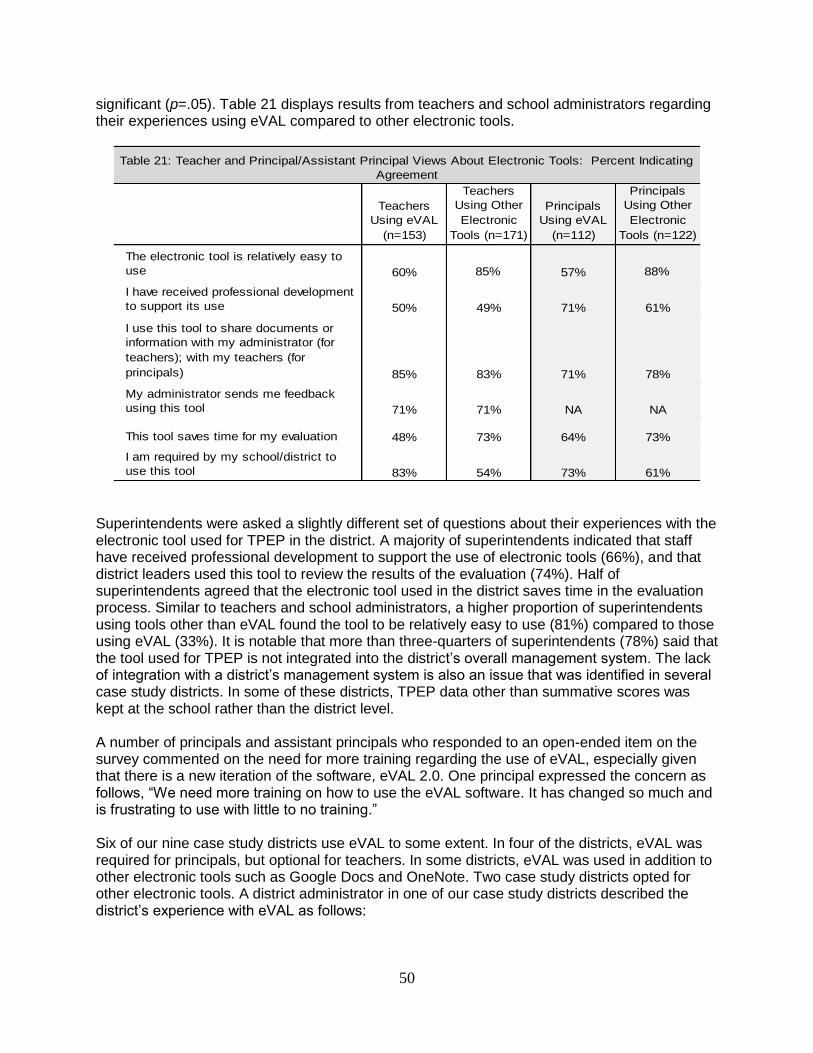
50
significant (p=.05). Table 21 displays results from teachers and school administrators regarding their experiences using eVAL compared to other electronic tools.
Teachers
Using eVAL
(n=153)
Teachers
Using Other
Electronic
Tools (n=171)
Principals
Using eVAL
(n=112)
Principals
Using Other
Electronic
Tools (n=122)
The electronic tool is relatively easy to
use 60% 85% 57% 88%
I have received professional development
to support its use 50% 49% 71% 61%
I use this tool to share documents or
information with my administrator (for
teachers); with my teachers (for
principals) 85% 83% 71% 78%
My administrator sends me feedback
using this tool 71% 71% NA NA
This tool saves time for my evaluation 48% 73% 64% 73%
I am required by my school/district to
use this tool 83% 54% 73% 61%
Table 21: Teacher and Principal/Assistant Principal Views About Electronic Tools: Percent Indicating
Agreement
Superintendents were asked a slightly different set of questions about their experiences with the electronic tool used for TPEP in the district. A majority of superintendents indicated that staff have received professional development to support the use of electronic tools (66%), and that district leaders used this tool to review the results of the evaluation (74%). Half of superintendents agreed that the electronic tool used in the district saves time in the evaluation process. Similar to teachers and school administrators, a higher proportion of superintendents using tools other than eVAL found the tool to be relatively easy to use (81%) compared to those using eVAL (33%). It is notable that more than three-quarters of superintendents (78%) said that the tool used for TPEP is not integrated into the district’s overall management system. The lack of integration with a district’s management system is also an issue that was identified in several case study districts. In some of these districts, TPEP data other than summative scores was kept at the school rather than the district level. A number of principals and assistant principals who responded to an open-ended item on the survey commented on the need for more training regarding the use of eVAL, especially given that there is a new iteration of the software, eVAL 2.0. One principal expressed the concern as follows, “We need more training on how to use the eVAL software. It has changed so much and is frustrating to use with little to no training.” Six of our nine case study districts use eVAL to some extent. In four of the districts, eVAL was required for principals, but optional for teachers. In some districts, eVAL was used in addition to other electronic tools such as Google Docs and OneNote. Two case study districts opted for other electronic tools. A district administrator in one of our case study districts described the district’s experience with eVAL as follows:
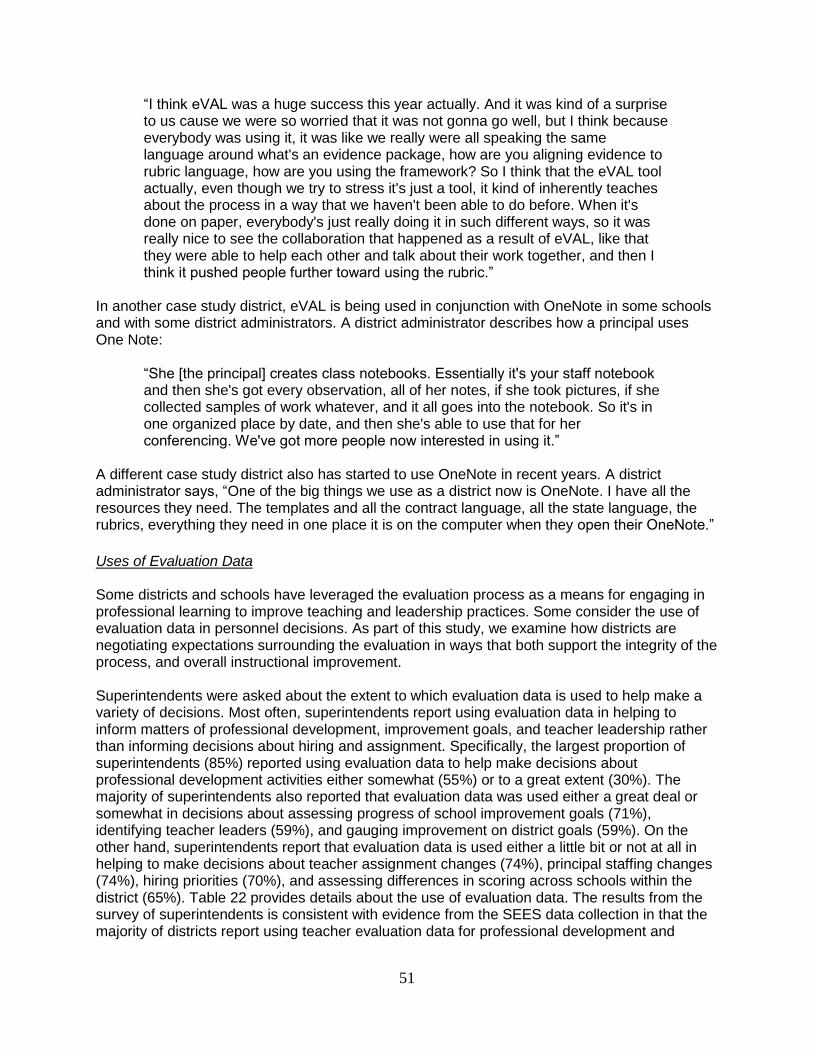
51
“I think eVAL was a huge success this year actually. And it was kind of a surprise to us cause we were so worried that it was not gonna go well, but I think because everybody was using it, it was like we really were all speaking the same language around what's an evidence package, how are you aligning evidence to rubric language, how are you using the framework? So I think that the eVAL tool actually, even though we try to stress it's just a tool, it kind of inherently teaches about the process in a way that we haven't been able to do before. When it's done on paper, everybody's just really doing it in such different ways, so it was really nice to see the collaboration that happened as a result of eVAL, like that they were able to help each other and talk about their work together, and then I think it pushed people further toward using the rubric.”
In another case study district, eVAL is being used in conjunction with OneNote in some schools and with some district administrators. A district administrator describes how a principal uses One Note: “She [the principal] creates class notebooks. Essentially it's your staff notebook
and then she's got every observation, all of her notes, if she took pictures, if she collected samples of work whatever, and it all goes into the notebook. So it's in one organized place by date, and then she's able to use that for her conferencing. We've got more people now interested in using it.”
A different case study district also has started to use OneNote in recent years. A district administrator says, “One of the big things we use as a district now is OneNote. I have all the resources they need. The templates and all the contract language, all the state language, the rubrics, everything they need in one place it is on the computer when they open their OneNote.”
Uses of Evaluation Data Some districts and schools have leveraged the evaluation process as a means for engaging in professional learning to improve teaching and leadership practices. Some consider the use of evaluation data in personnel decisions. As part of this study, we examine how districts are negotiating expectations surrounding the evaluation in ways that both support the integrity of the process, and overall instructional improvement. Superintendents were asked about the extent to which evaluation data is used to help make a variety of decisions. Most often, superintendents report using evaluation data in helping to inform matters of professional development, improvement goals, and teacher leadership rather than informing decisions about hiring and assignment. Specifically, the largest proportion of superintendents (85%) reported using evaluation data to help make decisions about professional development activities either somewhat (55%) or to a great extent (30%). The majority of superintendents also reported that evaluation data was used either a great deal or somewhat in decisions about assessing progress of school improvement goals (71%), identifying teacher leaders (59%), and gauging improvement on district goals (59%). On the other hand, superintendents report that evaluation data is used either a little bit or not at all in helping to make decisions about teacher assignment changes (74%), principal staffing changes (74%), hiring priorities (70%), and assessing differences in scoring across schools within the district (65%). Table 22 provides details about the use of evaluation data. The results from the survey of superintendents is consistent with evidence from the SEES data collection in that the majority of districts report using teacher evaluation data for professional development and
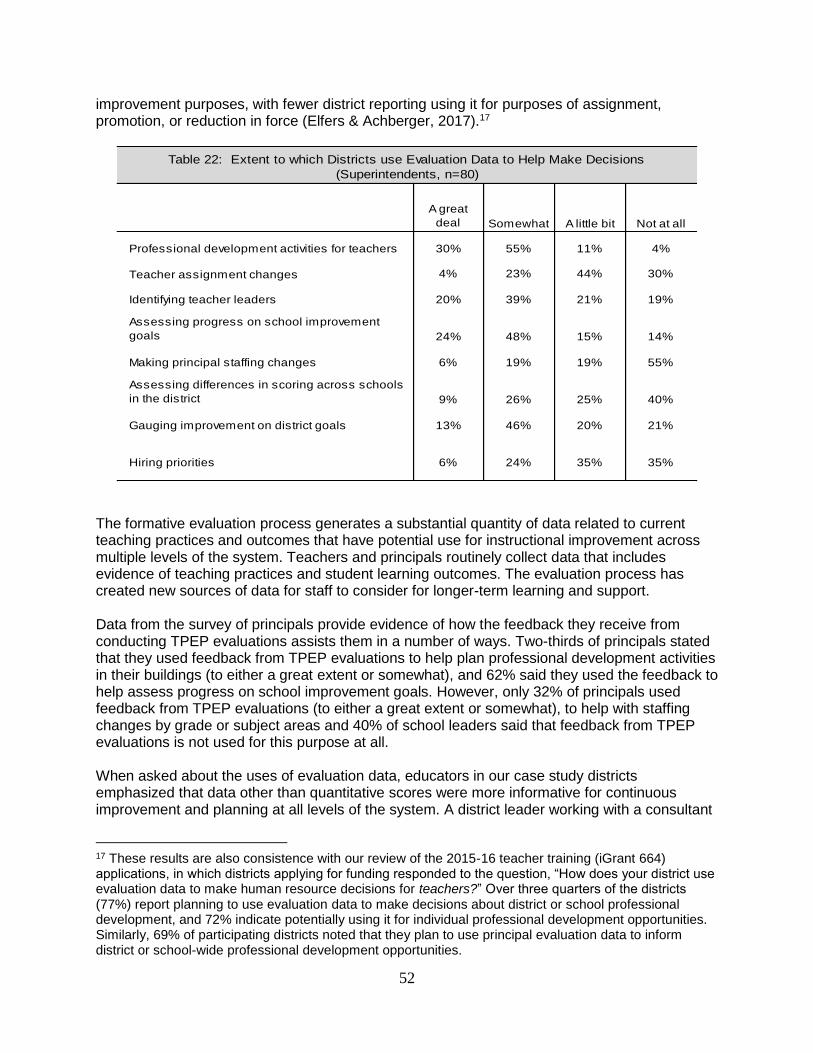
52
improvement purposes, with fewer district reporting using it for purposes of assignment, promotion, or reduction in force (Elfers & Achberger, 2017).17
Professional development activities for teachers 30% 55% 11% 4%
Teacher assignment changes 4% 23% 44% 30%
Identifying teacher leaders 20% 39% 21% 19%
Assessing progress on school improvement
goals 24% 48% 15% 14%
Making principal staffing changes 6% 19% 19% 55%
Assessing differences in scoring across schools
in the district 9% 26% 25% 40%
Gauging improvement on district goals 13% 46% 20% 21%
Hiring priorities 6% 24% 35% 35%
Table 22: Extent to which Districts use Evaluation Data to Help Make Decisions
(Superintendents, n=80)
A great
deal Somewhat A little bit Not at all
The formative evaluation process generates a substantial quantity of data related to current teaching practices and outcomes that have potential use for instructional improvement across multiple levels of the system. Teachers and principals routinely collect data that includes evidence of teaching practices and student learning outcomes. The evaluation process has created new sources of data for staff to consider for longer-term learning and support. Data from the survey of principals provide evidence of how the feedback they receive from conducting TPEP evaluations assists them in a number of ways. Two-thirds of principals stated that they used feedback from TPEP evaluations to help plan professional development activities in their buildings (to either a great extent or somewhat), and 62% said they used the feedback to help assess progress on school improvement goals. However, only 32% of principals used feedback from TPEP evaluations (to either a great extent or somewhat), to help with staffing changes by grade or subject areas and 40% of school leaders said that feedback from TPEP evaluations is not used for this purpose at all. When asked about the uses of evaluation data, educators in our case study districts emphasized that data other than quantitative scores were more informative for continuous improvement and planning at all levels of the system. A district leader working with a consultant
17 These results are also consistence with our review of the 2015-16 teacher training (iGrant 664) applications, in which districts applying for funding responded to the question, “How does your district use evaluation data to make human resource decisions for teachers?” Over three quarters of the districts (77%) report planning to use evaluation data to make decisions about district or school professional development, and 72% indicate potentially using it for individual professional development opportunities. Similarly, 69% of participating districts noted that they plan to use principal evaluation data to inform district or school-wide professional development opportunities.

53
on district improvement explained, “one of the things that [the consultant] is really pushing us on is how we get instructional data? Not just a number. Not just a teacher's quantitative outcome but how can we take artifacts that are uploaded…or other kinds of data that we have that actually give voice to what a teacher is doing, and use that information to inform where we need to go. It's not going to be easy to figure that out.” One case study district has responded to the challenge of using a variety of forms of data by establishing an interface with a data management tool for TPEP for every teacher. The system is set up such that principals can set up files for teachers, or teachers can go in and store artifacts and other forms of evidence in the system. A middle school principal explains, “District wide, school wide, [we are] working to see our focus as a district, so that's one of the things that we're able to do now that we weren't able to do before…. That's a nice, easy outcome of this new interface.” Another district administrator in a case study district noted how scoring can sometimes impede the learning process that is underway and explained, “You hear principals talk about it. They're having a great conversation with a teacher about their practice, what they're working on, what they're trying, and the minute it gets to the scoring part, it just throws a blanket over the whole thing because it's arbitrary and highly subjective and unnecessary really ... You can describe good practice with words, you don't need to assign a number to it.”
Analysis of District and School Summative and Criterion Scores Although the TPEP process generates a variety of types of data, in this study we devoted specific attention to data generated from the scoring process itself. The final summative scoring process provides a single number for each teacher and administrator. In order to generate the single number, scoring occurs at the criterion level within the rubrics. The integrity of the scoring process is dependent upon expectations that allow for professional growth. Collectively, across staff within a district, the scores from the rubrics can be used to identify areas in which staff may need further training to improve instructional practice. TPEP centers around eight statewide evaluative criteria for quality teaching (the “State Eight”). The instructional framework chosen by the district is intended to be the mechanism for the analysis of instruction, and the scoring rubrics serve to organize and quantify the evidence gathered. Teachers on provisional or probationary status must be evaluated on the comprehensive evaluation, meaning that the evaluation must assess all of the state’s eight criteria in developing the evaluation rating. A focused evaluation includes an assessment of one of the eight criteria selected for a performance rating plus professional growth activities specifically linked to the selected criterion. Scores from the eight criteria are known as criterion scores, which are combined into overall evaluation results known as summative scores. Districts report summative scores, but not criterion scores, to OSPI. In this study, we requested de-identified summative and criterion scores from each of our case study districts.
a. Data Received from Districts Four of our case study districts voluntarily agreed to provide de-identified TPEP summative and criterion scores for the 2015-16 school year. We also requested that de-identified scores be aggregated and organized by elementary, middle and high school levels, if possible. As shown
54
in the table below, the specific data shared with us and its format varied widely across the four districts, illuminating differences in the ways districts collect, manage, and use these score data. Three districts (1, 2, and 4) provided summative results from teacher evaluation; two of these also provided State Eight criterion scores. District 2 provided additional breakdowns of the student growth criteria (3, 6, and 8). Districts 1, 2, and 4 provided teacher-level data; that is, scores were provided for each teacher, with all personal identifiers removed. The data provided by District 3 were not at the teacher level. Instead, we received scores for each of the State Eight criterion summarized as counts of ratings at each level (unsatisfactory through distinguished), both districtwide and by grade level (elementary, middle, and high school). This presented two limitations for the analysis. First, the criterion scores could not be combined into criterion or summative scores for comparison with the other districts. Second, the criterion scores could be compared by grade level, but not by type of evaluation (comprehensive or focused). Table 23 below summarizes the type of data provided by each participating district.
District 1
2013/14
2014/15
2015/16 X
District 2 2015/16 X X X
District 3 2015/16 X1
District 4 2015/16 X X2
1 Not teacher-level data
2 Includes summaries for 2013/14 and 2014/15
Table 23: Summative and Criterion Scores Provided by
Participating Districts
School
Years Summative
State 8
Criterion
Scores
Student
Growth
b. Analysis of Summative Scores Three districts provided summative scores for 2015-16. In all three, a higher proportion of teachers on a comprehensive evaluation were rated as basic or proficient, and a lower proportion were rated as distinguished than those on a focused evaluation. This is consistent with the pattern in statewide summative scores for 2015-16 (Elfers & Achberger, 2017), and likely reflects the fact that teachers on provisional or probationary status must be evaluated on the comprehensive evaluation, and consequently are less experienced. Table 24 summarizes the data for each district.
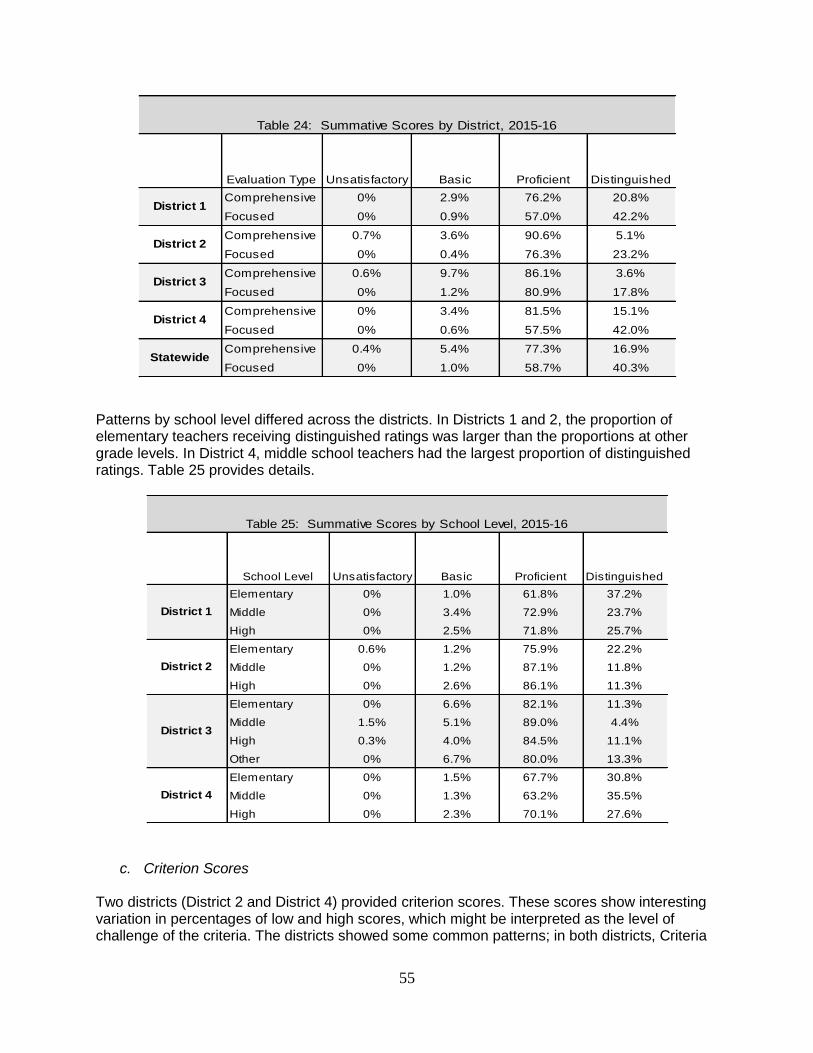
55
Comprehensive 0% 2.9% 76.2% 20.8%
Focused 0% 0.9% 57.0% 42.2%
Comprehensive 0.7% 3.6% 90.6% 5.1%
Focused 0% 0.4% 76.3% 23.2%
Comprehensive 0.6% 9.7% 86.1% 3.6%
Focused 0% 1.2% 80.9% 17.8%
Comprehensive 0% 3.4% 81.5% 15.1%
Focused 0% 0.6% 57.5% 42.0%
Comprehensive 0.4% 5.4% 77.3% 16.9%
Focused 0% 1.0% 58.7% 40.3%
District 4
Statewide
Distinguished
Table 24: Summative Scores by District, 2015-16
District 1
District 2
District 3
Evaluation Type Unsatisfactory Basic Proficient
Patterns by school level differed across the districts. In Districts 1 and 2, the proportion of elementary teachers receiving distinguished ratings was larger than the proportions at other grade levels. In District 4, middle school teachers had the largest proportion of distinguished ratings. Table 25 provides details.
Elementary 0% 1.0% 61.8% 37.2%
Middle 0% 3.4% 72.9% 23.7%
High 0% 2.5% 71.8% 25.7%
Elementary 0.6% 1.2% 75.9% 22.2%
Middle 0% 1.2% 87.1% 11.8%
High 0% 2.6% 86.1% 11.3%
Elementary 0% 6.6% 82.1% 11.3%
Middle 1.5% 5.1% 89.0% 4.4%
High 0.3% 4.0% 84.5% 11.1%
Other 0% 6.7% 80.0% 13.3%
Elementary 0% 1.5% 67.7% 30.8%
Middle 0% 1.3% 63.2% 35.5%
High 0% 2.3% 70.1% 27.6%
District 1
District 2
District 3
District 4
Table 25: Summative Scores by School Level, 2015-16
School Level Unsatisfactory Basic Proficient Distinguished
c. Criterion Scores Two districts (District 2 and District 4) provided criterion scores. These scores show interesting variation in percentages of low and high scores, which might be interpreted as the level of challenge of the criteria. The districts showed some common patterns; in both districts, Criteria

56
2 and 3 were challenging (with relatively high percentages of evaluations below proficient), while Criteria 1 and 8 were less challenging (with relatively high percentages of distinguished ratings). However, Criterion 6 appears to have been more challenging relative to other criteria in District 2 than it was in District 4 (See Table 26).
% below
Proficient % Proficient
%
Distinguished
% below
Proficient % Proficient
%
Distinguished
1: Centering instruction on
high expectations for student
achievement 4.8% 77.2% 17.9% 1.8% 72.1% 26.1%
2: Demonstrating effective
teaching practices 5.5% 86.2% 8.3% 8.4% 75.7% 15.9%
3: Recognizing individual
student learning needs and
developing strategies to
address those needs 6.1% 79.3% 14.6% 5.0% 75.9% 19.1%
4: Providing clear and
intentional focus on subject
matter content and curriculum 4.4% 84.4% 11.3% 4.7% 78.3% 17.0%
5: Fostering and managing
safe, positive learning
environment 4.3% 77.1% 18.6% 3.8% 76.0% 20.2%
6: Using multiple student data
elements to modify instruction
and improve student learning 5.8% 79.0% 14.8% 3.9% 73.5% 22.6%
7: Communicating and
collaborating with parents and
the school community 4.0% 85.2% 10.7% 3.7% 75.7% 20.6%
8: Exhibiting collaborative and
collegial practices focused on
improving instructional practice
and student learning 3.4% 80.4% 16.2% 0.6% 76.3% 23.1%
District 4
Table 26: Criterion Scores for Two Districts
Criterion
District 2
As noted previously, District 3 did not provide teacher-level data. Instead, we received results for each sub-criterion of each of the State Eight, summarized as counts of ratings at each level. Below we summarize the total percentage of ratings at each level for each criterion. Note that these data are not comparable to those for Districts 2 and 4 in the previous table (Table 26). This is because details of scores were not provided for individual teachers, and therefore cannot be combined into criterion scores for comparison. A pattern for District 3 is that the criteria generally showed lower ratings for teachers in middle school than for those in elementary or high school. Table 27 provides details.
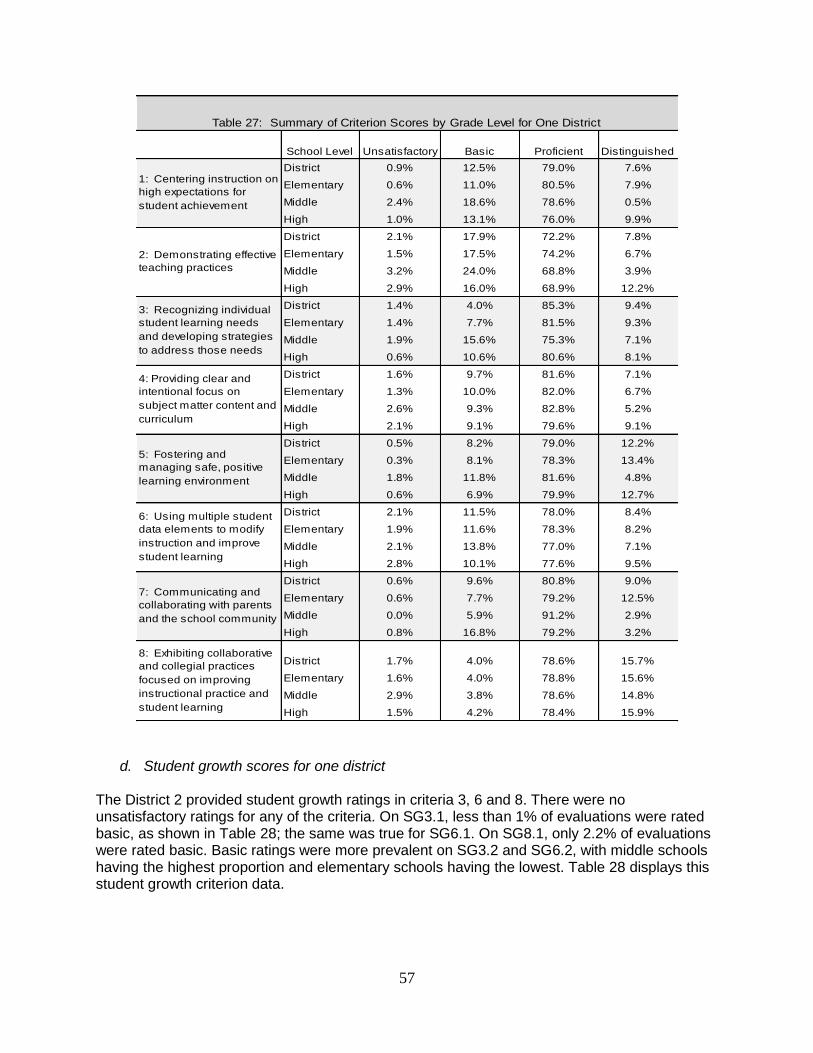
57
District 0.9% 12.5% 79.0% 7.6%
Elementary 0.6% 11.0% 80.5% 7.9%
Middle 2.4% 18.6% 78.6% 0.5%
High 1.0% 13.1% 76.0% 9.9%
District 2.1% 17.9% 72.2% 7.8%
Elementary 1.5% 17.5% 74.2% 6.7%
Middle 3.2% 24.0% 68.8% 3.9%
High 2.9% 16.0% 68.9% 12.2%
District 1.4% 4.0% 85.3% 9.4%
Elementary 1.4% 7.7% 81.5% 9.3%
Middle 1.9% 15.6% 75.3% 7.1%
High 0.6% 10.6% 80.6% 8.1%
District 1.6% 9.7% 81.6% 7.1%
Elementary 1.3% 10.0% 82.0% 6.7%
Middle 2.6% 9.3% 82.8% 5.2%
High 2.1% 9.1% 79.6% 9.1%
District 0.5% 8.2% 79.0% 12.2%
Elementary 0.3% 8.1% 78.3% 13.4%
Middle 1.8% 11.8% 81.6% 4.8%
High 0.6% 6.9% 79.9% 12.7%
District 2.1% 11.5% 78.0% 8.4%
Elementary 1.9% 11.6% 78.3% 8.2%
Middle 2.1% 13.8% 77.0% 7.1%
High 2.8% 10.1% 77.6% 9.5%
District 0.6% 9.6% 80.8% 9.0%
Elementary 0.6% 7.7% 79.2% 12.5%
Middle 0.0% 5.9% 91.2% 2.9%
High 0.8% 16.8% 79.2% 3.2%
District 1.7% 4.0% 78.6% 15.7%
Elementary 1.6% 4.0% 78.8% 15.6%
Middle 2.9% 3.8% 78.6% 14.8%
High 1.5% 4.2% 78.4% 15.9%
Table 27: Summary of Criterion Scores by Grade Level for One District
School Level Unsatisfactory Basic Proficient Distinguished
7: Communicating and
collaborating with parents
and the school community
8: Exhibiting collaborative
and collegial practices
focused on improving
instructional practice and
student learning
1: Centering instruction on
high expectations for
student achievement
2: Demonstrating effective
teaching practices
3: Recognizing individual
student learning needs
and developing strategies
to address those needs
4: Providing clear and
intentional focus on
subject matter content and
curriculum
5: Fostering and
managing safe, positive
learning environment
6: Using multiple student
data elements to modify
instruction and improve
student learning
d. Student growth scores for one district The District 2 provided student growth ratings in criteria 3, 6 and 8. There were no unsatisfactory ratings for any of the criteria. On SG3.1, less than 1% of evaluations were rated basic, as shown in Table 28; the same was true for SG6.1. On SG8.1, only 2.2% of evaluations were rated basic. Basic ratings were more prevalent on SG3.2 and SG6.2, with middle schools having the highest proportion and elementary schools having the lowest. Table 28 displays this student growth criterion data.
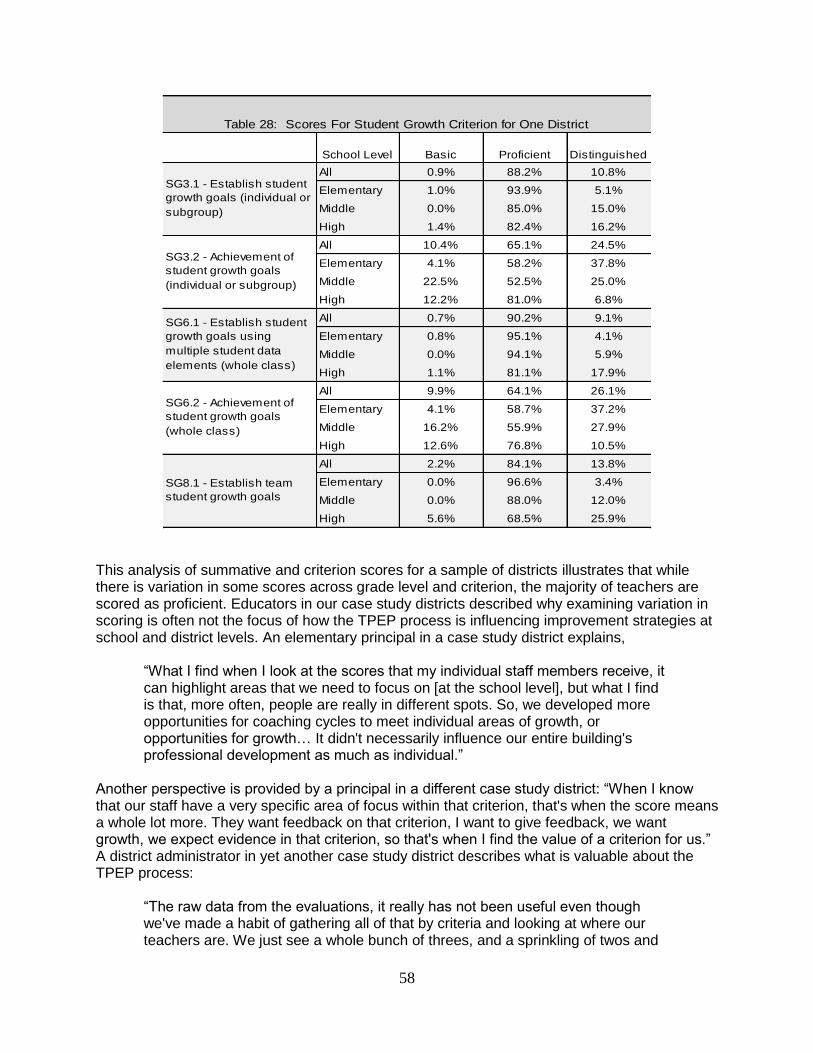
58
All 0.9% 88.2% 10.8%
Elementary 1.0% 93.9% 5.1%
Middle 0.0% 85.0% 15.0%
High 1.4% 82.4% 16.2%
All 10.4% 65.1% 24.5%
Elementary 4.1% 58.2% 37.8%
Middle 22.5% 52.5% 25.0%
High 12.2% 81.0% 6.8%
All 0.7% 90.2% 9.1%
Elementary 0.8% 95.1% 4.1%
Middle 0.0% 94.1% 5.9%
High 1.1% 81.1% 17.9%
All 9.9% 64.1% 26.1%
Elementary 4.1% 58.7% 37.2%
Middle 16.2% 55.9% 27.9%
High 12.6% 76.8% 10.5%
All 2.2% 84.1% 13.8%
Elementary 0.0% 96.6% 3.4%
Middle 0.0% 88.0% 12.0%
High 5.6% 68.5% 25.9%
Table 28: Scores For Student Growth Criterion for One District
School Level Basic Proficient Distinguished
SG3.1 - Establish student
growth goals (individual or
subgroup)
SG3.2 - Achievement of
student growth goals
(individual or subgroup)
SG6.1 - Establish student
growth goals using
multiple student data
elements (whole class)
SG6.2 - Achievement of
student growth goals
(whole class)
SG8.1 - Establish team
student growth goals
This analysis of summative and criterion scores for a sample of districts illustrates that while there is variation in some scores across grade level and criterion, the majority of teachers are scored as proficient. Educators in our case study districts described why examining variation in scoring is often not the focus of how the TPEP process is influencing improvement strategies at school and district levels. An elementary principal in a case study district explains, “What I find when I look at the scores that my individual staff members receive, it
can highlight areas that we need to focus on [at the school level], but what I find is that, more often, people are really in different spots. So, we developed more opportunities for coaching cycles to meet individual areas of growth, or opportunities for growth… It didn't necessarily influence our entire building's professional development as much as individual.”
Another perspective is provided by a principal in a different case study district: “When I know that our staff have a very specific area of focus within that criterion, that's when the score means a whole lot more. They want feedback on that criterion, I want to give feedback, we want growth, we expect evidence in that criterion, so that's when I find the value of a criterion for us.” A district administrator in yet another case study district describes what is valuable about the TPEP process: “The raw data from the evaluations, it really has not been useful even though
we've made a habit of gathering all of that by criteria and looking at where our teachers are. We just see a whole bunch of threes, and a sprinkling of twos and
59
a sprinkling of fours. The data from that doesn't really help to inform our professional learning, but like everything with TPEP, the conversations are where a lot of the value is, and so the conversations between principals and teachers that happen during evaluation conferences or just informally throughout the year, and in turn the conversations between principals and our leadership level, those conversations culminate... We would not have as rich of qualitative data to draw from if we weren't having the conversations that were necessarily because of TPEP.”
District Organizational Learning The implementation of TPEP was a learning curve for districts. Districts statewide started at different places depending on the extent to which they had some existing organizational capacity and their orientation as a learning organization. In some ways TPEP can be viewed as a barometer of the organization’s ability to adapt and productively engage staff in new ways of thinking about teaching and learning. While the changes were not easy, some case study districts and schools were in a better position to address the increasing demands on staff. For the most part, these districts and schools already had structures in place, like PLCs, or other collaborative learning spaces for teachers or principals that could be adapted to include TPEP-related activities. For them, TPEP was often an extension, and more formal expression, of what they were already doing, and as such, the instructional improvement agenda, though not less work, may have been less of a stretch for staff to comprehend. A secondary principal explains: “years ago before I think any of us were here, [the district]… had a program called creating a continuous culture of improvement... It has evolved into PLCs and RTI, and then TPEP….Those are things that have stuck.” It would be a mistake to conclude that implementing TPEP among the case study districts has been smooth or that there was uniformity across schools, even within districts with a strong orientation toward learning. Indeed, as we discussed earlier, the ability to take up TPEP in productive ways remains largely a leadership issue, one that is borne most heavily by school principals. Even among districts and schools that have weathered the required changes in productive ways, there remains a genuine concern and conversation among leaders around the sustainability of the initiative. Nearly four-fifths (79%) of superintendents responding to the survey stated that they believed district capacity to sustain TPEP over time was either a major (25%) or a moderate concern (54%). A self-reflective superintendent who has worked hard on TPEP acknowledged work yet to be done: “For me from a district level, we're moving forward toward system coherence to
do more with our admin. It's not about having the [teacher] PD or the time or the process. I think those things are in place. I think we've got teacher leaders to sustain the collaboration. We're going to sustain the [framework] leadership team, all those things ... but our next step, if we really want to sustain it, is we've got to expand the organizational capacity at the principal level and the superintendent. We've got to do a better job at that level.”
Other District Perspectives Leaders in larger districts described the push and pull of competing district commitments, especially when responsibilities are shared across departments. District leaders in one case study district concede that the system has gone backwards a bit this year. “Our systems aren't
60
nearly as good as they used to be. There's a combination of the HR taking over some of the responsibilities and then [we] are still in charge of certain responsibilities… so that's been a little disjointed.” Other district leaders worry that now the structures are in place, staff complacency may become a factor. A district leader explained: “I think that it has gone smoother every year since we began. It is actually to the
point now where we are ready to apply some different pressures to different parts of it. We think that it is time to do that because things are going smoothly, is also just that people have found ways to work around things in a very streamlined way. …Where I am right now in thinking about this is with complacency being the enemy right now and streamlining a process – over-streamlining, that's just human nature and it is how people are going to react to systems... The state has a new emphasis that they want Marzano to work on and incorporate, so I think some of the subtle updates and changes are healthy because it forces us to realize that we're professionals and that our field evolves and we grow. I think the danger would be that we just leave it alone and we have the same processes every year because I think that will just be a recipe for people doing less and less with it.”
In another case study district, a superintendent reflected on recent organizational changes associated with TPEP: “I think all in all, we know it's our system now and there's good things and bad
things to know in a system. Initially, as we've talked before, the startup of this really prompted some reflections on an individual level as teachers and administrators. Then at a systems level of how do you we move from an evaluation process that we needed for a long time that really wasn't all that helpful in terms of providing feedback for growth, and moving into a brand new system of the brand new framework and student growth and lots of new, new, new. It really captured our attention and focus and all of our professional learning was directed at that. Now we are four years later, or however far along on the journey a district is - I don't think complacency is the right word but you certainly aren't paying quite as much attention to it so there's some good things to that. Hopefully things are just flowing along. People are understanding what to do and they're using this as an opportunity to grow. There's some worry too that it's just become part of the routine and are we actually really pushing ourselves to use this as a process to get better at what we do and how we serve kids. For me, in my reflection in where we're at right now in the process, I'm excited to kind of almost revisit some things again next year that maybe we are assuming are happening.… As we do it, we're mindful about the outcomes we want, and is it a compliance outcome that we're looking for or is it truly an opportunity to reflect and slow down in the work, and prioritize what's most important for us in our own professional learning as we serve our students. I think maybe, as I reflect more on and try to respond to your question, it's more about revisiting the intentionality of the routines that we've created.”
Next, using our backward mapping strategy for policy analysis, we consider TPEP within the Washington state policy context.
61
State Level Mandates and Supports
State Policy Approaches to the Implementation of TPEP
Implementation of a state policy like TPEP can be understood through the lens of the policy instruments utilized to accomplish its goals. Policy instruments are the mechanisms that translate goals into concrete actions. In order to achieve TPEP’s policy objectives, resources, rules and authority have been brought to bear to influence the actions of individuals and institutions. When investigating TPEP, it is useful to consider the state policy instruments and approaches adopted, and the conditions under which they are most like to have a desired effect. Researchers have identified several types of policy instruments, three of which are relevant to the implementation of TPEP. They include mandates, inducements, and capacity building (McDonnell & Elmore, 1987). Mandates are the rules governing the policy, and have an expectation of compliance or adherence to proscribed rules. Inducements are the provision of resources, often monetary, to support adherence to a desired outcome. As McDonnell and Elmore write, “Mandates assume that the required action is something all individuals and agencies should be expected to do, regardless of their differing capacities, while inducements assume that individuals and agencies vary in their ability to produce things of value and that the transfer of money is one way to elicit performance” (1987, p. 139). Capacity building, however, understands that mandates and inducements may fail for lack of knowledge or skills, rather than an unwillingness to comply. The focus of capacity building is on the provision of resources toward longer term objectives, and is an investment in future benefits. In the discussion that follows, we discuss TPEP implementation through the lens of specific aspects of the state policy instruments.
TPEP’s Mandates and Flexibility While TPEP contains specific mandates, the implementation design also allowed for some district choice. For example, while districts were required to identify and use an instructional framework to support educator evaluation, districts were able to choose among three different frameworks. Many districts had prior experience with one framework, and so the flexibility allowed districts to continue working with that framework, or select a new framework that best met their needs. Flexibility in state policy design also provided districts with a variety of choices about how to gear up for full implementation of the policy over several years before they were required to use the TPEP system for all teachers. This allowed opportunity for districts to phase in implementation and focus on supporting educators in learning about the instructional framework and the TPEP process itself. A majority of superintendents (71%) and school administrators (64%) either strongly or somewhat agreed that they have the flexibility to implement TPEP in a way that worked best for their district or school, with only 10% of superintendents and 11% of school leaders strongly disagreeing. Results from the teacher survey indicated that less than one-tenth of teachers (9.2%) reported that they were either a little familiar (7.2%) or not familiar at all (2%) with the instructional framework used in their districts. The responses from teachers mirror the perspectives of administrators, as only 8% of superintendents and 6% of principals and assistant principals identified teacher knowledge of the instructional framework as a great challenge in their districts. Because state policy allowed for district choice among three approved frameworks, it is
62
sometimes the case that when educators move from one district to another, they may need to learn another framework. In our case study work, some districts reported that they try to hire new employees based in part on their familiarity with the district’s framework.
State Inducements to Support TPEP Implementation In TPEP implementation, inducements from the state have taken the form of pilot, RIG, and professional development grants (iGrants), as well as various supports from state and regional agencies. We would argue that inducements played a particularly important role in the early days of TPEP, and continue to play a role as districts seek additional support. The assumption behind inducements is that without additional resources, the policy goals put forward might not be attainable with the frequency or quality desired. Inducements also assume that districts and school vary in their capacity to implement the policy. However, the positive effects of inducements may be limited when capacity does not exist to sustain the desired outcomes over time. The majority of districts applied for and received i664 grants, and in earlier sections of this report, we discussed how districts were planning to use those funds. In our case study and survey work, we inquired about the extent to which services provided by ESDs are being used to support TPEP implementation. The majority of superintendents surveyed indicated that they used ESD services to provide professional development for teachers (66%) and principals (69%). Another 21% of superintendents indicated that they used ESD services to convene districts within their region. Only 15% of superintendents indicated that they did not use services provided by the ESD. Superintendents also responded that they sometimes use organizations other than the ESD to provide support, with 35% using services or events sponsored by OSPI, 22% using contracts with framework authors or representatives, 27% using the state’s principals’ association, and smaller numbers using university-based organizations (14%) or teachers’ associations (13%). More than a third of superintendents (34%) indicated that TPEP had either a very positive or somewhat positive impact on collaboration and cooperation with other districts, while 63% said it did not have an impact, either positive or negative. Even though state and regional agencies have provided supports, data from case study work and surveys indicate that there are areas where additional supports for TPEP implementation are needed. One superintendent who responded to the survey wrote, “With the number of new principals and teachers each year new to TPEP we are concerned about training opportunities to meet their needs if there is not continued state support.” A particular concern about sufficient support emerged from leaders in smaller districts who state they struggle with finding ways to provide adequate support. Another superintendent who responded to the survey described the issue as follows:
“The implementation difference between a larger district (plus 1,000 FTE) and a smaller district is significant. Having worked in both sizes during the implementation of TPEP it is substantially different. There is little or minimal recognition of this factor at OSPI. That is discouraging for smaller districts who carry the same instructional expectations, twice the workload, without support from state resources to compensate for the smaller sized district's resources.”
Superintendents who responded to the survey were asked to identify areas they would like to focus on if additional supports for TPEP implementation were available. About three-quarters of superintendents (74%) identified more supports for principals to lessen the workload as an area of major focus. Other major areas identified were additional time for teachers to work in PLCs
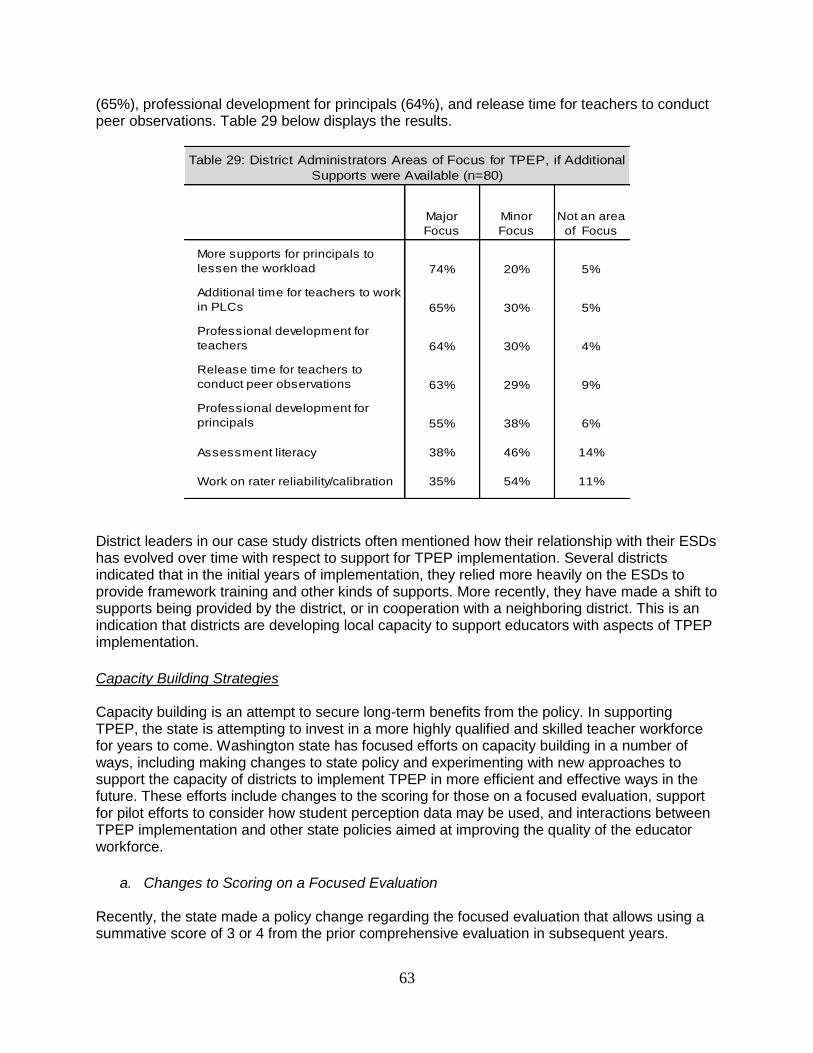
63
(65%), professional development for principals (64%), and release time for teachers to conduct peer observations. Table 29 below displays the results.
More supports for principals to
lessen the workload 74% 20% 5%
Additional time for teachers to work
in PLCs 65% 30% 5%
Professional development for
teachers 64% 30% 4%
Release time for teachers to
conduct peer observations 63% 29% 9%
Professional development for
principals 55% 38% 6%
Assessment literacy 38% 46% 14%
Work on rater reliability/calibration 35% 54% 11%
Table 29: District Administrators Areas of Focus for TPEP, if Additional
Supports were Available (n=80)
Major
Focus
Minor
Focus
Not an area
of Focus
District leaders in our case study districts often mentioned how their relationship with their ESDs has evolved over time with respect to support for TPEP implementation. Several districts indicated that in the initial years of implementation, they relied more heavily on the ESDs to provide framework training and other kinds of supports. More recently, they have made a shift to supports being provided by the district, or in cooperation with a neighboring district. This is an indication that districts are developing local capacity to support educators with aspects of TPEP implementation.
Capacity Building Strategies Capacity building is an attempt to secure long-term benefits from the policy. In supporting TPEP, the state is attempting to invest in a more highly qualified and skilled teacher workforce for years to come. Washington state has focused efforts on capacity building in a number of ways, including making changes to state policy and experimenting with new approaches to support the capacity of districts to implement TPEP in more efficient and effective ways in the future. These efforts include changes to the scoring for those on a focused evaluation, support for pilot efforts to consider how student perception data may be used, and interactions between TPEP implementation and other state policies aimed at improving the quality of the educator workforce.
a. Changes to Scoring on a Focused Evaluation Recently, the state made a policy change regarding the focused evaluation that allows using a summative score of 3 or 4 from the prior comprehensive evaluation in subsequent years.
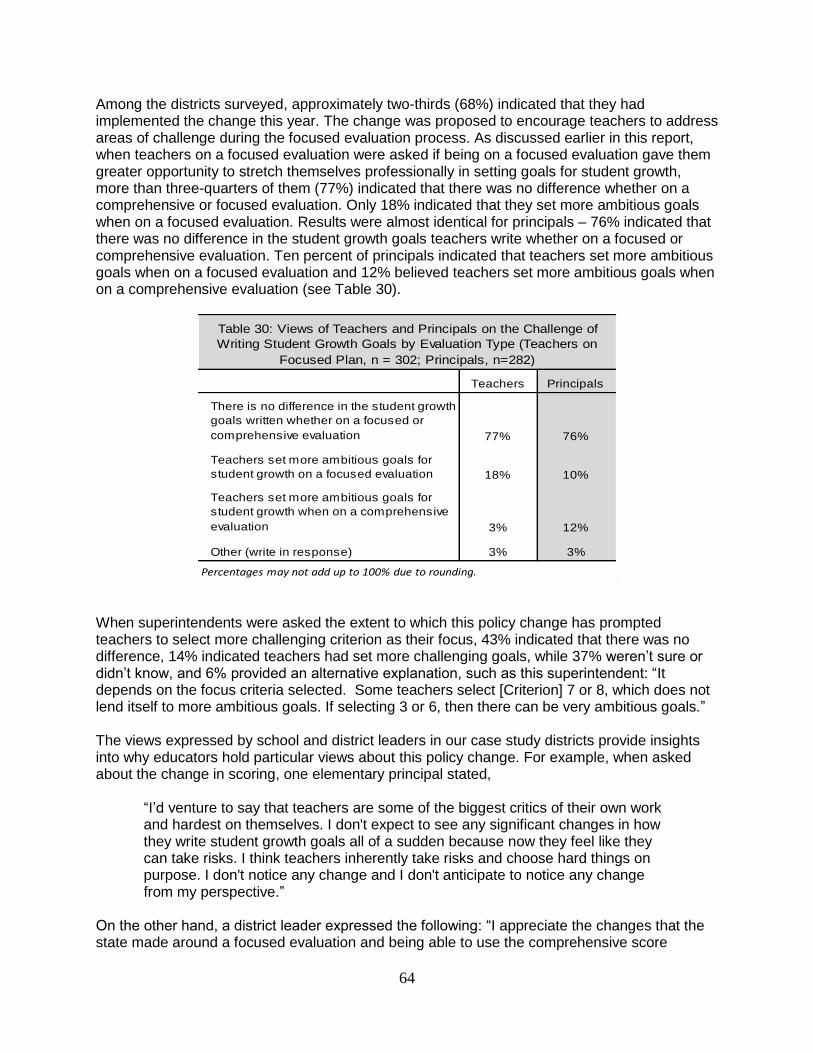
64
Among the districts surveyed, approximately two-thirds (68%) indicated that they had implemented the change this year. The change was proposed to encourage teachers to address areas of challenge during the focused evaluation process. As discussed earlier in this report, when teachers on a focused evaluation were asked if being on a focused evaluation gave them greater opportunity to stretch themselves professionally in setting goals for student growth, more than three-quarters of them (77%) indicated that there was no difference whether on a comprehensive or focused evaluation. Only 18% indicated that they set more ambitious goals when on a focused evaluation. Results were almost identical for principals – 76% indicated that there was no difference in the student growth goals teachers write whether on a focused or comprehensive evaluation. Ten percent of principals indicated that teachers set more ambitious goals when on a focused evaluation and 12% believed teachers set more ambitious goals when on a comprehensive evaluation (see Table 30).
Teachers Principals
There is no difference in the student growth
goals written whether on a focused or
comprehensive evaluation 77% 76%
Teachers set more ambitious goals for
student growth on a focused evaluation 18% 10%
Teachers set more ambitious goals for
student growth when on a comprehensive
evaluation 3% 12%
Other (write in response) 3% 3%
Table 30: Views of Teachers and Principals on the Challenge of
Writing Student Growth Goals by Evaluation Type (Teachers on
Focused Plan, n = 302; Principals, n=282)
Percentages may not add up to 100% due to rounding. When superintendents were asked the extent to which this policy change has prompted teachers to select more challenging criterion as their focus, 43% indicated that there was no difference, 14% indicated teachers had set more challenging goals, while 37% weren’t sure or didn’t know, and 6% provided an alternative explanation, such as this superintendent: “It depends on the focus criteria selected. Some teachers select [Criterion] 7 or 8, which does not lend itself to more ambitious goals. If selecting 3 or 6, then there can be very ambitious goals.” The views expressed by school and district leaders in our case study districts provide insights into why educators hold particular views about this policy change. For example, when asked about the change in scoring, one elementary principal stated, “I’d venture to say that teachers are some of the biggest critics of their own work
and hardest on themselves. I don't expect to see any significant changes in how they write student growth goals all of a sudden because now they feel like they can take risks. I think teachers inherently take risks and choose hard things on purpose. I don't notice any change and I don't anticipate to notice any change from my perspective.”
On the other hand, a district leader expressed the following: “I appreciate the changes that the state made around a focused evaluation and being able to use the comprehensive score
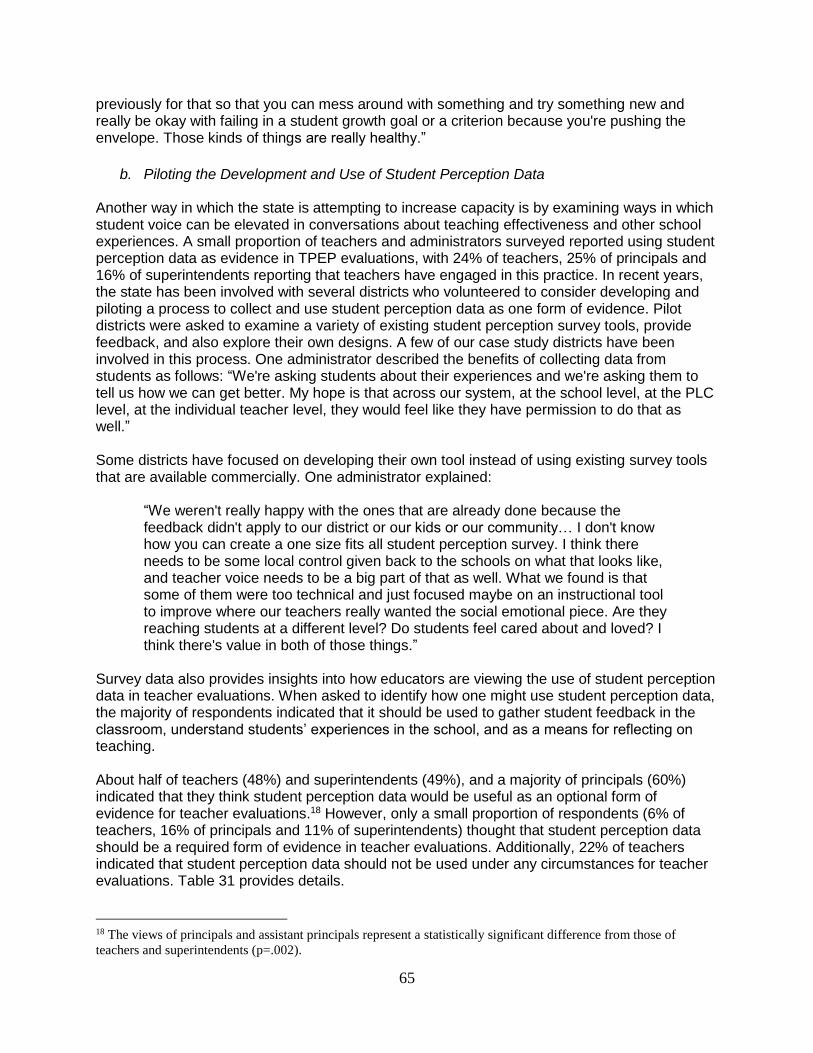
65
previously for that so that you can mess around with something and try something new and really be okay with failing in a student growth goal or a criterion because you're pushing the envelope. Those kinds of things are really healthy.”
b. Piloting the Development and Use of Student Perception Data
Another way in which the state is attempting to increase capacity is by examining ways in which student voice can be elevated in conversations about teaching effectiveness and other school experiences. A small proportion of teachers and administrators surveyed reported using student perception data as evidence in TPEP evaluations, with 24% of teachers, 25% of principals and 16% of superintendents reporting that teachers have engaged in this practice. In recent years, the state has been involved with several districts who volunteered to consider developing and piloting a process to collect and use student perception data as one form of evidence. Pilot districts were asked to examine a variety of existing student perception survey tools, provide feedback, and also explore their own designs. A few of our case study districts have been involved in this process. One administrator described the benefits of collecting data from students as follows: “We're asking students about their experiences and we're asking them to tell us how we can get better. My hope is that across our system, at the school level, at the PLC level, at the individual teacher level, they would feel like they have permission to do that as well.” Some districts have focused on developing their own tool instead of using existing survey tools that are available commercially. One administrator explained: “We weren't really happy with the ones that are already done because the
feedback didn't apply to our district or our kids or our community… I don't know how you can create a one size fits all student perception survey. I think there needs to be some local control given back to the schools on what that looks like, and teacher voice needs to be a big part of that as well. What we found is that some of them were too technical and just focused maybe on an instructional tool to improve where our teachers really wanted the social emotional piece. Are they reaching students at a different level? Do students feel cared about and loved? I think there's value in both of those things.”
Survey data also provides insights into how educators are viewing the use of student perception data in teacher evaluations. When asked to identify how one might use student perception data, the majority of respondents indicated that it should be used to gather student feedback in the classroom, understand students’ experiences in the school, and as a means for reflecting on teaching. About half of teachers (48%) and superintendents (49%), and a majority of principals (60%) indicated that they think student perception data would be useful as an optional form of evidence for teacher evaluations.18 However, only a small proportion of respondents (6% of teachers, 16% of principals and 11% of superintendents) thought that student perception data should be a required form of evidence in teacher evaluations. Additionally, 22% of teachers indicated that student perception data should not be used under any circumstances for teacher evaluations. Table 31 provides details.
18 The views of principals and assistant principals represent a statistically significant difference from those of
teachers and superintendents (p=.002).
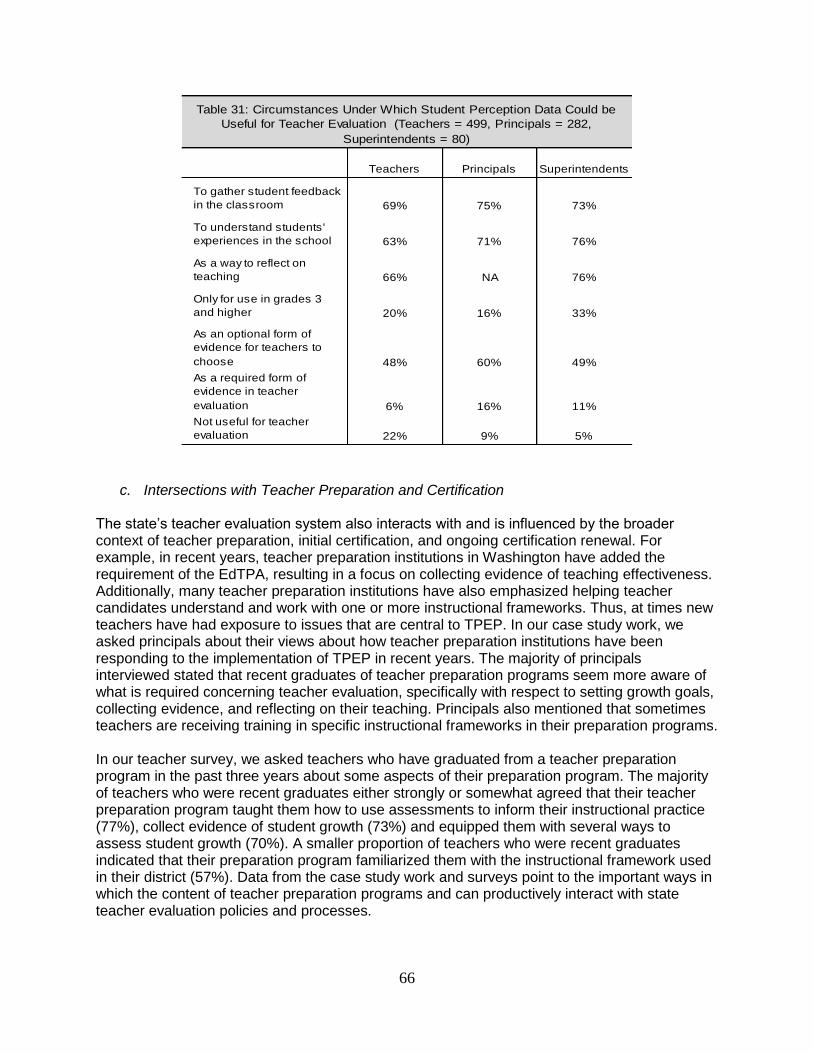
66
Teachers Principals Superintendents
To gather student feedback
in the classroom 69% 75% 73%
To understand students'
experiences in the school 63% 71% 76%
As a way to reflect on
teaching 66% NA 76%
Only for use in grades 3
and higher 20% 16% 33%
As an optional form of
evidence for teachers to
choose 48% 60% 49%
As a required form of
evidence in teacher
evaluation 6% 16% 11%
Not useful for teacher
evaluation 22% 9% 5%
Table 31: Circumstances Under Which Student Perception Data Could be
Useful for Teacher Evaluation (Teachers = 499, Principals = 282,
Superintendents = 80)
c. Intersections with Teacher Preparation and Certification The state’s teacher evaluation system also interacts with and is influenced by the broader context of teacher preparation, initial certification, and ongoing certification renewal. For example, in recent years, teacher preparation institutions in Washington have added the requirement of the EdTPA, resulting in a focus on collecting evidence of teaching effectiveness. Additionally, many teacher preparation institutions have also emphasized helping teacher candidates understand and work with one or more instructional frameworks. Thus, at times new teachers have had exposure to issues that are central to TPEP. In our case study work, we asked principals about their views about how teacher preparation institutions have been responding to the implementation of TPEP in recent years. The majority of principals interviewed stated that recent graduates of teacher preparation programs seem more aware of what is required concerning teacher evaluation, specifically with respect to setting growth goals, collecting evidence, and reflecting on their teaching. Principals also mentioned that sometimes teachers are receiving training in specific instructional frameworks in their preparation programs. In our teacher survey, we asked teachers who have graduated from a teacher preparation program in the past three years about some aspects of their preparation program. The majority of teachers who were recent graduates either strongly or somewhat agreed that their teacher preparation program taught them how to use assessments to inform their instructional practice (77%), collect evidence of student growth (73%) and equipped them with several ways to assess student growth (70%). A smaller proportion of teachers who were recent graduates indicated that their preparation program familiarized them with the instructional framework used in their district (57%). Data from the case study work and surveys point to the important ways in which the content of teacher preparation programs and can productively interact with state teacher evaluation policies and processes.
67
The state’s teacher evaluation system also interacts with policies regarding the ongoing certification of teachers such as Pro-Teach, Pro-Cert, and National Board certification. We asked teachers who have completed the Pro-Cert or Pro-Teach process in the last five years to indicate how useful the process was to their professional growth. Only 16% of teachers surveyed had recently completed either process. Of those who were able to respond, 22% indicated that TPEP was more useful than Pro-Teach or Pro-Cert, while 19% said that Pro-Cert or Pro-Teach was more useful. An additional 13% responded that both were useful, while 43% responded that neither was useful. However, views of school leaders on a similar item differed from those of teachers. The vast majority of principals indicated that they had teachers who have completed the Pro-Cert or Pro-Teach process in the last five years. Of those principals, 43% believed that TPEP has been more useful for teachers’ professional growth, while 18% indicated that Pro-Teach or Pro-Cert was more useful. Another 26% of school leaders indicated that both have been equally useful, while only 13% responded that neither has been useful (see Table 32). Teachers who have graduated from a teacher preparation program within the last three years were asked about their plans for the next step in the professional certification process. The majority (55%) stated that they plan to pursue National Board certification next rather than complete the Professional Certificate Assessment (ProTeach).
Which was more useful for
professional growth? Teachers Principals
Pro-Teach/Pro-Cert process 19% 18%
TPEP 22% 43%
Both have been equally useful for
professional growth 13% 26%
Neither have been useful for
professional growth 43% 13%
Table 32: Usefulness of Pro-Teach/Pro-Cert and TPEP for
Professional Growth* (Teachers = 67, Principals = 240)
*Note: Only asked of teachers who have completed Pro-
Teach/Pro-Cert; and only asked of princpals with teachers who
have completed Pro-Teach/Pro-Cert. For teachers involved in the Pro-Cert process, some would like to see greater alignment between Pro-Cert and TPEP. A teacher explained, “I would like to see ProCert and TPEP aligned so that the expectations that we’re writing about when we’re redoing our certificate, or if we’re asked to do SIOP training, that it’s all within the same framework…. and tackle the same guiding questions. I think that’s really important. Otherwise you’re not going to have buy-in from these people who are just trying to jump through hoops to get a job.” Teachers who either have National Board certification or are in the process of obtaining it (24% of teacher survey respondents) were asked questions about the extent to which aspects of National Board certification and TPEP are similar. The majority of respondents found that collecting evidence of student growth (89%), identifying assessments to measure student growth (88%), and reflecting on their practice (86%) were either very or somewhat similar when comparing aspects of National Board certification and TPEP. A slightly smaller proportion (77%) indicated that writing student growth goals was similar when comparing TPEP and National Board certification.
68
Strengths and Limitations of TPEP
Educators shared numerous views about the strengths and limitations of the TPEP system, and also provided suggestions for improvement of the policies and practices associated with TPEP implementation. These views are discussed below.
Strengths Educators in our case study districts and across the state generally agree that areas of strength with TPEP include the instructional framework, the conversations about instructional practice, and the focus on growth. As previously stated, the majority of teachers surveyed (89%) either strongly or somewhat agreed that the instructional framework provides a common language to talk about teaching, and 82% of teachers agreed that the framework is used by administrators to discuss effective teaching practices. Additionally, three-fourths of teachers surveyed agreed that examining student growth is a useful part of teacher evaluation and a similar proportion of teachers (73%) agreed that their TPEP evaluations have been a fair assessment of their work as a teacher. A majority, but somewhat smaller percentages of teachers either somewhat or strongly agreed that the feedback they received from TPEP was helpful in their work as a teacher (67%) or that their TPEP evaluation led them to try new things in the classroom. A district administrator in a case study district stated the main strengths of TPEP as follows: “The valuable parts are the rubrics and the conversations that the rubric sparks
and the ability for the people who are observing instruction to have a language that teachers understand and is common and that their colleagues understand so you can have a conversation. A calibration conversation about whatever you're looking at…The tools are really good, they're so much better than what we had in the past. You go back to look at the old forms that we used when I was a principal – it’s light years better than that.”
The overwhelming majority of superintendents (90%) and principals (92%) surveyed either strongly or somewhat agreed that the TPEP process recognizes the complex nature of teaching. A smaller majority of teachers surveyed (63%) either strongly or somewhat agreed with this view, and a quarter of teachers somewhat disagreed, a difference that is statistically significant (p=.0005). A superintendent responding to the survey wrote, “TPEP is very thorough and meets our professional needs to properly evaluate teachers and principals.” A principal survey participant said, “TPEP means definitely more time to complete evaluations but I find that I have richer conversations and that teachers are getting more used to using this tool as a way to engage in personal growth rather than just an evaluation tool.” Another principal stated, “TPEP captures all aspects of the profession and intentional conversations and conferences are built into the process to allow for a genuine feedback loop to occur.” More than three-quarters of superintendents (78%) agreed that that they preferred TPEP to other forms of teacher evaluation. A superintendent in a case study district explains: “I’d rather have the system we have now, which is we are trying to just keep up with things, versus the old system, which was pass/fail, get to your minimum number, and the focus was really not on… It was more on the teacher and compliance versus ‘Are the kids learning?’” When superintendents were asked to assess how TPEP has impacted their districts, a large majority responded that TPEP had either a very positive or somewhat positive impact on student learning (76%), the professional growth of teachers (83%), the professional growth of administrators (75%), and high expectations for student learning (73%). Similarly, principals

69
either somewhat or strongly agreed that TPEP had a positive impact on student learning outcomes (74%) and improved the quality of instruction (80%).
Limitations As discussed in prior sections of this report, time constraints are a major concern of educators in trying to fully implement TPEP in schools and districts. The majority of teachers (70%), superintendents (80%) and principals (84%) responding to our surveys either agreed or somewhat agreed that TPEP is useful, but takes too much time. In our surveys, we asked respondents to comment on any aspects of teacher evaluation that TPEP does not capture but should be included. The most common comment from teachers who responded described a need to better address the types of responsibilities of teachers in specialized roles (e.g., music and physical education teachers, subject matter specialists). Teachers who responded held views similar to the following teacher who works as an intervention specialist: “I feel that TPEP is directed more towards classroom teachers than specialists and that certain aspects of my job are not totally evaluated.” Another frequent comment from teachers who responded was that aspects of the student-teacher relationship were missing from TPEP. One teacher articulated this concern as follows: “It still misses how teachers really interact with students, how they connect with kids and how this really impacts how much a student is willing to work hard in a classroom,” while another teacher said, “I don’t think TPEP captures the extent that I go to build positive relationships with my students. It doesn’t capture how I get to know the whole child.” Some teachers also commented that TPEP doesn’t take into account work done outside of the classroom, including extra-curricular activities, after-school tutoring, and assisting students with high absenteeism. School administrators surveyed mentioned other important aspects that they thought were not captured in the TPEP process, with one principal saying, “TPEP doesn’t reflect a teacher’s ability to be culturally responsive or their ability to develop relationships that support at-risk students.” A number of school leaders also mentioned that TPEP does not adequately capture a teacher’s innovation or creativity. Another common comment from administrators was that issues of teacher professionalism that go beyond instructional skills, such as attitude, respect for colleagues, and issues of attendance were not specifically part of the evaluation system. A district administrator in a case study district described the concern in this way: “I guess I would just add there are also things that are not assessed on the rubric
that influence principal's decision making. Whatever we call ‘fit’. Whatever we mean by being a team player. These other ideas of just fitting within the culture of a school or a staff; those things that do matter don't find expression in the rubric, and they probably matter more to a principal's decision making around granting tenure than many of the things on the rubric.”
A superintendent responding to the survey echoed this concern: “TPEP is about instruction and learning -- it evaluates whether the teacher is a good practitioner, but leaves no room for consideration of whether the teacher is a good employee. As a supervisor, things like attendance, attitude, cooperation, work ethic, honesty, flexibility, and other traits are as important.” We also asked school and district administrators to identify concerns that they perceived to be obstacles to TPEP implementation. Both superintendents (65%) and school administrators (45%) identified time spent on evaluations as their greatest concern. A small proportion of
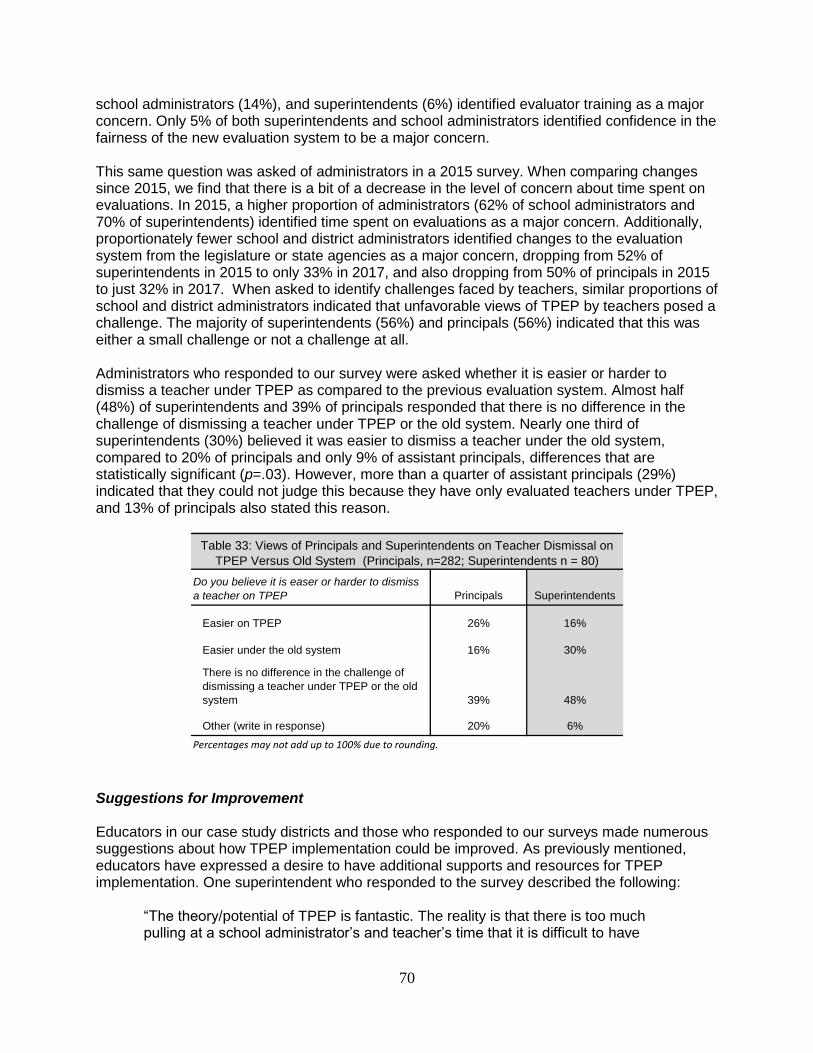
70
school administrators (14%), and superintendents (6%) identified evaluator training as a major concern. Only 5% of both superintendents and school administrators identified confidence in the fairness of the new evaluation system to be a major concern. This same question was asked of administrators in a 2015 survey. When comparing changes since 2015, we find that there is a bit of a decrease in the level of concern about time spent on evaluations. In 2015, a higher proportion of administrators (62% of school administrators and 70% of superintendents) identified time spent on evaluations as a major concern. Additionally, proportionately fewer school and district administrators identified changes to the evaluation system from the legislature or state agencies as a major concern, dropping from 52% of superintendents in 2015 to only 33% in 2017, and also dropping from 50% of principals in 2015 to just 32% in 2017. When asked to identify challenges faced by teachers, similar proportions of school and district administrators indicated that unfavorable views of TPEP by teachers posed a challenge. The majority of superintendents (56%) and principals (56%) indicated that this was either a small challenge or not a challenge at all. Administrators who responded to our survey were asked whether it is easier or harder to dismiss a teacher under TPEP as compared to the previous evaluation system. Almost half (48%) of superintendents and 39% of principals responded that there is no difference in the challenge of dismissing a teacher under TPEP or the old system. Nearly one third of superintendents (30%) believed it was easier to dismiss a teacher under the old system, compared to 20% of principals and only 9% of assistant principals, differences that are statistically significant (p=.03). However, more than a quarter of assistant principals (29%) indicated that they could not judge this because they have only evaluated teachers under TPEP, and 13% of principals also stated this reason.
Do you believe it is easer or harder to dismiss
a teacher on TPEP Principals Superintendents
Easier on TPEP 26% 16%
Easier under the old system 16% 30%
There is no difference in the challenge of
dismissing a teacher under TPEP or the old
system 39% 48%
Other (write in response) 20% 6%
Table 33: Views of Principals and Superintendents on Teacher Dismissal on
TPEP Versus Old System (Principals, n=282; Superintendents n = 80)
Percentages may not add up to 100% due to rounding.
Suggestions for Improvement Educators in our case study districts and those who responded to our surveys made numerous suggestions about how TPEP implementation could be improved. As previously mentioned, educators have expressed a desire to have additional supports and resources for TPEP implementation. One superintendent who responded to the survey described the following:
“The theory/potential of TPEP is fantastic. The reality is that there is too much
pulling at a school administrator’s and teacher’s time that it is difficult to have
71
those rich authentic conversations and in depth observations. Decision-makers need to understand that if quality is desired, then more supports needs (personnel, time, professional development) to be added or requirements removed.”
A principal noted the benefits of collaborating with peers in supporting TPEP implementation by stating, “I would appreciate collaborating with other administrators who evaluate teachers on specific problems of practice and what approaches have been successful and unsuccessful. Using a consultancy protocol in a group with different dilemmas in evaluation would be amazing.” In our case study work, educators discussed the scope of the comprehensive evaluation and many wondered whether adjustments should be made to make it less overwhelming for some teachers, especially for individuals new to the profession. We explored this notion in our survey work. More than three-quarters of teachers (78%), four-fifths of school administrators, and 71% of superintendents either strongly or somewhat agreed that the comprehensive evaluation attempts to cover too many aspects of teaching in a single year. More than four-fifths of principals (84%) identified covering all aspects of a comprehensive evaluation with a first year teacher as a major concern (51%) or a moderate concern (33%). Superintendents also expressed some concern, with 38% identifying this as a major concern and 34% stating it was a moderate concern for them. Some educators in our case study districts expressed support for the idea of requiring a comprehensive evaluation every six years once a teacher has been rated as proficient or distinguished in evaluations after their probationary period. Not all educators in our case study districts supported that notion, arguing that it is important to cover all aspects, especially for novice teachers, and that there are ways for an evaluator to make it work efficiently. One principal explains: “As far as the comprehensive being too comprehensive, I would just think we
would do teachers a disservice if we didn't look at the whole package. Again, it's how you utilize that tool…there may be areas that need to grow in a number of different components or criterion, but you choose which ones to really highlight and emphasize as the next step. I think there is an opportunity for a leader to make the system and the feedback not overwhelming.”
Survey respondents were asked whether peer review could be a useful component of teacher evaluation. Nearly three-quarters of principals (74%), 69% of superintendents and 61% of teachers either strongly or somewhat agreed that peer review might be useful. The differences between district administrators and teachers was statistically significant (p=.001).
Need for Continued Support Educators in several of our case study districts noted that there is a potential for TPEP to become “stale” and worried that the focus on supporting continuous improvement might wane over time. Several administrators in case study districts talked about a need to have “refresher” activities that can help keep the momentum going. As previously noted, nearly four-fifths (79%) of superintendents responding to the survey stated that they believed district capacity to sustain TPEP over time was either a major (25%) or a moderate concern (54%). An assistant principal responding to the survey stated, “I’d also like to see some re-training related to the process; it seems like it’s becoming more and more ‘sterile’ rather than collaborative. I think TPEP is an excellent model and want to see it continue to grow as a collaborative effort between principals and teachers.”
72
A superintendent in a case study district described the need for continual support from the state to improve the sustainability of TPEP over time:
“And what I'm worried about is because the state's not paying the attention they
used to pay and those kind of things, is it going to start to slip away? Because again, if you're busy and this is something that most people don't enjoy doing anyway, it gets put off until the last minute and then done poorly. That concerns me. And I think maybe the state could do some things where they on a rotating basis of some sort came out and worked with us. And looked and see what we're doing. And see if it meets what they expect us to meet and create some technical support processes for districts. Especially as we hire new principals and new assistant principals and people who are going to do this evaluation. I think this three or four day training is one thing. But I don't think it really prepares people to do the kind of job that is going to be required without a lot of other supports from the district.”
Another superintendent in a case study district also recommended continued support, noting that new teachers continually enter the district and have specific support needs:
“I think what they've done around providing the TPEP funding for professional
learning has been huge, and the expansion to provide that for administrators as well. I don't know how we would do it without that… We're hiring new teachers all the time so they don't have the same experiences of the first few years of the framework training and all that. What does that ongoing support look like and how do you - especially our district is big enough that we can kind of figure that out, but I think to those smaller districts… that may not have resources for an assistant principal, they probably don't have the resources either to bring staff together for professional learning, so help along that issue would be good.”
As found in the quote above, a frequent suggestion for improvement was for the state to acknowledge and target support to address the unique circumstances evaluators face in small districts and small schools.19 As described earlier in this report, collaboration is an important aspect of TPEP implementation, and evaluators who are located in districts or schools in which they are the only individual conducting evaluations have more limited opportunities to learn from others and receive other types of professional supports for their evaluation responsibilities. As one survey respondent stated, “TPEP is difficult for small districts with limited resources.”
Impact of TPEP on Career Decisions A question that emerged during a number of conversations in our case study districts was whether the TPEP process was causing educators to consider leaving the profession. Consequently, we inquired about this in our survey work with teachers, principals, and assistant principals.
19 In examining the 2015-16 teacher training (iGrant664) applications, districts responded to the prompt, “What assistance do you need?” Thirty percent of the participating districts requested additional assistance in the form of funding, materials or time. Seventeen percent of districts requested additional assistance from their ESDs. Districts in ESD 114 had the highest rate of assistance requested at 36%, followed by districts in ESD 112 (31%) and ESD 101 (29%).
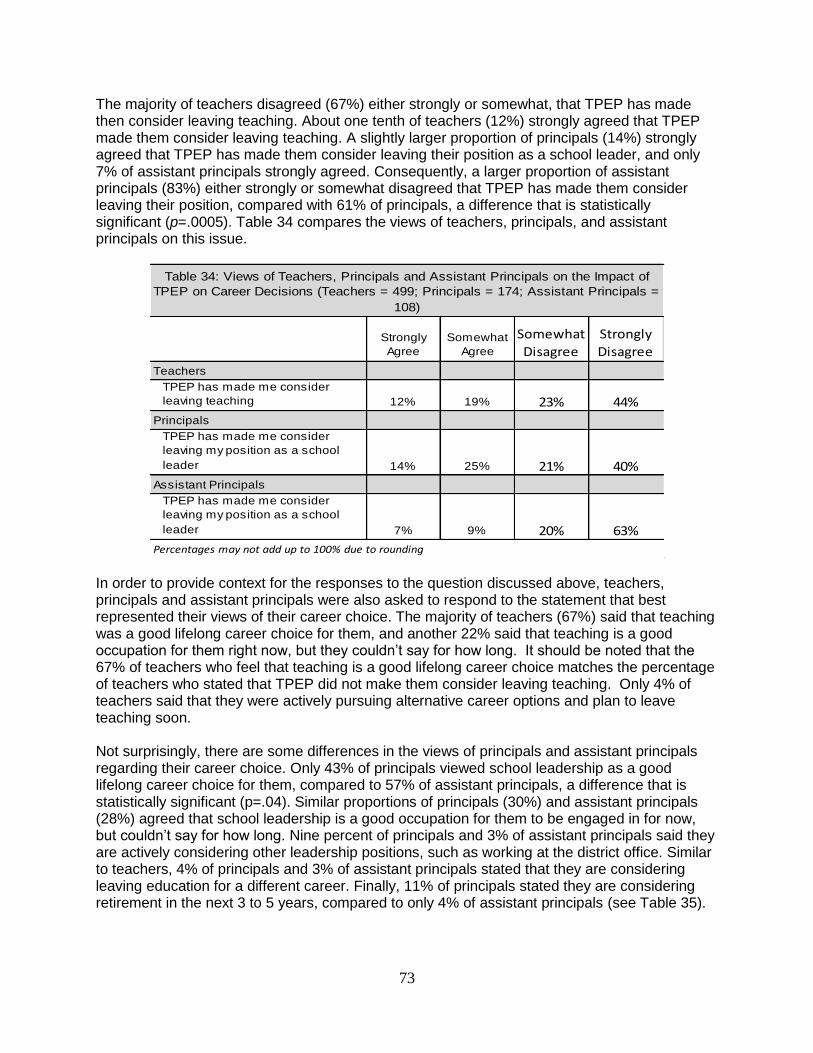
73
The majority of teachers disagreed (67%) either strongly or somewhat, that TPEP has made then consider leaving teaching. About one tenth of teachers (12%) strongly agreed that TPEP made them consider leaving teaching. A slightly larger proportion of principals (14%) strongly agreed that TPEP has made them consider leaving their position as a school leader, and only 7% of assistant principals strongly agreed. Consequently, a larger proportion of assistant principals (83%) either strongly or somewhat disagreed that TPEP has made them consider leaving their position, compared with 61% of principals, a difference that is statistically significant (p=.0005). Table 34 compares the views of teachers, principals, and assistant principals on this issue.
Strongly
Agree
Somewhat
Agree
Somewhat
Disagree
Strongly
Disagree
Teachers
TPEP has made me consider
leaving teaching 12% 19% 23% 44%
Principals
TPEP has made me consider
leaving my position as a school
leader 14% 25% 21% 40%
Assistant Principals
TPEP has made me consider
leaving my position as a school
leader 7% 9% 20% 63%
Table 34: Views of Teachers, Principals and Assistant Principals on the Impact of
TPEP on Career Decisions (Teachers = 499; Principals = 174; Assistant Principals =
108)
Percentages may not add up to 100% due to rounding In order to provide context for the responses to the question discussed above, teachers, principals and assistant principals were also asked to respond to the statement that best represented their views of their career choice. The majority of teachers (67%) said that teaching was a good lifelong career choice for them, and another 22% said that teaching is a good occupation for them right now, but they couldn’t say for how long. It should be noted that the 67% of teachers who feel that teaching is a good lifelong career choice matches the percentage of teachers who stated that TPEP did not make them consider leaving teaching. Only 4% of teachers said that they were actively pursuing alternative career options and plan to leave teaching soon. Not surprisingly, there are some differences in the views of principals and assistant principals regarding their career choice. Only 43% of principals viewed school leadership as a good lifelong career choice for them, compared to 57% of assistant principals, a difference that is statistically significant (p=.04). Similar proportions of principals (30%) and assistant principals (28%) agreed that school leadership is a good occupation for them to be engaged in for now, but couldn’t say for how long. Nine percent of principals and 3% of assistant principals said they are actively considering other leadership positions, such as working at the district office. Similar to teachers, 4% of principals and 3% of assistant principals stated that they are considering leaving education for a different career. Finally, 11% of principals stated they are considering retirement in the next 3 to 5 years, compared to only 4% of assistant principals (see Table 35).
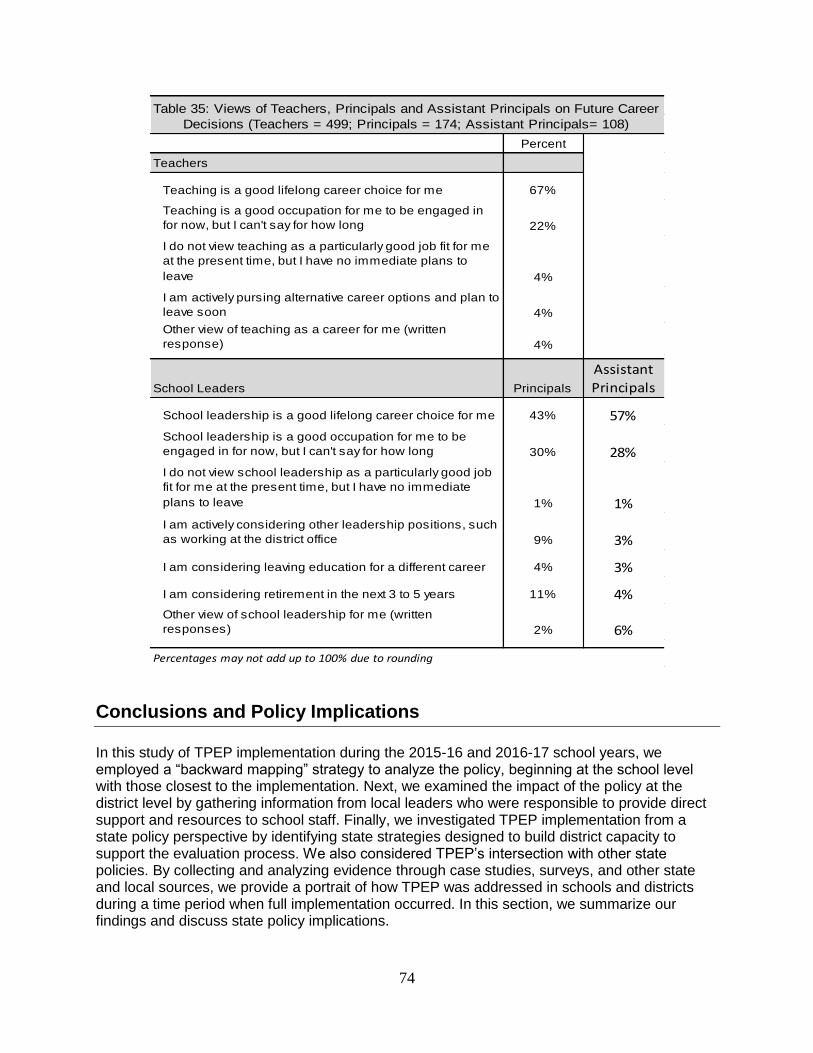
74
Percent
Teachers
Teaching is a good lifelong career choice for me 67%
Teaching is a good occupation for me to be engaged in
for now, but I can't say for how long 22%
I do not view teaching as a particularly good job fit for me
at the present time, but I have no immediate plans to
leave 4%
I am actively pursing alternative career options and plan to
leave soon 4%
Other view of teaching as a career for me (written
response) 4%
School Leaders Principals
Assistant
Principals
School leadership is a good lifelong career choice for me 43% 57%
School leadership is a good occupation for me to be
engaged in for now, but I can't say for how long 30% 28%
I do not view school leadership as a particularly good job
fit for me at the present time, but I have no immediate
plans to leave 1% 1%
I am actively considering other leadership positions, such
as working at the district office 9% 3%
I am considering leaving education for a different career 4% 3%
I am considering retirement in the next 3 to 5 years 11% 4%
Other view of school leadership for me (written
responses) 2% 6%
Percentages may not add up to 100% due to rounding
Table 35: Views of Teachers, Principals and Assistant Principals on Future Career
Decisions (Teachers = 499; Principals = 174; Assistant Principals= 108)
Conclusions and Policy Implications
In this study of TPEP implementation during the 2015-16 and 2016-17 school years, we employed a “backward mapping” strategy to analyze the policy, beginning at the school level with those closest to the implementation. Next, we examined the impact of the policy at the district level by gathering information from local leaders who were responsible to provide direct support and resources to school staff. Finally, we investigated TPEP implementation from a state policy perspective by identifying state strategies designed to build district capacity to support the evaluation process. We also considered TPEP’s intersection with other state policies. By collecting and analyzing evidence through case studies, surveys, and other state and local sources, we provide a portrait of how TPEP was addressed in schools and districts during a time period when full implementation occurred. In this section, we summarize our findings and discuss state policy implications.
75
Conclusions
1. How TPEP is implemented in schools and districts is a reflection of the organization’s
leadership capacity and belief systems.
For districts and schools actively engaged in instructional improvement efforts prior to TPEP, there was often some existing capacity to support TPEP activities. District commitment to professional growth and prior conversations about what constitutes effective teaching and learning, in some cases provided the basis for introducing the state’s new evaluation policy. Indeed, the long-term sustainability and success of the evaluation policy may be linked to the ways in which districts think and talk about teaching. According to many educators, the conversation should be centered around instruction and professional growth, rather than scoring and “checking off a box.” In this study, we found that districts send powerful messages that can build capacity for the initiative in a number of ways. First, districts communicate the primary purposes of TPEP, and this can influence whether or not educators see the policy as a means to continuous improvement or as simply a requirement to be met. Districts can also prioritize the creation of a trusting and collaborative culture that supports improvement efforts and coherently integrates the evaluation system into the broader set of initiatives and activities aimed at improving student and professional learning. Consequently, leadership is key to meaningful TPEP implementation at both district and school levels. District leaders set the tone for TPEP, how its purposes are interpreted, and how TPEP is integrated with other district initiatives. If viewed as a professional growth model, district and school administrators can see benefits and configure resources and training to support and mentor teachers through the evaluation process. Findings from this study support the primacy of the school leader in establishing trust, creating conditions and serving as an instructional leader for TPEP to be understood as an opportunity for continuous growth. Principals and assistant principals shoulder the majority of responsibilities for the evaluation, and the workload of school leaders can be overwhelming. In many cases, districts have added additional administrative staff and other supports to help evaluators manage these responsibilities.
2. The strength of TPEP is in its use of an instructional framework to support continuous
growth of student and professional learning.
TPEP implementation is directly related to educators’ knowledge about effective instruction, and the instructional framework can help support those conversations. The evaluation process requires a deep understanding of goal setting for student and professional growth and the use of evidence to assess progress toward these goals, both on the part of teachers and administrators. Given these elements of the evaluation, the instructional framework can serve as a unifying factor and help create coherence for staff as they work together on issues of professional practice.
3. Relying on scoring to prompt improvement is not a productive strategy.
The data indicates that most Washington teachers receive a summative score of proficient, and a few receive a distinguished rating. Few teachers receive a summative rating of basic or unsatisfactory. Thus, summative data is not helpful in providing educators with the kind of detailed feedback necessary to guide conversations about instructional improvement and
76
student learning. And while our examination of criterion scores in a handful of districts indicates a small amount of variation, this data alone does not provide sufficient detail to be reliable for general planning or professional development purposes. Gauging progress solely on the basis of changes in summative or criterion scores, either at the school or district level, does not provide sufficient evidence to inform strategies for improvement, nor will it necessarily inform decisions about hiring, staffing, or contract renewal.
4. TPEP cannot be done in isolation.
Collaboration is a fundamental element of the evaluation system as a means by which educators work together to improve professional practice and student learning. Collaboration applies in a very specific sense to the work of teachers with one another and their school leaders within the local context. But it also applies to the process itself, and the extent to which educators (whether at the classroom, school, district or state level) are able to create and engage in consistent procedures that generate confidence in the usefulness and fairness of the system. From a systems level perspective, learning can occur across settings (schools, districts, and regions), and collaboration in this light has the potential to prompt improvement in the evaluation process itself. Teachers and administrators prioritized the provision of professional development in collaboration with others, as the most important and valued aspect of TPEP. The collaborative nature of TPEP activities will need to be supported for long-term sustainability.
Implications for State Policy
1. There is a need for continuous professional development and collaboration to support TPEP implementation for both teachers and administrators. Evidence from multiple sources included in this study points to the need for ongoing professional learning opportunities for teachers and administrators. First, there is a need to provide professional development to those new to the profession as they become familiar with a district’s chosen framework and learn the processes for developing growth goals and collecting evidence. And while there is evidence that teacher preparation programs provide some important grounding in these areas, additional professional development is needed for novice teachers. This need for ongoing efforts aimed at those new to the profession also applies to newly minted principals and assistant principals who must manage the complexities of their responsibilities with the need to serve as an instructional leader. Furthermore, there is a need to support educators who transfer to districts that use a different framework. In addition to the onboarding of those new to the profession or to a specific framework, educators in this study expressed a need for “refreshers” for those who have been working with TPEP for some time. This type of training may best be done in collaboration with others, particularly for administrators to engage in rater reliability and to share best practices. For teachers, collaborative time is needed in PLCs or other groups to work on student growth goals and assessments. Ongoing professional development support may best be accomplished at the local level. In this study, educators noted the shift in providing professional development at district and school levels, using educators within a district as local experts.
77
2. Differentiated supports are needed to address special circumstances This study demonstrates the differential impact of the state’s teacher evaluation policy in light of factors such as size and location of the district, grade levels served, and types of teaching responsibilities and assignments. In particular, we found that small and rural or remote districts often have no readily available opportunities for collaboration and are in need of supports that help them connect with others and mediate the workload. Similarly, schools that have only one evaluator (typically small elementary schools in districts of all sizes) are in need of supports and opportunities for calibration. In addition to characteristics of districts and schools, teachers serving in specialized roles (e.g., music, PE, instructional coaches) often feel that TPEP is not applicable to many aspects of their work. Attention should be paid to adaptations that can mediate this problem. 3. Sustaining TPEP to support continuous improvement There is an underlying concern regarding TPEP’s long-term sustainability given the ambitious nature of the policy’s requirements. An ongoing challenge for the state involves supporting and sustaining the long-term efforts of schools and districts to productively engage staff in the evaluation process. As a number of educators who participated in this study have noted, TPEP may be at risk of becoming “stale” and marginalized if workload issues are not addressed and supports discussed above are not forthcoming. Additionally, promoting the purpose of continuous improvement is a message that needs continual emphasis so that the routines established for conducting evaluation to do not devolve to a simple process of “checking the boxes.” Integrating TPEP with other state and district improvement initiatives can help support its sustainability. One example for consideration would be for teacher certification systems to become more integrated with TPEP. Narrow views of the purposes of TPEP, for example, viewing its primary purpose as one of “firing bad teachers” fails to recognize the complexities and potential involved in building a system that supports continuous growth. TPEP is not causing a large proportion of educators to consider leaving the profession, but principals are most at risk, given their significant workloads. Efforts to streamline some TPEP processes should be considered, including ways to be strategic about focusing on critical aspects of the comprehensive evaluation based on teacher needs. An organizational focus on internal capacity building, and integration and coherence of supports aligns with research by Fullan and Hargreaves (2015) who suggest that policymakers should shift from heavy reliance on external accountability and instead build the professional capital of all teachers and leaders throughout the system. In this way, policies can prioritize supports for collective responsibility and the creation of conditions for internal accountability for continuous improvement and success for all students. In conclusion, by design TPEP allows for local decision-making at district, school, and classroom levels. These choices include matters such as instructional framework, identification of growth goals for students and professionals, use of formative and summative assessments, choice of electronic tools, relationships with professional associations, and use of evaluation data. Consequently, significant variation exists, as there are numerous and complex factors shaping the specific contours of TPEP implementation across the state’s schools and classrooms. Findings from this study point to several ways in which the analysis of TPEP
78
implementation serves as a reflection of the capacity of individual districts to articulate a vision for improvement, support teachers and principals in substantive ways, develop supportive and trusting work environments, and integrate initiatives in a coherent way. The organizational capacity of schools and districts to implement a complex reform like teacher evaluation is dependent upon different kinds of resources, as well as issues of alignment and workload. A challenge for the state going forward will be how to support and sustain schools and districts in productively engaging in the process.
79
References
Accomplished California Teachers (2015). A coherent system of teacher evaluation for quality
teaching. Education Policy Analysis Archive, 23(17), 1-23. Braun, H. (2015). The value in value-added depends on the ecology. Educational Researcher,
44(2), 127-131. Cohen, D. & Hill, H. (2008). Learning policy: When state education reform works. New Haven,
CT: Yale University Press. Creswell, J. W., & Plano Clark, V. L. (2011). Designing and conducting mixed methods
research. 2nd Edition. Thousand Oaks CA: Sage. Danielson, C. (2011). Evaluations that help teachers learn. Educational Leadership, 68 (4): 35-
39. Darling-Hammond, L. Amrein-Beardsley, A., Haertel, E. & Rothstein, J. (2012). Evaluating
teacher evaluation. Phi Delta Kappan, 93 (6), 8-15. Donaldson, M. L. (2013). Principals’ approaches to cultivating teacher effectiveness: Constraints
and opportunities in hiring, assigning, evaluating, and developing teachers. Educational Administration Quarterly, 49(5): 838-882.
Elfers, A. M & Achberger, E. (2017). Analysis of School Employees Evaluation Survey
(SEES). Research commissioned by the Washington State Office of the Superintendent of Public Instruction. Seattle, WA: Center for the Study of Teaching and Policy, University of Washington.
Elmore, R. F. (1980). Backward mapping: Implementation research and policy designs. Political
Science Quarterly, 94(4), 601-616. Fullan, M. & Hargreaves, A. (2015). Professional capital as accountability. Education Policy
Analysis Archives, 23(15), 1-22. Gitomer, D., Bell, C., Qi, Y., McCaffrey, D., Hamre, B., & Pianta, R. (2014). The instructional
challenge in improving teaching quality: Lessons from a classroom observation tool. Teachers College Record, 116, 1-32.
Goe, L., Biggers, K., & Croft, A. (2012). Linking teacher evaluation to professional development:
Focusing on improving teaching and learning. National Comprehensive Center for Teacher Quality. Washington, DC: Author.
Goldring, E., Grissom, J. A., Rubin, M., Neumerski, C. M., Cannata, M., Drake, T., &
Schuermann, P. (2015). Make room value added: Principals’ human capital decisions and the emergence of teacher observation data. Educational Researcher, 44(2), 96-104.
80
Grissom, J. A. & Loeb, S. (2017). Assessing principals’ assessments: Subjective evaluations of teacher effectiveness in low- and high- stakes environments. Education Finance and Policy 12 (3), 369-395.
Grissom, J. A., & Youngs, P. (Eds.). (2015). Improving Teacher Evaluation Systems: Making the
Most of Multiple Measures. New York, NY: Teachers College Press. Hargreaves, A. & Braun, H. (2013). Data-driven improvement and accountability. Boulder, CO:
National Education Policy Center. Retrieved from http://nepc.colorado.edu/publication/data-driven-improvement-accountability
Harris, D. N. & Herrington, C.D. (2015). The use of teacher value-added measures in schools:
New evidence, unanswered questions, and future prospects. Educational Researcher, 44(2), 74-76.
Herlihy, C., Karger, E., Pollard, C., Hill, H., Kraft, M., Williams, M., & Howard, S. (2014). State
and local efforts to investigate the validity and reliability of scores from teacher evaluation systems. Teachers College Record, 116 (1): http://www.tcrecord.org/library ID Number: 17292.
Isore, M. (2009). Teacher evaluation: Current practices in OECD countries and a literature
review. OECD Education Working Paper. Paris: OECD. Jiang, J. Y., Sporte, S. E., & Luppescu, S. (2015). Teacher perspectives on evaluation reform:
Chicago's REACH students. Educational Researcher, 44(2), 105-116. Kim, J., Youngs, P. & Frank, P. (2017). Burnout contagion: Is it due to early teachers’ social
networks or organizational exposure? Teaching and Teacher Education, 66, 250-260. Kraft, M. & Gilmour, A. (2017). Revisiting The Widget Effect: Teacher evaluation reforms and
the distribution of teacher effectiveness. Educational Researcher, 46 (5), 234-249. Lavigne, A. (2014). Exploring the intended and unintended consequences of high-stakes
teacher evaluation on schools, teachers, and students. Teachers College Record, 116 (1): http//www.tcrecord.org/library ID Number: 17294.
Looney, L. (2011). Developing high-quality teachers: Teacher evaluation for improvement.
European Journal of Education, 46 (4), 440-455. Malen, B., Rice, J. K., Matlach, L. K. B., Bowsher, A., Hoyer, K. M., & Hyde, L. H. (2015).
Developing organizational capacity for implementing complex education reform initiatives: Insights from a multiyear study of a Teacher Incentive Fund program. Educational Administration Quarterly, 51(1), 133-176.
McDonnell, L. & Elmore, R. (1987). Getting the job done: Alternative policy instruments.
Educational Evaluation and Policy Analysis, 9(2), 133-152. McLaughlin, M. (1987). Learning from experience: Lessons from policy implementation.
Educational Evaluation and Policy Analysis, 9(2), 171-178.
81
Moore Johnson, S. (2015). Will VAMS reinforce the walls of the egg-crate school? Educational Researcher, 44(2), 117-126.
Office of Superintendent of Public Instruction (2014). Teacher/Principal Evaluation Program,
Teacher Training Funds 2014-15. Memorandum No. 030-14 M, K-12 Education. Olympia, WA: Author. Retrieved from http://tpep-wa.org/wp-content/uploads/M030-14.pdf
Papay, J. (2012) Refocusing the debate: Assessing the purposes and tools of teacher
evaluation. Harvard Educational Review, 82(1), 123-141. Plecki, M., Elfers, A. & Wills, K. (2017). Understanding Principal Retention and Mobility in
Washington State. Seattle, WA: University of Washington Center for the Study of Teaching and Policy.
Plecki, M. L., Elfers, A. M. & Yeh, T. L. (2015). Washington's Teacher and Principal Evaluation
System: Efforts to Support Professional Development. Research commissioned by the Washington State Office of the Superintendent of Public Instruction. Seattle, WA: Center for the Study of Teaching and Policy, University of Washington.
Reinhorn, S., Moore Johnson, S. & Simon, N. (2017). Investing in development: Six high-
performing, high-poverty schools implement the Massachusetts teacher evaluation policy. Educational Evaluation and Policy Analysis, 39(3), 383-406.
Spillane, J., Reiser, B. & Reimer, T. (2002). Policy implementation and cognition: Reframing and
refocusing implementation research. Review of Educational Research, 72(3), 387-431.

82
Appendices
% of ALL
Districts
statewide
(n=295)
Participating
Districts
(n=223)
Non-
Participating
Districts
(n=72)
Region of State**
Eastern WA 45.4% 39% 64%
Central Puget Sound (ESD 121) 11.9% 15% 1%
Western WA (outside ESD 121) 42.7% 45% 35%
Districts by ESD
ESD 101: Spokane 19.7% 16% 32%
ESD 105: Yakima 8.1% 8% 10%
ESD 112: Vancouver 10.8% 10% 13%
ESD 113: Olympia 14.9% 15% 15%
Olympic ESD 114: Bremerton 5.1% 6% 1%
Puget Sound ESD 121: Renton 11.9% 15% 1%
ESD 123: Pasco 7.8% 8% 7%
North Central ESD 171 9.8% 8% 15%
Northwest ESD 189: Anacortes 11.9% 14% 6%
Instructional Framework
Marzano (MAR) 30.8% 26% 44%
Danielson (DAN) 35.3% 36% 32%
CEL 5D (CEL) 33.9% 37% 24%
Enrollment
500 and under 35.9% 26% 68%
501-999 14.9% 14% 17%
1,000-4,999 29.2% 34% 15%
5,000-9,999 9.5% 13% 0
10,000+ 10.5% 14% 0
*“Participating districts” are defined as those which completed sections of the
664 TPEP Teacher Training Funds application.
Appendix A1: Summary of Participating* and Non-Participating iGrant 664
Districts in 2015-16 (Teacher Training Funds)
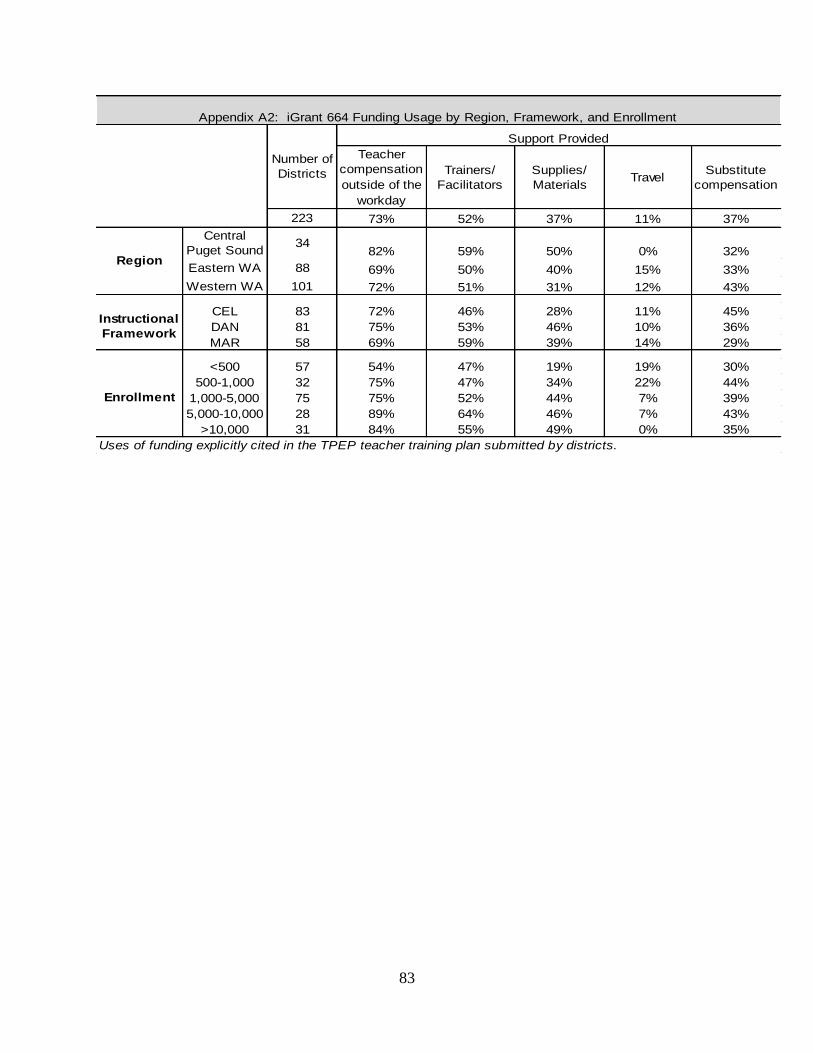
83
Teacher
compensation
outside of the
workday
Trainers/
Facilitators
Supplies/
MaterialsTravel
Substitute
compensation
223 73% 52% 37% 11% 37%
Central
Puget Sound34
82% 59% 50% 0% 32%
Eastern WA 88 69% 50% 40% 15% 33%
Western WA 101 72% 51% 31% 12% 43%
CEL 83 72% 46% 28% 11% 45%
DAN 81 75% 53% 46% 10% 36%
MAR 58 69% 59% 39% 14% 29%
<500 57 54% 47% 19% 19% 30%
500-1,000 32 75% 47% 34% 22% 44%
1,000-5,000 75 75% 52% 44% 7% 39%
5,000-10,000 28 89% 64% 46% 7% 43%
>10,000 31 84% 55% 49% 0% 35%
Enrollment
Uses of funding explicitly cited in the TPEP teacher training plan submitted by districts.
Appendix A2: iGrant 664 Funding Usage by Region, Framework, and Enrollment
Number of
Districts
Support Provided
Region
Instructional
Framework


