Washington State Vital Statistics 2005
193
Washington State Vital Statistics 2005 June 2007 For more information contact: Center for Health Statistics PO Box 47814 Olympia, WA 98504-7814 360 236-4321 Fax 360 753-4135 Mary C. Selecky Secretary of Health
Transcript of Washington State Vital Statistics 2005

Washington State Vital Statistics 2005 June 2007 For more information contact: Center for Health Statistics PO Box 47814 Olympia, WA 98504-7814 360 236-4321 Fax 360 753-4135 Mary C. Selecky Secretary of Health
Center for Health Statistics, Vital Statistics Report staff:
Joe Campo, Manager, Research Services (360) 236-4321
Patricia Starzyk, Research Investigator – Births (360) 236-4323 Phyllis Reed, Research Investigator - Deaths (360) 236-4324 Ann Lima, State Nosologist – (360) 236-4326 John Sabel IT Specialist – (360) 236-4332
Design Consultation: Office of Health Promotion Acknowledgements: We gratefully acknowledge the contributions of the many individuals who participate in the reporting of vital statistics and the maintenance of these very important public health indicators. We thank physicians, hospital staff, midwives, funeral directors, coroners/medical examiners, local registrars, and all staff of the Center for Health Statistics. Most importantly, we appreciate the role families and individuals play by providing information about the very personal events of their daily lives to promote the health of the population of Washington State. Jude VanBuren DrPH, MPH, RN, RS Assistant Secretary Epidemiology, Health Statistics & Public Health Laboratories Teresa J. Jennings MPA State Registrar and Director Center for Health Statistics

Washington State Vital Statistics Highlights for 2005
http://www.doh.wa.gov/EHSPHL/CHS/CHS-Data/main.htm • More babies were born in 2005
Washington women had 82,625 babies in 2005, an increase of 910 births compared to 2004. Despite this increase, the birth rate remained unchanged at 13.2 births per 1,000 population. After dropping fairly steadily in the 1990s, the birth rate has changed little since 2001.
• Maternal smoking rate is the same as 2004 The percent of women who smoked during pregnancy decreased nearly 40% between 1995 and 2004 (from 16.1% to 10.2%) but remained the same (10.2%) in 2005.
• Gestational diabetes is increasing; hypertension remains steady The percent of women with gestational diabetes has nearly doubled over the decade (from 2.6% in 1996 to 5.0% in 2005), while pregnancy-associated hypertension increased about 30% between 1996 and 2003 but has been unchanged (at 5.3%) since then.
• Cesarean section deliveries are increasing In 2005, more than a quarter of deliveries (27.8%) were by primary or repeat C-section, compared to 17.2% ten years ago.
• More residents died in 2005
There were 46,015 deaths of Washington State residents in 2005. The number of resident deaths increased from 2004; however the age-adjusted rate decreased.
• Cancer remained the leading cause of death in 2005, with Heart Disease in second place. Accidents are the 5th leading cause of death, and Alzheimer’s disease remains in 6th place. However, the percent distribution of deaths among the leading causes has changed very little.
• The infant death rate remains low The infant death rate was 5.1 per 1,000 live births in 2005. For comparison, the infant death rate in 1996 was 6.0 per 1,000 live births.
• Emma and Jacob remained the most popular names for babies born in 2005 The next most popular names were Emily and Olivia for girls and Ethan and Alexander for boys.

Washington State Vital Statistics Highlights for 2005
http://www.doh.wa.gov/EHSPHL/CHS/CHS-Data/main.htm
On an average day, these events occurred among Washington State Residents • 226 births including:
6 to teens <18 7 to women aged 40+ 69 to unmarried women 14 with low birth weight 63 by Cesarean section 22 to maternal smokers
• 126 deaths including: 30 due to heart disease 30 due to cancer 7 due to unintentional injuries (accidents)
2 due to suicide
Washington State outperformed the nation1 by experiencing a…
lower percentage of low weight births
lower proportion of Cesarean deliveries
lower percentage of births to unmarried women
lower infant mortality rate lower crude and age-adjusted death
rate for cancer, now the leading cause of death in WA State
higher life expectancy
Washington State fell below the nation1 by experiencing a…
higher age-adjusted death rate from cerebrovascular disease (strokes)
higher crude and age-adjusted death rate from suicide
much higher crude and age-adjusted death rate from Alzheimer’s Disease
1 National data reported in “Births: Preliminary Data for 2005” National Center for Health Statistics NCHS – Health E Stats November 2006, available on the internet at http://www.cdc.gov/nchs/products/pubs/pubd/hestats/prelimbirths05/prelimbirths05.htm and for Death data: Miniño AM, Heron M, Smith BL, Kochanek KD, “Deaths: Final Data for 2004.” Health E-Stats. Released November 24, 2006.

Table of Contents Introduction....................................................................................................................... 3
Source of Vital Statistics................................................................................................. 3 How to Access Annual Statistical and other CHS Information...................................... 4 Annual Trends................................................................................................................. 6 Maternal mortality .......................................................................................................... 6
Overview Table 1. Live Births, Deaths, Infant Deaths, Maternal Deaths, and Fetal Deaths Washington Residents, 1910-2005 ........................................................................................................................... 7 Overview Table 1. Live Births, Deaths, Infant Deaths, Maternal Deaths, and Fetal Deaths Washington Residents, 1910-2005 ........................................................................................................................... 8 Overview Table 1. Live Births, Deaths, Infant Deaths, Maternal Deaths, and Fetal Deaths Washington Residents, 1910-2005 ........................................................................................................................... 9
Exploring high relative risk regions.............................................................................. 11 Heart Disease ................................................................................................................ 11 Lung Cancer.................................................................................................................. 14 Discussion..................................................................................................................... 16
Natality............................................................................................................................. 18 A. Demographics ......................................................................................................... 18
Natality Table A1. Demographic Summary Indicators for Residents, 1996 - 2005 ..............................18 Natality Table A2a. Mother's Race/Ethnicity by Child's Sex¹ for Residents, 2005 ...............................19 Natality Table A2b. Mother's Multiple Race by Child's Sex¹ for Residents, 2005 ................................19 Natality Table A3. Mother's Age Group by Child's Sex¹ for Residents, 2005.......................................20 Natality Table A4. Child's Birth Order by Mother's Age Group for Residents, 2005 ............................20 Natality Table A5. Mother's Education by Mother's Age Group for Residents, 2005 ...........................20 Natality Table A6a. Top 100 Baby Names of Girls for Residents, 2005 ..............................................21 Natality Table A6b. Top 100 Baby Names of Boys for Residents, 2005..............................................22 Natality Table A7. County/City of Residence, Sex1, and County/City of Occurrence, 2005.................24 Natality Table A7. (Continued) County/City of Residence, Sex1, and County/City of Occurrence, 2005.............................................................................................................................................................25 Natality Table A8. Month of Birth by County of Residence, 2005 ........................................................26 Natality Table A9. Mother's Age Group by County of Residence, 2005 ..............................................27 Natality Table A10. Age Specific Live Birth Rates1 by County of Residence, 2005.............................28 Natality Table A11. Single Mothers, Mother's Age Group by County of Residence, 2005...................29 Natality Table A12. Father's Age Group by County of Residence, 2005 .............................................30 Natality Table A13a. Mother's Race/Ethnicity by County of Residence, 2005.....................................31 Natality Table A13b. Mother's Multiple Race by County of Residence, 2005 ......................................32 Natality Table A14. Mother's Education by County of Residence, 2005..............................................33
B. Behavioral and Health Characteristics .................................................................... 34 Natality Table B1. Behavioral and Health Summary Indicators for Residents, 1996 - 2005 ................34 Natality Figure 1. Maternal smoking, regions and trends.....................................................................35 Natality Table B2. Mother's Age Group by Maternal Smoking for Residents, 2005.............................35 Natality Table B2. Mother's Age Group by Maternal Smoking for Residents, 2005.............................36 Natality Table B3. Mother's Education by Maternal Smoking for Residents, 2005 ..............................36 Natality Table B4. Maternal Smoking During Pregnancy by County of Residence, 2005....................37 Natality Table B5. Selected Medical Risk Factors¹ by County of Residence, 2005 .............................38 Natality Table B6. Body Mass Index¹ by County of Residence, 2005..................................................39
C. Health Service Utilization ....................................................................................... 40 Natality Table C1. Health Service Utilization Summary Indicators for Residents, 1995 - 2005 ............40 Natality Figure 2. Late or no prenatal care, regions and trends............................................................41 Natality Table C2. Month Prenatal Care Began by Mother's Age Group for Residents, 2005 .............41 Natality Table C2. Month Prenatal Care Began by Mother's Age Group for Residents, 2005 .............42 Natality Table C3. Number of Prenatal Visits by Month Prenatal Care Began for Residents, 2005 ....42 Natality Table C4. Month Prenatal Care Began by County of Residence, 2005..................................43 Natality Table C5. Birth Facility by County of Occurrence, 2005 .........................................................44 Natality Table C6. Method of Delivery¹ by County of Occurrence, 2005..............................................45 Natality Table C7. Birth Attendant by County of Occurrence, 2005.....................................................46

Natality Table C8 County of Residence by County of Occurrence, 2005 ...........................................48 Natality Table C8 (Continued) County of Residence by County of Occurrence, 2005.........................49
D. Infant Health ........................................................................................................... 50 Natality Table D1. Infant Health Summary Indicators for Residents, 1996- 2005................................50 Natality Figure 3. Low birth weight .......................................................................................................51 Natality Figure 4. Singleton birth low birth weight.................................................................................51 Natality Figure 4. Singleton birth low birth weight.................................................................................52 Natality Table D2a. Birth Weight in Grams by Mother's Race/Ethnicity for Residents, 2005...............52 Natality Table D2a. Birth Weight in Grams by Mother's Race/Ethnicity for Residents, 2005...............53 Natality Table D2b. Birth Weight in Grams by Mother's Multiple Race for Residents, 2005 ................53 Natality Table D3. Birth Weight in Grams by Mother's Age Group for Residents, 2005 ......................54 Natality Table D4. Birth Weight in Grams by Calculated Gestational Age1 for Residents, 2005..........54 Natality Table D5. Birth Weight in Grams by Plurality for Residents, 2005..........................................55 Natality Table D6. Mother's Age Group by Plurality for Residents, 2005.............................................55 Natality Table D7. Birth Weight in Grams by County of Residence, 2005 ...........................................56 Natality Table D8. Calculated Gestational Age1 by County of Residence, 2005 .................................57 Natality Table D9. Plurality by County of Residence, 2005 .................................................................58
Mortality .......................................................................................................................... 60 A. Demographics ......................................................................................................... 60
Mortality Table A1. Age-Adjusted Mortality Rates and Life Expectancy by Sex for Residents, 1996-2005. ....................................................................................................................................................60 Mortality Figure 5. All deaths ................................................................................................................61 Mortality Table A2. Age by Race/Ethnicity for Residents, 2005...........................................................62 Mortality Table A2b. Age by Multiple Race for Residents, 2005..........................................................62 Mortality Table A3. Age by Sex for Residents, 2005 ...........................................................................63 Mortality Table A4. Life Expectancy1 by Age and Sex for Residents, 2005.........................................63 Mortality Table A5. Marital Status by Sex for Residents, 2005............................................................64 Mortality Table A6. Education by Age for Residents, 2005..................................................................64 Mortality Table A7-a. Residence and Occurrence by County and City, 2005 ......................................66 Mortality Table A7-a. (Continued) Residence and Occurrence by County and City, 2005 ..................67 Mortality Table A7-b. Residence and Occurrence by County Listed by Age-Adjusted Rates for 2003-2005. ....................................................................................................................................................68 Mortality Table A8. Sex and Race/Ethnicity by County/City of Residence, 2005.................................70 Mortality Table A8. (Continued) Sex and Race/Ethnicity by County/City of Residence, 2005.............71 Mortality Table A8b. Sex and Multiple Race by County/City of Residence, 2005................................72 Mortality Table A8b. (Continued) Sex and Multiple Race by County/City of Residence, 2005 .............73 Mortality Table A9. Age Group by County of Residence, 2005 ...........................................................74 Mortality Table A10. Month of Death by County of Residence, 2005 ..................................................75 Mortality Table A11. Place Where Death Occurred by County of Occurrence, 2005 ..........................76
B. Autopsy and Disposition ......................................................................................... 77 Mortality Table B1. Percent Autopsy and Cremation for Residents, 1996-2005..................................77 Mortality Table B2. Autopsy by Age and Manner of Death for Residents, 2005 ..................................78 Mortality Table B3. Type of Disposition by County of Residence, 2005 ..............................................79
C. Leading Causes of Death, Overview, and Selected Causes of Death ..................... 80 Mortality Table C1. Age-Adjusted Rates¹ for 10 Leading Causes of Death for Residents, 1996-200580 Mortality Figure 6. Heart disease deaths ..............................................................................................81 Mortality Figure 7. Stroke deaths..........................................................................................................81 Mortality Figure 7. Stroke deaths..........................................................................................................82 Mortality Table C2. Leading Causes of Death for Residents, 2005 .....................................................82 Mortality Table C2. Leading Causes of Death for Residents, 2005 .....................................................83 Mortality Figure 8. Leading Causes of Death for Residents, 2005 .......................................................83 Mortality Table C3. Leading Causes by Age Group and Sex for Residents, 2005 ..............................84 Mortality Table C3. (Continued) Leading Causes by Age Group and Sex for Residents, 2005...........85 Mortality Table C4. Crude Rates for Selected Causes by Sex for Residents, 2005 ............................86 Mortality Table C4. (Continued) Crude Rates for Selected Causes by Sex for Residents, 2005.........87 Mortality Table C5. Age-Adjusted Rates for Selected Causes by Sex for Residents, 2005.................88 Mortality Table C5. (Continued) Age-Adjusted Rates for Selected Causes by Sex for Residents, 2005.............................................................................................................................................................89 Mortality Table C6. Diabetes, Alzheimer's Disease, and Major Cardiovascular Disease by County of Residence, 2005 ..................................................................................................................................90

Mortality Table C7. Diseases of the Heart, Ischemic Heart Diseases, and Cerebrovascular Diseases by County of Residence, 2005 .............................................................................................................91 Mortality Table C8. Influenza & Pneumonia, Chronic Lower Respiratory Disease, and Chronic Liver Disease & Cirrhosis by County of Residence, 2005 .............................................................................92
D. Cancer ..................................................................................................................... 93 Mortality Table D1. Age-Adjusted Rates¹ for Leading Causes of Cancer for Residents, 1996-2005...93 Mortality Figure 9. All cancer deaths ....................................................................................................94 Mortality Figure 10. Lung cancer deaths ..............................................................................................94 Mortality Figure 10. Lung cancer deaths ..............................................................................................95 Mortality Table D2. Cancer by Primary Site by Sex for Residents, 2005.............................................95 Mortality Table D2. Cancer by Primary Site by Sex for Residents, 2005.............................................96 Mortality Table D3. Cancer for Total All Sites, Lung, and Colo-Rectal by County of Residence, 200597 Mortality Table D4. Cancer for Female Breast, Prostate, and Pancreas by County of Residence, 2005.............................................................................................................................................................98
E. External Causes or Injuries...................................................................................... 99 Mortality Table E1. Age-Adjusted Rates¹ for External Causes for Residents, 1996-2005 .................100 Mortality Table E2-a. External Causes of Injury With Crude Rates for Residents, 2005 ...................101 Mortality Table E2-b. External Causes of Injury With Age-Adjusted Rates for Residents, 2005........102 Mortality Table E2-c. ICD-10 Codes for External Causes..................................................................103 Mortality Table E3. External Causes by Place of Injury for Residents, 2005.....................................104 Mortality Table E4. Type of Firearm by Intent for Residents, 2005....................................................104 Mortality Table E5. Poisoning by Intent and Substance for Residents, 2005 ....................................105 Mortality Table E6. Suicide, Homicide, and Undetermined by County of Residence, 2005...............106 Mortality Table E7. Drug and Alcohol-Induced Causes for Residents, 2005 .....................................107 Mortality Table E8. Unintentional Injury (Accident), Motor Vehicle Traffic, and Falls by County of Residence, 2005 ................................................................................................................................108 Mortality Table E9. Drowning, Fires, and Other Unintentional Injury (Accident) by County of Residence, 2005 ................................................................................................................................109 Mortality Table E10. Suicide, Homicide, and Undetermined to Residents by County of Injury, 2005 110 Mortality Table E11. Unintentional Injury (Accident) to Residents by County of Injury, 2005 ............111
F. Infant Mortality...................................................................................................... 112 Mortality Table F1. Selected Causes for Infants (< 1 Year) Residents, 1996-2005...........................112 Mortality Figure 11. Infant Mortality ....................................................................................................113 Mortality Table F2. Leading Causes of Infant (Age < 1 Year) Death for Residents, 2005 .................113 Mortality Table F2. Leading Causes of Infant (Age < 1 Year) Death for Residents, 2005 .................114 Mortality Figure 12. Leading Causes of Infant (Age <1 Year) Death for Residents, 2005 .................114 Mortality Table F3. Birth Weight and Age for Infant (Age < 1 Year) Residents, 2005.........................115 Mortality Table F4-a. Selected Causes by Age and Sex for Infant (Age < 1 Year) Residents, 2005 ..116 Mortality Table F4-b. Selected Causes by Age and Sex for Infant (Age < 1 Year) Residents, 2005 ..117 Mortality Table F5. Selected Causes for Infant (Age < 1 Year) County of Residence, 2005 ..............118 Mortality Table F6. Mother's Race/Ethnicity1 by Infant (Age < 1 Year) County of Residence2, 2005.119 Mortality Table F7. Mother's Age Group1 by Infant (Age < 1 Year) by Place of Residence2, 2005....120 Mortality Table F8. Fetal Deaths, Perinatal, Neonatal, and Infant Mortality by County/City of Residence, 2005 ................................................................................................................................122 Mortality Table F8. (Continued) Fetal Deaths, Perinatal, Neonatal, and Infant Mortality by County/City of Residence, 2005 ............................................................................................................................123
G. Fetal Death ............................................................................................................ 124 Mortality Table G1. Selected Causes of Fetal Deaths for Residents, 1996-......................................124 2005 ...................................................................................................................................................124 Mortality Table G2. Fetal Deaths by Mother's Age Group by Place of Residence, 2005...................125 Mortality Table G3. Fetal Deaths for Residents by Cause, 2005.......................................................126 Mortality Table G4. Fetal Deaths by Weight and Sex for Residents, 2005........................................127
Marriage ........................................................................................................................ 130 Table 1. Marriages by County of Occurrence and County of Residence¹, 2005.................................131 Table 2. Marriages by Woman's Age and County where Ceremony was Performed, 2005 ..............132 Table 3. Marriages by Man's Age and County where Ceremony was Performed, 2005....................133
Divorce ........................................................................................................................... 136 Table 1. Divorces and Annulments by County of Decree and County of Residence¹, 2005...............137 Table 2. Divorces, Annulments, and Legal Separations by County of Decree, 2005 ........................138 Table 3. Divorces and Annulments by Wife's Age and County of Decree, 2005 ...............................139

Table 4. Divorces and Annulments by Husband's Age and County of Decree, 2005 ........................140 Table 5. Divorces and Annulments by Number of Children¹ and County of Wife's Residence², 2005...........................................................................................................................................................141
Appendix A. Technical Appendix............................................................................... 144 Interpreting Vital Statistics ......................................................................................... 144 Trend Analysis ............................................................................................................ 144 Frequently asked Questions: ....................................................................................... 145
Residence vs. Occurrence .......................................................................................................................................................145 Numbers vs. Crude or Age-Adjusted Rates............................................................................................................................146 Standards for Comparison of Rates ........................................................................................................................................147 Unknowns ...............................................................................................................................................................................148 Changes in Classification of Causes of Death (ICD-10)........................................................................................................149 Small Numbers........................................................................................................................................................................150 Data Quality ............................................................................................................................................................................151 Confidentiality ........................................................................................................................................................................152
Sources of Data ........................................................................................................... 153 Collection Year .......................................................................................................................................................................153 Population ...............................................................................................................................................................................153 Classification of Data ..............................................................................................................................................................153
Demographics ............................................................................................................. 153 Age ..........................................................................................................................................................................................153 Race.........................................................................................................................................................................................154 County of Residence ...............................................................................................................................................................155 City of Residence ....................................................................................................................................................................156
Birth Data Notes ......................................................................................................... 157 Method of Delivery.................................................................................................................................................................159
Death Certificate Items: .............................................................................................. 160 Underlying Cause Of Death....................................................................................................................................................160
Cause of Death Groupings .......................................................................................... 161 Maternal Death ........................................................................................................................................................................162 Perinatal Death........................................................................................................................................................................163
Marriage and Divorce Data......................................................................................... 164 Residence vs. Occurrence Data ..............................................................................................................................................164 Legal Separations....................................................................................................................................................................164 Court Orders............................................................................................................................................................................164 Number of Children ................................................................................................................................................................165
Definitions................................................................................................................... 166 Rates and Ratios.......................................................................................................... 168
Appendix B. Conversion of Birth Weight in Grams to Pounds and Ounces ......... 170 Appendix C. Estimated Population, State of Washington, by Age Group by Sex, April 1, 2004 .................................................................................................................. 171 Appendix D. Estimated Population of Counties and Cities of 15,000 Population and Over, April 1, 2005........................................................................................................ 172 Appendix E. Comparison Between Current and Previous Table Numbers........... 174 Appendix F. Sample Certificates ................................................................................ 178
Birth Filing Form ........................................................................................................ 179 Certificate of Death..................................................................................................... 180 Certificate of Death..................................................................................................... 181 Certificate of Fetal Death............................................................................................ 182 Certificate of Dissolution............................................................................................ 183 Certificate of Dissolution............................................................................................ 184 Certificate of Marriage................................................................................................ 185

Introduction
Washington State Vital Statistics 2005

Washington Counties and County Seats
#
#
##
##
# #
##
#
#
###
#
#
###
#
##
#
##
#
#
##
##
#
##
#
##
#
Yakima
Okanogan
King
Grant
Ferry
Lewis
Chelan
Clallam
Kittitas
Lincoln
Stevens
Skagit
Pierce Adams
Whatcom
Benton
Klickitat
Whitman
Jefferson Douglas
Spokane
Snohomish
Pacific
Skamania
GraysHarbor
Cowlitz
Franklin
Mason
Clark
PendOreille
Walla Walla AsotinColumbia
Garfield
Kitsap
Thurston
Island
SanJuan
Wahkiakum Pasco
Kelso
Tacoma
Colfax
Yakima
AsotinDayton
Newport
Everett
Spokane
Seattle
EphrataShelton
Olympia
Pomeroy
Prosser
RepublicColville
Okanogan
Chehalis
Davenport
Wenatchee
Ritzville
Montesano
Cathlamet
StevensonVancouver
Bellingham
Coupeville
Waterville
SouthBend
Goldendale
Ellensburg
Walla Walla
Mount Vernon
Port Angeles
PortOrchard
FridayHarbor
PortTown-send
Washington State Vital Statistics 2005 2

Introduction Washington State Vital Statistics, 2005, published by the Center for Health Statistics of the Washington State Department of Health, contains tables on births, deaths, marriages and dissolutions of marriage (i.e., divorces, annulments) that occurred during calendar year 2005. Publication of vital statistics supports the mission of the Department of Health to protect and improve the health of people in Washington State. Timely and wide-ranging health information, such as that presented in Washington State Vital Statistics, is crucial to accomplishing this mission. Vital statistics data are used by policy makers, health professionals, community-based organizations, researchers, and citizens to understand trends in vital statistics, identify high risk populations (and geographic areas), set prevention priorities, and plan targeted health promotion strategies. This report is often the first resource used to identify problems related to prenatal care, maternal and infant health, family planning, and mortality due to various causes. Source of Vital Statistics Data used to prepare this report come from Certificates of Live Birth, Certificates of Fetal Death, Certificates of Death, Certificates of Marriage, and Certificates of Dissolution. The forms for these certificates are provided by the Washington State Department of Health. The following table describes who completes the forms and where they are filed:
Filing of Washington State Vital Statistics Certificate Completed by Initially Filed with Live Birth Hospital or Birth
Attendant State Dept. of Health
Fetal Death Hospital or Birth Attendant
Local Health Jurisdiction
Death Funeral Director and Physician, Coroner or Medical Examiner
Local Health Jurisdiction
Marriage Person Performing the Marriage
County Auditor
Dissolution Clerk of Court, Petitioner’s Attorney
County Clerk
Washington State Vital Statistics 2005 3
RCW 70.58 which governs the registration and reporting of vital statistics requires births, fetal deaths, deaths, marriages, and dissolutions of marriage to be reported within a timely fashion. Birth and death certificates are designed to gather information in a manner consistent with federal reporting requirements of the National Center for Health Statistics. On October 1, 2002, the Department of Health adopted amendments to Washington Administrative Code (WAC) 246-491, sections 029,039 and 149. These changes assured that the state’s birth, death and fetal death certificates will be consistent with the US Standard Certificates. New Birth and Fetal Death Certificates have been in place since January 1, 2003. The 2003 Vital Statistics Report covered the first year’s data collected using the new Birth and Fetal Death Certificates. The new Death Certificate was in place on January 1, 2004. Death data in this Vital Statistics Report cover the first year’s data collected using the new death certificate. A formal interstate exchange agreement governs the mutual exchange of information on births, deaths and fetal deaths between states and other countries so that events occurring to Washington residents elsewhere are also reported to this state. Such an interstate exchange agreement does not exist, however, for marriages and divorces. Therefore, the Center for Health Statistics does not have the marriage and divorce records for all of the state’s residents since some may have gone elsewhere to be married or divorced. Between 1992 and 2002, hospitals or birth attendants used the Electronic Birth Certificate (EBC) system to send birth records directly to the Department of Health instead of to registrars of local health jurisdictions. On January, 1, 2003, hospitals and birth attendants began using the Birth Record Realtime Registration (BR3) system, a web-based reporting system that allows almost instantaneous registration of births directly to the Center for Health Statistics at the Department of Health. See Appendix A, Section I for information on how to best use and interpret Vital Statistics. How to Access Annual Statistical and other CHS Information This annual report, which provides an overview of the vital statistics data collected from certificates, is available through the Washington State Center for Health Statistics. Birth, death, and fetal death data are also available as raw data files on the Center’s CD-ROM “Vital Registration System Annual
Washington State Vital Statistics 2005 4

Statistical Files, Washington State.” The CD-ROM contains data in ASCII format, detailed technical documentation, and annual summary tables for 1980-2005 in Excel format. To order a copy of the CD-ROM, call (360) 236-4327. All of the information in this report is available on the Internet. To access this information, go to the DOH web page at: http://www.doh.wa.gov/EHSPHL/CHS/CHS-Data/main.htm. At that point a list of subject topics appears (e.g., “births,” “deaths”). Click on any of these topics to locate a table or tables of particular interest. Tables are available not only for the current year but for previous years as well. Click on “publications” to download a PDF copy of this report. The Center for Health Statistics also works with data users on a variety of levels: 1) to help users formulate requests so they get the data they need; 2) to provide technical consultation about how to use or interpret data; 3) to perform special analyses to address a specific problem or need; and 4) to help users access data files. For more information, call the Manager of Research of the Center for Health Statistics at (360) 236-4321. The Center for Health Statistics also houses data from the Behavioral Risk Factor Surveillance Survey (BRFSS) which is the largest, continuously conducted, telephone health survey in the world. It enables the state and local health departments, the Centers for Disease Control and Prevention (CDC), and other health agencies to monitor modifiable risk factors for chronic diseases and other leading causes of death. The Center for Health Statistics also captures and publishes several types of hospital data, including the Comprehensive Hospital Abstract Reporting System (CHARS) which has all admissions and discharges to all hospitals in Washington State by year, as well as various financial reports on Washington State hospitals, including the Charity Care in Washington Hospitals report.
Washington State Vital Statistics 2005 5

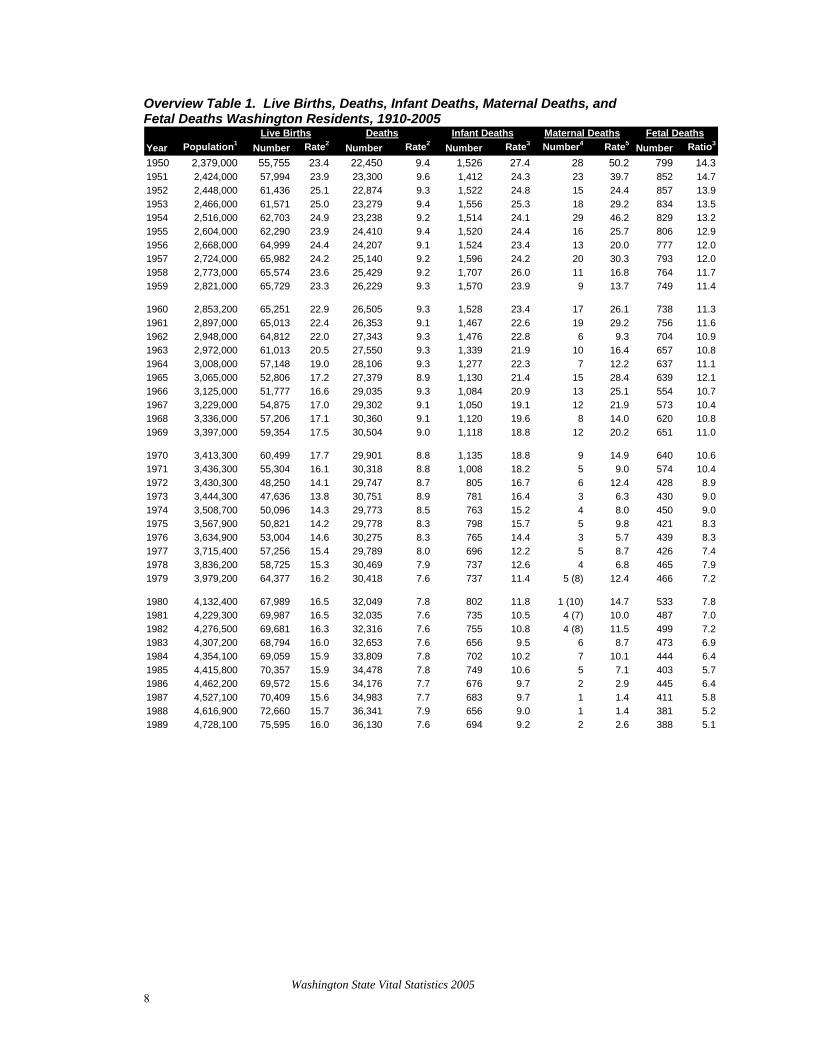
Annual Trends Overview Table 1 provides a historical context for interpreting 2005 vital statistics in Washington State. The number of births increased in 2005, compared to 2004. However, the state’s population also increased. As a result, there was no difference in the birth rate. The number of deaths increased in 2004 but the overall death rate changed little. The number and rate for infant deaths both decreased by about 7% in 2005. The number and ratio for fetal deaths both had relatively large increases in 2003, decreased in 2004 to levels consistent with 2000-2002, and increased again in 2005 to levels slightly larger than in 2003. Trends in vital statistics since the early part of the last century have been dramatic. The state population increased more than five-fold from 1910-2005, while the number of fetal deaths is about 40% lower than it was and the number of infant deaths is less than one-quarter what it was early in the century. The difference in rates is even more dramatic. The fetal death ratio had about a six-fold decrease while the infant death rate decreased about 18-fold. Maternal mortality Notes on maternal death reporting: Maternal death rates are based on very small numbers (even the relatively large 2005 rate is only based on 26 deaths) and should be interpreted with particular caution. Specifically, in 2004 Washington State implemented the U.S. Standard Certificate of Death which includes a separate check box related to pregnancy status of female decedents around the time of their death. If the box is marked yes, then the death will be included in the maternal death category regardless of the actual underlying cause of death. This separate pregnancy status item on the death certificate may explain much of the increase in maternal deaths.
Washington State Vital Statistics 2005 6

Overview Table 1. Live Births, Deaths, Infant Deaths, Maternal Deaths, and Fetal Deaths Washington Residents, 1910-2005
Year Population1 Number Rate2 Number Rate2 Number Rate3 Number4 Rate5 Number Ratio3
1910 1,142,000 19,916 17.4 11,502 10.1 1,862 93.5 194 974.1 705 35.41911 1,168,800 20,728 17.7 10,845 9.3 1,531 73.9 177 853.9 699 33.71912 1,190,600 20,683 17.4 10,187 8.6 1,365 66.0 179 865.4 724 35.01913 1,212,400 21,200 17.5 11,397 9.4 1,566 73.9 178 839.6 688 32.51914 1,234,000 23,008 18.6 11,448 9.3 1,540 66.9 152 660.6 783 34.01915 1,256,000 24,046 19.1 11,895 9.5 1,461 60.8 156 648.8 779 32.41916 1,277,800 23,831 18.7 11,805 9.2 1,531 64.2 175 734.3 705 29.61917 1,299,600 23,464 18.1 12,137 9.3 1,625 69.3 173 737.3 691 29.41918 1,321,400 25,682 19.4 16,837 12.7 1,769 68.9 253 985.1 730 28.41919 1,343,200 25,112 18.7 14,370 10.7 1,584 63.1 216 860.1 730 29.1
1920 1,356,600 27,072 20.0 15,164 11.2 1,797 66.4 249 919.8 888 32.81921 1,385,700 27,267 19.7 13,254 9.6 1,512 55.5 192 704.1 852 31.21922 1,407,100 25,378 18.0 14,249 10.1 1,566 61.7 190 748.7 731 28.81923 1,427,300 25,259 17.7 13,856 9.7 1,428 56.5 159 629.5 680 26.91924 1,447,200 25,378 17.5 14,580 10.1 1,426 56.2 167 658.1 711 28.01925 1,467,600 24,741 16.9 15,280 10.4 1,395 56.4 140 565.9 667 27.01926 1,487,600 23,989 16.1 15,670 10.5 1,352 56.4 174 725.3 719 30.01927 1,507,800 23,315 15.5 15,950 10.6 1,162 49.8 151 647.7 650 27.91928 1,528,200 23,161 15.2 16,723 10.9 1,115 48.1 175 755.6 641 27.71929 1,548,400 22,685 14.7 16,413 10.6 1,110 48.9 150 661.2 572 25.2
1930 1,563,400 23,019 14.7 16,678 10.7 1,122 48.7 148 642.9 601 26.11931 1,585,000 22,028 13.9 16,524 10.4 1,064 48.3 141 640.1 591 26.81932 1,602,500 21,379 13.3 16,581 10.3 967 45.2 139 650.2 530 24.81933 1,619,700 20,882 12.9 16,705 10.3 811 38.8 140 670.4 446 21.41934 1,636,900 22,484 13.7 17,456 10.7 968 43.1 105 467.0 520 23.11935 1,654,000 22,378 13.5 18,046 10.9 998 44.6 120 536.2 469 21.01936 1,671,400 23,354 14.0 19,057 11.4 1,064 45.6 115 492.4 468 20.01937 1,689,100 24,882 14.7 18,771 11.1 978 39.3 118 474.2 495 19.91938 1,706,000 26,702 15.7 18,514 10.9 1,035 38.8 94 352.0 440 16.51939 1,723,400 26,471 15.4 18,528 10.8 977 36.9 97 366.4 450 17.0
1940 1,736,200 27,952 16.1 19,837 11.4 969 34.7 89 318.4 459 16.41941 1,816,700 30,916 17.0 19,359 10.7 1,065 34.4 66 213.5 445 14.41942 1,880,700 38,744 20.6 20,190 10.7 1,278 33.0 78 201.3 606 15.61943 1,945,000 44,258 22.8 22,017 11.3 1,534 34.7 72 162.7 575 13.01944 2,009,600 44,246 22.0 21,144 10.5 1,493 33.7 72 162.7 607 13.71945 2,073,600 44,296 21.4 21,292 10.3 1,523 34.4 79 178.3 672 15.21946 2,137,600 51,941 24.3 21,620 10.1 1,723 33.2 65 125.1 869 16.71947 2,202,400 58,230 26.4 21,763 9.9 1,630 28.0 59 101.3 907 15.61948 2,266,400 55,460 24.5 21,925 9.7 1,525 27.5 36 64.9 776 14.01949 2,331,000 56,433 24.2 22,420 9.6 1,526 27.0 36 63.8 850 15.1
Fetal DeathsLive Births Deaths Infant Deaths Maternal Deaths
Washington State Vital Statistics 2005 7
Overview Table 1. Live Births, Deaths, Infant Deaths, Maternal Deaths, and Fetal Deaths Washington Residents, 1910-2005
Year Population1 Number Rate2 Number Rate2 Number Rate3 Number4 Rate5 Number Ratio3
1950 2,379,000 55,755 23.4 22,450 9.4 1,526 27.4 28 50.2 799 14.31951 2,424,000 57,994 23.9 23,300 9.6 1,412 24.3 23 39.7 852 14.71952 2,448,000 61,436 25.1 22,874 9.3 1,522 24.8 15 24.4 857 13.91953 2,466,000 61,571 25.0 23,279 9.4 1,556 25.3 18 29.2 834 13.51954 2,516,000 62,703 24.9 23,238 9.2 1,514 24.1 29 46.2 829 13.21955 2,604,000 62,290 23.9 24,410 9.4 1,520 24.4 16 25.7 806 12.91956 2,668,000 64,999 24.4 24,207 9.1 1,524 23.4 13 20.0 777 12.01957 2,724,000 65,982 24.2 25,140 9.2 1,596 24.2 20 30.3 793 12.01958 2,773,000 65,574 23.6 25,429 9.2 1,707 26.0 11 16.8 764 11.71959 2,821,000 65,729 23.3 26,229 9.3 1,570 23.9 9 13.7 749 11.4
1960 2,853,200 65,251 22.9 26,505 9.3 1,528 23.4 17 26.1 738 11.31961 2,897,000 65,013 22.4 26,353 9.1 1,467 22.6 19 29.2 756 11.61962 2,948,000 64,812 22.0 27,343 9.3 1,476 22.8 6 9.3 704 10.91963 2,972,000 61,013 20.5 27,550 9.3 1,339 21.9 10 16.4 657 10.81964 3,008,000 57,148 19.0 28,106 9.3 1,277 22.3 7 12.2 637 11.11965 3,065,000 52,806 17.2 27,379 8.9 1,130 21.4 15 28.4 639 12.11966 3,125,000 51,777 16.6 29,035 9.3 1,084 20.9 13 25.1 554 10.71967 3,229,000 54,875 17.0 29,302 9.1 1,050 19.1 12 21.9 573 10.41968 3,336,000 57,206 17.1 30,360 9.1 1,120 19.6 8 14.0 620 10.81969 3,397,000 59,354 17.5 30,504 9.0 1,118 18.8 12 20.2 651 11.0
1970 3,413,300 60,499 17.7 29,901 8.8 1,135 18.8 9 14.9 640 10.61971 3,436,300 55,304 16.1 30,318 8.8 1,008 18.2 5 9.0 574 10.41972 3,430,300 48,250 14.1 29,747 8.7 805 16.7 6 12.4 428 8.91973 3,444,300 47,636 13.8 30,751 8.9 781 16.4 3 6.3 430 9.01974 3,508,700 50,096 14.3 29,773 8.5 763 15.2 4 8.0 450 9.01975 3,567,900 50,821 14.2 29,778 8.3 798 15.7 5 9.8 421 8.31976 3,634,900 53,004 14.6 30,275 8.3 765 14.4 3 5.7 439 8.31977 3,715,400 57,256 15.4 29,789 8.0 696 12.2 5 8.7 426 7.41978 3,836,200 58,725 15.3 30,469 7.9 737 12.6 4 6.8 465 7.91979 3,979,200 64,377 16.2 30,418 7.6 737 11.4 5 (8) 12.4 466 7.2
1980 4,132,400 67,989 16.5 32,049 7.8 802 11.8 1 (10) 14.7 533 7.81981 4,229,300 69,987 16.5 32,035 7.6 735 10.5 4 (7) 10.0 487 7.01982 4,276,500 69,681 16.3 32,316 7.6 755 10.8 4 (8) 11.5 499 7.21983 4,307,200 68,794 16.0 32,653 7.6 656 9.5 6 8.7 473 6.91984 4,354,100 69,059 15.9 33,809 7.8 702 10.2 7 10.1 444 6.41985 4,415,800 70,357 15.9 34,478 7.8 749 10.6 5 7.1 403 5.71986 4,462,200 69,572 15.6 34,176 7.7 676 9.7 2 2.9 445 6.41987 4,527,100 70,409 15.6 34,983 7.7 683 9.7 1 1.4 411 5.81988 4,616,900 72,660 15.7 36,341 7.9 656 9.0 1 1.4 381 5.21989 4,728,100 75,595 16.0 36,130 7.6 694 9.2 2 2.6 388 5.1
Live Births Deaths Infant Deaths Maternal Deaths Fetal Deaths
Washington State Vital Statistics 2005 8

Overview Table 1. Live Births, Deaths, Infant Deaths, Maternal Deaths, and Fetal Deaths Washington Residents, 1910-2005
Year Population1 Number Rate2 Number Rate2 Number Rate3 Number4 Rate5 Number Ratio3
1990 4,866,700 79,468 16.3 37,047 7.6 622 7.8 4 (5) 5.0 462 5.81991 5,021,335 79,962 15.9 37,028 7.4 603 7.5 3 (8) 3.8 426 5.31992 5,141,177 79,897 15.5 38,095 7.4 540 6.8 3 (6) 3.8 448 5.61993 5,265,688 78,771 15.0 40,380 7.7 495 6.3 6 (8) 7.6 396 5.01994 5,364,338 77,368 14.4 39,906 7.4 478 6.2 3 (4) 3.9 443 5.71995 5,470,104 77,240 14.1 40,729 7.4 449 5.8 0 (3) 0.0 419 5.41996 5,567,764 77,874 14.0 42,248 7.6 467 6.0 3 (6) 3.9 462 5.91997 5,663,763 78,141 13.8 41,429 7.3 440 5.6 2 2.6 457 5.81998 5,750,033 79,640 13.9 42,585 7.4 452 5.7 3 3.8 471 5.91999 5,830,835 79,577 13.6 43793 7.5 401 5.0 6 7.5 468 5.9
2000 5,894,121 81,004 13.7 43,904 7.4 423 5.2 3 3.7 437 5.42001 5,974,900 79,542 13.3 44,563 7.5 461 5.8 9 11.3 418 5.32002 6,041,710 79,003 13.1 45,244 8.0 452 5.7 7 8.9 434 5.52003 6,098,300 80,482 13.2 45,807 8.0 447 5.6 2 2.5 498 6.22004 6,167,800 81,715 13.2 44,703 7.2 451 5.5 22 26.9 432 5.32005 6,256,400 82,625 13.2 46,015 7.4 420 5.1 27 32.7 519 6.3
4 Numbers in parentheses include maternal deaths that are based on 1979-1998 studies using links from birth and death certificates and 1990-1996 links of deaths and hospitalizations with birth and fetal deaths; Maternal deaths in other years are based only on the death certificate and may undercount deaths due to complications of pregnancy. 5 Rate per 100,000 live births (change from previous reports). * The increase in maternal deaths should be interpreted with caution. The 2004 Death Certificate includes a new question which asks if the decedent is female was she pregnant. If the box is marked yes, then the death will be included in the maternal death category regardless of the actual underlying cause of death.
Note: Rates based on fewer than 20 events are likely to be unstable and imprecise.
Fetal Deaths
1 Population figures for 1910-1950 ten year intervals and for 1950-2001 single years are from the Office of Financial Management, Forecasting Division. Current Population Data: See Appendix A: Technical Appendix2 Rate per 1,000 population.3 Ratio per 1,000 live births.
Live Births Deaths Infant Deaths Maternal Deaths
Washington State Vital Statistics 2005 9

Washington State Vital Statistics 2005 10

Exploring high relative risk regions As was done in last year’s report, this year we have included maps of high relative risk regions and graphs of statewide trends for a subset of natality measures:
• Maternal smoking, • Late or no prenatal care, • Low birth weight, and • Singleton low birth weight;
and, mortality measures: • All deaths, • Heart disease deaths, • Stroke deaths, • All cancer deaths, • Lung cancer deaths, and • Infant mortality.
The methods used in these analyses are described in the introduction to the Vital Statistics 2004 report. In this year’s report, we are highlighting heart disease and lung cancer by exploring those regions with higher than expected mortality rates for these two leading causes of death, and by assessing the age-adjusted mortality rate trends within those regions. Heart Disease For each year between 2001 and 2005, as well as for those five years combined, the spatial scan statistic program, SaTScan1, identified regions in south central and south west Washington as having a heart disease mortality rate higher than in the rest of the state. For 2001-2005 combined, this high rate or high relative risk (RR) region included all or portions of 13 of the 39 counties in Washington State. The RR for this region was 1.2, or 20% higher than expected, equaling about 450 more heart disease deaths per year than expected. Concurrently, the JoinPoint2 regression program found that the statewide trend for age-adjusted heart disease mortality rates had been significantly decreasing from 1980 to 2005. Taken together, these two findings raised the following questions:
While the statewide trend is decreasing, what are the rates and trends like within and outside of this high RR region? Are the rates within significantly different from those outside the high RR region? Are their trends parallel, incongruent, or heading in opposite directions?
Washington State Vital Statistics 2005 11

To answer these questions, we identified all the census tracts in the 2001-2005 combined high relative risk region. For this region we then computed each individual year’s age-adjusted mortality rate from 1990 through 2005. At the same time, we identified all the census tracts outside the high relative risk region (calling this our heart disease reference area) and computed this area’s age-adjusted mortality rate for each year from 1990 through 2005. Rates prior to 1990 were not computed because we do not have tract-specific population estimates for those years. What we found -- For each year assessed, the age-adjusted heart disease mortality rate within the high RR region was significantly higher than the age-adjusted rate for the reference area. By applying the JoinPoint trend model we also found that while rates in both the high RR region and the reference area were decreasing, rates were decreasing more rapidly in the reference area (2.7% per year) than in the high RR region (2.2% per year).
Heart disease deaths: High relative risk regions 2001-2005 combined
Heart disease death rates: Trends inside and outside the high relative risk region, 1990-2005
Overall this meant that from 1990 to 2005 the rates within the high RR region fell by 40%, while those in the reference area fell by 50%. Since the rates within the high RR region are decreasing at a slower pthe differences between the two regions have been increasing: in 1990 the rate within the high RR region was 13% higher than the rate in the reference area; by 2005 it was 21% higher.
ace,
155
175
195
215
235
255
275
295
315
1990 1993 1996 1999 2002 2005
age-
adju
sted
rate
per
100
,000
per
sons
2.20% per year decrease
Rates and trend for statewide area outside the high RR region
2.66% per year decrease
Rates and trend for high RR region
Because the high RR region encompasses such a large area, we next reran SaTScan focusing only on the high RR region to see if we could identify any sub-regional areas with particularly high rates. SaTScan identified two such sub-regional areas: one included the western Pierce County and Tacoma environs; the other, portions of Yakima and Klickitat Counties. Trends for these two sub-regional areas were then computed.
Washington State Vital Statistics 2005 12

Compared to the reference area, the rates within the Tacoma/Pierce County area were significantly higher for each year assessed. The rates within the Yakima/Klickitat area were significantly higher than those in the reference area for 10 of the 16 years assessed. Although both the Tacoma/Pierce and Yakima/Klickitat areas had significantly decreasing rates, the speed at which those rates declined differed from that seen in the reference area: in the Tacoma/Pierce area they decreased by 2.0% per year, equaling an overall decline of 26% from 1990 to 2005; in the Yakima/Klickitat area they decreased by 1.6% per year, equaling an overall decline of 21% from 1990 to 2005. As was previously noted, the rates in the reference area decreased by 2.7% per year, equaling a 50% decline from 1990 to 2005. Because of these differences in the trends, not only are the rates higher in the Tacoma/Pierce and Yakima/Klickitat areas than in the reference area, the differences between those areas and the rarea are increasing. Specificall1990 the age-adjusted heart dimortality rate in the Tacoma/Pierce area was 29% higher than the rate in the reference area; in 2005 it was 47% higher. In the Yakima/Klickitatarea the rate was 15% higher than treference area rate in 1990 and 37%higher in 2005.
eference y, in sease
he
155
175
195
215
235
255
275
295
315
1990 1993 1996 1999 2002 2005
age-
adju
sted
rate
per
100
,000
per
sons
Rates and trend for the Yakima/South Central Washington environs within the high RR region
Rates and trend for statewide area outside the high RR region
1.56% per year decrease
2.66% per year decrease
155
175
195
215
235
255
275
295
315
1990 1993 1996 1999 2002 2005
age-
adju
sted
rate
per
100
,000
per
sons
Rates and trend for the Tacoma/Pierce environs within the high RR region
Rates and trend for statewide area outside the high RR region
1.97% per year decrease
2.66% per yeardecrease
Heart disease deaths: High rate areas within the high RR region together with
trends for those areas, 1990-2005
Washington State Vital Statistics 2005 13

Lung Cancer
s with heart disease, for each year between 2001 and 2005 and for those five years
R)
oncurrently, the statewide trend for age-adjusted lung cancer mortality rates showed a
s with heart disease, we thought it worthwhile to assess the trends within and outside
er
or each year from 1990 to 2005 the lity rate in the high
e
oint found at between 1993 and 2005 there was a
y int
RR region JoinPoint found o significant trend during the entire period
Acombined, the spatial scan statistic identified varying size regions in western and southwestern Washington as having a lung cancer mortality rate or relative risk (Rhigher than in the rest of the state. For 2001-2005 combined this region included all orportions of 12 counties, and, with an RR of 1.24, averaged 160 more lung cancer deathsper year than expected. Csignificant increase from 1980 to 1993 and then a significant decline from 1993 to 2005. Athis high RR lung cancer region. We therefore identified all the tracts within the 2001-2005 combined high RR region and computed age-adjusted rates for each year from 1990 to 2005. Similarly, we computed the age-adjusted lung cancer mortality rates from 1990 to 2005 for the remainder of the state outside the high RR region, calling this our lung cancreference area. What we found -- Fage-adjusted mortaRR region was significantly higher than thrate in the reference area, except in 1991. Within the reference area, JoinP
Lung cancer deaths: High relative risk regions 2001-2005 combined
Lung cancer death rates: Trends inside and outside the high relative risk region, 1990-2005
40
45
50
55
60
65
70
75
80
85
90
95
1990 1993 1996 1999 2002 2005
age-
adju
sted
rate
per
100
,000
per
sons
Rates for high RR regionNo significant trend (1990-2005
Rates and trend for statewide area outside the high RR region
1.17% per year decrease (1993-2005)
thsignificant trend with the rates decreasing b1.2% per year; from 1990 to 1993 JoinPoidentified no significant trend for the reference area. Within the high nfrom 1990 to 2005. Because the rates withinthe high RR region have remained essentiallyunchanged while those outside the high RR region are decreasing, the difference between the two areas is increasing.
Washington State Vital Statistics 2005 14

As was done with heart disease, the SaTScan program was next rerun focusing this time nly on the high RR region to see if any sub-regional areas with particularly high rates
ar from 1990 to 2000 and en leveled off with no significant trend from 2000 to 2005.
ncreasing from 1990 to 005 by 2.9% per year. Overall that equaled a 53% increase in the lung cancer mortality
cific/Mason
ounties region more closely by fic
h
e rates for omen, the differences are
ocould be identified. Two such areas were found, one in the Pierce County and Tacoma environs, the other including most of Grays Harbor and portions of Mason and Pacific Counties. Trends for these areas were computed, and for both of the sub-regional areas JoinPoint found that the rates were significantly increasing. In the Tacoma/Pierce area rates had increased by 2.3% per yeth In the Grays Harbor area, rates were found to be significantly i2rates for the residents of this region from 1990 to 2005. Given its relatively large and continuing upward trend, we choose to examinethe Grays Harbor/PaCassessing that area’s sex-specirates. In doing so we found that althougthe rates for men in this region are consistently higher than thwsignificant for only 2 of the 16 yearsexamined, 1992 and 1996.
40
45
50
55
60
65
70
75
80
85
90
95
1990 1993 1996 1999 2002 2005
age-
adju
sted
rate
per
100
,000
per
sons
Rates and trend for statewide area outside the high RR region
1.17% per year decrease (1993-2005)
Rates and trend for the Tacoma/Pierce environs within the high RR region
2.29% per year increase1990-2000
No significant trend2000-2005
40
45
50
55
60
65
70
75
80
85
90
95
1990 1993 1996 1999 2002 2005
age-
adju
sted
rate
per
100
,000
per
sons
Rates and trend for statewide area outside the high RR region
1.17% per year decrease (1993-2005)
Rates and trend for the Grays Harbor environs within the high RR region
2.89% per year increase
Lung cancer deaths: High rate areas within the high RR region together with
trends for those areas, 1990-2005
Washington State Vital Statistics 2005 15

In addition, while JoinPoint did not identify a
gnificant trend among the men’s rates, it did entify one for women: each year their age-
by n
examining two of the leading causes of isease and lung cancer, we
und large regions with higher than expected
ly
they were decreasing at a ower rate, not changing over time, or actually increasing while the rest of the state was
ld warrant rther assessment. Given that tobacco use and obesity are well-known risk factors for
n
data sets, and while we strive to aintain high quality vital statistics data, variations in coding practices within regions
Lung cancer death rates: Trends for men and women inside the
Grays Harbor/Pacific/Mason high relative risk region, 1990-2005 si
idadjusted lung cancer mortality rates increased by an average of 4.4%. Overall that represents a 92% increase in this area’s female rates from 1990 to 2005 – a near doubling in 16 years. Conversely, within the reference area, women’s rates increased 1.3% per year from 1990 to 2000 and theleveled off with no significant trend thereafter. Discussion Indeath, heart dfomortality rates, and, within those large regions, smaller areas that have particularhigh rates. In looking at the trends for these high RR areas we found that
30
35
40
45
50
55
60
65
70
75
80
85
90
95
100
105
110
115
120
1990 1993 1996 1999 2002 2005
age-
adju
sted
rate
per
100
,000
per
sons
Rates for males in Grays Harbor high RR areaNo significant trend, 1990 - 2005
Rates for females in Grays Harbor high RR area
4.45% per year increase
slexperiencing a significant decline or having no significant trend in their rates. We believe these high RR areas might be considered a priority concern and coufuheart disease, and tobacco use alone is the leading cause of lung cancer, these data might be an indication of higher smoking and obesity rates in these areas – risk factors that cabe changed through public health interventions. There are, of course, limitations to administrativemshould also be considered. 1 Kulldorff M. and Information Management Services, Inc. SaTScanTM v6.0: Software for the spatial and space-time scan statistics. http://www.satscan.org/, 2005. SaTScanTM is a trademark of Martin Kulldorff.
,
The SaTScanTM software was developed under the joint auspices of Martin Kulldorff, of the National Cancer Institute and of Farzad Mostashari at the New York City Department of Health and Mental Hygiene. 2 Joinpoint Regression Program, Version 3.0. April 2005; Statistical Research and Applications BranchNational Cancer Institute. http://srab.cancer.gov/joinpoint/
Washington State Vital Statistics 2005 16

Natality

Washington State Vital Statistics 2005 18
Natality A. Demographics Demographics (such as education, marital status and race) provide basic data about the women who are having babies. Lack of money or cultural/language barriers may prevent women from getting the care and services they need so that they can have a safe pregnancy and a healthy baby. Demographic birth data help health programs understand and address these disparities. Natality Table A1. Demographic Summary Indicators for Residents, 1996 - 2005
A Teenager (<20) Unmarried Not a High School Graduate A Woman of Color2
1996 11.2 27.2 18.3 24.81997 11.0 27.2 18.1 25.51998 10.9 27.9 18.1 26.11999 10.8 28.0 17.8 27.72000 10.2 28.3 17.4 29.52001 9.6 28.7 17.3 30.62002 9.0 28.8 17.0 31.82003 8.5 28.7 19.4 32.22004 8.4 30.2 19.3 33.32005 8.3 30.8 19.2 33.9
Percent of Births1 where Mother is…
1 Unknowns have been subtracted from total births in calculating percentages2 Includes all but White Non-Hispanic births. Trends for teenagers, women of color, and unmarried mothers continue as they have over the decade. The percent of births to women without a high school degree increased in 2003. However, the education item on the birth certificate changed substantially in 2003. High school graduation may have been overestimated in the past because of the way the data were collected (see ‘Birth Data Notes’ in the Technical Appendix). These data have changed very little since 2003.

Washington State Vital Statistics 2005 19
Natality Table A2a. Mother's Race/Ethnicity by Child's Sex¹ for Residents, 2005
Race/Ethnicity Number Percent2 Male FemaleState Total 82,625 100.0 42,329 40,296White 68,597 83.0 35,101 33,496African American 3,664 4.4 1,872 1,792Native American 1,795 2.2 929 866Japanese 433 0.5 230 203Chinese 999 1.2 515 484Filipino 1,271 1.5 645 626Other Asian 4,828 5.8 2,512 2,316Other 0 0.0 0 0Unknown 1,038 1.3 525 513Hispanic3 14,988 18.1 7,635 7,353
NOTE: Uses bridged race, see Technical Appendix
Total
1 Total includes 0 births for which sex is unknown.2 Percents may not add to 100% due to rounding.3 Persons of Hispanic Origin may be of any race. See Appendix A, "Hispanic Origin."
Natality Table A2b. Mother's Multiple Race by Child's Sex¹ for Residents, 2005
Race Number Percent2 Male FemaleState Total 82,625 100.0 42,329 40,296Single RaceWhite 67,531 81.7 34,555 32,976African American 3,122 3.8 1,589 1,533Native American 1,573 1.9 809 764Asian 6,334 7.7 3,265 3,069Pacific Islander 727 0.9 395 332Multiple RaceWhite/African American 495 0.6 256 239White/Native American 749 0.9 396 353White/Asian 636 0.8 313 323White/Pacific Islander 105 0.1 58 47Other mulitple race 462 0.6 248 214
Unknown 891 1.1 445 446
NOTE: Includes all races reported by mother, see Technical Appendix.
Total
1 Total includes 0 births for which sex is unknown.2 Percents may not add to 100% due to rounding.
Washington State Vital Statistics 2005 20
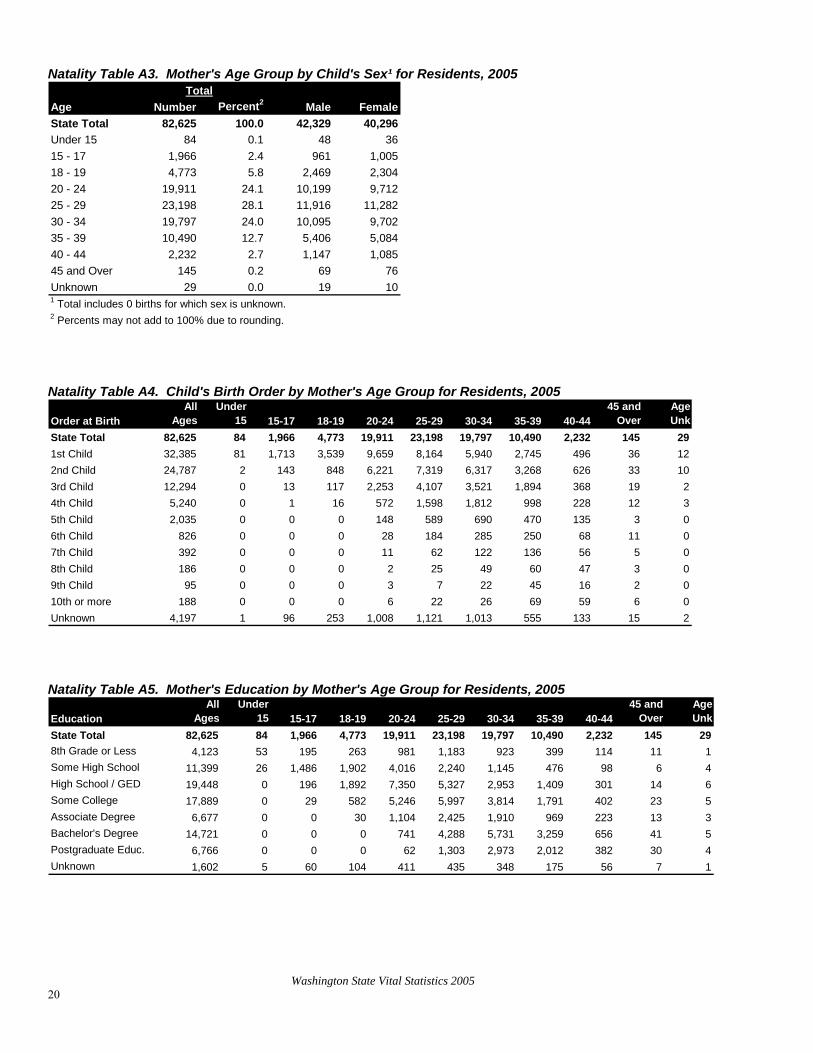
Natality Table A3. Mother's Age Group by Child's Sex¹ for Residents, 2005
Age Number Percent2 Male FemaleState Total 82,625 100.0 42,329 40,296Under 15 84 0.1 48 3615 - 17 1,966 2.4 961 1,00518 - 19 4,773 5.8 2,469 2,30420 - 24 19,911 24.1 10,199 9,71225 - 29 23,198 28.1 11,916 11,28230 - 34 19,797 24.0 10,095 9,70235 - 39 10,490 12.7 5,406 5,08440 - 44 2,232 2.7 1,147 1,08545 and Over 145 0.2 69 76Unknown 29 0.0 19 10
Total
1 Total includes 0 births for which sex is unknown.2 Percents may not add to 100% due to rounding. Natality Table A4. Child's Birth Order by Mother's Age Group for Residents, 2005
Order at BirthAll
AgesUnder
15 15-17 18-19 20-24 25-29 30-34 35-39 40-4445 and
OverAgeUnk
State Total 82,625 84 1,966 4,773 19,911 23,198 19,797 10,490 2,232 145 291st Child 32,385 81 1,713 3,539 9,659 8,164 5,940 2,745 496 36 122nd Child 24,787 2 143 848 6,221 7,319 6,317 3,268 626 33 103rd Child 12,294 0 13 117 2,253 4,107 3,521 1,894 368 19 24th Child 5,240 0 1 16 572 1,598 1,812 998 228 12 35th Child 2,035 0 0 0 148 589 690 470 135 3 06th Child 826 0 0 0 28 184 285 250 68 11 07th Child 392 0 0 0 11 62 122 136 56 5 08th Child 186 0 0 0 2 25 49 60 47 3 09th Child 95 0 0 0 3 7 22 45 16 2 010th or more 188 0 0 0 6 22 26 69 59 6 0Unknown 4,197 1 96 253 1,008 1,121 1,013 555 133 15 2 Natality Table A5. Mother's Education by Mother's Age Group for Residents, 2005
EducationAll
AgesUnder
15 15-17 18-19 20-24 25-29 30-34 35-39 40-4445 and
OverAgeUnk
State Total 82,625 84 1,966 4,773 19,911 23,198 19,797 10,490 2,232 145 298th Grade or Less 4,123 53 195 263 981 1,183 923 399 114 11 1Some High School 11,399 26 1,486 1,902 4,016 2,240 1,145 476 98 6 4High School / GED 19,448 0 196 1,892 7,350 5,327 2,953 1,409 301 14 6Some College 17,889 0 29 582 5,246 5,997 3,814 1,791 402 23 5Associate Degree 6,677 0 0 30 1,104 2,425 1,910 969 223 13 3Bachelor's Degree 14,721 0 0 0 741 4,288 5,731 3,259 656 41 5Postgraduate Educ. 6,766 0 0 0 62 1,303 2,973 2,012 382 30 4Unknown 1,602 5 60 104 411 435 348 175 56 7 1

Washington State Vital Statistics 2005 21
Natality Table A6a. Top 100 Baby Names of Girls for Residents, 2005
Rank First Name N % N % Rank First Name N % N %1 EMMA 428 1.1 428 1.1 51 KAITLYN 106 0.3 9,882 24.52 EMILY 425 1.1 853 2.1 52 TRINITY 106 0.3 9,988 24.83 OLIVIA 361 0.9 1,214 3.0 53 RACHEL 105 0.3 10,093 25.04 MADISON 360 0.9 1,574 3.9 54 CLAIRE 103 0.3 10,196 25.35 ISABELLA 332 0.8 1,906 4.7 55 AMELIA 101 0.3 10,297 25.66 AVA 324 0.8 2,230 5.5 56 MACKENZIE 101 0.3 10,398 25.87 SOPHIA 311 0.8 2,541 6.3 57 MAYA 101 0.3 10,499 26.18 SAMANTHA 305 0.8 2,846 7.1 58 RILEY 101 0.3 10,600 26.39 ABIGAIL 299 0.7 3,145 7.8 59 AVERY 96 0.2 10,696 26.510 HANNAH 297 0.7 3,442 8.5 60 ALLISON 93 0.2 10,789 26.811 GRACE 267 0.7 3,709 9.2 61 JENNIFER 93 0.2 10,882 27.012 ELIZABETH 249 0.6 3,958 9.8 62 MAKAYLA 92 0.2 10,974 27.213 NATALIE 238 0.6 4,196 10.4 63 GABRIELLA 91 0.2 11,065 27.514 ELLA 237 0.6 4,433 11.0 64 JENNA 90 0.2 11,155 27.715 ALEXIS 229 0.6 4,662 11.6 65 NICOLE 89 0.2 11,244 27.916 ASHLEY 218 0.5 4,880 12.1 66 ISABEL 88 0.2 11,332 28.117 ANNA 212 0.5 5,092 12.6 67 KATELYN 85 0.2 11,417 28.318 SARAH 210 0.5 5,302 13.2 68 SARA 84 0.2 11,501 28.519 CHLOE 208 0.5 5,510 13.7 69 ANDREA 83 0.2 11,584 28.720 HAILEY 192 0.5 5,702 14.2 70 KIMBERLY 80 0.2 11,664 28.921 TAYLOR 188 0.5 5,890 14.6 71 ALEXA 79 0.2 11,743 29.122 MIA 179 0.4 6,069 15.1 72 BROOKLYN 79 0.2 11,822 29.323 JESSICA 175 0.4 6,244 15.5 73 HALEY 79 0.2 11,901 29.524 ALYSSA 166 0.4 6,410 15.9 74 NAOMI 79 0.2 11,980 29.725 LAUREN 163 0.4 6,573 16.3 75 RUBY 78 0.2 12,058 29.926 JASMINE 162 0.4 6,735 16.7 76 VANESSA 78 0.2 12,136 30.127 SYDNEY 161 0.4 6,896 17.1 77 LEAH 77 0.2 12,213 30.328 ZOE 160 0.4 7,056 17.5 78 NEVAEH 77 0.2 12,290 30.529 LILY 153 0.4 7,209 17.9 79 GABRIELLE 76 0.2 12,366 30.730 AUDREY 136 0.3 7,345 18.2 80 SIERRA 76 0.2 12,442 30.931 KYLIE 133 0.3 7,478 18.6 81 BAILEY 75 0.2 12,517 31.132 PAIGE 133 0.3 7,611 18.9 82 ELLIE 75 0.2 12,592 31.233 VICTORIA 131 0.3 7,742 19.2 83 GRACIE 74 0.2 12,666 31.434 MEGAN 130 0.3 7,872 19.5 84 AMANDA 73 0.2 12,739 31.635 MARIA 129 0.3 8,001 19.9 85 DESTINY 73 0.2 12,812 31.836 BRIANNA 128 0.3 8,129 20.2 86 EVA 73 0.2 12,885 32.037 JULIA 128 0.3 8,257 20.5 87 MARISSA 73 0.2 12,958 32.238 LILLIAN 128 0.3 8,385 20.8 88 REBECCA 73 0.2 13,031 32.339 KAYLA 127 0.3 8,512 21.1 89 ISABELLE 72 0.2 13,103 32.540 MORGAN 126 0.3 8,638 21.4 90 CHARLOTTE 71 0.2 13,174 32.741 KATHERINE 125 0.3 8,763 21.7 91 KATIE 71 0.2 13,245 32.942 SOFIA 121 0.3 8,884 22.0 92 KYLEE 71 0.2 13,316 33.043 SAVANNAH 117 0.3 9,001 22.3 93 MARIAH 70 0.2 13,386 33.244 FAITH 115 0.3 9,116 22.6 94 SOPHIE 70 0.2 13,456 33.445 MADELINE 114 0.3 9,230 22.9 95 AMY 69 0.2 13,525 33.646 ANGELINA 113 0.3 9,343 23.2 96 LUCY 69 0.2 13,594 33.747 BROOKE 110 0.3 9,453 23.5 97 STEPHANIE 69 0.2 13,663 33.948 EVELYN 110 0.3 9,563 23.7 98 MICHELLE 67 0.2 13,730 34.149 KAYLEE 107 0.3 9,670 24.0 99 KATHRYN 65 0.2 13,795 34.250 ALEXANDRA 106 0.3 9,776 24.3 100 ASHLYN 64 0.2 13,859 34.4
Cumulative Cumulative

Washington State Vital Statistics 2005 22
Natality Table A6b. Top 100 Baby Names of Boys for Residents, 2005
Rank First Name N % N % Rank First Name N % N %1 JACOB 487 1.2 487 1.2 51 JAYDEN 172 0.4 13,888 32.82 ETHAN 448 1.1 935 2.2 52 CAMERON 170 0.4 14,058 33.23 ALEXANDER 425 1.0 1,360 3.2 53 WYATT 164 0.4 14,222 33.64 ANDREW 398 0.9 1,758 4.2 54 CARTER 157 0.4 14,379 34.05 DANIEL 391 0.9 2,149 5.1 55 ROBERT 155 0.4 14,534 34.36 JOSHUA 364 0.9 2,513 5.9 56 COLE 152 0.4 14,686 34.77 MICHAEL 363 0.9 2,876 6.8 57 HAYDEN 152 0.4 14,838 35.18 TYLER 361 0.9 3,237 7.6 58 AARON 151 0.4 14,989 35.49 DAVID 349 0.8 3,586 8.5 59 JORDAN 151 0.4 15,140 35.810 LOGAN 343 0.8 3,929 9.3 60 KADEN 147 0.3 15,287 36.111 MATTHEW 335 0.8 4,264 10.1 61 NATHANIEL 147 0.3 15,434 36.512 BENJAMIN 334 0.8 4,598 10.9 62 CODY 145 0.3 15,579 36.813 WILLIAM 328 0.8 4,926 11.6 63 KEVIN 143 0.3 15,722 37.114 NOAH 327 0.8 5,253 12.4 64 IAN 142 0.3 15,864 37.515 SAMUEL 325 0.8 5,578 13.2 65 ALEX 139 0.3 16,003 37.816 JOSEPH 323 0.8 5,901 13.9 66 JUAN 136 0.3 16,139 38.117 NATHAN 313 0.7 6,214 14.7 67 HENRY 133 0.3 16,272 38.418 RYAN 303 0.7 6,517 15.4 68 JASON 129 0.3 16,401 38.719 ANTHONY 286 0.7 6,803 16.1 69 KYLE 129 0.3 16,530 39.120 DYLAN 281 0.7 7,084 16.7 70 LANDON 125 0.3 16,655 39.321 GABRIEL 278 0.7 7,362 17.4 71 RILEY 125 0.3 16,780 39.622 JAMES 268 0.6 7,630 18.0 72 CHASE 124 0.3 16,904 39.923 ELIJAH 262 0.6 7,892 18.6 73 ERIC 123 0.3 17,027 40.224 ZACHARY 259 0.6 8,151 19.3 74 BRAYDEN 122 0.3 17,149 40.525 JACK 254 0.6 8,405 19.9 75 BRIAN 122 0.3 17,271 40.826 ISAAC 247 0.6 8,652 20.4 76 SEAN 122 0.3 17,393 41.127 CHRISTOPHER 245 0.6 8,897 21.0 77 BLAKE 120 0.3 17,513 41.428 JONATHAN 244 0.6 9,141 21.6 78 CHARLES 120 0.3 17,633 41.729 AIDEN 240 0.6 9,381 22.2 79 JULIAN 120 0.3 17,753 41.930 JACKSON 234 0.6 9,615 22.7 80 ADRIAN 117 0.3 17,870 42.231 NICHOLAS 229 0.5 9,844 23.3 81 LIAM 114 0.3 17,984 42.532 EVAN 222 0.5 10,066 23.8 82 ADAM 111 0.3 18,095 42.733 CALEB 218 0.5 10,284 24.3 83 DIEGO 110 0.3 18,205 43.034 MASON 217 0.5 10,501 24.8 84 LUIS 107 0.3 18,312 43.335 GAVIN 215 0.5 10,716 25.3 85 JESUS 106 0.3 18,418 43.536 JOSE 215 0.5 10,931 25.8 86 TANNER 106 0.3 18,524 43.837 LUCAS 215 0.5 11,146 26.3 87 JADEN 102 0.2 18,626 44.038 LUKE 215 0.5 11,361 26.8 88 JESSE 100 0.2 18,726 44.239 AIDAN 209 0.5 11,570 27.3 89 TRISTAN 100 0.2 18,826 44.540 AUSTIN 208 0.5 11,778 27.8 90 LEVI 98 0.2 18,924 44.741 CHRISTIAN 204 0.5 11,982 28.3 91 TIMOTHY 98 0.2 19,022 44.942 JOHN 203 0.5 12,185 28.8 92 CARLOS 97 0.2 19,119 45.243 ISAIAH 201 0.5 12,386 29.3 93 COOPER 97 0.2 19,216 45.444 CONNOR 198 0.5 12,584 29.7 94 CADEN 96 0.2 19,312 45.645 OWEN 198 0.5 12,782 30.2 95 CONNER 95 0.2 19,407 45.846 HUNTER 195 0.5 12,977 30.7 96 DOMINIC 95 0.2 19,502 46.147 BRANDON 194 0.5 13,171 31.1 97 JOSIAH 94 0.2 19,596 46.348 ANGEL 190 0.4 13,361 31.6 98 COLIN 92 0.2 19,688 46.549 JUSTIN 181 0.4 13,542 32.0 99 KAI 92 0.2 19,780 46.750 THOMAS 174 0.4 13,716 32.4 100 TREVOR 92 0.2 19,872 46.9
Cumulative Cumulative

Washington State Vital Statistics 2005 23

Washington State Vital Statistics 2005 24
Natality Table A7. County/City of Residence, Sex1, and County/City of Occurrence, 2005 Occurrence
County and City Total Rate2 Male Female TotalState Total 82,625 13.2 42,329 40,296 82,364Adams 424 24.9 217 207 551Asotin 237 11.3 119 118 3Benton 2,164 13.7 1,096 1,068 3,528 Kennewick 1,121 18.6 556 565 1,217 Richland 512 11.8 260 252 1,989Chelan 902 13.0 466 436 1,398 Wenatchee 559 19.1 295 264 1,314Clallam 617 9.2 313 304 588 Port Angeles 222 11.9 113 109 469Clark 5,635 14.4 2,833 2,802 5,144Camas 296 19.1 135 161 3 Vancouver 3,667 23.7 1,902 1,765 5,110Columbia 24 5.9 10 14 0Cowlitz 1,242 13.0 620 622 1,191 Longview 576 16.3 279 297 1,185Douglas 518 14.9 262 256 0Ferry 82 11.1 44 38 5Franklin 1,484 24.5 750 734 486 Pasco 1,223 27.7 618 605 483Garfield 16 6.7 11 5 0Grant 1,451 18.3 755 696 1,090 Moses Lake 395 24.2 206 189 1,013Grays Harbor 857 12.3 444 413 590 Aberdeen 312 19.0 169 143 581Island 997 13.1 533 464 695 Oak Harbor 566 26.1 308 258 426Jefferson 204 7.4 110 94 126King 22,680 12.5 11,625 11,055 27,160 Auburn 994 22.8 502 492 1,016 Bellevue 1,287 11.1 672 615 3,891 Bothell part 331 20.4 172 159 3 Burien 371 12.0 180 191 1,302 Covington 224 13.5 113 111 0 Des Moines 361 12.5 179 182 0 Federal Way 1,223 14.3 621 602 1,404 Issaquah 507 29.7 246 261 1 Kenmore 235 12.2 126 109 1 Kent 1,633 19.2 868 765 1 Kirkland 834 18.2 423 411 4,614 Maple Valley 354 19.8 186 168 0 Mercer Island 143 6.6 74 69 1 Redmond 905 19.0 450 455 2 Renton 1,466 25.8 743 723 2,748 Sammamish 652 16.9 336 316 0 SeaTac 383 15.2 190 193 1 Seattle 7,026 12.3 3,624 3,402 11,730 Shoreline 430 8.2 226 204 15
Residence

Washington State Vital Statistics 2005 25
Natality Table A7. (Continued) County/City of Residence, Sex1, and County/City of Occurrence, 2005 Occurrence
County and City Total Rate2 Male Female Total Tukwila 285 16.7 135 150 0Kitsap 2,902 12.1 1,496 1,406 2,689 Bainbridge Island 136 6.1 71 65 1 Bremerton 971 28.1 495 476 730Kittitas 333 9.1 166 167 304 Ellensburg 157 9.4 79 78 304Klickitat 209 10.7 118 91 143Lewis 874 12.2 469 405 595 Centralia 291 19.0 159 132 528Lincoln 94 9.3 51 43 0Mason 620 11.9 300 320 344Okanogan 530 13.4 276 254 531Pacific 219 10.3 106 113 7Pend Oreille 120 9.8 50 70 111Pierce 10,469 13.8 5,306 5,163 10,584 Lakewood 961 16.3 510 451 6 Puyallup 1,156 32.3 600 556 1,853 Tacoma 3,780 19.1 1,879 1,901 7,759 University Place 368 11.9 187 181 1San Juan 108 7.0 51 57 6Skagit 1,451 13.1 729 722 1,601 Anacortes 135 8.6 77 58 384 Mount Vernon 553 19.6 277 276 1,208Skamania 94 9.1 45 49 1Snohomish 8,924 13.6 4,638 4,286 5,808 Edmonds 442 11.1 219 223 1,238 Everett 2,276 23.3 1,162 1,114 3,775 Lynnwood 1,028 29.5 551 477 4 Marysville 716 24.3 388 328 3 Monroe 322 20.2 158 164 422 Mountlake Terrace 236 11.6 129 107 1 Mukilteo 186 9.6 103 83 0Spokane 5,593 12.8 2,874 2,719 6,452 Spokane (city) 3,429 17.3 1,733 1,696 6,387 Spokane Valley 595 7.0 328 267 64Stevens 451 10.9 240 211 281Thurston 2,618 11.7 1,373 1,245 2,798 Lacey 611 18.4 324 287 6 Olympia 959 22.1 495 464 2,781Wahkiakum 37 9.5 15 22 0Walla Walla 721 12.5 371 350 920 Walla Walla (city) 481 15.7 248 233 918Whatcom 2,122 11.7 1,099 1,023 2,130 Bellingham 929 12.8 497 432 2,115Whitman 432 10.2 224 208 422 Pullman 250 9.4 137 113 361Yakima 4,170 18.2 2,124 2,046 4,082 Yakima (city) 1,681 21.1 852 829 2,909
Note: Occurrence represents all births which occur in Washington State regardless of the mother's residence.
Residence represents all births to residents of Washington State regardless of where the birth occurred.
Residence
1 Total includes 0 births for which sex is unknown.2 Rate per 1,000 population.

Washington State Vital Statistics 2005 26
Natality Table A8. Month of Birth by County of Residence, 2005 County Total Jan Feb Mar Apr May Jun Jul Aug Sep Oct Nov DecState Total 82,625 6,488 6,262 7,090 6,703 7,222 7,106 7,110 7,272 7,132 6,806 6,652 6,782Adams 424 33 31 44 26 37 33 40 35 45 33 35 32Asotin 237 17 14 19 16 21 25 19 15 24 16 28 23Benton 2,164 149 169 167 180 176 202 190 174 199 198 161 199Chelan 902 57 84 67 83 73 82 79 66 81 78 73 79Clallam 617 35 54 40 45 58 56 48 62 68 46 54 51Clark 5,635 434 443 467 479 477 504 506 518 469 442 446 450Columbia 24 1 3 3 3 2 0 1 2 4 3 2 0Cowlitz 1,242 113 77 115 106 100 116 107 75 104 102 111 116Douglas 518 36 43 47 48 49 55 40 49 30 44 33 44Ferry 82 4 10 8 7 12 6 6 6 7 5 7 4Franklin 1,484 123 102 127 131 124 136 118 145 130 114 106 128Garfield 16 2 2 2 2 0 2 0 0 1 2 1 2Grant 1,451 96 107 130 105 135 114 139 131 150 116 113 115Grays Harbor 857 73 67 75 74 75 78 61 82 68 66 70 68Island 997 84 67 97 88 78 87 86 86 75 74 112 63Jefferson 204 16 8 17 17 19 20 17 16 24 22 15 1King 22,680 1,807 1,758 1,920 1,865 1,999 1,959 1,959 1,971 1,892 1,910 1,793 1,847Kitsap 2,902 231 185 243 238 244 247 241 277 246 258 247 245Kittitas 333 28 22 37 21 32 27 18 37 20 29 24 38Klickitat 209 14 10 24 23 20 18 21 21 15 12 22 9Lewis 874 79 66 90 60 89 74 81 60 58 80 55 82Lincoln 94 9 9 10 7 8 8 6 13 7 5 9 3Mason 620 55 47 47 45 47 45 59 61 55 64 52 43Okanogan 530 39 50 51 37 51 42 46 43 47 38 42 44Pacific 219 14 23 16 13 19 17 14 22 28 12 19 22Pend Oreille 120 6 6 9 15 7 7 10 11 16 10 11 12Pierce 10,469 812 787 933 809 897 852 806 965 952 899 882 875San Juan 108 8 5 7 7 7 11 9 15 11 6 8Skagit 1,451 100 129 121 135 135 114 112 109 139 119 112 126Skamania 94 11 8 8 8 7 8 6 8 6 7 11Snohomish 8,924 697 692 789 721 757 771 783 787 739 720 725 743Spokane 5,593 441 407 492 446 504 467 512 460 494 468 456 446Stevens 451 36 41 45 39 28 42 45 36 38 31 35 35Thurston 2,618 222 176 215 197 235 240 240 247 232 209 192 213Wahkiakum 37 3 5 4 4 3 2 4 2 4 3 2 1Walla Walla 721 60 69 54 48 71 50 71 64 58 55 57 64Whatcom 2,122 171 150 164 173 205 191 190 188 202 159 167 162Whitman 432 35 35 36 50 35 35 43 40 32 25 36 30Yakima 4,170 337 301 350 332 386 363 377 373 362 326 328 335
3
14
6

Washington State Vital Statistics 2005 27
Natality Table A9. Mother's Age Group by County of Residence, 2005
CountyAll
AgesUnder
15 15-19 15-17 18-19 20-24 25-29 30-34 35-39 40-4445 and
OverAgeUnk
State Total 82,625 84 6,739 1,966 4,773 19,911 23,198 19,797 10,490 2,232 145 29Adams 424 3 67 26 41 146 122 58 23 5 0 0Asotin 237 0 35 6 29 87 60 33 18 4 0 0Benton 2,164 1 233 77 156 611 644 429 199 44 3 0Chelan 902 1 111 26 85 260 249 181 77 21 2 0Clallam 617 2 66 18 48 179 170 126 63 10 1 0Clark 5,635 4 434 104 330 1,312 1,712 1,362 676 126 8 1Columbia 24 0 5 0 5 5 4 4 6 0 0 0Cowlitz 1,242 5 179 56 123 385 353 205 87 24 3 1Douglas 518 3 58 18 40 134 147 123 43 10 0 0Ferry 82 0 12 3 9 29 20 13 8 0 0 0Franklin 1,484 2 172 70 102 402 484 281 110 30 2 1Garfield 16 0 1 0 1 5 4 5 1 0 0 0Grant 1,451 6 208 76 132 454 398 251 112 21 1 0Grays Harbor 857 3 129 36 93 274 243 144 56 8 0 0Island 997 1 76 13 63 325 291 186 100 17 0 1Jefferson 204 0 23 7 16 45 42 42 43 9 0 0King 22,680 11 1,056 327 729 3,542 5,682 6,985 4,380 955 62 7Kitsap 2,902 1 235 49 186 896 791 593 304 77 5 0Kittitas 333 0 24 4 20 87 121 65 31 5 0 0Klickitat 209 0 29 6 23 64 55 30 17 13 1 0Lewis 874 0 101 24 77 304 256 141 59 13 0 0Lincoln 94 0 8 2 6 25 35 17 8 1 0 0Mason 620 1 87 30 57 198 181 110 30 13 0 0Okanogan 530 1 59 20 39 170 144 106 41 9 0 0Pacific 219 0 23 9 14 72 62 36 21 5 0 0Pend Oreille 120 1 20 5 15 35 25 22 14 2 1 0Pierce 10,469 8 949 246 703 2,911 3,121 2,223 1,013 222 17 5San Juan 108 0 8 0 8 26 38 21 11 4 0 0Skagit 1,451 1 191 66 125 394 397 267 163 36 2 0Skamania 94 0 6 0 6 19 36 22 10 1 0 0Snohomish 8,924 8 538 155 383 2,055 2,501 2,404 1,174 224 12 8Spokane 5,593 5 478 118 360 1,583 1,733 1,119 554 112 8 1Stevens 451 1 62 12 50 136 134 74 35 9 0 0Thurston 2,618 0 185 41 144 666 758 616 321 66 4 2Wahkiakum 37 0 2 1 1 19 10 3 1 2 0 0Walla Walla 721 2 88 38 50 194 209 141 78 9 0 0Whatcom 2,122 3 148 51 97 503 647 505 259 52 5 0Whitman 432 0 11 4 7 108 157 109 39 6 2 0Yakima 4,170 10 622 222 400 1,251 1,162 745 305 67 6 2
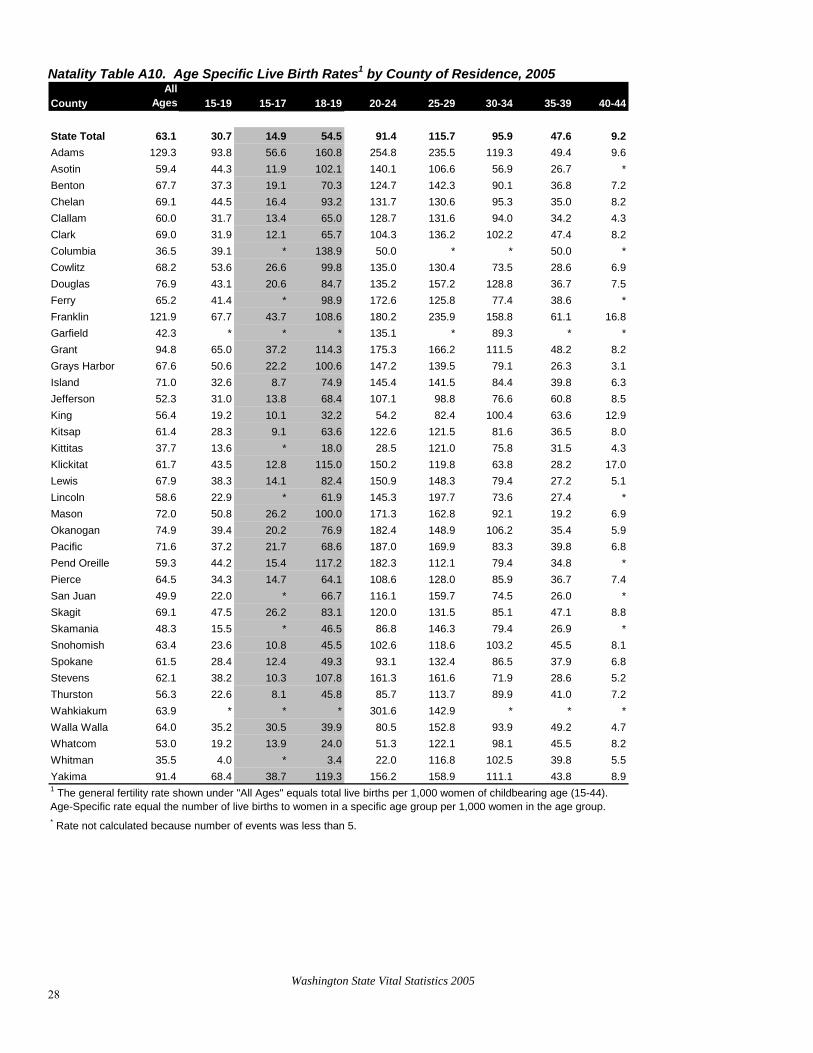
Washington State Vital Statistics 2005 28
Natality Table A10. Age Specific Live Birth Rates1 by County of Residence, 2005
CountyAll
Ages 15-19 15-17 18-19 20-24 25-29 30-34 35-39 40-44
State Total 63.1 30.7 14.9 54.5 91.4 115.7 95.9 47.6 9.2Adams 129.3 93.8 56.6 160.8 254.8 235.5 119.3 49.4 9.6Asotin 59.4 44.3 11.9 102.1 140.1 106.6 56.9 26.7 *Benton 67.7 37.3 19.1 70.3 124.7 142.3 90.1 36.8 7.2Chelan 69.1 44.5 16.4 93.2 131.7 130.6 95.3 35.0 8.2Clallam 60.0 31.7 13.4 65.0 128.7 131.6 94.0 34.2 4.3Clark 69.0 31.9 12.1 65.7 104.3 136.2 102.2 47.4 8.2Columbia 36.5 39.1 * 138.9 50.0 * * 50.0 *Cowlitz 68.2 53.6 26.6 99.8 135.0 130.4 73.5 28.6 6.9Douglas 76.9 43.1 20.6 84.7 135.2 157.2 128.8 36.7 7.5Ferry 65.2 41.4 * 98.9 172.6 125.8 77.4 38.6 *Franklin 121.9 67.7 43.7 108.6 180.2 235.9 158.8 61.1 16.8Garfield 42.3 * * * 135.1 * 89.3 * *Grant 94.8 65.0 37.2 114.3 175.3 166.2 111.5 48.2 8.2Grays Harbor 67.6 50.6 22.2 100.6 147.2 139.5 79.1 26.3 3.1Island 71.0 32.6 8.7 74.9 145.4 141.5 84.4 39.8 6.3Jefferson 52.3 31.0 13.8 68.4 107.1 98.8 76.6 60.8 8.5King 56.4 19.2 10.1 32.2 54.2 82.4 100.4 63.6 12.9Kitsap 61.4 28.3 9.1 63.6 122.6 121.5 81.6 36.5 8.0Kittitas 37.7 13.6 * 18.0 28.5 121.0 75.8 31.5 4.3Klickitat 61.7 43.5 12.8 115.0 150.2 119.8 63.8 28.2 17.0Lewis 67.9 38.3 14.1 82.4 150.9 148.3 79.4 27.2 5.1Lincoln 58.6 22.9 * 61.9 145.3 197.7 73.6 27.4 *Mason 72.0 50.8 26.2 100.0 171.3 162.8 92.1 19.2 6.9Okanogan 74.9 39.4 20.2 76.9 182.4 148.9 106.2 35.4 5.9Pacific 71.6 37.2 21.7 68.6 187.0 169.9 83.3 39.8 6.8Pend Oreille 59.3 44.2 15.4 117.2 182.3 112.1 79.4 34.8 *Pierce 64.5 34.3 14.7 64.1 108.6 128.0 85.9 36.7 7.4San Juan 49.9 22.0 * 66.7 116.1 159.7 74.5 26.0 *Skagit 69.1 47.5 26.2 83.1 120.0 131.5 85.1 47.1 8.8Skamania 48.3 15.5 * 46.5 86.8 146.3 79.4 26.9 *Snohomish 63.4 23.6 10.8 45.5 102.6 118.6 103.2 45.5 8.1Spokane 61.5 28.4 12.4 49.3 93.1 132.4 86.5 37.9 6.8Stevens 62.1 38.2 10.3 107.8 161.3 161.6 71.9 28.6 5.2Thurston 56.3 22.6 8.1 45.8 85.7 113.7 89.9 41.0 7.2Wahkiakum 63.9 * * * 301.6 142.9 * * *Walla Walla 64.0 35.2 30.5 39.9 80.5 152.8 93.9 49.2 4.7Whatcom 53.0 19.2 13.9 24.0 51.3 122.1 98.1 45.5 8.2Whitman 35.5 4.0 * 3.4 22.0 116.8 102.5 39.8 5.5Yakima 91.4 68.4 38.7 119.3 156.2 158.9 111.1 43.8 8.91 The general fertility rate shown under "All Ages" equals total live births per 1,000 women of childbearing age (15-44). Age-Specific rate equal the number of live births to women in a specific age group per 1,000 women in the age group.* Rate not calculated because number of events was less than 5.
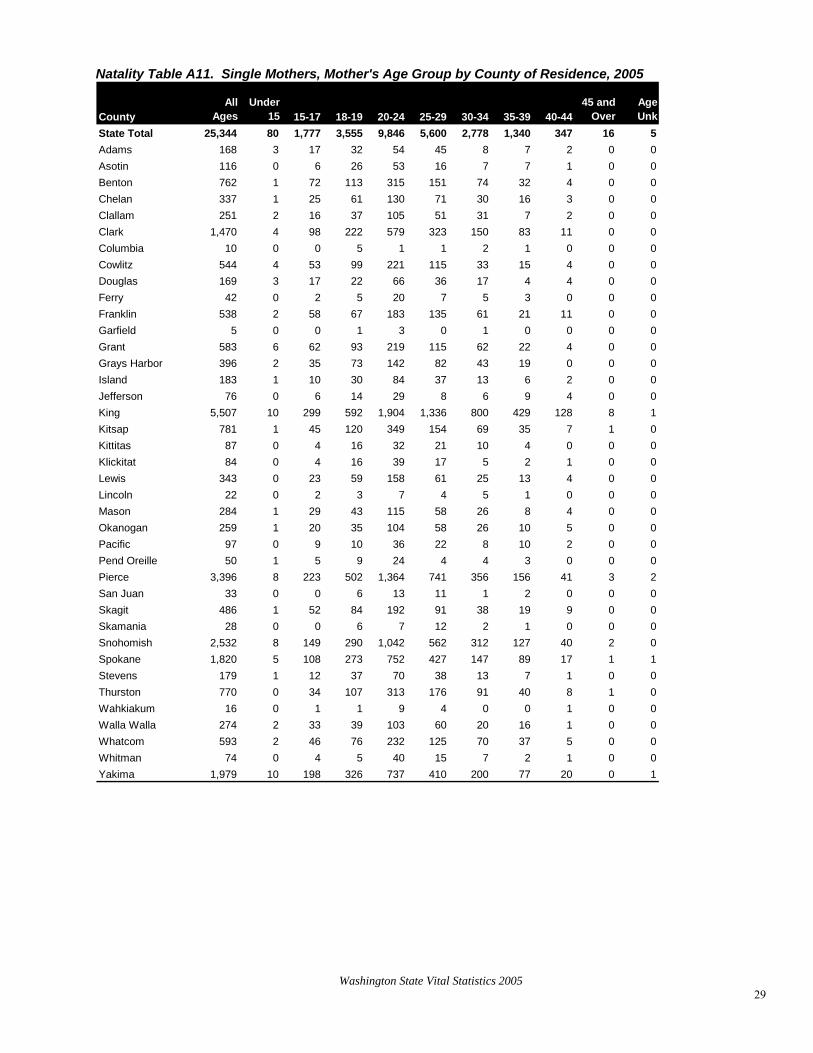
Washington State Vital Statistics 2005 29
Natality Table A11. Single Mothers, Mother's Age Group by County of Residence, 2005
CountyAll
AgesUnder
15 15-17 18-19 20-24 25-29 30-34 35-39 40-4445 and
OverAgeUnk
State Total 25,344 80 1,777 3,555 9,846 5,600 2,778 1,340 347 16 5Adams 168 3 17 32 54 45 8 7 2 0Asotin 116 0 6 26 53 16 7 7 1 0 0Benton 762 1 72 113 315 151 74 32 4 0 0Chelan 337 1 25 61 130 71 30 16 3 0 0Clallam 251 2 16 37 105 51 31 7 2 0 0Clark 1,470 4 98 222 579 323 150 83 11 0 0Columbia 10 0 0 5 1 1 2 1 0 0 0Cowlitz 544 4 53 99 221 115 33 15 4 0 0Douglas 169 3 17 22 66 36 17 4 4 0 0Ferry 42 0 2 5 20 7 5 3 0 0 0Franklin 538 2 58 67 183 135 61 21 11 0 0Garfield 5 0 0 1 3 0 1 0 0 0 0Grant 583 6 62 93 219 115 62 22 4 0 0Grays Harbor 396 2 35 73 142 82 43 19 0 0 0Island 183 1 10 30 84 37 13 6 2 0Jefferson 76 0 6 14 29 8 6 9 4 0 0King 5,507 10 299 592 1,904 1,336 800 429 128 8 1Kitsap 781 1 45 120 349 154 69 35 7 1 0Kittitas 87 0 4 16 32 21 10 4 0 0Klickitat 84 0 4 16 39 17 5 2 1 0Lewis 343 0 23 59 158 61 25 13 4 0 0Lincoln 22 0 2 3 7 4 5 1 0 0 0Mason 284 1 29 43 115 58 26 8 4 0 0Okanogan 259 1 20 35 104 58 26 10 5 0 0Pacific 97 0 9 10 36 22 8 10 2 0Pend Oreille 50 1 5 9 24 4 4 3 0 0 0Pierce 3,396 8 223 502 1,364 741 356 156 41 3 2San Juan 33 0 0 6 13 11 1 2 0 0 0Skagit 486 1 52 84 192 91 38 19 9 0 0Skamania 28 0 0 6 7 12 2 1 0 0 0Snohomish 2,532 8 149 290 1,042 562 312 127 40 2 0Spokane 1,820 5 108 273 752 427 147 89 17 1 1Stevens 179 1 12 37 70 38 13 7 1 0Thurston 770 0 34 107 313 176 91 40 8 1 0Wahkiakum 16 0 1 1 9 4 0 0 1 0 0Walla Walla 274 2 33 39 103 60 20 16 1 0 0Whatcom 593 2 46 76 232 125 70 37 5 0 0Whitman 74 0 4 5 40 15 7 2 1 0 0Yakima 1,979 10 198 326 737 410 200 77 20 0 1
0
0
00
0
0

Washington State Vital Statistics 2005 30
Natality Table A12. Father's Age Group by County of Residence, 2005
CountyAll
AgesUnder
15 15-17 18-19 20-24 25-29 30-34 35-39 40-4445 and
OverAgeUnk
State Total 82,625 3 393 1,520 12,106 19,571 20,098 13,129 5,316 2,339 8,150Adams 424 0 7 15 95 122 84 40 18 1 42Asotin 237 0 2 7 40 72 36 24 10 4 42Benton 2,164 1 18 55 374 560 451 278 100 51 276Chelan 902 0 4 20 180 235 201 121 59 21 61Clallam 617 0 2 25 117 154 127 68 37 22 65Clark 5,635 0 14 75 701 1,355 1,402 828 348 139 773Columbia 24 0 0 1 5 7 2 5 1 0 3Cowlitz 1,242 0 12 40 252 328 230 139 49 35 157Douglas 518 0 10 17 97 134 125 71 30 10 24Ferry 82 0 0 2 20 19 15 13 2 1 10Franklin 1,484 1 14 33 262 410 357 162 51 43 151Garfield 16 0 0 0 0 7 4 1 1 1 2Grant 1,451 0 17 50 291 413 269 154 57 29 171Grays Harbor 857 0 6 33 178 209 178 87 37 15 114Island 997 0 1 21 242 316 182 118 43 19 55Jefferson 204 0 1 5 37 40 39 41 17 9 15King 22,680 0 61 218 1,928 4,285 6,496 5,148 2,046 934 1,564Kitsap 2,902 0 5 49 621 761 605 358 150 71 282Kittitas 333 0 0 7 65 97 85 41 19 5 14Klickitat 209 0 2 3 39 45 44 25 14 10 27Lewis 874 0 3 18 170 214 173 83 41 19 153Lincoln 94 0 0 2 14 28 24 9 7 2 8Mason 620 0 10 17 143 163 124 58 20 11 74Okanogan 530 0 4 18 116 135 117 55 22 18 45Pacific 219 0 0 8 33 63 40 29 11 6 29Pend Oreille 120 0 1 5 29 26 15 18 9 2 15Pierce 10,469 0 29 222 1,802 2,631 2,297 1,363 547 224 1,354San Juan 108 0 0 1 15 33 31 13 7 4 4Skagit 1,451 0 9 46 272 353 292 200 81 33 165Skamania 94 0 0 2 12 27 20 11 7 0 15Snohomish 8,924 0 34 104 1,163 2,047 2,374 1,545 603 222 832Spokane 5,593 0 19 119 969 1,587 1,237 702 280 106 574Stevens 451 0 4 9 100 120 84 46 22 11 55Thurston 2,618 0 8 54 375 661 648 375 171 77 249Wahkiakum 37 0 0 0 6 12 9 1 4 1 4Walla Walla 721 0 10 29 130 169 176 84 43 18 62Whatcom 2,122 0 11 28 297 568 554 316 122 58 168Whitman 432 0 0 3 70 133 120 65 23 8 10Yakima 4,170 1 75 159 846 1,032 831 434 207 99 486

Washington State Vital Statistics 2005 31
Natality Table A13a. Mother's Race/Ethnicity by County of Residence, 2005
County Total WhiteAfrican
AmericanNative
AmericanJapa-nese Chinese Filipino
OtherAsian Other Unk
Hispanic Origin1
State Total 82,625 68,597 3,664 1,795 433 999 1,271 4,828 0 1,038 14,988Adams 424 404 0 14 0 0 0 1 0 5 313Asotin 237 229 2 6 0 0 0 0 0 0 6Benton 2,164 1,985 24 17 2 10 5 36 0 85 598Chelan 902 868 4 11 0 2 4 10 0 3 404Clallam 617 541 4 61 1 2 2 4 0 2 48Clark 5,635 5,128 108 50 25 50 48 215 0 11 588Columbia 24 23 1 0 0 0 0 0 0 0 2Cowlitz 1,242 1,173 15 23 2 1 5 18 0 5 179Douglas 518 506 0 4 0 0 1 1 0 6 238Ferry 82 55 0 27 0 0 0 0 0 0 2Franklin 1,484 1,330 13 7 1 3 0 17 0 113 935Garfield 16 16 0 0 0 0 0 0 0 0 1Grant 1,451 1,418 11 10 0 0 1 8 0 3 781Grays Harbor 857 761 2 72 0 2 2 11 0 7 146Island 997 844 50 14 7 2 42 30 0 8 110Jefferson 204 181 2 14 0 1 1 3 0 2 13King 22,680 16,133 1,826 226 278 742 603 2,571 0 301 3,153Kitsap 2,902 2,466 124 52 21 8 98 120 0 13 243Kittitas 333 327 1 1 0 0 1 2 0 1 46Klickitat 209 193 0 11 0 0 1 3 0 1 35Lewis 874 835 4 15 0 0 4 5 0 11 123Lincoln 94 92 0 1 0 0 0 1 0 0 0Mason 620 558 5 31 1 0 5 8 0 12 126Okanogan 530 420 2 91 0 0 2 2 0 13 155Pacific 219 206 2 3 0 1 1 4 0 2 43Pend Oreille 120 115 0 3 0 1 0 0 0 1 5Pierce 10,469 8,288 921 203 23 25 168 742 0 99 1,360San Juan 108 102 0 2 0 0 1 2 0 1 12Skagit 1,451 1,377 11 27 1 0 8 18 0 9 470Skamania 94 91 1 2 0 0 0 0 0 0 9Snohomish 8,924 7,371 266 178 50 92 178 583 0 206 1,179Spokane 5,593 5,103 124 164 7 14 28 127 0 26 324Stevens 451 404 1 40 0 0 2 4 0 0 18Thurston 2,618 2,232 84 47 6 13 32 152 0 52 255Wahkiakum 37 35 0 1 0 0 0 1 0 0 1Walla Walla 721 689 5 6 0 3 2 10 0 6 250Whatcom 2,122 1,883 9 101 5 11 13 77 0 23 290Whitman 432 384 7 3 1 10 4 23 0 0 14Yakima 4,170 3,831 35 257 2 6 9 19 0 11 2,5131Persons of Hispanic Origin maybe of any race. See Appendix A, "Hispanic Origin." NOTE: Uses bridged race, see Technical Appendix

Washington State Vital Statistics 2005 32
Natality Table A13b. Mother's Multiple Race by County of Residence, 2005 Single race More
County Total WhiteAfricanAmer.
NativeAmer. Asian
Pacific Islander
than one race given
Race unknown
State Total 82,625 67,531 3,122 1,573 6,334 727 2,447 891Adams 424 403 0 13 0 0 3 5Asotin 237 226 2 6 0 0 3 0Benton 2,164 1,967 17 15 45 6 30 84Chelan 902 863 2 9 14 0 12 2Clallam 617 536 3 59 9 0 8 2Clark 5,635 5,063 97 35 238 35 157 10Columbia 24 23 0 0 0 0 1 0Cowlitz 1,242 1,140 12 20 21 2 45 2Douglas 518 505 0 4 2 0 1 6Ferry 82 54 0 26 0 0 2 0Franklin 1,484 1,322 9 5 20 1 14 113Garfield 16 16 0 0 0 0 0 0Grant 1,451 1,408 9 9 6 1 16 2Grays Harbor 857 744 1 64 14 0 28 6Island 997 832 44 12 65 6 34 4Jefferson 204 181 1 13 4 1 3 1King 22,680 15,921 1,644 190 3,774 280 637 234Kitsap 2,902 2,408 103 39 170 42 132 8Kittitas 333 322 0 1 2 0 8 0Klickitat 209 190 0 10 4 0 5 0Lewis 874 821 3 12 6 1 21 10Lincoln 94 91 0 1 0 1 1 0Mason 620 546 3 26 9 3 22 11Okanogan 530 414 2 87 3 1 10 13Pacific 219 200 2 3 5 0 8 1Pend Oreille 120 116 0 3 1 0 0 0Pierce 10,469 8,083 761 163 643 219 521 79San Juan 108 101 0 1 2 0 4 0Skagit 1,451 1,363 2 24 22 4 30 6Skamania 94 90 1 2 0 0 1 0Snohomish 8,924 7,239 213 157 796 47 278 194Spokane 5,593 5,012 91 147 138 28 153 24Stevens 451 392 0 38 4 1 16 0Thurston 2,618 2,167 64 41 144 40 117 45Wahkiakum 37 35 0 1 0 0 1 0Walla Walla 721 686 5 4 14 1 7 4Whatcom 2,122 1,867 6 94 95 4 39 17Whitman 432 378 6 2 34 1 11 0Yakima 4,170 3,806 19 237 30 2 68 8NOTE: Includes all races reported by mother, see Technical Appendix

Washington State Vital Statistics 2005 33
Natality Table A14. Mother's Education by County of Residence, 2005
County Total8th Grade or Less
Some High School
High School /
GEDSome
CollegeAssociate
DegreeBachelor's
DegreePostgrad
Educ UnknownState Total 82,625 4,123 11,399 19,448 17,889 6,677 14,721 6,766 1,602Adams 424 125 131 82 44 17 14 9 2Asotin 237 3 49 66 79 11 21 7Benton 2,164 153 396 485 486 171 284 127 62Chelan 902 157 164 266 114 64 87 44 6Clallam 617 19 88 196 172 51 62 27 2Clark 5,635 137 719 1,521 1,535 428 1,010 261 24Columbia 24 1 4 8 6 2 3 0 0Cowlitz 1,242 71 270 348 319 96 94 39 5Douglas 518 85 93 139 73 52 47 24 5Ferry 82 1 18 32 13 9 5 3 1Franklin 1,484 309 362 293 234 102 111 41 32Garfield 16 0 2 6 2 1 4 1 0Grant 1,451 278 436 359 196 50 90 39 3Grays Harbor 857 87 184 242 200 58 60 20 6Island 997 12 94 268 346 77 145 49 6Jefferson 204 0 23 58 61 13 32 15King 22,680 668 2,206 4,118 3,675 1,684 6,403 3,528 398Kitsap 2,902 39 336 715 907 283 431 171 20Kittitas 333 18 30 83 77 23 84 18 0Klickitat 209 9 47 66 44 9 29 5Lewis 874 51 167 295 186 74 61 27 13Lincoln 94 0 14 31 25 6 14 4 0Mason 620 68 137 193 129 44 36 10 3Okanogan 530 54 117 150 96 41 44 17 11Pacific 219 20 33 81 44 11 26 3 1Pend Oreille 120 2 25 47 25 8 8 5 0Pierce 10,469 297 1,488 2,684 2,551 922 1,319 607 601San Juan 108 2 10 24 22 9 34 7 0Skagit 1,451 145 261 416 242 91 132 55 109Skamania 94 1 8 27 25 8 20 5 0Snohomish 8,924 324 1,081 2,032 2,267 797 1,696 580 147Spokane 5,593 46 562 1,515 1,451 655 915 424 25Stevens 451 3 70 187 100 40 41 9 1Thurston 2,618 49 254 639 728 247 458 188 55Wahkiakum 37 1 7 17 5 3 3 1 0Walla Walla 721 72 136 152 174 62 83 40 2Whatcom 2,122 75 241 477 489 199 434 159 48Whitman 432 0 16 52 94 44 140 85Yakima 4,170 741 1,120 1,078 653 215 241 112 10
1
2
0
1
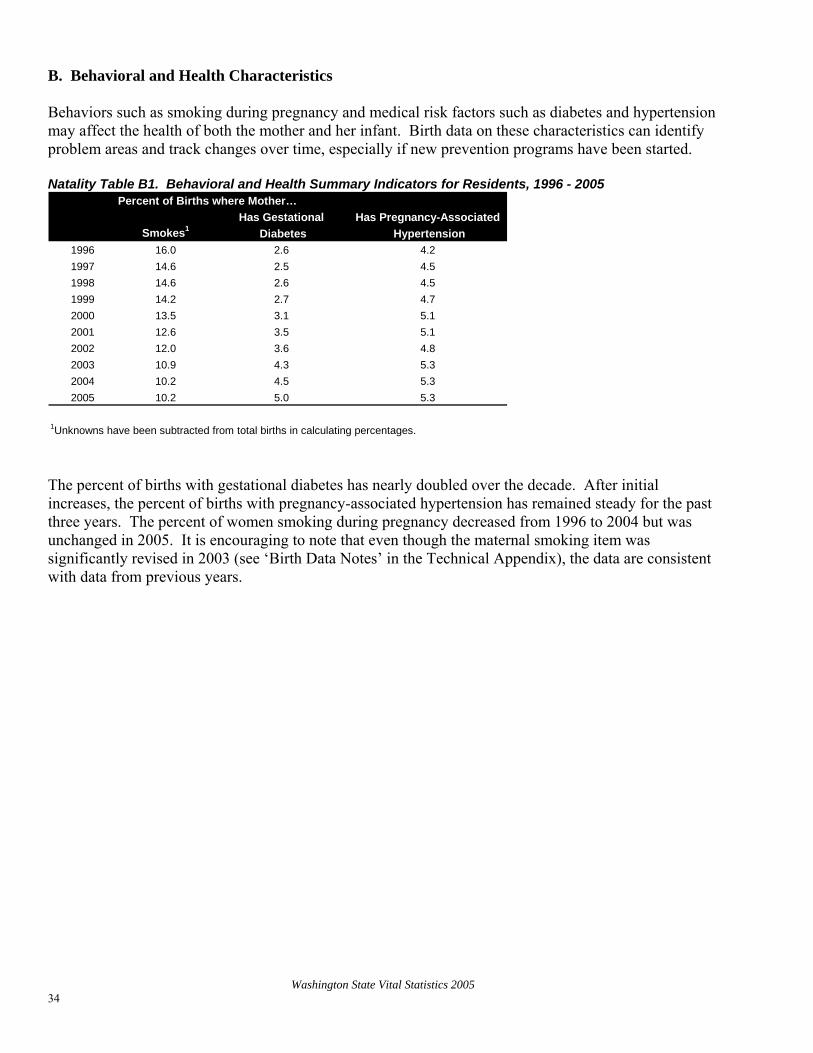
Washington State Vital Statistics 2005 34
B. Behavioral and Health Characteristics Behaviors such as smoking during pregnancy and medical risk factors such as diabetes and hypertension may affect the health of both the mother and her infant. Birth data on these characteristics can identify problem areas and track changes over time, especially if new prevention programs have been started. Natality Table B1. Behavioral and Health Summary Indicators for Residents, 1996 - 2005
Has Gestational Has Pregnancy-AssociatedSmokes1 Diabetes Hypertension
1996 16.0 2.6 4.21997 14.6 2.5 4.51998 14.6 2.6 4.51999 14.2 2.7 4.72000 13.5 3.1 5.12001 12.6 3.5 5.12002 12.0 3.6 4.82003 10.9 4.3 5.32004 10.2 4.5 5.32005 10.2 5.0 5.3
Percent of Births where Mother…
1Unknowns have been subtracted from total births in calculating percentages. The percent of births with gestational diabetes has nearly doubled over the decade. After initial increases, the percent of births with pregnancy-associated hypertension has remained steady for the past three years. The percent of women smoking during pregnancy decreased from 1996 to 2004 but was unchanged in 2005. It is encouraging to note that even though the maternal smoking item was significantly revised in 2003 (see ‘Birth Data Notes’ in the Technical Appendix), the data are consistent with data from previous years.
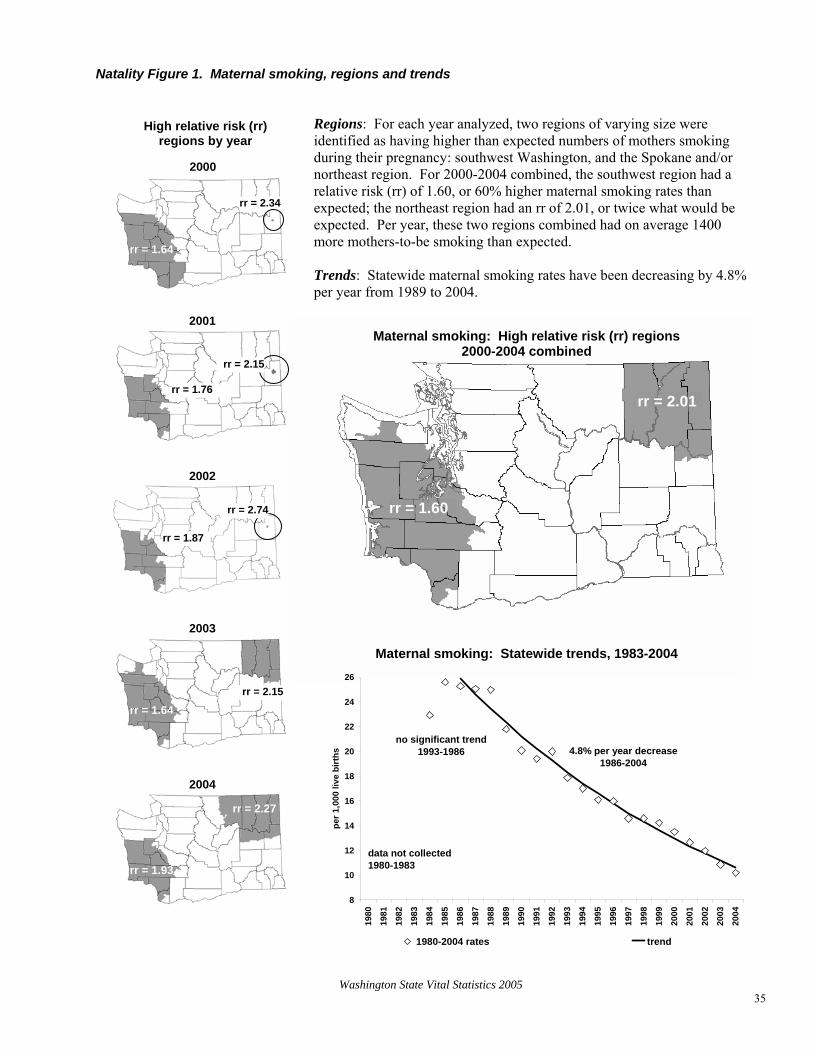
Washington State Vital Statistics 2005 35
Natality Figure 1. Maternal smoking, regions and trends
rr = 2.01
Maternal smoking: Statewide trends, 1983-2004
8
10
12
14
16
18
20
22
24
26
1980
1981
1982
1983
1984
1985
1986
1987
1988
1989
1990
1991
1992
1993
1994
1995
1996
1997
1998
1999
2000
2001
2002
2003
2004
per 1
,000
live
birt
hs
1980-2004 rates trend
4.8% per year decrease1986-2004
no significant trend1993-1986
data not collected1980-1983
Regions: For each year analyzed, two regions of varying size were identified as having higher than expected numbers of mothers smoking during their pregnancy: southwest Washington, and the Spokane and/or northeast region. For 2000-2004 combined, the southwest region had a relative risk (rr) of 1.60, or 60% higher maternal smoking rates than expected; the northeast region had an rr of 2.01, or twice what would be expected. Per year, these two regions combined had on average 1400 more mothers-to-be smoking than expected. Trends: Statewide maternal smoking rates have been decreasing by 4.8% per year from 1989 to 2004.
Maternal smoking: High relative risk (rr) regions
rr = 1.64
rr = 2.34
2001
rr = 1.76
rr = 2.15
rr = 2.74 rr = 1.60
2000-2004 combined
High relative risk (rr) regions by year
2000
2002
rr = 1.87
2003
rr = 2.15
rr = 1.64
2004
rr = 2.27
rr = 1.93

Washington State Vital Statistics 2005 36
Natality Table B2. Mother's Age Group by Maternal Smoking for Residents, 2005 Age Total Maternal Smoking No Maternal Smoking UnknownState Total 82,625 8,174 72,128 2,323Under 15 84 10 74 015 - 17 1,966 268 1,649 4918 - 19 4,773 910 3,754 10920 - 24 19,911 3,194 16,235 48225 - 29 23,198 2,131 20,424 64330 - 34 19,797 1,056 18,138 60335 - 39 10,490 482 9,670 33840 - 44 2,232 117 2,026 8945 and Over 145 2 134 9Unknown 29 4 24 1 Natality Table B3. Mother's Education by Maternal Smoking for Residents, 2005 Education Total Maternal Smoking No Maternal Smoking UnknownState Total 82,625 8,174 72,128 2,3238th Grade or Less 4,123 232 3,819 72Some High School 11,399 2,309 8,794 296High School / GED 19,448 3,149 15,691 608Some College 17,889 1,850 15,478 561Associate Degree 6,677 337 6,258 82Bachelor's Degree 14,721 174 14,016 531Postgraduate Educ. 6,766 24 6,676 66Unknown 1,602 99 1,396 107

Washington State Vital Statistics 2005 37
Natality Table B4. Maternal Smoking During Pregnancy by County of Residence, 2005 No Smoking Smoking Maternal Smoking Unknown
County Total Births During Pregnancy
3 Months Before
First Trimester
Second Trimester
Third Trimester
Maternal Smoking
State Total 82,625 72,128 9,773 7,991 6,993 6,720 2,323Adams 424 408 16 14 13 13 2Asotin 237 165 86 72 57 54 0Benton 2,164 1,873 293 225 183 169 56Chelan 902 856 37 37 37 36 8Clallam 617 493 138 124 114 108 0Clark 5,635 4,172 895 674 558 533 772Columbia 24 18 5 4 4 5 1Cowlitz 1,242 854 317 305 264 250 82Douglas 518 499 13 13 13 13 6Ferry 82 59 25 22 20 20 1Franklin 1,484 1,390 74 49 37 37 44Garfield 16 12 4 4 4 3 0Grant 1,451 1,314 145 133 125 107 1Grays Harbor 857 624 254 203 180 166 24Island 997 874 175 117 95 81 3Jefferson 204 159 48 44 40 38 0King 22,680 21,084 1,294 1,048 902 883 518Kitsap 2,902 2,539 390 353 328 305 8Kittitas 333 289 63 40 30 32 0Klickitat 209 98 38 34 28 27 76Lewis 874 682 210 168 150 145 17Lincoln 94 78 16 16 16 16Mason 620 517 109 88 77 73 15Okanogan 530 450 87 72 64 59 6Pacific 219 105 24 16 16 16 96Pend Oreille 120 98 26 22 22 22 0Pierce 10,469 9,140 1,204 975 834 798 338San Juan 108 97 18 11 8 8 0Skagit 1,451 1,284 192 165 160 157 0Skamania 94 46 17 12 10 7 35Snohomish 8,924 8,029 999 824 707 693 59Spokane 5,593 4,506 1,201 1,072 996 978 1Stevens 451 335 127 114 107 104 0Thurston 2,618 2,138 512 341 280 268 120Wahkiakum 37 19 9 8 8 8Walla Walla 721 649 77 70 64 60 2Whatcom 2,122 1,951 186 155 134 131 14Whitman 432 404 32 27 25 24 1Yakima 4,170 3,820 417 320 283 273 7
0
10

Washington State Vital Statistics 2005 38
Natality Table B5. Selected Medical Risk Factors¹ by County of Residence, 2005 Previous Group B
CountyTotal
Births Gestational Established Gestational Established
Poor Pregnancy
OutcomeInfertility
Treatment
Strep Culture
PositiveState Total 82,625 4,114 527 4,342 1,034 3,010 879 13,459Adams 424 21 4 15 2 14 0 42Asotin 237 17 1 8 2 7 1 47Benton 2,164 104 6 142 19 101 21 334Chelan 902 19 7 13 7 6 5 86Clallam 617 37 3 48 8 15 2 116Clark 5,635 242 19 463 64 363 43 899Columbia 24 0 1 0 1 3 0 4Cowlitz 1,242 58 6 104 33 45 3 200Douglas 518 17 3 9 0 2 0 51Ferry 82 3 1 3 3 3 1 11Franklin 1,484 84 10 79 7 62 9 174Garfield 16 3 1 3 0 0 0 2Grant 1,451 60 7 56 8 36 4 150Grays Harbor 857 69 6 49 20 37 0 165Island 997 46 6 70 22 32 10 195Jefferson 204 7 1 8 1 5 4 36King 22,680 1,112 138 844 244 597 427 3,757Kitsap 2,902 122 15 179 66 68 10 642Kittitas 333 21 1 23 2 14 2 74Klickitat 209 10 0 18 3 34 0 19Lewis 874 47 8 48 15 53 2 165Lincoln 94 5 0 1 0 3 0 19Mason 620 28 4 28 12 31 1 134Okanogan 530 29 6 48 5 54 3 56Pacific 219 8 2 15 4 35 0 26Pend Oreille 120 3 0 11 1 4 0 24Pierce 10,469 374 72 471 123 314 66 1,546San Juan 108 2 0 3 0 1 0 17Skagit 1,451 86 8 86 40 49 15 188Skamania 94 2 0 11 2 13 0 11Snohomish 8,924 482 72 661 152 304 119 1,628Spokane 5,593 342 34 268 42 254 58 991Stevens 451 11 4 26 4 17 2 40Thurston 2,618 203 17 102 26 146 19 448Wahkiakum 37 0 0 1 0 2 0Walla Walla 721 30 4 45 7 36 8 73Whatcom 2,122 79 16 145 38 59 12 395Whitman 432 20 2 29 2 19 9 70Yakima 4,170 311 42 209 49 172 23 620
Diabetes
4
Hypertension
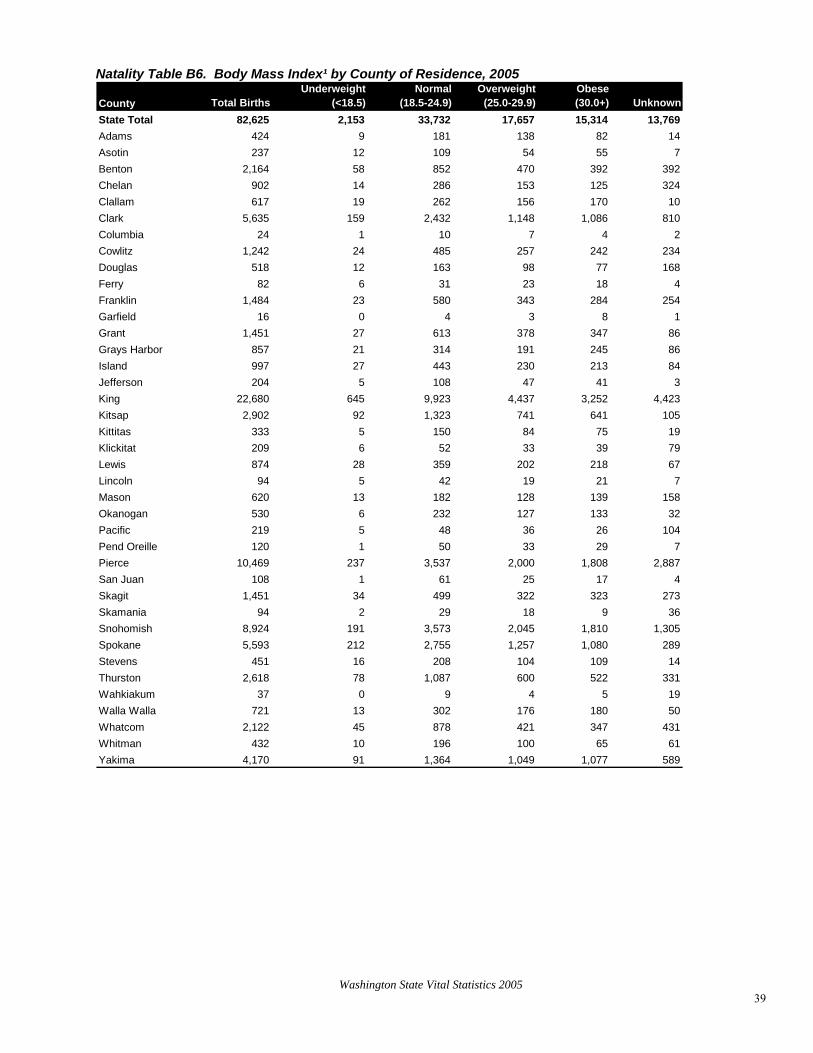
Washington State Vital Statistics 2005 39
Natality Table B6. Body Mass Index¹ by County of Residence, 2005
County Total BirthsUnderweight
(<18.5)Normal
(18.5-24.9)Overweight
(25.0-29.9)Obese (30.0+) Unknown
State Total 82,625 2,153 33,732 17,657 15,314 13,769Adams 424 9 181 138 82 14Asotin 237 12 109 54 55 7Benton 2,164 58 852 470 392 392Chelan 902 14 286 153 125 324Clallam 617 19 262 156 170 10Clark 5,635 159 2,432 1,148 1,086 810Columbia 24 1 10 7 4 2Cowlitz 1,242 24 485 257 242 234Douglas 518 12 163 98 77 168Ferry 82 6 31 23 18 4Franklin 1,484 23 580 343 284 254Garfield 16 0 4 3 8 1Grant 1,451 27 613 378 347 86Grays Harbor 857 21 314 191 245 86Island 997 27 443 230 213 84Jefferson 204 5 108 47 41 3King 22,680 645 9,923 4,437 3,252 4,423Kitsap 2,902 92 1,323 741 641 105Kittitas 333 5 150 84 75 19Klickitat 209 6 52 33 39 79Lewis 874 28 359 202 218 67Lincoln 94 5 42 19 21 7Mason 620 13 182 128 139 158Okanogan 530 6 232 127 133 32Pacific 219 5 48 36 26 104Pend Oreille 120 1 50 33 29 7Pierce 10,469 237 3,537 2,000 1,808 2,887San Juan 108 1 61 25 17 4Skagit 1,451 34 499 322 323 273Skamania 94 2 29 18 9 36Snohomish 8,924 191 3,573 2,045 1,810 1,305Spokane 5,593 212 2,755 1,257 1,080 289Stevens 451 16 208 104 109 14Thurston 2,618 78 1,087 600 522 331Wahkiakum 37 0 9 4 5 19Walla Walla 721 13 302 176 180 50Whatcom 2,122 45 878 421 347 431Whitman 432 10 196 100 65 61Yakima 4,170 91 1,364 1,049 1,077 589

Washington State Vital Statistics 2005 40
C. Health Service Utilization The health service utilization data in this section describe the prenatal care and delivery services the mother received. Prenatal care data are used to assess whether women are receiving timely prenatal care. Data on the birth attendant, birth facility, and method of delivery help to assure that appropriate delivery services are available, including both ‘low tech’ and ‘high tech’ services. Natality Table C1. Health Service Utilization Summary Indicators for Residents, 1995 - 2005
1st Trimester Prenatal Care Late/No Prenatal Care2 Primary C-Section Delivery1996 83.3 3.6 11.21997 83.3 3.4 11.31998 83.0 3.2 12.21999 82.8 3.1 12.32000 82.6 3.3 13.12001 83.2 3.0 14.02002 83.4 3.1 14.82003 81.1 4.2 18.62004 79.6 4.5 19.22005 79.2 4.7 19.4
Percent of Births1 where Mother has…
1Unknowns have been subtracted from total births in calculating percentages.2Includes no care or care beginning in third trimester. C-section delivery continues to increase, following a national trend. In 2005, mothers were less likely to have timely prenatal care than they had been for the past decade. These numbers should be viewed with caution because the data collection method for this item changed significantly (see ‘Birth Data Notes’ in the Technical Appendix) and the unknowns are still very high. However, even though the large change between 2002 and 2003 can be attributed at least in part to the certificate revision, it is important to note that timely prenatal care continues to decline.

Washington State Vital Statistics 2005 41
Natality Figure 2. Late or no prenatal care, regions and trends
Regions: Although varying in size and shape, for each year assessed two regions were consistently identified as having more “late or no prenatal care” than expected: south Puget Sound, and south central Washington. For 2000-2004 combined, south Puget Sound had a relative risk (rr) of 1.96, about twice what would be expected; south central Washington had an rr of 1.5, or 50% more than expected. These two regions averaged 330 more births per year with late or no prenatal care than expected. Trends: From 1980-1983 late or no prenatal care births increased by 7.1% per year; from 1983 to 1989 the rate of increase was 1.3% per year. Between 1989 and 1993 the rate decreased by 7.8% per year, and from 1993 to 2000 the rate decreased by 2% per year.
High relative risk (rr) regions by year
2000
rr = 1.71 rr = 2.22
2001
rr = 1.69 rr = 2.90
2002
Late or no prenatal care: High relative risk (rr) regions 2000-2004 combined
rr = 1.52
rr = 1.96rr = 1.91
rr = 3.63
2003
rr = 1.56 rr = 1.76
Late or no prenatal care: Statewide trends, 1980-2004
2.5
3
3.5
4
4.5
5
5.5
1980
1981
1982
1983
1984
1985
1986
1987
1988
1989
1990
1991
1992
1993
1994
1995
1996
1997
1998
1999
2000
2001
2002
2003
2004
per 1
,000
live
birt
hs
1980-2002 rates trend
7.8% per year decrease1989-1993
2.0% per year decrease1993-2002
7.1% per year increase1980-1983
2003-2004excluded *
* Trend analysis excludes 2003 & 2004 data due to 2003 certificate revision
1.3% per year increase1983-1989
2004
rr = 1.79 rr = 1.41

Washington State Vital Statistics 2005 42
Natality Table C2. Month Prenatal Care Began by Mother's Age Group for Residents, 2005 Month All Under 45 andCare Began Ages 15 15-17 18-19 20-24 25-29 30-34 35-39 40-44 Over UnkState Total 82,625 84 1,966 4,773 19,911 23,198 19,797 10,490 2,232 145 29First 10,378 2 125 403 2,284 3,161 2,696 1,409 277 19 2Second 28,494 12 444 1,301 6,038 8,513 7,530 3,810 799 40 7Third 15,776 15 419 1,010 4,073 4,341 3,598 1,918 379 21 2Fourth 5,936 12 252 545 1,854 1,509 1,054 561 136 11 2Fifth 3,210 12 162 336 1,018 794 527 272 80 7 2Sixth 1,980 10 101 201 634 489 323 176 45 1 0Seventh 1,300 3 64 139 407 351 204 103 26 3 0Eighth 831 5 44 74 279 206 137 74 12 0 0Ninth + 319 1 18 29 121 74 43 26 6 1 0No Care 814 3 40 69 264 212 137 61 27 1 0Unknown 13,587 9 297 666 2,939 3,548 3,548 2,080 445 41 14 Natality Table C3. Number of Prenatal Visits by Month Prenatal Care Began for Residents, 2005 Number ofPrenatal Visits Total 1 - 3 4 - 6 7 - 9+ No Care UnkState Total 82,625 54,648 11,126 2,450 814 13,5879 or More 52,311 44,123 5,500 304 2 2,3825 - 8 13,365 7,486 4,343 1,008 2 5261 - 4 2,854 678 884 1,045 0 247No Visits 818 0 0 0 810Unknown 13,277 2,361 399 93 0 10,424
8

Washington State Vital Statistics 2005 43
Natality Table C4. Month Prenatal Care Began by County of Residence, 2005
County Total 1st 2nd 3rd 4th 5th 6th 7th 8th 9th+No
Care UnkState Total 82,625 10,378 28,494 15,776 5,936 3,210 1,980 1,300 831 319 814 13,587Adams 424 52 172 79 40 22 19 7 11 4 7 11Asotin 237 16 67 101 26 6 6 3 2 0 1Benton 2,164 213 816 368 178 96 51 44 19 9 22 348Chelan 902 51 402 235 57 39 30 13 7 5 10 53Clallam 617 66 252 153 54 33 14 15 4 2 3 21Clark 5,635 386 2,265 1,603 612 312 199 110 55 17 25 51Columbia 24 6 6 5 0 2 0 0 0 0 1Cowlitz 1,242 170 530 249 115 56 27 27 11 5 22 30Douglas 518 28 239 130 42 18 12 5 6 2 3 33Ferry 82 12 24 12 6 8 4 0 3 0 3Franklin 1,484 125 492 247 136 82 59 38 23 6 25 251Garfield 16 2 3 6 3 2 0 0 0 0 0Grant 1,451 167 571 288 129 69 51 31 32 3 69 41Grays Harbor 857 114 262 159 99 55 31 29 13 4 16 75Island 997 101 448 202 67 36 32 37 23 6 4 41Jefferson 204 15 68 61 19 11 11 2 6 2 1 8King 22,680 2,715 7,565 3,711 1,289 732 428 293 187 98 179 5,483Kitsap 2,902 260 969 830 276 136 96 83 54 24 33 141Kittitas 333 60 155 68 20 8 2 1 0 0 4Klickitat 209 23 79 67 17 10 3 1 4 1 2 2Lewis 874 188 296 142 87 42 19 14 10 4 4 68Lincoln 94 20 37 10 5 2 0 1 0 0 1Mason 620 83 228 128 56 48 23 9 5 2 2 36Okanogan 530 79 220 104 34 21 21 19 9 3 5 15Pacific 219 18 84 66 17 11 3 5 2 0 8 5Pend Oreille 120 23 43 25 11 4 2 2 2 2 3Pierce 10,469 1,366 3,265 1,626 650 373 215 144 73 44 89 2,624San Juan 108 3 43 34 12 8 1 1 2 0 2Skagit 1,451 132 585 333 118 91 55 29 18 6 9 75Skamania 94 11 37 26 12 2 2 0 2 0 1Snohomish 8,924 954 2,914 1,677 640 337 215 158 115 34 80 1,800Spokane 5,593 1,389 2,024 760 240 115 75 39 21 8 71 851Stevens 451 82 157 101 32 20 8 5 4 1 5 36Thurston 2,618 622 825 343 166 70 58 32 28 4 17 453Wahkiakum 37 5 17 6 3 1 1 0 0 1 1Walla Walla 721 54 258 225 62 47 18 5 6 2 4 40Whatcom 2,122 91 674 748 234 110 68 38 27 5 10 117Whitman 432 35 168 140 44 20 7 2 4 0 2 10Yakima 4,170 641 1,234 708 328 155 114 58 43 15 70 804
9
4
10
0
15
18
3
2
1
2

Washington State Vital Statistics 2005 44
Natality Table C5. Birth Facility by County of Occurrence, 2005
County Total HospitalBirth
CenterFederalFacility Home
Born OnArrival Other Unknown
State Total 82,364 77,535 771 3,107 914 32 5 0Adams 551 550 0 0 0 1 0 0Asotin 3 0 0 0 3 0 0 0Benton 3,528 3,492 29 0 7 0 0 0Chelan 1,398 1,376 21 0 1 0 0 0Clallam 588 573 0 0 15 0 0 0Clark 5,144 5,088 0 0 52 4 0 0Columbia 0 0 0 0 0 0 0 0Cowlitz 1,191 1,178 0 0 13 0 0 0Douglas 0 0 0 0 0 0 0 0Ferry 5 5 0 0 0 0 0 0Franklin 486 476 0 0 10 0 0 0Garfield 0 0 0 0 0 0 0 0Grant 1,090 1,083 0 0 7 0 0 0Grays Harbor 590 578 0 0 10 1 1 0Island 695 241 24 426 4 0 0 0Jefferson 126 99 0 0 27 0 0 0King 27,160 26,613 305 0 231 10 1 0Kitsap 2,689 1,941 0 709 37 2 0 0Kittitas 304 291 0 0 13 0 0 0Klickitat 143 137 0 0 6 0 0 0Lewis 595 547 0 0 47 1 0 0Lincoln 0 0 0 0 0 0 0 0Mason 344 339 0 0 5 0 0 0Okanogan 531 524 0 0 7 0 0 0Pacific 7 0 0 0 5 2 0 0Pend Oreille 111 111 0 0 0 0 0 0Pierce 10,584 8,305 238 1,972 64 4 1 0San Juan 6 0 0 0 5 0 1 0Skagit 1,601 1,566 0 0 34 1 0 0Skamania 1 0 0 0 1 0 0 0Snohomish 5,808 5,672 44 0 90 2 0 0Spokane 6,452 6,336 80 0 33 3 0 0Stevens 281 263 0 0 18 0 0 0Thurston 2,798 2,728 0 0 69 1 0 0Wahkiakum 0 0 0 0 0 0 0 0Walla Walla 920 902 9 0 9 0 0 0Whatcom 2,130 2,029 20 0 80 0 1 0Whitman 422 417 1 0 4 0 0 0Yakima 4,082 4,075 0 0 7 0 0 0

Washington State Vital Statistics 2005 45
Natality Table C6. Method of Delivery¹ by County of Occurrence, 2005 Primary
County TotalSponta-neous Forceps Vacuum VBAC
C-SectionWith Labor No Labor Unk
State Total 82,364 53,578 577 4,283 1,051 16,004 458 6,412 1Adams 551 289 2 101 0 76 0 83 0Asotin 3 3 0 0 0 0 0 0Benton 3,528 2,283 25 193 104 579 15 329 0Chelan 1,398 999 2 11 8 266 8 104 0Clallam 588 433 1 15 1 93 7 38 0Clark 5,144 3,541 39 196 103 775 40 450 0Columbia 0 0 0 0 0 0 0 0Cowlitz 1,191 742 2 62 27 226 8 124 0Douglas 0 0 0 0 0 0 0 0 0Ferry 5 5 0 0 0 0 0 0Franklin 486 317 0 37 7 83 4 38 0Garfield 0 0 0 0 0 0 0 0Grant 1,090 699 5 102 2 219 2 61 0Grays Harbor 590 392 1 5 7 123 3 59 0Island 695 426 11 37 0 137 1 83 0Jefferson 126 104 0 2 0 15 0 5 0King 27,160 16,672 266 1,653 298 6,136 174 1,960 1Kitsap 2,689 1,734 10 178 21 491 35 220 0Kittitas 304 207 2 5 2 46 1 41 0Klickitat 143 84 0 8 1 37 0 13 0Lewis 595 383 20 33 0 99 0 60 0Lincoln 0 0 0 0 0 0 0 0Mason 344 241 0 7 7 53 3 33 0Okanogan 531 345 0 20 5 95 4 62 0Pacific 7 6 0 0 1 0 0 0Pend Oreille 111 79 0 0 0 24 1 7 0Pierce 10,584 7,243 53 385 98 2,078 22 705 0San Juan 6 6 0 0 0 0 0 0Skagit 1,601 1,027 4 76 33 334 14 113 0Skamania 1 1 0 0 0 0 0 0Snohomish 5,808 3,807 8 269 91 992 31 610 0Spokane 6,452 4,166 56 272 72 1,270 16 600 0Stevens 281 217 0 7 4 41 1 11 0Thurston 2,798 1,815 14 176 21 563 15 194 0Wahkiakum 0 0 0 0 0 0 0 0Walla Walla 920 658 0 47 3 172 2 38 0Whatcom 2,130 1,421 43 47 34 415 26 144 0Whitman 422 259 0 26 1 95 1 40 0Yakima 4,082 2,974 13 313 100 471 24 187 0
Vaginal Deliveries
0
0
0
0
0
0
0
0
0
Repeat C-Section
1Based on first or second methods given. See Appendix A for details.

Washington State Vital Statistics 2005 46
Natality Table C7. Birth Attendant by County of Occurrence, 2005
County Total MD DOCert
MidwifeLic
MidwifeOther
Midwife NurseHosp
Admin Father Other UnkState Total 82,364 72,064 1,127 6,824 1,441 41 549 0 50 243 25Adams 551 535 0 0 0 0 0 0 0 16 0Asotin 3 0 0 2 0 0 0 0 1 0 0Benton 3,528 2,882 231 354 7 0 39 0 1 3 11Chelan 1,398 1,339 0 37 22 0 0 0 0 0 0Clallam 588 387 0 186 13 0 0 0 2 0 0Clark 5,144 3,656 41 1,383 29 15 8 0 5 7 0Columbia 0 0 0 0 0 0 0 0 0 0 0Cowlitz 1,191 1,092 5 79 12 0 0 0 1 2 0Douglas 0 0 0 0 0 0 0 0 0 0 0Ferry 5 1 0 0 0 0 2 0 0 1 1Franklin 486 467 0 11 6 0 0 0 2 0 0Garfield 0 0 0 0 0 0 0 0 0 0 0Grant 1,090 863 97 121 0 0 0 0 3 6 0Grays Harbor 590 417 0 165 2 0 1 0 1 4 0Island 695 648 18 0 27 0 0 0 1 1 0Jefferson 126 97 1 0 27 0 0 0 0 1 0King 27,160 24,702 4 1,867 498 9 17 0 3 55 5Kitsap 2,689 2,533 13 60 35 0 18 0 1 29 0Kittitas 304 274 0 13 10 0 0 0 3 4 0Klickitat 143 137 0 2 4 0 0 0 0 0 0Lewis 595 233 314 0 47 0 0 0 1 0 0Lincoln 0 0 0 0 0 0 0 0 0 0 0Mason 344 331 0 0 4 0 0 0 1 8 0Okanogan 531 419 36 69 4 0 0 0 1 2 0Pacific 7 1 0 1 2 0 1 0 1 1 0Pend Oreille 111 85 26 0 0 0 0 0 0 0 0Pierce 10,584 9,078 48 1,175 226 0 38 0 4 14 1San Juan 6 1 0 0 4 0 0 0 0 1 0Skagit 1,601 1,412 0 128 60 0 0 0 0 1 0Skamania 1 0 0 0 1 0 0 0 0 0 0Snohomish 5,808 5,259 119 285 125 0 4 0 3 11 2Spokane 6,452 5,937 1 387 100 8 4 0 4 10 1Stevens 281 239 24 0 1 9 0 0 5 3 0Thurston 2,798 2,396 0 332 69 0 0 0 1 0 0Wahkiakum 0 0 0 0 0 0 0 0 0 0 0Walla Walla 920 812 37 68 1 0 0 0 0 2 0Whatcom 2,130 2,019 0 8 97 0 1 0 4 0 1Whitman 422 357 0 0 4 0 2 0 0 59 0Yakima 4,082 3,455 112 91 4 0 414 0 1 2 3

Washington State Vital Statistics 2005 47

Washington State Vital Statistics 2005 48
Natality Table C8 County of Residence by County of Occurrence, 2005
County of Residence A
dam
s
Aso
tin
Ben
ton
Che
lan
Cla
llam
Cla
rk
Col
umbi
a
Cow
litz
Dou
glas
Ferr
y
Fran
klin
Gar
field
Gra
nt
Gra
ys H
arbo
r
Isla
nd
Jeffe
rson
Kin
g
Kits
ap
Kitt
itas
Adams 287 26 4 65
Asotin 3 1
Benton 2 1,999 79 1 1 7
Chelan 1 856 35 1
Clallam 575 2 3 19 9
Clark 2 1 4,825 20 4
Columbia
Cowlitz 1 135 1,006 5 3
Douglas 430 2 1 10
Ferry 4 7
Franklin 51 1,022 2 383 6 8
Garfield
Grant 210 21 88 1 2 952 8 6
Grays Harbor 1 1 507 15 1
Island 1 673 41
Jefferson 7 6 119 15 52
King 1 1 1 2 2 1 1 1 21,994 3 1
Kitsap 2 1 2 200 2,436
Kittitas 3 21 27
Klickitat 7 3
Lewis 3 32 1 8
Lincoln 1 10
Mason 1 1 15 101
Okanogan 13 37 4
Pacific 2 6 70 3
Pend Oreille
Pierce 3 1 1 1,163 63
San Juan 2 2
Skagit 15 58
Skamania 38
Snohomish 1 1 1 3,300 8
Spokane 3 1 2 7 2
Stevens 1
Thurston 2 1 2 1 55 2
Wahkiakum 2 25
Walla Walla 53 13 4
Whatcom 1 1 60
Whitman 2
Yakima 1 262 3 15 11
Out of State 128 2 1 125 95 5 4 1 1 81 8 4
Occurrence Total 551 3 3,528 1,398 588 5,144 0 1,191 0 5 486 0 1,090 590 695 126 27,160 2,689 304Note: Diagonal numbers are shaded where county of occurrence and county of residence are the same.
County of Occurrence
1
1
9
1

Washington State Vital Statistics 2005 49
Natality Table C8 (Continued) County of Residence by County of Occurrence, 2005
Klic
kita
t
Lew
is
Linc
oln
Mas
on
Oka
noga
n
Paci
fic
Pend
Ore
ille
Pier
ce
San
Juan
Skag
it
Skam
ania
Snoh
omis
h
Spok
ane
Stev
ens
Thur
ston
Wah
kiak
um
Wal
la W
alla
Wha
tcom
Whi
tman
Yaki
ma
Out
-of-S
tate
Res
iden
ceTo
tal
38 3 1 42
9 1 8 215 23
3 3 5 54 10 2,164
4 2 1 2 90
2 6 1 61
3 2 2 1 1 774 5,63
23 1 2
6 5 3 78 1,24
67 3 1 3 51
5 18 44 1 3 8
7 3 2 1,48
1 15 1
1 1 47 1 1 111 1 1,451
11 8 24 286 2 857
31 136 105 1 1 4 1 3 997
2 2 1 20
488 3 136 3 1 7 4 3 27 22,680
1 242 1 5 1 1 10 2,902
2 1 27 33
113 2 8 76 20
517 42 264 1 6 874
82 1 9
325 36 1 138 2 620
453 1 19 1 1 1 53
12 7 3 20 96 219
61 52 5 2 12
1 1 9,138 2 4 4 61 1 2 1 1 22 10,469
1 6 88 2 6 1 10
3 1,257 42 2 74 1,451
19 1 1 35 9
1 1 14 76 5,497 3 2 5 2 12 8,924
6 3 5,541 1 1 25 5,593
221 227 2 45
42 7 487 2,012 1 6 2,618
10 3
1 5 642 3 72
1 37 5 2,015 2 2,122
41 360 29 432
1 1 2 1 1 3,866 6 4,170
6 4 3 44 45 1 5 347 1 1 239 17 47 6 1,221
143 595 0 344 531 7 111 10,584 6 1,601 1 5,808 6,452 281 2,798 0 920 2,130 422 4,082 1,482 83,846
County of Occurrence
4
7
2
7
5
4
2
8
2
4
6
4
3
9
4
0
0
8
4
1
7
1

Washington State Vital Statistics 2005 50
D. Infant Health The items in this section are used to assess the health of infants born in Washington State and their chances for survival. The data are also used to track progress towards reducing infant health problems and to identify areas where more work is still needed. Natality Table D1. Infant Health Summary Indicators for Residents, 1996- 2005
Low Birth Weight Low Birth Weight - Singletons Plural (Twins+) Preterm ( < 37 Weeks)1996 5.6 4.4 2.5 8.71997 5.6 4.5 2.5 8.91998 5.7 4.5 2.6 9.41999 5.9 4.5 2.8 9.22000 5.6 4.3 2.8 9.72001 5.8 4.5 2.9 10.12002 5.8 4.4 3.0 9.82003 6.1 4.6 3.0 10.02004 6.2 4.8 3.0 10.02005 6.1 4.7 3.0 10.3
Percent of Births1 that are…
1Unknowns have been subtracted from total births in calculating percentages. After a seven-year period of relatively little change, the percent low birth weight (infants weighing <2500 grams) was higher for 2003-2005. Nationally, the percent low birth weight has been increasing for several years. Birth weight is strongly related to plurality. However, low birth weight was higher in 2005-2005 even for singletons. Preterm deliveries remained relatively constant at about 10% of births for 2001-2004 but increased slightly in 2005.
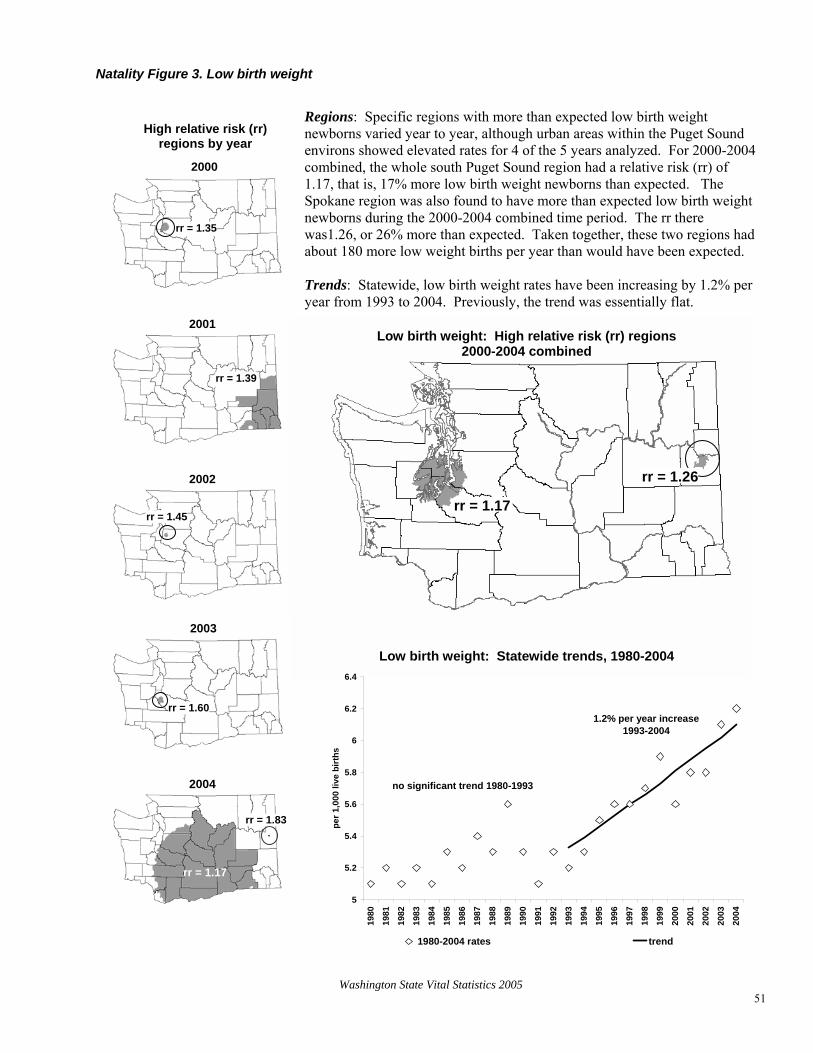
Washington State Vital Statistics 2005 51
Natality Figure 3. Low birth weight
2000
2001
2002
2003
Regions: Specific regions with more than expected low birth weight newborns varied year to year, although urban areas within the Puget Sound environs showed elevated rates for 4 of the 5 years analyzed. For 2000-2004 combined, the whole south Puget Sound region had a relative risk (rr) of 1.17, that is, 17% more low birth weight newborns than expected. The Spokane region was also found to have more than expected low birth weight newborns during the 2000-2004 combined time period. The rr there was1.26, or 26% more than expected. Taken together, these two regions had about 180 more low weight births per year than would have been expected. Trends: Statewide, low birth weight rates have been increasing by 1.2% per year from 1993 to 2004. Previously, the trend was essentially flat.
Low birth weight: High relative risk (rr) regions 2000-2004 combined
Low birth weight: Statewide trends, 1980-2004
High relative risk (rr) regions by year
rr = 1.35
rr = 1.39
rr = 1.45
rr = 1.26
rr = 1.17
5
5.2
5.4
5.6
5.8
6
6.2
6.4
1980
1981
1982
1983
1984
1985
1986
1987
1988
1989
1990
1991
1992
1993
1994
1995
1996
1997
1998
1999
2000
2001
2002
2003
2004
per 1
,000
live
birt
hs
1980-2004 rates trend
1.2% per year increase1993-2004
no significant trend 1980-1993
rr = 1.60
2004
rr = 1.83
rr = 1.17
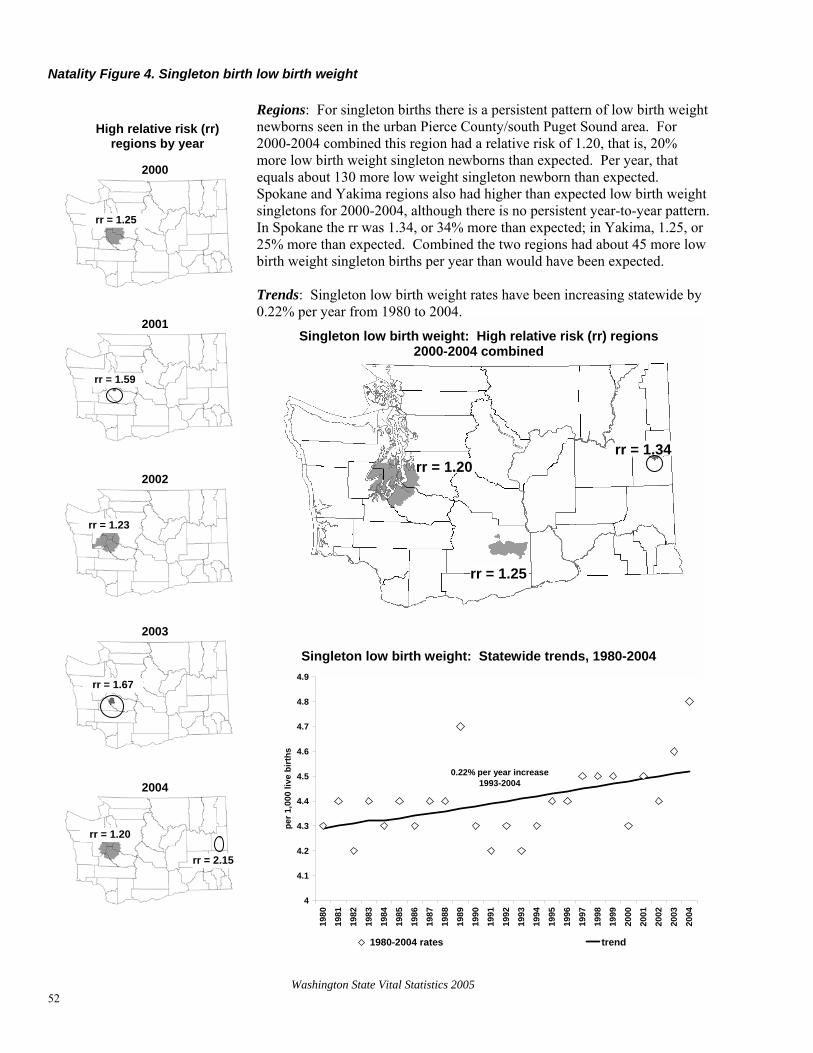
Washington State Vital Statistics 2005 52
Natality Figure 4. Singleton birth low birth weight
rr = 1.34
rr = 1.25
rr = 1.20
4
4.1
4.2
4.3
4.4
4.5
4.6
4.7
4.8
4.9
1980
1981
1982
1983
1984
1985
1986
1987
1988
1989
1990
1991
1992
1993
1994
1995
1996
1997
1998
1999
2000
2001
2002
2003
2004
per 1
,000
live
birt
hs
1980-2004 rates trend
0.22% per year increase1993-2004
Singleton low birth weight: Statewide trends, 1980-2004
Singleton low birth weight: High relative risk (rr) regions 2000-2004 combined
2000
2001
rr = 1.59
Regions: For singleton births there is a persistent pattern of low birth weight newborns seen in the urban Pierce County/south Puget Sound area. For 2000-2004 combined this region had a relative risk of 1.20, that is, 20% more low birth weight singleton newborns than expected. Per year, that equals about 130 more low weight singleton newborn than expected. Spokane and Yakima regions also had higher than expected low birth weight singletons for 2000-2004, although there is no persistent year-to-year pattern. In Spokane the rr was 1.34, or 34% more than expected; in Yakima, 1.25, or 25% more than expected. Combined the two regions had about 45 more low birth weight singleton births per year than would have been expected. Trends: Singleton low birth weight rates have been increasing statewide by 0.22% per year from 1980 to 2004.
High relative risk (rr) regions by year
rr = 1.25
2002
rr = 1.23
2004
rr = 2.15
rr = 1.20
2003
rr = 1.67

Washington State Vital Statistics 2005 53
Natality Table D2a. Birth Weight in Grams by Mother's Race/Ethnicity for Residents, 2005 Birth Weight African Native Other Hispanicin Grams Total White Amer. Amer. Japanese Chinese Filipino Asian Other Unk Origin1
State Total 82,625 68,597 3,664 1,795 433 999 1,271 4,828 0 1,038 14,988Under 1,000 351 264 42 9 0 7 4 20 0 5 681,000 - 1,499 399 312 31 12 4 2 9 23 0 6 711,500 - 1,999 981 768 74 28 8 4 22 54 0 23 1922,000 - 2,499 3,309 2,573 224 88 26 37 74 245 0 42 5812,500 - 2,999 12,003 9,371 749 245 79 177 261 984 0 137 2,3293,000 - 3,499 30,383 24,847 1,358 641 197 433 524 2,001 0 382 5,8473,500 - 3,999 25,803 22,244 879 559 88 279 294 1,129 0 331 4,5284,000 - 4,499 7,649 6,720 252 164 26 46 70 292 0 79 1,1214,500 and Over 1,448 1,267 46 38 2 12 9 53 0 21 205Unknown 299 231 9 11 3 2 4 27 0 12 46
NOTE: Uses bridged race, see Technical Appendix
1Persons of Hispanic Origin may be of any race. See Appendix A, "Hispanic Origin."
Natality Table D2b. Birth Weight in Grams by Mother's Multiple Race for Residents, 2005 Birth Weight Single race More
in Grams Total WhiteAfricanAmer.
NativeAmer. Asian
Pacific Islander
than one race given
Race unknown
State Total 82,625 67,531 3,122 1,573 6,334 727 2,447 891Under 1,000 351 258 39 8 27 2 13 41,000 - 1,499 399 310 26 9 32 4 12 61,500 - 1,999 981 759 67 26 72 7 29 212,000 - 2,499 3,309 2,539 200 80 329 31 95 352,500 - 2,999 12,003 9,228 645 217 1,308 117 374 1143,000 - 3,499 30,383 24,453 1,175 558 2,699 259 916 3233,500 - 3,999 25,803 21,903 725 485 1,457 214 728 2914,000 - 4,499 7,649 6,611 199 146 332 70 221 704,500 and Over 1,448 1,246 39 34 47 21 45 16Unknown 299 224 7 10 31 2 14 11NOTE: Includes all races reported by mother, see Technical Appendix.

Washington State Vital Statistics 2005 54
Natality Table D3. Birth Weight in Grams by Mother's Age Group for Residents, 2005 Birth Weight Under 45 and Agein Grams Total 15 15-17 18-19 20-24 25-29 30-34 35-39 40-44 Over UnkState Total 82,625 84 1,966 4,773 19,911 23,198 19,797 10,490 2,232 145 29Under 1,000 351 0 7 39 89 96 66 41 12 0 11,000 - 1,499 399 0 12 33 81 89 96 72 16 0 01,500 - 1,999 981 3 31 61 231 225 228 145 51 6 02,000 - 2,499 3,309 3 93 221 780 869 772 449 102 19 12,500 - 2,999 12,003 20 359 798 3,134 3,231 2,601 1,486 341 29 43,000 - 3,499 30,383 26 834 1,900 7,692 8,429 7,073 3,679 697 42 113,500 - 3,999 25,803 29 494 1,344 5,964 7,513 6,447 3,266 705 33 84,000 - 4,499 7,649 3 113 315 1,605 2,240 2,046 1,067 243 13 44,500 and Over 1,448 0 15 40 275 418 396 243 59 2 0Unknown 299 0 8 22 60 88 72 42 6 1 0 Natality Table D4. Birth Weight in Grams by Calculated Gestational Age1 for Residents, 2005
Birth Weight Total Preterm Term Postterm Unknownin Grams (<37 wks) (37-41 wks) (42+ wks)
State Total 82,625 8,354 67,760 5,241 1,270Under 1,000 351 350 1 0 01,000 - 1,499 399 365 23 1 101,500 - 1,999 981 753 112 9 1072,000 - 2,499 3,309 1,629 1,355 70 2552,500 - 2,999 12,003 2,300 8,957 491 2553,000 - 3,499 30,383 1,831 26,431 1,867 2543,500 - 3,999 25,803 858 22,792 1,980 1734,000 - 4,499 7,649 168 6,780 658 434,500 and over 1,448 33 1,249 162 4Unknown 299 67 60 3 1691See Appendix A for method used to calculate gestational age.

Washington State Vital Statistics 2005 55
Natality Table D5. Birth Weight in Grams by Plurality for Residents, 2005
Birth Weightin Grams Total Single Twin Triplet Quadruplet+ Unknown
State Total 82,625 80,109 2,448 60 8 0Under 1,000 351 292 55 3 1 01,000 - 1,499 399 276 103 13 7 01,500 - 1,999 981 659 297 25 0 02,000 - 2,499 3,309 2,509 785 15 0 02,500 - 2,999 12,003 11,179 821 3 0 03,000 - 3,499 30,383 30,082 301 0 0 03,500 - 3,999 25,803 25,763 40 0 0 04,000 - 4,499 7,649 7,642 7 0 0 04,500 and over 1,448 1,446 2 0 0 0Unknown 299 261 37 1 0 0 Natality Table D6. Mother's Age Group by Plurality for Residents, 2005 Age Total Single Twin Triplet Quadruplet+ UnknownState Total 82,625 80,109 2,448 60 8 0Under 15 84 83 1 0 0 015 - 17 1,966 1,944 22 0 0 018 - 19 4,773 4,701 72 0 0 020 - 24 19,911 19,481 421 9 0 025 - 29 23,198 22,552 631 11 4 030 - 34 19,797 19,053 715 25 4 035 - 39 10,490 10,045 430 15 0 040 - 44 2,232 2,106 126 0 0 045 and Over 145 115 30 0 0 0Unknown 29 29 0 0 0 0

Washington State Vital Statistics 2005 56
Natality Table D7. Birth Weight in Grams by County of Residence, 2005
County TotalUnder 1000
1000-1499
1500-1999
2000-2499
2500-2999
3000-3499
3500-3999
4000-4499 4500+ Unk
State Total 82,625 351 399 981 3,309 12,003 30,383 25,803 7,649 1,448 299Adams 424 4 1 5 9 89 169 109 36 2 0Asotin 237 3 2 2 14 31 89 73 19 4 0Benton 2,164 10 14 23 101 331 826 673 162 20 4Chelan 902 8 8 14 42 147 324 286 65 8 0Clallam 617 1 2 0 17 67 218 225 73 12Clark 5,635 20 26 58 181 797 2,046 1,816 582 109 0Columbia 24 1 0 0 0 6 6 7 3 1 0Cowlitz 1,242 8 4 21 49 172 448 412 109 19 0Douglas 518 4 2 1 19 84 195 160 41 11Ferry 82 1 0 1 3 17 38 17 4 1 0Franklin 1,484 7 13 16 70 242 514 471 125 23 3Garfield 16 0 0 0 0 5 5 3 3 0 0Grant 1,451 6 5 16 55 214 600 419 118 18 0Grays Harbor 857 6 2 10 30 121 317 271 85 14 1Island 997 3 2 4 31 119 378 319 111 22Jefferson 204 0 2 0 7 30 70 72 21 2 0King 22,680 72 106 280 997 3,373 8,371 6,915 2,050 423 93Kitsap 2,902 16 14 28 120 404 1,014 958 286 61 1Kittitas 333 0 1 2 7 45 123 103 48 4 0Klickitat 209 0 0 3 6 33 85 66 12 4 0Lewis 874 5 3 17 40 122 286 304 82 15 0Lincoln 94 0 0 0 5 16 36 27 8 2 0Mason 620 3 5 10 20 97 244 179 53 9 0Okanogan 530 2 1 8 23 84 199 163 37 12Pacific 219 1 0 2 7 31 79 74 20 5 0Pend Oreille 120 0 0 1 8 20 41 33 14 3 0Pierce 10,469 59 52 139 437 1,505 3,829 3,296 976 167 9San Juan 108 0 1 0 2 18 35 38 10 4 0Skagit 1,451 4 6 21 48 218 525 458 137 31 3Skamania 94 1 1 2 2 16 27 36 7 2 0Snohomish 8,924 28 38 97 303 1,193 3,238 2,775 919 169 164Spokane 5,593 28 27 72 233 876 2,082 1,720 470 85 0Stevens 451 2 1 7 20 55 159 153 42 11Thurston 2,618 10 19 37 113 312 914 875 287 47 4Wahkiakum 37 0 0 1 2 5 12 9 7 1 0Walla Walla 721 5 2 7 46 115 259 203 73 10Whatcom 2,122 10 12 23 65 229 747 738 238 57 3Whitman 432 1 1 5 13 58 175 128 41 10Yakima 4,170 22 26 48 164 706 1,660 1,219 275 50 0
2
1
8
1
1
1
0
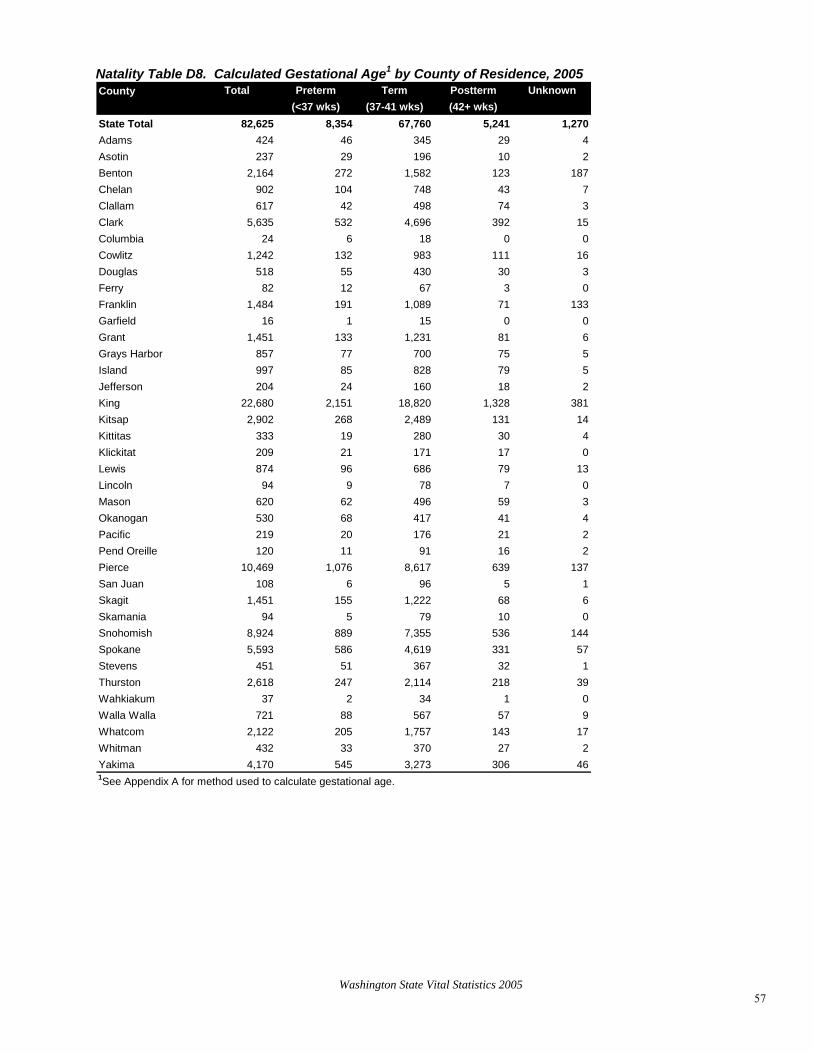
Washington State Vital Statistics 2005 57
Natality Table D8. Calculated Gestational Age1 by County of Residence, 2005 County Total Preterm Term Postterm Unknown
(<37 wks) (37-41 wks) (42+ wks)State Total 82,625 8,354 67,760 5,241 1,270Adams 424 46 345 29 4Asotin 237 29 196 10 2Benton 2,164 272 1,582 123 187Chelan 902 104 748 43 7Clallam 617 42 498 74 3Clark 5,635 532 4,696 392 15Columbia 24 6 18 0 0Cowlitz 1,242 132 983 111 16Douglas 518 55 430 30 3Ferry 82 12 67 3 0Franklin 1,484 191 1,089 71 133Garfield 16 1 15 0 0Grant 1,451 133 1,231 81 6Grays Harbor 857 77 700 75 5Island 997 85 828 79 5Jefferson 204 24 160 18 2King 22,680 2,151 18,820 1,328 381Kitsap 2,902 268 2,489 131 14Kittitas 333 19 280 30 4Klickitat 209 21 171 17 0Lewis 874 96 686 79 13Lincoln 94 9 78 7 0Mason 620 62 496 59 3Okanogan 530 68 417 41 4Pacific 219 20 176 21 2Pend Oreille 120 11 91 16 2Pierce 10,469 1,076 8,617 639 137San Juan 108 6 96 5 1Skagit 1,451 155 1,222 68 6Skamania 94 5 79 10 0Snohomish 8,924 889 7,355 536 144Spokane 5,593 586 4,619 331 57Stevens 451 51 367 32 1Thurston 2,618 247 2,114 218 39Wahkiakum 37 2 34 1 0Walla Walla 721 88 567 57 9Whatcom 2,122 205 1,757 143 17Whitman 432 33 370 27 2Yakima 4,170 545 3,273 306 461See Appendix A for method used to calculate gestational age.

Natality Table D9. Plurality by County of Residence, 2005 County Total Single Twin Triplet Quadruplet+ UnknownState Total 82,625 80,109 2,448 60 8 0Adams 424 418 6 0 0 0Asotin 237 231 6 0 0 0Benton 2,164 2,107 54 3 0 0Chelan 902 879 19 0 4 0Clallam 617 605 12 0 0 0Clark 5,635 5,450 177 8 0 0Columbia 24 22 2 0 0 0Cowlitz 1,242 1,194 48 0 0 0Douglas 518 513 5 0 0 0Ferry 82 80 2 0 0 0Franklin 1,484 1,445 39 0 0 0Garfield 16 16 0 0 0 0Grant 1,451 1,422 29 0 0 0Grays Harbor 857 851 6 0 0 0Island 997 979 18 0 0 0Jefferson 204 197 7 0 0 0King 22,680 21,923 745 12 0 0Kitsap 2,902 2,820 82 0 0 0Kittitas 333 323 10 0 0 0Klickitat 209 201 8 0 0 0Lewis 874 845 26 3 0 0Lincoln 94 92 2 0 0 0Mason 620 610 10 0 0 0Okanogan 530 516 14 0 0 0Pacific 219 217 2 0 0 0Pend Oreille 120 112 8 0 0 0Pierce 10,469 10,130 324 15 0 0San Juan 108 106 2 0 0 0Skagit 1,451 1,404 44 3 0 0Skamania 94 94 0 0 0 0Snohomish 8,924 8,627 290 7 0 0Spokane 5,593 5,404 186 3 0 0Stevens 451 441 10 0 0 0Thurston 2,618 2,545 69 0 4 0Wahkiakum 37 37 0 0 0 0Walla Walla 721 700 18 3 0 0Whatcom 2,122 2,061 61 0 0 0Whitman 432 424 8 0 0 0Yakima 4,170 4,068 99 3 0 0
Washington State Vital Statistics 2005 58

Mortality
Washington State Vital Statistics 2005

Washington State Vital Statistics 2005 60
Mortality A. Demographics Demographics provide basic data (such as gender and age) about people who have died. Information about patterns of mortality by demographic characteristics is important for understanding the health of the citizens of Washington State. As such, they help health programs assess risks or needs in certain areas. For example, age at death is used to compute life expectancy. Life expectancy combines rates of mortality at different age groups and determines how long a person of a specified age is expected to live. In addition, demographic death data are used in conjunction with birth and migration data to provide population estimates used in resource allocation and planning as well as denominators of population-based rates. Mortality Table A1. Age-Adjusted Mortality Rates and Life Expectancy by Sex for Residents, 1996-2005.
Year Total Male Female Total Male Female Total Male Female Total Male Female1996 850.0 1,043.3 704.6 902.4 1117.5 742.8 77.5 74.8 80.3 76.1 73.1 79.11997 813.7 992.5 681.1 887.3 1090.5 736.3 78.1 75.5 80.6 76.5 73.6 79.41998 815.0 990.4 684.7 875.8 1064.6 732.7 78.2 75.6 80.6 76.7 73.8 79.51999 818.4 988.7 692.1 881.9 1061.8 743.6 78.2 75.6 80.6 76.7 73.9 79.42000 803.6 960.5 683.2 872.4 1042.7 739.8 78.4 76.0 80.7 76.9 74.1 79.52001 797.7 943.2 684.7 854.5 1029.1 721.8 78.5 76.2 80.7 77.2 74.4 79.82002 790.3 946.3 671.2 846.8 1015.3 716.7 78.6 76.1 80.9 77.3 74.5 79.92003 782.4 924.0 671.4 831.2 991.7 705.4 78.7 76.4 80.9 77.6 74.8 80.12004 746.1 891.8 635.8 800.8 955.7 679.2 79.3 76.9 81.6 77.8 75.2 80.42005 738.4 871.1 633.9 79.3 76.9 81.6
Miniño AM, Heron M, Smith BL, Kochanek KD, Deaths: Final data for 2004. Health E-Stats. Released November 24, 2006.
1Rate per 100,000 age-adjusted to U.S. 2000 population. 2Life expectancy is the average number of years an infant is expected to live.3Source for United States mortality and Life Expectancy are:
Age-Adjusted Rate1 Infant Life Expectancy2
Washington State United States3United States3Washington State
The mortality rate of 738.4 in 2005 is the lowest mortality rate ever reported in Washington State and continues an almost steady decline in mortality over time. Mortality rates for males are much higher than females. This results in life expectancies of 76.9 years for males and 81.6 for females. The differences between male and female life expectancies are decreasing over time, however. Mortality rates in Washington State are considerably lower than the U.S. as a whole.

Washington State Vital Statistics 2005 61
Mortality Figure 5. All deaths Regions: For each individual year, and for all years combined, the
southwest region and a portion of Spokane County have consistently had more deaths than expected. For 2000-2004 combined the relative risk (rr) for the southwest region was 1.15, indicating there were 15% more deaths than expected; in the Spokane area the rr was 1.21, or 21% more than expected. Because these areas are so large and populous even with these relatively small rr’s the effect is large: on average the two regions combined had approximately 1500 more deaths per year than expected. Trends: Overall the statewide age-adjusted mortality rates have been decreasing by 0.9% per year from 1980 to 2004.
High relative risk (rr) regions by year
2000
rr = 1.32
rr = 1.13 rr = 2.12
2001 All deaths: High relative risk (rr) regions
2000-2004 combined
rr = 1.15
2002
rr = 1.15
rr = 1.46
2003
rr = 1.15
rr = 1.25
rr = 1.19
rr = 1.99
rr = 1.21
rr = 1.15
All deaths rates: Statewide trends, 1980-2004
rr = 1.15
rr = 1.49
rr = 1.86
720
770
820
870
920
970
1020
1980
1981
1982
1983
1984
1985
1986
1987
1988
1989
1990
1991
1992
1993
1994
1995
1996
1997
1998
1999
2000
2001
2002
2003
2004
age-
adju
sted
rate
1980-1998 rates, ICD-9 1999-2004 rates, ICD-10 trend line(s)
0.9% per year decrease 1980-2004
2004
rr = 1.15
rr = 1.16

Washington State Vital Statistics 2005 62
Mortality Table A2. Age by Race/Ethnicity for Residents, 2005 African Native Japa- Chi- Other Hispanic
Age Group Total White American American nese nese Filipino Asian Other Unk Origin1
State Total 46,015 42,683 1,222 630 270 231 268 645 0 66 982Under 1 420 331 42 16 0 3 1 23 0 4 761-4 76 61 7 5 0 0 0 3 0 0 15-14 104 78 12 2 0 0 1 10 0 1 715-19 237 196 14 14 1 0 2 10 0 0 3020-24 362 296 26 21 0 2 2 12 0 3 4825-34 737 600 56 35 2 3 6 29 0 6 9135-44 1,392 1,207 81 50 4 4 5 38 0 3 6445-54 3,453 3,007 202 96 18 18 27 77 0 8 12955-64 5,078 4,585 198 124 13 22 40 84 0 12 11865-74 7,137 6,589 183 97 41 46 52 124 0 5 13675-84 13,027 12,283 250 104 101 66 78 130 0 15 15085-94 11,774 11,294 135 59 82 59 41 95 0 9 10295 and over 2,218 2,156 16 7 8 8 13 10 0 0 16Unknown 0 0 0 0 0 0 0 0 0 0 01 Persons of Hispanic Origin may be of any race. See Appendix A, "Hispanic Origin."
5
Mortality Table A2b. Age by Multiple Race for Residents, 2005
African Native Pacific More Than Age Group Total White American American Asian Islander One Race Given UnkState Total 46,015 42,564 1,189 589 1,249 130 232 62Under 1 420 324 29 14 20 3 26 41-4 76 55 6 5 1 2 7 05-14 104 76 8 2 9 1 7 115-19 237 192 13 12 10 3 7 020-24 362 294 24 20 14 2 5 325-34 737 593 53 34 27 9 16 535-44 1,392 1,199 79 46 35 13 17 345-54 3,453 2,991 201 91 115 21 26 855-64 5,078 4,572 196 111 129 24 34 1265-74 7,137 6,568 183 92 232 25 32 575-84 13,027 12,267 247 98 349 20 32 1485-94 11,774 11,281 134 58 270 6 18 795 and over 2,218 2,152 16 6 38 1 5 0Unknown 0 0 0 0 0 0 0 01Includes all races as reported on the Death Certificate.
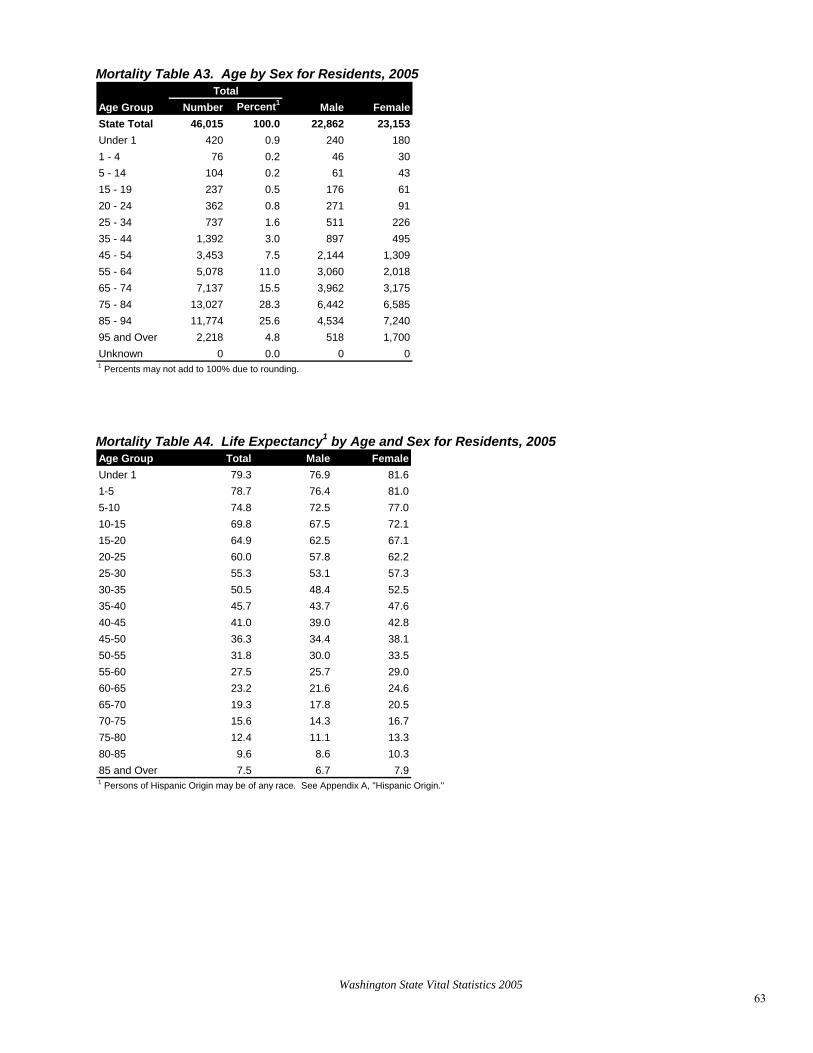
Washington State Vital Statistics 2005 63
Mortality Table A3. Age by Sex for Residents, 2005
Age Group Number Percent1 Male FemaleState Total 46,015 100.0 22,862 23,153Under 1 420 0.9 240 1801 - 4 76 0.2 46 305 - 14 104 0.2 61 4315 - 19 237 0.5 176 6120 - 24 362 0.8 271 9125 - 34 737 1.6 511 22635 - 44 1,392 3.0 897 49545 - 54 3,453 7.5 2,144 1,30955 - 64 5,078 11.0 3,060 2,01865 - 74 7,137 15.5 3,962 3,17575 - 84 13,027 28.3 6,442 6,58585 - 94 11,774 25.6 4,534 7,24095 and Over 2,218 4.8 518 1,700Unknown 0 0.0 0 0
Total
1 Percents may not add to 100% due to rounding. Mortality Table A4. Life Expectancy1 by Age and Sex for Residents, 2005 Age Group Total Male FemaleUnder 1 79.3 76.9 81.61-5 78.7 76.4 81.05-10 74.8 72.5 77.010-15 69.8 67.5 72.115-20 64.9 62.5 67.120-25 60.0 57.8 62.225-30 55.3 53.1 57.330-35 50.5 48.4 52.535-40 45.7 43.7 47.640-45 41.0 39.0 42.845-50 36.3 34.4 38.150-55 31.8 30.0 33.555-60 27.5 25.7 29.060-65 23.2 21.6 24.665-70 19.3 17.8 20.570-75 15.6 14.3 16.775-80 12.4 11.1 13.380-85 9.6 8.6 10.385 and Over 7.5 6.7 7.91 Persons of Hispanic Origin may be of any race. See Appendix A, "Hispanic Origin."

Washington State Vital Statistics 2005 64
Mortality Table A5. Marital Status by Sex for Residents, 2005
Marital Status Number Percent1 Male FemaleState Total 46,015 100.0 22,862 23,153Single 4,306 9.4 2,887 1,419Married 17,730 38.5 11,793 5,937Divorced 7,007 15.2 3,660 3,347Widowed 16,599 36.1 4,283 12,316Seperated 151 0.3 84 67Unknown 222 0.5 155 67
Total
1 Percents may not add to 100% due to rounding. Mortality Table A6. Education by Age for Residents, 2005
State Total 46,015 5,276 4,972 18,244 7,377 2,567 4,584 2,221 774Under 1 420 415 0 0 0 0 0 0 51-4 76 76 0 0 0 0 0 0 05-14 104 93 8 0 0 0 0 0 315-19 237 23 123 71 16 1 0 0 320-24 362 16 74 152 77 26 8 1 825-34 737 50 103 310 130 44 79 11 1035-44 1,392 49 214 593 256 92 124 42 2245-54 3,453 133 390 1,401 645 314 337 148 8555-64 5,078 237 464 1,894 1,056 426 573 319 10965-74 7,137 599 832 2,849 1,211 405 699 416 12675-84 13,027 1,444 1,370 5,408 2,038 606 1,332 642 18785-94 11,774 1,668 1,163 4,811 1,685 544 1,182 547 17495 and over 2,218 473 231 755 263 109 250 95 42Unknown 0 0 0 0 0 0 0 0 0
Postgrad Educ Unknown
Some High School
High School / GED
Some College
Associate DegreeAge Total
8th Grade or Less
Bachelor's Degree

Washington State Vital Statistics 2005 65

Washington State Vital Statistics 2005 66
Mortality Table A7-a. Residence and Occurrence by County and City, 2005 Occurrence
County and City Total Crude Rate1 Age-Adj Rate2 TotalState Total 46015 7.4 7.5 46273Adams 112 6.6 7.4 106Asotin 202 9.7 7 174Benton 1029 6.5 7.5 1131 Kennewick 456 7.5 . 604 Richland 296 6.8 . 412Chelan 607 8.8 7.3 718 Wenatchee 315 10.7 . 535Clallam 826 12.4 7.7 741 Port Angeles 233 12.5 . 437Clark 2714 6.9 8.1 2575Camas 97 6.3 . 79 Vancouver 1669 10.8 . 2235Columbia 38 9.3 6.3 32Cowlitz 1042 10.9 9.7 1097 Longview 513 14.5 . 890Douglas 258 7.4 7.2 165Ferry 83 11.2 12 5Franklin 276 4.6 6.3 187 Pasco 231 5.2 . 179Garfield 25 10.4 7.8 20Grant 573 7.2 7.7 460 Moses Lake 174 10.6 . 251Grays Harbor 764 10.9 9 625 Aberdeen 184 11.2 . 305Island 591 7.8 7.1 460 Oak Harbor 128 5.9 . 147Jefferson 295 10.7 7.1 224King 11418 6.3 6.6 12819 Auburn 418 9.6 . 534 Bellevue 747 6.5 . 818 Bothell part 129 7.9 . 103 Burien 216 7 . 414 Covington 39 2.3 . 20 Des Moines 269 9.3 . 278 Federal Way 534 6.2 . 611 Issaquah 187 11 . 227 Kenmore 113 5.9 . 49 Kent 470 5.5 . 298 Kirkland 347 7.6 . 848 Maple Valley 56 3.1 . 43 Mercer Island 163 7.5 . 126 Redmond 260 5.5 . 325 Renton 489 8.6 . 723 Sammamish 75 1.9 . 36 SeaTac 137 5.4 . 68 Seattle 4426 7.7 . 6303 Shoreline 487 9.3 . 464
Residence
5

Washington State Vital Statistics 2005 67
Mortality Table A7-a. (Continued) Residence and Occurrence by County and City, 2005 Occurrence
County and City Total Crude Rate1 Age-Adj Rate2 Total Tukwila 81 4.7 . 42Kitsap 1799 7.5 8 1721 Bainbridge Island 130 5.9 . 120 Bremerton 515 14.9 . 422Kittitas 236 6.4 6.5 207 Ellensburg 99 5.9 . 159Klickitat 175 9 7.7 138Lewis 752 10.5 8.3 663 Centralia 257 16.8 . 435Lincoln 132 13.1 8.7 94Mason 592 11.4 9.5 438Okanogan 365 9.2 8.2 320Pacific 294 13.8 8.8 213Pend Oreille 119 9.8 9 100Pierce 5502 7.3 8.2 5559 Lakewood 526 8.9 . 471 Puyallup 418 11.7 . 971 Tacoma 1888 9.5 . 2507 University Place 249 8 . 552San Juan 103 6.6 4.6 84Skagit 1024 9.2 7.6 1019 Anacortes 162 10.3 . 185 Mount Vernon 266 9.4 . 453Skamania 79 7.7 8.2 51Snohomish 4236 6.5 7.7 3868 Edmonds 360 9 . 548 Everett 961 9.9 . 1475 Lynnwood 376 10.8 . 318 Marysville 262 8.9 . 268 Monroe 103 6.5 . 182 Mountlake Terrace 140 6.9 . 65 Mukilteo 102 5.3 . 52Spokane 3637 8.3 7.6 4124 Spokane (city) 2055 10.3 . 3303 Spokane Valley 699 8.2 . 450Stevens 389 9.4 8.7 287Thurston 1738 7.8 7.7 1852 Lacey 358 10.8 . 319 Olympia 542 12.5 . 1321Wahkiakum 43 11 8.1 35Walla Walla 547 9.5 7.3 584 Walla Walla (city) 332 10.8 . 480Whatcom 1320 7.3 7.2 1313 Bellingham 657 9.1 . 946Whitman 225 5.3 6.6 190 Pullman 57 2.1 . 66Yakima 1855 8.1 8.2 1824 Yakima (city) 928 11.7 . 1294
* Age by city population not available.Note: Occurrence represents all deaths which occur in Washington State regardless of the decedent's residence.
Residence represents all deaths to residents of Washington State regardless of where the death occurred.
1 Rate per 1,000 population.2 Rate per 1,000 age-adjusted to U.S. 2000 population. Does not include deaths where age is unknown.
Residence
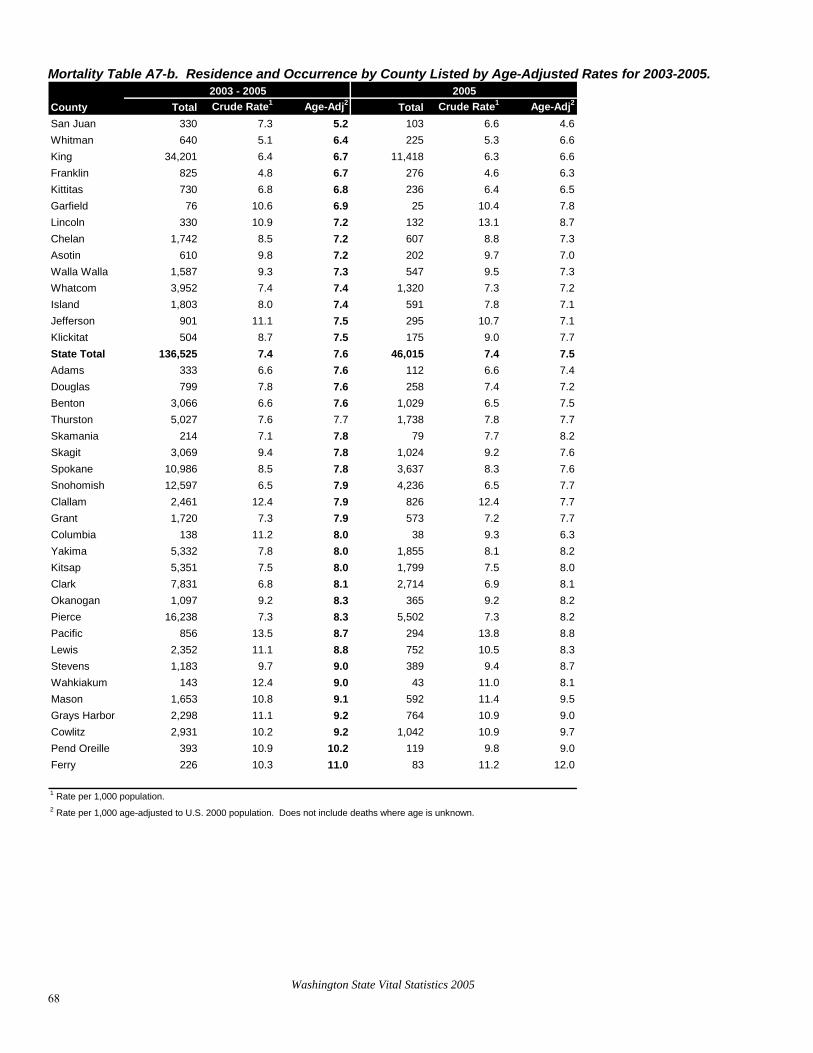
Washington State Vital Statistics 2005 68
Mortality Table A7-b. Residence and Occurrence by County Listed by Age-Adjusted Rates for 2003-2005.
County Total Crude Rate1 Age-Adj2 Total Crude Rate1 Age-Adj2
San Juan 330 7.3 5.2 103 6.6 4.6Whitman 640 5.1 6.4 225 5.3 6.6King 34,201 6.4 6.7 11,418 6.3 6.6Franklin 825 4.8 6.7 276 4.6 6.3Kittitas 730 6.8 6.8 236 6.4 6.5Garfield 76 10.6 6.9 25 10.4 7.8Lincoln 330 10.9 7.2 132 13.1 8.7Chelan 1,742 8.5 7.2 607 8.8 7.3Asotin 610 9.8 7.2 202 9.7 7.0Walla Walla 1,587 9.3 7.3 547 9.5 7.3Whatcom 3,952 7.4 7.4 1,320 7.3 7.2Island 1,803 8.0 7.4 591 7.8 7.1Jefferson 901 11.1 7.5 295 10.7 7.1Klickitat 504 8.7 7.5 175 9.0 7.7State Total 136,525 7.4 7.6 46,015 7.4 7.5Adams 333 6.6 7.6 112 6.6 7.4Douglas 799 7.8 7.6 258 7.4 7.2Benton 3,066 6.6 7.6 1,029 6.5 7.5Thurston 5,027 7.6 7.7 1,738 7.8 7.7Skamania 214 7.1 7.8 79 7.7 8.2Skagit 3,069 9.4 7.8 1,024 9.2 7.6Spokane 10,986 8.5 7.8 3,637 8.3 7.6Snohomish 12,597 6.5 7.9 4,236 6.5 7.7Clallam 2,461 12.4 7.9 826 12.4 7.7Grant 1,720 7.3 7.9 573 7.2 7.7Columbia 138 11.2 8.0 38 9.3 6.3Yakima 5,332 7.8 8.0 1,855 8.1 8.2Kitsap 5,351 7.5 8.0 1,799 7.5 8.0Clark 7,831 6.8 8.1 2,714 6.9 8.1Okanogan 1,097 9.2 8.3 365 9.2 8.2Pierce 16,238 7.3 8.3 5,502 7.3 8.2Pacific 856 13.5 8.7 294 13.8 8.8Lewis 2,352 11.1 8.8 752 10.5 8.3Stevens 1,183 9.7 9.0 389 9.4 8.7Wahkiakum 143 12.4 9.0 43 11.0 8.1Mason 1,653 10.8 9.1 592 11.4 9.5Grays Harbor 2,298 11.1 9.2 764 10.9 9.0Cowlitz 2,931 10.2 9.2 1,042 10.9 9.7Pend Oreille 393 10.9 10.2 119 9.8 9.0Ferry 226 10.3 11.0 83 11.2 12.0
2003 - 2005 2005
1 Rate per 1,000 population.2 Rate per 1,000 age-adjusted to U.S. 2000 population. Does not include deaths where age is unknown.

Washington State Vital Statistics 2005 69

Washington State Vital Statistics 2005 70
Mortality Table A8. Sex and Race/Ethnicity by County/City of Residence, 2005
County & City Total Male Female WhiteAfrican
Amer.NativeAmer.
Japa-nese
Chi-nese
Fili-pino
Other Asian Other Unk Hispanic1
State Total 46,015 22,862 23,153 42,683 1,222 630 270 231 268 645 0 66 982Adams 112 69 43 110 1 0 0 0 0 1 0 0Asotin 202 90 112 196 0 2 0 0 0 0 0 4Benton 1,029 491 538 1,002 12 4 2 0 0 8 0 1 Kennewick 456 211 245 443 7 2 0 0 0 3 0 1 Richland 296 126 170 287 4 0 1 0 0 4 0 0Chelan 607 290 317 597 3 4 0 3 0 0 0 0 Wenatchee 315 153 162 310 2 2 0 1 0 0 0 0Clallam 826 449 377 799 2 20 1 0 0 3 0 1 Port Angeles 233 103 130 229 1 3 0 0 0 0 0 0Clark 2,714 1,309 1,405 2,624 29 12 10 5 6 26 0 2 34Camas 97 34 63 95 0 1 0 0 0 1 0 0 Vancouver 1,669 813 856 1,605 24 5 7 4 2 20 0 2 23Columbia 38 20 18 38 0 0 0 0 0 0 0 0Cowlitz 1,042 505 537 1,022 4 10 2 2 2 0 0 0 Longview 513 226 287 504 0 5 1 1 2 0 0 0Douglas 258 141 117 254 0 2 0 0 0 1 0 1Ferry 83 43 40 70 0 12 1 0 0 0 0 0Franklin 276 159 117 254 12 4 1 0 2 2 0 1 Pasco 231 131 100 211 12 4 0 0 1 2 0 1Garfield 25 10 15 25 0 0 0 0 0 0 0 0Grant 573 306 267 551 6 9 7 0 0 0 0 0 Moses Lake 174 76 98 165 2 3 4 0 0 0 0 0Grays Harbor 764 404 360 727 4 23 0 0 2 5 0 3 Aberdeen 184 97 87 172 2 5 0 0 1 3 0 1Island 591 303 288 571 4 2 3 1 4 4 0 2 Oak Harbor 128 66 62 120 2 0 1 0 2 1 0 2Jefferson 295 162 133 283 0 6 1 1 0 1 0 3King 11,418 5,614 5,804 9,831 679 104 167 173 140 308 0 16 206 Auburn 418 182 236 388 12 6 1 3 3 5 0 0 Bellevue 747 367 380 678 12 3 17 14 1 22 0 0 15 Bothell part 129 60 69 119 3 2 1 0 3 1 0 0 Burien 216 102 114 195 14 1 1 2 1 2 0 0 Covington 39 26 13 39 0 0 0 0 0 0 0 0 Des Moines 269 105 164 250 7 0 4 1 4 2 0 1 Federal Way 534 265 269 457 30 3 7 3 6 28 0 0 12 Issaquah 187 85 102 175 2 0 0 4 1 5 0 0 Kenmore 113 56 57 105 2 1 1 1 2 1 0 0 Kent 470 249 221 390 38 8 8 1 4 21 0 0 10 Kirkland 347 147 200 321 6 1 2 4 5 8 0 0 Maple Valley 56 36 20 54 0 0 0 0 1 1 0 0 Mercer Island 163 66 97 154 1 0 1 2 0 5 0 0 Redmond 260 131 129 246 1 0 2 0 0 9 0 2 Renton 489 241 248 406 39 5 8 8 8 14 0 1 10 Sammamish 75 44 31 69 0 0 1 1 0 4 0 0 SeaTac 137 78 59 115 8 3 2 0 3 6 0 0 Seattle 4,426 2,217 2,209 3,472 470 43 96 115 84 136 0 10 75 Shoreline 487 205 282 450 6 4 4 7 8 6 0 2
230
32165
181263
0
1181272
38340
491441641
16
3514
32
8205
17
3

Washington State Vital Statistics 2005 71
Mortality Table A8. (Continued) Sex and Race/Ethnicity by County/City of Residence, 2005
County & City Total Male Female WhiteAfrican
Amer.NativeAmer.
Japa-nese
Chi-nese
Fili-pino
Other Asian Other Unk Hispanic1
Tukwila 81 47 34 68 5 1 0 0 1 6 0 0Kitsap 1,799 872 927 1,686 26 25 6 6 26 22 0 2 17 Bainbridge Island 130 53 77 123 0 0 3 0 2 1 0 1 Bremerton 515 226 289 473 15 6 1 3 10 7 0 0 4Kittitas 236 106 130 235 1 0 0 0 0 0 0 0 Ellensburg 99 31 68 98 1 0 0 0 0 0 0 0Klickitat 175 91 84 171 0 3 0 0 0 1 0 0Lewis 752 371 381 747 0 4 0 0 0 1 0 0 Centralia 257 101 156 253 0 3 0 0 0 1 0 0Lincoln 132 66 66 131 1 0 0 0 0 0 0 0Mason 592 326 266 572 1 16 1 0 1 1 0 0Okanogan 365 174 191 328 0 36 0 0 1 0 0 0Pacific 294 152 142 287 1 5 1 0 0 0 0 0Pend Oreille 119 58 61 111 1 5 1 0 0 1 0 0Pierce 5,502 2,794 2,708 4,920 301 61 31 11 33 134 0 11 86 Lakewood 526 274 252 439 44 2 2 2 14 22 0 1 16 Puyallup 418 186 232 397 8 7 2 0 1 3 0 0 Tacoma 1,888 926 962 1,604 171 32 10 4 11 51 0 5 43 University Place 249 118 131 228 12 1 2 0 0 5 0 1San Juan 103 54 49 103 0 0 0 0 0 0 0 0Skagit 1,024 521 503 1,004 2 12 1 1 0 3 0 1 Anacortes 162 86 76 161 0 0 0 0 0 0 0 1 Mount Vernon 266 115 151 261 1 0 0 1 0 3 0 0Skamania 79 37 42 77 0 2 0 0 0 0 0 0Snohomish 4,236 2,105 2,131 4,004 45 51 17 19 31 61 0 8 74 Edmonds 360 160 200 341 1 4 3 1 4 5 0 1 Everett 961 466 495 902 15 14 1 3 3 22 0 1 21 Lynnwood 376 185 191 341 10 4 3 5 6 7 0 0 Marysville 262 112 150 253 2 1 2 0 2 2 0 0 Monroe 103 61 42 100 1 0 0 0 0 1 0 1 Mountlake Terrace 140 71 69 128 1 1 1 0 5 3 0 1 Mukilteo 102 52 50 99 0 0 1 0 0 2 0 0Spokane 3,637 1,733 1,904 3,522 34 46 12 3 3 16 0 1 31 Spokane (city) 2,055 972 1,083 1,973 31 27 8 2 3 10 0 1 17 Spokane Valley 699 318 381 680 1 12 2 1 0 3 0 0Stevens 389 196 193 365 0 23 1 0 0 0 0 0Thurston 1,738 864 874 1,660 25 15 0 3 6 26 0 3 22 Lacey 358 178 180 338 8 2 0 1 2 6 0 1 Olympia 542 245 297 522 6 2 0 1 1 9 0 1Wahkiakum 43 17 26 43 0 0 0 0 0 0 0 0Walla Walla 547 275 272 534 5 4 0 0 1 2 0 1 Walla Walla (city) 332 162 170 323 4 3 0 0 0 1 0 1Whatcom 1,320 635 685 1,259 7 31 1 3 2 15 0 2 20 Bellingham 657 299 358 629 5 10 1 2 1 9 0 0Whitman 225 115 110 219 0 2 0 0 1 2 0 1 Pullman 57 23 34 55 0 0 0 0 0 2 0 0Yakima 1,855 935 920 1,751 16 75 3 0 7 1 0 2 2 Yakima (city) 928 439 489 904 11 11 0 0 1 0 0 11 Persons of Hispanic Origin may be of any race. See Appendix A, "Hispanic Origin."
3
1
2017319431
4
11
272
120
4
92231
63
190
189
700
1060

Washington State Vital Statistics 2005 72
Mortality Table A8b. Sex and Multiple Race by County/City of Residence, 2005 More
African Native Pacific than one RaceCounty & City Total Male Female White Amer. Amer. Asian Islander race given UnkState Total 46,015 22,862 23,153 42,564 1,189 589 1,249 130 232 62Adams 112 69 43 110 1 0 0 0 1 0Asotin 202 90 112 196 0 2 0 0 0 4Benton 1,029 491 538 1,001 10 4 7 1 5 1 Kennewick 456 211 245 443 5 2 2 0 3 1 Richland 296 126 170 287 4 0 4 1 0 0Chelan 607 290 317 595 3 4 3 0 2 0 Wenatchee 315 153 162 309 2 2 1 0 1 0Clallam 826 449 377 799 2 20 4 0 0 1 Port Angeles 233 103 130 229 1 3 0 0 0 0Clark 2,714 1,309 1,405 2,622 28 12 43 4 3 2Camas 97 34 63 94 0 1 1 0 1 Vancouver 1,669 813 856 1,604 24 5 30 3 1 2Columbia 38 20 18 38 0 0 0 0 0 0Cowlitz 1,042 505 537 1,021 4 8 6 0 3 0 Longview 513 226 287 504 0 4 4 0 1 0Douglas 258 141 117 254 0 2 0 1 0 1Ferry 83 43 40 70 0 12 1 0 0 0Franklin 276 159 117 254 12 4 5 0 0 1 Pasco 231 131 100 211 12 4 3 0 0 1Garfield 25 10 15 25 0 0 0 0 0 0Grant 573 306 267 549 6 9 7 0 2 0 Moses Lake 174 76 98 165 2 3 4 0 0 0Grays Harbor 764 404 360 722 4 19 5 2 10 2 Aberdeen 184 97 87 172 2 5 3 1 0 1Island 591 303 288 567 4 2 8 4 4 2 Oak Harbor 128 66 62 120 2 0 3 1 0 2Jefferson 295 162 133 283 0 6 2 0 1 3King 11,418 5,614 5,804 9,802 668 96 728 44 64 16 Auburn 418 182 236 387 11 6 9 2 3 0 Bellevue 747 367 380 677 12 3 51 0 4 0 Bothell part 129 60 69 119 3 1 5 0 1 0 Burien 216 102 114 193 13 1 6 0 3 0 Covington 39 26 13 39 0 0 0 0 0 0 Des Moines 269 105 164 249 7 0 11 0 1 1 Federal Way 534 265 269 456 30 3 37 7 1 0 Issaquah 187 85 102 175 2 0 9 0 1 0 Kenmore 113 56 57 105 2 1 4 0 1 0 Kent 470 249 221 387 37 6 28 6 6 0 Kirkland 347 147 200 320 5 1 18 1 2 0 Maple Valley 56 36 20 54 0 0 2 0 0 0 Mercer Island 163 66 97 154 1 0 8 0 0 0 Redmond 260 131 129 246 1 0 11 0 0 2 Renton 489 241 248 405 37 4 36 1 5 1 Sammamish 75 44 31 69 0 0 6 0 0 0 SeaTac 137 78 59 114 8 1 9 1 4 0 Seattle 4,426 2,217 2,209 3,459 467 43 406 19 22 10 Shoreline 487 205 282 450 6 3 22 2 2 2 Tukwila 81 47 34 68 5 1 4 3 0 0Kitsap 1,799 872 927 1,682 25 23 42 13 12 2 Bainbridge Island 130 53 77 123 0 0 4 0 2 1
Single Race
0

Washington State Vital Statistics 2005 73
Mortality Table A8b. (Continued) Sex and Multiple Race by County/City of Residence, 2005 More
African Native Pacific than one RaceCounty & City Total Male Female White Amer. Amer. Asian Islander race given Unk Bremerton 515 226 289 472 14 6 16 4 3 0Kittitas 236 106 130 234 1 0 0 0 1 0 Ellensburg 99 31 68 98 1 0 0 0 0 0Klickitat 175 91 84 170 0 3 1 0 1 0Lewis 752 371 381 743 0 3 1 0 5 0 Centralia 257 101 156 253 0 2 1 0 1 0Lincoln 132 66 66 131 1 0 0 0 0 0Mason 592 326 266 571 1 16 2 1 1 0Okanogan 365 174 191 328 0 36 1 0 0 0Pacific 294 152 142 285 1 5 1 0 2 0Pend Oreille 119 58 61 111 1 5 1 1 0 0Pierce 5,502 2,794 2,708 4,898 286 53 171 36 47 11 Lakewood 526 274 252 436 43 2 33 6 5 1 Puyallup 418 186 232 395 6 7 6 0 4 0 Tacoma 1,888 926 962 1,595 165 29 67 9 18 5 University Place 249 118 131 228 12 1 5 1 1 1San Juan 103 54 49 103 0 0 0 0 0 0Skagit 1,024 521 503 1,000 2 10 3 1 7 1 Anacortes 162 86 76 161 0 0 0 0 0 1 Mount Vernon 266 115 151 257 1 0 2 1 5 0Skamania 79 37 42 77 0 2 0 0 0 0Snohomish 4,236 2,105 2,131 3,995 44 45 121 3 22 6 Edmonds 360 160 200 340 1 3 13 0 2 1 Everett 961 466 495 898 15 12 26 2 8 0 Lynnwood 376 185 191 339 10 3 20 1 3 0 Marysville 262 112 150 253 2 1 6 0 0 0 Monroe 103 61 42 100 1 0 1 0 0 1 Mountlake Terrace 140 71 69 128 1 1 8 0 1 1 Mukilteo 102 52 50 99 0 0 3 0 0 0Spokane 3,637 1,733 1,904 3,511 33 44 26 6 16 1 Spokane (city) 2,055 972 1,083 1,966 30 26 18 4 10 1 Spokane Valley 699 318 381 676 1 11 5 0 6 0Stevens 389 196 193 364 0 20 1 0 4 0Thurston 1,738 864 874 1,658 24 14 28 7 5 2 Lacey 358 178 180 338 8 2 6 3 0 1 Olympia 542 245 297 519 5 2 11 0 4 1Wahkiakum 43 17 26 43 0 0 0 0 0Walla Walla 547 275 272 532 5 4 1 1 3 1 Walla Walla (city) 332 162 170 322 4 3 1 0 1 1Whatcom 1,320 635 685 1,258 7 30 17 4 2 2 Bellingham 657 299 358 629 5 9 13 0 1 0Whitman 225 115 110 219 0 2 2 1 0 1 Pullman 57 23 34 55 0 0 1 1 0 0Yakima 1,855 935 920 1,743 16 74 11 0 9 2 Yakima (city) 928 439 489 900 11 11 1 0 4 1
Single Race
0

Washington State Vital Statistics 2005 74
Mortality Table A9. Age Group by County of Residence, 2005 85 and Age
County Total < 1 1-4 5-14 15-19 20-24 25-34 35-44 45-54 55-64 65-74 75-84 Over UnkState Total 46,015 420 76 104 237 362 737 1,392 3,453 5,078 7,137 13,027 13,992 0Adams 112 5 0 1 1 2 6 5 7 9 17 33 26Asotin 202 0 0 1 2 1 1 6 18 16 25 53 79Benton 1,029 12 4 2 6 5 12 37 57 105 170 306 313 0Chelan 607 11 1 1 2 2 9 9 42 55 88 154 233 0Clallam 826 1 1 0 4 6 7 16 46 74 114 261 296 0Clark 2,714 28 2 2 16 18 54 70 238 305 425 749 807 0Columbia 38 0 1 0 0 0 0 0 1 3 5 18 10Cowlitz 1,042 2 1 3 6 7 18 33 84 122 181 305 280 0Douglas 258 3 0 1 1 0 2 12 16 28 45 75 75 0Ferry 83 2 0 0 3 4 1 4 3 8 20 24 14Franklin 276 5 1 1 3 4 4 8 22 33 36 87 72Garfield 25 0 0 0 1 0 1 3 1 1 5 7 6Grant 573 8 3 3 9 8 15 14 47 53 106 166 141Grays Harbor 764 3 3 1 3 7 6 27 57 89 156 223 189 0Island 591 3 0 3 2 10 4 12 20 62 101 188 186 0Jefferson 295 1 1 0 0 3 3 8 11 56 45 79 88King 11,418 102 10 24 53 71 204 347 870 1,197 1,615 3,194 3,731 0Kitsap 1,799 18 3 3 8 20 32 47 143 188 253 547 537 0Kittitas 236 1 1 1 1 1 1 13 13 30 42 66 66 0Klickitat 175 0 0 1 1 0 2 5 13 26 35 39 53Lewis 752 6 1 5 4 2 5 23 58 93 133 207 215 0Lincoln 132 0 0 2 0 0 0 6 7 14 27 38 38 0Mason 592 5 2 2 4 3 10 15 50 65 115 169 152Okanogan 365 2 2 0 4 6 6 15 24 44 65 89 108 0Pacific 294 3 0 1 1 2 3 4 22 31 57 92 78Pend Oreille 119 0 0 0 1 2 0 2 11 17 19 36 31Pierce 5,502 64 9 20 31 52 95 194 434 671 937 1,536 1,459 0San Juan 103 0 1 0 0 2 0 2 6 11 17 25 39 0Skagit 1,024 4 4 0 2 5 12 25 64 102 149 322 335 0Skamania 79 0 0 1 1 0 3 2 6 16 11 23 16Snohomish 4,236 32 10 9 21 32 76 143 354 501 662 1,184 1,212 0Spokane 3,637 34 1 5 19 25 49 115 281 365 540 1,027 1,176 0Stevens 389 4 2 5 2 4 3 13 27 53 74 95 107 0Thurston 1,738 16 3 2 5 17 28 41 131 207 271 508 509 0Wahkiakum 43 0 0 0 1 0 1 1 4 9 3 11 13Walla Walla 547 5 0 0 2 3 4 13 33 54 68 163 202 0Whatcom 1,320 9 4 2 7 12 20 30 84 132 173 376 471 0Whitman 225 1 0 0 0 0 4 6 16 20 36 65 77Yakima 1,855 30 5 2 10 26 36 66 132 213 296 487 552 0
00
0
0000
0
0
0
00
0
0
0

Washington State Vital Statistics 2005 75
Mortality Table A10. Month of Death by County of Residence, 2005 County Total Jan Feb Mar Apr May Jun Jul Aug Sep Oct Nov DecState Total 46,015 4,296 4,036 4,381 3,858 3,811 3,580 3,554 3,518 3,422 3,725 3,647 4,187Adams 112 11 12 9 7 15 9 3 9 10 13 10Asotin 202 23 14 24 22 14 15 14 17 14 15 19 1Benton 1,029 81 76 101 94 91 91 79 81 89 84 78 84Chelan 607 60 42 57 44 47 54 45 45 54 58 45 5Clallam 826 89 61 78 70 74 64 79 55 55 62 64 75Clark 2,714 254 245 235 203 223 197 213 210 231 250 213 240Columbia 38 1 8 6 3 3 0 2 2 6 3 2 2Cowlitz 1,042 99 89 91 105 89 75 85 85 77 68 80 9Douglas 258 29 28 26 18 25 15 25 21 15 23 13 2Ferry 83 13 8 6 9 14 8 6 6 3 5 4 1Franklin 276 25 20 25 24 25 25 22 28 17 22 26 1Garfield 25 2 3 2 3 5 1 1 4 2 0 2 0Grant 573 44 59 61 41 54 47 48 42 51 35 42 49Grays Harbor 764 78 79 75 69 71 56 44 36 54 72 55 7Island 591 59 55 48 53 42 39 60 46 41 43 48 5Jefferson 295 23 23 27 22 26 28 29 29 15 24 19 30King 11,418 1,081 1,012 1,050 969 935 924 917 815 851 922 858 1,084Kitsap 1,799 155 144 194 171 142 135 136 134 127 145 149 167Kittitas 236 9 24 23 24 20 15 23 20 19 26 15 18Klickitat 175 19 13 18 15 16 11 12 15 13 15 18 10Lewis 752 75 74 65 64 63 71 55 62 54 53 54 6Lincoln 132 10 12 15 13 10 11 9 12 12 9 6 13Mason 592 50 49 59 47 55 52 44 53 43 45 47 48Okanogan 365 33 33 41 24 25 30 23 25 34 26 35 36Pacific 294 39 21 31 32 21 18 25 21 22 22 15 27Pend Oreille 119 11 12 13 10 8 14 9 8 8 8 13Pierce 5,502 514 503 541 474 436 402 386 414 393 452 471 516San Juan 103 11 5 10 12 7 9 7 7 5 8 15Skagit 1,024 78 90 101 82 80 80 76 92 79 74 87 105Skamania 79 9 11 8 6 7 6 8 4 5 8 3 4Snohomish 4,236 403 345 396 341 368 357 327 333 320 338 328 380Spokane 3,637 369 327 353 272 309 258 284 316 279 272 303 295Stevens 389 30 39 37 38 33 33 21 23 31 31 34 39Thurston 1,738 165 137 175 151 136 143 131 133 121 141 146 159Wahkiakum 43 0 9 3 1 6 1 3 8 2 5 2 3Walla Walla 547 39 38 62 46 58 41 40 37 37 53 55 41Whatcom 1,320 134 129 117 105 86 96 101 117 86 113 100 136Whitman 225 20 22 14 23 25 13 20 16 12 24 16 20Yakima 1,855 151 165 184 151 147 136 142 137 135 158 157 192
41
6
90
7
57
2
5
7

Mortality Table A11. Place Where Death Occurred by County of Occurrence, 2005
County TotalGeneralHospital
NursingHome
Hospice Facility Home
Federal Facility
PsychiatricHospital
State Facility
Dead onArrival
Other andUnk
State Total 46,273 15,036 13,215 1,737 13,604 511 18 7 58 2,087Adams 106 27 30 0 32 0 0 0 0 17Asotin 174 53 62 0 45 0 0 0 0 14Benton 1,131 396 178 255 268 0 0 0 0 34Chelan 718 347 193 0 150 0 0 0 1 27Clallam 741 208 222 0 277 0 0 0 2 32Clark 2,575 583 591 345 935 9 0 0 3 109Columbia 32 12 11 0 7 0 0 0 0 2Cowlitz 1,097 240 230 372 212 0 0 0 0 43Douglas 165 0 80 1 74 0 0 0 0 10Ferry 55 17 2 2 22 0 0 0 0 12Franklin 187 49 48 0 78 0 0 0 3 9Garfield 20 8 7 0 3 0 0 0 0 2Grant 460 147 121 0 156 0 0 0 2 34Grays Harbor 625 192 177 0 218 0 0 0 2 36Island 460 73 154 8 198 1 0 0 0 26Jefferson 224 53 41 0 112 0 0 0 1 17King 12,819 4,921 3,486 386 3,291 233 0 0 9 493Kitsap 1,721 578 597 0 470 9 0 0 5 62Kittitas 207 32 60 0 93 0 0 0 0 22Klickitat 138 41 4 0 76 0 0 0 0 17Lewis 663 197 225 1 209 0 0 0 1 30Lincoln 94 36 25 0 28 0 0 0 0 5Mason 438 69 156 0 181 0 0 0 0 32Okanogan 320 94 93 0 107 0 0 0 0 26Pacific 213 61 59 0 80 0 0 0 0 13Pend Oreille 100 22 31 0 39 0 0 0 0 8Pierce 5,559 1,682 1,570 348 1,548 155 7 0 12 237San Juan 84 0 34 0 44 0 0 0 0 6Skagit 1,019 260 381 0 323 0 0 0 1 54Skamania 51 0 5 0 29 0 0 0 0 17Snohomish 3,868 1,112 1,230 4 1,311 0 0 3 6 202Spokane 4,124 1,581 1,179 8 1,129 74 11 0 1 141Stevens 287 76 70 0 118 0 0 0 0 23Thurston 1,852 616 558 4 608 0 0 0 1 65Wahkiakum 35 0 19 0 7 0 0 0 0 9Walla Walla 584 224 175 0 136 30 0 4 1 14Whatcom 1,313 294 495 2 447 0 0 0 2 73Whitman 190 59 57 0 63 0 0 0 2 9Yakima 1,824 676 559 1 480 0 0 0 3 105
Washington State Vital Statistics 2005 76

Washington State Vital Statistics 2005 77
B. Autopsy and Disposition Death certificates collect information on whether or not an autopsy was performed and also collect information on the type of disposition. The use of an autopsy provides information about the quality of cause-of-death information on death certificates. Mortality Table B1. Percent Autopsy and Cremation for Residents, 1996-2005 Year Percent Autopsy Percent Cremation1996 10.7 52.01997 10.1 53.81998 10.0 55.01999 10.1 56.12000 9.9 57.62001 9.7 59.52002 9.8 60.62003 9.3 61.22004 9.9 62.62005 10.0 64.0 The percent of deaths with an autopsy has steadily decreased since 1990. Rates of autopsy vary by age and by manner of death. Table B2 provides more detailed information on autopsies for 2005. The percent of total deaths with cremation as a disposition type has increased substantially since 1990.
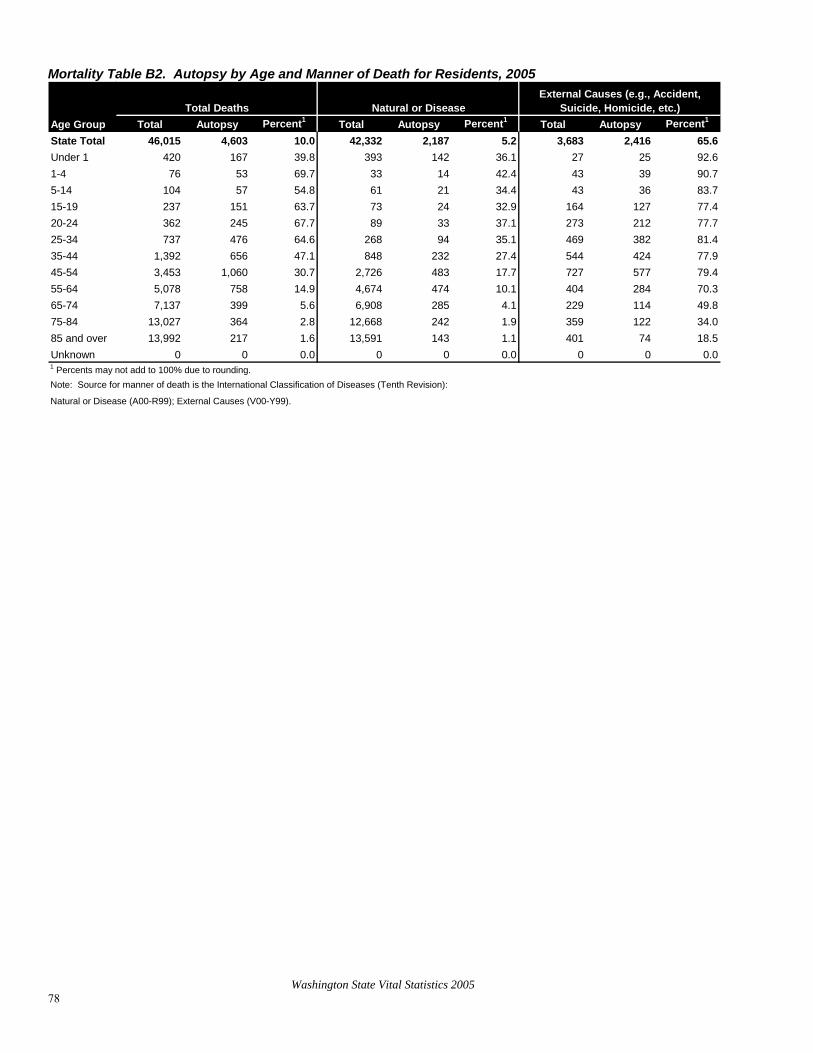
Washington State Vital Statistics 2005 78
Mortality Table B2. Autopsy by Age and Manner of Death for Residents, 2005
Age Group Total Autopsy Percent1 Total Autopsy Percent1 Total Autopsy Percent1
State Total 46,015 4,603 10.0 42,332 2,187 5.2 3,683 2,416 65.6Under 1 420 167 39.8 393 142 36.1 27 25 92.61-4 76 53 69.7 33 14 42.4 43 39 90.75-14 104 57 54.8 61 21 34.4 43 36 83.715-19 237 151 63.7 73 24 32.9 164 127 77.420-24 362 245 67.7 89 33 37.1 273 212 77.725-34 737 476 64.6 268 94 35.1 469 382 81.435-44 1,392 656 47.1 848 232 27.4 544 424 77.945-54 3,453 1,060 30.7 2,726 483 17.7 727 577 79.455-64 5,078 758 14.9 4,674 474 10.1 404 284 70.365-74 7,137 399 5.6 6,908 285 4.1 229 114 49.875-84 13,027 364 2.8 12,668 242 1.9 359 122 34.085 and over 13,992 217 1.6 13,591 143 1.1 401 74 18.5Unknown 0 0 0.0 0 0 0.0 0 0 0.01 Percents may not add to 100% due to rounding.Note: Source for manner of death is the International Classification of Diseases (Tenth Revision):
Natural or Disease (A00-R99); External Causes (V00-Y99).
Total Deaths Natural or DiseaseExternal Causes (e.g., Accident,
Suicide, Homicide, etc.)

Mortality Table B3. Type of Disposition by County of Residence, 2005
County Total Burial Cremation RemovalMedical
ResearchBody Not
Recovered Entombment Other UnknownState Total 46,015 14,089 29,447 1,390 199 3 551 4 332Adams 112 51 47 13 0 0 0 0 1Asotin 202 60 78 64 0 0 0 0 0Benton 1,029 397 570 42 4 0 12 0 4Chelan 607 234 358 8 1 0 6 0 0Clallam 826 153 649 16 4 0 3 0 1Clark 2,714 865 1,569 80 7 0 48 1 144Columbia 38 13 24 0 0 0 0 0 1Cowlitz 1,042 260 691 25 2 0 39 0 25Douglas 258 100 147 7 0 0 4 0 0Ferry 83 30 53 0 0 0 0 0 0Franklin 276 126 125 21 0 0 2 0 2Garfield 25 14 11 0 0 0 0 0 0Grant 573 185 363 23 0 0 0 0 2Grays Harbor 764 203 537 8 4 0 10 0 2Island 591 114 450 17 2 0 6 0 2Jefferson 295 31 255 7 1 1 0 0 0King 11,418 3,232 7,477 416 82 1 178 1 31Kitsap 1,799 410 1,301 62 6 0 17 0 3Kittitas 236 80 148 4 1 0 2 0 1Klickitat 175 42 99 8 1 0 0 0 25Lewis 752 251 478 15 2 1 3 0 2Lincoln 132 54 76 1 0 0 0 0 1Mason 592 120 454 16 0 0 1 0 1Okanogan 365 170 190 4 0 0 0 0 1Pacific 294 73 196 1 1 0 2 0 21Pend Oreille 119 40 77 1 1 0 0 0 0Pierce 5,502 1,812 3,402 168 25 0 83 1 11San Juan 103 16 85 1 0 0 0 0 1Skagit 1,024 324 676 15 2 0 7 0 0Skamania 79 18 42 3 0 0 0 0 16Snohomish 4,236 1,114 2,912 129 32 0 40 0 9Spokane 3,637 1,200 2,301 67 7 0 56 0 6Stevens 389 142 237 9 0 0 0 0 1Thurston 1,738 474 1,181 63 5 0 12 0 3Wahkiakum 43 16 20 1 0 0 3 1 2Walla Walla 547 211 314 8 2 0 4 0 8Whatcom 1,320 450 830 25 6 0 9 0 0Whitman 225 84 131 9 0 0 0 0 1Yakima 1,855 920 893 33 1 0 4 0 4
Washington State Vital Statistics 2005 79

Washington State Vital Statistics 2005 80
C. Leading Causes of Death, Overview, and Selected Causes of Death Leading causes of death are used to determine the relative ranking of specific causes of death. The rankings depend on how causes of death are categorized into groups. Leading causes of death for this report follow the guidelines established by the National Center for Health Statistics. See the first part of Appendix A for more information about how changes in the classification of diseases (from ICD-9 to ICD-10) affects trends. Mortality Table C1. Age-Adjusted Rates¹ for 10 Leading Causes of Death for Residents, 1996-2005
YearHeart
Disease Cancer Strokes COPDUninten- tional
or Accident Alzheimer's DiabetesFlu &
PneumoniaInten- tional or
SuicideLiver
Disease1996 241.4 202.9 73.0 45.8 34.8 11.5 23.9 34.3 14.2 9.21997 221.2 196.6 67.6 46.5 34.0 11.6 21.8 33.0 13.0 9.61998 222.0 196.0 66.3 46.5 33.9 11.9 23.2 33.5 12.3 8.5***1998 Comparability Modified***
218.7 197.8 69.6 48.4 34.7 18.9 23.7 23.4 12.3 8.71999 216.4 198.9 70.2 51.4 33.5 30.0 24.5 23.8 14.2 9.52000 209.3 195.6 68.6 49.3 35.5 33.4 24.5 18.6 12.4 8.72001 202.1 194.0 67.8 48.2 35.1 37.0 25.3 17.2 11.9 9.82002 194.8 190.6 66.1 48.5 36.5 39.2 26.4 15.8 13.4 8.92003 190.4 190.1 61.5 46.4 36.4 40.5 26.0 18.5 13.0 9.22004 177.1 184.9 54.3 43.6 37.6 37.0 25.2 12.2 13.2 8.92005 176.4 180.5 47.0 45.0 39.8 36.9 25.3 14.8 12.7 8.6
Diabetes Mellitus: ICD-9: 250; ICD-10: E10-E14; CR=1.0193
Influenza and Pneumonia: ICD-9: 480-487; ICD-10: J10-J18; CR=0.6974
Intentional or Suicide: ICD-9: E950-E959; ICD-10: X60-X84,Y87.0; CR=1.0022
Chronic Liver Disease: ICD-9: 571; ICD-10: K70,K73-K74; CR=1.0321
Strokes or Cerebrovascular Disease: ICD-9: 430-434,436-438; ICD-10: I60-I69; CR=1.0502
COPD or Chronic Lower Respiratory Disease: ICD-9: 490-494,496; ICD-10: J40-J47; CR=1.0411
Unintentional Injury or Accident: ICD-9: E800-E869,E880-E929; ICD-10: V01-X59,Y85-Y86; CR=1.0251
Alzheimer's Disease: ICD-9: 331.0; ICD-10: G30; CR=1.5812
the Tenth Revision (ICD-10) started in 1998. Rates during 1998 have been multiplied by a comparability ratio (CR).
ICD codes and comparability ratios are:
Heart Disease: ICD-9: 390-398,402,404,410-429; ICD-10: I00-I09,I11,I13,I20-I51; CR=0.9852
Cancer: ICD-9: 140-208; ICD-10: C00-C97; CR=1.0093
1Rate per 100,000 age-adjusted to U.S. 2000 population. Note:
Causes of death were coded with International Classification of Diseases, Ninth Revision (ICD-9) in 1990-1998 and with
The ten leading causes of death accounted for 78.6% of all deaths to residents of Washington State in 2005. Heart disease and cancer alone account for 47.6% of all deaths. Alzheimer’s disease and heart disease have the largest changes over time with heart disease decreasing and Alzheimer’s disease increasing. There have been smaller increases in mortality due to diabetes during the last decade.

Washington State Vital Statistics 2005 81
Mortality Figure 6. Heart disease deaths Regions: Although varying in size, portions of Pierce County and
southwest Washington are consistently found to have higher than expected heart disease deaths. For 2000-2004 combined this southwest region had a relative risk (rr) of 1.19, or 19% more heart disease deaths than expected. On average, this rr suggests that the area experienced approximately 420 more heart diseases deaths per year than would have been expected. Trends: The statewide age-adjusted heart disease mortality rates have been decreasing. Between 1980 and 1998 the rates dropped by 2.8% per year; between 1999 and 2004 they decreased by 3.7% per year.
High relative risk (rr) regions by year
2000
rr = 2.58
2001
rr = 1.25
rr = 1.34
2002
rr = 1.32 rr = 1.79
2003
2004
rr = 1.20
rr = 1.19
Heart disease deaths: High relative risk (rr) regions 2000-2004 combined
rr = 1.19
Heart disease death rates: Statewide tends, 1980-2004
150
200
250
300
350
400
1980
1981
1982
1983
1984
1985
1986
1987
1988
1989
1990
1991
1992
1993
1994
1995
1996
1997
1998
1999
2000
2001
2002
2003
2004
age-
adju
sted
rate
1980-1998 rates, ICD-9 1999-2004 rates, ICD-10 trend line(s)
2.8% per year decrease1980-1998 3.7% per year
decrease1999-2004
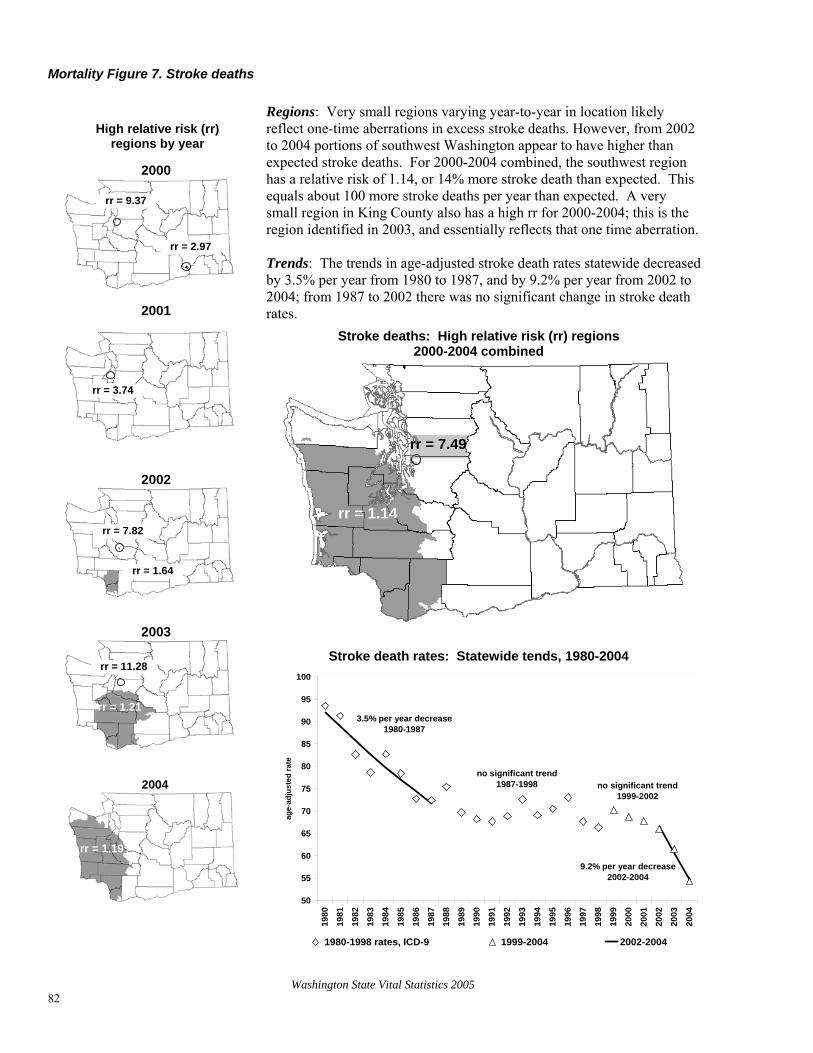
Washington State Vital Statistics 2005 82
Mortality Figure 7. Stroke deaths Regions: Very small regions varying year-to-year in location likely
reflect one-time aberrations in excess stroke deaths. However, from 2002 to 2004 portions of southwest Washington appear to have higher than expected stroke deaths. For 2000-2004 combined, the southwest region has a relative risk of 1.14, or 14% more stroke death than expected. This equals about 100 more stroke deaths per year than expected. A very small region in King County also has a high rr for 2000-2004; this is the region identified in 2003, and essentially reflects that one time aberration. Trends: The trends in age-adjusted stroke death rates statewide decreased by 3.5% per year from 1980 to 1987, and by 9.2% per year from 2002 to 2004; from 1987 to 2002 there was no significant change in stroke death rates.
High relative risk (rr) regions by year
2000
rr = 2.97
rr = 9.37
2001
Stroke deaths: High relative risk (rr) regions 2000-2004 combined
rr = 3.74
rr = 1.14
rr = 7.49
2002
rr = 1.64
rr = 7.82
2003
rr = 1.21
2004
rr = 1.19
rr = 11.28 Stroke death rates: Statewide tends, 1980-2004
50
55
60
65
70
75
80
85
90
95
100
1980
1981
1982
1983
1984
1985
1986
1987
1988
1989
1990
1991
1992
1993
1994
1995
1996
1997
1998
1999
2000
2001
2002
2003
2004
age-
adju
sted
rate
1980-1998 rates, ICD-9 1999-2004 2002-2004
3.5% per year decrease1980-1987
no significant trend1999-2002
9.2% per year decrease2002-2004
no significant trend1987-1998

Washington State Vital Statistics 2005 83
Mortality Table C2. Leading Causes of Death for Residents, 2005
Rank Causes of Death and ICD-10 Codes Number Percent1Cumulative
PercentAll Causes 46,015 100.0
1 Malignant Neoplasms (C00-C97) 11,008 23.9 23.92 Diseases of the Heart (I00-I09,I11,I13,I20-I51) 10,913 23.7 47.63 Cerebrovascular Diseases (I60-I69) 2,883 6.3 53.94 Chronic Lower Respiratory Diseases (J40-J47) 2,692 5.9 59.85 Unintentional Injury (Accident) (V01-X59,Y85-Y86) 2,520 5.5 65.26 Alzheimer's Disease (G30) 2,308 5.0 70.27 Diabetes Mellitus (E10-E14) 1,549 3.4 73.68 Influenza and Pneumonia (J10-J18) 926 2.0 75.69 Intentional Self-Harm (Suicide) (X60-X84,Y87.0) 814 1.8 77.410 Chronic Liver Disease & Cirrhosis (K70,K73-K74) 556 1.2 78.6
All Other Causes 9,846 21.4 100.01 Percents may not add to 100% due to rounding. Mortality Figure 8. Leading Causes of Death for Residents, 2005
21.4
1.2
1.8
2.0
3.4
5.0
5.5
5.9
6.3
23.7
23.9
0 10 20
All Other Causes
Chronic Liver Disease & Cirrhosis
Intentional Self-Harm
Influenza and Pneumonia
Diabetes Mellitus
Alzheimer's Disease
Unintentional Injury (Accident)
Chronic Lower Respiratory Diseases
Cerebrovascular Diseases
Diseases of the Heart
Malignant Neoplasms
Percent
30
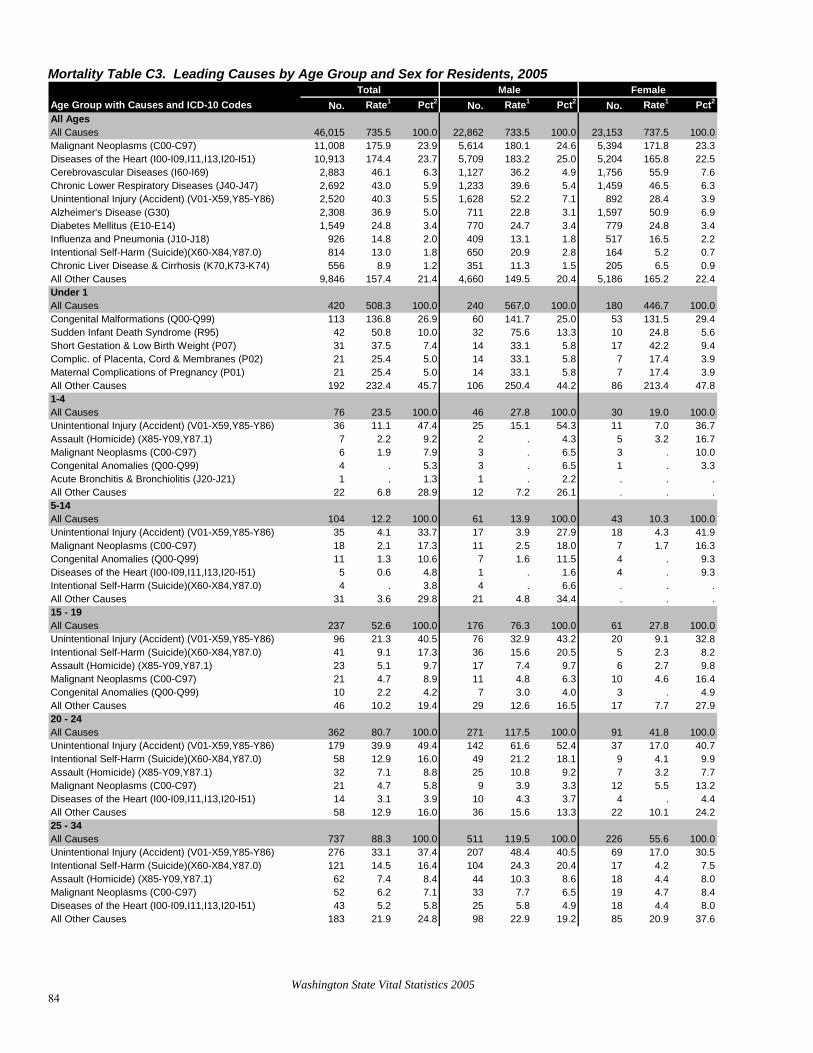
Washington State Vital Statistics 2005 84
Mortality Table C3. Leading Causes by Age Group and Sex for Residents, 2005
Age Group with Causes and ICD-10 Codes No. Rate1 Pct2 No. Rate1 Pct2 No. Rate1 Pct2
All AgesAll Causes 46,015 735.5 100.0 22,862 733.5 100.0 23,153 737.5 100.0Malignant Neoplasms (C00-C97) 11,008 175.9 23.9 5,614 180.1 24.6 5,394 171.8 23.3Diseases of the Heart (I00-I09,I11,I13,I20-I51) 10,913 174.4 23.7 5,709 183.2 25.0 5,204 165.8 22.5Cerebrovascular Diseases (I60-I69) 2,883 46.1 6.3 1,127 36.2 4.9 1,756 55.9 7.6Chronic Lower Respiratory Diseases (J40-J47) 2,692 43.0 5.9 1,233 39.6 5.4 1,459 46.5 6.3Unintentional Injury (Accident) (V01-X59,Y85-Y86) 2,520 40.3 5.5 1,628 52.2 7.1 892 28.4 3.9Alzheimer's Disease (G30) 2,308 36.9 5.0 711 22.8 3.1 1,597 50.9 6.9Diabetes Mellitus (E10-E14) 1,549 24.8 3.4 770 24.7 3.4 779 24.8 3.4Influenza and Pneumonia (J10-J18) 926 14.8 2.0 409 13.1 1.8 517 16.5 2.2Intentional Self-Harm (Suicide)(X60-X84,Y87.0) 814 13.0 1.8 650 20.9 2.8 164 5.2 0.7Chronic Liver Disease & Cirrhosis (K70,K73-K74) 556 8.9 1.2 351 11.3 1.5 205 6.5 0.9All Other Causes 9,846 157.4 21.4 4,660 149.5 20.4 5,186 165.2 22.4Under 1All Causes 420 508.3 100.0 240 567.0 100.0 180 446.7 100.0Congenital Malformations (Q00-Q99) 113 136.8 26.9 60 141.7 25.0 53 131.5 29.4Sudden Infant Death Syndrome (R95) 42 50.8 10.0 32 75.6 13.3 10 24.8 5.6Short Gestation & Low Birth Weight (P07) 31 37.5 7.4 14 33.1 5.8 17 42.2 9.4Complic. of Placenta, Cord & Membranes (P02) 21 25.4 5.0 14 33.1 5.8 7 17.4 3.9Maternal Complications of Pregnancy (P01) 21 25.4 5.0 14 33.1 5.8 7 17.4 3.9All Other Causes 192 232.4 45.7 106 250.4 44.2 86 213.4 47.81-4All Causes 76 23.5 100.0 46 27.8 100.0 30 19.0 100.0Unintentional Injury (Accident) (V01-X59,Y85-Y86) 36 11.1 47.4 25 15.1 54.3 11 7.0 36.7Assault (Homicide) (X85-Y09,Y87.1) 7 2.2 9.2 2 . 4.3 5 3.2 16.7Malignant Neoplasms (C00-C97) 6 1.9 7.9 3 . 6.5 3 . 10.0Congenital Anomalies (Q00-Q99) 4 . 5.3 3 . 6.5 1 . 3.3Acute Bronchitis & Bronchiolitis (J20-J21) 1 . 1.3 1 . 2.2 . . .All Other Causes 22 6.8 28.9 12 7.2 26.1 . . .5-14All Causes 104 12.2 100.0 61 13.9 100.0 43 10.3 100.0Unintentional Injury (Accident) (V01-X59,Y85-Y86) 35 4.1 33.7 17 3.9 27.9 18 4.3 41.9Malignant Neoplasms (C00-C97) 18 2.1 17.3 11 2.5 18.0 7 1.7 16.3Congenital Anomalies (Q00-Q99) 11 1.3 10.6 7 1.6 11.5 4 . 9.3Diseases of the Heart (I00-I09,I11,I13,I20-I51) 5 0.6 4.8 1 . 1.6 4 . 9.3Intentional Self-Harm (Suicide)(X60-X84,Y87.0) 4 . 3.8 4 . 6.6 . . .All Other Causes 31 3.6 29.8 21 4.8 34.4 . . .15 - 19All Causes 237 52.6 100.0 176 76.3 100.0 61 27.8 100.0Unintentional Injury (Accident) (V01-X59,Y85-Y86) 96 21.3 40.5 76 32.9 43.2 20 9.1 32.8Intentional Self-Harm (Suicide)(X60-X84,Y87.0) 41 9.1 17.3 36 15.6 20.5 5 2.3 8.2Assault (Homicide) (X85-Y09,Y87.1) 23 5.1 9.7 17 7.4 9.7 6 2.7 9.8Malignant Neoplasms (C00-C97) 21 4.7 8.9 11 4.8 6.3 10 4.6 16.4Congenital Anomalies (Q00-Q99) 10 2.2 4.2 7 3.0 4.0 3 . 4.9All Other Causes 46 10.2 19.4 29 12.6 16.5 17 7.7 27.920 - 24All Causes 362 80.7 100.0 271 117.5 100.0 91 41.8 100.0Unintentional Injury (Accident) (V01-X59,Y85-Y86) 179 39.9 49.4 142 61.6 52.4 37 17.0 40.7Intentional Self-Harm (Suicide)(X60-X84,Y87.0) 58 12.9 16.0 49 21.2 18.1 9 4.1 9.9Assault (Homicide) (X85-Y09,Y87.1) 32 7.1 8.8 25 10.8 9.2 7 3.2 7.7Malignant Neoplasms (C00-C97) 21 4.7 5.8 9 3.9 3.3 12 5.5 13.2Diseases of the Heart (I00-I09,I11,I13,I20-I51) 14 3.1 3.9 10 4.3 3.7 4 . 4.4All Other Causes 58 12.9 16.0 36 15.6 13.3 22 10.1 24.225 - 34All Causes 737 88.3 100.0 511 119.5 100.0 226 55.6 100.0Unintentional Injury (Accident) (V01-X59,Y85-Y86) 276 33.1 37.4 207 48.4 40.5 69 17.0 30.5Intentional Self-Harm (Suicide)(X60-X84,Y87.0) 121 14.5 16.4 104 24.3 20.4 17 4.2 7.5Assault (Homicide) (X85-Y09,Y87.1) 62 7.4 8.4 44 10.3 8.6 18 4.4 8.0Malignant Neoplasms (C00-C97) 52 6.2 7.1 33 7.7 6.5 19 4.7 8.4Diseases of the Heart (I00-I09,I11,I13,I20-I51) 43 5.2 5.8 25 5.8 4.9 18 4.4 8.0All Other Causes 183 21.9 24.8 98 22.9 19.2 85 20.9 37.6
Total Male Female
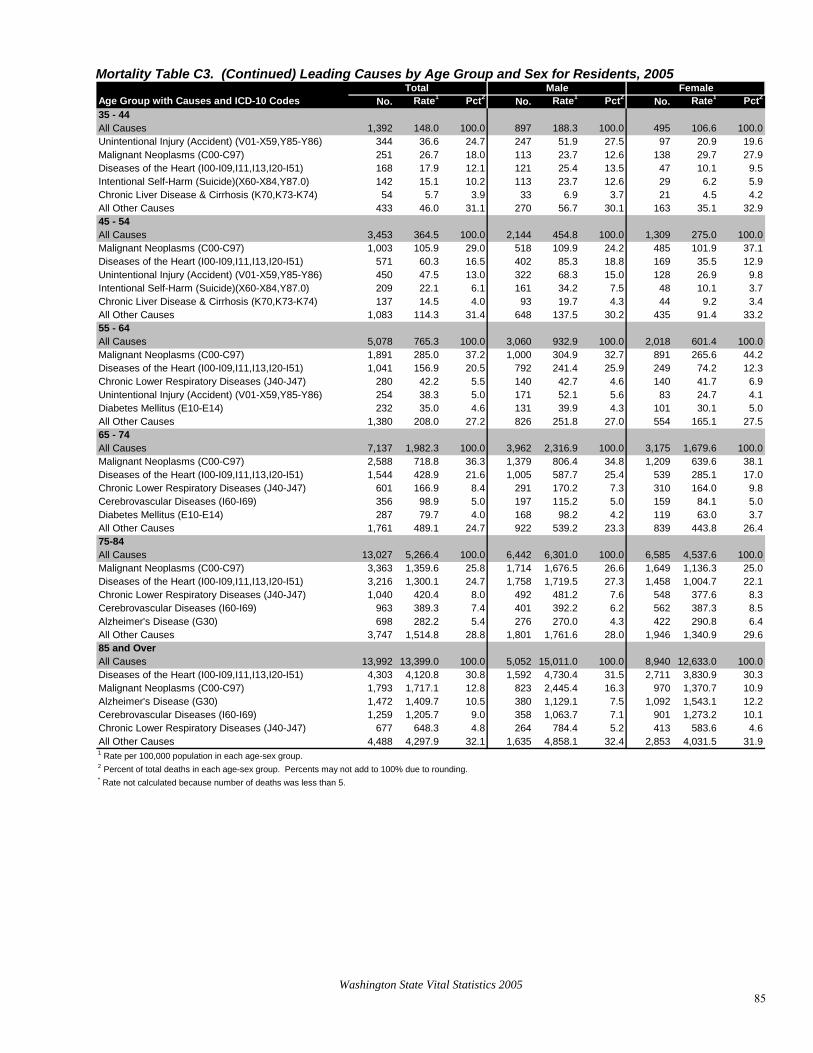
Washington State Vital Statistics 2005 85
Mortality Table C3. (Continued) Leading Causes by Age Group and Sex for Residents, 2005
Age Group with Causes and ICD-10 Codes No. Rate1 Pct2 No. Rate1 Pct2 No. Rate1 Pct2
35 - 44All Causes 1,392 148.0 100.0 897 188.3 100.0 495 106.6 100.0Unintentional Injury (Accident) (V01-X59,Y85-Y86) 344 36.6 24.7 247 51.9 27.5 97 20.9 19.6Malignant Neoplasms (C00-C97) 251 26.7 18.0 113 23.7 12.6 138 29.7 27.9Diseases of the Heart (I00-I09,I11,I13,I20-I51) 168 17.9 12.1 121 25.4 13.5 47 10.1 9.5Intentional Self-Harm (Suicide)(X60-X84,Y87.0) 142 15.1 10.2 113 23.7 12.6 29 6.2 5.9Chronic Liver Disease & Cirrhosis (K70,K73-K74) 54 5.7 3.9 33 6.9 3.7 21 4.5 4.2All Other Causes 433 46.0 31.1 270 56.7 30.1 163 35.1 32.945 - 54All Causes 3,453 364.5 100.0 2,144 454.8 100.0 1,309 275.0 100.0Malignant Neoplasms (C00-C97) 1,003 105.9 29.0 518 109.9 24.2 485 101.9 37.1Diseases of the Heart (I00-I09,I11,I13,I20-I51) 571 60.3 16.5 402 85.3 18.8 169 35.5 12.9Unintentional Injury (Accident) (V01-X59,Y85-Y86) 450 47.5 13.0 322 68.3 15.0 128 26.9 9.8Intentional Self-Harm (Suicide)(X60-X84,Y87.0) 209 22.1 6.1 161 34.2 7.5 48 10.1 3.7Chronic Liver Disease & Cirrhosis (K70,K73-K74) 137 14.5 4.0 93 19.7 4.3 44 9.2 3.4All Other Causes 1,083 114.3 31.4 648 137.5 30.2 435 91.4 33.255 - 64All Causes 5,078 765.3 100.0 3,060 932.9 100.0 2,018 601.4 100.0Malignant Neoplasms (C00-C97) 1,891 285.0 37.2 1,000 304.9 32.7 891 265.6 44.2Diseases of the Heart (I00-I09,I11,I13,I20-I51) 1,041 156.9 20.5 792 241.4 25.9 249 74.2 12.3Chronic Lower Respiratory Diseases (J40-J47) 280 42.2 5.5 140 42.7 4.6 140 41.7 6.9Unintentional Injury (Accident) (V01-X59,Y85-Y86) 254 38.3 5.0 171 52.1 5.6 83 24.7 4.1Diabetes Mellitus (E10-E14) 232 35.0 4.6 131 39.9 4.3 101 30.1 5.0All Other Causes 1,380 208.0 27.2 826 251.8 27.0 554 165.1 27.565 - 74All Causes 7,137 1,982.3 100.0 3,962 2,316.9 100.0 3,175 1,679.6 100.0Malignant Neoplasms (C00-C97) 2,588 718.8 36.3 1,379 806.4 34.8 1,209 639.6 38.1Diseases of the Heart (I00-I09,I11,I13,I20-I51) 1,544 428.9 21.6 1,005 587.7 25.4 539 285.1 17.0Chronic Lower Respiratory Diseases (J40-J47) 601 166.9 8.4 291 170.2 7.3 310 164.0 9.8Cerebrovascular Diseases (I60-I69) 356 98.9 5.0 197 115.2 5.0 159 84.1 5.0Diabetes Mellitus (E10-E14) 287 79.7 4.0 168 98.2 4.2 119 63.0 3.7All Other Causes 1,761 489.1 24.7 922 539.2 23.3 839 443.8 26.475-84All Causes 13,027 5,266.4 100.0 6,442 6,301.0 100.0 6,585 4,537.6 100.0Malignant Neoplasms (C00-C97) 3,363 1,359.6 25.8 1,714 1,676.5 26.6 1,649 1,136.3 25.0Diseases of the Heart (I00-I09,I11,I13,I20-I51) 3,216 1,300.1 24.7 1,758 1,719.5 27.3 1,458 1,004.7 22.1Chronic Lower Respiratory Diseases (J40-J47) 1,040 420.4 8.0 492 481.2 7.6 548 377.6 8.3Cerebrovascular Diseases (I60-I69) 963 389.3 7.4 401 392.2 6.2 562 387.3 8.5Alzheimer's Disease (G30) 698 282.2 5.4 276 270.0 4.3 422 290.8 6.4All Other Causes 3,747 1,514.8 28.8 1,801 1,761.6 28.0 1,946 1,340.9 29.685 and OverAll Causes 13,992 13,399.0 100.0 5,052 15,011.0 100.0 8,940 12,633.0 100.0Diseases of the Heart (I00-I09,I11,I13,I20-I51) 4,303 4,120.8 30.8 1,592 4,730.4 31.5 2,711 3,830.9 30.3Malignant Neoplasms (C00-C97) 1,793 1,717.1 12.8 823 2,445.4 16.3 970 1,370.7 10.9Alzheimer's Disease (G30) 1,472 1,409.7 10.5 380 1,129.1 7.5 1,092 1,543.1 12.2Cerebrovascular Diseases (I60-I69) 1,259 1,205.7 9.0 358 1,063.7 7.1 901 1,273.2 10.1Chronic Lower Respiratory Diseases (J40-J47) 677 648.3 4.8 264 784.4 5.2 413 583.6 4.6All Other Causes 4,488 4,297.9 32.1 1,635 4,858.1 32.4 2,853 4,031.5 31.9
Total Male Female
1 Rate per 100,000 population in each age-sex group.2 Percent of total deaths in each age-sex group. Percents may not add to 100% due to rounding.* Rate not calculated because number of deaths was less than 5.

Washington State Vital Statistics 2005 86
Mortality Table C4. Crude Rates for Selected Causes by Sex for Residents, 2005
Cause with ICD-10 Code NumberCrude Rate2 Number
Crude Rate2 Number
Crude Rate2
All Causes1 (46,015) (735.5) (22,862) (733.5) (23,153) (737.5)Certain Infectious & Parasitic Disease (A00-B99) (954) (15.2) (537) (17.2) (417) (13.3)Tuberculosis (A16-A19) 9 0.1 8 0.3 1 *Septicemia (A40-A41) 360 5.8 176 5.6 184 5.9Viral Hepatitis (B15-B19) 158 2.5 94 3.0 64 2.0HIV (B20-B24) 136 2.2 112 3.6 24Other (A00-A15,A20-A39,A42-B14,B25-B99) 291 4.7 147 4.7 144 4.6Neoplasms (C00-D48) (11,226) (179.4) (5,723) (183.6) (5,503) (175.3)Malignant Neoplasms (C00-C97) 11,008 175.9 5,614 180.1 5,394 171.8In Situ & Benign Neoplasms (D00-D48) 218 3.5 109 3.5 109 3.5Diseases of Blood & Blood-Forming Organs (D50-D89) (137) (2.2) (62) (2.0) (75) (2.4)Anemias (D50-D64) 66 1.1 25 0.8 41 1.3Other (D65-D89) 71 1.1 37 1.2 34 1.1Endocrine, Nutritional & Metabolic Diseases (E00-E90) (2,138) (34.2) (1,038) (33.3) (1,100) (35.0)Diabetes Mellitus (E10-E14) 1,549 24.8 770 24.7 779 24.8Nutritional Diseases (E40-E64) 42 0.7 11 0.4 31 1.0Other (E00-E09,E15-E39,E65-E90) 547 8.7 257 8.2 290 9.2Mental & Behavioral Disorders (F01-F99) (1,079) (17.2) (444) (14.2) (635) (20.2)Diseases of the Nervous System (G00-G98) (3,439) (55.0) (1,306) (41.9) (2,133) (67.9)Meningitis (G00-G03) 18 0.3 11 0.4 7 0.2Amyotrophic Lateral Sclerosis (G12.2) 169 2.7 96 3.1 73 2.3Parkinson's Disease (G20-G21) 526 8.4 299 9.6 227 7.2Alzheimer's Disease (G30) 2,308 36.9 711 22.8 1,597 50.9Multiple Sclerosis (G35) 98 1.6 36 1.2 62 2.0Other (G04-G12.1,G12.3-G19,G22-G29,G31-G34,G36-G98) 320 5.1 153 4.9 167 5.3Diseases of the Eye & Ear (H00-H93) (3) (*) (1) (*) (2) (Diseases of the Circulatory System (I00-I99) (15,180) (242.6) (7,449) (239.0) (7,731) (246.3)Major Cardiovascular Diseases (I00-I78) (15,082) (241.1) (7,405) (237.6) (7,677) (244.5) Diseases of the Heart (I00-I09,I11,I13,I20-I51) (10,913) (174.4) (5,709) (183.2) (5,204) (165.8) Acute & Chronic Rheumatic Disease (I00-I09) 88 1.4 19 0.6 69 2.2 Hypertensive Heart Disease (I11) 562 9.0 226 7.3 336 10.7 Hypertensive Heart & Renal Disease (I13) 71 1.1 31 1.0 40 1.3 Ischemic Heart Diseases (I20-I25) (7,734) (123.6) (4,334) (139.0) (3,400) (108.3) Acute Myocardial Infarction (I21-I22) 2,428 38.8 1,352 43.4 1,076 34.3 Other Acute Ischemic Heart Disease (I24) 29 0.5 16 0.5 13 0.4 Other Chronic Ischemic Heart Disease (I20,I25) (5,277) (84.3) (2,966) (95.2) (2,311) (73.6) Atherosclerotic Cardiovascular Disease (I25.0) 1,549 24.8 876 28.1 673 21.4 All Other Chronic Disease (I20,I25.1-I25.9) 3,728 59.6 2,090 67.1 1,638 52.2 Other Heart Diseases (I26-I51) (2,458) (39.3) (1,099) (35.3) (1,359) (43.3) Acute & Subacute Endocarditis (I33) 30 0.5 15 0.5 15 0.5 Disease Pericardium & Acute Myocarditis (I30-I31,I40) 18 0.3 6 0.2 12 0.4 Heart Failure (I50) 555 8.9 219 7.0 336 10.7 All Other Heart disease (I26-I28,I34-I38,I42-I49,I51) 1,855 29.6 859 27.6 996 31.7 Hypertension & Hypertensive Renal Disease (I10,I12) 449 7.2 160 5.1 289 9.2 Cerebrovascular Diseases (I60-I69) 2,883 46.1 1,127 36.2 1,756 55.9 Atherosclerosis (I70) 311 5.0 123 3.9 188 6.0 Other Diseases of Circulatory System (I71-I78) (526) (8.4) (286) (9.2) (240) (7.6) Aortic Aneurysm & Dissection (I71) 313 5.0 200 6.4 113 3.6 Other Disease of Arteries (I72-I78) 213 3.4 86 2.8 127 4.0 Other (I80-I99) 98 1.6 44 1.4 54 1.7
Total Male Female
0.8
*)
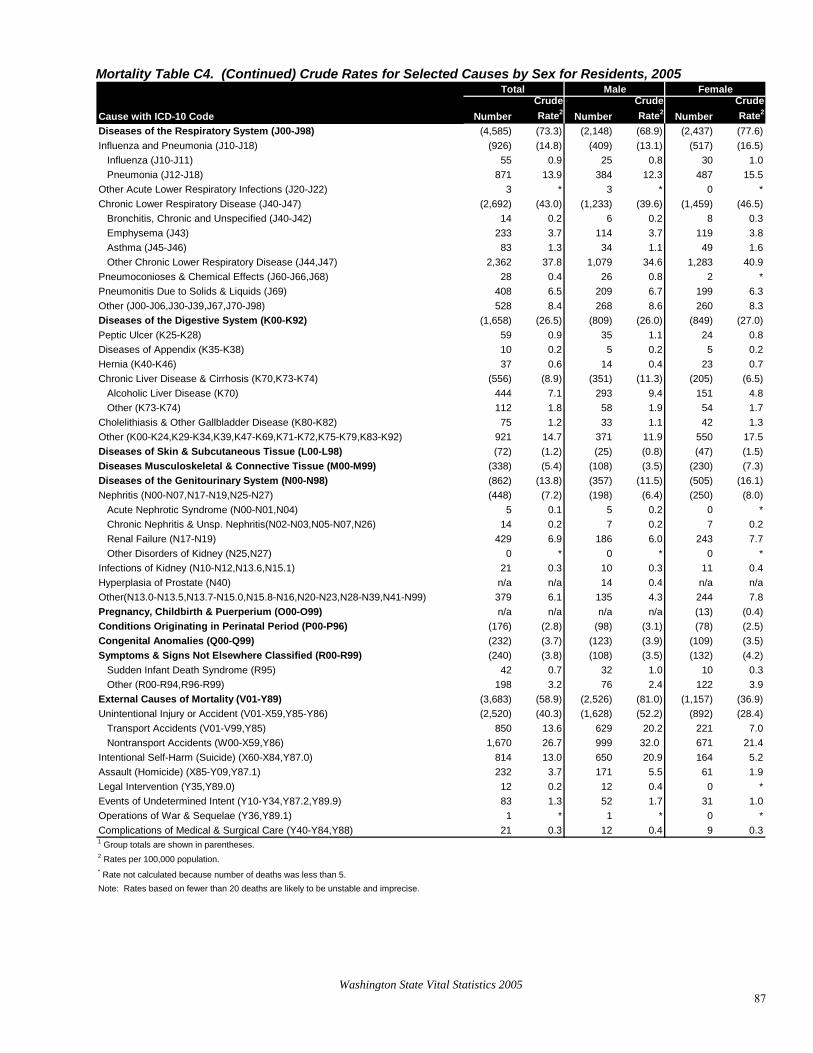
Washington State Vital Statistics 2005 87
Mortality Table C4. (Continued) Crude Rates for Selected Causes by Sex for Residents, 2005
Cause with ICD-10 Code NumberCrude Rate2 Number
Crude Rate2 Number
Crude Rate2
Diseases of the Respiratory System (J00-J98) (4,585) (73.3) (2,148) (68.9) (2,437) (77.6)Influenza and Pneumonia (J10-J18) (926) (14.8) (409) (13.1) (517) (16.5) Influenza (J10-J11) 55 0.9 25 0.8 30 1.0 Pneumonia (J12-J18) 871 13.9 384 12.3 487 15.5Other Acute Lower Respiratory Infections (J20-J22) 3 * 3 * 0 *Chronic Lower Respiratory Disease (J40-J47) (2,692) (43.0) (1,233) (39.6) (1,459) (46.5) Bronchitis, Chronic and Unspecified (J40-J42) 14 0.2 6 0.2 8 0.3 Emphysema (J43) 233 3.7 114 3.7 119 3.8 Asthma (J45-J46) 83 1.3 34 1.1 49 1.6 Other Chronic Lower Respiratory Disease (J44,J47) 2,362 37.8 1,079 34.6 1,283 40.9Pneumoconioses & Chemical Effects (J60-J66,J68) 28 0.4 26 0.8 2 *Pneumonitis Due to Solids & Liquids (J69) 408 6.5 209 6.7 199 6.3Other (J00-J06,J30-J39,J67,J70-J98) 528 8.4 268 8.6 260 8.3Diseases of the Digestive System (K00-K92) (1,658) (26.5) (809) (26.0) (849) (27.0)Peptic Ulcer (K25-K28) 59 0.9 35 1.1 24 0.8Diseases of Appendix (K35-K38) 10 0.2 5 0.2 5 0.2Hernia (K40-K46) 37 0.6 14 0.4 23 0.7Chronic Liver Disease & Cirrhosis (K70,K73-K74) (556) (8.9) (351) (11.3) (205) (6.5) Alcoholic Liver Disease (K70) 444 7.1 293 9.4 151 4.8 Other (K73-K74) 112 1.8 58 1.9 54 1.7Cholelithiasis & Other Gallbladder Disease (K80-K82) 75 1.2 33 1.1 42 1.3Other (K00-K24,K29-K34,K39,K47-K69,K71-K72,K75-K79,K83-K92) 921 14.7 371 11.9 550 17.5Diseases of Skin & Subcutaneous Tissue (L00-L98) (72) (1.2) (25) (0.8) (47) (1.5)Diseases Musculoskeletal & Connective Tissue (M00-M99) (338) (5.4) (108) (3.5) (230) (7.3)Diseases of the Genitourinary System (N00-N98) (862) (13.8) (357) (11.5) (505) (16.1)Nephritis (N00-N07,N17-N19,N25-N27) (448) (7.2) (198) (6.4) (250) (8.0) Acute Nephrotic Syndrome (N00-N01,N04) 5 0.1 5 0.2 0 * Chronic Nephritis & Unsp. Nephritis(N02-N03,N05-N07,N26) 14 0.2 7 0.2 7 0.2 Renal Failure (N17-N19) 429 6.9 186 6.0 243 7.7 Other Disorders of Kidney (N25,N27) 0 * 0 * 0 *Infections of Kidney (N10-N12,N13.6,N15.1) 21 0.3 10 0.3 11 0.4Hyperplasia of Prostate (N40) n/a n/a 14 0.4 n/a n/aOther(N13.0-N13.5,N13.7-N15.0,N15.8-N16,N20-N23,N28-N39,N41-N99) 379 6.1 135 4.3 244 7.8Pregnancy, Childbirth & Puerperium (O00-O99) n/a n/a n/a n/a (13) (0.4)Conditions Originating in Perinatal Period (P00-P96) (176) (2.8) (98) (3.1) (78) (2.5)Congenital Anomalies (Q00-Q99) (232) (3.7) (123) (3.9) (109) (3.5)Symptoms & Signs Not Elsewhere Classified (R00-R99) (240) (3.8) (108) (3.5) (132) (4.2) Sudden Infant Death Syndrome (R95) 42 0.7 32 1.0 10 0.3 Other (R00-R94,R96-R99) 198 3.2 76 2.4 122 3.9External Causes of Mortality (V01-Y89) (3,683) (58.9) (2,526) (81.0) (1,157) (36.9)Unintentional Injury or Accident (V01-X59,Y85-Y86) (2,520) (40.3) (1,628) (52.2) (892) (28.4) Transport Accidents (V01-V99,Y85) 850 13.6 629 20.2 221 7.0 Nontransport Accidents (W00-X59,Y86) 1,670 26.7 999 32.0 671 21.4Intentional Self-Harm (Suicide) (X60-X84,Y87.0) 814 13.0 650 20.9 164 5.2Assault (Homicide) (X85-Y09,Y87.1) 232 3.7 171 5.5 61 1.9Legal Intervention (Y35,Y89.0) 12 0.2 12 0.4 0 *Events of Undetermined Intent (Y10-Y34,Y87.2,Y89.9) 83 1.3 52 1.7 31 1.0Operations of War & Sequelae (Y36,Y89.1) 1 * 1 * 0 *Complications of Medical & Surgical Care (Y40-Y84,Y88) 21 0.3 12 0.4 9 0.3
Total Male Female
1 Group totals are shown in parentheses.2 Rates per 100,000 population.* Rate not calculated because number of deaths was less than 5.Note: Rates based on fewer than 20 deaths are likely to be unstable and imprecise.

Washington State Vital Statistics 2005 88
Mortality Table C5. Age-Adjusted Rates for Selected Causes by Sex for Residents, 2005
Cause with ICD-10 Code NumberAge-Adj
Rate2 NumberAge-Adj
Rate2 NumberAge-Adj
Rate2
All Causes1 (46,015) (746.1) (22,862) (882.7) (23,153) (638.3)Certain Infectious & Parasitic Disease (A00-B99) (954) (15.1) (537) (19.0) (417) (11.8)Tuberculosis (A16-A19) 9 0.2 8 0.3 1 *Septicemia (A40-A41) 360 5.8 176 7.0 184 5.1Viral Hepatitis (B15-B19) 158 2.3 94 2.8 64 1.8HIV (B20-B24) 136 2.1 112 3.5 24Other (A00-A15,A20-A39,A42-B14,B25-B99) 291 4.7 147 5.4 144 4.1Neoplasms (C00-D48) (11,226) (184.0) (5,723) (218.1) (5,503) (160.9)Malignant Neoplasms (C00-C97) 11,008 180.5 5,614 213.7 5,394 157.9In Situ & Benign Neoplasms (D00-D48) 218 3.6 109 4.4 109 3.0Diseases of Blood & Blood-Forming Organs (D50-D89) (137) (2.2) (62) (2.4) (75) (2.1)Anemias (D50-D64) 66 1.1 25 1.0 41 1.1Other (D65-D89) 71 1.2 37 1.4 34 1.0Endocrine, Nutritional & Metabolic Diseases (E00-E90) (2,138) (34.8) (1,038) (39.6) (1,100) (31.0)Diabetes Mellitus (E10-E14) 1,549 25.3 770 29.6 779 22.1Nutritional Diseases (E40-E64) 42 0.7 11 0.5 31 0.8Other (E00-E09,E15-E39,E65-E90) 547 8.8 257 9.5 290 8.2Mental & Behavioral Disorders (F01-F99) (1,079) (17.2) (444) (17.9) (635) (16.3)Diseases of the Nervous System (G00-G98) (3,439) (55.5) (1,306) (55.1) (2,133) (54.9)Meningitis (G00-G03) 18 0.3 11 0.4 7 0.2Amyotrophic Lateral Sclerosis (G12.2) 169 2.8 96 3.5 73 2.2Parkinson's Disease (G20-G21) 526 8.8 299 12.9 227 6.1Alzheimer's Disease (G30) 2,308 36.9 711 31.6 1,597 39.7Multiple Sclerosis (G35) 98 1.5 36 1.2 62 1.8Other (G04-G12.1,G12.3-G19,G22-G29,G31-G34,G36-G98) 320 5.1 153 5.4 167 4.9Diseases of the Eye & Ear (H00-H93) (3) (*) (1) (*) (2) (Diseases of the Circulatory System (I00-I99) (15,180) (245.8) (7,449) (298.5) (7,731) (204.1)Major Cardiovascular Diseases (I00-I78) (15,082) (244.2) (7,405) (296.9) (7,677) (202.6) Diseases of the Heart (I00-I09,I11,I13,I20-I51) (10,913) (176.4) (5,709) (227.2) (5,204) (137.2) Acute & Chronic Rheumatic Disease (I00-I09) 88 1.4 19 0.8 69 1.9 Hypertensive Heart Disease (I11) 562 8.9 226 8.6 336 8.6 Hypertensive Heart & Renal Disease (I13) 71 1.2 31 1.3 40 1.0 Ischemic Heart Diseases (I20-I25) (7,734) (125.3) (4,334) (171.8) (3,400) (89.9) Acute Myocardial Infarction (I21-I22) 2,428 39.4 1,352 52.7 1,076 29.0 Other Acute Ischemic Heart Disease (I24) 29 0.5 16 0.6 13 0.3 Other Chronic Ischemic Heart Disease (I20,I25) (5,277) (85.4) (2,966) (118.5) (2,311) (60.6) Atherosclerotic Cardiovascular Disease (I25.0) 1,549 24.7 876 32.6 673 17.9 All Other Chronic Disease (I20,I25.1-I25.9) 3,728 60.8 2,090 85.9 1,638 42.7 Other Heart Diseases (I26-I51) (2,458) (39.6) (1,099) (44.7) (1,359) (35.8) Acute & Subacute Endocarditis (I33) 30 0.5 15 0.6 15 0.5 Disease Pericardium & Acute Myocarditis (I30-I31,I40) 18 0.3 6 0.2 12 0.4 Heart Failure (I50) 555 8.9 219 9.4 336 8.5 All Other Heart disease (I26-I28,I34-I38,I42-I49,I51) 1,855 29.9 859 34.5 996 26.5 Hypertension & Hypertensive Renal Disease (I10,I12) 449 7.3 160 6.6 289 7.5 Cerebrovascular Diseases (I60-I69) 2,883 47.0 1,127 46.5 1,756 46.4 Atherosclerosis (I70) 311 5.0 123 5.3 188 4.7 Other Diseases of Circulatory System (I71-I78) (526) (8.6) (286) (11.3) (240) (6.7) Aortic Aneurysm & Dissection (I71) 313 5.2 200 7.8 113 3.2 Other Disease of Arteries (I72-I78) 213 3.5 86 3.5 127 3.5 Other (I80-I99) 98 1.6 44 1.6 54 1.5
Total Male Female
0.7
*)

Washington State Vital Statistics 2005 89
Mortality Table C5. (Continued) Age-Adjusted Rates for Selected Causes by Sex for Residents, 2005
Cause with ICD-10 Code NumberAge-Adj
Rate2 NumberAge-Adj
Rate2 NumberAge-Adj
Rate2
Diseases of the Respiratory System (J00-J98) (4,585) (75.7) (2,148) (88.0) (2,437) (68.0)Influenza and Pneumonia (J10-J18) (926) (14.8) (409) (17.0) (517) (13.6) Influenza (J10-J11) 55 0.9 25 1.1 30 0.8 Pneumonia (J12-J18) 871 13.9 384 16.0 487 12.8Other Acute Lower Respiratory Infections (J20-J22) 3 * 3 * 0 *Chronic Lower Respiratory Disease (J40-J47) (2,692) (45.0) (1,233) (50.1) (1,459) (41.9) Bronchitis, Chronic and Unspecified (J40-J42) 14 0.2 6 0.2 8 0.2 Emphysema (J43) 233 4.0 114 4.7 119 3.6 Asthma (J45-J46) 83 1.3 34 1.2 49 1.4 Other Chronic Lower Respiratory Disease (J44,J47) 2,362 39.5 1,079 43.9 1,283 36.7Pneumoconioses & Chemical Effects (J60-J66,J68) 28 0.5 26 1.1 2 *Pneumonitis Due to Solids & Liquids (J69) 408 6.6 209 9.1 199 5.1Other (J00-J06,J30-J39,J67,J70-J98) 528 8.8 268 10.6 260 7.3Diseases of the Digestive System (K00-K92) (1,658) (26.5) (809) (29.4) (849) (23.8)Peptic Ulcer (K25-K28) 59 0.9 35 1.3 24 0.6Diseases of Appendix (K35-K38) 10 0.2 5 0.2 5 0.1Hernia (K40-K46) 37 0.6 14 0.5 23 0.6Chronic Liver Disease & Cirrhosis (K70,K73-K74) (556) (8.6) (351) (11.4) (205) (6.2) Alcoholic Liver Disease (K70) 444 6.8 293 9.3 151 4.6 Other (K73-K74) 112 1.8 58 2.1 54 1.6Cholelithiasis & Other Gallbladder Disease (K80-K82) 75 1.2 33 1.4 42 1.2Other (K00-K24,K29-K34,K39,K47-K69,K71-K72,K75-K79,K83-K92) 921 15.0 371 14.6 550 15.2Diseases of Skin & Subcutaneous Tissue (L00-L98) (72) (1.1) (25) (0.9) (47) (1.2)Diseases Musculoskeletal & Connective Tissue (M00-M99) (338) (5.4) (108) (4.3) (230) (6.3)Diseases of the Genitourinary System (N00-N98) (862) (14.0) (357) (15.0) (505) (13.6)Nephritis (N00-N07,N17-N19,N25-N27) (448) (7.3) (198) (8.2) (250) (6.9) Acute Nephrotic Syndrome (N00-N01,N04) 5 0.1 5 0.2 0 * Chronic Nephritis & Unsp. Nephritis(N02-N03,N05-N07,N26) 14 0.2 7 0.3 7 0.2 Renal Failure (N17-N19) 429 7.0 186 7.7 243 6.7 Other Disorders of Kidney (N25,N27) 0 * 0 * 0 *Infections of Kidney (N10-N12,N13.6,N15.1) 21 0.3 10 0.4 11 0.3Hyperplasia of Prostate (N40) n/a n/a 14 0.6 n/a n/aOther(N13.0-N13.5,N13.7-N15.0,N15.8-N16,N20-N23,N28-N39,N41-N99) 379 6.1 135 5.8 244 6.3Pregnancy, Childbirth & Puerperium (O00-O99) n/a n/a n/a n/a (13) (0.4)Conditions Originating in Perinatal Period (P00-P96) (176) (2.9) (98) (3.2) (78) (2.7)Congenital Anomalies (Q00-Q99) (232) (3.7) (123) (4.0) (109) (3.5)Symptoms & Signs Not Elsewhere Classified (R00-R99) (240) (3.8) (108) (3.8) (132) (3.5) Sudden Infant Death Syndrome (R95) 42 0.7 32 1.0 10 0.3 Other (R00-R94,R96-R99) 198 3.1 76 2.8 122 3.2External Causes of Mortality (V01-Y89) (3,683) (58.0) (2,526) (83.5) (1,157) (34.0)Unintentional Injury or Accident (V01-X59,Y85-Y86) (2,520) (39.8) (1,628) (54.9) (892) (25.9) Transport Accidents (V01-V99,Y85) 850 13.5 629 20.3 221 6.9 Nontransport Accidents (W00-X59,Y86) 1,670 26.4 999 34.5 671 19.0Intentional Self-Harm (Suicide) (X60-X84,Y87.0) 814 12.7 650 20.9 164 4.9Assault (Homicide) (X85-Y09,Y87.1) 232 3.7 171 5.3 61 1.9Legal Intervention (Y35,Y89.0) 12 0.2 12 0.4 0 *Events of Undetermined Intent (Y10-Y34,Y87.2,Y89.9) 83 1.3 52 1.6 31 1.0Operations of War & Sequelae (Y36,Y89.1) 1 * 1 * 0 *Complications of Medical & Surgical Care (Y40-Y84,Y88) 21 0.3 12 0.4 9 0.3
Total Male Female
1 Group totals are shown in parentheses.2 Rates per 100,000 age-adjusted to U.S. 2000 population. Does not include deaths where age is unknown* Rate not calculated because number of deaths was less than 5.Note: Rates based on fewer than 20 deaths are likely to be unstable and imprecise.

Washington State Vital Statistics 2005 90
Mortality Table C6. Diabetes, Alzheimer's Disease, and Major Cardiovascular Disease by County of Residence, 2005
County Number Crude Rate1Age-Adj
Rate2 Number Crude Rate1Age-Adj
Rate2 Number Crude Rate1Age-Adj
Rate2
State Total 1,549 24.8 25.3 2,308 36.9 36.9 15,082 241.1 244.2Adams 7 41.2 45.3 2 * * 32 188.2 223.8Asotin 1 * * 5 23.9 15.5 60 287.1 188.7Benton 41 25.9 29.8 38 24.0 28.9 374 236.6 278.2Chelan 17 24.6 20.4 40 57.8 43.9 215 310.7 249.5Clallam 22 32.9 18.9 37 55.4 31.0 297 444.6 262.7Clark 101 25.8 31.4 138 35.2 43.2 851 217.4 261.4Columbia 0 * * 1 * * 9 219.5 143.9Cowlitz 41 42.8 38.6 52 54.2 45.5 301 313.9 274.6Douglas 4 * * 13 37.5 35.3 94 270.9 261.3Ferry 4 * * 0 * * 20 270.2 287.3Franklin 16 26.4 39.4 14 23.1 36.2 107 176.9 253.6Garfield 1 * * 1 * * 7 291.7 168.8Grant 24 30.3 31.9 17 21.5 23.9 186 235.2 256.1Grays Harbor 25 35.8 28.8 33 47.3 37.3 255 365.3 291.2Island 15 19.7 18.5 37 48.7 46.5 187 246.1 224.8Jefferson 10 36.2 27.0 12 43.5 28.1 104 376.8 236.9King 354 19.6 20.6 605 33.5 34.0 3,603 199.2 206.7Kitsap 55 22.9 24.8 113 47.0 50.6 560 232.9 249.3Kittitas 1 * * 9 24.6 23.9 86 235.0 233.3Klickitat 10 51.3 44.8 3 * * 71 364.1 310.2Lewis 49 68.4 52.7 45 62.8 44.3 227 317.0 240.2Lincoln 4 * * 4 * * 53 524.7 313.4Mason 23 44.3 35.6 21 40.5 34.6 203 391.1 320.6Okanogan 19 48.0 39.3 17 42.9 37.2 102 257.6 220.8Pacific 6 28.2 18.0 11 51.6 29.7 108 507.0 295.9Pend Oreille 2 * * 7 57.4 61.5 32 262.3 247.2Pierce 191 25.3 28.3 286 37.8 44.2 1,860 246.1 280.8San Juan 3 * * 8 51.6 34.7 30 193.6 128.6Skagit 44 39.7 32.3 79 71.2 54.7 303 273.2 216.5Skamania 1 * * 2 * * 24 233.1 264.9Snohomish 114 17.4 20.4 189 28.8 36.1 1,376 209.8 257.8Spokane 125 28.7 26.5 174 39.9 33.2 1,220 279.6 246.5Stevens 5 12.1 9.9 8 19.4 18.9 141 342.2 312.7Thurston 71 31.7 32.8 96 42.8 42.7 545 243.2 241.8Wahkiakum 5 128.3 114.2 2 * * 10 256.5 178.3Walla Walla 14 24.3 20.9 23 40.0 25.3 211 367.0 270.4Whatcom 45 24.9 24.4 85 47.0 44.3 441 243.9 236.0Whitman 6 14.2 18.4 14 33.0 38.1 69 162.7 195.8Yakima 73 31.8 33.2 67 29.2 27.0 708 308.8 307.1
Rates based on fewer than 20 deaths are likely to be unstable and imprecise.
1 Rate per 100,000 population.2 Rate per 100,000 age-adjusted to U.S. 2000 population. Does not include deaths where age is unknown.* Rate not calculated because number of deaths was less than 5.Note: Codes for International Classification of Diseases, Tenth Revision (ICD-10) are in parentheses after each group heading.
Diabetes (E10-E14) Alzheimer's Disease (G30) Major Cardiovascular Disease (I00-I78)

Washington State Vital Statistics 2005 91
Mortality Table C7. Diseases of the Heart, Ischemic Heart Diseases, and Cerebrovascular Diseases by County of Residence, 2005
County Number Crude Rate1Age-Adj
Rate2 Number Crude Rate1Age-Adj
Rate2 Number Crude Rate1Age-Adj
Rate2
State Total 10,913 174.4 176.4 7,734 123.6 125.3 2,883 46.1 47.0Adams 27 158.8 186.1 14 82.3 97.9 4 * *Asotin 45 215.3 142.7 26 124.4 81.6 9 43.1 25.8Benton 273 172.7 202.6 193 122.1 143.2 74 46.8 55.8Chelan 144 208.1 168.1 109 157.5 128.5 58 83.8 66.3Clallam 192 287.4 171.4 129 193.1 114.6 81 121.3 69.6Clark 612 156.3 187.2 416 106.3 127.7 155 39.6 48.7Columbia 9 219.5 143.9 9 219.5 143.9 0 * *Cowlitz 211 220.0 190.8 167 174.1 151.8 62 64.7 57.1Douglas 66 190.2 183.6 51 147.0 141.7 19 54.8 51.8Ferry 16 216.2 232.7 8 108.1 111.2 3 * *Franklin 84 138.8 200.2 63 104.1 154.0 14 23.1 32.2Garfield 5 208.3 122.7 4 * * 2 * *Grant 138 174.5 189.3 103 130.2 141.4 32 40.5 44.7Grays Harbor 186 266.5 212.4 121 173.4 138.3 44 63.0 51.0Island 134 176.3 161.0 88 115.8 104.3 28 36.8 33.9Jefferson 68 246.4 155.5 48 173.9 110.3 29 105.1 66.4King 2,608 144.2 149.5 1,774 98.1 102.0 698 38.6 40.0Kitsap 404 168.1 178.2 268 111.5 118.2 114 47.4 52.2Kittitas 63 172.1 173.8 47 128.4 125.4 17 46.4 44.4Klickitat 56 287.2 245.2 44 225.7 192.6 9 46.2 38.6Lewis 178 248.6 189.0 140 195.5 149.0 40 55.9 41.6Lincoln 33 326.7 207.8 21 207.9 128.0 8 79.2 41.9Mason 154 296.7 240.4 101 194.6 156.8 36 69.4 59.1Okanogan 69 174.2 148.7 39 98.5 84.3 24 60.6 52.0Pacific 86 403.7 236.6 68 319.2 188.3 17 79.8 45.6Pend Oreille 21 172.1 156.8 15 123.0 106.9 8 65.6 68.2Pierce 1,380 182.6 206.9 1,032 136.5 155.0 334 44.2 51.5San Juan 23 148.4 98.4 12 77.4 50.7 6 38.7 25.9Skagit 211 190.3 151.1 137 123.5 97.9 70 63.1 49.8Skamania 16 155.4 170.2 11 106.8 112.3 6 58.3 73.4Snohomish 1,036 158.0 193.1 758 115.6 142.1 246 37.5 46.8Spokane 801 183.6 162.5 577 132.2 117.8 238 54.5 48.8Stevens 99 240.3 216.8 82 199.0 179.8 32 77.7 72.3Thurston 395 176.3 175.7 258 115.1 115.2 98 43.7 43.6Wahkiakum 7 179.6 124.2 5 128.3 88.9 2 * *Walla Walla 137 238.3 176.4 87 151.3 111.8 58 100.9 71.8Whatcom 314 173.7 168.3 223 123.3 120.4 86 47.6 46.0Whitman 55 129.7 156.4 40 94.3 115.5 13 30.7 36.2Yakima 557 242.9 242.1 446 194.5 195.0 109 47.5 47.4
Rates based on fewer than 20 deaths are likely to be unstable and imprecise.
1 Rate per 100,000 population.2 Rate per 100,000 age-adjusted to U.S. 2000 population. Does not include deaths where age is unknown.* Rate not calculated because number of deaths was less than 5.Note: Codes for International Classification of Diseases, Tenth Revision (ICD-10) are in parentheses after each group heading.
Diseases of the Heart (I00-I09,I11,I13,I20-I51) Ischemic Heart Disease (I20-I25) Cerebrovascular Disease (I60-I69)

Mortality Table C8. Influenza & Pneumonia, Chronic Lower Respiratory Disease, and Chronic Liver Disease & Cirrhosis by County of Residence, 2005
County Number Crude Rate1Age-Adj
Rate2 Number Crude Rate1Age-Adj
Rate2 Number Crude Rate1Age-Adj
Rate2
State Total 926 14.8 14.8 2,692 43.0 45.0 556 8.9 8.6Adams 2 * * 5 29.4 33.5 0 *Asotin 11 52.6 35.4 14 67.0 51.4 5 23.9 19.4Benton 14 8.9 10.1 70 44.3 53.4 10 6.3 6.1Chelan 12 17.3 13.7 30 43.4 36.5 7 10.1 9.6Clallam 12 18.0 10.5 45 67.4 40.0 2 *Clark 37 9.5 11.5 154 39.3 48.2 23 5.9 6.0Columbia 1 * * 4 * * 0 * *Cowlitz 13 13.6 11.4 86 89.7 80.9 9 9.4Douglas 7 20.2 19.6 22 63.4 60.6 7 20.2 18.4Ferry 5 67.5 82.3 7 94.6 109.0 0 * *Franklin 3 * * 9 14.9 21.7 3 *Garfield 1 * * 1 * * 0 * *Grant 11 13.9 14.9 27 34.1 36.5 7 8.9Grays Harbor 16 22.9 18.3 52 74.5 60.5 11 15.8 12.6Island 13 17.1 16.3 29 38.2 34.9 5 6.6 5.4Jefferson 7 25.4 16.6 19 68.8 42.6 4 * *King 238 13.2 13.2 566 31.3 33.9 134 7.4 7.5Kitsap 46 19.1 20.6 116 48.3 52.9 25 10.4 9.5Kittitas 9 24.6 21.6 15 41.0 41.2 5 13.7 15.4Klickitat 1 * * 11 56.4 45.8 4 * *Lewis 16 22.3 15.2 49 68.4 53.3 5 7.0Lincoln 2 * * 17 168.3 112.6 0 * *Mason 9 17.3 14.7 26 50.1 39.0 8 15.4 13.1Okanogan 5 12.6 10.2 23 58.1 51.5 7 17.7 13.9Pacific 6 28.2 17.4 17 79.8 46.6 3 * *Pend Oreille 3 * * 17 139.4 125.3 3 * *Pierce 83 11.0 12.6 358 47.4 55.2 66 8.7 8.9San Juan 2 * * 0 * * 3 * *Skagit 28 25.2 20.1 46 41.5 33.9 15 13.5 11.4Skamania 0 * * 3 * * 0 * *Snohomish 99 15.1 18.3 248 37.8 47.9 58 8.8 9.6Spokane 86 19.7 17.5 275 63.0 59.4 42 9.6 9.4Stevens 7 17.0 15.0 23 55.8 49.4 10 24.3 22.9Thurston 31 13.8 14.1 107 47.7 49.0 30 13.4 12.2Wahkiakum 3 * * 4 * * 0 * *Walla Walla 19 33.0 22.8 24 41.7 30.9 2 *Whatcom 28 15.5 15.4 65 36.0 36.2 16 8.8Whitman 6 14.2 16.2 17 40.1 53.4 2 * *Yakima 34 14.8 14.1 91 39.7 41.5 25 10.9 11.1
Rates based on fewer than 20 deaths are likely to be unstable and imprecise.
1 Rate per 100,000 population.2 Rate per 100,000 age-adjusted to U.S. 2000 population. Does not include deaths where age is unknown.* Rate not calculated because number of deaths was less than 5.Note: Codes for International Classification of Diseases, Tenth Revision (ICD-10) are in parentheses after each group heading.
Pneumonia and Influenza (J10-J18)Chronic Lower Resp. Dis. (J40-J47)
Chronic Liver Disease & Cirrhosis (K70,K73-K74)
*
*
8.3
*
9.2
5.7
*8.5
Washington State Vital Statistics 2005 92
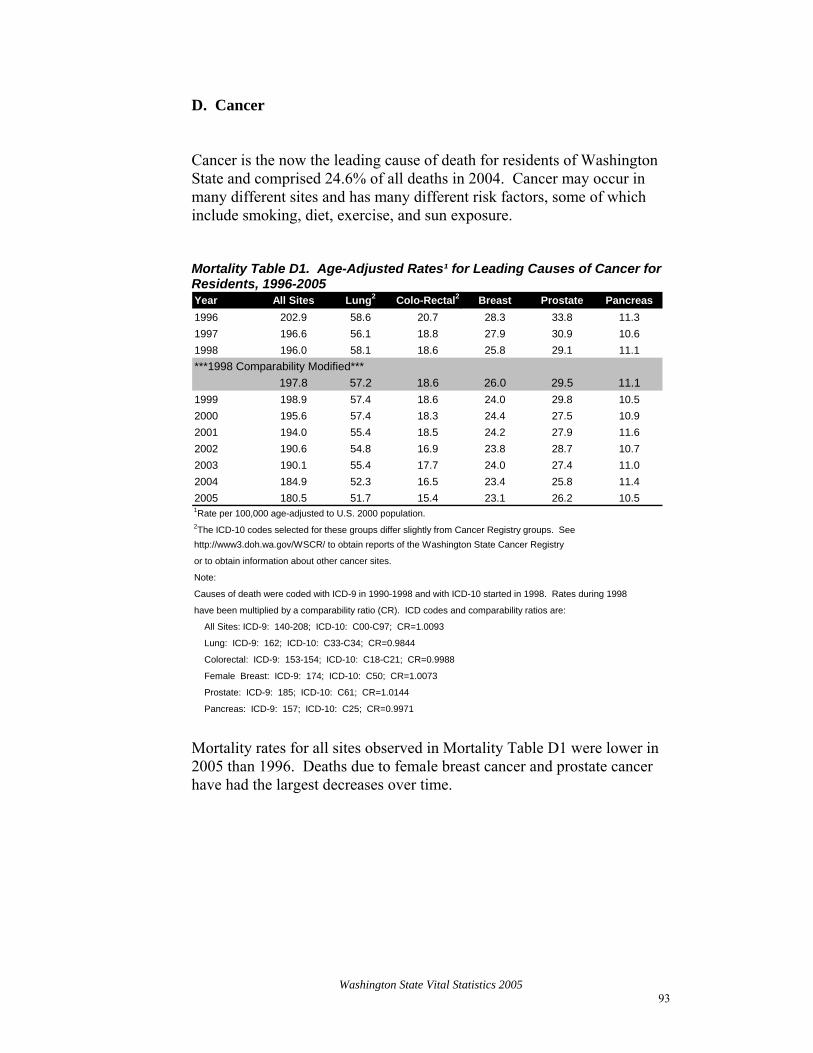
Washington State Vital Statistics 2005 93
D. Cancer Cancer is the now the leading cause of death for residents of Washington State and comprised 24.6% of all deaths in 2004. Cancer may occur in many different sites and has many different risk factors, some of which include smoking, diet, exercise, and sun exposure. Mortality Table D1. Age-Adjusted Rates¹ for Leading Causes of Cancer for Residents, 1996-2005 Year All Sites Lung2 Colo-Rectal2 Breast Prostate Pancreas1996 202.9 58.6 20.7 28.3 33.8 11.31997 196.6 56.1 18.8 27.9 30.9 10.61998 196.0 58.1 18.6 25.8 29.1 11.1***1998 Comparability Modified***
197.8 57.2 18.6 26.0 29.5 11.11999 198.9 57.4 18.6 24.0 29.8 10.52000 195.6 57.4 18.3 24.4 27.5 10.92001 194.0 55.4 18.5 24.2 27.9 11.62002 190.6 54.8 16.9 23.8 28.7 10.72003 190.1 55.4 17.7 24.0 27.4 11.02004 184.9 52.3 16.5 23.4 25.8 11.42005 180.5 51.7 15.4 23.1 26.2 10.5
Prostate: ICD-9: 185; ICD-10: C61; CR=1.0144
Pancreas: ICD-9: 157; ICD-10: C25; CR=0.9971
All Sites: ICD-9: 140-208; ICD-10: C00-C97; CR=1.0093
Lung: ICD-9: 162; ICD-10: C33-C34; CR=0.9844
Colorectal: ICD-9: 153-154; ICD-10: C18-C21; CR=0.9988
Female Breast: ICD-9: 174; ICD-10: C50; CR=1.0073
or to obtain information about other cancer sites.
Note:
Causes of death were coded with ICD-9 in 1990-1998 and with ICD-10 started in 1998. Rates during 1998
have been multiplied by a comparability ratio (CR). ICD codes and comparability ratios are:
1Rate per 100,000 age-adjusted to U.S. 2000 population. 2The ICD-10 codes selected for these groups differ slightly from Cancer Registry groups. See http://www3.doh.wa.gov/WSCR/ to obtain reports of the Washington State Cancer Registry
Mortality rates for all sites observed in Mortality Table D1 were lower in 2005 than 1996. Deaths due to female breast cancer and prostate cancer have had the largest decreases over time.

94
Mortality Figure 9. All cancer deaths
Washington State Vital Statistics 2005
180
185
190
195
200
205
210
1980
1981
1982
1983
1984
1985
1986
1987
1988
1989
1990
1991
1992
1993
1994
1995
1996
1997
1998
1999
2000
2001
2002
2003
2004
age-
adju
sted
rate
215
1980-1998 rates, ICD-9 1999-2004 rates, ICD-10 trend line(s)
0.3% per year increase 1980-1993
1.4% per year decrease1993-1998
1.3% per year decrease1999-2004
2000
2001
High relative risk (rr) regions by year
Regions: Most of southwest Washington has had higher than expected total cancer deaths for each year individually and for all years combined. For 2000-2004 combined, the relative risk (rr) was 1.14, or 14% more cancer deaths than expected; this equals about 290 excess deaths per year. While not seen for individual years, a small region in Spokane has an rr of 1.31 for 2000-2004 combined. This finding is not as robust as that for southwest Washington and likely represents the cumulative effect of elevated but not statistically significant cancer mortalities over time. On average there were about 25 excess cancer deaths per year in this area. rr = 1.14
Trends: Age-adjusted statewide cancer death rates increased by 0.3% per year from 1980 to 1993. Since 1993, they have been declining by 1.4% per year from 1993-1998, and by 1.3% per year from 1998 to 2004.
Cancer deaths: High relative risk (rr) regions 2000-2004 combined
rr = 1.12
rr = 1.312002
rr = 1.15
2004
rr = 1.19
2003
rr = 1.15
rr = 1.14
Cancer death rates: Statewide tends, 1980-2004

Washington State Vital Statistics 2005 95
Mortality Figure 10. Lung cancer deaths
Regions: For each year individually and for all years combined most of southwest Washington has had higher than expected lung cancer deaths. For 2000-2004 combined the relative risk (rr) within this region was 1.25, or 25% more lung cancer deaths than expected. On average this means there were 146 more lung cancer deaths per year than expected. A small region within the Spokane area was also seen to have higher than expected lung cancer deaths for 2000-2004 combined; the rr was 1.40, or 40% more than expected. On average this equals about 9 more lung cancer deaths per year than would be expected. Trends: Statewide age-adjusted lung cancer mortality rates had been increasing by 1.3% per year from 1980 to 1993; however, since 1993 they have been declining, by 1.5% per year from 1993 to 1998, and by 1.6% per year from 1999 to 2004.
High relative risk (rr)
regions by year
2000
2001
rr = 1.27
rr = 1.23
Lung cancer deaths: High relative risk (rr) regions 2000-2004 combined
rr = 1.40
2002
rr = 1.36
2003
rr = 1.32
2004 rr = 2.05
rr = 1.23
rr = 1.25
Lung cancer death rates: Statewide tends, 1980-2004 64
50
52
54
56
58
60
62
1980
1981
1982
1983
1984
1985
1986
1987
1988
1989
1990
1991
1992
1993
1994
1995
1996
1997
1998
1999
2000
2001
2002
2003
2004
age-
adju
sted
rate
1980-1998 rates, ICD-9 1999-2004 rates, ICD-10 trend line(s)
1.3% per year increase1980-1993
1.5% per year decrease1993-1998
1.6% per year decrease1999-2004

Washington State Vital Statistics 2005 96
Mortality Table D2. Cancer by Primary Site by Sex for Residents, 2005
Cause with ICD-10 Codes No.Crude Rate1
Age-Adj. Rate2 No.
Crude Rate1
Age-Adj. Rate2 No.
Crude Rate1
Age-Adj. Rate2
All Sites Combined (C00-C97) 11,008 175.9 180.5 5,614 180.1 213.7 5,394 171.8 157.9Bladder (C67) 284 4.5 4.8 211 6.8 8.5 73 2.3 2.1Brain, Meninges, & CNS (C70-C72)3 345 5.5 5.5 202 6.5 6.9 143 4.6 4.3 Brain (C71) 339 5.4 5.4 200 6.4 6.8 139 4.4 4.1Breast (C50) 799 12.8 12.8 8 0.3 0.3 791 25.2 23.1Cervix (C53) n/a n/a n/a n/a n/a n/a 63 2.0 1.9Colorectal (C18-C21)3 946 15.1 15.4 496 15.9 18.9 450 14.3 12.7 Colorectal (C18-C20,C26.0) 942 15.1 15.3 496 15.9 19.0 446 14.2 12.6Endometrium & Uterus (C54-C55)3 n/a n/a n/a n/a n/a n/a 130 4.1 3.8 Endometrium (C54) n/a n/a n/a n/a n/a n/a 54 1.7 1.6Esophagus (C15) 274 4.4 4.5 218 7.0 8.2 56 1.8 1.7Hodgkin's Disease (C81) 27 0.4 0.4 15 0.5 0.5 12 0.4 0.4Kidney & Renal Pelvis (C64-C65) 261 4.2 4.2 162 5.2 6.0 99 3.2 2.9Larynx (C32) 60 1.0 1.0 45 1.4 1.6 15 0.5 0.5Leukemia (C91-C95)3 421 6.7 7.0 247 7.9 9.6 174 5.5 5.1 Leukemia (C90.1,C91-C95) 422 6.7 7.0 247 7.9 9.6 175 5.6 5.1Liver (C22)3 316 5.1 5.0 196 6.3 6.7 120 3.8 3.5 Liver (C22.0,C22.2-C22.4,C22.7,C22.9) 225 3.6 3.5 149 4.8 5.0 76 2.4 2.2Lung, Bronchus & Trachea (C33-C34)3 3,118 49.8 51.7 1,642 52.7 62.4 1,476 47.0 44.0 Lung & Bronchus (C34) 3,117 49.8 51.7 1,641 52.6 62.4 1,476 47.0 44.0Melanoma of Skin (C43) 170 2.7 2.7 105 3.4 3.9 65 2.1 1.9Multiple Myeloma & Immunoproliferative (C88,C90)3 230 3.7 3.8 137 4.4 5.3 93 3.0 2.7 Multiple Myeloma (C90.0,C90.2) 218 3.5 3.6 129 4.1 5.0 89 2.8 2.6Non-Hodgkin's Lymphoma (C82-C85) 432 6.9 7.1 214 6.9 8.1 218 6.9 6.2Oral Cavity & Pharynx (C00-C14) 191 3.1 3.1 120 3.8 4.2 71 2.3 2.1Ovary (C56) n/a n/a n/a n/a n/a n/a 331 10.5 9.7Pancreas (C25) 640 10.2 10.5 320 10.3 11.7 320 10.2 9.4Prostate (C61) n/a n/a n/a 620 19.9 26.2 n/a n/a n/aStomach (C16) 187 3.0 3.1 103 3.3 3.9 84 2.7 2.4Testis (C62) n/a n/a n/a 4 * * n/a n/a n/aThyroid & Endocrine Glands (C73-C75)3 42 0.7 0.7 13 0.4 0.5 29 0.9 0.9 Thyroid (C73) 31 0.5 0.5 8 0.3 0.3 23 0.7 0.7Site Unspecified (C80) 450 7.2 7.4 188 6.0 7.0 262 8.3 7.5All Other Sites 4 652 10.4 10.7 342 11.0 13.0 310 9.9 9.1
4 ICD-10 Codes:C17,C23-C24,C26.1-C31,C37-C42,C44-C49,C51-C52,C57-C60,C63,C66,C68-C69,C76-C79,C88,C96-C97.Note: Rates based on fewer than 20 deaths are likely to be unstable and imprecise.
1 Rate per 100,000 population.2 Rate per 100,000 age-adjusted to U.S. 2000 population. Does not include deaths where age is unknown.3 The ICD-10 codes selected for these groups differ slightly from Cancer Registry groups. See http://www3.doh.wa.gov/WSCR/to obtain reports of the Washington State Cancer Registry or to obtain information about other cancer sites.
Total Male Female
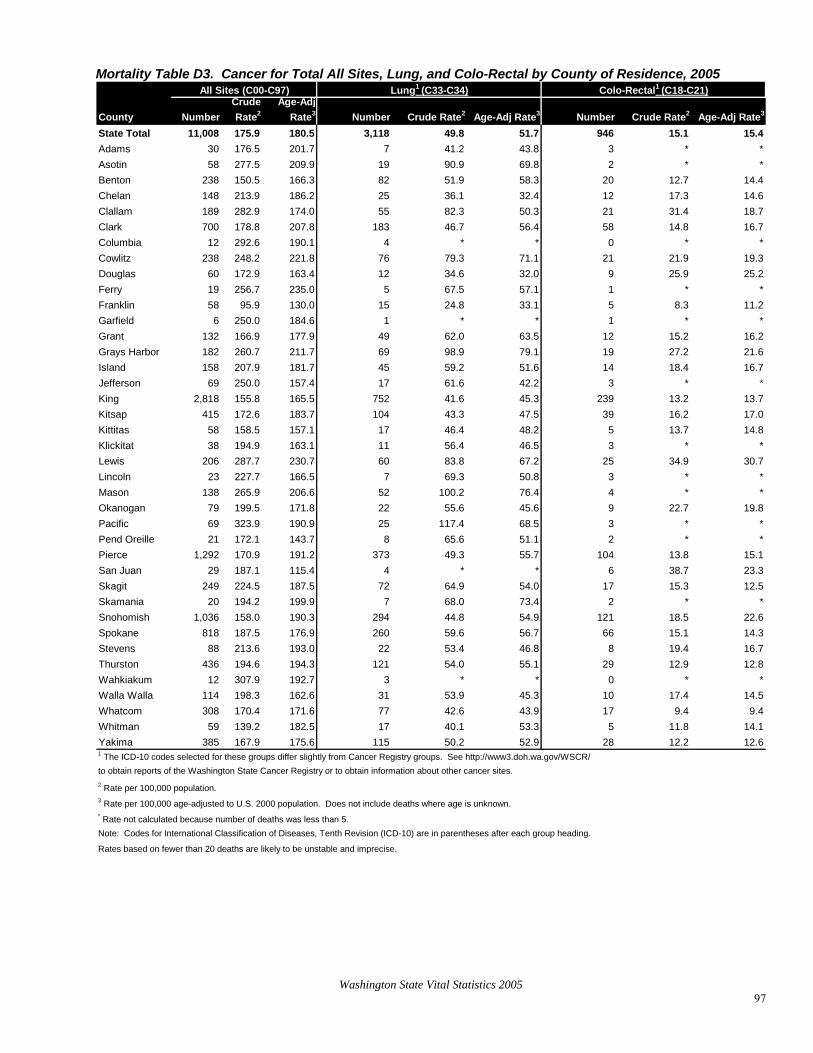
Washington State Vital Statistics 2005 97
3. Cancer for TMortality Table D otal All Sites, Lung, and Colo-Rectal by County of Residence, 2005
County NumberCrude Rate2
Age-Adj Rate3 Number Crude Rate2 Age-Adj Rate3 Number Crude Rate2 Age-Adj Rate3
State Total 11,008 175.9 180.5 3,118 49.8 51.7 946 15.1 15.4Adams 30 176.5 201.7 7 41.2 43.8 3 * *Asotin 58 277.5 209.9 19 90.9 69.8 2 * *Benton 238 150.5 166.3 82 51.9 58.3 20 12.7 14.4Chelan 148 213.9 186.2 25 36.1 32.4 12 17.3 14.6Clallam 189 282.9 174.0 55 82.3 50.3 21 31.4 18.7Clark 700 178.8 207.8 183 46.7 56.4 58 14.8 16.7Columbia 12 292.6 190.1 4 * * 0 * *Cowlitz 238 248.2 221.8 76 79.3 71.1 21 21.9 19.3Douglas 60 172.9 163.4 12 34.6 32.0 9 25.9 25.2Ferry 19 256.7 235.0 5 67.5 57.1 1 * *Franklin 58 95.9 130.0 15 24.8 33.1 5 8.3 11.2Garfield 6 250.0 184.6 1 * * 1 * *Grant 132 166.9 177.9 49 62.0 63.5 12 15.2 16.2Grays Harbor 182 260.7 211.7 69 98.9 79.1 19 27.2 21.6Island 158 207.9 181.7 45 59.2 51.6 14 18.4 16.7Jefferson 69 250.0 157.4 17 61.6 42.2 3 * *King 2,818 155.8 165.5 752 41.6 45.3 239 13.2 13.7Kitsap 415 172.6 183.7 104 43.3 47.5 39 16.2 17.0Kittitas 58 158.5 157.1 17 46.4 48.2 5 13.7 14.8Klickitat 38 194.9 163.1 11 56.4 46.5 3 * *Lewis 206 287.7 230.7 60 83.8 67.2 25 34.9 30.7Lincoln 23 227.7 166.5 7 69.3 50.8 3 * *Mason 138 265.9 206.6 52 100.2 76.4 4 * *Okanogan 79 199.5 171.8 22 55.6 45.6 9 22.7 19.8Pacific 69 323.9 190.9 25 117.4 68.5 3 * *Pend Oreille 21 172.1 143.7 8 65.6 51.1 2 * *Pierce 1,292 170.9 191.2 373 49.3 55.7 104 13.8 15.1San Juan 29 187.1 115.4 4 * * 6 38.7 23.3Skagit 249 224.5 187.5 72 64.9 54.0 17 15.3 12.5Skamania 20 194.2 199.9 7 68.0 73.4 2 * *Snohomish 1,036 158.0 190.3 294 44.8 54.9 121 18.5 22.6Spokane 818 187.5 176.9 260 59.6 56.7 66 15.1 14.3Stevens 88 213.6 193.0 22 53.4 46.8 8 19.4 16.7Thurston 436 194.6 194.3 121 54.0 55.1 29 12.9 12.8Wahkiakum 12 307.9 192.7 3 * * 0 * *Walla Walla 114 198.3 162.6 31 53.9 45.3 10 17.4 14.5Whatcom 308 170.4 171.6 77 42.6 43.9 17 9.4 9.4Whitman 59 139.2 182.5 17 40.1 53.3 5 11.8 14.1Yakima 385 167.9 175.6 115 50.2 52.9 28 12.2 12.6
* Rate not calculated because number of deaths was less than 5.Note: Codes for International Classification of Diseases, Tenth Revision (ICD-10) are in parentheses after each group heading.
Rates based on fewer than 20 deaths are likely to be unstable and imprecise.
1 The ICD-10 codes selected for these groups differ slightly from Cancer Registry groups. See http://www3.doh.wa.gov/WSCR/to obtain reports of the Washington State Cancer Registry or to obtain information about other cancer sites.2 Rate per 100,000 population.3 Rate per 100,000 age-adjusted to U.S. 2000 population. Does not include deaths where age is unknown.
g pAll Sites (C00-C97) Lung1 (C33-C34) Colo-Rectal1 (C18-C21)

Mortality Table D4. Cancer for Female Breast, Prostate, and Pancreas by County of Residence, 2005
County NumberCrude Rate2
Age-Adj Rate3 Number Crude Rate2 Age-Adj Rate3 Number Crude Rate2 Age-Adj Rate3
State Total 791 25.2 23.1 620 19.9 26.2 640 10.2 10.5Adams 2 * * 1 * * 2 * *Asotin 2 * * 4 * * 4 * *Benton 21 26.4 24.8 12 15.3 23.3 15 9.5 10.6Chelan 8 23.0 20.3 14 40.6 40.6 9 13.0 11.2Clallam 8 23.7 13.9 16 48.4 32.8 9 13.5 8.0Clark 45 22.8 23.7 45 23.1 34.7 46 11.7 14.3Columbia 1 * * 0 * * 0 * *Cowlitz 15 31.0 23.7 10 21.0 23.8 9 9.4 8.1Douglas 4 * * 3 * * 5 14.4 14.0Ferry 3 * * 1 * * 1 * *Franklin 5 17.3 21.0 3 * * 2 * *Garfield 1 * * 0 * * 0 * *Grant 5 12.9 12.9 8 19.8 24.8 5 6.3 6.7Grays Harbor 6 17.1 11.5 8 23.0 21.5 5 7.2 5.3Island 13 34.3 27.7 6 15.8 17.5 5 6.6 6.2Jefferson 5 36.0 21.6 4 * * 5 18.1 10.3King 230 25.3 23.7 179 19.9 27.9 181 10.0 10.4Kitsap 31 26.2 24.1 27 22.1 33.6 20 8.3 8.6Kittitas 8 43.5 41.2 2 * * 4 * *Klickitat 3 * * 1 * * 3 * *Lewis 17 47.1 37.9 10 28.1 27.4 12 16.8 14.0Lincoln 0 * * 1 * * 2 * *Mason 6 23.9 17.5 11 41.0 34.1 4 * *Okanogan 8 40.4 37.7 2 * * 2 * *Pacific 11 102.5 60.7 1 * * 6 28.2 15.9Pend Oreille 0 * * 2 * * 1 * *Pierce 98 25.8 25.7 58 15.4 22.4 67 8.9 10.0San Juan 1 * * 2 * * 4 * *Skagit 15 26.8 20.8 14 25.5 24.1 16 14.4 12.3Skamania 1 * * 2 * * 2 * *Snohomish 48 14.7 15.6 46 14.0 21.6 57 8.7 10.7Spokane 72 32.4 25.9 43 20.1 24.1 47 10.8 10.6Stevens 3 * * 3 * * 8 19.4 15.9Thurston 35 30.6 27.1 21 19.1 25.1 28 12.5 12.9Wahkiakum 0 * * 2 * * 1 * *Walla Walla 5 17.7 13.4 12 41.0 38.2 2 * *Whatcom 23 25.1 23.3 21 23.5 29.1 23 12.7 12.5Whitman 4 * * 2 * * 1 * *Yakima 28 24.4 21.9 23 20.1 26.0 27 11.8 11.9
Rates based on fewer than 20 deaths are likely to be unstable and imprecise.
1 Rate per 100,000 population.2 Rate per 100,000 age-adjusted to U.S. 2000 population. Does not include deaths where age is unknown.* Rate not calculated because number of deaths was less than 5.Note: Codes for International Classification of Diseases, Tenth Revision (ICD-10) are in parentheses after each group heading.
Female Breast (C50) Prostate (C61) Pancreas (C25)
Washington State Vital Statistics 2005 98

E. External Causes or Injuries A single event that causes a large number of deaths, such as the Alaska Airlines plane crash in 2000 or the 1980 eruption of Mt. Saint Helens may generate large annual variations in mortality due to unintentional injury. Injuries do not “just happen” because of bad luck - many can be prevented. Information about the distribution of deaths due to injuries can be used to plan prevention strategies. External causes of death can be categorized by the intent (e.g., unintentional, suicide, homicide, undetermined) and by the mechanism (e.g., drowning, poisoning, cut/pierce, etc.). The Injury and Violence Prevention Program (http://www.doh.wa.gov/hsqa/emstrauma/injury.htm ) develops and maintains programs designed to reduce injuries in Washington State. There are three programmatic areas of focus: Unintentional Injury, Intentional Injury, and Data Analysis. The focus areas in unintentional injury are injuries among children; fire injury prevention; motor vehicle-related injuries, with a specific focus on DUI; drowning; and falls among older adults. Intentional injury prevention focuses on youth suicide prevention, sexual assault and family violence prevention, and promoting the safe storage of firearms. The data analysis section provides injury data and prepares reports on leading injury issues. Injury death and hospitalization data are provided by age group, county, year (for the past 10 years), and emergency medical service region for all mechanisms and intent of injury.
Washington State Vital Statistics 2005 99

Washington State Vital Statistics 2005 100
Mortality Table E1. Age-Adjusted Rates¹ for External Causes for Residents, 1996-2005
Year
Uninten-tional Injury (Accident)
Intentional Self-Harm (Suicide)
Assault (Homicide)
Undeter-mined
Drug-Induced2
Alcohol-Induced2
Motor Vehicle Traffic
Accidents FallsDrowning, Accidental
1996 34.8 14.2 4.5 1.9 8.8 11.0 13.7 7.2 1.81997 34.0 13.0 4.6 1.7 7.8 10.8 13.0 5.9 2.11998 34.7 12.3 4.0 1.7 8.4 9.2 12.8 6.4 1.9
*** 1998 35.6 12.3 4.0 1.6 8.8 8.5 12.2 5.0 1.91999 33.5 14.2 3.2 1.7 10.0 9.9 12.2 6.2 2.02000 35.5 12.4 3.4 2.2 9.9 9.0 11.8 8.4 1.62001 35.1 11.9 3.2 1.8 9.0 10.3 12.0 8.4 1.82002 36.5 13.4 3.5 1.7 11.1 9.6 12.0 8.4 2.02003 36.4 13.0 3.4 1.7 11.7 10.0 11.1 8.9 1.72004 37.6 13.2 3.5 1.8 13.8 9.7 10.4 9.0 1.62005 39.8 12.7 3.7 1.3 14.2 9.5 11.4 9.1 1.7
1Rate per 100,000 age-adjusted to U.S. 2000 population. 2These categories include some causes that are classified as "natural" deaths (e.g., alcoholic cirrhosis of the liver).na: Comparability ratio not available.
Note:
Causes of death were coded with ICD-9 in 1990-1998 and with ICD-10 started in 1998. Rates during 1998
have been multiplied by a comparability ratio (CR). ICD codes and comparability ratios are:
Unintentional Injury (Accident): ICD-9: E800-E869,E880-E929; ICD-10: V01-X59,Y85-Y86; CR=1.0251
Alcohol-Induced: ICD-9: 291,303,305.0,357.5,425.5,535.3,571.0-571.3,790.3,E860; ICD-10: F10,G31.2,G62.1,
Intentional Self-Harm (Suicide): ICD-9: E950-E959; ICD-10: X60-X84,Y87.0; CR=1.0022
Assault (Homicide): ICD-9: E960-E969; ICD-10: X85-Y09,Y87.1; CR=1.0020
Undetermined: ICD-9: E980-E989; ICD-10: Y10-Y34,Y87.2,Y89.9; CR = .9867
Drug-Induced: ICD-9: 292,304,305.2-305.9,E850-E858,E950.0-E950.5,E962.0,E980.0-E980; ICD-10: F11.0-11.5,
Drowning, Accidental: ICD-9 E830,E832,E910; ICD-10 V90,V92,W65-W74; CR = 1.0297
*** 1998 Comparability Modified ***
I42.6,K29.2,K70,R78.0,X45,X65,Y15; CR=0.9222
Motor Vehicle Traffic Accidents: ICD-9: E810-E819; ICD-10: V02-V04(.1,.9),V09.2,V12-V14(.3-.9), V19(.4-.6),
V20-V28(.3-.9),V29-V79(.4-.9),V80(.3-.5),V81.1,V82.1,V83-V86(.0-.3),V87(.0-.8),V89.2; CR = .9527
Falls: ICD-9 E880-E886,E888; ICD-10 W00-W19; CR = .7720
F11.7-F11.9,F12.0-F12.5,F12.7-F12.9,F13.0-F13.5,F13.7-F13.9,F14.0-F14.5,F14.7-F14.9,F15.0-F15.5,F15.7-F15.9,
F16.0-F16.5,F16.7-F16.9,F17.0,F17.3-F17.5,F17.7-F17.9,F18.0-F18.5,F18.7-F18.9,F19.0-F19.5,F19.7-F19.9,
X40-X44,X60-X64,X85,Y10-Y14; CR=1.0434
Mortality from drug-induced causes has increased during the past decade while assaults and motor vehicle traffic accidents have declined overall during this time period.

Washington State Vital Statistics 2005 101
Mortality Table E2-a. External Causes of Injury With Crude Rates for Residents, 2005
Cause No. Rate2 No. Rate2 No. Rate2 No. Rate2 No. Rate2 No. Rate2
All Injuries3 (3,662) (58.5) (2,520) (40.3) (814) (13.0) (232) (3.7) (83) (1.3) (13) (0.2)Cut/Pierce 60 1.0 2 * 20 0.3 37 0.6 1 * 0 *Drowning (123) (2.0) (104) (1.7) (11) (0.2) (0) (*) (8) (0.1) -- -- Boating-Related 16 0.3 16 0.3 -- -- -- -- -- -- -- - Other 107 1.7 88 1.4 11 0.2 0 * 8 0.1 -- --Fall/Jump/Push 594 9.5 566 9.0 27 0.4 0 * 1 * -- --Fire/Hot Object or Substance (57) (0.9) (52) (0.8) (4) (*) (0) (*) (1) (*) (0) (*) Fire/Flame 57 0.9 52 0.8 4 * 0 * 1 * -- Hot Object/Substance 0 * 0 * 0 * 0 * 0 * -- --Firearm 563 9.0 8 0.1 396 6.3 141 2.3 6 0.1 12 0.2Machinery 17 0.3 17 0.3 -- -- -- -- -- -- -- -All Transport (816) (13.0) (809) (12.9) (5) (0.1) (1) (*) (1) (*) (0) (*) Motor Vehicle Traffic (721) (11.5) (721) (11.5) -- -- -- -- -- -- -- -- Occupant 500 8.0 500 8.0 -- -- -- -- -- -- -- -- Motorcyclist 84 1.3 84 1.3 -- -- -- -- -- -- -- -- Pedal Cyclist 15 0.2 15 0.2 -- -- -- -- -- -- -- -- Pedestrian 76 1.2 76 1.2 -- -- -- -- -- -- -- -- Other 0 * 0 * -- -- -- -- -- -- -- -- Unspecified 46 0.7 46 0.7 -- -- -- -- -- -- -- - Pedal Cyclist, Other 5 0.1 5 0.1 -- -- -- -- -- -- -- -- Pedestrian, Other 25 0.4 25 0.4 -- -- -- -- -- -- -- -- Other Land Transport 34 0.5 27 0.4 5 0.1 1 * 1 * -- -- Watercraft/Air/Space 31 0.5 31 0.5 -- -- -- -- -- -- 0Natural/Environmental (36) (0.6) (36) (0.6) -- -- -- -- -- -- -- -- Bites/Stings 6 0.1 6 0.1 -- -- -- -- -- -- -- -- Other 30 0.5 30 0.5 -- -- -- -- -- -- -- --Overexertion 0 * 0 * -- -- -- -- -- -- -- --Poisoning 923 14.8 679 10.9 194 3.1 1 * 49 0.8 0 *Struck By or Against 32 0.5 28 0.4 0 * 4 * 0 * 0 *Suffocation 267 4.3 111 1.8 144 2.3 8 0.1 4 * -- --Other Specified, Classifiable (45) (0.7) (34) (0.5) (8) (0.1) (1) (*) (1) (*) (1) (*) Sequelae (Late Effects) 25 0.4 25 0.4 -- -- -- -- -- -- -- -- Other 19 0.3 9 0.1 8 0.1 1 * 1 * 0 *Other Specified, NEC
-
--
-
-
*
4 (43) (0.7) (30) (0.5) (3) (*) (7) (0.1) (3) (*) (0) (*) Sequelae (Late Effects) 38 0.6 30 0.5 2 * 5 0.1 1 * -- -- Other 5 0.1 0 * 1 * 2 * 2 * 0 *Unspecified 86 1.4 44 0.7 2 * 32 0.5 8 0.1 0 *Adverse Effects3 (21) (0.3) -- -- -- -- -- -- -- -- -- - Drugs 4 * -- -- -- -- -- -- -- -- -- -- Medical Care 17 0.3 -- -- -- -- -- -- -- -- -- -1 The war-related categories include deaths due to late effects of injuries from war. Deaths occurring overseas during military activities are registered with the U.S. Department of State and are not reported to the Center for Health Statistics.2 Rate per 100,000 population.
Legal
-
-
Intervention & War1Total
Unintentional or Accident Suicide Homicide Undeter- mined
3 Group totals are shown in parentheses. Adverse Effects are not included in the total of All Injuries.4 NEC: Not elsewhere classified.* Rate not calculated because number of deaths was less than 5.-- No ICD-10 codes available for this category.
More injury tables can be obtained from Injury Prevention Program, Washington State Department of Health web site:
Refer to the previous page under External Causes or Injuries for the website address.
Note: Rates based on fewer than 20 deaths are likely to be unstable and imprecise.
With the exception of drowning, bites/stings, all transport, and sequelae, cause-of-death categories for this table
follow the guidelines of National Center for Health Statistics (NCHS) International Collaborative Effort (ICE) on Injury
Statistics. These groupings differ from previously published Vital Statistics reports and from other NCHS groupings.
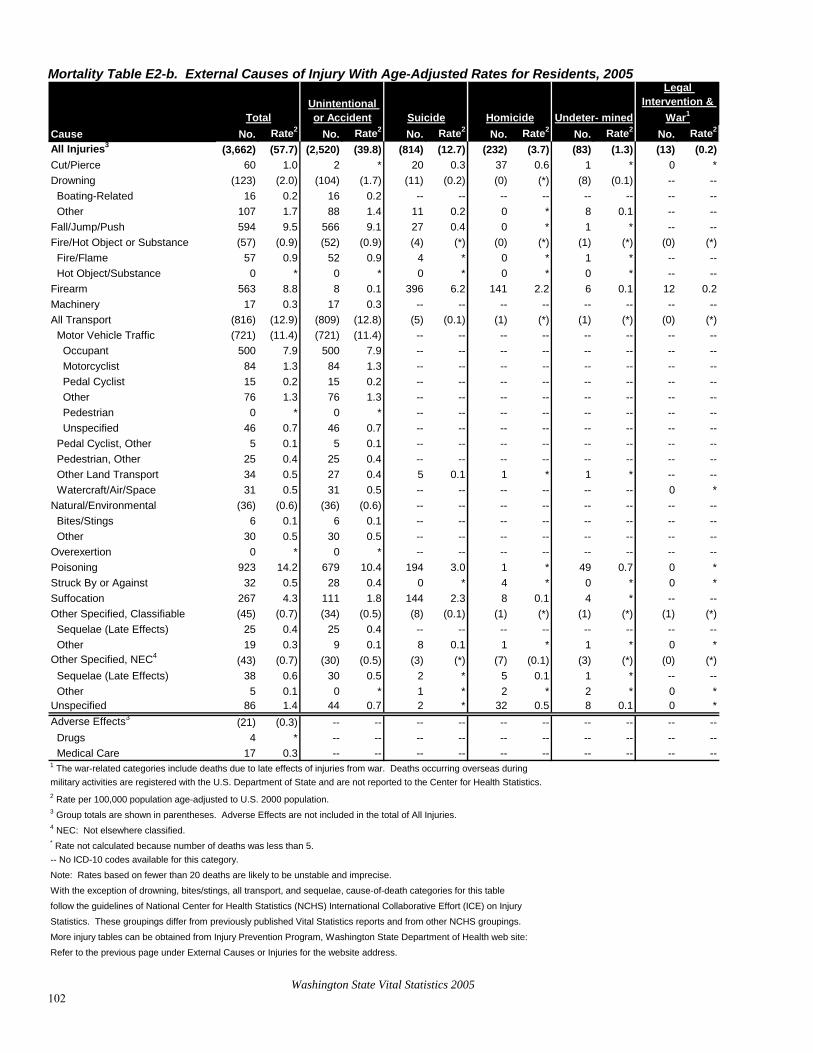
Washington State Vital Statistics 2005 102
Mortality Table E2-b. External Causes of Injury With Age-Adjusted Rates for Residents, 2005
Cause No. Rate2 No. Rate2 No. Rate2 No. Rate2 No. Rate2 No. Rate2
All Injuries3 (3,662) (57.7) (2,520) (39.8) (814) (12.7) (232) (3.7) (83) (1.3) (13) (0.2)Cut/Pierce 60 1.0 2 * 20 0.3 37 0.6 1 * 0 *Drowning (123) (2.0) (104) (1.7) (11) (0.2) (0) (*) (8) (0.1) -- -- Boating-Related 16 0.2 16 0.2 -- -- -- -- -- -- -- -- Other 107 1.7 88 1.4 11 0.2 0 * 8 0.1 -- --Fall/Jump/Push 594 9.5 566 9.1 27 0.4 0 * 1 * -- --Fire/Hot Object or Substance (57) (0.9) (52) (0.9) (4) (*) (0) (*) (1) (*) (0) (*) Fire/Flame 57 0.9 52 0.9 4 * 0 * 1 * -- -- Hot Object/Substance 0 * 0 * 0 * 0 * 0 * -- --Firearm 563 8.8 8 0.1 396 6.2 141 2.2 6 0.1 12 0.2Machinery 17 0.3 17 0.3 -- -- -- -- -- -- -- -All Transport (816) (12.9) (809) (12.8) (5) (0.1) (1) (*) (1) (*) (0) (*) Motor Vehicle Traffic (721) (11.4) (721) (11.4) -- -- -- -- -- -- -- -- Occupant 500 7.9 500 7.9 -- -- -- -- -- -- -- -- Motorcyclist 84 1.3 84 1.3 -- -- -- -- -- -- -- -- Pedal Cyclist 15 0.2 15 0.2 -- -- -- -- -- -- -- - Other 76 1.3 76 1.3 -- -- -- -- -- -- -- - Pedestrian 0 * 0 * -- -- -- -- -- -- -- -- Unspecified 46 0.7 46 0.7 -- -- -- -- -- -- -- - Pedal Cyclist, Other 5 0.1 5 0.1 -- -- -- -- -- -- -- -- Pedestrian, Other 25 0.4 25 0.4 -- -- -- -- -- -- -- -- Other Land Transport 34 0.5 27 0.4 5 0.1 1 * 1 * -- -- Watercraft/Air/Space 31 0.5 31 0.5 -- -- -- -- -- -- 0 *Natural/Environmental (36) (0.6) (36) (0.6) -- -- -- -- -- -- -- -- Bites/Stings 6 0.1 6 0.1 -- -- -- -- -- -- -- -- Other 30 0.5 30 0.5 -- -- -- -- -- -- -- --Overexertion 0 * 0 * -- -- -- -- -- -- -- --Poisoning 923 14.2 679 10.4 194 3.0 1 * 49 0.7 0 *Struck By or Against 32 0.5 28 0.4 0 * 4 * 0 * 0 *Suffocation 267 4.3 111 1.8 144 2.3 8 0.1 4 * -- --Other Specified, Classifiable (45) (0.7) (34) (0.5) (8) (0.1) (1) (*) (1) (*) (1) (*) Sequelae (Late Effects) 25 0.4 25 0.4 -- -- -- -- -- -- -- -- Other 19 0.3 9 0.1 8 0.1 1 * 1 * 0 *Other Specified, NEC
-
--
-
4 (43) (0.7) (30) (0.5) (3) (*) (7) (0.1) (3) (*) (0) (*) Sequelae (Late Effects) 38 0.6 30 0.5 2 * 5 0.1 1 * -- -- Other 5 0.1 0 * 1 * 2 * 2 * 0 *Unspecified 86 1.4 44 0.7 2 * 32 0.5 8 0.1 0 *Adverse Effects3 (21) (0.3) -- -- -- -- -- -- -- -- -- Drugs 4 * -- -- -- -- -- -- -- -- -- -- Medical Care 17 0.3 -- -- -- -- -- -- -- -- -- -1 The war-related categories include deaths due to late effects of injuries from war. Deaths occurring overseas during military activities are registered with the U.S. Department of State and are not reported to the Center for Health Statistics.2 Rate per 100,000 population age-adjusted to U.S. 2000 population.
Undeter- mined
--
-
Legal Intervention &
War1TotalUnintentional or Accident Suicide Homicide
3 Group totals are shown in parentheses. Adverse Effects are not included in the total of All Injuries.4 NEC: Not elsewhere classified.* Rate not calculated because number of deaths was less than 5.-- No ICD-10 codes available for this category.
More injury tables can be obtained from Injury Prevention Program, Washington State Department of Health web site:
Refer to the previous page under External Causes or Injuries for the website address.
Note: Rates based on fewer than 20 deaths are likely to be unstable and imprecise.
With the exception of drowning, bites/stings, all transport, and sequelae, cause-of-death categories for this table
follow the guidelines of National Center for Health Statistics (NCHS) International Collaborative Effort (ICE) on Injury
Statistics. These groupings differ from previously published Vital Statistics reports and from other NCHS groupings.

Washington State Vital Statistics 2005 103
Mortality Table E2-c. ICD-10 Codes for External Causes
Cause Unintentional or Accident Suicide HomicideUndeter- mined
Legal Intervention & War
All Injuries V01-X59,Y85-Y86 X60-X84,Y87.0X85-Y09, Y87.1
Y10-Y34, Y87.2,Y89.9
Y35-Y36, Y89(.0,.1)
Cut/Pierce W25-W29,W45 X78 X99 Y28 Y35.4Drowning W65-W74,V90,V92 X71 X92 Y21 Boating-Related V90,V92 Other W65-W74 X71 X92 Y21Fall/Jump/Push W00-W19 X80 Y01 Y30Fire/Hot Object or Substance X00-X19 X76-X77 X97-X98 Y26-Y27 Y36.3 Fire/Flame X00-X09 X76 X97 Y26 Hot Object/Substance X10-X19 X77 X98 Y27Firearm W32-W34 X72-X74 X93-X95 Y22-Y24 Y35.0Machinery W24,W30-W31All Transport V01-V89,V91,V93-V99 X82 Y03 Y32 Y36.1 Motor Vehicle Traffic Codes from 5 groups below
V30-V39(.4-.9),V40-V49(.4-.9),V50-V59(.4-.9),V60-V69(.4-.9),V70-V79(.4-.9),
Occupant V81.1,V82.1, V83-V86(.0-.3) Motorcyclist V20-V28(.3-.9), V29(.4-.9) Pedal Cyclist V12-V14(.3-.9), V19(.4-.6) Pedestrian V02-V04(.1,.9), V09.2 Other V80(.3-.5) Unspecified V87(.0-.8), V89.2
V10-V11,V12-V14(.0-.2), Pedal Cyclist, Other V15-V18,V19(.0-.3,.8,.9)
V01,V02-V04(.0),V05,V06, Pedestrian, Other V09(.0,.1,.3,.9)
V20-V28 (.0-.2), V29(.0-.3),V30-V39(.0-.3), V40-V49(.0-.3),V50-V59(.0-.3), V60-V69(.0-.3),V70-V79(.0-.3), V80(.0-.2,.6-.9),V81-V82(.0,.2-.9),V83-V86(.4-.9)V83-V86(.4-.9),V87.9,V88(.0-.9),
Other Land Transport V89(.0,.1,.3,.9) X82 Y03 Y32 Y36.1 Water/Air/Space V91,V93-V99
W42,W43,W53-W64,Natural/Environmental W92-W99,X20-X39,X51-X57 Bites/Stings W53-W59, X20-X29 Other Residual, Natural/EnvironmentalOverexertion X50Poisoning X40-X49 X60-X69 X85-X90 Y10-Y19 Y35.2Struck By or Against W20-W22,W50-W52 X79 Y00,Y04 Y29 Y35.3Suffocation W75-W84 X70 X91 Y20
W23,W35-W41,W44, X96,Y02, Y35(.1,.5), Other Specified, Classifiable W49,W85-W91,Y85 X75,X81 Y05-Y07 Y25,Y31 Y36(.0,.2,.4-.8) Sequelae (Late Effects) Y85
X86,Y02 Y35(.1,.5), Other W49,W85-W91 X75,X81 Y05-Y07 Y25,Y31 Y36(.0,.2,.4-.8)
Other Specified, NEC X58,Y86 X83,Y87.0 Y08,Y87.1 Y33,Y87.2Y35.6, Y89(.0,.1)
Sequelae (Late Effects) Y86 Y87.0 Y87.1 Y87.2 Other X58 X83 Y08 Y33 Y35.6,Y89(.0,.1)Unspecified X59 X84 Y09 Y34,Y89.9 Y35.7,Y36.9
Adverse Effects: Y40-Y59,Y60-Y84,Y88 Drugs: Y40-Y59,Y88.0 Medical Care: Y60-Y84,Y88(.1-.3)

Washington State Vital Statistics 2005 104
Mortality Table E3. External Causes by Place of Injury for Residents, 2005
Place of Injury1 Total
Unintentional Injury
(Accident), Non-Transport
Uninten-tional Injury (Accident), Transport
Intentional Self-Harm (Suicide)
Assault (Homicide) Undetermined Other
State Total 3,683 1,670 850 814 232 83 34Home 1,762 982 9 584 126 50 11Nursing Home 167 159 0 5 2 1 0Agriculture 9 7 1 0 1 0Industry 104 65 3 25 9 2 0Prison 11 0 0 11 0 0 0Public 1,329 256 807 165 77 19 5Unknown 301 201 30 24 17 11 181 National Safety Council place of injury category definitions.Note:
Source for groups is the International Classification of Diseases, Tenth Revision (ICD-10): Unintentional Injury (Accident),
Non-Transport (ICD-10: W00-X59,Y86); Unintentional Injury (Accident), Transport (ICD-10: V01-V99,Y85); Intentional
Self-Harm (Suicide) (ICD-10: X60-X84,Y87.0); Assault (Homicide) (ICD-10: X85-Y09,Y87.1); Undetermined (ICD-10:
Y10-Y34,Y87.2,Y89.9); Other (ICD-10: Y35,Y36,Y40-Y84,Y88, Y89.0,Y89.1)..
0
Mortality Table E4. Type of Firearm by Intent for Residents, 2005
Intent No.Crude Rate1
Age-Adj Rate2 No.
Crude Rate1
Age-Adj Rate2 No.
Crude Rate1
Age-Adj Rate2 No.
Crude Rate1
Age-Adj Rate2
Total 563 9.0 8.8 293 4.7 4.6 133 2.1 2.1 137 2.2 2.2Unintentional Injury (Accident) 8 0.1 0.1 4 * * 3 * * 1 * *Self-Harm (Suicide) 396 6.3 6.2 245 3.9 3.8 111 1.8 1.7 40 0.6 0.6Assault (Homicide) 141 2.3 2.2 42 0.7 0.7 17 0.3 0.3 82 1.3 1.3Undetermined 6 0.1 0.1 2 * * 2 * * 2 * *Legal Intervention 12 0.2 0.2 0 * * 0 * * 12 0.2 0.21 Rate per 100,000 population.2 Rate per 100,000 age-adjusted to U.S. 2000 population. Does not include deaths where age is unknown.* Rate not calculated because number of deaths was less than 5.
Total Handgun Rifle or Shotgun Other & Unspecified
Rates based on fewer than 20 deaths are likely to be unstable and imprecise.
Note:
Source for groups is the International Classification of Diseases, Tenth Revision (ICD-10): Unintentional Injury (Accident),
(Accident) (ICD-10: W32-W34); Self-Harm (Suicide) (ICD-10: X72-X74); Assault (Homicide) (ICD-10: X93-X95);
Undetermined (ICD-10: Y22-Y24); Legal Intervention (ICD-10: Y35.0).
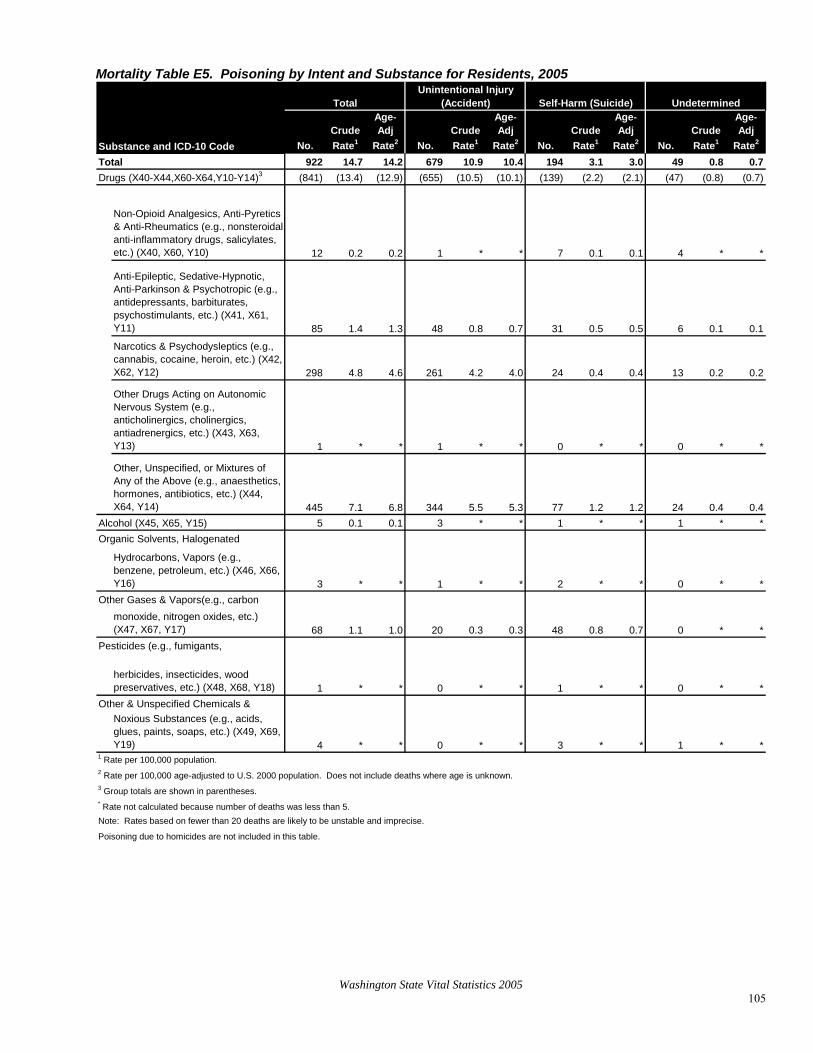
Washington State Vital Statistics 2005 105
Mortality Table E5. Poisoning by Intent and Substance for Residents, 2005
Substance and ICD-10 Code No.Crude Rate1
Age-Adj
Rate2 No.Crude Rate1
Age-Adj
Rate2 No.Crude Rate1
Age-Adj
Rate2 No.Crude Rate1
Age-Adj
Rate2
922 14.7 14.2 679 10.9 10.4 194 3.1 3.0 49 0.8 0.7(841) (13.4) (12.9) (655) (10.5) (10.1) (139) (2.2) (2.1) (47) (0.8) (0.7)
Non-Opioid Analgesics, Anti-Pyretics & Anti-Rheumatics (e.g., nonsteroidal anti-inflammatory drugs, salicylates, etc.) (X40, X60, Y10) 12 0.2 0.2 1 * * 7 0.1 0.1 4 * *
Anti-Epileptic, Sedative-Hypnotic, Anti-Parkinson & Psychotropic (e.g., antidepressants, barbiturates, psychostimulants, etc.) (X41, X61, Y11) 85 1.4 1.3 48 0.8 0.7 31 0.5 0.5 6 0.1 0.1
Narcotics & Psychodysleptics (e.g., cannabis, cocaine, heroin, etc.) (X42, X62, Y12) 298 4.8 4.6 261 4.2 4.0 24 0.4 0.4 13 0.2 0.2
Other Drugs Acting on Autonomic Nervous System (e.g., anticholinergics, cholinergics, antiadrenergics, etc.) (X43, X63, Y13) 1 * * 1 * * 0 * * 0 * *
Other, Unspecified, or Mixtures of Any of the Above (e.g., anaesthetics, hormones, antibiotics, etc.) (X44, X64, Y14) 445 7.1 6.8 344 5.5 5.3 77 1.2 1.2 24 0.4 0.4
5 0.1 0.1 3 * * 1 * * 1 * *
Hydrocarbons, Vapors (e.g., benzene, petroleum, etc.) (X46, X66, Y16) 3 * * 1 * * 2 * * 0 * *
monoxide, nitrogen oxides, etc.) (X47, X67, Y17) 68 1.1 1.0 20 0.3 0.3 48 0.8 0.7 0 * *
herbicides, insecticides, wood preservatives, etc.) (X48, X68, Y18) 1 * * 0 * * 1 * * 0 * *
Noxious Substances (e.g., acids, glues, paints, soaps, etc.) (X49, X69, Y19) 4 * * 0 * * 3 * * 1 * *
Total
Pesticides (e.g., fumigants,
Other & Unspecified Chemicals &
Organic Solvents, Halogenated
Other Gases & Vapors(e.g., carbon
1 Rate per 100,000 population.2 Rate per 100,000 age-adjusted to U.S. 2000 population. Does not include deaths where age is unknown.3 Group totals are shown in parentheses.
Unintentional Injury (Accident) Self-Harm (Suicide) Undetermined
Drugs (X40-X44,X60-X64,Y10-Y14)3Total
Alcohol (X45, X65, Y15)
* Rate not calculated because number of deaths was less than 5.Note: Rates based on fewer than 20 deaths are likely to be unstable and imprecise.
Poisoning due to homicides are not included in this table.

Washington State Vital Statistics 2005 106
Mortality Table E6. Suicide, Homicide, and Undetermined by County of Residence, 2005
County Number Crude Rate1Age-Adj
Rate2 Number Crude Rate1Age-Adj
Rate2 Number Crude Rate1Age-Adj
Rate2
State Total 814 13.0 12.7 232 3.7 3.7 83 1.3 1.3Adams 4 * * 1 * * 0 * *Asotin 4 * * 1 * * 0 * *Benton 10 6.3 7.3 9 5.7 5.7 1 * *Chelan 11 15.9 15.2 3 * * 4 * *Clallam 15 22.5 22.0 0 * * 0 * *Clark 50 12.8 12.6 17 4.3 4.6 4 * *Columbia 1 * * 0 * * 0 * *Cowlitz 19 19.8 19.5 3 * * 5 5.2 4.3Douglas 3 * * 0 * * 2 * *Ferry 1 * * 0 * * 1 * *Franklin 3 * * 2 * * 0 * *Garfield 1 * * 0 * * 0 * *Grant 4 * * 3 * * 3 * *Grays Harbor 13 18.6 18.4 4 * * 5 7.2 5.9Island 7 9.2 9.0 0 * * 0 * *Jefferson 6 21.7 16.2 1 * * 2 * *King 215 11.9 11.3 66 3.6 3.4 17 0.9 0.9Kitsap 39 16.2 16.4 10 4.2 4.1 5 2.1 1.7Kittitas 3 * * 0 * * 0 * *Klickitat 3 * * 0 * * 1 * *Lewis 13 18.2 17.0 2 * * 1 * *Lincoln 2 * * 0 * * 0 * *Mason 13 25.0 20.9 5 9.6 9.2 0 * *Okanogan 11 27.8 28.8 4 * * 0 * *Pacific 3 * * 2 * * 2 * *Pend Oreille 1 * * 0 * * 0 * *Pierce 92 12.2 12.1 33 4.4 4.3 13 1.7 1.8San Juan 4 * * 1 * * 0 * *Skagit 14 12.6 13.2 3 * * 2 * *Skamania 4 * * 1 * * 0 * *Snohomish 82 12.5 12.6 17 2.6 2.5 4 * *Spokane 63 14.4 13.9 15 3.4 3.4 4 * *Stevens 7 17.0 16.1 0 * * 0 * *Thurston 27 12.0 11.3 3 * * 3 * *Wahkiakum 2 * * 0 * * 0 * *Walla Walla 9 15.7 15.6 0 * * 2 * *Whatcom 30 16.6 16.0 5 2.8 2.7 2 * *Whitman 1 * * 3 * * 0 * *Yakima 24 10.5 11.1 18 7.8 7.6 0 * *
Intentional Self-Harm (Suicide) (X60-X84,Y87.0) Assault (Homicide) (X85-Y09,Y87.1) Undetermined (Y10-Y34,Y87.2,Y89.9)
Rates based on fewer than 20 deaths are likely to be unstable and imprecise.
1 Rate per 100,000 population.2 Rate per 100,000 age-adjusted to U.S. 2000 population. Does not include deaths where age is unknown.* Rate not calculated because number of deaths was less than 5.Note: Codes for International Classification of Diseases, Tenth Revision (ICD-10) are in parentheses after each group heading.

Washington State Vital Statistics 2005 107
Mortality Table E7. Drug and Alcohol-Induced Causes for Residents, 2005
County Number Crude Rate1 Age-Adj Rate2 Number Crude Rate1 Age-Adj Rate2
State Total 921 14.7 14.2 616 9.8 9.5Adams 1 * * 0 * *Asotin 1 * * 4 * *Benton 16 10.1 10.2 10 6.3 6.1Chelan 7 10.1 11.1 5 7.2 7.1Clallam 15 22.5 23.3 7 10.5 7.0Clark 46 11.7 11.3 32 8.2 8.1Columbia 0 * * 0 * *Cowlitz 34 35.5 35.7 13 13.6 12.4Douglas 7 20.2 19.8 7 20.2 18.4Ferry 2 * * 1 * *Franklin 4 * * 4 * *Garfield 2 * * 1 * *Grant 13 16.4 18.1 7 8.9 9.3Grays Harbor 17 24.4 24.4 15 21.5 17.1Island 4 * * 4 * *Jefferson 9 32.6 27.1 6 21.7 13.3King 249 13.8 12.5 149 8.2 8.2Kitsap 33 13.7 12.6 27 11.2 10.1Kittitas 0 * * 6 16.4 17.3Klickitat 2 * * 3 * *Lewis 16 22.3 23.4 6 8.4 7.0Lincoln 0 * * 1 * *Mason 12 23.1 21.1 10 19.3 16.5Okanogan 10 25.3 25.2 7 17.7 15.0Pacific 1 * * 4 * *Pend Oreille 4 * * 3 * *Pierce 99 13.1 12.8 75 9.9 9.9San Juan 0 * * 2 * *Skagit 18 16.2 15.8 15 13.5 11.2Skamania 2 * * 0 * *Snohomish 98 14.9 14.1 56 8.5 8.9Spokane 101 23.1 22.7 45 10.3 10.2Stevens 10 24.3 25.3 8 19.4 18.0Thurston 36 16.1 15.3 31 13.8 12.5Wahkiakum 0 * * 0 * *Walla Walla 6 10.4 11.2 2 * *Whatcom 25 13.8 14.3 25 13.8 13.5Whitman 1 * * 1 * *Yakima 20 8.7 9.7 24 10.5 10.6
Drug-Induced Alcohol-Induced
1 Rate per 100,000 population.2 Rate per 100,000 age-adjusted to U.S. 2000 population. Does not include deaths where age is unknown.* Rate not calculated because number of deaths was less than 5.Note: Source for Selected Disease Conditions is International Classification of Diseases, Tenth Revision, (ICD-10): Drug-Induced:
F11.0-11.5,F11.7-F11.9,F12.0-F12.5,F12.7-F12.9,F13.0-F13.5,F13.7-F13.9,F14.0-F14.5,F14.7-F14.9,F15.0-F15.5,F15.7-F15.9,F16.0-F16.5,F16.7-F16.9,
Rates based on fewer than 20 deaths are likely to be unstable and imprecise.
F17.0,F17.3,F16.9,F17.0,F17.3-F17.5,F17.7-F17.9,F18.0-F18.5,F18.7-F18.9,F19.0-F19.5,F19.7-F19.9,X40-X44,X60-X64,X85,Y10-Y14;
D52.1,D59.0,D59.2,D61.1,D64.2,E06.4,E16.0,E23.1,E24.2,E27.3,E66.1,G21.1,G24.0,G25.1,G25.4,G25.6,G44.4,G62.0,
G72.0,I95.2,J70.2,J70.3,J70.4,L10.5,L27.0,L27.1,M10.2,M32.0,M80.4,M81.4,M83.5,M87.1,R78.1,R78.2,R78.3,R78.4,R78.5.
Alcohol-Induced: F10,G31.2,G62.1,I42.6, K29.2,K70, R78.0,X45,X65,Y15, E24.4, G72.1, K86.0.

Washington State Vital Statistics 2005 108
Mortality Table E8. Unintentional Injury (Accident), Motor Vehicle Traffic, and Falls by County of Residence, 2005
County Number Crude Rate2Age-Adj
Rate3 Number Crude Rate2Age-Adj
Rate3 Number Crude Rate2Age-Adj
Rate3
State Total 2,520 40.3 39.8 721 11.5 11.4 566 9.0 9.1Adams 9 52.9 58.4 7 41.2 45.2 0 * *Asotin 6 28.7 28.3 2 * * 1 * *Benton 45 28.5 30.6 12 7.6 7.8 8 5.1 6.1Chelan 24 34.7 30.1 7 10.1 9.4 7 10.1 7.2Clallam 47 70.4 65.1 13 19.5 23.6 15 22.5 16.6Clark 127 32.4 34.3 42 10.7 11.1 24 6.1 7.4Columbia 2 * * 0 * * 1 * *Cowlitz 76 79.3 76.3 13 13.6 13.8 20 20.9 1Douglas 8 23.1 22.8 2 * * 2 * *Ferry 11 148.6 172.6 8 108.1 121.0 2 * *Franklin 14 23.1 27.2 7 11.6 10.9 3 * *Garfield 3 * * 0 * * 0 * *Grant 60 75.9 77.6 31 39.2 38.2 9 11.4 12.1Grays Harbor 41 58.7 57.4 12 17.2 16.9 9 12.9 10.2Island 37 48.7 47.5 14 18.4 18.7 11 14.5 13.7Jefferson 18 65.2 59.0 4 * * 3 * *King 624 34.5 33.6 152 8.4 8.4 139 7.7 8.0Kitsap 84 34.9 35.0 28 11.6 11.7 25 10.4 10.7Kittitas 14 38.3 47.7 7 19.1 23.3 1 * *Klickitat 10 51.3 49.3 5 25.6 25.8 1 * *Lewis 37 51.7 49.1 10 14.0 13.0 9 12.6 10.0Lincoln 6 59.4 55.8 3 * * 2 * *Mason 38 73.2 74.0 15 28.9 33.7 8 15.4 12.3Okanogan 29 73.2 75.8 12 30.3 32.7 3 * *Pacific 14 65.7 63.3 7 32.9 34.2 3 * *Pend Oreille 10 82.0 84.8 1 * * 2 * *Pierce 259 34.3 35.9 68 9.0 9.1 57 7.5 8.9San Juan 4 * * 1 * * 1 * *Skagit 68 61.3 56.3 20 18.0 17.6 19 17.1 13.8Skamania 9 87.4 84.5 2 * * 1 * *Snohomish 251 38.3 39.4 72 11.0 11.1 54 8.2 9.7Spokane 213 48.8 45.7 30 6.9 6.4 63 14.4 12.8Stevens 35 85.0 84.3 11 26.7 27.2 8 19.4 17.3Thurston 94 41.9 41.7 27 12.0 11.9 22 9.8 10.1Wahkiakum 1 * * 0 * * 1 * *Walla Walla 23 40.0 31.1 6 10.4 9.1 6 10.4 6.1Whatcom 60 33.2 32.4 20 11.1 10.0 11 6.1 5.8Whitman 9 21.2 24.5 2 * * 5 11.8 13.8Yakima 100 43.6 45.1 48 20.9 21.4 10 4.4 4.4
Unintentional Injury (Accident)(V01-X59,Y85-Y86) Motor Vehicle Traffic1
7.5
Falls (W00-W19)
1 ICD-10 codes are V02-V04(.1,.9),V09.2,V12-V14(.3-.9), V19(.4-.6),V20-V28(.3-.9),V29-V79(.4-.9),V80(.3-.5),V81.1,V82.1,V83-V86(.0-.3),V87(.0-.8),V89.22 Rate per 100,000 population.3 Rate per 100,000 age-adjusted to U.S. 2000 population. Does not include deaths where age is unknown.* Rate not calculated because number of deaths was less than 5.Note: Codes for International Classification of Diseases, Tenth Revision (ICD-10) are in parentheses after each groupheading unless otherwise noted.Rates based on fewer than 20 deaths are likely to be unstable and imprecise.

Washington State Vital Statistics 2005 109
Mortality Table E9. Drowning, Fires, and Other Unintentional Injury (Accident) by County of Residence, 2005
County Number Crude Rate1Age-Adj
Rate2 Number Crude Rate1Age-Adj
Rate2 Number Crude Rate1Age-Adj
Rate2
State Total 104 1.7 1.7 52 0.8 0.9 1,077 17.2 16.7Adams 0 * * 1 * * 1 * *Asotin 1 * * 0 * * 2 * *Benton 3 * * 1 * * 21 13.3 13.9Chelan 2 * * 0 * * 8 11.6 11.0Clallam 1 * * 0 * * 18 26.9 23.5Clark 1 * * 1 * * 59 15.1 15.2Columbia 0 * * 0 * * 1 * *Cowlitz 5 5.2 5.5 5 5.2 5.1 33 34.4 34.3Douglas 0 * * 0 * * 4 * *Ferry 0 * * 0 * * 1 * *Franklin 0 * * 0 * * 4 * *Garfield 0 * * 0 * * 3 * *Grant 1 * * 0 * * 19 24.0 25.8Grays Harbor 5 7.2 7.4 2 * * 13 18.6 19.5Island 2 * * 0 * * 10 13.2 12.2Jefferson 1 * * 0 * * 10 36.2 35.7King 27 1.5 1.4 7 0.4 0.4 299 16.5 15.5Kitsap 0 * * 3 * * 28 11.6 11.2Kittitas 3 * * 0 * * 3 * *Klickitat 0 * * 0 * * 4 * *Lewis 2 * * 1 * * 15 20.9 21.9Lincoln 0 * * 0 * * 1 * *Mason 1 * * 1 * * 13 25.0 23.6Okanogan 1 * * 1 * * 12 30.3 31.9Pacific 1 * * 1 * * 2 * *Pend Oreille 1 * * 0 * * 6 49.2 44.8Pierce 7 0.9 0.9 9 1.2 1.4 118 15.6 15.6San Juan 1 * * 0 * * 1 * *Skagit 1 * * 4 * * 24 21.6 20.6Skamania 0 * * 0 * * 6 58.3 56.7Snohomish 13 2.0 2.0 6 0.9 1.1 106 16.2 15.5Spokane 3 * * 0 * * 117 26.8 25.9Stevens 1 * * 1 * * 14 34.0 35.6Thurston 6 2.7 2.9 0 * * 39 17.4 16.8Wahkiakum 0 * * 0 * * 0 * *Walla Walla 2 * * 2 * * 7 12.2 10.5Whatcom 4 * * 3 * * 22 12.2 12.6Whitman 1 * * 0 * * 1 * *Yakima 7 3.1 3.1 3 * * 32 14.0 14.6
Drownings (V90,V92,W65-W74) Fires (X00-X09)Other Unintentional Injury (Accident)
(remainder)
Rates based on fewer than 20 deaths are likely to be unstable and imprecise.
1 Rate per 100,000 population.2 Rate per 100,000 age-adjusted to U.S. 2000 population. Does not include deaths where age is unknown.* Rate not calculated because number of deaths was less than 5.Note: Codes for International Classification of Diseases, Tenth Revision (ICD-10) are in parentheses after each group heading.

Washington State Vital Statistics 2005 110
Mortality Table E10. Suicide, Homicide, and Undetermined to Residents by County of Injury, 2005
County of InjuryIntentional Self-Harm
(Suicide) (X60-X84, Y87.0)Assault (Homicide) (X85-
Y09,Y87.1)Undetermined (Y10-Y34,
Y87.2, Y89.9)State Total 814 232 83Adams 4 1 0Asotin 3 1 0Benton 10 7 0Chelan 13 2 3Clallam 16 0 0Clark 39 12 1Columbia 1 0 0Cowlitz 16 2 3Douglas 2 0 2Ferry 1 0 0Franklin 3 0 0Garfield 1 0 0Grant 5 3 1Grays Harbor 14 2 5Island 9 1 0Jefferson 6 1 1King 205 60 19Kitsap 35 8 5Kittitas 3 0 0Klickitat 2 1 1Lewis 14 2 0Lincoln 2 0 0Mason 14 7 0Okanogan 12 4 1Pacific 3 1 1Pend Oreille 1 0 0Pierce 91 29 11San Juan 4 0 0Skagit 16 3 2Skamania 5 1 0Snohomish 76 15 2Spokane 57 13 1Stevens 6 0 0Thurston 23 2 3Wahkiakum 2 0 0Walla Walla 6 1 1Whatcom 28 6 2Whitman 2 3 0Yakima 21 21 0Unknown 13 11 1Out of State 30 12 17Note: Codes for International Classification of Diseases, Tenth Revision (ICD-10) are in parentheses after each group heading.

Washington State Vital Statistics 2005 111
Mortality Table E11. Unintentional Injury (Accident) to Residents by County of Injury, 2005
County of InjuryAll Unintentional Injury (Accident)
Motor Vehicle Traffic Falls Drownings Fires
Other Accidents
State Total 2,520 721 566 104 52 1,077Adams 14 12 0 0 1 1Asotin 3 1 0 1 0 1Benton 32 10 7 2 1 12Chelan 27 4 8 5 0 10Clallam 33 9 10 2 0 12Clark 74 27 20 0 0 27Columbia 3 0 2 0 0 1Cowlitz 54 10 11 3 5 25Douglas 10 6 1 0 0 3Ferry 11 9 2 0 0 0Franklin 12 4 4 1 0 3Garfield 0 0 0 0 0 0Grant 48 20 7 2 0 19Grays Harbor 38 15 7 6 2 8Island 29 8 11 1 0 9Jefferson 15 4 3 1 0 7King 534 135 133 15 6 245Kitsap 69 22 26 0 3 18Kittitas 20 11 0 5 0 4Klickitat 5 3 0 0 0 2Lewis 40 10 10 3 1 16Lincoln 5 4 1 0 0 0Mason 34 15 7 1 1 10Okanogan 27 11 4 1 1 10Pacific 9 3 2 1 1 2Pend Oreille 6 0 1 0 0 5Pierce 222 60 56 7 7 92San Juan 2 1 0 0 0 1Skagit 67 20 20 2 4 21Skamania 6 1 0 0 0 5Snohomish 214 56 48 15 7 88Spokane 180 30 62 3 0 85Stevens 25 5 9 1 1 9Thurston 81 27 15 6 0 33Wahkiakum 6 5 1 0 0 0Walla Walla 14 5 5 1 2 1Whatcom 55 20 9 3 3 20Whitman 4 1 3 0 0 0Yakima 86 47 9 3 3 24Unknown 89 47 13 7 0 22Out of State 317 43 39 6 3 226
10: W00-W19); Drownings (ICD-10: V90,V92,W65-W74); Fires (ICD-10: X00-X09); Other Accidents (remainder).* *
Note: Source for Selected Accidents is International Classification of Diseases (Tenth): All Unintentional Injury
(Accident) (ICD-10: V01-X59,Y85-Y86); Motor Vehicle Traffic (ICD-10: V02-V04(.1,.9),V09.2,V12-V14(.3-.9),
V19(.4-.6),V20-V28(.3-.9),V29-V79(.4-.9),V80(.3-.5),V81.1,V82.1,V83-V86(.0-.3),V87(.0-.8),V89.2; Falls (ICD-

Washington State Vital Statistics 2005 112
F. Infant Mortality Infant mortality data include all infants who died at less than one year of age. Information on the causes of infant death helps identify areas where special care or preventive measures may be needed. To provide more information about infant death, the death data are linked to data about the infant’s birth. This linkage provides demographic data such as the mother’s age and race/ethnicity, behavioral data such as smoking during pregnancy, health service data such as prenatal care, and outcome data such as birth weight. Using this linked file, analysts can compare birth characteristics of infants who died to those of infants who survived to identify risk factors for infant mortality. Health care providers use this knowledge to help their patients have a healthy baby. Mortality Table F1. Selected Causes for Infants (< 1 Year) Residents, 1996-2005
Total All Causes Perinatal ConditionsCongenital
Malformations SIDS External CausesYear Number Rate1 Number Rate1 Number Rate1 Number Rate1 Number Rate1
1996 467 6.0 175 2.2 144 1.8 80 1.0 9 0.11997 440 5.6 156 2.0 117 1.5 84 1.1 18 0.21998 452 5.7 175 2.2 120 1.5 91 1.1 13 0.2***1998 Comparability Modified***
452 5.7 188 2.4 111 1.4 96 1.2 13 0.21999 401 5.0 172 2.2 102 1.3 69 0.9 13 0.22000 423 5.2 172 2.1 92 1.1 76 0.9 27 0.32001 461 5.8 200 2.5 119 1.5 60 0.8 32 0.42002 452 5.7 200 2.5 105 1.3 70 0.9 24 0.32003 447 5.6 200 2.5 116 1.4 48 0.6 20 0.22004 451 5.5 189 2.3 120 1.5 53 0.6 29 0.42005 420 5.1 170 2.1 113 1.4 42 0.5 27 0.31Rate per 1,000 live births.
Note:
SIDS: ICD-9: 798.0; ICD-10: R95; CR=1.0570
External Causes: ICD-9: E800-E999; ICD-10: V01-Y89; CR=0.9981
Causes of death were coded with ICD-9 in 1990-1998 and with ICD-10 started in 1998. Rates during 1998
have been multiplied by a comparability ratio (CR). ICD codes and comparability ratios are:
Perinatal Conditions: ICD-9: 760-771.2,771.4-779; ICD-10: P00-P96; CR=1.0732
Congenital Mallformations: ICD-9: 740-759; ICD-10: Q00-Q99; CR=0.9280
Total infant mortality has dramatically decreased since 1990. During this time period, SIDS deaths have declined and deaths from other causes have also decreased. Possible reasons for the change include emphasis on preventive measures such as proper sleep position (the ’Back to Sleep’ campaign), use of folic acid before and during pregnancy to prevent neural tube defects, and smoking cessation. However, when interpreting this table if a sudden change in the SIDS number or rate is evident, the category “unexplained infant death” should be considered to see if that has also changed. Since neither of these conditions is very well-defined, the designation of a particular infant death as SIDS (ICD-10 R95) vs. unexplained death (ICD-10 R99) may be a matter of personal preference on the part of the coroner/ME.
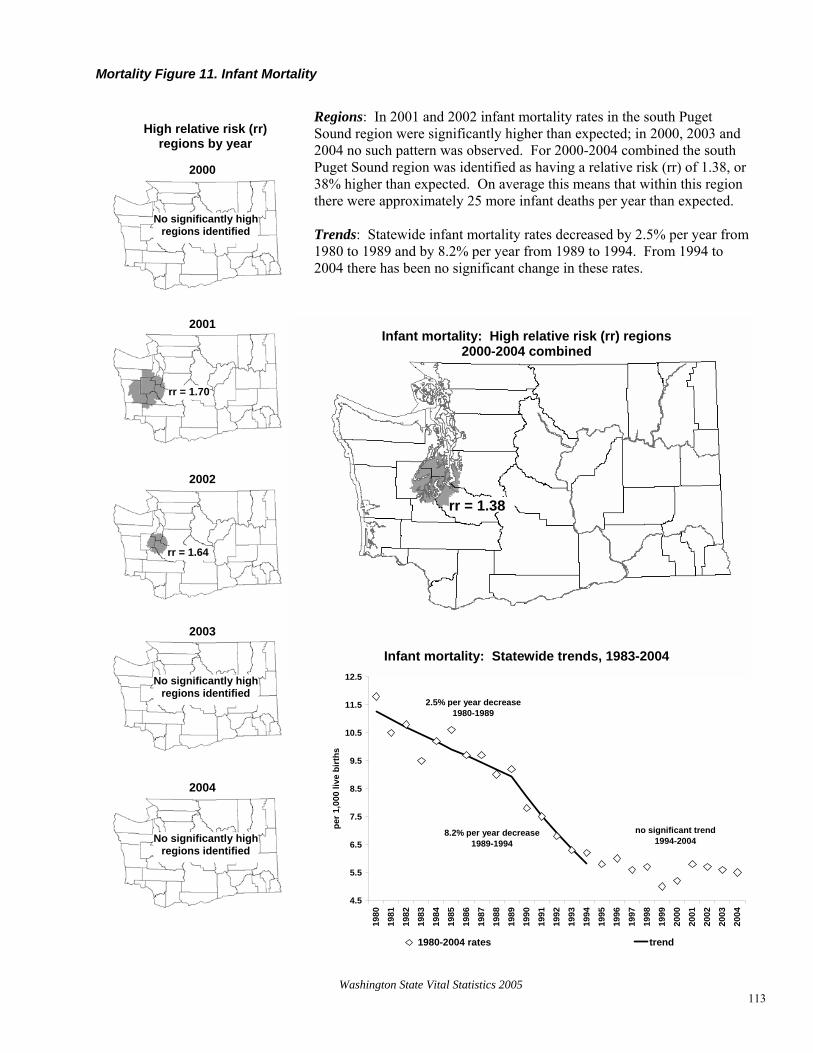
Washington State Vital Statistics 2005 113
Mortality Figure 11. Infant Mortality Regions: In 2001 and 2002 infant mortality rates in the south Puget
Sound region were significantly higher than expected; in 2000, 2003 and 2004 no such pattern was observed. For 2000-2004 combined the south Puget Sound region was identified as having a relative risk (rr) of 1.38, or 38% higher than expected. On average this means that within this region there were approximately 25 more infant deaths per year than expected. Trends: Statewide infant mortality rates decreased by 2.5% per year from 1980 to 1989 and by 8.2% per year from 1989 to 1994. From 1994 to 2004 there has been no significant change in these rates.
High relative risk (rr) regions by year
2000
No significantly highregions identified
2001
rr = 1.70
Infant mortality: High relative risk (rr) regions 2000-2004 combined
2002
rr = 1.38
rr = 1.64
2003
No significantly highregions identified
Infant mortality: Statewide trends, 1983-2004
4.5
5.5
6.5
7.5
8.5
9.5
10.5
11.5
12.5
1980
1981
1982
1983
1984
1985
1986
1987
1988
1989
1990
1991
1992
1993
1994
1995
1996
1997
1998
1999
2000
2001
2002
2003
2004
per 1
,000
live
birt
hs
1980-2004 rates trend
8.2% per year decrease1989-1994
no significant trend1994-2004
2.5% per year decrease1980-1989
2004
No significantly highregions identified

Washington State Vital Statistics 2005 114
Mortality Table F2. Leading Causes of Infant (Age < 1 Year) Death for Residents, 2005
Rank Causes of Death and ICD-10 Codes Number Percent1Cumulative
PercentState Total 420 100.0 .
1 Congenital Malformations (Q00-Q99) 113 26.9 26.92 Sudden Infant Death Syndrome (R95) 42 10.0 36.93 Short Gestation & Low Birth Weight (P07) 31 7.4 44.34 Complic. of Placenta, Cord & Membranes (P02) 21 5.0 49.35 Maternal Complications of Pregnancy (P01) 21 5.0 54.36 Unintentional Injury (Accident) (V01-X59,Y85-Y86) 21 5.0 59.37 Intrauterine Hypoxia & Birth Asphyxia (P20-P21) 15 3.6 62.98 Bacterial Sepsis of Newborn (P36) 14 3.3 66.29 Gastritis & Noninfective Enteritis (K29, K50-K55) 9 2.1 68.310 Atelectasis (P28.0-P28.1) 8 1.9 70.2
All Other Causes 125 29.8 100.01 Percents may not add to 100% due to rounding. Mortality Figure 12. Leading Causes of Infant (Age <1 Year) Death for Residents, 2005
29.8
1.9
2.1
3.3
3.6
5.0
5.0
5.0
7.4
10.0
26.9
0.0 5.0 10.0 15.0 20.0 25.0 30.0 35.0
All Other Causes
Atelectasis
Gastritis & Noninfective Enteritis
Bacterial Sepsis of Newborn
Intrauterine Hypoxia & Birth Asphyxia
Unintentional Injury (Accident)
Maternal Complications of Pregnancy
Complic. of Placenta, Cord & Membranes
Short Gestation & Low Birth Weight
Sudden Infant Death Syndrome
Congenital Malformations
Percent

Washington State Vital Statistics 2005 115
Mortality Table F3. Birth Weight and Age for Infant (Age < 1 Year) Residents, 2005 Birth Weight 1 Day to 7 Days to 28 Days to 6 Months toin Grams Number Rate1 < 1 Day < 7 Days <28 Days < 6 Months < 12 MonthsState Totals 420 5.1 138 46 67 126 43Under 500 50 862.1 45 0 3 0 2500 - 749 71 503.5 39 6 11 13 2750 - 999 26 171.1 9 1 7 6 31,000 - 1,499 26 65.2 8 8 6 4 01,500 - 1,999 30 30.6 7 5 6 8 42,000 - 2,499 40 12.1 9 7 4 142,500 - 2,999 55 4.6 8 6 5 293,000 - 3,499 60 2.0 4 8 10 30 83,500 - 3,999 35 1.4 1 4 7 164,000 - 4,499 10 1.3 2 1 2 4 14,500 and over 3 * 0 0 0 0 3Unknown 14 46.8 6 0 6 2 0
Total
1 Rate per 1,000 live births.* Rate not calculated because number of deaths was less than 5.
67
7

Washington State Vital Statistics 2005 116
Mortality Table F4-a. Selected Causes by Age and Sex for Infant (Age < 1 Year) Residents, 2005
Cause and ICD-10 Code Total Male Fem. Total Male Fem. Total Male Fem.Total All Causes¹ (420) (240) (180) (138) (77) (61) (46) (21) (25)Infectious & Parasitic Diseases (A00-B99) 10 8 2 0 0 0 0 0 0Diseases of the Nervous System (G00-G98) 6 4 2 0 0 0 0 0 0Diseases of the Circulatory System (I00-I99) 7 3 4 0 0 0 0 0 0Diseases of the Respiratory System (J00-J98) 11 9 2 0 0 0 0 0 0Conditions Originating in Perinatal Period(P00-P96) (170) (93) (77) (98) (53) (45) (26) (14) (12) Newborn Affected by Maternal Factors (P00-P04) (49) (33) (16) (41) (26) (15) (5) (4) (1) Incompetent Cervix (P01.0) 11 6 5 11 6 5 0 0 0 Premature Rupture of Membranes (P01.1) 9 7 2 9 7 2 0 0 0 Other Maternal Complic. of Pregnancy (P01.2-P01.9) 1 1 0 1 1 0 0 0 0 Complications Involving Placenta (P02.0-P02.3) 15 9 6 11 6 5 4 3 1 Complications of Cord & Membranes (P02.4-P02.9) 6 5 1 4 3 1 0 0 0 Other (P00,P03,P04) 7 5 2 5 3 2 1 1 0 Short Gestation & Low Birth Weight (P07) 31 14 17 27 13 14 1 0 1 Intrauterine Hypoxia & Birth Asphyxia (P20-P21) 15 6 9 3 1 2 5 2 3 Respiratory Distress of Newborn (P22) 5 3 2 2 1 1 3 2 1 Other Respiratory Conditions (P23-P28) 23 14 9 11 4 7 3 3 0 Infections Specific to Perinatal Period (P35-P39) 16 12 4 3 3 0 2 1 1 Neonatal Hemorrhage (P50-P52,P54) 5 3 2 2 1 1 1 0 1 Necrotizing Enterocolitis of Newborn (P77) 7 2 5 0 0 0 1 1 0 Hydrops Fetalis Not Due to Hemolytic Disease (P83.2) 5 2 3 3 2 1 2 0 2 Other (Residual) 14 4 10 6 2 4 3 1 2Congenital Malformations (Q00-Q99) (113) (60) (53) (38) (22) (16) (18) (5) (13) Anencephaly and Similar Malformations (Q00) 3 0 3 1 0 1 2 0 2 Malformations of Heart (Q20-Q24) 32 15 17 4 2 2 3 0 3 Other Malformations of Circulatory System (Q25-Q28) 8 5 3 1 0 1 1 1 0 Malformations of Respiratory System (Q30-Q34) 4 3 1 2 1 1 1 1 0 Malformations of Genitourinary System (Q50-Q64) 4 4 0 4 4 0 0 0 0 Malform. of Musculoskeletal Sys. & Skin (Q65-Q85) 16 9 7 7 4 3 3 0 3 Down's Syndrome (Q90) 4 1 3 2 0 2 0 0 0 Edward's Syndrome (Q91.0-Q91.3) 9 4 5 3 2 1 3 0 3 Patau's Syndrome (Q91.4-Q91.7) 9 4 5 3 1 2 3 1 2 Other (Q01-Q18,Q35-Q45,Q86-Q89) 20 13 7 10 8 2 1 1 0 Other Chromosomal Abnormalities (Q92-Q99) 4 2 2 1 0 1 1 1 0Sudden Infant Death Syndrome (R95) 42 32 10 0 0 0 2 2 0Other(C00-F99,H00-H99,K00-N99,R00-R94,R96-R99) 34 17 17 2 2 0 0 0 0External Causes of Mortality (V01-Y89) (27) (14) (13) (0) (0) (0) (0) (0) (0) Accidents (V01-X59, Y85-Y86) (21) (11) (10) (0) (0) (0) (0) (0) (0) Suffocation & Strangulation (W75-W77,W81-W84) 11 6 5 0 0 0 0 0 0 Other (V00-W74,W78-W80,W85-X59,Y85-Y86) 10 5 5 0 0 0 0 0 0 Assault (homicide) (X85-Y09, Y87.1) 2 1 1 0 0 0 0 0 0 Other (X60-X84,Y10-Y84,Y87.0,Y87.2-Y89) 4 2 2 0 0 0 0 0 01 Group totals are shown in parentheses.
Under 1 DayTotal 1 Day to Under 7 Days
Total includes 1 death for which sex is unknown.
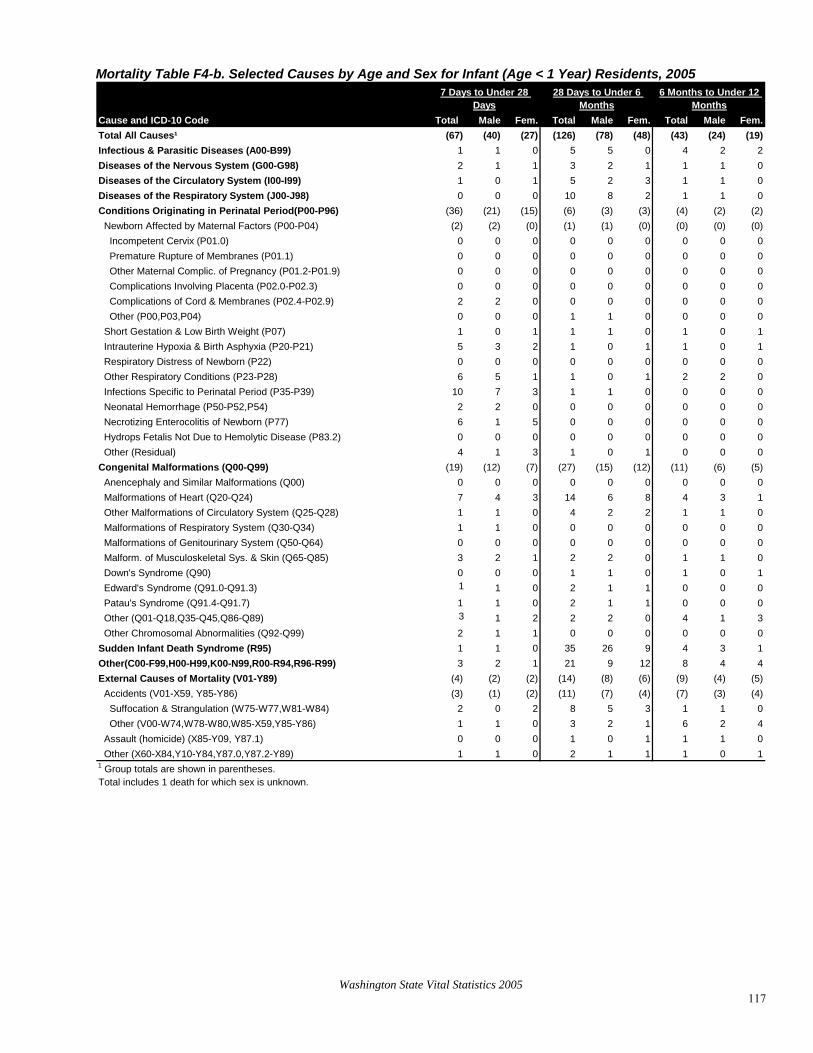
Washington State Vital Statistics 2005 117
Mortality Table F4-b. Selected Causes by Age and Sex for Infant (Age < 1 Year) Residents, 2005
Cause and ICD-10 Code Total Male Fem. Total Male Fem. Total Male Fem.Total All Causes¹ (67) (40) (27) (126) (78) (48) (43) (24) (19)Infectious & Parasitic Diseases (A00-B99) 1 1 0 5 5 0 4 2 2Diseases of the Nervous System (G00-G98) 2 1 1 3 2 1 1 1 0Diseases of the Circulatory System (I00-I99) 1 0 1 5 2 3 1 1 0Diseases of the Respiratory System (J00-J98) 0 0 0 10 8 2 1 1 0Conditions Originating in Perinatal Period(P00-P96) (36) (21) (15) (6) (3) (3) (4) (2) (2) Newborn Affected by Maternal Factors (P00-P04) (2) (2) (0) (1) (1) (0) (0) (0) (0) Incompetent Cervix (P01.0) 0 0 0 0 0 0 0 0 0 Premature Rupture of Membranes (P01.1) 0 0 0 0 0 0 0 0 0 Other Maternal Complic. of Pregnancy (P01.2-P01.9) 0 0 0 0 0 0 0 0 0 Complications Involving Placenta (P02.0-P02.3) 0 0 0 0 0 0 0 0 0 Complications of Cord & Membranes (P02.4-P02.9) 2 2 0 0 0 0 0 0 0 Other (P00,P03,P04) 0 0 0 1 1 0 0 0 0 Short Gestation & Low Birth Weight (P07) 1 0 1 1 1 0 1 0 1 Intrauterine Hypoxia & Birth Asphyxia (P20-P21) 5 3 2 1 0 1 1 0 1 Respiratory Distress of Newborn (P22) 0 0 0 0 0 0 0 0 0 Other Respiratory Conditions (P23-P28) 6 5 1 1 0 1 2 2 0 Infections Specific to Perinatal Period (P35-P39) 10 7 3 1 1 0 0 0 0 Neonatal Hemorrhage (P50-P52,P54) 2 2 0 0 0 0 0 0 0 Necrotizing Enterocolitis of Newborn (P77) 6 1 5 0 0 0 0 0 0 Hydrops Fetalis Not Due to Hemolytic Disease (P83.2) 0 0 0 0 0 0 0 0 0 Other (Residual) 4 1 3 1 0 1 0 0 0Congenital Malformations (Q00-Q99) (19) (12) (7) (27) (15) (12) (11) (6) (5) Anencephaly and Similar Malformations (Q00) 0 0 0 0 0 0 0 0 0 Malformations of Heart (Q20-Q24) 7 4 3 14 6 8 4 3 1 Other Malformations of Circulatory System (Q25-Q28) 1 1 0 4 2 2 1 1 0 Malformations of Respiratory System (Q30-Q34) 1 1 0 0 0 0 0 0 0 Malformations of Genitourinary System (Q50-Q64) 0 0 0 0 0 0 0 0 0 Malform. of Musculoskeletal Sys. & Skin (Q65-Q85) 3 2 1 2 2 0 1 1 0 Down's Syndrome (Q90) 0 0 0 1 1 0 1 0 1 Edward's Syndrome (Q91.0-Q91.3) 1 1 0 2 1 1 0 0 0 Patau's Syndrome (Q91.4-Q91.7) 1 1 0 2 1 1 0 0 0 Other (Q01-Q18,Q35-Q45,Q86-Q89) 3 1 2 2 2 0 4 1 3 Other Chromosomal Abnormalities (Q92-Q99) 2 1 1 0 0 0 0 0 0Sudden Infant Death Syndrome (R95) 1 1 0 35 26 9 4 3 1Other(C00-F99,H00-H99,K00-N99,R00-R94,R96-R99) 3 2 1 21 9 12 8 4 4External Causes of Mortality (V01-Y89) (4) (2) (2) (14) (8) (6) (9) (4) (5) Accidents (V01-X59, Y85-Y86) (3) (1) (2) (11) (7) (4) (7) (3) (4) Suffocation & Strangulation (W75-W77,W81-W84) 2 0 2 8 5 3 1 1 0 Other (V00-W74,W78-W80,W85-X59,Y85-Y86) 1 1 0 3 2 1 6 2 4 Assault (homicide) (X85-Y09, Y87.1) 0 0 0 1 0 1 1 1 0 Other (X60-X84,Y10-Y84,Y87.0,Y87.2-Y89) 1 1 0 2 1 1 1 0 11 Group totals are shown in parentheses.
6 Months to Under 12 Months
7 Days to Under 28 Days
28 Days to Under 6 Months
Total includes 1 death for which sex is unknown.

Washington State Vital Statistics 2005 118
Mortality Table F5. Selected Causes for Infant (Age < 1 Year) County of Residence, 2005
CountyState Total 420 49 43 78 113 42 27 68Adams 5 1 1 1 2 0 0 0Asotin 0 0 0 0 0 0 0 0Benton 12 0 1 2 3 5 0 1Chelan 11 0 2 2 4 2 0 1Clallam 1 1 0 0 0 0 0 0Clark 28 2 5 9 5 2 4 1Columbia 0 0 0 0 0 0 0 0Cowlitz 2 0 0 0 0 0 1 1Douglas 3 0 0 0 2 0 1 0Ferry 2 0 0 1 1 0 0 0Franklin 5 1 0 0 3 0 0 1Garfield 0 0 0 0 0 0 0 0Grant 8 1 1 0 1 0 3 2Grays Harbor 3 0 1 2 0 0 0 0Island 3 2 0 0 1 0 0 0Jefferson 1 0 0 0 0 0 1 0King 102 11 8 19 34 11 4 15Kitsap 18 4 2 2 5 3 1 1Kittitas 1 0 0 0 0 0 0 1Klickitat 0 0 0 0 0 0 0 0Lewis 6 1 1 1 0 1 0 2Lincoln 0 0 0 0 0 0 0 0Mason 5 1 0 0 2 1 0 1Okanogan 2 0 0 0 0 0 1 1Pacific 3 0 1 0 0 0 2 0Pend Oreille 0 0 0 0 0 0 0 0Pierce 64 5 9 15 11 2 2 20San Juan 0 0 0 0 0 0 0 0Skagit 4 0 0 1 0 1 1 1Skamania 0 0 0 0 0 0 0 0Snohomish 32 5 4 8 10 3 0 2Spokane 34 3 0 8 11 5 2 5Stevens 4 0 0 0 3 0 0 1Thurston 16 2 2 1 6 1 1 3Wahkiakum 0 0 0 0 0 0 0 0Walla Walla 5 1 1 1 1 1 0 0Whatcom 9 3 0 0 3 1 1 1Whitman 1 0 0 0 0 0 0 1Yakima 30 5 4 5 5 3 2 6
Total AllCauses
Maternal Factors
Hypoxia & Respiratory Conditions
Other Perinatal
Conditions
Sudden Infant Death Syndrome (ICD-10: R95); External Causes (ICD-10: V01-Y89)
Note: Source for Selected Causes is International Classification of Diseases, Tenth Revision (ICD-10): Maternal Factors (ICD-10: P00-P04); Hypoxia, and Respiratory Conditions (ICD-10: P20-P28); Other Perinatal Conditions (ICD-10: P05-P15, P29-P96); Congenital Malformations (ICD-10: Q00-Q99);
Congenital Malforma-
tionsSudden Infant
DeathExternal Causes
All OtherCauses
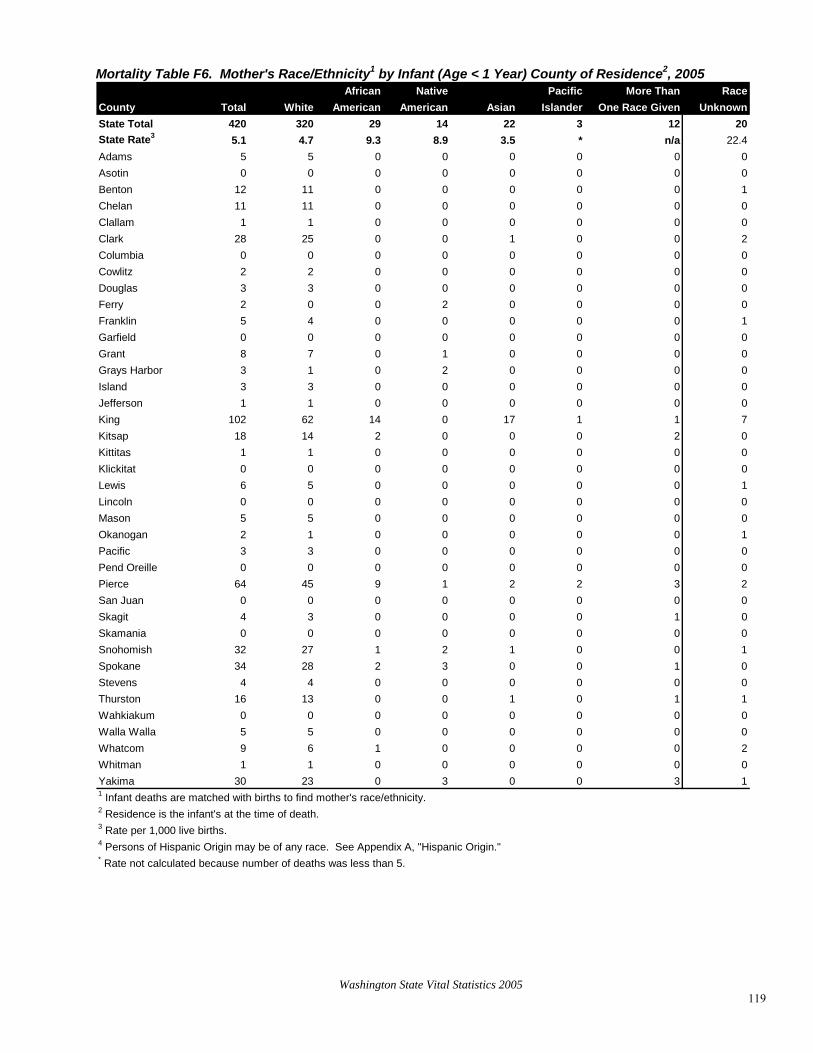
Washington State Vital Statistics 2005 119
Mortality Table F6. Mother's Race/Ethnicity1 by Infant (Age < 1 Year) County of Residence2, 2005 African Native Pacific More Than Race
County Total White American American Asian Islander One Race Given UnknownState Total 420 320 29 14 22 3 12 20State Rate3 5.1 4.7 9.3 8.9 3.5 * n/a 22.4Adams 5 5 0 0 0 0 0Asotin 0 0 0 0 0 0 0Benton 12 11 0 0 0 0 0 1Chelan 11 11 0 0 0 0 0 0Clallam 1 1 0 0 0 0 0Clark 28 25 0 0 1 0 0Columbia 0 0 0 0 0 0 0Cowlitz 2 2 0 0 0 0 0Douglas 3 3 0 0 0 0 0 0Ferry 2 0 0 2 0 0 0Franklin 5 4 0 0 0 0 0Garfield 0 0 0 0 0 0 0Grant 8 7 0 1 0 0 0Grays Harbor 3 1 0 2 0 0 0Island 3 3 0 0 0 0 0Jefferson 1 1 0 0 0 0 0King 102 62 14 0 17 1 1 7Kitsap 18 14 2 0 0 0 2 0Kittitas 1 1 0 0 0 0 0 0Klickitat 0 0 0 0 0 0 0Lewis 6 5 0 0 0 0 0Lincoln 0 0 0 0 0 0 0 0Mason 5 5 0 0 0 0 0Okanogan 2 1 0 0 0 0 0 1Pacific 3 3 0 0 0 0 0Pend Oreille 0 0 0 0 0 0 0 0Pierce 64 45 9 1 2 2 3 2San Juan 0 0 0 0 0 0 0 0Skagit 4 3 0 0 0 0 1Skamania 0 0 0 0 0 0 0 0Snohomish 32 27 1 2 1 0 0 1Spokane 34 28 2 3 0 0 1 0Stevens 4 4 0 0 0 0 0 0Thurston 16 13 0 0 1 0 1 1Wahkiakum 0 0 0 0 0 0 0Walla Walla 5 5 0 0 0 0 0 0Whatcom 9 6 1 0 0 0 0Whitman 1 1 0 0 0 0 0Yakima 30 23 0 3 0 0 3 1
4 Persons of Hispanic Origin may be of any race. See Appendix A, "Hispanic Origin."* Rate not calculated because number of deaths was less than 5.
1 Infant deaths are matched with births to find mother's race/ethnicity.2 Residence is the infant's at the time of death.3 Rate per 1,000 live births.
00
0200
0100000
01
0
0
0
0
20
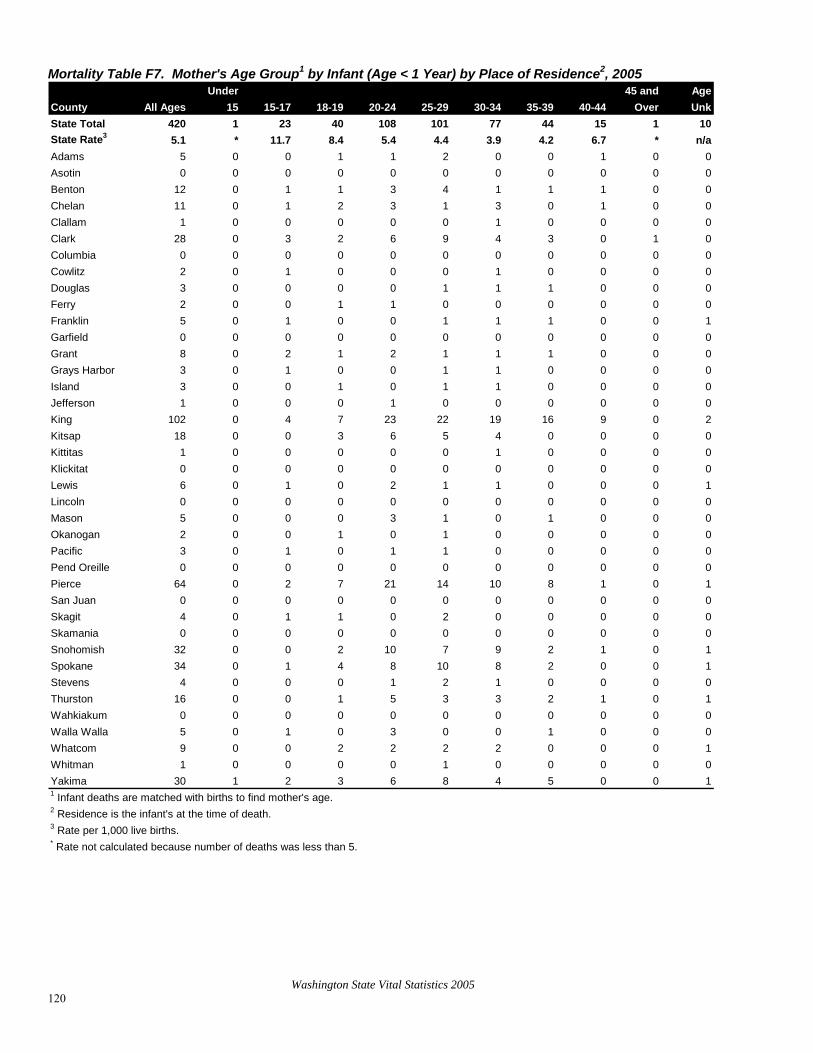
Washington State Vital Statistics 2005 120
Mortality Table F7. Mother's Age Group1 by Infant (Age < 1 Year) by Place of Residence2, 2005 Under 45 and Age
County All Ages 15 15-17 18-19 20-24 25-29 30-34 35-39 40-44 Over UnkState Total 420 1 23 40 108 101 77 44 15 1 10State Rate3 5.1 * 11.7 8.4 5.4 4.4 3.9 4.2 6.7 * n/aAdams 5 0 0 1 1 2 0 0 1 0 0Asotin 0 0 0 0 0 0 0 0 0 0 0Benton 12 0 1 1 3 4 1 1 1 0 0Chelan 11 0 1 2 3 1 3 0 1 0 0Clallam 1 0 0 0 0 0 1 0 0 0 0Clark 28 0 3 2 6 9 4 3 0 1 0Columbia 0 0 0 0 0 0 0 0 0 0 0Cowlitz 2 0 1 0 0 0 1 0 0 0 0Douglas 3 0 0 0 0 1 1 1 0 0 0Ferry 2 0 0 1 1 0 0 0 0 0 0Franklin 5 0 1 0 0 1 1 1 0 0 1Garfield 0 0 0 0 0 0 0 0 0 0 0Grant 8 0 2 1 2 1 1 1 0 0 0Grays Harbor 3 0 1 0 0 1 1 0 0 0 0Island 3 0 0 1 0 1 1 0 0 0 0Jefferson 1 0 0 0 1 0 0 0 0 0 0King 102 0 4 7 23 22 19 16 9 0 2Kitsap 18 0 0 3 6 5 4 0 0 0 0Kittitas 1 0 0 0 0 0 1 0 0 0 0Klickitat 0 0 0 0 0 0 0 0 0 0 0Lewis 6 0 1 0 2 1 1 0 0 0 1Lincoln 0 0 0 0 0 0 0 0 0 0 0Mason 5 0 0 0 3 1 0 1 0 0 0Okanogan 2 0 0 1 0 1 0 0 0 0 0Pacific 3 0 1 0 1 1 0 0 0 0 0Pend Oreille 0 0 0 0 0 0 0 0 0 0 0Pierce 64 0 2 7 21 14 10 8 1 0San Juan 0 0 0 0 0 0 0 0 0 0 0Skagit 4 0 1 1 0 2 0 0 0 0 0Skamania 0 0 0 0 0 0 0 0 0 0 0Snohomish 32 0 0 2 10 7 9 2 1 0 1Spokane 34 0 1 4 8 10 8 2 0 0 1Stevens 4 0 0 0 1 2 1 0 0 0 0Thurston 16 0 0 1 5 3 3 2 1 0 1Wahkiakum 0 0 0 0 0 0 0 0 0 0 0Walla Walla 5 0 1 0 3 0 0 1 0 0 0Whatcom 9 0 0 2 2 2 2 0 0 0 1Whitman 1 0 0 0 0 1 0 0 0 0 0Yakima 30 1 2 3 6 8 4 5 0 0 1
* Rate not calculated because number of deaths was less than 5.
1 Infant deaths are matched with births to find mother's age.2 Residence is the infant's at the time of death.3 Rate per 1,000 live births.
1

Washington State Vital Statistics 2005 121

Washington State Vital Statistics 2005 122
Mortality Table F8. Fetal Deaths, Perinatal, Neonatal, and Infant Mortality by County/City of Residence, 2005
Fetal Deaths Perinatal Mortality Neonatal Mortality Infant MortalityCounty and City Number Ratio1 Number Rate2 Number Rate3 Number Rate4
State Total 519 6.3 703 8.5 251 3.0 420 5.1Adams 5 11.8 7 16.3 3 * 5 11.8Asotin 1 * 1 * 0 * 0 *Benton 14 6.5 20 9.2 7 3.2 12 5.5 Kennewick 7 6.2 9 8.0 3 * 6 5.4 Richland 3 * 5 9.7 2 * 3 *Chelan 7 7.8 9 9.9 5 5.5 11 12.2 Wenatchee 5 8.9 6 10.6 2 * 7 12.5Clallam 3 * 4 * 1 * 1 Port Angeles 2 * 3 * 1 * 1 *Clark 32 5.7 50 8.8 19 3.4 28 5.0Camas 2 * 3 * 2 * 3 Vancouver 19 5.2 34 9.2 15 4.1 21 5.7Columbia 0 * 0 * 0 * 0 *Cowlitz 5 4.0 5 4.0 1 * 2 * Longview 0 * 0 * 0 * 1Douglas 2 * 3 * 1 * 3Ferry 0 * 2 * 2 * 2Franklin 6 4.0 9 6.0 4 * 5 3.4 Pasco 4 * 6 4.9 3 * 4 *Garfield 0 * 0 * 0 * 0 *Grant 9 6.2 13 8.9 4 * 8 5 Moses Lake 1 * 2 * 1 * 2Grays Harbor 8 9.3 9 10.4 3 * 3 * Aberdeen 2 * 2 * 0 * 0 *Island 5 5.0 7 7.0 2 * 3 * Oak Harbor 3 * 4 * 1 * 1 *Jefferson 1 * 1 * 0 * 1 *King 142 6.3 183 8.0 58 2.6 102 4.5 Auburn 3 * 4 * 4 * 6 Bellevue 13 10.1 13 10.0 0 * 1 * Bothell part 2 * 2 * 0 * 0 * Burien 1 * 1 * 0 * 2 * Covington 0 * 0 * 0 * 1 Des Moines 2 * 3 * 2 * 2 * Federal Way 11 9.0 12 9.7 2 * 8 6.5 Issaquah 1 * 2 * 1 * 2 * Kenmore 3 * 5 21.0 2 * 2 * Kent 11 6.7 15 9.1 4 * 8 4.9 Kirkland 2 * 4 * 2 * 3 * Maple Valley 5 14.1 5 13.9 0 * 1 * Mercer Island 0 * 0 * 0 * 0 * Redmond 5 5.5 8 8.8 4 * 5 5.5 Renton 4 * 5 3.4 2 * 8 5.5 Sammamish 1 * 2 * 1 * 1 * SeaTac 2 * 4 * 2 * 3 * Seattle 55 7.8 70 9.9 21 3.0 32 4.6 Shoreline 4 * 4 * 0 * 0
*
*
***
.5*
6.0
*
*

Mortality Table F8. (Continued) Fetal Deaths, Perinatal, Neonatal, and Infant Mortality by County/City of Residence, 2005
Fetal Deaths Perinatal Mortality Neonatal Mortality Infant MortalityCounty and City Number Ratio1 Number Rate2 Number Rate3 Number Rate4
Tukwila 1 * 1 * 0 * 2Kitsap 18 6.2 27 9.2 14 4.8 18 6.2 Bainbridge Island 0 * 0 * 0 * 0 * Bremerton 6 6.2 6 6.1 1 * 4 *Kittitas 5 15.0 5 14.8 0 * 1 * Ellensburg 4 * 4 * 0 * 0 *Klickitat 1 * 1 * 0 * 0Lewis 8 9.2 11 12.5 3 * 6 6.9 Centralia 1 * 2 * 1 * 2Lincoln 0 * 0 * 0 * 0 *Mason 0 * 3 * 3 * 5Okanogan 4 * 4 * 1 * 2 *Pacific 1 * 2 * 1 * 3Pend Oreille 1 * 1 * 0 * 0 *Pierce 65 6.2 93 8.8 39 3.7 64 6.1 Lakewood 6 6.2 8 8.3 3 * 6 6.2 Puyallup 5 4.3 7 6.0 5 4.3 8 6.9 Tacoma 25 6.6 35 9.2 13 3.4 24 6.3 University Place 3 * 3 * 0 * 0San Juan 1 * 1 * 0 * 0 *Skagit 14 9.6 14 9.6 1 * 4 * Anacortes 1 * 1 * 0 * 1 Mount Vernon 5 9.0 5 9.0 1 * 2 *Skamania 0 * 0 * 0 * 0Snohomish 56 6.3 72 8.0 22 2.5 32 3.6 Edmonds 0 * 1 * 1 * 1 * Everett 17 7.5 19 8.3 3 * 7 3.1 Lynnwood 10 9.7 12 11.6 3 * 3 * Marysville 6 8.4 7 9.7 3 * 4 * Monroe 4 * 4 * 0 * 0 * Mountlake Terrace 2 * 3 * 1 * 1 Mukilteo 0 * 1 * 1 * 2Spokane 37 6.6 52 9.2 17 3.0 34 6.1 Spokane (city) 25 7.3 36 10.4 11 3.2 19 5.5 Spokane Valley 2 * 3 * 1 * 5 8.4Stevens 4 * 6 13.2 3 * 4 *Thurston 16 6.1 20 7.6 8 3.1 16 6.1 Lacey 3 * 3 * 0 * 2 * Olympia 4 * 5 5.2 3 * 7 7.3Wahkiakum 0 * 0 * 0 * 0Walla Walla 6 8.3 8 11 2 * 5 6.9 Walla Walla (city) 3 * 4 * 1 * 2 *Whatcom 8 3.8 11 5.2 7 3.3 9 4.2 Bellingham 5 5.4 7 7.5 5 5.4 6 6.5Whitman 3 * 3 * 0 * 1 Pullman 1 * 1 * 0 * 1Yakima 31 7.4 46 10.9 20 4.8 30 7.2 Yakima (city) 11 6.5 19 11.2 10 5.9 14 8.31 Fetal death ratio = fetal deaths per 1,000 live births.2 Perinatal mortality rate = fetal deaths plus deaths to infants within first 6 days of life per 1,000 live births plus fetal deaths.3 Neonatal mortality rate = deaths to infants within first 27 days of life per 1,000 live births.4 Infant mortality rate = deaths to infants under one year of age per 1,000 live births.
Washington State Vital Statistics 2005 123
*
*
*
8.1
*
*
*
*
**
*
**
* Rate or ratio not calculated because number of deaths was less than 5.

Washington State Vital Statistics 2005 124
G. Fetal Death Fetal death data includes cases where the fetus shows no sign of life at delivery. Fetal death has also been called ‘stillbirth.’ Only fetal deaths of 20 or more weeks’ gestation are required to be reported to the state. Thus, data for early fetal losses are not included in this report. Fetal deaths complete the picture: together with births and early infant deaths they are used to describe the perinatal period (i.e., the period surrounding the delivery). Mortality Table G1. Selected Causes of Fetal Deaths for Residents, 1996- 2005
Year Number Ratio1 Number Ratio1 Number Ratio1 Number Ratio1 Number Ratio1
1996 462 5.9 51 0.7 142 1.8 208 2.7 58 0.71997 457 5.8 43 0.6 144 1.8 186 2.4 80 1.01998 471 5.9 57 0.7 148 1.9 209 2.6 55 0.71999 468 5.9 52 0.7 125 1.6 213 2.7 77 1.02000 437 5.4 53 0.7 141 1.7 191 2.4 51 0.62001 418 5.3 52 0.7 116 1.5 185 2.3 62 0.82002 434 5.5 56 0.7 134 1.7 180 2.3 63 0.82003 498 6.2 74 0.9 149 1.9 184 2.3 84 1.02004 432 5.3 74 0.9 114 1.4 151 1.8 85 1.02005 519 6.3 59 0.7 171 2.1 191 2.3 94 1.1
Note:
Other Perinatal Conditions Congenital Anomalies
1Ratio per 1,000 live births.
Complications of Placenta, Cord, & Membranes: ICD-9: 762; ICD-10: P02Other Perinatal Conditions: ICD-9: 760,763-771.2,771.4-779; ICD-10: P00,P03-P96Congenital Anomalies: ICD-9: 740-759; ICD-10: Q00-Q99
Total All Causes
Causes of death were coded with ICD-9 through 1998 and with ICD-10 beginning 1999. Comparabiliy ratios to adjust for the change in classification are not available for fetal death causes. ICD codes are:
Maternal Complications of Pregnancy: ICD-9: 761; ICD-10: P01
Fetus Affected by Maternal Complications
of Pregnancy
Complications of Placenta, Cord, &
Membrane
Fetal death ratios have fluctuated overtime. The 2005 ratio (6.3) is higher than in the past decade; however the 2004 ratio (5.3) is consistent with previous levels. Data for future years will show if this is just another fluctuation or part of an overall trend. Trends in cause-specific fetal death ratios generally parallel the all-cause trend.
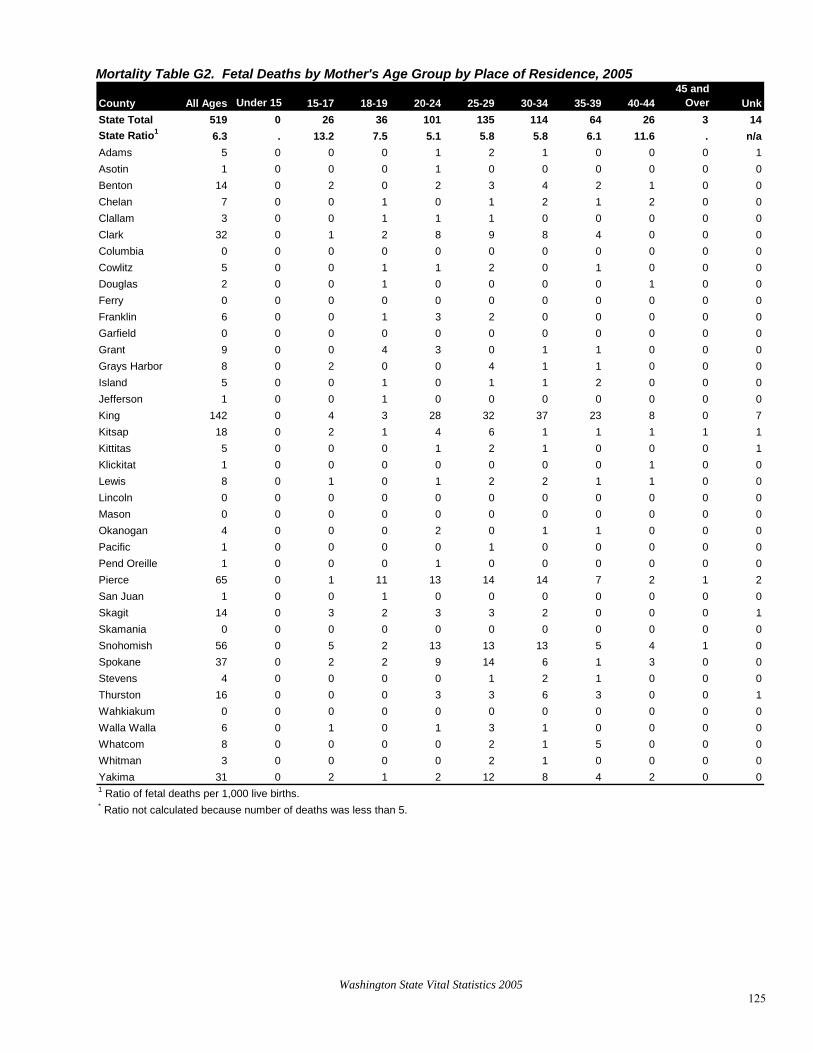
Washington State Vital Statistics 2005 125
Mortality Table G2. Fetal Deaths by Mother's Age Group by Place of Residence, 2005
County All Ages Under 15 15-17 18-19 20-24 25-29 30-34 35-39 40-4445 and
Over UnkState Total 519 0 26 36 101 135 114 64 26 3 14State Ratio1 6.3 . 13.2 7.5 5.1 5.8 5.8 6.1 11.6 . n/aAdams 5 0 0 0 1 2 1 0 0 0 1Asotin 1 0 0 0 1 0 0 0 0 0 0Benton 14 0 2 0 2 3 4 2 1 0 0Chelan 7 0 0 1 0 1 2 1 2 0 0Clallam 3 0 0 1 1 1 0 0 0 0 0Clark 32 0 1 2 8 9 8 4 0 0 0Columbia 0 0 0 0 0 0 0 0 0 0 0Cowlitz 5 0 0 1 1 2 0 1 0 0 0Douglas 2 0 0 1 0 0 0 0 1 0 0Ferry 0 0 0 0 0 0 0 0 0 0 0Franklin 6 0 0 1 3 2 0 0 0 0 0Garfield 0 0 0 0 0 0 0 0 0 0 0Grant 9 0 0 4 3 0 1 1 0 0 0Grays Harbor 8 0 2 0 0 4 1 1 0 0 0Island 5 0 0 1 0 1 1 2 0 0 0Jefferson 1 0 0 1 0 0 0 0 0 0 0King 142 0 4 3 28 32 37 23 8 0 7Kitsap 18 0 2 1 4 6 1 1 1 1 1Kittitas 5 0 0 0 1 2 1 0 0 0 1Klickitat 1 0 0 0 0 0 0 0 1 0 0Lewis 8 0 1 0 1 2 2 1 1 0 0Lincoln 0 0 0 0 0 0 0 0 0 0 0Mason 0 0 0 0 0 0 0 0 0 0 0Okanogan 4 0 0 0 2 0 1 1 0 0 0Pacific 1 0 0 0 0 1 0 0 0 0 0Pend Oreille 1 0 0 0 1 0 0 0 0 0 0Pierce 65 0 1 11 13 14 14 7 2 1 2San Juan 1 0 0 1 0 0 0 0 0 0 0Skagit 14 0 3 2 3 3 2 0 0 0 1Skamania 0 0 0 0 0 0 0 0 0 0 0Snohomish 56 0 5 2 13 13 13 5 4 1 0Spokane 37 0 2 2 9 14 6 1 3 0 0Stevens 4 0 0 0 0 1 2 1 0 0 0Thurston 16 0 0 0 3 3 6 3 0 0 1Wahkiakum 0 0 0 0 0 0 0 0 0 0 0Walla Walla 6 0 1 0 1 3 1 0 0 0 0Whatcom 8 0 0 0 0 2 1 5 0 0 0Whitman 3 0 0 0 0 2 1 0 0 0 0Yakima 31 0 2 1 2 12 8 4 2 0 01 Ratio of fetal deaths per 1,000 live births.* Ratio not calculated because number of deaths was less than 5.

Washington State Vital Statistics 2005 126
Mortality Table G3. Fetal Deaths for Residents by Cause, 2005 Cause with ICD-10 Code NumberAll causes1 519Perinatal conditions (P00-P96) 421 Fetus Affected by Maternal Conditions (P00)2 (33) Maternal Hypertensive Disorders (P00.0) 17 Maternal Injury (P00.5) 2 Other Maternal Conditions (P00.1-P00.4,P00.6-P00.9) 14 Fetus Affected by Maternal Complications of Pregnancy (P01) (59) Incompetent Cervix (P01.0) 8 Premature Rupture of Membranes (P01.1) 44 Multiple Pregnancy (P01.5) 2 Other (P01.2-P01.4,P01.6-P01.9) 5 Fetus Affected by Complications of Placenta, Cord & Membrane (P02) (171) Other Forms of Placental Separation & Hemorrhage (P02.1) 37 Other Morphological & Functional Abnormalities of Placenta (P02.2) 25 Placental Transfusion Syndrome (P02.3) 14 Other Compression of Umbilical Cord (P02.5) 44 Other & Unspecified Conditions of Umbilical Cord (P02.6) 21 Chorioamnionitis (P02.7) 21 Other (P02.0,P02.4,P02.8-P02.9) 9 Fetus Affected by Complications of Labor & Delivery (P03) 2 Fetus Affected by Noxious Influences Via Placenta (P04) 8 Slow Fetal Growth & Fetal Malnutrition (P05) 2 Disorders Related to Short Gestation, Low Birth Weight (P07) 12 Disorders Related to Long Gestation & High Birth Weight (P08) 1 Birth Trauma (P10-P15) 0 Intrauterine Hypoxia and Birth Asphyxia (P20-P21) 0 Fetal Hemorrhage (P50-P54) 3 Hydrops Fetalis Due to Hemolytic Disease (P56) 0 Transitory Endocrine & Metabolic Disorders (P70-P74) 13 Fetal Death of Unspecified Cause (P95) 108 All other (P22-P26,P28,P30-P49,P55,P57-P69,P75-P94,P96) 9Congenital Malformations & Chromosomal Abnormalities (Q00-Q99) 94 Congenital Malformations of Nervous System (Q00-Q07) (25) Anencephaly & Similar Malformations (Q00) 8 Other (Q01-Q07) 17 Congenital Malformations of Heart (Q20-Q24) 12 Congenital Malformations of Urinary System (Q60-Q64) 5 Congenital Malformations Musculoskeletal & Integument (Q65-Q85) 13 Chromosomal Abnormalities Not Elsewhere Classified, (Q90-Q99) (28) Down's Syndrome (Q90) 5 Edward's Syndrome (Q91.0-Q91.3) 10 Other (Q91.4-Q99) 13 Other (Q08-Q18,Q25-Q56,Q86-Q89) 11All Other Causes (A00-O00,R00-R99,V01-V84) 41 Group totals are shown in bold.2 Sub-group totals are shown in parentheses.

Mortality Table G4. Fetal Deaths by Weight and Sex for Residents, 2005 Weight in Grams Total Male Female Unknown
State Totals 519 268 247 4Under 250 26 13 13 0250 - 499 103 66 37 0500 - 749 72 34 38 0750 - 999 33 14 19 01,000 - 1,499 24 13 11 01,500 - 1,999 25 16 9 02,000 - 2,499 36 19 17 02,500 - 2,999 45 19 26 03,000 - 3,499 17 5 12 03,500 - 3,999 15 9 6 04,000 - 4,499 12 9 3 04,500 and over 5 3 2 0Unknown 106 48 54 4
Washington State Vital Statistics 2005 127


Washington State Vital Statistics 2005
Marriage

Washington State Vital Statistics 2005 130
Marriage The Washington State Marriage Certificate System gathers information about each marriage that occurs in Washington State. The information on the marriage certificate is provided by the couple themselves and the officiant. The filing of marriage certificates at the state level began in 1968. The main purposes of the marriage system are: 1) to provide a legal record of the marriage; and 2) to collect information on population trends, especially in regards to the age and location of the participants.

Washington State Vital Statistics 2005 131
Table 1. Marriages by County of Occurrence and County of Residence¹, 2005
County Number Rate2, 3 Number Rate2 Number Rate2
State Total 40,802 6.5 37,579 6.0 37,158 5.9Adams 124 7.3 102 6.0 105 6.2Asotin 99 4.7 51 2.4 56 2.7Benton 987 6.2 861 5.4 852 5.4Chelan 820 11.8 439 6.3 429 6.2Clallam 481 7.2 370 5.5 372 5.6Clark 2,431 6.2 2,180 5.6 2,076 5.3Columbia 23 5.6 20 4.9 19 4.6Cowlitz 695 7.2 574 6.0 585 6.1Douglas 116 3.3 193 5.6 189 5.4Ferry 40 5.4 22 3.0 21 2.8Franklin 368 6.1 356 5.9 359 5.9Garfield 12 5.0 10 4.2 10 4.2Grant 431 5.4 455 5.8 435 5.5Grays Harbor 568 8.1 437 6.3 418 6.0Island 648 8.5 511 6.7 566 7.4Jefferson 261 9.5 137 5.0 138 5.0King 11,642 6.4 11,144 6.2 10,943 6.1Kitsap 1,654 6.9 1,483 6.2 1,497 6.2Kittitas 236 6.4 255 7.0 258 7.0Klickitat 125 6.4 91 4.7 93 4.8Lewis 482 6.7 461 6.4 455 6.4Lincoln 68 6.7 46 4.6 47 4.7Mason 390 7.5 306 5.9 311 6.0Okanogan 298 7.5 179 4.5 192 4.8Pacific 219 10.3 118 5.5 120 5.6Pend Oreille 77 6.3 44 3.6 48 3.9Pierce 5,564 7.4 5,217 6.9 5,325 7.0San Juan 368 23.7 81 5.2 78 5.0Skagit 876 7.9 690 6.2 669 6.0Skamania 151 14.7 40 3.9 40 3.9Snohomish 3,340 5.1 3,892 5.9 3,851 5.9Spokane 2,263 5.2 2,129 4.9 2,072 4.7Stevens 212 5.1 178 4.3 189 4.6Thurston 1,544 6.9 1,499 6.7 1,432 6.4Wahkiakum 33 8.5 17 4.4 24 6.2Walla Walla 367 6.4 302 5.3 282 4.9Whatcom 1,257 7.0 1,192 6.6 1,147 6.3Whitman 151 3.6 180 4.2 173 4.1Yakima 1,381 6.0 1,317 5.7 1,282 5.6Tribal Authority * * * * * *
_ _ _ _ _ _Out of State * * 3,223 * 3,644 *Unknown
Occurrence Wife's Residence Husband's Residence
1 Does not include marriages to Washington residents performed in other states or countries.2 Rates per 1,000 population. 3 Exceptionally high rates by county of occurrence may reflect unique local circumstances, such as highly desirable locations for weddings. See pages 5-6 for a discussion of occurrence rates.
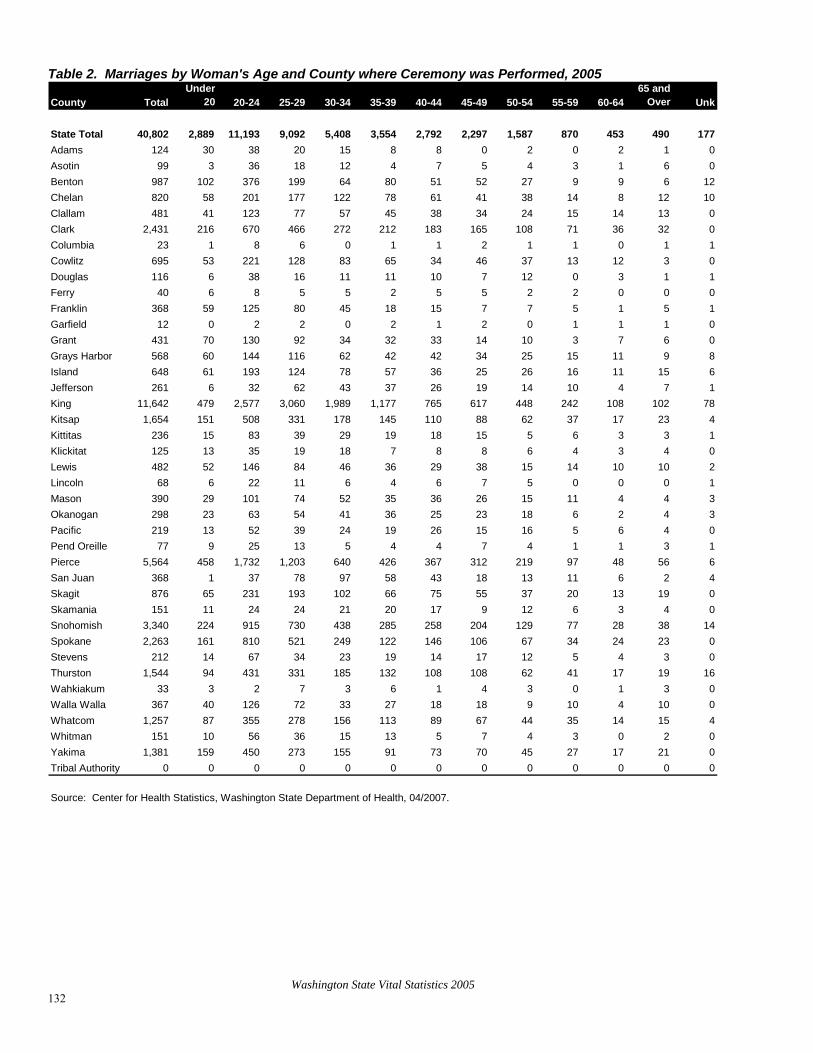
Washington State Vital Statistics 2005 132
Table 2. Marriages by Woman's Age and County where Ceremony was Performed, 2005
County TotalUnder
20 20-24 25-29 30-34 35-39 40-44 45-49 50-54 55-59 60-6465 and
Over Unk
State Total 40,802 2,889 11,193 9,092 5,408 3,554 2,792 2,297 1,587 870 453 490 177Adams 124 30 38 20 15 8 8 0 2 0 2 1 0Asotin 99 3 36 18 12 4 7 5 4 3 1 6Benton 987 102 376 199 64 80 51 52 27 9 9 6 12Chelan 820 58 201 177 122 78 61 41 38 14 8 12 10Clallam 481 41 123 77 57 45 38 34 24 15 14 13Clark 2,431 216 670 466 272 212 183 165 108 71 36 32 0Columbia 23 1 8 6 0 1 1 2 1 1 0 1Cowlitz 695 53 221 128 83 65 34 46 37 13 12 3 0Douglas 116 6 38 16 11 11 10 7 12 0 3 1 1Ferry 40 6 8 5 5 2 5 5 2 2 0 0Franklin 368 59 125 80 45 18 15 7 7 5 1 5 1Garfield 12 0 2 2 0 2 1 2 0 1 1 1Grant 431 70 130 92 34 32 33 14 10 3 7 6 0Grays Harbor 568 60 144 116 62 42 42 34 25 15 11 9 8Island 648 61 193 124 78 57 36 25 26 16 11 15 6Jefferson 261 6 32 62 43 37 26 19 14 10 4 7King 11,642 479 2,577 3,060 1,989 1,177 765 617 448 242 108 102 78Kitsap 1,654 151 508 331 178 145 110 88 62 37 17 23 4Kittitas 236 15 83 39 29 19 18 15 5 6 3 3 1Klickitat 125 13 35 19 18 7 8 8 6 4 3 4 0Lewis 482 52 146 84 46 36 29 38 15 14 10 10 2Lincoln 68 6 22 11 6 4 6 7 5 0 0 0 1Mason 390 29 101 74 52 35 36 26 15 11 4 4Okanogan 298 23 63 54 41 36 25 23 18 6 2 4Pacific 219 13 52 39 24 19 26 15 16 5 6 4 0Pend Oreille 77 9 25 13 5 4 4 7 4 1 1 3 1Pierce 5,564 458 1,732 1,203 640 426 367 312 219 97 48 56 6San Juan 368 1 37 78 97 58 43 18 13 11 6 2 4Skagit 876 65 231 193 102 66 75 55 37 20 13 19Skamania 151 11 24 24 21 20 17 9 12 6 3 4 0Snohomish 3,340 224 915 730 438 285 258 204 129 77 28 38 14Spokane 2,263 161 810 521 249 122 146 106 67 34 24 23 0Stevens 212 14 67 34 23 19 14 17 12 5 4 3 0Thurston 1,544 94 431 331 185 132 108 108 62 41 17 19 16Wahkiakum 33 3 2 7 3 6 1 4 3 0 1 3Walla Walla 367 40 126 72 33 27 18 18 9 10 4 10Whatcom 1,257 87 355 278 156 113 89 67 44 35 14 15 4Whitman 151 10 56 36 15 13 5 7 4 3 0 2 0Yakima 1,381 159 450 273 155 91 73 70 45 27 17 21Tribal Authority 0 0 0 0 0 0 0 0 0 0 0 0
Source: Center for Health Statistics, Washington State Department of Health, 04/2007.
0
0
1
0
0
1
33
0
00
00

Table 3. Marriages by Man's Age and County where Ceremony was Performed, 2005
County TotalUnder
20 20-24 25-29 30-34 35-39 40-44 45-49 50-54 55-59 60-6465 and
Over Unk
State Total 40,802 1,111 9,114 9,411 6,173 4,343 3,139 2,601 1,910 1286 762 872 80Adams 124 9 44 27 15 12 7 2 4 1 1 2Asotin 99 1 29 24 8 8 6 8 4 2 4 5Benton 987 38 331 228 120 75 47 46 51 21 15 13 2Chelan 820 24 157 191 124 92 72 59 40 19 18 19 5Clallam 481 15 105 88 71 38 40 37 20 24 22 21Clark 2,431 93 537 532 320 236 198 162 128 120 50 54 1Columbia 23 1 5 7 2 1 2 1 1 0 0 3Cowlitz 695 17 196 140 85 64 58 54 32 26 13 10 0Douglas 116 1 31 19 16 9 6 7 13 6 6 2 0Ferry 40 4 4 6 7 3 4 4 3 5 0 0Franklin 368 20 124 97 43 25 21 13 9 10 1 5 0Garfield 12 0 2 2 2 0 1 1 0 3 0 1Grant 431 29 134 76 60 52 22 23 12 6 8 8 1Grays Harbor 568 23 101 137 79 74 40 37 28 16 12 19 2Island 648 25 173 138 90 69 33 33 26 23 14 24 0Jefferson 261 1 27 48 39 46 29 26 10 11 12 12King 11,642 140 1,870 2,897 2,168 1,515 970 721 561 363 199 201 37Kitsap 1,654 55 470 352 212 148 125 90 80 45 40 35 2Kittitas 236 4 72 54 26 26 15 13 7 10 7 2Klickitat 125 3 32 21 20 13 5 5 7 6 5 8Lewis 482 20 122 105 62 37 48 24 23 12 7 21 1Lincoln 68 1 21 11 9 1 11 6 4 2 1 1 0Mason 390 7 81 85 62 38 36 32 20 13 10 5Okanogan 298 10 46 59 55 30 34 26 15 9 3 9Pacific 219 7 36 42 26 26 26 17 17 11 4 7Pend Oreille 77 6 20 14 9 4 5 6 4 1 5 3 0Pierce 5,564 221 1,443 1,247 768 527 410 364 248 135 91 101 9San Juan 368 0 24 63 87 63 42 33 18 21 11 5 1Skagit 876 21 185 201 131 95 57 57 50 26 22 30Skamania 151 2 23 19 20 18 13 25 7 12 6 6 0Snohomish 3,340 78 770 760 507 355 275 222 151 98 51 69 4Spokane 2,263 69 667 573 297 165 146 118 94 62 28 44 0Stevens 212 7 55 51 15 19 17 16 10 9 8 5Thurston 1,544 40 352 358 196 156 110 108 80 69 33 32 10Wahkiakum 33 1 3 5 5 4 2 2 4 0 3 4Walla Walla 367 21 102 96 41 19 22 19 12 13 6 16Whatcom 1,257 25 282 289 180 139 94 89 69 38 23 29 0Whitman 151 3 46 38 20 14 8 7 6 4 2 3Yakima 1,381 69 392 311 176 127 82 88 42 34 21 38 1Tribal Authority 0 0 0 0 0 0 0 0 0 0 0 0
00
0
0
0
0
0
00
120
1
0
00
0
0
Washington State Vital Statistics 2005 133


Washington State Vital Statistics 2005
Divorce
Washington State Vital Statistics 2005 136
Divorce
The Washington State Divorce Certificate System gathers information about each dissolution, annulment, or legal separation that is finalized in Washington State. These certificates may come from any superior court or tribal court in the state. The clerk of the court forwards the divorce certificate to the Center upon finalization of the decree. The clerk of the court or the legal counsel for the person requesting the divorce can complete the information on the certificate. The filing of divorce certificates at the state level began in 1968.
The main purposes of the divorce system are 1) to provide a brief, legal record of the event; and 2) to collect information on population trends.
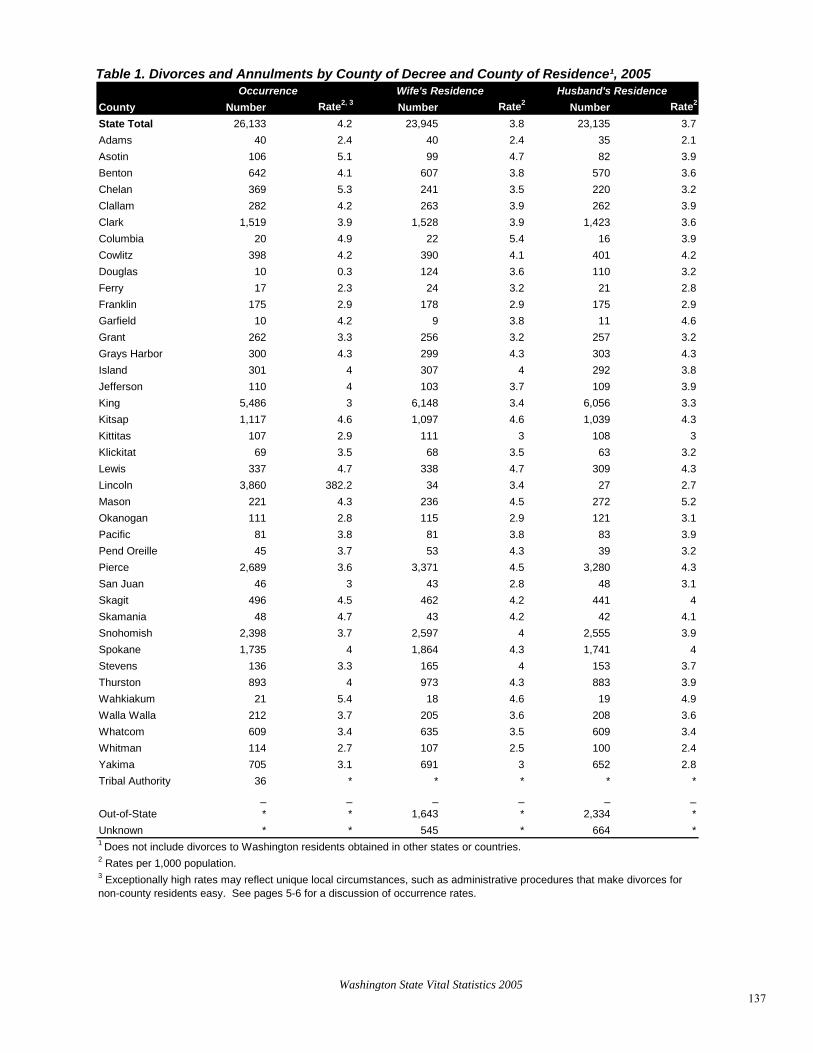
Washington State Vital Statistics 2005 137
Table 1. Divorces and Annulments by County of Decree and County of Residence¹, 2005
County Number Rate2, 3 Number Rate2 Number Rate2
State Total 26,133 4.2 23,945 3.8 23,135 3.7Adams 40 2.4 40 2.4 35 2.1Asotin 106 5.1 99 4.7 82 3.9Benton 642 4.1 607 3.8 570 3.6Chelan 369 5.3 241 3.5 220 3.2Clallam 282 4.2 263 3.9 262 3.9Clark 1,519 3.9 1,528 3.9 1,423 3.6Columbia 20 4.9 22 5.4 16 3.9Cowlitz 398 4.2 390 4.1 401 4.2Douglas 10 0.3 124 3.6 110 3.2Ferry 17 2.3 24 3.2 21 2.8Franklin 175 2.9 178 2.9 175 2.9Garfield 10 4.2 9 3.8 11 4.6Grant 262 3.3 256 3.2 257 3.2Grays Harbor 300 4.3 299 4.3 303 4.3Island 301 4 307 4 292 3.8Jefferson 110 4 103 3.7 109 3.9King 5,486 3 6,148 3.4 6,056 3.3Kitsap 1,117 4.6 1,097 4.6 1,039 4.3Kittitas 107 2.9 111 3 108 3Klickitat 69 3.5 68 3.5 63 3.2Lewis 337 4.7 338 4.7 309 4.3Lincoln 3,860 382.2 34 3.4 27 2.7Mason 221 4.3 236 4.5 272 5.2Okanogan 111 2.8 115 2.9 121 3.1Pacific 81 3.8 81 3.8 83 3.9Pend Oreille 45 3.7 53 4.3 39 3.2Pierce 2,689 3.6 3,371 4.5 3,280 4.3San Juan 46 3 43 2.8 48 3.1Skagit 496 4.5 462 4.2 441 4Skamania 48 4.7 43 4.2 42 4.1Snohomish 2,398 3.7 2,597 4 2,555 3.9Spokane 1,735 4 1,864 4.3 1,741 4Stevens 136 3.3 165 4 153 3.7Thurston 893 4 973 4.3 883 3.9Wahkiakum 21 5.4 18 4.6 19 4.9Walla Walla 212 3.7 205 3.6 208 3.6Whatcom 609 3.4 635 3.5 609 3.4Whitman 114 2.7 107 2.5 100 2.4Yakima 705 3.1 691 3 652 2.8Tribal Authority 36 * * * * *
_ _ _ _ _Out-of-State * * 1,643 * 2,334 *Unknown * * 545 * 664 *
2 Rates per 1,000 population. 3 Exceptionally high rates may reflect unique local circumstances, such as administrative procedures that make divorces for non-county residents easy. See pages 5-6 for a discussion of occurrence rates.
Occurrence Wife's Residence Husband's Residence
1 Does not include divorces to Washington residents obtained in other states or countries.
_

Washington State Vital Statistics 2005 138
Table 2. Divorces, Annulments, and Legal Separations by County of Decree, 2005 County Total Divorce Annulment Legal Separation1
State Total 26,133 24,928 1205 889Adams 40 40 0 1Asotin 106 95 11 0Benton 642 603 39 12Chelan 369 336 33 7Clallam 282 282 0 11Clark 1,519 1,505 14 55Columbia 20 20 0 1Cowlitz 398 367 31 2Douglas 10 9 1 0Ferry 17 17 0 0Franklin 175 151 24 2Garfield 10 10 0 0Grant 262 234 28 6Grays Harbor 300 250 50 5Island 301 300 1 6Jefferson 110 110 0 5King 5,486 5,215 271 231Kitsap 1,117 920 197 55Kittitas 107 103 4 2Klickitat 69 66 3 0Lewis 337 274 63 8Lincoln 3,860 3,802 58 81Mason 221 220 1 9Okanogan 111 110 1 1Pacific 81 80 1 3Pend Oreille 45 45 0 1Pierce 2,689 2,638 51 119San Juan 46 45 1 5Skagit 496 459 37 14Skamania 48 48 0 2Snohomish 2,398 2,235 163 69Spokane 1,735 1,650 85 75Stevens 136 127 9 4Thurston 893 888 5 47Wahkiakum 21 21 0 0Walla Walla 212 212 0 4Whatcom 609 593 16 22Whitman 114 114 0 1Yakima 705 698 7 22Tribal Authority 36 36 0 11Since legal separations are not final dissolutions of marriage they are excluded from the total.

Washington State Vital Statistics 2005 139
Table 3. Divorces and Annulments by Wife's Age and County of Decree, 2005
County TotalUnder
20 20-24 25-29 30-34 35-39 40-44 45-49 50-54 55-59 60-6465 and
Over Unk
State Total 26,133 107 2,229 3,761 4,102 4,183 4,027 3,212 2,118 1151 469 360 414Adams 40 0 1 7 7 8 6 3 1 2 2 2 1Asotin 106 2 8 10 18 17 23 12 7 5 2 1 1Benton 642 3 83 97 105 98 104 64 45 19 15 5 4Chelan 369 5 30 45 69 52 57 56 25 10 8 5Clallam 282 2 32 39 34 32 47 32 27 13 7 6 1Clark 1,519 8 86 206 264 242 265 184 122 71 36 18 17Columbia 20 1 0 4 6 2 4 1 0 2 0 0 0Cowlitz 398 0 25 61 72 69 52 45 38 17 7 11Douglas 10 0 1 0 4 1 1 1 1 0 0 0 1Ferry 17 1 1 2 4 1 4 1 2 0 1 0 0Franklin 175 0 16 33 31 25 23 21 10 8 2 3Garfield 10 0 0 1 1 2 4 0 0 2 0 0 0Grant 262 2 32 43 34 43 38 29 13 13 6 7Grays Harbor 300 1 28 36 40 50 52 40 27 11 7 4Island 301 1 55 64 42 32 37 26 18 15 5 3Jefferson 110 0 4 16 11 15 18 12 17 9 2 3 3King 5,486 8 277 724 877 958 862 723 528 272 98 69 90Kitsap 1,117 15 151 163 129 162 171 132 105 50 18 10 11Kittitas 107 1 10 16 11 16 14 14 13 6 3 2Klickitat 69 0 3 7 9 13 8 13 8 3 2 1Lewis 337 1 40 52 48 53 54 42 22 10 6 7Lincoln 3,860 12 347 599 649 622 578 470 272 162 61 50 38Mason 221 1 23 32 28 38 28 28 15 11 4 8Okanogan 111 0 16 14 16 12 15 13 10 11 2 0 2Pacific 81 0 5 9 10 21 13 8 3 5 4 1 2Pend Oreille 45 0 4 8 4 6 9 3 5 3 1 2 0Pierce 2,689 17 286 426 417 425 398 314 193 95 43 33 42San Juan 46 0 2 4 3 5 9 12 6 3 2 0 0Skagit 496 2 39 75 77 74 63 69 49 20 10 15Skamania 48 0 4 4 7 5 11 5 6 1 0 2 3Snohomish 2,398 11 171 298 358 406 396 324 177 103 29 32 93Spokane 1,735 7 215 270 294 246 252 174 135 71 30 20 21Stevens 136 0 14 13 16 21 23 22 13 6 5 2Thurston 893 2 80 139 141 143 124 116 79 35 9 16 9Wahkiakum 21 0 2 3 5 3 0 2 1 1 2 2 0Walla Walla 212 1 14 32 36 36 27 23 23 6 7 3Whatcom 609 2 47 74 77 95 92 92 54 44 18 6Whitman 114 0 13 23 19 15 20 12 4 4 3 1Yakima 705 1 62 106 121 112 121 72 43 29 11 10 17Tribal Authority 36 0 2 6 8 7 4 2 1 3 1 0 2
71
1
3
243
122
5
3
1
480
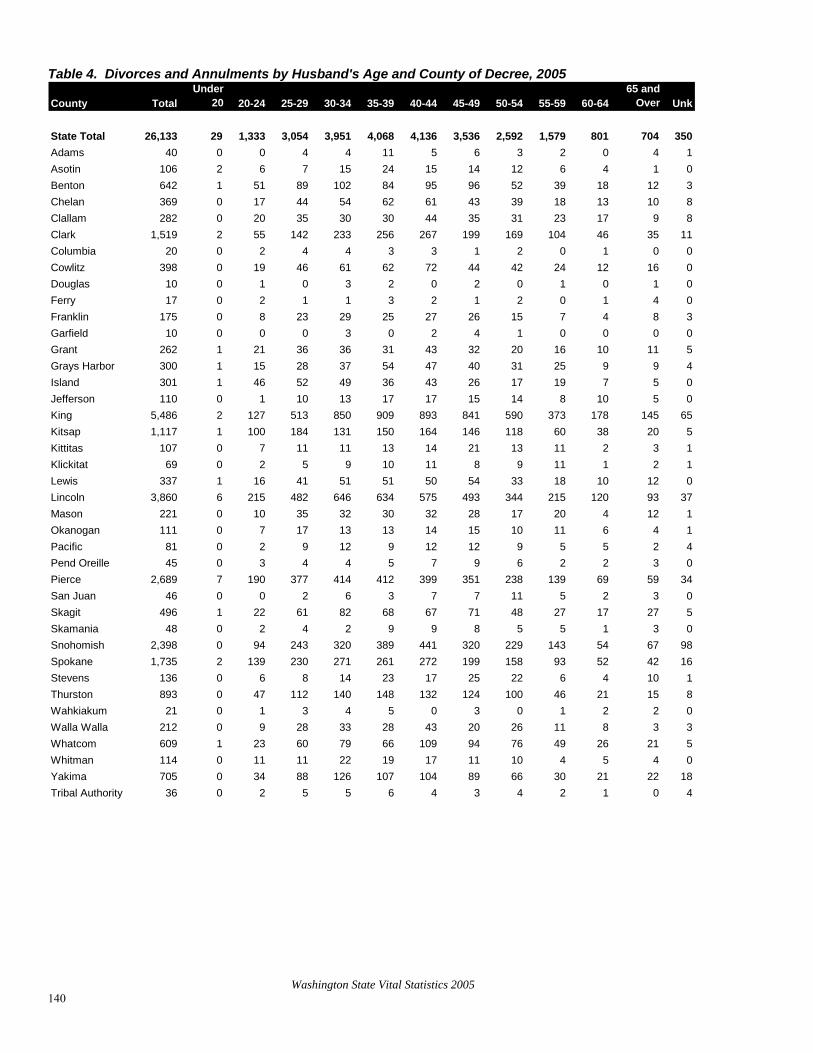
Washington State Vital Statistics 2005 140
Table 4. Divorces and Annulments by Husband's Age and County of Decree, 2005
County TotalUnder
20 20-24 25-29 30-34 35-39 40-44 45-49 50-54 55-59 60-6465 and
Over Unk
State Total 26,133 29 1,333 3,054 3,951 4,068 4,136 3,536 2,592 1,579 801 704 350Adams 40 0 0 4 4 11 5 6 3 2 0 4Asotin 106 2 6 7 15 24 15 14 12 6 4 1Benton 642 1 51 89 102 84 95 96 52 39 18 12 3Chelan 369 0 17 44 54 62 61 43 39 18 13 10Clallam 282 0 20 35 30 30 44 35 31 23 17 9Clark 1,519 2 55 142 233 256 267 199 169 104 46 35 11Columbia 20 0 2 4 4 3 3 1 2 0 1 0Cowlitz 398 0 19 46 61 62 72 44 42 24 12 16Douglas 10 0 1 0 3 2 0 2 0 1 0 1Ferry 17 0 2 1 1 3 2 1 2 0 1 4Franklin 175 0 8 23 29 25 27 26 15 7 4 8 3Garfield 10 0 0 0 3 0 2 4 1 0 0 0Grant 262 1 21 36 36 31 43 32 20 16 10 11Grays Harbor 300 1 15 28 37 54 47 40 31 25 9 9Island 301 1 46 52 49 36 43 26 17 19 7 5Jefferson 110 0 1 10 13 17 17 15 14 8 10 5 0King 5,486 2 127 513 850 909 893 841 590 373 178 145 65Kitsap 1,117 1 100 184 131 150 164 146 118 60 38 20 5Kittitas 107 0 7 11 11 13 14 21 13 11 2 3 1Klickitat 69 0 2 5 9 10 11 8 9 11 1 2Lewis 337 1 16 41 51 51 50 54 33 18 10 12Lincoln 3,860 6 215 482 646 634 575 493 344 215 120 93 37Mason 221 0 10 35 32 30 32 28 17 20 4 12Okanogan 111 0 7 17 13 13 14 15 10 11 6 4 1Pacific 81 0 2 9 12 9 12 12 9 5 5 2Pend Oreille 45 0 3 4 4 5 7 9 6 2 2 3Pierce 2,689 7 190 377 414 412 399 351 238 139 69 59 34San Juan 46 0 0 2 6 3 7 7 11 5 2 3Skagit 496 1 22 61 82 68 67 71 48 27 17 27Skamania 48 0 2 4 2 9 9 8 5 5 1 3Snohomish 2,398 0 94 243 320 389 441 320 229 143 54 67 98Spokane 1,735 2 139 230 271 261 272 199 158 93 52 42 16Stevens 136 0 6 8 14 23 17 25 22 6 4 10Thurston 893 0 47 112 140 148 132 124 100 46 21 15 8Wahkiakum 21 0 1 3 4 5 0 3 0 1 2 2Walla Walla 212 0 9 28 33 28 43 20 26 11 8 3 3Whatcom 609 1 23 60 79 66 109 94 76 49 26 21 5Whitman 114 0 11 11 22 19 17 11 10 4 5 4Yakima 705 0 34 88 126 107 104 89 66 30 21 22 18Tribal Authority 36 0 2 5 5 6 4 3 4 2 1 0
10
88
0000
0540
10
1
40
050
1
0
0
4

Table 5. Divorces and Annulments by Number of Children¹ and County of Wife's Residence², 2005 County Total 0 1 2 3 4 + UnknownState Total 26,133 12,487 5,356 5,422 1,842 657 369Adams 40 13 8 12 4 3 0Asotin 99 45 18 23 10 3 0Benton 607 255 148 139 44 17 4Chelan 241 105 46 59 25 6 0Clallam 263 120 46 56 23 15 3Clark 1,528 649 323 359 140 34 23Columbia 22 8 5 8 1 0 0Cowlitz 390 177 90 87 28 8 0Douglas 124 52 24 30 10 7 1Ferry 24 10 5 6 0 1 2Franklin 178 66 42 34 16 16 4Garfield 9 4 1 3 0 1 0Grant 256 114 54 50 22 10 6Grays Harbor 299 140 71 63 15 10 0Island 307 163 63 51 22 6 2Jefferson 103 50 23 17 9 1 3King 6,148 3,134 1,166 1,257 385 121 85Kitsap 1,097 499 234 241 82 26 15Kittitas 111 40 27 27 12 1 4Klickitat 68 28 9 21 6 3 1Lewis 338 136 76 70 37 12 7Lincoln 34 15 7 8 3 1 0Mason 236 119 46 47 13 9 2Okanogan 115 52 21 25 9 7 1Pacific 81 37 17 16 7 3Pend Oreille 53 29 7 9 6 2 0Pierce 3,371 1,548 767 705 225 93 33San Juan 43 24 10 5 4 0 0Skagit 462 210 98 94 41 14 5Skamania 43 20 8 11 2 0 2Snohomish 2,597 1,191 527 595 187 57 40Spokane 1,864 853 417 394 144 43 13Stevens 165 84 33 30 10 6 2Thurston 973 433 229 215 64 20 12Wahkiakum 18 10 2 5 1 0 0Walla Walla 205 91 45 41 17 10 1Whatcom 635 288 124 130 58 18 17Whitman 107 52 20 24 8 3 0Yakima 691 264 153 162 68 31 13Out-of-State 1,643 1059 256 216 59 26 27Unknown 545 300 90 77 25 13 401Certificate of dissolution records, "Children born alive of this marriage." All children are counted regardless of age.2Does not include residents who obtain divorces or annulments outside of Washington State.3Unknowns are higher and divorces with no children appear lower in 1999 than in prior years since cases in which the number of children was not reported were previously entered as "none" rather than "unknown."
3
1
Washington State Vital Statistics 2005 141


Appendices
Washington State Vital Statistics 2005

Appendix A. Technical Appendix Interpreting Vital Statistics Washington State Vital Statistics presents commonly used vital statistics data. These data are intended for a variety of users ranging from the beginner to the sophisticated analyst. This section is intended primarily to help those who may not entirely understand how to use vital statistics data or are not aware of data limitations, especially limitations due to small numbers. Reading this section may help beginning users avoid drawing incorrect conclusions from the data. For other users, this section may serve as a review. Vital statistics pertain to basic events of life collected from mandated certificates: birth, fetal death, death, marriage, and divorce. They provide powerful indicators of health problems and, therefore, can help track progress toward health improvement goals. They can also provide information on what health problems occur, who may have these problems, and when and where they occur. Unfortunately, vital statistics cannot usually tell us why health problems occur, which is what prevention programs really need to know. It is a common mistake to think that if two data items are associated or correlated (such as age of mother and low birth weight), then one causes the other. In reality, this could be a chance association (if you look at enough variables you usually find some relationship) or both items could be associated with a third, unmeasured factor (such as poverty or poor nutrition). Mortality statistics are sometimes used as indicators of disease conditions within the population. They are very limited in this capacity, however, especially for illnesses that are not usually classified as the underlying cause of death. Hospital inpatient data from the Comprehensive Hospital Abstract Reporting System (CHARS) provide a somewhat better measure of morbidity, but even these data are limited to conditions that result in a hospital admission. Trend Analysis We conducted tests of trend to determine whether rates were increasing, decreasing, or staying the same over time. For these analyses, we used the “joinpoint” methodology developed by the National Cancer Institute. Information on this method is available at http://srab.cancer.gov/joinpoint. Trend analysis for mortality data was complicated by changes in coding death certificates effective in 1999. For some causes of death, data before 1999 are not comparable to data from 1999 and later. In the Vital Statistics
Washington State Vital Statistics 2005 144

2005, we conducted formal trend analysis for two time periods using the death data for 1980 through 1998 separately from data for 1999 through 2005. (See Changes in Classification of Causes of Death section for more details.) Spatial Clustering Clusters presented on maps were based on a spatial scan statistical test that looks at all the possible combinations of adjacent census tracts and identifies any grouping of areas that have significantly more cases or deaths than expected. The methodology and software (SaTScan) was developed under contract for the US National Cancer Institute. (http://www.satscan.org/) For these analyses, we combined data for 2001-2005 by preparing counts by census tract. The counts for mortality were prepared by 10 year age groups and gender. Population by census tract, age and gender was obtained from Population Estimates: Washington State Department of Health, Vista Partnership, Krupski Consulting; Washington State Population Estimates for Public Health. October 2004. Frequently asked Questions: Residence vs. Occurrence What's the difference between residence and occurrence? Users may notice that tables contain tabulations in two ways: 1) by residence (where the person lived) or 2) by occurrence (where the event occurred). For example, a woman who lived in Olympia (Thurston County) but had her baby in Seattle (King County) would be counted in Thurston County on a residence table and in King County on an occurrence table. The Center for Health Statistics actually registers only those vital events occurring in Washington State. However, because of an interstate exchange agreement, we receive data on Washington residents who have babies in another state, or who die in another state. Thus we have complete records on births, deaths and fetal deaths for residents of Washington State regardless of where the event took place. Some users may be tempted to add residence and occurrence figures together to get a total for an area, but this would not be correct. There is a great deal of overlap between these two ways of counting, as most residents of a county have their babies or die in the same county. Other users try to subtract residence and occurrence data to figure out how many residents are born or die outside of their county, but this is also incorrect. The only way to determine where county residents are having babies or dying is to tabulate births or deaths by place of residence relative to place of occurrence. For
Washington State Vital Statistics 2005 145

births, one may use Natality Table C8 of this report which cross-tabulates the mother’s county of residence by the county in which the birth occurred. For deaths, please refer to Mortality Table A7-a, which shows deaths by residence and occurrence by county and city. When should residence or occurrence data be used? Users generally need data about the residents of an area. Residents would be the target audience for any local health assessment or health promotion programs. Population figures, commonly used to calculate rates, are also based on a person's residence. Hospital planners might want to know both (where births occurred to residents of their area) so they can assess possible markets. For certain events, particularly external causes of death such as motor vehicle accidents or drowning, prevention programs might instead want to know where the event occurred so they can identify potentially hazardous situations or areas. Unfortunately, there is no population base to use for calculating occurrence rates, which might tell if the numbers are unusually high or low. For example, a rural road might have a high number of motor vehicle accidents relative to the number of people living there, but there may be many more people driving that road on their way to work, so there would be more people at risk of getting in accidents. The size of particular events and occurrences vary, so population must always be considered when looking at occurrence data. Numbers vs. Crude or Age-Adjusted Rates When should numbers or rates be used? All tables in this report give the number of events (e.g., the number of Washington residents dying of cancer). These numbers are used to determine the size of a problem in any area (e.g., how many people die of cancer) or to estimate population changes due to birth and death. But, using just numbers, we cannot readily compare two areas or two time periods. Such comparisons should take the size of the population into account to avoid erroneous conclusions. To eliminate the effect of different sized populations, we compare rates. A rate is the number of vital events (such as deaths) in a specified time period divided by the number of people at risk of these events in that period (typically, a state or county population, or the number of births in the case of infant death). This figure is generally multiplied by a constant such as 1,000 or 100,000 to get a number that is easy to read and compare and is reported as “per 1,000” or “per 100,000.” Rates calculated in this manner are called crude rates. They adjust for differences in population size but not differences in population characteristics. These population characteristics also need to be considered in interpreting comparisons. For example, since death rates increase with
Washington State Vital Statistics 2005 146

increasing age, a county with an older population may have higher death rates just because its population is older. To compare rates and see if a particular county’s death rate is high just because of its older population, we need to use age-adjusted death rates. These rates are computed by taking a county's death rates for each age group and applying them to a standard population. The traditional standard has been the 1940 US population. However, in 1999 the standard changed and is now the 2000 US population (see Anderson, RN, and Rosenberg, HM. Age standardization of death rates: implementation of the year 2000 standard. National Center for Health Statistics. National Vital Statistics Report 3 (47), 1998, or Klein,RJ and Schoenborn, CA. Age Adjustment Using the 2000 Projected U.S. Population. CDC Statistical Notes, No.20, January, 2001.). The year 2000 population has a higher concentration of population in the age groups between 35 to 44 years and 65 and over. The population of age 65 years and over almost doubled during this period. Since age-adjusted rates using 2000 population give more weight to older age groups, the magnitude of age-adjusted rates using this standard will change considerably. Age-adjusted death rates describe what a particular county's death rate would be if it had the same age distribution as the standard population. The major use of age-adjusted death rates is to allow comparisons among different areas and/or over various periods of time. Users should be aware that an age-adjusted death rate has no absolute meaning; it is an artificial number based on a hypothetical population and is only useful for comparing with other rates calculated in the same manner. While age adjustment is the most common method for adjusting rates, a similar process can be used to adjust for other characteristics such as sex, education, or birth weight. Although reports often focus on which population has the highest rate, one should remember that rates can mask differences in numbers that may be needed for policy decisions. For example, the infant mortality rate is considerably higher for many people of color than for whites. However, due to the state’s racial composition, most infants who die in this state are white and examining the rate for all infants might mask information of a particular race or ethnicity. To reduce racial disparity, one would focus on reducing infant mortality among people of color. Such a reduction, however, would not necessarily have much effect on the state’s overall infant mortality rate. So, to determine the burden of a health problem in a community, numbers rather than rates are usually the most appropriate measure. Standards for Comparison of Rates What are good standards for comparison of rates? To help interpret a particular rate, one may choose to compare it to rates for another county or similar geographical area, national or state data, or an independent goal or
Washington State Vital Statistics 2005 147

standard. Such issues as comparability of population characteristics and stability of rates from year to year for the standard population should be considered when choosing a base for comparison. In comparing rates from different sources, users should be sure that the same methods and definitions were used to calculate the rates. Otherwise, the rates are not truly comparable and may lead to incorrect conclusions. Some questions to ask might be: Are the rates crude or adjusted? Are they for the same time period? Is the definition of what constitutes an event the same? Are the same coding definitions used? Is the completeness of reporting events similar? Are the denominators taken from the same or similar data sources? Unknowns Most vital statistics data are not 100% complete. Sometimes the information is not (or cannot be) collected, and then the item is reported as unknown. How should unknowns be handled? When the number of unknowns for a particular characteristic is large, it can affect rates or percentage distributions based on that characteristic. For example, in 2005, father’s education was missing for about 17% of the births. How should unknowns be handled in calculating percentages? If we include unknowns in the total, the percent in any category is smaller than it would be if we subtract unknowns from the total. For example, in the case of 2005 births, the percent of fathers with less than a high school education is 13.6% if unknowns are included in the total, but is 16.4% if unknowns are excluded from the total. In deciding which method offers a “truer” representation of the population as a whole one needs to consider whether the cases with an unknown characteristic are similar to or different from those cases in which the characteristic is known. If it appears likely that the cases with the unknown characteristic are similar to those with the known values, then “unknowns” should be excluded from the total and percentages should be based on the “known” population. To the extent that this assumption seems unlikely, then other methods could be invoked to distribute the cases with unknown values. Assumptions about the probable characteristics of the population with a given unknown attribute could be based on: 1) greater familiarity with local situations by persons in the county or city health community; or 2) on more in-depth analysis of the source of the unknowns in the reporting system. For example, if only a few hospitals or medical facilities fail to report a particular variable, one might examine information about the population served by those particular facilities or those living in the nearby community.
Washington State Vital Statistics 2005 148

Changes in Classification of Causes of Death (ICD-10) Beginning with deaths occurring in January 1999, the United States began using International Classification of Diseases (ICD-10) to classify causes of death reported on death certificates. ICD-9 had been used during 1979-1998. Implementation of ICD-10 has had an important impact on the presentation and interpretation of mortality statistics by cause-of-death. The change to ICD-10 created a discontinuity in trends that must be accounted for when comparing mortality during 1999 and later to prior years. To put it another way, cause-of-death data for 1999 and later years are not comparable to prior years, unless adjustments are made for the coding and classification changes. Without adjustment, it is impossible to know whether an observed increase or decrease in deaths due to a particular cause is “real” or merely the result of the changes in classification and coding. Some of the differences between ICD-10 and ICD-9 are:
• ICD-10 is far more detailed and has about 8,000 categories compared to ICD-9 with about 5,000 categories.
• ICD-10 uses 4-digit alphanumeric codes that begin with a letter compared to ICD-9 which has 4-digit numeric codes.
• Additional chapters have been added and some have been rearranged. For example, myelodysplastic syndromes have been moved into the neoplasm chapter which has caused an increase in the number of benign neoplasms and neoplasms of uncertain or unknown behavior.
• Tabulation lists with groups of ICD codes have changed. More conditions are included in the lists used to determine leading causes of death and some of the groups of conditions have changed. For example, accidents and adverse effects were combined in ICD-9 tabulation lists. With ICD-10, accidents and adverse effects are now in separate categories.
• Coding rules for causes of death have changed. For example, pneumonia is now considered a direct sequel of more conditions which has led to a 30% decrease in pneumonia as an underlying cause-of-death.
To enable comparisons across the ICD-9 to ICD-10 transition, a preliminary comparability study was carried out by the National Center for Health Statistics (NCHS). NCHS double-coded a large sample of the 1996 national mortality file, once by ICD-9, and again by ICD-10. A comparability ratio was then calculated by dividing the number of deaths for a selected cause of death classified by ICD-10 by the number of deaths classified to the most nearly comparable cause of death by ICD-9. The resulting ratio can be used to adjust counts and rates for a given cause of death classified by ICD-9 so they are comparable to those for the most
Washington State Vital Statistics 2005 149

similar cause classified by ICD-10. The ratio will also allow users to estimate the extent of the discontinuity of the change to ICD-10 by showing the net effect of coding and classification changes. The National Center for Health Statistics (NCHS) has published its final comparability study based on the complete national mortality file to supercede the preliminary comparability study. The NCHS Study is published, and is noted on the CHS update website at http://www.doh.wa.gov/EHSPHL/CHS/CHS-Data/main.htm . Calculations: In order to compare rates or counts coded by ICD-9 with rates or counts coded by ICD-10, multiply the ICD-9 count or rate by the cause specific comparability ratio. The Center for Health Statistics produced an additional report Washington State Vital Statistics ICD-10 Supplement, 1990-1999 (See: http://www.doh.wa.gov/ehsphl/chs/chs-data/public/sup90_99.pdf ). This report provides more information about ICD-10 and includes tables with comparability ratios and tables with counts and age-adjusted mortality rates for 1990-1999. For example, there were 1,717 deaths due to pneumonia and influenza to residents of Washington State in 1998 (ICD-9 480-487). In 1999, 1,257 residents of Washington State died due to pneumonia and influenza (ICD-10 J10-J18). Comparing these counts leads to a conclusion that there was a very large drop in deaths due to pneumonia and influenza. This conclusion is incorrect: By multiplying the 1998 count of 1,717 by the comparability ratio of 0.70, the resulting comparability modified number of deaths in 1998 would be 1,202. Comparing the modified count in 1998 of 1,202 to the ICD-10 count in 1999 of 1,257 shows an increase of only 55 deaths from 1998 to 1999 instead of a large decrease. Small Numbers How should small numbers be handled? If the state collects all births and deaths in a year, then aren't the birth and death rates exactly as calculated? It's certainly true that vital statistics are not based on samples of the population, as many research data are. We do know the actual number of births, deaths, and population (assuming complete reporting of events), so we can calculate an exact birth or death rate for any one year. However, the data may still be affected by random fluctuations in the number of events between successive measurements (e.g., for different years). The effect of such random fluctuations on birth or death rates is proportionately larger when the number of events is small. For example, one more infant death has a larger numerical impact on an area with three deaths than it does on an area with 300 deaths. Because of these random fluctuations, the rates based on small numbers may not be as reliable as those
Washington State Vital Statistics 2005 150

based on larger numbers in the sense that they may have limited predictive value. Specifically, knowing one year's rate in such instances may not allow one to reliably anticipate the rate for another year. This instability makes it difficult to use the rates for program planning or assessment purposes. In fact, considerable caution should be used in interpreting any data where the number of events is small. There are no hard and fast rules as to when numbers are too small for rates to be stable predictors of what's happening. However, the Washington State Department of Health Guidelines for Working with Small Numbers call for suppressing calculation of rates when the number of events is less than five. In addition, tables should include a footnote indicating that rates based on fewer than 20 events are likely to be unstable and imprecise. To increase the stability of the rate, one can combine several years of data (as long as there is no strong temporal trend in rates) or one can group several counties in the same geographic area or with similar population characteristics. For more help in using small numbers consult the Data Guidelines at http://www.doh.wa.gov/Data/guidelines/SmallNumbers.htm. Data Quality How does data quality affect the use of the data? Conclusions and health policy decisions are only as good as the data that go into making them. Vital statistics data quality has three major components: completeness, accuracy, and timeliness. Are vital statistics complete, i.e., do we have a record for each vital event? According to National Center for Health Statistics (NCHS) studies, registration of births and deaths is currently better than 99% complete. However, some records come in after the data files are prepared and thus are not included in the data presented in this report. In addition to determining the completeness of a reporting system, researchers are often concerned with the degree to which people report what is actually happening. This characteristic of the data is called its validity. Studies of validity of reporting systems like the birth certificate system usually look for an independent source of the information and determine the consistency with data contained in the reporting system. To improve data quality, both birth and death certificates are edited for accuracy of the data. Where possible, data are checked to see if they are within a reasonable range of values (e.g., mother's age must be 8-59, with warning notices for ages less than 14 or greater than 49). Data are also checked to see if there is internal consistency between items (e.g., a person is not expected to have more than one year of college education if he/she is less than 16 years old). Those who complete death certificates are queried if there is not enough information to establish an accurate and specific cause of death.
Washington State Vital Statistics 2005 151
A factor that affects the completeness of the data is the number of unknowns among responses. Sometimes providers do not complete all items on a certificate. The information may be overlooked or refused by the informant, or the informant may not have been asked for the data. Missing data decrease the overall accuracy of an item because we don't know where they fit (e.g., are smokers less likely to respond to a question on smoking?). Periodic data quality analyses are done to help identify facilities with large amounts of missing data. These facilities are queried for more information. In order to help improve data completeness, the Center for Health Statistics recently developed a web-based method to provide feedback on data completeness to each birth hospital and also works intensively with the facilities throughout the year to help them improve their data collection procedures. Finally, are vital statistics timely, i.e., are they registered early enough so that the data are available when needed to be most useful for planning and program assessment purposes? There is often a tradeoff between timeliness and accuracy. For example, if birth certificates are filed quickly, there may not be enough time for malformations or complications to become evident. Similarly, if death certificates are filed quickly, there may not be time for autopsy results to be incorporated into the cause of death data. Despite the potential benefits of waiting for complete information, the main thrust, particularly for birth certificates, is to streamline the reporting process and to gather and report information as close to the event as possible. This has been accomplished by the Center for Health Statistics primarily by the development of the Electronic Birth Certificate System. Confidentiality How do we ensure confidentiality of the data? All of the data in this report are presented in aggregate form so that individuals are not likely to be identified from the tables. However, it is important for potential data users to be aware of confidentiality issues related to the data. The medical and health information on birth and fetal death certificates is confidential and is to be used only in aggregate statistics which do not enable the identification of specific individuals. Hence, such confidential data may not be linked to any identifying information except for research projects approved by the Washington State Institutional Review Board of the Department of Social and Health Services and the Department of Health. The sample birth and fetal death certificates in Appendix G delineate the portion that is confidential. Some death data (particularly causes of death such as suicide and AIDS), while not confidential by law, are extremely sensitive. It is the responsibility of all data users to treat these data in such a way as to respect and protect the privacy of individuals who have provided information about their personal lives, to be used for the good of the public. To ensure
Washington State Vital Statistics 2005 152

continued reporting of important demographic, medical, and health information, data must be handled in a way that ensures the privacy of individuals as required by law. Sources of Data Collection Year Data for Washington State Vital Statistics, 2005 are compiled from items on birth, death, fetal death, marriage, and dissolution certificates received before extraction of the annual data files from the database files in 2006. The tables in this report will therefore not reflect any changes made to the database files after the extraction date. (See Appendix F for samples of certificate forms used.) Population Population estimates in this report are from the Washington State Office of Financial Management, Forecasting Division, Intercensal and Postcensal Estimates of County Population by Age and Sex: 1980-2005, August 2006. Classification of Data Classification and coding of data on Washington State vital records follow National Center for Health Statistics (NCHS) guidelines as defined in Vital Statistics Instruction Manuals, parts 1-20 (Published by U.S. Department of Health and Human Services, Public Health Service, Centers for Disease Control and Prevention, National Center for Health Statistics, Hyattsville, Maryland). Demographics Age The death certificate contains fields for reported age at death and also birth and death dates, which are used to calculate age at death. Where there is a discrepancy between the reported and calculated ages, the county (and ultimately the funeral director) is queried and most of the discrepancies are resolved. For the remaining discrepancies, where there is a difference of one year, the calculated age is used for age at death (which assumes that the informant made an arithmetic error). Where there is a difference of more than one year, the reported age is used.
Washington State Vital Statistics 2005 153

For infant deaths (<1 year), age is measured in minutes, hours, days, or months. Some certificates may report a primary and secondary age, e.g., 1 month 2 weeks. This report uses only the primary age (e.g., 1 month). The secondary age (e.g., 2 weeks) is dropped off, so the infant's age is truncated at the primary age category. Race Race data collected on vital statistics follow the definition established by the Census Bureau, as follows:
The concept of race as used by the Census Bureau reflects self-identification; it does not denote any clear-cut scientific definition of biological stock. The data for race represents self-classification by people according to the race with which they most closely identify. Furthermore, it is recognized that the categories of the race item include both racial and national origin or socio-cultural groups.
Until 2003, birth and death certificates used open-ended reporting of race, allowing for multiple racial entries. As of 2003, race on birth and fetal death certificates is collected by a series of check boxes, according to rules established by the US Office of Management and Budget and used in the collection of the 2000 Census Data. (See ‘Birth Data Notes’ for more discussion.) Beginning January 1, 2004, the same convention was applied to race data captured by death certificates. Reporting of race on birth certificates is based on information provided by the mother. Reporting of race on death certificates is sometimes based on observing the decedent, rather than questioning the next of kin. This procedure causes an underestimate of deaths for certain groups, particularly Native Americans, some of the Asian subgroups, and Hispanics. Thus, death rates based on death certificate data are lower than true death rates for these groups. Because the denominator for infant mortality rates uses the race at birth, the most accurate race-specific infant mortality rates come from linked birth-infant death data files, where the mother’s race can be used for both the numerator and the denominator. In this report, Mortality Table F6 tabulates data by the mother’s race/ethnicity.
Washington State Vital Statistics 2005 154
Hispanic Origin “Origin” as used by the Census Bureau refers to “the ancestry, nationality group, lineage, or country of birth of the person or the person's parents or ancestors before their arrival in the United States.” Persons of Hispanic Origin have their origins in a Hispanic or Spanish-speaking country such as Mexico, Cuba, or Puerto Rico, or the Spanish-speaking countries of Central or South America. Persons of Hispanic Origin may be of any race. The certificates for live births, deaths, and fetal deaths in Washington State capture Hispanic Origin under two separate items, one to measure ethnicity and another to measure race. The item measuring ethnicity asks, [Is the person] "Of Hispanic Origin or descent (Ancestry)?" and permits a "Yes/No" response. The item measuring race on the birth and fetal death certificates says, "Race (American Indian, White, Black, Asian/Pacific Islander (Specify subgroup), etc.). On the death certificate, the item reads, "Race (Specify)." Beginning in 1992, “Hispanic” was no longer listed as a sample response under "Race.” Nonetheless, some people do report Hispanic Origin under the race item on birth, death, and fetal death certificates. To capture this information, separate codes are used to record Hispanic responses when provided under race, and this information is available on data files provided by the Center for Health Statistics. The National Center for Health Statistics (NCHS), however, does not treat Hispanic Origin as a race and requires instead that persons reporting Hispanic as a race be counted as "White." Tables in this report use this NCHS convention for tabulations by race. In addition, at the end of each table on race, counts of persons identified as "Hispanic Origin" under the ethnicity item are provided as well. County of Residence The county of residence data reported by the informant was verified by a process called geocoding using software that identifies county based on street address. When the reported county differed from the one assigned through geocoding, the address was located on a base map and the correct county was assigned to the record. In the rare instances in which a post office box was given as the address, the reported county of residence was retained since the software cannot assign county without a street address. Geocoding has been done since 1987 for births, deaths, and fetal deaths. Geocoding could not be done prior to 1987 because address information was not available for many records in those years. The county of residence assigned through geocoding matched the county originally reported by the informant in all but about 0.4% of the records. Most of the differences occurred in areas where zip codes cross county
Washington State Vital Statistics 2005 155
boundaries. It is likely that some informants in this situation may be less sure of whether an address is in one county or the other. In most instances where differences were found, the geocoded county was determined to be correct and, in these instances, it was used in place of the reported county. The differences amounted to very small proportions of births or deaths in the affected counties. In the few instances when the county or city of residence or occurrence is unknown, the county/city is imputed using NCHS guidelines. For place of occurrence, if the county is known but the city is not, the place of occurrence is set to the rural county value (no defined city). If both county and city are unknown, the place of occurrence is set to the county and city of occurrence of the previous record. For place of residence, if the county is known but the city is not, the place of residence is set to the rural county value. If both county and city of residence are unknown but the event occurred in Washington, the place of residence is set to the county/city of occurrence. If both county and city of residence are unknown and the event occurred outside Washington, the place of residence is set to the largest city in the state (Seattle). City of Residence A city is given a separate code in the vital statistics system only if it has a population of at least 2,500. Vital events in cities smaller than 2,500 are assigned a place of residence code that represents other small and rural areas of a county, termed “balance of county.” Because of space considerations, only vital statistics for cities of 15,000 population or more are published in this report. Population estimates and information on the incorporation of cities provided by the Washington State Office of Financial Management are used to establish which cities meet the 2,500 minimum population criteria for receiving a separate place of residence code. New codes are implemented in January of each year based on population estimates and municipal incorporations published in the preceding year. Thus, an area that was incorporated in 1990 with a population of at least 2,500 would be coded as a distinct place of residence and would have separate vital statistics beginning with 1991 published data. The city of residence assigned for a record is based on whether or not the person lived within city limits using responses to an item on the certificate: “Inside city limits - yes/no.” If the response to this item is “yes,” “unknown,” or blank, the place of residence is assigned to the reported city. If the response is “no,” the place of residence is assigned a “balance of county” code. Reporting on this item has been found to be somewhat unreliable when compared to locating addresses within city boundaries using geocoding software. For city of occurrence there is no
Washington State Vital Statistics 2005 156

“inside city limits” item to use for coding. If a city is given on the certificate, the event is coded as occurring within city limits of that city. However, if the place of occurrence lists a rural road, state park, or other remote location, the place of occurrence is coded to “balance of county.” Birth Data Notes Changes for 2003+ data The 2003 birth certificate changed considerably, compared to earlier certificates. These changes can affect comparability with data tables from previous years. The effect of the changes on specific items is discussed below. Note on unknowns Only some of the states have adopted the new birth certificate form. The other states continue to use the old certificate form. Therefore, items which were added or significantly revised in 2003 will most likely not have data for Washington residents who gave birth in another state. These unknowns will show up in residence data but not occurrence data. Body Mass Index (BMI) The 2003 certificate collected data on mother’s height for the first time. This addition made calculation of the Body Mass Index (BMI) possible. The BMI is a measure of weight for height. The formula for calculating BMI is: BMI = 703.1 x (prepregnancy weight in lb / square of height in inches). For analysis, Body Mass Index is generally grouped as follows: Underweight (<18.5), Normal (18.5 – 24.9), Overweight (25.0 – 29.9), and Obese (30.0 and above). For the birth database, BMI is only calculated where both the prepregnancy weight and the height is given; otherwise it is unknown. Education Before 2003, the mother was asked to report the highest grade completed in years of education (e.g., 16 for college graduate). The 2003 certificate instead provided a series of check boxes for her to report the highest level of education completed at the time of delivery. The check boxes include degrees completed rather than years of schooling. The item is now clearer and easier to complete. The previous format tended to overestimate high school graduation because the mother could not report that she had 12 years of education without getting a degree. Thus, the percent of mothers without a high
Washington State Vital Statistics 2005 157

school degree is expected to increase somewhat, as is seen in Natality Table A1. Gestational Age, Calculated The gestational age in weeks is calculated by subtracting the date of last normal menses from the birth date, dividing by 7 and truncating the result to eliminate decimal places. If the menses day is missing but the month and year are present, a value of ‘15’ is used for the day. In earlier years, if the menses month and/or year were missing or the calculated gestational age was beyond a reasonable range (<18 or >45 weeks), the gestational age was estimated from the child’s birth weight. Currently, if the menses month and/or year is missing or the calculated age is out of range, the clinical estimate is used as the ‘calculated’ gestational age. If the clinical estimate is also out of range or unknown, the calculated age is unknown. This change makes the Washington State data consistent with national data but not with data published in earlier versions of this report. Gestational ages have now been recalculated by this method for 1980-2002 data. The Center for Health Statistics web site has corrected gestational age tables (see the Introduction to this report for instructions on how to access the web site). Maternal Smoking This item has undergone wording and placement changes over time. Note that data may not be comparable before and after the change.
• 1984-88: Used wording 'Smoking at any time during the pregnancy' and placed in the middle section of the certificate, which the mother generally completes from a worksheet.
• 1989: Changed wording to 'Tobacco use during pregnancy' (which could include smokeless tobacco) and relocated to the bottom of the certificate, which is generally completed by the physician. The percentage of missing data increased from 4% in 1984 to 13% in 1989, possibly as a result of this change.
• 1992: Changed back to original wording and placement on the certificate
• 2003: Item revised to collect average number of cigarettes per day three months before pregnancy and by trimester during pregnancy, but placement not changed.
For Tables B1, B2, and B3 in this report, smoking is defined as smoking during any trimester. Past data tables used the item ‘smoking at any time during pregnancy’ which is likely to be fairly comparable to the 2003+ data. Table B4 now reports the actual smoking data by trimester.
Washington State Vital Statistics 2005 158
Method of Delivery Before 2003, the method of delivery was selected by the data provider from a list of possible methods. This list just gave common methods with no hierarchy assumed by the order of the methods on the list. The data provider could check all methods that apply, although it was rare to have more than two methods given (<0.4% of births). For earlier reports, the method of delivery was determined by the following algorithm: If there was a second method given and it was a ‘higher technology’ or more invasive method, it was assigned as the method of delivery. Otherwise, the first method was used. Thus, for example, if both vaginal and forceps were reported, forceps was the method chosen. Starting in 2003, the method of delivery section was revised so that the data provider reports only the final route and method of delivery. This final route and method is used in Tables C1 and C6. Month Prenatal Care Began In previous years, the mother or prenatal care provider reported the month of pregnancy in which the mother began prenatal care (e.g., 1st, 2nd, etc). As of 2003, this item was replaced by the exact dates of first and last prenatal visit. Thus, the month prenatal care began is now calculated from the menses date and the date of first prenatal care visit. Unfortunately, because the exact dates are harder to get, the month prenatal care began now has high rates of missing data. For the 2003 report, there was an error in the way month care began was calculated. The program has been corrected for prenatal care tables in this report (Natality Tables C1, C2, C3, and C4). This change more than doubled the number of births where the mother had no prenatal care. The Center for Health Statistics web site has corrected prenatal care tables for 2003 (see the Introduction to this report for instructions on how to access the web site). Race As noted earlier, the race item was revised from an open-ended question to a check box format which allows multiple races to be reported. In this report, race is tabulated in two ways: a. Single race data, which is used to compare with previous years’ data. To get these data, the multiple race data are bridged back to a single race by the National Center for Health Statistics (NCHS). The bridging method uses National Health Interview Survey data to estimate what multiracial people are likely to report if they could only report a single race. See
Washington State Vital Statistics 2005 159

http://www.cdc.gov/nchs/about/major/dvs/popbridge/popbridge.htm for details on the bridging process. Single race data are used in Natality Tables A1, A2a, A13a, and D2a. b. Multiple race data, which includes all races reported by the mother. The reported race data are edited by NCHS to remove duplicate entries. See http://www.cdc.gov/nchs/data/dvs/multiple_race_docu_5-10-04.pdf for details. The Center for Health Statistics (CHS) has done further recoding to group the races into the five basic groups and to create single fields for the mother’s and father’s races with a code for each possible race combination. Multiple race data are used in Tables A2b, A13b, and D2b. Death Certificate Items: The race and education items changed with the 2004 Washington State implementation of the U.S. Standard Certificate of Death. See the Birth Data Notes above for further discussion. Cause of Death The causes of death presented in this report are classified in accordance with the International Classification of Diseases, Tenth Revision published by the World Health Organization. The State of Washington began using this revision on January 1, 1999. More information about the change to the new revision can be found in the introduction. According to the National Center for Health Statistics, more than 99% of all deaths occurring in the United States are registered in the death certificate system. The accuracy of reporting specific causes of death may vary since classification of disease conditions is a medical-legal opinion subject to the best information available to the physician, medical examiner, or coroner certifying the cause of death. Underlying Cause Of Death Tabulated causes of death in this report are based on the underlying cause of death. The underlying cause of death is defined as “(a) the disease or injury which initiated the train of events leading directly to death or (b) the circumstances of the accident or violence which produced the fatal injury.” International (World Health Organization) rules are used to determine the underlying cause of death using data supplied by the certifier in the “cause of death” and “other significant conditions” sections of the death certificate.
Washington State Vital Statistics 2005 160

Information from other sources is used to supplement the cause of death data on the certificate to determine a more precise or more accurate cause of death. The following sources are used:
1. Queries: For about 8% of records, the certifier of the cause of death is asked for additional information because the cause of death data given is inaccurate, incomplete, or non-specific. About 93-98% of these queries are returned. The underlying cause of death may change minimally or substantially as a result of these queries. Query standards change over time, which can affect trends in cause of death and death rates for Washington compared to other states or to the United States.
2. State Patrol: The Washington State Patrol provides information on motor vehicle accidents which is used to refine or add a more complete cause of death for these deaths, particularly related to whether the decedent was the driver or a passenger.
3. Gun Surveillance: In many gun-related deaths, the gun is removed from the scene so the cause of death cannot be coded to the specific type of gun involved (such as handgun or rifle). Beginning in 1995, cause of death data have been supplemented with information on type of gun from a statewide reporting system for gun-related deaths operated by the Department of Health’s Injury Prevention Program. Beginning in 1999, cause of death information for legal intervention was updated using the gun surveillance data.
4. Labor and Industries (L&I): For injury deaths, the death certificate asks whether the injury occurred at work or not. This item is sometimes open to interpretation as to whether the injury occurred in the course of the person’s work or not. Beginning with 1996, death certificate data are supplemented with results of L&I investigations of work-related injuries.
Cause of Death Groupings Due to the detailed nature of this classification system, it is common to group ICD codes into more general categories for analysis and comparison purposes. The National Center for Health Statistics (NCHS) provides one of the most commonly used classification systems in which causes of deaths for adults are grouped into 113 separate groups and deaths for infants into 130 groups. NCHS groupings were used throughout this report with the exception of Mortality Section E which follows guidelines from the NCHS International Collaborative Effort (ICE) on Injury Statistics.
Washington State Vital Statistics 2005 161

Maternal Death Maternal deaths are those for which a maternal condition (ICD-9 codes 630-676 and ICD-10 codes O00-O99) is given as the underlying cause of death. The World Health Organization defines a maternal death as:
The death of a woman while pregnant or within 42 days of termination of pregnancy, irrespective of the duration and the site of the pregnancy, from any cause related to or aggravated by the pregnancy or its management but not from accidental or incidental causes.
With ICD-10, an additional category was added for late maternal death (>42 days and > 1 year after termination of pregnancy). A death will be coded as maternal only if the death certificate notes pregnancy or a maternal condition. In 1979-1988, Washington State supplemented reported maternal deaths with results from a special study. Death certificates for women ages 15-44 were linked to birth/fetal death certificates to see if the woman had a delivery within 42 days of the death. If so, the cause of death was examined to see if the death could have been related to the pregnancy. This special study added an average of two maternal deaths per year, a substantial change because only about three deaths per year are reported as maternal. In 1990-1996, deaths to Washington resident women were linked to births, fetal deaths and obstetric hospitalizations within 365 days prior to death. Information from the linkages was provided to the Department of Health Maternal and Child Health Office. Three perinatologists, an obstetrician and an epidemiologist reviewed the information available on each death from the death certificate, birth/fetal death certificate and hospitalization information. All linked deaths were considered pregnancy-associated deaths (deaths which occurred within 365 days of pregnancy regardless of cause) and were further classified as to pregnancy-related (deaths caused by pregnancy or by condition exacerbated by pregnancy) or not. Deaths considered not pregnancy-related included all deaths due to cancer, injury, or deaths with a vague or indefinite cause. Deaths due to epilepsy or seizures, deep vein thrombosis, infection, or intracerebral hemorrhage if they occurred ≥ 42 days post delivery were also considered not pregnancy-related. Deaths considered pregnancy-related included deaths due to deep vein thrombosis, pneumonia or aneurysm that occurred during pregnancy or less than 42 days post delivery. Cardiovascular deaths within three months of delivery, and deaths due to epilepsy/seizures or infection that occurred within 42 days of delivery were considered on a case by case basis.
Washington State Vital Statistics 2005 162
The 2004 Washington State implementation of the U.S. Standard Certificate of Death introduced a standard question format with categories designed to utilize additional codes available in ICD–10 for deaths associated with pregnancy, childbirth, and the puerperium. A separate pregnancy status item on the death certificate may result in the identification of more maternal deaths.
Place of Death This item changed with the new 2004 death certificate. The worksheet includes a new check box for “Hospice Facility”, changed “In transit “to “Dead on arrival”; changed “nursing Home to Nursing home/long term Care; changed “Home” to “Decedent’s Home”. The new check boxes will provide clarity. Adding hospice care and long-term care facility reflects changes in types of care. Disposition A check box for “entombment” was added to the death certificate in 2004 for method of disposition. This new category is reflected in mortality table B3. Marital Status A new category was added to the marital status item on the 2004 death certificate. A check box for “separated” is now included as an option. This new category is listed in mortality table A5. Perinatal Death The perinatal period covers times shortly before and after birth. Thus, perinatal death includes both fetal and infant deaths. Perinatal death rates are generally more consistent between different sources than infant or fetal death rates because they eliminate the effect of judgments as to whether the fetus was alive at time of delivery. However, there are at least four definitions of perinatal death, using different combinations of fetal death, gestational age, and infant age at death. This report uses the following definition from the National Center for Health Statistics: “fetal deaths of 20 or more weeks’ gestation plus infant deaths of less than seven days.” This definition gives the second largest number of perinatal deaths among the four common definitions. Caution should be used in comparing perinatal death rates in this report with rates from other sources unless it is certain that the same definition has been used.
Washington State Vital Statistics 2005 163
Marriage and Divorce Data Residence vs. Occurrence Data Information on the number of marriages or divorces for all residents of Washington State is not available since residents may go elsewhere to have a marriage performed or to obtain a divorce. For marriage and divorce statistics, unlike other vital records such as births, deaths, or fetal deaths, there is no interstate agreement for the exchange of information on marriages or divorces for residents of Washington State that occur in other states or countries. Marriages are tabulated in this report according to the county in which the marriage was performed. Divorces, annulments and legal separations also include tabulations by the county in which the legal certificate was issued. Thus, statistics calculated with these data reflect the place of occurrence of the legal activity (e.g. marriage ceremony performed, divorce decree issued) rather than the place of residence of the individuals involved. Please note that tabulations by occurrence include events that were issued in Washington State for residents of other states. Divorces and annulments issued in Washington State are also tabulated by wife’s county of residence (Divorce Tables 1 and 5) and husband’s county of residence (Divorce Table1). These tables, unlike the other tables in this section, present information by place of residence rather than by the place (county) where the legal document was issued and recorded. As stated above, the data in these tables do not include divorces to Washington residents obtained in other states or countries. Legal Separations In annual summaries for years prior to 1992, legal separations were included in divorce totals. Because legal separations are not final dissolutions of marriage, they have been excluded from divorce totals in annual summary tables beginning with 1992 data. This change makes Washington State’s tabulations consistent with those contained in national publications by the National Center for Health Statistics. The impact of the change on trends is small, since legal separations reported to this office equal only about 1 to 2% of total dissolutions. Court Orders Prior to 1996, a small number of divorces (between 32 and 145, see Vital Statistics 1994-95 – Table 50) were submitted to the Center for Health Statistics by county clerks as court orders without filing the certificate of dissolution with the Center as required by law (RCW 70.58.055(3)). The number of such court orders were reported in a footnote in those years but were not included in divorce totals. Beginning in 1996, this problem has been corrected through the cooperation of county clerks.
Washington State Vital Statistics 2005 164

Number of Children Data on the number of children reported on the certificate of dissolution are captured by an item on the form labeled, “Children born alive of the marriage.” Divorce Table 5 in this report presents the number of divorces and annulments tabulated by the number of children born to the couple regardless of the child’s age (i.e., some of the children may be over 18 years of age). Prior to 1997, in some cases, when the number of children was unknown, the number was erroneously recorded as none due to a data entry problem. Beginning in 1997, this problem was corrected. As a result, divorces for which the number of children is recorded as unknown is somewhat higher than in prior years.
Washington State Vital Statistics 2005 165

Definitions Birth Weight - Weight of fetus or infant at time of delivery (normally recorded in pounds and ounces). Low birth weight is any birth weight less than 2,500 grams (about 5-1/2 lbs). Fetal Death - Death prior to the complete expulsion or extraction from its mother of a product of human conception, irrespective of the duration of pregnancy. The death is indicated by the fact that after such expulsion or extraction the fetus does not breathe or show any other evidence of life such as beating of the heart, pulsation of the umbilical cord, or definite movement of voluntary muscles. Reporting of fetal deaths to the state is required only when the gestational period is twenty weeks or more. Infant Death - Death of a child under one year of age. Live Birth - The complete expulsion or extraction from its mother of a product of human conception, irrespective of the duration of pregnancy, which, after such expulsion or extraction, breathes, or shows any other evidence of life such as beating of the heart, pulsation of the umbilical cord, or definite movement of voluntary muscles, whether or not the umbilical cord has been cut or the placenta is attached. Live Birth Order – Live birth order indicates what number the present birth represents; for example, a baby born to a mother who has had two previous live births (even if one or both are not now living) has a live birth order of three. Low Birth Weight – See ‘Birth Weight.’ Maternal Death - Death attributed to complications of pregnancy, childbirth, or the puerperium (ICD-10 O00-O99) for women of childbearing age; includes abortion-related death. Neonatal Death - Death of an infant within the first 27 days of life. Nulliparous - Having never given birth to a live born infant. Occurrence Data - Data allocated by place where the event occurred, regardless of the person's place of residence. Parity - Total number of previous live births; does not include the current birth. Perinatal Death - Fetal deaths plus deaths to infants within the first six days of life.
Washington State Vital Statistics 2005 166

Plurality - The number of siblings born as the result of a single pregnancy (e.g., twins, triplets). Postneonatal Death - Death of an infant of 28-364 days of age. Premature Birth - A live birth weighing 2,500 grams (5-1/2 pounds) or less. If birth weight is not stated, length of gestation (under 37 weeks) is used. Residence Data - Data allocated by place of residence of the child's mother (births, fetal deaths), or by place of residence of the decedent (deaths), regardless of where the event occurred. Underlying Cause of Death - The disease or injury which initiated the train of morbid events leading directly or indirectly to death or the circumstances of the accident or violence which produced the fatal injury.
Washington State Vital Statistics 2005 167
Rates and Ratios Rounding of Rates - Rates are rounded to the nearest tenth. When the rate or percent is less than one-tenth, the entry is 0. Rates are not calculated when the number of events is less than 5. Rates and Ratios Used in this Report - Rates and ratios are calculated by dividing the number of events of concern by the population at risk (or a related population) and multiplying by a standard constant (i.e., 1,000 or 10,000 or 100,000).
( )#
,Crude Birth RateLive Births
Total Populationx= 1 000
Age SpecificBirth RateBirths forSpecific AgeGroup
Population forSame AgeGroupx− =
#,1 000
( ) # ,Crude DeathRate DeathsTotal Population
x= 1 000
Age SpecificDeathRateDeaths forSpecific AgeGroup
Population forSame AgeGroupx− =
#,100 000
Cause SpecificDeathRateDeaths forSpecificCause
Total Populationx− =
#,100 000
agegroupandPopulationStandardTotal
PopulationStandardWiwhere
xPopulation
DeathsWiRateDeathadjustedAge
i
i
i
i
i
=
=
•=− ∑ 000,100#
9#10#−−
=ICDwithClassifiedDeathsICDwithClassifiedDeathsRatioityComparabil
RatioityComparabilCountorRateValuesModifiedityComparabil ×=
Washington State Vital Statistics 2005 168

Infant DeathRateInfant Deaths
Total LiveBirthsx=
#,1 000
NeonatalDeathRateNeonatalDeaths
Total LiveBirthsx=
#,1 000
PostneonatalDeathRatePostneonatalDeaths
Total LiveBirthsx=
#,1 000
MaternalDeathRateMaternalDeaths
Total LiveBirthsx=
#,10 000
FetalDeathRatioFetalDeaths
Total LiveBirthsx=
#,1 000
PerinatalDeath RatePerinatalDeaths
LiveBirths FetalDeathsx=
+#
,1 000
Washington State Vital Statistics 2005 169

Washington State Vital Statistics 2005 170
Appendix B. Conversion of Birth Weight in Grams to Pounds and Ounces Weight in Grams Pounds and OuncesUnder 1,000 2lbs. 3 oz. and less1,000 - 1,499 2 lbs. 4 oz. - 3 lbs. 4 oz.1,500 - 1,999 3 lbs. 5 oz. - 4 lbs. 6 oz.2,000 - 2,499 4 lbs. 7 oz. - 5 lbs. 8 oz.2,500 - 2,999 5 lbs. 9 oz. - 6 lbs. 9 oz.3,000 - 3,499 6 lbs. 10 oz. - 7 lbs. 11 oz.3,500 - 3,999 7 lbs. 12 oz. - 8 lbs. 13 oz.4,000 - 4,499 8 lbs. 14 oz. - 9 lbs. 14 oz.4,500 and over 9 lbs. 15 oz. and over
One pound = 453.59 grams
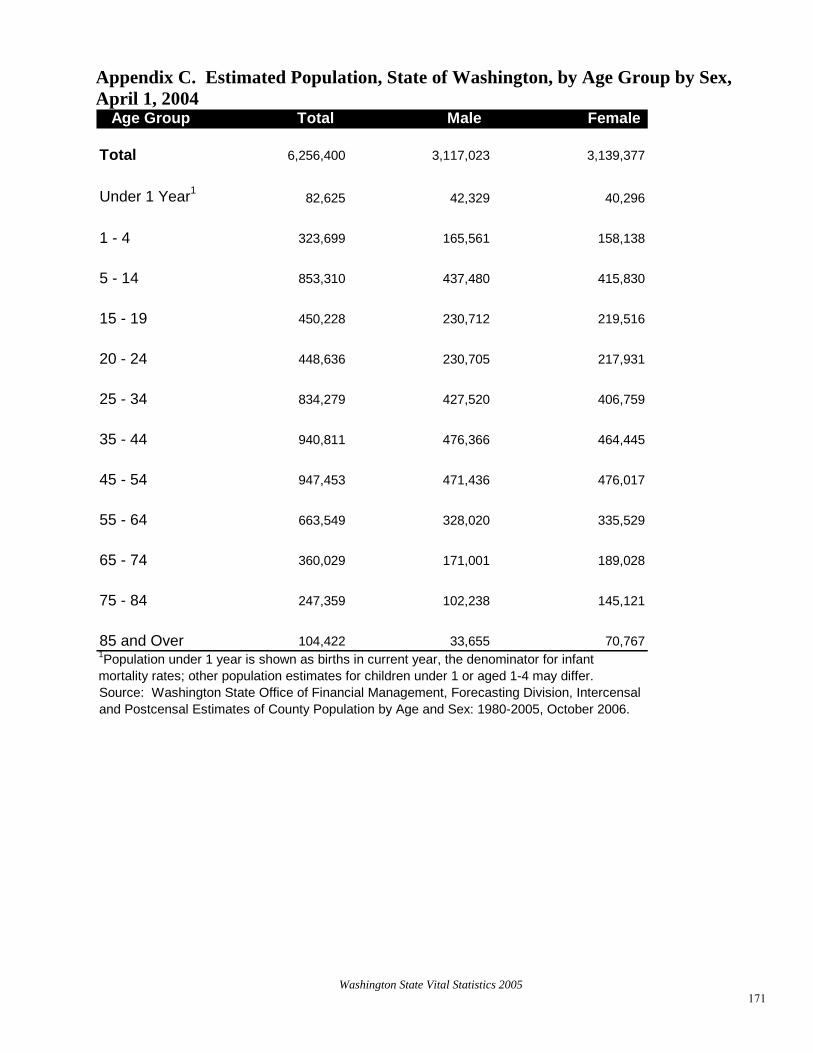
Washington State Vital Statistics 2005 171
Appendix C. Estimated Population, State of Washington, by Age Group by Sex, April 1, 2004
Age Group Total Male Female
Total 6,256,400 3,117,023 3,139,377
Under 1 Year182,625 42,329 40,296
1 - 4 323,699 165,561 158,138
5 - 14 853,310 437,480 415,830
15 - 19 450,228 230,712 219,516
20 - 24 448,636 230,705 217,931
25 - 34 834,279 427,520 406,759
35 - 44 940,811 476,366 464,445
45 - 54 947,453 471,436 476,017
55 - 64 663,549 328,020 335,529
65 - 74 360,029 171,001 189,028
75 - 84 247,359 102,238 145,121
85 and Over 104,422 33,655 70,7671Population under 1 year is shown as births in current year, the denominator for infant mortality rates; other population estimates for children under 1 or aged 1-4 may differ. Source: Washington State Office of Financial Management, Forecasting Division, Intercensal and Postcensal Estimates of County Population by Age and Sex: 1980-2005, October 2006.

Washington State Vital Statistics 2005 172
Appendix D. Estimated Population of Counties and Cities of 15,000 Population and Over, April 1, 2005 Name City County Name City CountyState Total 6,256,400 Kenmore 19,290 Sammamish 38,640Adams 17,000 Kitsap 240,400Asotin 20,900 Bremerton 34,580Benton 158,100 Bainbridge Island 22,200 Kennewick 60,410 Kittitas 36,600 Richland 43,520 Ellensburg 16,700Chelan 69,200 Klickitat 19,500 Wenatchee 29,320 Lewis 71,600Clallam 66,800 Centralia 15,340 Port Angeles 18,640 Lincoln 10,100Clark 391,500 Mason 51,900 Vancouver 154,800 Okanogan 39,600Camas 15,460 Pacific 21,300Columbia 4,100 Pend Oreille 12,200Cowlitz 95,900 Pierce 755,900 Longview 35,430 Tacoma 198,100Douglas 34,700 Puyallup 35,830Ferry 7,400 Lakewood 58,850Franklin 60,500 University Place 30,980 Pasco 44,190 San Juan 15,500Garfield 2,400 Skagit 110,900Grant 79,100 Anacortes 15,700 Moses Lake 16,340 Mount Vernon 28,210Grays Harbor 69,800 Skamania 10,300 Aberdeen 16,450 Snohomish 655,800Island 76,000 Everett 97,500 Oak Harbor 21,720 Edmonds 39,860Jefferson 27,600 Lynnwood 34,830King 1,808,300 Marysville 29,460 Seattle 573,000 Mountlake Terrace 20,390 Renton 56,840 Monroe 15,920 Auburn 43,540 Mukilteo 19,360 Kent 84,920 Spokane 436,300 Kirkland 45,740 Spokane (city) 198,700 Bellevue 115,500 Spokane Valley 85,010 Mercer Island 21,710 Stevens 41,200 Redmond 47,600 Thurston 224,100 Bothell part 16,250 Olympia 43,330 Des Moines 28,960 Lacey 33,180 Issaquah 17,060 Wahkiakum 3,900 Tukwila 17,110 Walla Walla 57,500 Federal Way 85,800 Walla Walla (city) 30,630 SeaTac 25,140 Whatcom 180,800 Burien 31,040 Bellingham 72,320 Shoreline 52,500 Whitman 42,400 Covington 16,610 Pullman 26,590 Maple Valley 17,870 Yakima 229,300
Yakima (city) 79480Source: Population estimates in this report are from the Washington State Office of Financial Management, Forecasting Division, Intercensal and Postcensal Estimates of County Population by Age and Sex: 1980-2005, October 2006.

Washington State Vital Statistics 2005 173
Appendix E. Comparison Between Current and Previous Table Numbers Table Numbers
2003+2000-2002 19991
1980-19982 Current Title Comments
NatalitNatality A: DemographicsA1 A1 --- --- Summary Indicators, Washington State Residents, 1990-2000A2a A2 1A 2A Mother's Race/Ethnicity by Child's Sex, Residence A2b --- --- --- Mother's Multiple Race by Child's Sex, Residence New TableA3 A3 1C 2C Mother's Age Group by Child's Sex, ResidenceA4 A4 --- --- Child's Birth Order by Mother's Age Group, Residence
A5 A5 --- --- Mother's Education by Mother's Age Group, ResidenceNew Education Categories
A6a A6a Appendix E Top 100 Baby Names of Girls, ResidenceA6b A6b Appendix E Top 100 Baby Names of Boys, ResidenceA7 A7 7 8 Place of Residence, Sex, and Place of OccurrenceA8 A8 12 13 Month of Birth by Place of ResidenceA9 A9 8 9 Mother's Age Group by Place of ResidenceA10 A10 --- --- Age-Specific Live Birth Rates by Place of Residence3
A11 A11 9 10 Single Mothers, Mother's Age Group by Place of ResidenceA12 A12 --- --- Father's Age Group by Place of ResidenceA13a A13 10 11 Mother's Race/Ethnicity by Place of Residence A13b --- --- --- Mother's Multiple Race by County of Residence New Table
A14 A14 --- --- Mother's Education by Place of ResidenceNew Education Categories
Natality B: Behavioral and Health CharacteristicsB1 B1 --- --- Summary Indicators, Washington State Residents, 1990-2000B2 B2 --- --- Mother's Age Group by Maternal Smoking, Residence
B3 B3 --- --- Mother's Education by Maternal Smoking, ResidenceNew Education Categories
B4 B4 16 17 Maternal Smoking During Pregnancy by Place of Residence New Smoking Categories
B5 B5 --- --- Selected Medical Risk Factors by Place of Residence New Risk FactorsB6 --- --- --- Body Mass Index by County of Residence New Table
Natality C: Health Service UtilizationC1 C1 --- --- Summary Indicators, Washington State Residents, 1990-2000C2 C2 5 6 Month Prenatal Care Began by Mother's Age Group, ResidenceC3 C3 6 7 Number of Prenatal Visits by Month Care Began, Residence C4 C4 14 15 Month Prenatal Care Began by Place of ResidenceC5 C5 17 18 Birth Facility by Place of OccurrenceC6 C6 --- --- Method of Delivery by Place of OccurrenceC7 C7 --- --- Birth Attendant by Place of OccurrenceC8 C8 18 19 County of Residence by County of Occurrence
Natality D: Infant HealthD1 D1 --- --- Summary Indicators, Washington State Residents, 1990-2000D2a D2 2 3 Birth Weight in Grams by Mother's Race/Ethnicity, ResidenceD2b --- --- --- Birth Weight in Grams by Mother's Multiple Race, Residence New TableD3 D3 4 5 Birth Weight in Grams by Mother's Age Group, Residence
D4 D4 --- --- Birth Weight in Grams by Calculated Gestational Age, ResidenceNew Gestational Age Calculation
D5 D5 --- --- Birth Weight in Grams by Plurality, ResidenceD6 D6 --- --- Mother's Age Group by Plurality, ResidenceD7 D7 13 14 Birth Weight in Grams by Place of Residence
D8 D8 --- --- Calculated Gestational Age by Place of ResidenceNew Gestational Age Calculation
D9 D9 --- --- Plurality by Place of Residence

Washington State Vital Statistics 2005 174
Table Numbers
2000 199911980-19982 Current Title Comments
--- 1B 2B Residence, Child's Race/Ethnicity by SexMother's race has been the standard since 1980
--- 1D 2D Residence, Order of Birth to MotherSee 'All ages' column of Table A4
--- 1E 2E Residence, Attendant at BirthSee 'State total' row of Table C7
--- 1F 2F Residence, Maternal SmokingSee 'State total' row of Table B4
--- 1G 2G Residence and Occurrence, Birth Weight in Grams by SexSee 'State total' row of Table A8 (births)
--- 1H 2H Residence and Occurrence, Live Births and Fetal Deaths by MonthSee 'State total' row of Table D7 (residence data)
--- 1I 2I Occurrence, Primary Method of Birth Delivery by Obstetric ProceduresSee 'State total' row of Table C6
--- 1J 2J Occurrence, Type of PlaceSee 'State total' row of Table C5
--- 3 4 Live Births to Residents by Birth Weight in Grams by Child's Race/EthnicityMother's race has been the standard since 1980
--- 11 12 Live Births by Child's Race/Ethnicity by Place of ResidenceMother's race has been the standard since 1980
--- 15 16 Live Births with Malformations by Place of ResidenceMalformation data are not very reliable
Mortality A: Demographics
A1 -- --Age-Adjusted Mortality Rates and Life Expectancy by Sex for Residents, 1990-2000 New Table
A2 2 20B Age by Race/Ethnicity for ResidentsA3 3 20C Age by Sex for ResidentsA4 4 20D Life Expectancy by Age and Sex for ResidentsA5 7 20H Marital Status by Sex for ResidentsA6 -- -- Education by Age for Residents New TableA7-a 17A 25 Residence and Occurrence by County and City
A7-b 17B -- Residence and Occurrence by County Listed by Age-Adjusted Rates for 1998-2000
A8 18 26 Sex and Race/Ethnicity by County/City of ResidenceA9 19 27 Age Group by County of ResidenceA10 20 28 Month of Death by County of ResidenceA11 28 37 Place Where Death Occurred by County of Occurrence
Mortality B: Autopsy and DispositionB1 -- -- Percent Autopsy and Cremation for Residents, 1990-2000 New TableB2 9 -- Autopsy by Age and Manner of Death for Residents
B3 -- -- Type of Disposition by County of Residence New Table
Mortality C: Leading Causes of Death, Overview and Selected Causes of DeathC1 -- -- Age-Adjusted Rates1 for 10 Leading Causes of Death for Residents, 1990- New TableC2 5A 20E Leading Causes of Death for ResidentsC3 10 21 Leading Causes by Age Group and Sex for ResidentsC4 11A 22 Crude Rates for Selected Causes by Sex for ResidentsC5 11B 22 Age-Adjusted Rates for Selected Causes by Sex for Residents
C6 21A 29Diabetes, Alzheimer's Disease, and Major Cardiovascular Disease by County of Residence
C7 21B 29Diseases of the Heart, Ischemic Heart Diseases, and Cerebrovascular Diseases by County of Residence
C8 21C 29Influenza & Pnuemonia, Chronic Lower Respiratory Disease, and Chronic Liver Disease & Cirrhosis by County of Residence
Old Natality Tables Not Included in Current Report

Washington State Vital Statistics 2005 175
Table Numbers
2000 199911980-19982 Current Title Comments
NatalitMortality D: CancerD1 -- -- Age-Adjusted Rates for Leading Causes of Cancer for Residents, 1990- New TableD2 12 23 Cancer by Primary Site and Sex for ResidentsD3 23A 30A Cancer for Total All Sites, Lung, and Colo-Rectal by County of ResidenceD4 23B 30B Cancer for Female Breast, Prostate, and Pancreas by County of Residence
Mortality E: External Causes or InjuriesE1 -- -- Age-Adjusted Rates for External Causes for Residents, 1990-2000 New TableE2-a 13 24 External Causes of Injury With Crude Rates for ResidentsE2-b 13 24 External Causes of Injury With Age-Adjusted Rates for ResidentsE2-c 13 24 ICD-10 Codes for External CausesE3 14 -- External Causes by Place of Injury for ResidentsE4 15 -- Type of Firearm by Intent for ResidentsE5 16 -- Poisoning by Intent and SubstanceE6 25 33 Suicide, Homicide, Undetermined by County of ResidenceE7 22 -- Drug and Alcohol-Induced Causes for Residents
E8 24A 32AUnintentional Injury (Accident), Motor Vehicle Traffic, and Falls by Place of Residence
E9 24B 32BDrowning Drowning, Fires, and Other Unintentional Injury (Accident) by County of Residence
E10 27 36 Suicide, Homicide, and Undetermined for Residents by County of InjuryTables prior to 1999 used county of occurrence
E11 26 35 Unintentional Injury (Accident) to Residents by County of InjuryTables prior to 1999 used county of occurrence
Mortality F: Infant DeathsF1 -- -- Selected Causes for Infant (Age < 1 Year) Residents, 1990-2000 New TableF2 5B 20F Leading Causes of Infant (Age < 1 Year) Death for ResidentsF3 29 -- Birth Weight and Age for Infant (Age < 1 Year) ResidentsF4-a 30A 38A Selected Causes by Age and Sex for Infant (Age < 1 Year) ResidentsF4-b 30B 38B Selected Causes by Age and Sex for Infant (Age < 1 Year) ResidentsF5 31 39 Selected Causes for Infant (Age < 1 Year) County of ResidenceF6 32 40 Mother's Race/Ethnicity by Infant (Age < 1 Year) County of ResidenceF7 34 42 Mother's Age Group by Infant (Age <1 Year) County of Residence
F8 35 26Fetal Deaths, Perinatal, Neonatal, and Infant Mortality by County/City of Residence
Mortality G: Fetal DeathsG1 -- -- Selected Causes of Fetal Death Residents New TableG2 36 45 Fetal Deaths by Mother's Age Group by Place of ResidenceG3 37 46 Fetal Deaths for Residents by CauseG4 38 47 Fetal Deaths by Weight in Grams and Sex for Residents
Mortality Tables Not Included in Current Report
-- 1 20A Deaths to Residents by Race/Ethnicity and SexSee 'State Total' row of Table A8
-- 6 20G Deaths to Residents and by Occurrence by Month of DeathSee 'State Total' row of Table A10
-- 8 20I Deaths by Occurrence by Type of PlaceSee 'State Total' row of Table A11

Washington State Vital Statistics 2005 176
Table Numbers
2000 199911980-19982 Current Title Comments
continued Mortality Tables Not Included in Current Report
-- -- 31Deaths Due to Human Immunodeficiency Virus by Sex by Place of Residence
Number of deaths have declined; Most cells are zero
-- -- 34Deaths Due to Human Immunodeficiency Virus by Sex by Place of Occurrence
Number of deaths have declined; Most cells are zero
-- -- 44Fetal Deaths, Perinatal, Neonatal and Infant Mortality by Place of Occurrence
Place of Residence is used more often
-- 33 41 Infant (Age < 1 Year) Deaths by Child's Race/Ethnicity by ResidenceMother's race has been the standard since 1980
1From Washington State Vital Statistics, 19992From Washington State Vital Statistics Reports, 1980-19983 Also published as Table 19 in Washington State Pregnancy and Induced Abortion Statistics

Washington State Vital Statistics 2005 177
Appendix F. Sample Certificates
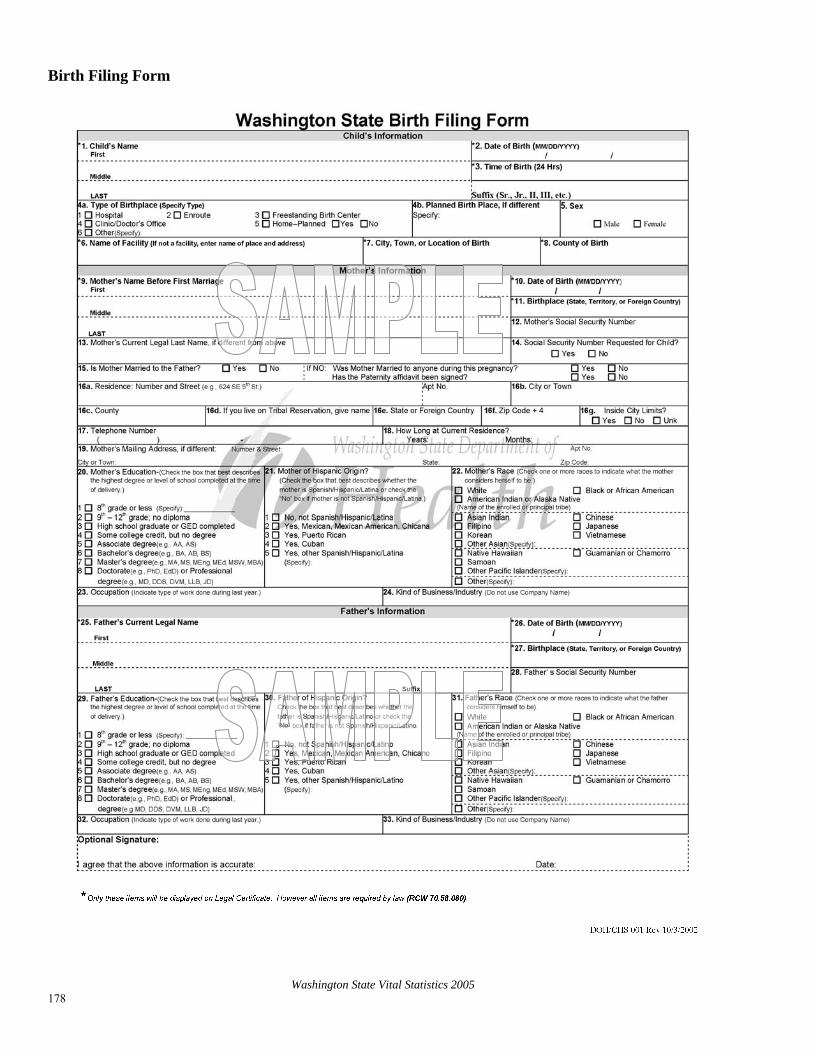
Washington State Vital Statistics 2005 178
Birth Filing Form

Washington State Vital Statistics 2005 179
Washington State Vital Statistics 2005 179

Washington State Vital Statistics 2005 180
Certificate of Death

Washington State Vital Statistics 2005 181
Certificate of Fetal Death

Washington State Vital Statistics 2005 182
Washington State Vital Statistics 2005 182
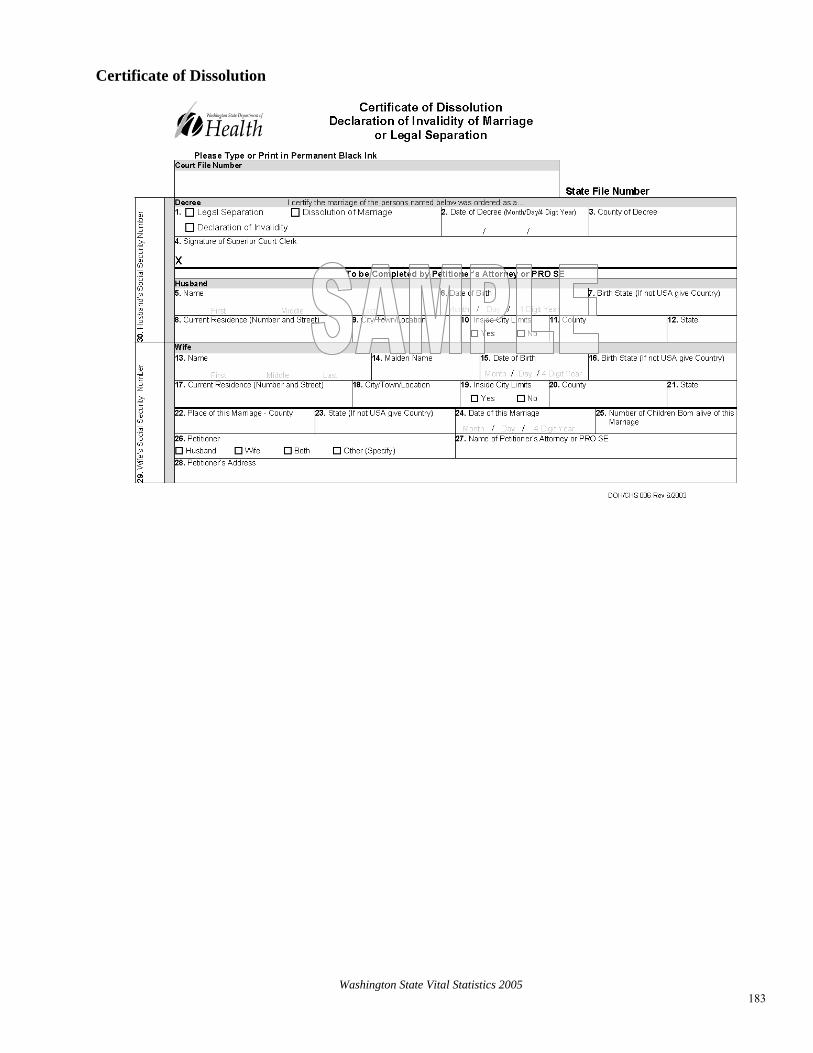
Washington State Vital Statistics 2005 183
Certificate of Dissolution

Washington State Vital Statistics 2005 184
Certificate of Marriage

Washington State Vital Statistics 2005 185
continued Certificate of Marriage