Washington State Electric Utility Fuel Mix Disclosure ......Claims on BPA* Calendar Year 2012. BPA...
280
Washington State Electric Utility Fuel Mix Disclosure Reports for Calendar Year 2012 July 2013 Brian Bonlender, Director
Transcript of Washington State Electric Utility Fuel Mix Disclosure ......Claims on BPA* Calendar Year 2012. BPA...

Washington State Electric Utility Fuel Mix Disclosure Reports for Calendar Year 2012
July 2013 Brian Bonlender, Director

Acknowledgements
Washington State Department of Commerce Angela Burrell, Project Manager, Energy Office Tony Usibelli, Director, Energy Office Washington State Department of Commerce Energy Office 1011 Plum Street P.O. Box 43173 Olympia, WA 98504 www.commerce.wa.gov/energy/ For people with disabilities, this report is available on request in other formats. To submit a request, please call 360-725-4000 (TTY 360-586-0772). Link to report posted at Department of Commerce Website: http://www.commerce.wa.gov/Programs/Energy/Office/Utilities/Pages/default.aspx

Table of Contents
Aggregate Fuel Mix 2012 ................................................................................................. 1
Aggregate Fuel Mix 2012 Dataset .................................................................................... 2
NWPP Net System Mix* Calendar Year 2012 .................................................................. 3
Aggregate CO2 Emissions by Fuel Type 2012 ................................................................... 4
Washington State Electric Utilities Aggregate Fuel Mix 2000-2012 ................................ 5
Washington State Electric Utilities Aggregate Fuel Mix 2000-2012 Dataset ................... 6
Alder Mutual Light Co., Inc. ............................................................................................. 7
Avista Corporation (WA) ................................................................................................ 11
Benton Rural Electric Assn. ............................................................................................ 17
Big Bend Electric Coop, Inc ............................................................................................ 21
Chewelah Light Department .......................................................................................... 25
City of Blaine .................................................................................................................. 29
City of Centralia.............................................................................................................. 33
City of Cheney ................................................................................................................ 38
City of Ellensburg ........................................................................................................... 42
City of Milton ................................................................................................................. 46
City of Port Angeles ........................................................................................................ 50
City of Richland .............................................................................................................. 55
City of Sumas.................................................................................................................. 59
Clearwater Power Company .......................................................................................... 63
Columbia Rural Electric Association, Inc ........................................................................ 67
Coulee Dam Light Department ...................................................................................... 71
Elmhurst Mutual Power &Light Co ................................................................................ 75
Inland Power & Light Company ..................................................................................... 79
Lakeview Light & Power ................................................................................................. 84
McCleary Light & Power ................................................................................................ 88
Modern Electric Water Company .................................................................................. 92
Nespelem Valley Electric Coop, Inc ................................................................................ 96
Northern Lights, Inc. .................................................................................................... 100

Ohop Mutual Light Company ....................................................................................... 105
Okanogan County Electric Coop, Inc ............................................................................ 109
Orcas Power & Light Cooperative ................................................................................ 113
Pacific Power and Light ................................................................................................ 118
Parkland Light & Water Company................................................................................ 121
Peninsula Light Company ............................................................................................. 125
PUD No 1 of Asotin County .......................................................................................... 129
PUD No 1 of Benton County ........................................................................................ 133
PUD No 1 of Chelan County ......................................................................................... 138
PUD No 1 of Clallam County ........................................................................................ 142
PUD No 1 of Clark County ............................................................................................ 147
PUD No 1 of Cowlitz County ........................................................................................ 152
PUD No 1 of Douglas County ....................................................................................... 158
PUD No 1 of Ferry County ............................................................................................ 161
PUD No 1 of Franklin County ....................................................................................... 165
PUD No 1 of Grays Harbor County ............................................................................... 170
PUD No 1 of Kittitas County ......................................................................................... 174
PUD No 1 of Klickitat County ....................................................................................... 178
PUD No 1 of Lewis County ........................................................................................... 183
PUD No 1 of Mason County ......................................................................................... 188
PUD No 1 of Okanogan County .................................................................................... 192
PUD No 1 of Pend Oreille County ................................................................................ 197
PUD No 1 of Skamania County ..................................................................................... 202
PUD No 1 of Snohomish County .................................................................................. 206
PUD No 1 of Wahkiakum County ................................................................................. 211
PUD No 1 of Whatcom County .................................................................................... 215
PUD No 2 of Grant County ........................................................................................... 219
PUD No 2 of Pacific County .......................................................................................... 224
PUD No 3 of Mason County ......................................................................................... 228
Puget Sound Energy, Inc .............................................................................................. 233
Ruston Electric Utility ................................................................................................... 242

Seattle City Light .......................................................................................................... 248
Tacoma Power ............................................................................................................. 254
Tanner Electric Cooperative ......................................................................................... 260
Town of Eatonville ....................................................................................................... 264
Town of Steilacoom ..................................................................................................... 268
Vera Water & Power .................................................................................................... 272

Washington State Electric Utilities Aggregate Fuel Mix 2012
(90,643,770 megawatt hours)
Notes: • “Fuel Mix” is the range of energy sources that make up total retail electricity sales to customers. • “Market Purchases” are utility and BPA purchases or claims acquired on the spot market and not connected with a
specified energy plant (16% of total). • “Claims on Facilities” are utility purchases or claims connected with a specified energy plant, typically representing a
contracted agreement for energy purchase (84% of total). • The “Other” fuel category consists of fuel remaining after categories listed in fuel mix disclosure legislation have
been matched with reported categories. It contains blast furnace gas, other biomass gas such as digester gas and methane, and purchased steam.
• Black liquor is reported in the “Waste” category.
Hydropower69.5%
Coal13.4%
Natural Gas11.0%
Nuclear4.7%
Wind3.3%
1.4%
1
Biomass 0.34%Waste 0.33%
Landfill Gases 0.09%
Petroleum 0.07%
Other 0.04%
Geothermal 0.02%

Washington State Electric Utilities Aggregate Fuel Mix 2012 Dataset
(megawatt hours)
Fuel Market Purchases
Claims on Facilities
Total Percent
Hydropower 6,513,046 56,471,491 62,984,536 69.49% Coal 4,694,947 7,454,311 12,149,258 13.40% Natural Gas 1,676,778 5,276,100 6,952,877 7.67% Nuclear 359,918 3,879,480 4,239,398 4.68% Wind - 3,011,137 3,011,137 3.32% Cogeneration - 486,609 486,609 0.54% Biomass 82,293 228,518 310,812 0.34% Waste 85,597 217,469 303,066 0.33% Landfill Gases 20,844 62,821 83,665 0.09% Petroleum 47,932 19,648 67,580 0.07% Other 21,105 15,291 36,396 0.04% Geothermal - 17,003 17,003 0.02% Solar - 1,433 1,433 0.00% Total 13,502,458.96 77,141,311.55 90,643,770.50 100.00%
Notes:
• “Fuel Mix” is the range of energy sources that make up total retail electricity sales to customers. • “Market Purchases” are utility and BPA purchases or claims acquired on the spot market and not connected
with a specified energy plant (16% of total). • “Claims on Facilities” are utility purchases or claims connected with a specified energy plant, typically
representing a contracted agreement for energy purchase (84% of total). • The “Other” fuel category consists of fuel remaining after categories listed in fuel mix disclosure legislation have
been matched with reported categories. It contains blast furnace gas, other biomass gas such as digester gas and methane, and purchased steam.
• Black liquor is reported in the “Waste” category.
2

NWPP Net System Mix* Calendar Year 2012 Assigned to “spot” market purchases
The Net System is the mix for the balance of power pool resources after utilities’ claims on specific resources are deducted. The Net System Mix is assigned to “spot” market purchases, which are non-contractual, or very short-term contract, purchases- and which, are not associated with a specified fuel source. The Mix is not the aggregate mix for the Northwest power pool.
Biomass 0.61% Coal (anthracite) 0.00% Coal (bituminous) 35.07% Coal (lignite) 0.55% Coke 0.28% Geothermal 0.00% Hydro 47.48% Landfill Gases 0.15% Natural Gas 12.40% Nuclear 2.61% Other 0.16% Petroleum (heavy oil) 0.02% Petroleum (light oil) 0.05% Solar--Photovoltaic 0.00% Solar--Thermal 0.00% Waste 0.62% Wind 0.00%
Total 100.00% *The net system mix is calculated for each fuel by deducting utility claims and plant use from reported generation. The percentages are used to calculate fuel amounts for each utility's market purchases.
3

Washington State Electric Utilities Aggregate CO2 Emissions by Fuel Type 2012
(tons of CO2 emissions resulting from electricity sold to Washington residents)
Notes:
• CO2=carbon dioxide, SO2=sulfur dioxide, NOx=nitrogen oxides, Hg=mercury • Emissions are allocated by amount and type of fuel purchased by electric utilities serving Washington State
customers. • Emission rate factors are obtained from the U.S. EPA EGRID database . Each fossil fuel has a unique
emission factor. Estimated CO2 emissions are calculate by multiplying MMBtu by the fuel-specific CO2 Lbs/MMBtu rate. SO2 tons NOx tons, and Hg Lbs are calculated using plant-specific Lbs/MMBtu rates. These rates are updated annually or using the most recent data available.
• Natural Gas includes cogeneration; mostly comprised of the heat energy produced by a plant heat engine or power station that simultaneously generates electricity and steam energy.
• Landfill Gases: electricity produced by a plant that uses waste gases produced by the decomposition of organic materials in landfills
• Figures are rounded upward
Fuel Tons of CO2 Coal 13,315,348 Natural Gas 3,246,821 Waste 101,208 Petroleum 75,656 Landfill Gases 57,696 Total 16,796,730
Other Emissions SO2 (tons) 11,445 NOx (tons) 17,187 HG (lbs) 487
4
Coal79.3%
Natural Gas19.3%
Waste0.6%
Petroleum0.5%
Landfill Gases0.3%

Washington State Electric Utilities Aggregate Fuel Mix 2000-2012
Notes:
• “Natural Gas” includes cogeneration • “Fossil Fuels Other” includes waste, landfill gases and other • “Other” includes blast furnace gas, other biomass gas such as digester gas and methane, and purchased steam • “Renewables Other” geothermal and solar
-
10,000,000
20,000,000
30,000,000
40,000,000
50,000,000
60,000,000
70,000,000
80,000,000
90,000,000
100,000,000
110,000,000
2000 2001 2002 2003 2004 2005 2006 2007 2008 2009 2010 2011 2012Hydropower Coal Natural Gas Nuclear Biomass Petroleum Wind Fossil Fuels Other Renewables Other
5

Washington State Electric Utilities Aggregate Fuel Mix 2000-2012 Dataset
Note: “Other” contains furnace gas, other biomass gas such as digester gas and methane, and purchased steam.
Fuel Source 2000 2001 2002 2003 2004 2005 2006 2007 2008 2009 2010 2011 2012Hydropower 67,889,834 45,853,455 55,796,455 53,850,478 54,132,176 55,342,273 59,609,529 59,203,647 58,235,550 57,214,771 53,412,121 66,847,397 62,984,536 Coal 16,243,438 13,247,976 10,498,764 14,336,264 14,459,001 14,860,017 14,245,188 14,866,637 15,034,912 14,672,973 15,955,168 12,900,636 12,149,258 Cogeneration 5,428,455 5,908,568 3,971,751 3,590,493 - 2,660,660 2,766,515 2,157,302 1,635,296 1,867,355 1,731,728 1,319,055 486,609 Natura l Gas 5,343,539 5,954,725 2,703,929 4,370,728 14,459,001 5,325,475 4,553,447 6,302,442 7,385,757 9,979,345 10,476,257 5,684,223 6,952,877 Nuclear 4,285,939 3,975,371 3,897,750 3,726,175 4,591,072 4,403,537 4,513,216 4,326,265 5,083,665 3,653,541 5,430,617 2,390,245 4,239,398 Biomass 1,100,469 937,515 401,339 434,700 536,643 587,085 392,712 460,983 415,226 445,076 492,371 446,890 310,812 Petroleum 401,383 489,650 23,112 34,957 53,046 44,233 62,232 69,267 69,937 94,360 81,372 68,539 67,580 Waste 159,888 236,666 24,503 139,056 102,864 150,955 331,963 288,528 276,669 296,180 332,719 336,948 303,066 Geothermal 143,024 158,779 - - - - 14,399 11,189 16,866 19,237 17,376 18,107 17,003 Landfi l l Gases 68,978 70,807 220,805 75,125 134,122 80,500 57,858 49,041 23,043 16,058 18,787 49,209 83,665 Wind - 23,822 163,134 320,540 346,470 432,667 867,392 545,622 1,010,928 587,994 567,281 1,017,702 3,011,137 Other 233,995 6,991 37,379 31,156 10,863 12,923 19,391 28,650 28,504 27,307 36,396 Solar 1,433 Total 101,064,948 76,857,334 77,935,538 80,885,507 88,851,774 83,918,558 87,425,313 88,293,846 89,207,239 88,875,541 88,544,303 91,106,257 90,643,771
6

Calculations are based on power purchases for 2012 reported by the Utility to the Washington State Department of Commerce in 2013.
Alder Mutual Light Co., Inc.
Fuel Mix Calendar Year 2012
Biomass 0.09% Coal 1.60% Cogeneration 0.00% Geothermal 0.00% Hydro 88.03% Landfill Gases 0.01% Natural Gas 0.64% Nuclear 9.57% Other 0.01% Petroleum 0.02% Solar 0.00% Waste 0.04% Wind 0.00%
Total 100.00%
7

Calculations are based on power purchases for 2012 reported by the Utility to the Washington State Department of Commerce in 2013.
Alder Mutual Light Co., Inc
Fuel Mix Calculations Calendar Year 2012
MWh MWh from from Total Fuel Market Purchases* Claims on Resources* Percent Biomass 1.258 2.709 3.967 0.09% Coal 74.003 0.000 74.003 1.60% Cogeneration 0.000 0.000 0.000 0.00% Geothermal 0.000 0.000 0.000 0.00% Hydro 98.636 3,970.226 4,068.862 88.03% Landfill Gases 0.317 0.000 0.317 0.01% Natural Gas 25.756 3.863 29.620 0.64% Nuclear 5.429 436.712 442.141 9.57% Other 0.326 0.000 0.326 0.01% Petroleum 0.726 0.361 1.087 0.02% Solar 0.000 0.000 0.000 0.00% Waste 1.292 0.386 1.678 0.04% Wind 0.000 0.000 0.000 0.00% Total 207.743 4,414.257 4,622.000 100.00%
* Market Purchases include those made directly by utilities, as well as the fraction of delivered BPA power that can be attributed to BPA’s purchases of market power. Claims on Resources include those made directly by utilities, as well as the fractions of delivered BPA power that can be attributed to specific plants.
8

Calculations are based on power purchases for 2012 reported by the Utility to the Washington State Department of Commerce in 2013.
Alder Mutual Light Co, Inc
Claims on BPA* Calendar Year 2012 BPA Resource Mix 4,414.257
Biomass 2.709
Natural Gas 3.863
Nuclear 436.712
Petroleum (heavy oil) 0.361
Waste 0.386
Water 3,970.226
*The BPA Resource Mix includes only the fraction of delivered BPA power that can be attributed to specific plants. The fraction of BPA power that BPA purchased on the market is included in the 'Market Purchases' table.
9

Calculations are based on power purchases for 2012 reported by the Utility to the Washington State Department of Commerce in 2013.
Alder Mutual Light Co, Inc.
Market Purchases Calendar Year 2012
Total Market Purchases 207.743
BPA Market Purchase* 207.743
* “BPA Market Purchases” are the fraction of delivered BPA power that BPA purchased on the market.
**The BPA Slice product includes a small amount of wind power that is not bundled with the Renewable Energy Credits (REC) associated with that power. Such power is assigned the net system fuel mix – as though it were a market purchase.
10

Calculations are based on power purchases for 2012 reported by the Utility to the Washington State Department of Commerce in 2013.
Avista Corporation (WA)
Fuel Mix Calendar Year 2012
Biomass 2.64% Coal 19.09% Cogeneration 0.24% Geothermal 0.00% Hydro 47.39% Landfill Gases 0.11% Natural Gas 26.03% Nuclear 0.24% Other 0.01% Petroleum 0.05% Solar 0.00% Waste 3.56% Wind 0.65%
Total 100.00%
11

Calculations are based on power purchases for 2012 reported by the Utility to the Washington State Department of Commerce in 2013.
Avista Corporation (WA)
Fuel Mix Calculations Calendar Year 2012
MWh MWh from from Total Fuel Market Purchases* Claims on Resources* Percent Biomass 3,399.826 154,841.104 158,240.930 2.64% Coal 200,027.164 945,414.144 1,145,441.309 19.09% Cogeneration 0.000 14,207.529 14,207.529 0.24% Geothermal 0.000 0.000 0.000 0.00% Hydro 266,610.470 2,577,238.000 2,843,848.470 47.39% Landfill Gases 857.499 6,019.000 6,876.499 0.11% Natural Gas 69,618.689 1,492,385.566 1,562,004.255 26.03% Nuclear 14,675.254 0.000 14,675.254 0.24% Other 880.308 0.000 880.308 0.01% Petroleum 1,961.722 895.856 2,857.577 0.05% Solar 0.000 0.000 0.000 0.00% Waste 3,492.067 209,962.802 213,454.869 3.56% Wind 0.000 38,793.000 38,793.000 0.65% Total 561,523.000 5,439,757.000 6,001,280.000 100.00%
* Market Purchases include those made directly by utilities, as well as the fraction of delivered BPA power that can be attributed to BPA’s purchases of market power. Claims on Resources include those made directly by utilities, as well as the fractions of delivered BPA power that can be attributed to specific plants.
12

Calculations are based on power purchases for 2012 reported by the Utility to the Washington State Department of Commerce in 2013.
Avista Corporation (WA)
Claims on Plants Calendar Year 2012 Noxon Rapids Claim Type: PlntMix 776,081.000
Water 776,081.000
Little Falls Claim Type: PlntMix 127,511.000
Water 127,511.000
Long Lake Claim Type: PlntMix 324,156.000
Water 324,156.000
Meyers Falls Claim Type: PlntMix 7,033.000
Water 7,033.000
Nine Mile Claim Type: PlntMix 45,209.000
Water 45,209.000
Rocky Reach Claim Type: PlntMix 200,702.000
Water 200,702.000
Wells Claim Type: PlntMix 235,052.000
Water 235,052.000
Priest Rapids Claim Type: PlntMix 209,678.000
Water 209,678.000
Sheep Creek Hydro Inc Claim Type: PlntMix 4,576.000
Water 4,576.000
13
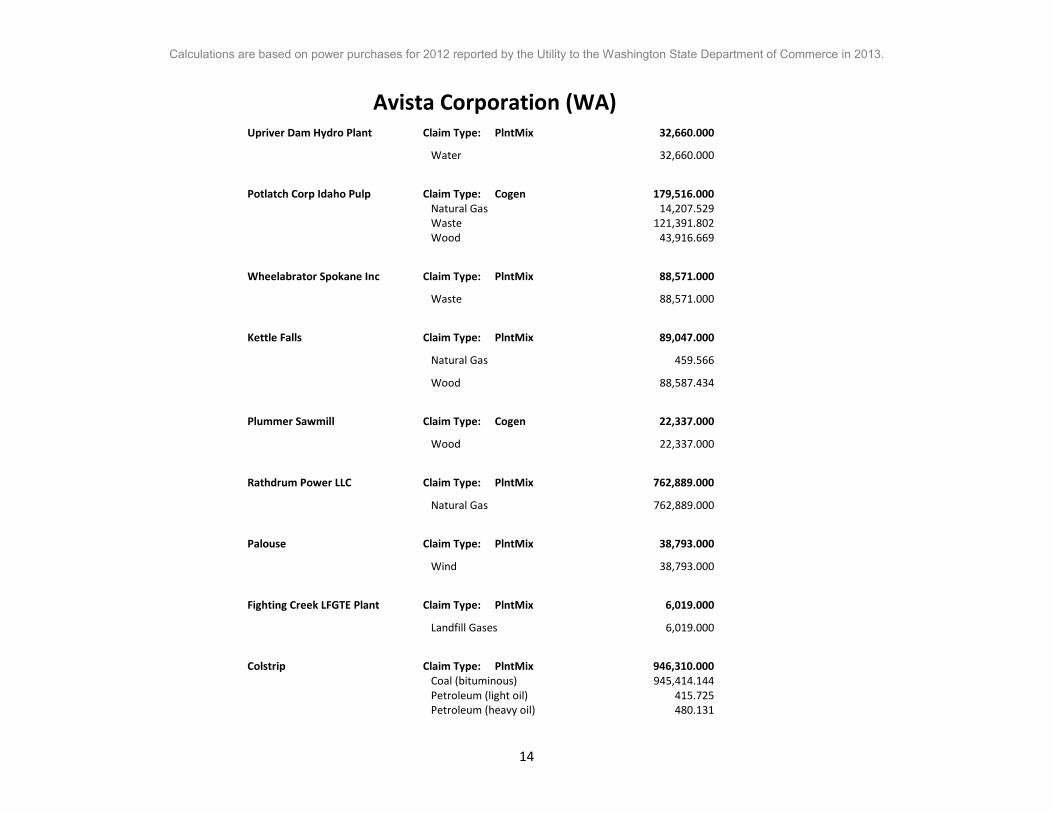
Calculations are based on power purchases for 2012 reported by the Utility to the Washington State Department of Commerce in 2013.
Avista Corporation (WA) Upriver Dam Hydro Plant Claim Type: PlntMix 32,660.000
Water 32,660.000
Potlatch Corp Idaho Pulp Claim Type: Cogen 179,516.000 Natural Gas 14,207.529 Waste 121,391.802 Wood 43,916.669
Wheelabrator Spokane Inc Claim Type: PlntMix 88,571.000
Waste 88,571.000
Kettle Falls Claim Type: PlntMix 89,047.000
Natural Gas 459.566
Wood 88,587.434
Plummer Sawmill Claim Type: Cogen 22,337.000
Wood 22,337.000
Rathdrum Power LLC Claim Type: PlntMix 762,889.000
Natural Gas 762,889.000
Palouse Claim Type: PlntMix 38,793.000
Wind 38,793.000
Fighting Creek LFGTE Plant Claim Type: PlntMix 6,019.000
Landfill Gases 6,019.000
Colstrip Claim Type: PlntMix 946,310.000 Coal (bituminous) 945,414.144 Petroleum (light oil) 415.725 Petroleum (heavy oil) 480.131
14

Calculations are based on power purchases for 2012 reported by the Utility to the Washington State Department of Commerce in 2013.
Avista Corporation (WA) Northeast Claim Type: PlntMix 114.000
Natural Gas 114.000
Rathdrum Claim Type: PlntMix 4,383.000
Natural Gas 4,383.000
Coyote Springs II Claim Type: PlntMix 721,019.000
Natural Gas 721,019.000
Boulder Park Claim Type: PlntMix 3,521.000
Natural Gas 3,521.000
Cabinet Gorge Claim Type: PlntMix 510,385.000
Water 510,385.000
Post Falls Claim Type: PlntMix 35,320.000
Water 35,320.000
Monroe Street Claim Type: PlntMix 43,490.000
Water 43,490.000
Upper Falls Claim Type: PlntMix 25,385.000
Water 25,385.000
15

Calculations are based on power purchases for 2012 reported by the Utility to the Washington State Department of Commerce in 2013.
Avista Corporation (WA)
Market Purchases Calendar Year 2012
Total Market Purchases 561,523.000
Utility Market Purchase 561,523.000
* “BPA Market Purchases” are the fraction of delivered BPA power that BPA purchased on the market.
**The BPA Slice product includes a small amount of wind power that is not bundled with the Renewable Energy Credits (REC) associated with that power. Such power is assigned the net system fuel mix – as though it were a market purchase.
16

Calculations are based on power purchases for 2012 reported by the Utility to the Washington State Department of Commerce in 2013.
Benton Rural Electric Assn.
Fuel Mix Calendar Year 2012
Biomass 0.09% Coal 2.10% Cogeneration 0.00% Geothermal 0.00% Hydro 87.43% Landfill Gases 0.01% Natural Gas 0.81% Nuclear 9.46% Other 0.01% Petroleum 0.03% Solar 0.00% Waste 0.04% Wind 0.00%
Total 100.00%
17

Calculations are based on power purchases for 2012 reported by the Utility to the Washington State Department of Commerce in 2013.
Benton Rural Electric Assn.
Fuel Mix Calculations Calendar Year 2012
MWh MWh from from Total Fuel Market Purchases* Claims on Resources* Percent Biomass 208.647 336.792 545.439 0.09% Coal 12,275.625 0.000 12,275.625 2.10% Cogeneration 0.000 0.000 0.000 0.00% Geothermal 0.000 0.000 0.000 0.00% Hydro 16,361.829 493,558.719 509,920.548 87.43% Landfill Gases 52.625 0.000 52.625 0.01% Natural Gas 4,272.484 480.264 4,752.748 0.81% Nuclear 900.617 54,289.797 55,190.414 9.46% Other 54.024 0.000 54.024 0.01% Petroleum 120.390 44.846 165.237 0.03% Solar 0.000 0.000 0.000 0.00% Waste 214.307 48.032 262.340 0.04% Wind 0.000 0.000 0.000 0.00% Total 34,460.549 548,758.451 583,219.000 100.00%
* Market Purchases include those made directly by utilities, as well as the fraction of delivered BPA power that can be attributed to BPA’s purchases of market power. Claims on Resources include those made directly by utilities, as well as the fractions of delivered BPA power that can be attributed to specific plants.
18

Calculations are based on power purchases for 2012 reported by the Utility to the Washington State Department of Commerce in 2013.
Benton Rural Electric Assn.
Claims on BPA* Calendar Year 2012 BPA Resource Mix 548,758.451
Biomass 336.792
Natural Gas 480.264
Nuclear 54,289.797
Petroleum (heavy oil) 44.846
Waste 48.032
Water 493,558.719
*The BPA Resource Mix includes only the fraction of delivered BPA power that can be attributed to specific plants. The fraction of BPA power that BPA purchased on the market is included in the “Market Purchases” table.
19

Calculations are based on power purchases for 2012 reported by the Utility to the Washington State Department of Commerce in 2013.
Benton Rural Electric Assn.
Market Purchases Calendar Year 2012
Total Market Purchases 34,460.549
BPA Market Purchase* 25,825.549
Utility Market Purchase 8,635.000
* “BPA Market Purchases” are the fraction of delivered BPA power that BPA purchased on the market.
**The BPA Slice product includes a small amount of wind power that is not bundled with the Renewable Energy Credits (REC) associated with that power. Such power is assigned the net system fuel mix – as though it were a market purchase.
20

Calculations are based on power purchases for 2012 reported by the Utility to the Washington State Department of Commerce in 2013.
Big Bend Electric Coop, Inc
Fuel Mix Calendar Year 2012
Biomass 0.09% Coal 2.03% Cogeneration 0.00% Geothermal 0.00% Hydro 87.52% Landfill Gases 0.01% Natural Gas 0.79% Nuclear 9.48% Other 0.01% Petroleum 0.03% Solar 0.00% Waste 0.04% Wind 0.00%
Total 100.00%
21

Calculations are based on power purchases for 2012 reported by the Utility to the Washington State Department of Commerce in 2013.
Big Bend Electric Coop, Inc
Fuel Mix Calculations Calendar Year 2012
MWh MWh from from Total Fuel Market Purchases* Claims on Resources* Percent Biomass 180.095 302.004 482.099 0.09% Coal 10,595.815 0.000 10,595.815 2.03% Cogeneration 0.000 0.000 0.000 0.00% Geothermal 0.000 0.000 0.000 0.00% Hydro 14,122.858 442,577.133 456,699.991 87.52% Landfill Gases 45.423 0.000 45.423 0.01% Natural Gas 3,687.833 430.655 4,118.488 0.79% Nuclear 777.376 48,681.994 49,459.370 9.48% Other 46.632 0.000 46.632 0.01% Petroleum 103.916 40.214 144.130 0.03% Solar 0.000 0.000 0.000 0.00% Waste 184.981 43.071 228.052 0.04% Wind 0.000 0.000 0.000 0.00% Total 29,744.929 492,075.071 521,820.000 100.00%
* Market Purchases include those made directly by utilities, as well as the fraction of delivered BPA power that can be attributed to BPA’s purchases of market power. Claims on Resources include those made directly by utilities, as well as the fractions of delivered BPA power that can be attributed to specific plants.
22

Calculations are based on power purchases for 2012 reported by the Utility to the Washington State Department of Commerce in 2013.
Big Bend Electric Coop, Inc
Claims on BPA* Calendar Year 2012 BPA Resource Mix 492,075.071
Biomass 302.004
Natural Gas 430.655
Nuclear 48,681.994
Petroleum (heavy oil) 40.214
Waste 43.071
Water 442,577.133
*The BPA Resource Mix includes only the fraction of delivered BPA power that can be attributed to specific plants. The fraction of BPA power that BPA purchased on the market is included in the “Market Purchases” table.
23

Calculations are based on power purchases for 2012 reported by the Utility to the Washington State Department of Commerce in 2013.
Big Bend Electric Coop, Inc
Market Purchases Calendar Year 2012
Total Market Purchases 29,744.929
BPA Market Purchase* 23,157.929
Utility Market Purchase 6,587.000
* “BPA Market Purchases” are the fraction of delivered BPA power that BPA purchased on the market.
**The BPA Slice product includes a small amount of wind power that is not bundled with the Renewable Energy Credits (REC) associated with that power. Such power is assigned the net system fuel mix – as though it were a market purchase.
24

Calculations are based on power purchases for 2012 reported by the Utility to the Washington State Department of Commerce in 2013.
Chewelah Light Department
Fuel Mix Calendar Year 2012
Biomass 0.09% Coal 1.60% Cogeneration 0.00% Geothermal 0.00% Hydro 88.03% Landfill Gases 0.01% Natural Gas 0.64% Nuclear 9.57% Other 0.01% Petroleum 0.02% Solar 0.00% Waste 0.04% Wind 0.00%
Total 100.00%
25

Calculations are based on power purchases for 2012 reported by the Utility to the Washington State Department of Commerce in 2013.
Chewelah Light Department
Fuel Mix Calculations Calendar Year 2012
MWh MWh from from Total Fuel Market Purchases* Claims on Resources* Percent Biomass 6.214 13.385 19.600 0.09% Coal 365.626 0.000 365.626 1.60% Cogeneration 0.000 0.000 0.000 0.00% Geothermal 0.000 0.000 0.000 0.00% Hydro 487.333 19,615.769 20,103.102 88.03% Landfill Gases 1.567 0.000 1.567 0.01% Natural Gas 127.255 19.087 146.342 0.64% Nuclear 26.825 2,157.669 2,184.493 9.57% Other 1.609 0.000 1.609 0.01% Petroleum 3.586 1.782 5.368 0.02% Solar 0.000 0.000 0.000 0.00% Waste 6.383 1.909 8.292 0.04% Wind 0.000 0.000 0.000 0.00% Total 1,026.399 21,809.601 22,836.000 100.00%
* Market Purchases include those made directly by utilities, as well as the fraction of delivered BPA power that can be attributed to BPA’s purchases of market power. Claims on Resources include those made directly by utilities, as well as the fractions of delivered BPA power that can be attributed to specific plants.
26

Calculations are based on power purchases for 2012 reported by the Utility to the Washington State Department of Commerce in 2013.
Chewelah Light Department
Claims on BPA* Calendar Year 2012 BPA Resource Mix 21,809.601
Biomass 13.385
Natural Gas 19.087
Nuclear 2,157.669
Petroleum (heavy oil) 1.782
Waste 1.909
Water 19,615.769
*The BPA Resource Mix includes only the fraction of delivered BPA power that can be attributed to specific plants. The fraction of BPA power that BPA purchased on the market is included in the “Market Purchases” table.
27

Calculations are based on power purchases for 2012 reported by the Utility to the Washington State Department of Commerce in 2013.
Chewelah Light Department
Market Purchases Calendar Year 2012
Total Market Purchases 1,026.399
BPA Market Purchase* 1,026.399
* “BPA Market Purchases” are the fraction of delivered BPA power that BPA purchased on the market.
**The BPA Slice product includes a small amount of wind power that is not bundled with the Renewable Energy Credits (REC) associated with that power. Such power is assigned the net system fuel mix – as though it were a market purchase.
28

Calculations are based on power purchases for 2012 reported by the Utility to the Washington State Department of Commerce in 2013.
City of Blaine
Fuel Mix Calendar Year 2012
Biomass 0.09% Coal 1.60% Cogeneration 0.00% Geothermal 0.00% Hydro 88.03% Landfill Gases 0.01% Natural Gas 0.64% Nuclear 9.57% Other 0.01% Petroleum 0.02% Solar 0.00% Waste 0.04% Wind 0.00%
Total 100.00%
29

Calculations are based on power purchases for 2012 reported by the Utility to the Washington State Department of Commerce in 2013.
City of Blaine
Fuel Mix Calculations Calendar Year 2012
MWh MWh from from Total Fuel Market Purchases* Claims on Resources* Percent Biomass 21.637 46.604 68.241 0.09% Coal 1,273.016 0.000 1,273.016 1.60% Cogeneration 0.000 0.000 0.000 0.00% Geothermal 0.000 0.000 0.000 0.00% Hydro 1,696.766 68,296.994 69,993.760 88.03% Landfill Gases 5.457 0.000 5.457 0.01% Natural Gas 443.068 66.457 509.526 0.64% Nuclear 93.396 7,512.439 7,605.836 9.57% Other 5.602 0.000 5.602 0.01% Petroleum 12.485 6.206 18.690 0.02% Solar 0.000 0.000 0.000 0.00% Waste 22.224 6.647 28.871 0.04% Wind 0.000 0.000 0.000 0.00% Total 3,573.653 75,935.347 79,509.000 100.00%
* Market Purchases include those made directly by utilities, as well as the fraction of delivered BPA power that can be attributed to BPA’s purchases of market power. Claims on Resources include those made directly by utilities, as well as the fractions of delivered BPA power that can be attributed to specific plants.
30

Calculations are based on power purchases for 2012 reported by the Utility to the Washington State Department of Commerce in 2013.
City of Blaine
Claims on BPA* Calendar Year 2012 BPA Resource Mix 75,935.347
Biomass 46.604
Natural Gas 66.457
Nuclear 7,512.439
Petroleum (heavy oil) 6.206
Waste 6.647
Water 68,296.994
*The BPA Resource Mix includes only the fraction of delivered BPA power that can be attributed to specific plants. The fraction of BPA power that BPA purchased on the market is included in the “Market Purchases” table.
31

Calculations are based on power purchases for 2012 reported by the Utility to the Washington State Department of Commerce in 2013.
City of Blaine
Market Purchases Calendar Year 2012
Total Market Purchases 3,573.653
BPA Market Purchase* 3,573.653
* “BPA Market Purchases” are the fraction of delivered BPA power that BPA purchased on the market.
**The BPA Slice product includes a small amount of wind power that is not bundled with the Renewable Energy Credits (REC) associated with that power. Such power is assigned the net system fuel mix – as though it were a market purchase.
32
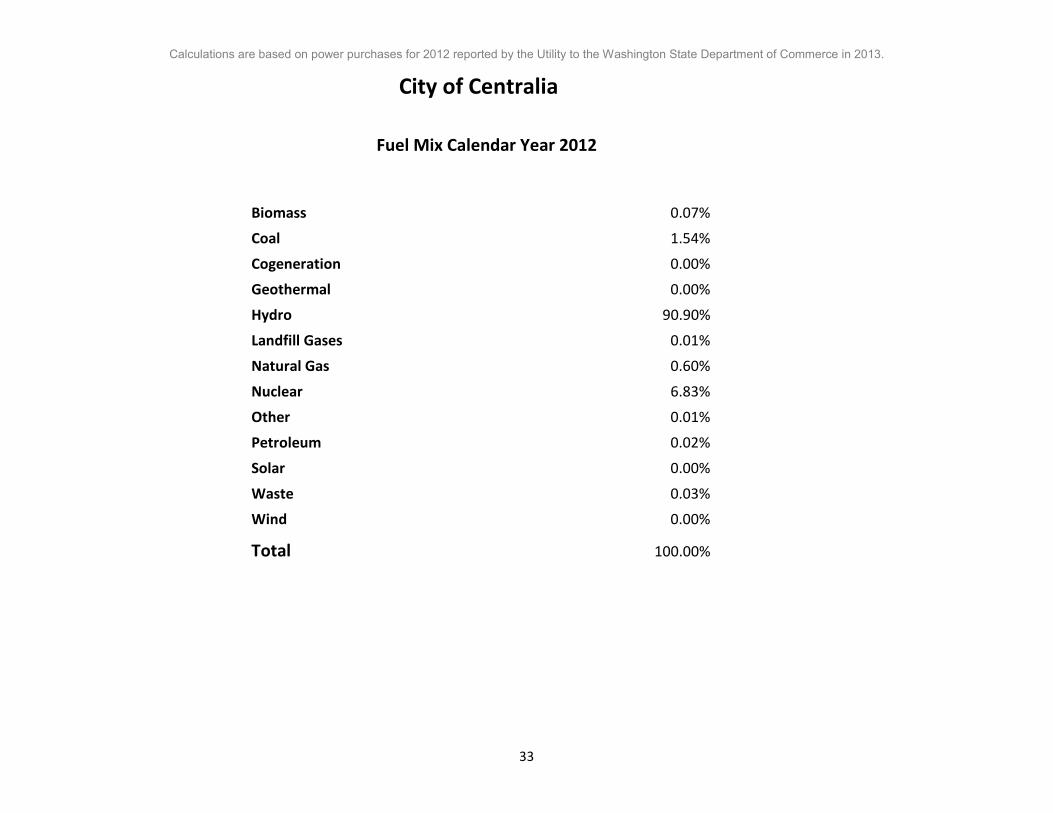
Calculations are based on power purchases for 2012 reported by the Utility to the Washington State Department of Commerce in 2013.
City of Centralia
Fuel Mix Calendar Year 2012
Biomass 0.07% Coal 1.54% Cogeneration 0.00% Geothermal 0.00% Hydro 90.90% Landfill Gases 0.01% Natural Gas 0.60% Nuclear 6.83% Other 0.01% Petroleum 0.02% Solar 0.00% Waste 0.03% Wind 0.00%
Total 100.00%
33

Calculations are based on power purchases for 2012 reported by the Utility to the Washington State Department of Commerce in 2013.
City of Centralia
Fuel Mix Calculations Calendar Year 2012
MWh MWh from from Total Fuel Market Purchases* Claims on Resources* Percent Biomass 71.857 114.273 186.129 0.07% Coal 4,227.650 0.000 4,227.650 1.54% Cogeneration 0.000 0.000 0.000 0.00% Geothermal 0.000 0.000 0.000 0.00% Hydro 5,634.913 243,726.184 249,361.097 90.90% Landfill Gases 18.124 0.000 18.124 0.01% Natural Gas 1,471.417 162.952 1,634.369 0.60% Nuclear 310.167 18,420.386 18,730.553 6.83% Other 18.606 0.000 18.606 0.01% Petroleum 41.462 15.216 56.678 0.02% Solar 0.000 0.000 0.000 0.00% Waste 73.806 16.297 90.103 0.03% Wind 0.000 0.000 0.000 0.00% Total 11,868.000 262,455.309 274,323.309 100.00%
* Market Purchases include those made directly by utilities, as well as the fraction of delivered BPA power that can be attributed to BPA’s purchases of market power. Claims on Resources include those made directly by utilities, as well as the fractions of delivered BPA power that can be attributed to specific plants.
34

Calculations are based on power purchases for 2012 reported by the Utility to the Washington State Department of Commerce in 2013.
City of Centralia
Claims on Plants Calendar Year 2012 Yelm Claim Type: PlntMix 76,263.000
Water 76,263.000
35
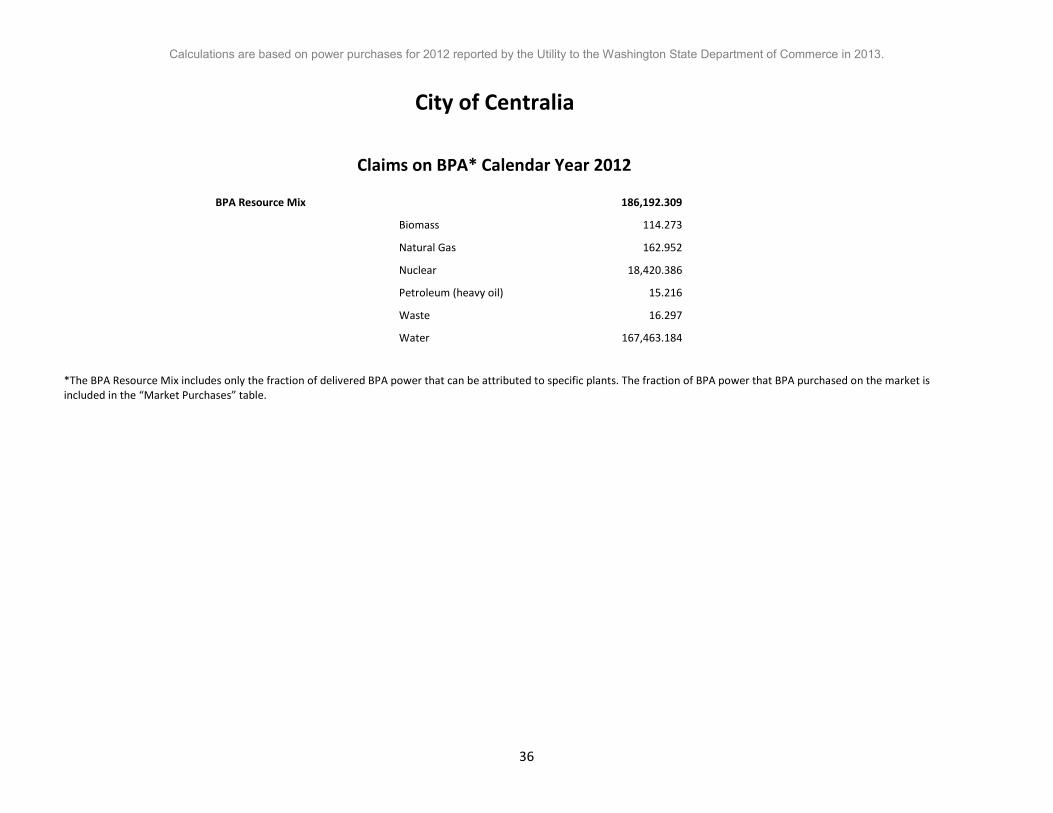
Calculations are based on power purchases for 2012 reported by the Utility to the Washington State Department of Commerce in 2013.
City of Centralia
Claims on BPA* Calendar Year 2012 BPA Resource Mix 186,192.309
Biomass 114.273
Natural Gas 162.952
Nuclear 18,420.386
Petroleum (heavy oil) 15.216
Waste 16.297
Water 167,463.184
*The BPA Resource Mix includes only the fraction of delivered BPA power that can be attributed to specific plants. The fraction of BPA power that BPA purchased on the market is included in the “Market Purchases” table.
36

Calculations are based on power purchases for 2012 reported by the Utility to the Washington State Department of Commerce in 2013.
City of Centralia
Market Purchases Calendar Year 2012
Total Market Purchases 11,868.000
BPA Market Purchase* 8,762.541
Utility Market Purchase 3,105.459
* “BPA Market Purchases” are the fraction of delivered BPA power that BPA purchased on the market.
**The BPA Slice product includes a small amount of wind power that is not bundled with the Renewable Energy Credits (REC) associated with that power. Such power is assigned the net system fuel mix – as though it were a market purchase.
37

Calculations are based on power purchases for 2012 reported by the Utility to the Washington State Department of Commerce in 2013.
City of Cheney
Fuel Mix Calendar Year 2012
Biomass 0.09% Coal 2.05% Cogeneration 0.00% Geothermal 0.00% Hydro 87.50% Landfill Gases 0.01% Natural Gas 0.80% Nuclear 9.47% Other 0.01% Petroleum 0.03% Solar 0.00% Waste 0.04% Wind 0.00%
Total 100.00%
38

Calculations are based on power purchases for 2012 reported by the Utility to the Washington State Department of Commerce in 2013.
City of Cheney
Fuel Mix Calculations Calendar Year 2012
MWh MWh from from Total Fuel Market Purchases* Claims on Resources* Percent Biomass 48.511 80.597 129.108 0.09% Coal 2,854.139 0.000 2,854.139 2.05% Cogeneration 0.000 0.000 0.000 0.00% Geothermal 0.000 0.000 0.000 0.00% Hydro 3,804.200 118,112.079 121,916.280 87.50% Landfill Gases 12.235 0.000 12.235 0.01% Natural Gas 993.372 114.930 1,108.303 0.80% Nuclear 209.398 12,991.931 13,201.329 9.47% Other 12.561 0.000 12.561 0.01% Petroleum 27.991 10.732 38.723 0.03% Solar 0.000 0.000 0.000 0.00% Waste 49.827 11.495 61.322 0.04% Wind 0.000 0.000 0.000 0.00% Total 8,012.236 131,321.764 139,334.000 100.00%
* Market Purchases include those made directly by utilities, as well as the fraction of delivered BPA power that can be attributed to BPA’s purchases of market power. Claims on Resources include those made directly by utilities, as well as the fractions of delivered BPA power that can be attributed to specific plants.
39
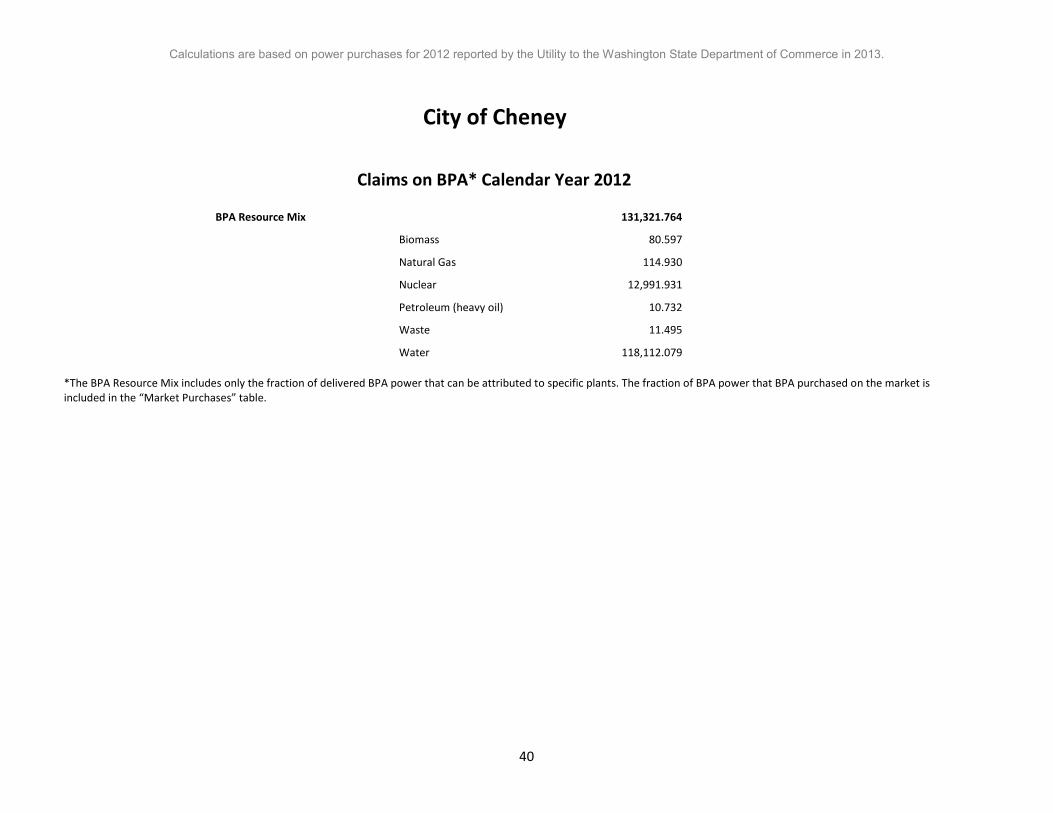
Calculations are based on power purchases for 2012 reported by the Utility to the Washington State Department of Commerce in 2013.
City of Cheney
Claims on BPA* Calendar Year 2012 BPA Resource Mix 131,321.764
Biomass 80.597
Natural Gas 114.930
Nuclear 12,991.931
Petroleum (heavy oil) 10.732
Waste 11.495
Water 118,112.079
*The BPA Resource Mix includes only the fraction of delivered BPA power that can be attributed to specific plants. The fraction of BPA power that BPA purchased on the market is included in the “Market Purchases” table.
40
Calculations are based on power purchases for 2012 reported by the Utility to the Washington State Department of Commerce in 2013.
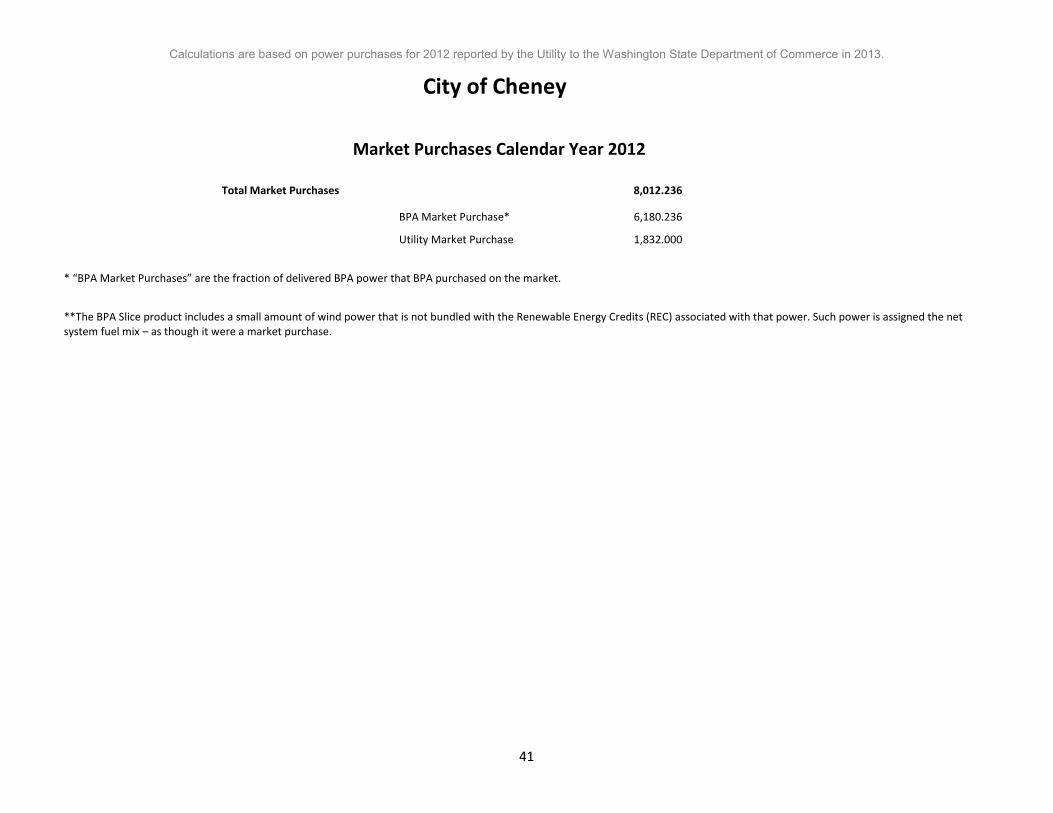
City of Cheney
Market Purchases Calendar Year 2012
Total Market Purchases 8,012.236
BPA Market Purchase* 6,180.236
Utility Market Purchase 1,832.000
* “BPA Market Purchases” are the fraction of delivered BPA power that BPA purchased on the market.
**The BPA Slice product includes a small amount of wind power that is not bundled with the Renewable Energy Credits (REC) associated with that power. Such power is assigned the net system fuel mix – as though it were a market purchase.
41

Calculations are based on power purchases for 2012 reported by the Utility to the Washington State Department of Commerce in 2013.
City of Ellensburg
Fuel Mix Calendar Year 2012
Biomass 0.09% Coal 1.60% Cogeneration 0.00% Geothermal 0.00% Hydro 88.03% Landfill Gases 0.01% Natural Gas 0.64% Nuclear 9.57% Other 0.01% Petroleum 0.02% Solar 0.00% Waste 0.04% Wind 0.00%
Total 100.00%
42

Calculations are based on power purchases for 2012 reported by the Utility to the Washington State Department of Commerce in 2013.
City of Ellensburg
Fuel Mix Calculations Calendar Year 2012
MWh MWh from from Total Fuel Market Purchases* Claims on Resources* Percent Biomass 56.758 122.251 179.009 0.09% Coal 3,339.336 0.000 3,339.336 1.60% Cogeneration 0.000 0.000 0.000 0.00% Geothermal 0.000 0.000 0.000 0.00% Hydro 4,450.906 179,154.610 183,605.515 88.03% Landfill Gases 14.315 0.000 14.315 0.01% Natural Gas 1,162.243 174.329 1,336.572 0.64% Nuclear 244.995 19,706.404 19,951.398 9.57% Other 14.696 0.000 14.696 0.01% Petroleum 32.750 16.278 49.028 0.02% Solar 0.000 0.000 0.000 0.00% Waste 58.298 17.435 75.733 0.04% Wind 0.000 0.000 0.000 0.00% Total 9,374.297 199,191.307 208,565.604 100.00%
* Market Purchases include those made directly by utilities, as well as the fraction of delivered BPA power that can be attributed to BPA’s purchases of market power. Claims on Resources include those made directly by utilities, as well as the fractions of delivered BPA power that can be attributed to specific plants.
43

Calculations are based on power purchases for 2012 reported by the Utility to the Washington State Department of Commerce in 2013.
City of Ellensburg
Claims on BPA* Calendar Year 2012 BPA Resource Mix 199,191.307
Biomass 122.251
Natural Gas 174.329
Nuclear 19,706.404
Petroleum (heavy oil) 16.278
Waste 17.435
Water 179,154.610
*The BPA Resource Mix includes only the fraction of delivered BPA power that can be attributed to specific plants. The fraction of BPA power that BPA purchased on the market is included in the “Market Purchases” table.
44

Calculations are based on power purchases for 2012 reported by the Utility to the Washington State Department of Commerce in 2013.
City of Ellensburg
Market Purchases Calendar Year 2012
Total Market Purchases 9,374.297
BPA Market Purchase* 9,374.297
* “BPA Market Purchases” are the fraction of delivered BPA power that BPA purchased on the market.
**The BPA Slice product includes a small amount of wind power that is not bundled with the Renewable Energy Credits (REC) associated with that power. Such power is assigned the net system fuel mix – as though it were a market purchase.
45

Calculations are based on power purchases for 2012 reported by the Utility to the Washington State Department of Commerce in 2013.
City of Milton
Fuel Mix Calendar Year 2012
Biomass 0.09% Coal 1.60% Cogeneration 0.00% Geothermal 0.00% Hydro 88.03% Landfill Gases 0.01% Natural Gas 0.64% Nuclear 9.57% Other 0.01% Petroleum 0.02% Solar 0.00% Waste 0.04% Wind 0.00%
Total 100.00%
46

Calculations are based on power purchases for 2012 reported by the Utility to the Washington State Department of Commerce in 2013.
City of Milton
Fuel Mix Calculations Calendar Year 2012
MWh MWh from from Total Fuel Market Purchases* Claims on Resources* Percent Biomass 16.055 34.580 50.635 0.09% Coal 944.567 0.000 944.567 1.60% Cogeneration 0.000 0.000 0.000 0.00% Geothermal 0.000 0.000 0.000 0.00% Hydro 1,258.986 50,675.787 51,934.773 88.03% Landfill Gases 4.049 0.000 4.049 0.01% Natural Gas 328.753 49.311 378.064 0.64% Nuclear 69.299 5,574.166 5,643.465 9.57% Other 4.157 0.000 4.157 0.01% Petroleum 9.264 4.605 13.868 0.02% Solar 0.000 0.000 0.000 0.00% Waste 16.490 4.932 21.422 0.04% Wind 0.000 0.000 0.000 0.00% Total 2,651.620 56,343.380 58,995.000 100.00%
* Market Purchases include those made directly by utilities, as well as the fraction of delivered BPA power that can be attributed to BPA’s purchases of market power. Claims on Resources include those made directly by utilities, as well as the fractions of delivered BPA power that can be attributed to specific plants.
47

Calculations are based on power purchases for 2012 reported by the Utility to the Washington State Department of Commerce in 2013.
City of Milton
Claims on BPA* Calendar Year 2012 BPA Resource Mix 56,343.380
Biomass 34.580
Natural Gas 49.311
Nuclear 5,574.166
Petroleum (heavy oil) 4.605
Waste 4.932
Water 50,675.787
*The BPA Resource Mix includes only the fraction of delivered BPA power that can be attributed to specific plants. The fraction of BPA power that BPA purchased on the market is included in the “Market Purchases” table.
48

Calculations are based on power purchases for 2012 reported by the Utility to the Washington State Department of Commerce in 2013.
City of Milton
Market Purchases Calendar Year 2012
Total Market Purchases 2,651.620
BPA Market Purchase* 2,651.620
* “BPA Market Purchases” are the fraction of delivered BPA power that BPA purchased on the market.
**The BPA Slice product includes a small amount of wind power that is not bundled with the Renewable Energy Credits (REC) associated with that power. Such power is assigned the net system fuel mix – as though it were a market purchase.
49

Calculations are based on power purchases for 2012 reported by the Utility to the Washington State Department of Commerce in 2013.
City of Port Angeles
Fuel Mix Calendar Year 2012
Biomass 0.09% Coal 1.64% Cogeneration 0.00% Geothermal 0.00% Hydro 88.00% Landfill Gases 0.01% Natural Gas 0.65% Nuclear 9.55% Other 0.01% Petroleum 0.02% Solar 0.00% Waste 0.04% Wind 0.00%
Total 100.00%
50

Calculations are based on power purchases for 2012 reported by the Utility to the Washington State Department of Commerce in 2013.
City of Port Angeles
Fuel Mix Calculations Calendar Year 2012
MWh MWh from from Total Fuel Market Purchases* Claims on Resources* Percent Biomass 203.414 427.848 631.261 0.09% Coal 11,967.739 0.000 11,967.739 1.64% Cogeneration 0.000 0.000 0.000 0.00% Geothermal 0.000 0.000 0.000 0.00% Hydro 15,951.455 627,724.843 643,676.298 88.00% Landfill Gases 51.305 0.000 51.305 0.01% Natural Gas 4,165.326 610.108 4,775.433 0.65% Nuclear 878.029 68,967.574 69,845.603 9.55% Other 52.669 0.000 52.669 0.01% Petroleum 117.371 56.971 174.342 0.02% Solar 0.000 0.000 0.000 0.00% Waste 208.932 61.019 269.951 0.04% Wind 0.000 0.000 0.000 0.00% Total 33,596.239 697,848.361 731,444.600 100.00%
* Market Purchases include those made directly by utilities, as well as the fraction of delivered BPA power that can be attributed to BPA’s purchases of market power. Claims on Resources include those made directly by utilities, as well as the fractions of delivered BPA power that can be attributed to specific plants.
51

Calculations are based on power purchases for 2012 reported by the Utility to the Washington State Department of Commerce in 2013.
City of Port Angeles
Claims on Plants Calendar Year 2012 Morse Creek Claim Type: PlntMix 727.700
Water 727.700
52

Calculations are based on power purchases for 2012 reported by the Utility to the Washington State Department of Commerce in 2013.
City of Port Angeles
Claims on BPA* Calendar Year 2012 BPA Resource Mix 697,120.661
Biomass 427.848
Natural Gas 610.108
Nuclear 68,967.574
Petroleum (heavy oil) 56.971
Waste 61.019
Water 626,997.143
*The BPA Resource Mix includes only the fraction of delivered BPA power that can be attributed to specific plants. The fraction of BPA power that BPA purchased on the market is included in the “Market Purchases” table.
53

Calculations are based on power purchases for 2012 reported by the Utility to the Washington State Department of Commerce in 2013.
City of Port Angeles
Market Purchases Calendar Year 2012
Total Market Purchases 33,596.239
BPA Market Purchase* 32,807.739
Utility Market Purchase 788.500
* “BPA Market Purchases” are the fraction of delivered BPA power that BPA purchased on the market.
**The BPA Slice product includes a small amount of wind power that is not bundled with the Renewable Energy Credits (REC) associated with that power. Such power is assigned the net system fuel mix – as though it were a market purchase.
54

Calculations are based on power purchases for 2012 reported by the Utility to the Washington State Department of Commerce in 2013.
City of Richland
Fuel Mix Calendar Year 2012
Biomass 0.09% Coal 2.07% Cogeneration 0.00% Geothermal 0.00% Hydro 87.48% Landfill Gases 0.01% Natural Gas 0.80% Nuclear 9.47% Other 0.01% Petroleum 0.03% Solar 0.00% Waste 0.04% Wind 0.00%
Total 100.00%
55

Calculations are based on power purchases for 2012 reported by the Utility to the Washington State Department of Commerce in 2013.
City of Richland
Fuel Mix Calculations Calendar Year 2012
MWh MWh from from Total Fuel Market Purchases* Claims on Resources* Percent Biomass 303.494 499.102 802.596 0.09% Coal 17,855.944 0.000 17,855.944 2.07% Cogeneration 0.000 0.000 0.000 0.00% Geothermal 0.000 0.000 0.000 0.00% Hydro 23,799.676 731,417.603 755,217.279 87.48% Landfill Gases 76.547 0.000 76.547 0.01% Natural Gas 6,214.693 711.715 6,926.408 0.80% Nuclear 1,310.025 80,453.473 81,763.498 9.47% Other 78.583 0.000 78.583 0.01% Petroleum 175.118 66.459 241.577 0.03% Solar 0.000 0.000 0.000 0.00% Waste 311.728 71.181 382.909 0.04% Wind 0.000 0.000 0.000 0.00% Total 50,125.809 813,219.532 863,345.341 100.00%
* Market Purchases include those made directly by utilities, as well as the fraction of delivered BPA power that can be attributed to BPA’s purchases of market power. Claims on Resources include those made directly by utilities, as well as the fractions of delivered BPA power that can be attributed to specific plants.
56

Calculations are based on power purchases for 2012 reported by the Utility to the Washington State Department of Commerce in 2013.
City of Richland
Claims on BPA* Calendar Year 2012 BPA Resource Mix 813,219.532
Biomass 499.102
Natural Gas 711.715
Nuclear 80,453.473
Petroleum (heavy oil) 66.459
Waste 71.181
Water 731,417.603
*The BPA Resource Mix includes only the fraction of delivered BPA power that can be attributed to specific plants. The fraction of BPA power that BPA purchased on the market is included in the “Market Purchases” table.
57

Calculations are based on power purchases for 2012 reported by the Utility to the Washington State Department of Commerce in 2013.
City of Richland
Market Purchases Calendar Year 2012
Total Market Purchases 50,125.809
BPA Market Purchase* 38,271.559
Utility Market Purchase 11,854.250
* “BPA Market Purchases” are the fraction of delivered BPA power that BPA purchased on the market.
**The BPA Slice product includes a small amount of wind power that is not bundled with the Renewable Energy Credits (REC) associated with that power. Such power is assigned the net system fuel mix – as though it were a market purchase.
.
58

Calculations are based on power purchases for 2012 reported by the Utility to the Washington State Department of Commerce in 2013.
City of Sumas
Fuel Mix Calendar Year 2012
Biomass 0.09% Coal 1.60% Cogeneration 0.00% Geothermal 0.00% Hydro 88.03% Landfill Gases 0.01% Natural Gas 0.64% Nuclear 9.57% Other 0.01% Petroleum 0.02% Solar 0.00% Waste 0.04% Wind 0.00%
Total 100.00%
59

Calculations are based on power purchases for 2012 reported by the Utility to the Washington State Department of Commerce in 2013.
City of Sumas
Fuel Mix Calculations Calendar Year 2012
MWh MWh from from Total Fuel Market Purchases* Claims on Resources* Percent Biomass 8.028 17.291 25.319 0.09% Coal 472.307 0.000 472.307 1.60% Cogeneration 0.000 0.000 0.000 0.00% Geothermal 0.000 0.000 0.000 0.00% Hydro 629.525 25,339.182 25,968.707 88.03% Landfill Gases 2.025 0.000 2.025 0.01% Natural Gas 164.385 24.657 189.041 0.64% Nuclear 34.651 2,787.225 2,821.876 9.57% Other 2.079 0.000 2.079 0.01% Petroleum 4.632 2.302 6.934 0.02% Solar 0.000 0.000 0.000 0.00% Waste 8.246 2.466 10.712 0.04% Wind 0.000 0.000 0.000 0.00% Total 1,325.877 28,173.123 29,499.000 100.00%
* Market Purchases include those made directly by utilities, as well as the fraction of delivered BPA power that can be attributed to BPA’s purchases of market power. Claims on Resources include those made directly by utilities, as well as the fractions of delivered BPA power that can be attributed to specific plants.
60

Calculations are based on power purchases for 2012 reported by the Utility to the Washington State Department of Commerce in 2013.
City of Sumas
Claims on BPA* Calendar Year 2012 BPA Resource Mix 28,173.123
Biomass 17.291
Natural Gas 24.657
Nuclear 2,787.225
Petroleum (heavy oil) 2.302
Waste 2.466
Water 25,339.182
*The BPA Resource Mix includes only the fraction of delivered BPA power that can be attributed to specific plants. The fraction of BPA power that BPA purchased on the market is included in the “Market Purchases” table.
61

Calculations are based on power purchases for 2012 reported by the Utility to the Washington State Department of Commerce in 2013.
City of Sumas
Market Purchases Calendar Year 2012
Total Market Purchases 1,325.877
BPA Market Purchase* 1,325.877
* “BPA Market Purchases” are the fraction of delivered BPA power that BPA purchased on the market.
**The BPA Slice product includes a small amount of wind power that is not bundled with the Renewable Energy Credits (REC) associated with that power. Such power is assigned the net system fuel mix – as though it were a market purchase.
62

Calculations are based on power purchases for 2012 reported by the Utility to the Washington State Department of Commerce in 2013.
Clearwater Power Company
Fuel Mix Calendar Year 2012
Biomass 0.09% Coal 1.60% Cogeneration 0.00% Geothermal 0.00% Hydro 88.03% Landfill Gases 0.01% Natural Gas 0.64% Nuclear 9.57% Other 0.01% Petroleum 0.02% Solar 0.00% Waste 0.04% Wind 0.00%
Total 100.00%
63

Calculations are based on power purchases for 2012 reported by the Utility to the Washington State Department of Commerce in 2013.
Clearwater Power Company
Fuel Mix Calculations Calendar Year 2012
MWh MWh from from Total Fuel Market Purchases* Claims on Resources* Percent Biomass 3.936 8.478 12.414 0.09% Coal 231.586 0.000 231.586 1.60% Cogeneration 0.000 0.000 0.000 0.00% Geothermal 0.000 0.000 0.000 0.00% Hydro 308.674 12,424.525 12,733.199 88.03% Landfill Gases 0.993 0.000 0.993 0.01% Natural Gas 80.603 12.090 92.692 0.64% Nuclear 16.991 1,366.656 1,383.646 9.57% Other 1.019 0.000 1.019 0.01% Petroleum 2.271 1.129 3.400 0.02% Solar 0.000 0.000 0.000 0.00% Waste 4.043 1.209 5.252 0.04% Wind 0.000 0.000 0.000 0.00% Total 650.115 13,814.087 14,464.202 100.00%
* Market Purchases include those made directly by utilities, as well as the fraction of delivered BPA power that can be attributed to BPA’s purchases of market power. Claims on Resources include those made directly by utilities, as well as the fractions of delivered BPA power that can be attributed to specific plants.
64

Calculations are based on power purchases for 2012 reported by the Utility to the Washington State Department of Commerce in 2013.
Clearwater Power Company
Claims on BPA* Calendar Year 2012 BPA Resource Mix 13,814.087
Biomass 8.478
Natural Gas 12.090
Nuclear 1,366.656
Petroleum (heavy oil) 1.129
Waste 1.209
Water 12,424.525
*The BPA Resource Mix includes only the fraction of delivered BPA power that can be attributed to specific plants. The fraction of BPA power that BPA purchased on the market is included in the “Market Purchases” table.
65

Calculations are based on power purchases for 2012 reported by the Utility to the Washington State Department of Commerce in 2013.
Clearwater Power Company
Market Purchases Calendar Year 2012
Total Market Purchases 650.115
BPA Market Purchase* 650.115
* “BPA Market Purchases” are the fraction of delivered BPA power that BPA purchased on the market.
**The BPA Slice product includes a small amount of wind power that is not bundled with the Renewable Energy Credits (REC) associated with that power. Such power is assigned the net system fuel mix – as though it were a market purchase.
66

Calculations are based on power purchases for 2012 reported by the Utility to the Washington State Department of Commerce in 2013.
Columbia Rural Electric Association, Inc
Fuel Mix Calendar Year 2012
Biomass 0.12% Coal 3.69% Cogeneration 0.00% Geothermal 0.00% Hydro 85.55% Landfill Gases 0.02% Natural Gas 1.36% Nuclear 9.14% Other 0.02% Petroleum 0.04% Solar 0.00% Waste 0.07% Wind 0.00%
Total 100.00%
67

Calculations are based on power purchases for 2012 reported by the Utility to the Washington State Department of Commerce in 2013.
Columbia Rural Electric Association, Inc
Fuel Mix Calculations Calendar Year 2012
MWh MWh from from Total Fuel Market Purchases* Claims on Resources* Percent Biomass 198.659 174.384 373.042 0.12% Coal 11,687.984 0.000 11,687.984 3.69% Cogeneration 0.000 0.000 0.000 0.00% Geothermal 0.000 0.000 0.000 0.00% Hydro 15,578.579 255,553.886 271,132.465 85.55% Landfill Gases 50.105 0.000 50.105 0.02% Natural Gas 4,067.958 248.670 4,316.628 1.36% Nuclear 857.504 28,110.067 28,967.571 9.14% Other 51.438 0.000 51.438 0.02% Petroleum 114.627 23.220 137.848 0.04% Solar 0.000 0.000 0.000 0.00% Waste 204.048 24.870 228.919 0.07% Wind 0.000 0.000 0.000 0.00% Total 32,810.903 284,135.097 316,946.000 100.00%
* Market Purchases include those made directly by utilities, as well as the fraction of delivered BPA power that can be attributed to BPA’s purchases of market power. Claims on Resources include those made directly by utilities, as well as the fractions of delivered BPA power that can be attributed to specific plants.
68

Calculations are based on power purchases for 2012 reported by the Utility to the Washington State Department of Commerce in 2013.
Columbia Rural Electric Association, Inc
Claims on BPA* Calendar Year 2012 BPA Resource Mix 284,135.097
Biomass 174.384
Natural Gas 248.670
Nuclear 28,110.067
Petroleum (heavy oil) 23.220
Waste 24.870
Water 255,553.886
*The BPA Resource Mix includes only the fraction of delivered BPA power that can be attributed to specific plants. The fraction of BPA power that BPA purchased on the market is included in the “Market Purchases” table.
69
Calculations are based on power purchases for 2012 reported by the Utility to the Washington State Department of Commerce in 2013.
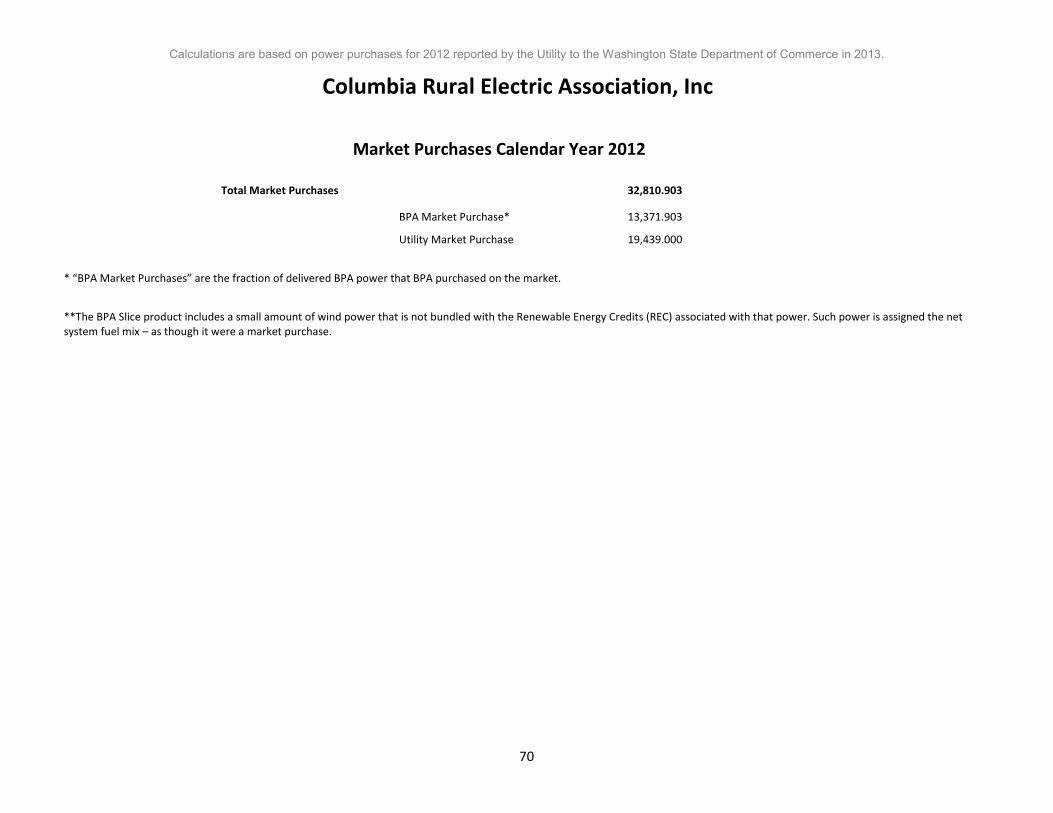
Columbia Rural Electric Association, Inc
Market Purchases Calendar Year 2012
Total Market Purchases 32,810.903
BPA Market Purchase* 13,371.903
Utility Market Purchase 19,439.000
* “BPA Market Purchases” are the fraction of delivered BPA power that BPA purchased on the market.
**The BPA Slice product includes a small amount of wind power that is not bundled with the Renewable Energy Credits (REC) associated with that power. Such power is assigned the net system fuel mix – as though it were a market purchase.
70

Calculations are based on power purchases for 2012 reported by the Utility to the Washington State Department of Commerce in 2013.
Coulee Dam Light Department
Fuel Mix Calendar Year 2012
Biomass 0.09% Coal 1.60% Cogeneration 0.00% Geothermal 0.00% Hydro 88.03% Landfill Gases 0.01% Natural Gas 0.64% Nuclear 9.57% Other 0.01% Petroleum 0.02% Solar 0.00% Waste 0.04% Wind 0.00%
Total 100.00%
71

Calculations are based on power purchases for 2012 reported by the Utility to the Washington State Department of Commerce in 2013.
Coulee Dam Light Department
Fuel Mix Calculations Calendar Year 2012
MWh MWh from from Total Fuel Market Purchases* Claims on Resources* Percent Biomass 4.788 10.314 15.102 0.09% Coal 281.729 0.000 281.729 1.60% Cogeneration 0.000 0.000 0.000 0.00% Geothermal 0.000 0.000 0.000 0.00% Hydro 375.508 15,114.690 15,490.199 88.03% Landfill Gases 1.208 0.000 1.208 0.01% Natural Gas 98.055 14.708 112.762 0.64% Nuclear 20.669 1,662.565 1,683.234 9.57% Other 1.240 0.000 1.240 0.01% Petroleum 2.763 1.373 4.136 0.02% Solar 0.000 0.000 0.000 0.00% Waste 4.918 1.471 6.389 0.04% Wind 0.000 0.000 0.000 0.00% Total 790.879 16,805.121 17,596.000 100.00%
* Market Purchases include those made directly by utilities, as well as the fraction of delivered BPA power that can be attributed to BPA’s purchases of market power. Claims on Resources include those made directly by utilities, as well as the fractions of delivered BPA power that can be attributed to specific plants.
72

Calculations are based on power purchases for 2012 reported by the Utility to the Washington State Department of Commerce in 2013.
Coulee Dam Light Department
Claims on BPA* Calendar Year 2012 BPA Resource Mix 16,805.121
Biomass 10.314
Natural Gas 14.708
Nuclear 1,662.565
Petroleum (heavy oil) 1.373
Waste 1.471
Water 15,114.690
*The BPA Resource Mix includes only the fraction of delivered BPA power that can be attributed to specific plants. The fraction of BPA power that BPA purchased on the market is included in the “Market Purchases” table.
73

Calculations are based on power purchases for 2012 reported by the Utility to the Washington State Department of Commerce in 2013.
Coulee Dam Light Department
Market Purchases Calendar Year 2012
Total Market Purchases 790.879
BPA Market Purchase* 790.879
* “BPA Market Purchases” are the fraction of delivered BPA power that BPA purchased on the market.
**The BPA Slice product includes a small amount of wind power that is not bundled with the Renewable Energy Credits (REC) associated with that power. Such power is assigned the net system fuel mix – as though it were a market purchase.
74
Calculations are based on power purchases for 2012 reported by the Utility to the Washington State Department of Commerce in 2013.
Elmhurst Mutual Power &Light Co
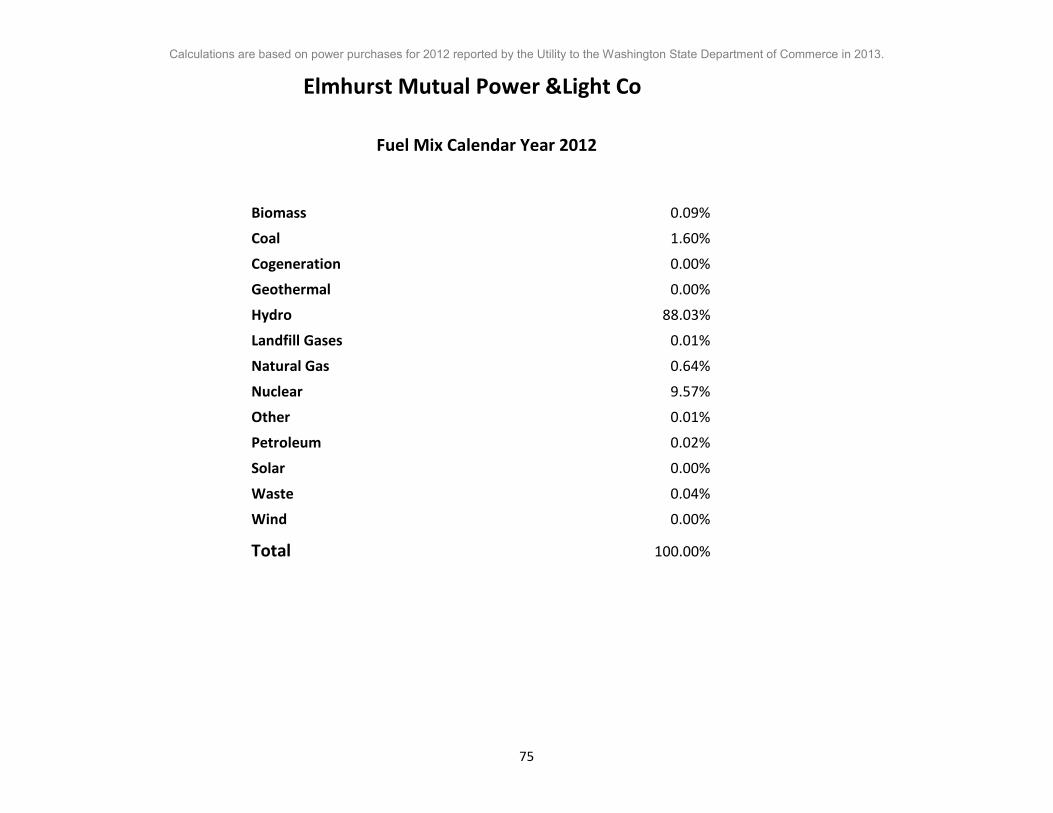
Fuel Mix Calendar Year 2012
Biomass 0.09% Coal 1.60% Cogeneration 0.00% Geothermal 0.00% Hydro 88.03% Landfill Gases 0.01% Natural Gas 0.64% Nuclear 9.57% Other 0.01% Petroleum 0.02% Solar 0.00% Waste 0.04% Wind 0.00%
Total 100.00%
75

Calculations are based on power purchases for 2012 reported by the Utility to the Washington State Department of Commerce in 2013.
Elmhurst Mutual Power &Light Co
Fuel Mix Calculations Calendar Year 2012
MWh MWh from from Total Fuel Market Purchases* Claims on Resources* Percent Biomass 74.337 160.113 234.450 0.09% Coal 4,373.571 0.000 4,373.571 1.60% Cogeneration 0.000 0.000 0.000 0.00% Geothermal 0.000 0.000 0.000 0.00% Hydro 5,829.407 234,641.050 240,470.457 88.03% Landfill Gases 18.749 0.000 18.749 0.01% Natural Gas 1,522.205 228.320 1,750.525 0.64% Nuclear 320.873 25,809.725 26,130.598 9.57% Other 19.248 0.000 19.248 0.01% Petroleum 42.893 21.320 64.213 0.02% Solar 0.000 0.000 0.000 0.00% Waste 76.354 22.835 99.189 0.04% Wind 0.000 0.000 0.000 0.00% Total 12,277.635 260,883.365 273,161.000 100.00%
* Market Purchases include those made directly by utilities, as well as the fraction of delivered BPA power that can be attributed to BPA’s purchases of market power. Claims on Resources include those made directly by utilities, as well as the fractions of delivered BPA power that can be attributed to specific plants.
76

Calculations are based on power purchases for 2012 reported by the Utility to the Washington State Department of Commerce in 2013.
Elmhurst Mutual Power &Light Co
Claims on BPA* Calendar Year 2012 BPA Resource Mix 260,883.365
Biomass 160.113
Natural Gas 228.320
Nuclear 25,809.725
Petroleum (heavy oil) 21.320
Waste 22.835
Water 234,641.050
*The BPA Resource Mix includes only the fraction of delivered BPA power that can be attributed to specific plants. The fraction of BPA power that BPA purchased on the market is included in the “Market Purchases” table.
77

Calculations are based on power purchases for 2012 reported by the Utility to the Washington State Department of Commerce in 2013.
Elmhurst Mutual Power &Light Co
Market Purchases Calendar Year 2012
Total Market Purchases 12,277.635
BPA Market Purchase* 12,277.635
* “BPA Market Purchases” are the fraction of delivered BPA power that BPA purchased on the market.
**The BPA Slice product includes a small amount of wind power that is not bundled with the Renewable Energy Credits (REC) associated with that power. Such power is assigned the net system fuel mix – as though it were a market purchase.
78
Calculations are based on power purchases for 2012 reported by the Utility to the Washington State Department of Commerce in 2013.
Inland Power & Light Company
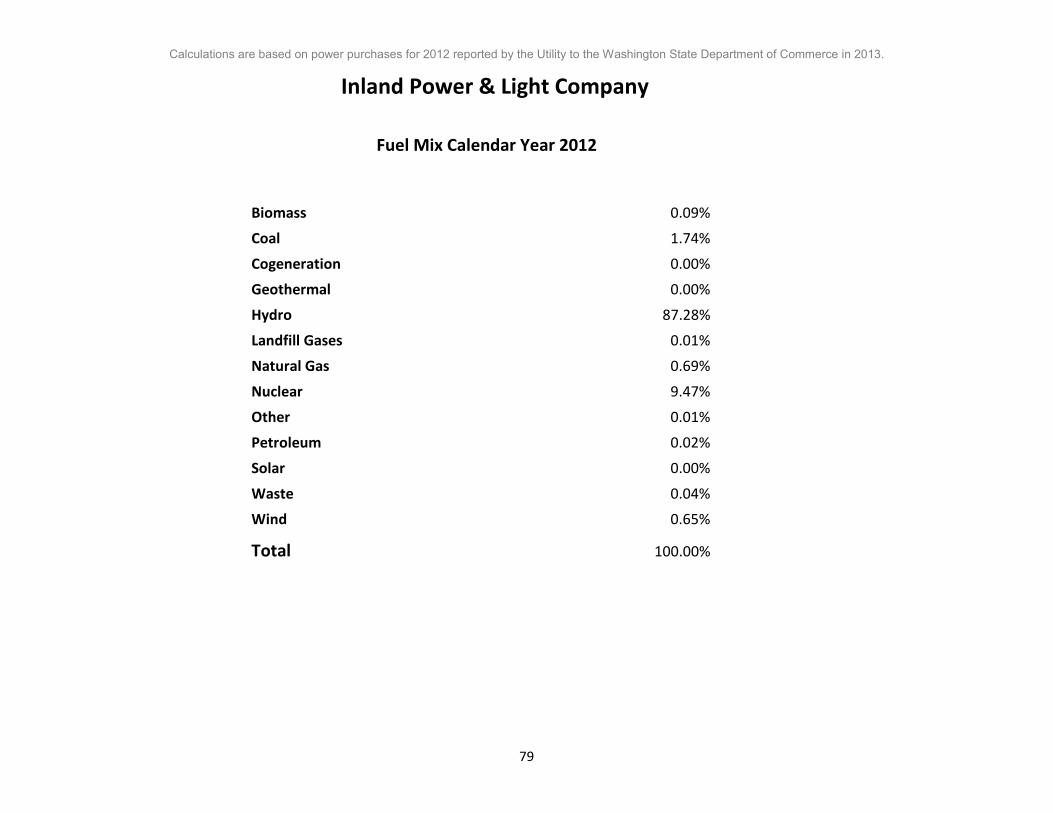
Fuel Mix Calendar Year 2012
Biomass 0.09% Coal 1.74% Cogeneration 0.00% Geothermal 0.00% Hydro 87.28% Landfill Gases 0.01% Natural Gas 0.69% Nuclear 9.47% Other 0.01% Petroleum 0.02% Solar 0.00% Waste 0.04% Wind 0.65%
Total 100.00%
79

Calculations are based on power purchases for 2012 reported by the Utility to the Washington State Department of Commerce in 2013.
Inland Power & Light Company
Fuel Mix Calculations Calendar Year 2012
MWh MWh from from Total Fuel Market Purchases* Claims on Resources* Percent Biomass 265.602 520.553 786.155 0.09% Coal 15,626.580 0.000 15,626.580 1.74% Cogeneration 0.000 0.000 0.000 0.00% Geothermal 0.000 0.000 0.000 0.00% Hydro 20,828.220 762,853.779 783,681.999 87.28% Landfill Gases 66.990 0.000 66.990 0.01% Natural Gas 5,438.771 742.305 6,181.076 0.69% Nuclear 1,146.464 83,911.347 85,057.811 9.47% Other 68.772 0.000 68.772 0.01% Petroleum 153.254 69.315 222.569 0.02% Solar 0.000 0.000 0.000 0.00% Waste 272.808 74.240 347.048 0.04% Wind 0.000 5,822.000 5,822.000 0.65% Total 43,867.462 853,993.538 897,861.000 100.00%
* Market Purchases include those made directly by utilities, as well as the fraction of delivered BPA power that can be attributed to BPA’s purchases of market power. Claims on Resources include those made directly by utilities, as well as the fractions of delivered BPA power that can be attributed to specific plants.
80
Calculations are based on power purchases for 2012 reported by the Utility to the Washington State Department of Commerce in 2013.
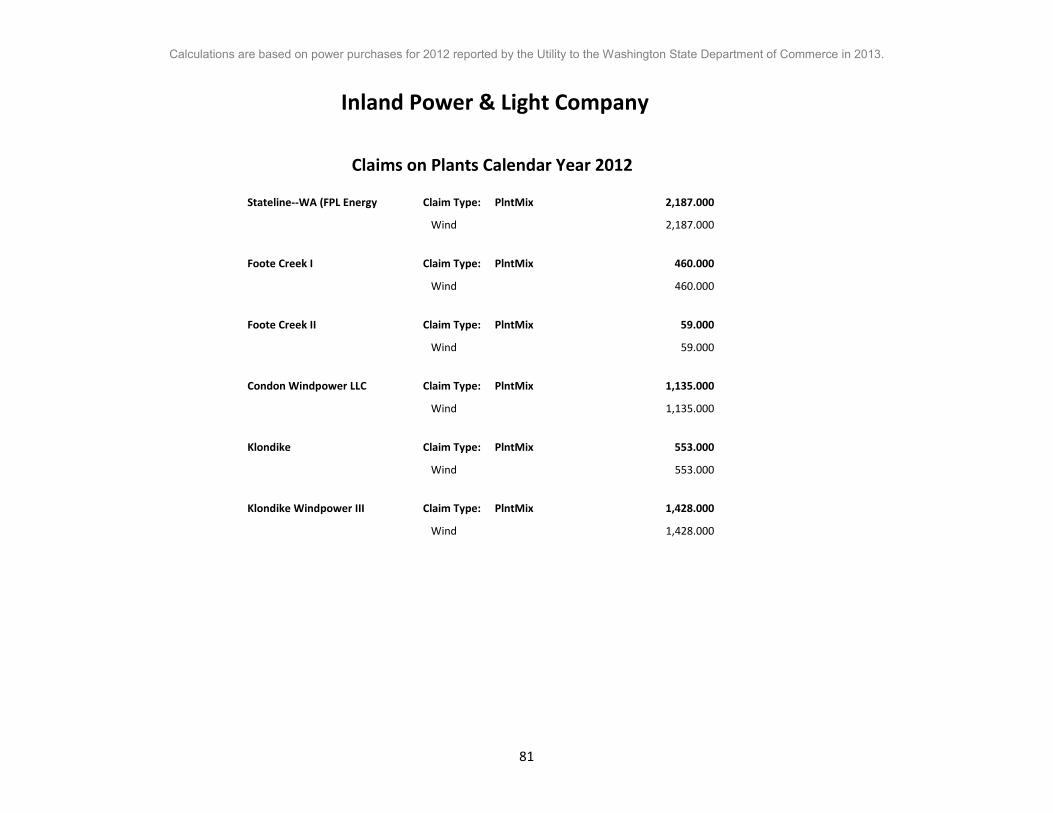
Inland Power & Light Company
Claims on Plants Calendar Year 2012 Stateline--WA (FPL Energy Claim Type: PlntMix 2,187.000
Wind 2,187.000
Foote Creek I Claim Type: PlntMix 460.000
Wind 460.000
Foote Creek II Claim Type: PlntMix 59.000
Wind 59.000
Condon Windpower LLC Claim Type: PlntMix 1,135.000
Wind 1,135.000
Klondike Claim Type: PlntMix 553.000
Wind 553.000
Klondike Windpower III Claim Type: PlntMix 1,428.000
Wind 1,428.000
81
Calculations are based on power purchases for 2012 reported by the Utility to the Washington State Department of Commerce in 2013.
Inland Power & Light Company
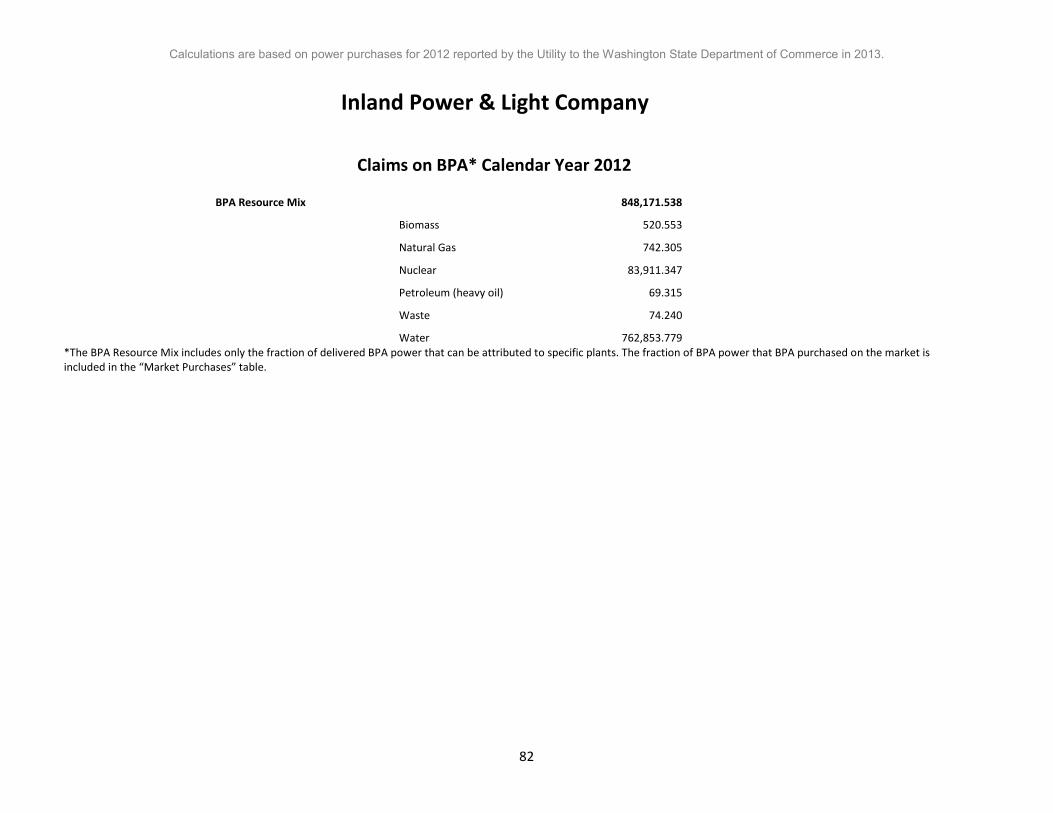
Claims on BPA* Calendar Year 2012 BPA Resource Mix 848,171.538
Biomass 520.553
Natural Gas 742.305
Nuclear 83,911.347
Petroleum (heavy oil) 69.315
Waste 74.240
Water 762,853.779 *The BPA Resource Mix includes only the fraction of delivered BPA power that can be attributed to specific plants. The fraction of BPA power that BPA purchased on the market is included in the “Market Purchases” table.
82

Calculations are based on power purchases for 2012 reported by the Utility to the Washington State Department of Commerce in 2013.
Inland Power & Light Company
Market Purchases Calendar Year 2012
Total Market Purchases 43,867.462
BPA Market Purchase* 39,916.462
Utility Market Purchase 3,951.000
* “BPA Market Purchases” are the fraction of delivered BPA power that BPA purchased on the market.
**The BPA Slice product includes a small amount of wind power that is not bundled with the Renewable Energy Credits (REC) associated with that power. Such power is assigned the net system fuel mix – as though it were a market purchase.
.
83

Calculations are based on power purchases for 2012 reported by the Utility to the Washington State Department of Commerce in 2013.
Lakeview Light & Power
Fuel Mix Calendar Year 2012
Biomass 0.09% Coal 1.60% Cogeneration 0.00% Geothermal 0.00% Hydro 88.03% Landfill Gases 0.01% Natural Gas 0.64% Nuclear 9.57% Other 0.01% Petroleum 0.02% Solar 0.00% Waste 0.04% Wind 0.00%
Total 100.00%
84

Calculations are based on power purchases for 2012 reported by the Utility to the Washington State Department of Commerce in 2013.
Lakeview Light & Power
Fuel Mix Calculations Calendar Year 2012
MWh MWh from from Total Fuel Market Purchases* Claims on Resources* Percent Biomass 74.291 160.015 234.307 0.09% Coal 4,370.893 0.000 4,370.893 1.60% Cogeneration 0.000 0.000 0.000 0.00% Geothermal 0.000 0.000 0.000 0.00% Hydro 5,825.838 234,497.370 240,323.207 88.03% Landfill Gases 18.738 0.000 18.738 0.01% Natural Gas 1,521.272 228.181 1,749.453 0.64% Nuclear 320.676 25,793.921 26,114.597 9.57% Other 19.236 0.000 19.236 0.01% Petroleum 42.867 21.307 64.174 0.02% Solar 0.000 0.000 0.000 0.00% Waste 76.307 22.821 99.128 0.04% Wind 0.000 0.000 0.000 0.00% Total 12,270.117 260,723.615 272,993.732 100.00%
* Market Purchases include those made directly by utilities, as well as the fraction of delivered BPA power that can be attributed to BPA’s purchases of market power. Claims on Resources include those made directly by utilities, as well as the fractions of delivered BPA power that can be attributed to specific plants.
85

Calculations are based on power purchases for 2012 reported by the Utility to the Washington State Department of Commerce in 2013.
Lakeview Light & Power
Claims on BPA* Calendar Year 2012 BPA Resource Mix 260,723.615
Biomass 160.015
Natural Gas 228.181
Nuclear 25,793.921
Petroleum (heavy oil) 21.307
Waste 22.821
Water 234,497.370
*The BPA Resource Mix includes only the fraction of delivered BPA power that can be attributed to specific plants. The fraction of BPA power that BPA purchased on the market is included in the “Market Purchases” table.
86
Calculations are based on power purchases for 2012 reported by the Utility to the Washington State Department of Commerce in 2013.
Lakeview Light & Power
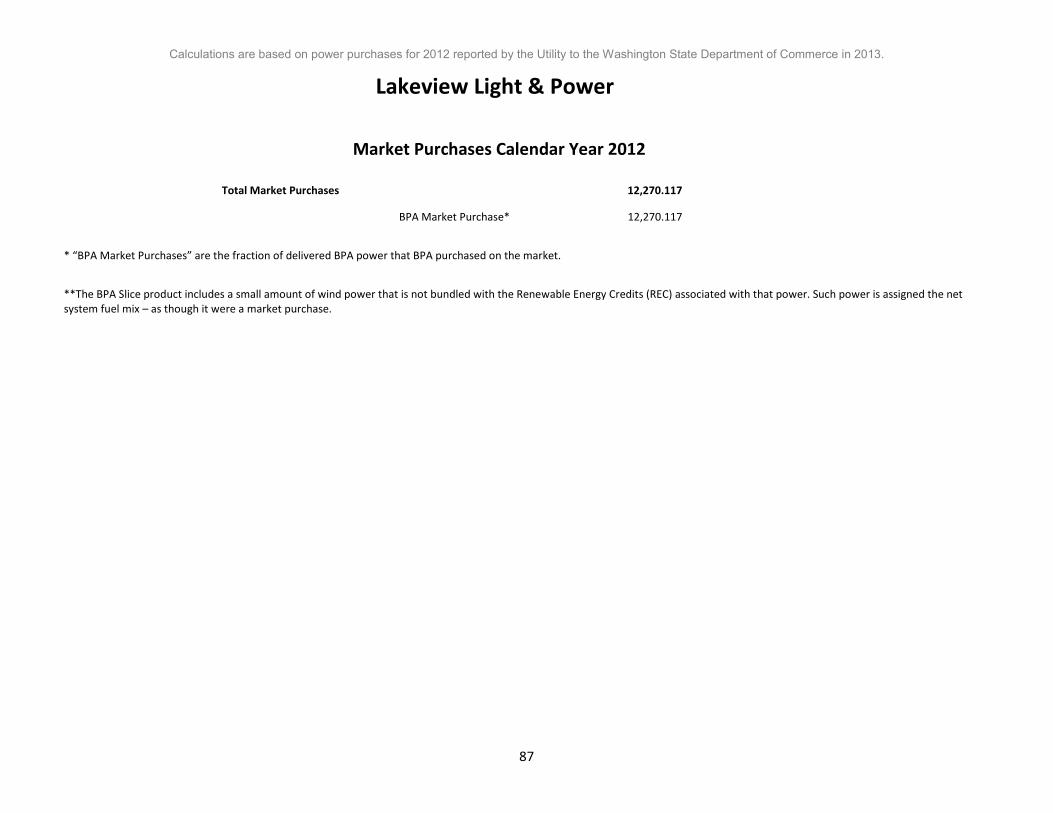
Market Purchases Calendar Year 2012
Total Market Purchases 12,270.117
BPA Market Purchase* 12,270.117
* “BPA Market Purchases” are the fraction of delivered BPA power that BPA purchased on the market.
**The BPA Slice product includes a small amount of wind power that is not bundled with the Renewable Energy Credits (REC) associated with that power. Such power is assigned the net system fuel mix – as though it were a market purchase.
87

Calculations are based on power purchases for 2012 reported by the Utility to the Washington State Department of Commerce in 2013.
McCleary Light & Power
Fuel Mix Calendar Year 2012
Biomass 0.09% Coal 1.60% Cogeneration 0.00% Geothermal 0.00% Hydro 88.03% Landfill Gases 0.01% Natural Gas 0.64% Nuclear 9.57% Other 0.01% Petroleum 0.02% Solar 0.00% Waste 0.04% Wind 0.00%
Total 100.00%
88

Calculations are based on power purchases for 2012 reported by the Utility to the Washington State Department of Commerce in 2013.
McCleary Light & Power
Fuel Mix Calculations Calendar Year 2012
MWh MWh from from Total Fuel Market Purchases* Claims on Resources* Percent Biomass 8.515 18.340 26.855 0.09% Coal 500.967 0.000 500.967 1.60% Cogeneration 0.000 0.000 0.000 0.00% Geothermal 0.000 0.000 0.000 0.00% Hydro 667.725 26,876.764 27,544.489 88.03% Landfill Gases 2.148 0.000 2.148 0.01% Natural Gas 174.360 26.153 200.512 0.64% Nuclear 36.754 2,956.354 2,993.108 9.57% Other 2.205 0.000 2.205 0.01% Petroleum 4.913 2.442 7.355 0.02% Solar 0.000 0.000 0.000 0.00% Waste 8.746 2.616 11.361 0.04% Wind 0.000 0.000 0.000 0.00% Total 1,406.332 29,882.668 31,289.000 100.00%
* Market Purchases include those made directly by utilities, as well as the fraction of delivered BPA power that can be attributed to BPA’s purchases of market power. Claims on Resources include those made directly by utilities, as well as the fractions of delivered BPA power that can be attributed to specific plants.
89

Calculations are based on power purchases for 2012 reported by the Utility to the Washington State Department of Commerce in 2013.
McCleary Light & Power
Claims on BPA* Calendar Year 2012 BPA Resource Mix 29,882.668
Biomass 18.340
Natural Gas 26.153
Nuclear 2,956.354
Petroleum (heavy oil) 2.442
Waste 2.616
Water 26,876.764
*The BPA Resource Mix includes only the fraction of delivered BPA power that can be attributed to specific plants. The fraction of BPA power that BPA purchased on the market is included in the “Market Purchases” table.
90

Calculations are based on power purchases for 2012 reported by the Utility to the Washington State Department of Commerce in 2013.
McCleary Light & Power
Market Purchases Calendar Year 2012
Total Market Purchases 1,406.332
BPA Market Purchase* 1,406.332
* “BPA Market Purchases” are the fraction of delivered BPA power that BPA purchased on the market.
**The BPA Slice product includes a small amount of wind power that is not bundled with the Renewable Energy Credits (REC) associated with that power. Such power is assigned the net system fuel mix – as though it were a market purchase.
91

Calculations are based on power purchases for 2012 reported by the Utility to the Washington State Department of Commerce in 2013.
Modern Electric Water Company
Fuel Mix Calendar Year 2012
Biomass 0.09% Coal 1.60% Cogeneration 0.00% Geothermal 0.00% Hydro 88.03% Landfill Gases 0.01% Natural Gas 0.64% Nuclear 9.57% Other 0.01% Petroleum 0.02% Solar 0.00% Waste 0.04% Wind 0.00%
Total 100.00%
92

Calculations are based on power purchases for 2012 reported by the Utility to the Washington State Department of Commerce in 2013.
Modern Electric Water Company
Fuel Mix Calculations Calendar Year 2012
MWh MWh from from Total Fuel Market Purchases* Claims on Resources* Percent Biomass 60.002 129.237 189.238 0.09% Coal 3,530.161 0.000 3,530.161 1.60% Cogeneration 0.000 0.000 0.000 0.00% Geothermal 0.000 0.000 0.000 0.00% Hydro 4,705.251 189,392.327 194,097.577 88.03% Landfill Gases 15.133 0.000 15.133 0.01% Natural Gas 1,228.659 184.291 1,412.950 0.64% Nuclear 258.995 20,832.518 21,091.513 9.57% Other 15.536 0.000 15.536 0.01% Petroleum 34.621 17.209 51.830 0.02% Solar 0.000 0.000 0.000 0.00% Waste 61.629 18.431 80.061 0.04% Wind 0.000 0.000 0.000 0.00% Total 9,909.988 210,574.012 220,484.000 100.00%
* Market Purchases include those made directly by utilities, as well as the fraction of delivered BPA power that can be attributed to BPA’s purchases of market power. Claims on Resources include those made directly by utilities, as well as the fractions of delivered BPA power that can be attributed to specific plants.
93

Calculations are based on power purchases for 2012 reported by the Utility to the Washington State Department of Commerce in 2013.
Modern Electric Water Company
Claims on BPA* Calendar Year 2012 BPA Resource Mix 210,574.012
Biomass 129.237
Natural Gas 184.291
Nuclear 20,832.518
Petroleum (heavy oil) 17.209
Waste 18.431
Water 189,392.327
*Includes that part of claims on BPA electricity products that correspond to the percentage of BPA's power that comes from specific generating facilities. That part of claims on BPA electricity products that correspond to the percentage of BPA's power that comes from market purchases is included in the “Market Purchases” table.
94
Calculations are based on power purchases for 2012 reported by the Utility to the Washington State Department of Commerce in 2013.
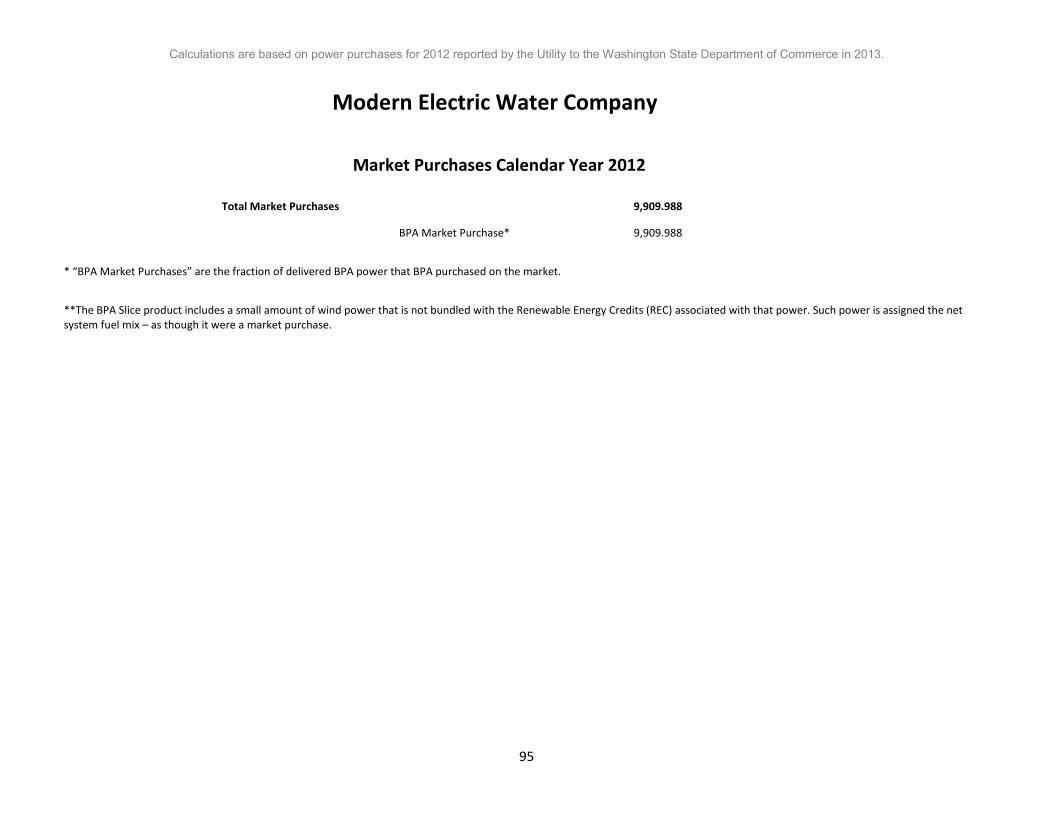
Modern Electric Water Company
Market Purchases Calendar Year 2012
Total Market Purchases 9,909.988
BPA Market Purchase* 9,909.988
* “BPA Market Purchases” are the fraction of delivered BPA power that BPA purchased on the market.
**The BPA Slice product includes a small amount of wind power that is not bundled with the Renewable Energy Credits (REC) associated with that power. Such power is assigned the net system fuel mix – as though it were a market purchase.
95
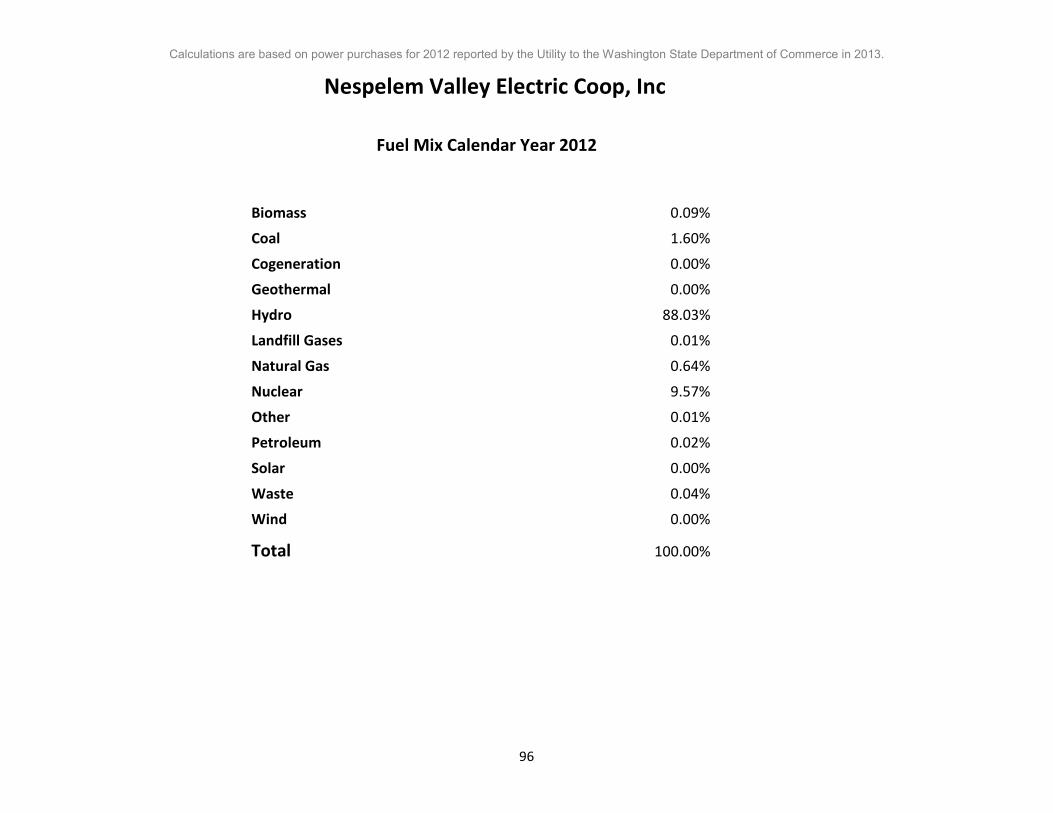
Calculations are based on power purchases for 2012 reported by the Utility to the Washington State Department of Commerce in 2013.
Nespelem Valley Electric Coop, Inc
Fuel Mix Calendar Year 2012
Biomass 0.09% Coal 1.60% Cogeneration 0.00% Geothermal 0.00% Hydro 88.03% Landfill Gases 0.01% Natural Gas 0.64% Nuclear 9.57% Other 0.01% Petroleum 0.02% Solar 0.00% Waste 0.04% Wind 0.00%
Total 100.00%
96

Calculations are based on power purchases for 2012 reported by the Utility to the Washington State Department of Commerce in 2013.
Nespelem Valley Electric Coop, Inc
Fuel Mix Calculations Calendar Year 2012
MWh MWh from from Total Fuel Market Purchases* Claims on Resources* Percent Biomass 14.495 31.221 45.717 0.09% Coal 852.824 0.000 852.824 1.60% Cogeneration 0.000 0.000 0.000 0.00% Geothermal 0.000 0.000 0.000 0.00% Hydro 1,136.705 45,753.807 46,890.511 88.03% Landfill Gases 3.656 0.000 3.656 0.01% Natural Gas 296.822 44.521 341.343 0.64% Nuclear 62.569 5,032.765 5,095.333 9.57% Other 3.753 0.000 3.753 0.01% Petroleum 8.364 4.157 12.521 0.02% Solar 0.000 0.000 0.000 0.00% Waste 14.889 4.453 19.341 0.04% Wind 0.000 0.000 0.000 0.00% Total 2,394.076 50,870.924 53,265.000 100.00%
* Market Purchases include those made directly by utilities, as well as the fraction of delivered BPA power that can be attributed to BPA’s purchases of market power. Claims on Resources include those made directly by utilities, as well as the fractions of delivered BPA power that can be attributed to specific plants.
97

Calculations are based on power purchases for 2012 reported by the Utility to the Washington State Department of Commerce in 2013.
Nespelem Valley Electric Coop, Inc
Claims on BPA* Calendar Year 2012 BPA Resource Mix 50,870.924
Biomass 31.221
Natural Gas 44.521
Nuclear 5,032.765
Petroleum (heavy oil) 4.157
Waste 4.453
Water 45,753.807
*The BPA Resource Mix includes only the fraction of delivered BPA power that can be attributed to specific plants. The fraction of BPA power that BPA purchased on the market is included in the “Market Purchases” table.
98

Calculations are based on power purchases for 2012 reported by the Utility to the Washington State Department of Commerce in 2013.
Nespelem Valley Electric Coop, Inc
Market Purchases Calendar Year 2012
Total Market Purchases 2,394.076
BPA Market Purchase* 2,394.076
* “BPA Market Purchases” are the fraction of delivered BPA power that BPA purchased on the market.
**The BPA Slice product includes a small amount of wind power that is not bundled with the Renewable Energy Credits (REC) associated with that power. Such power is assigned the net system fuel mix – as though it were a market purchase.
99

Calculations are based on power purchases for 2012 reported by the Utility to the Washington State Department of Commerce in 2013.
Northern Lights, Inc.
Fuel Mix Calendar Year 2012
Biomass 0.08% Coal 1.46% Cogeneration 0.00% Geothermal 0.00% Hydro 89.10% Landfill Gases 0.01% Natural Gas 0.58% Nuclear 8.71% Other 0.01% Petroleum 0.02% Solar 0.00% Waste 0.03% Wind 0.00%
Total 100.00%
100

Calculations are based on power purchases for 2012 reported by the Utility to the Washington State Department of Commerce in 2013.
Northern Lights, Inc.
Fuel Mix Calculations Calendar Year 2012
MWh MWh from from Total Fuel Market Purchases* Claims on Resources* Percent Biomass 0.030 0.064 0.094 0.08% Coal 1.744 0.000 1.744 1.46% Cogeneration 0.000 0.000 0.000 0.00% Geothermal 0.000 0.000 0.000 0.00% Hydro 2.325 104.236 106.561 89.10% Landfill Gases 0.007 0.000 0.007 0.01% Natural Gas 0.607 0.091 0.698 0.58% Nuclear 0.128 10.295 10.423 8.71% Other 0.008 0.000 0.008 0.01% Petroleum 0.017 0.009 0.026 0.02% Solar 0.000 0.000 0.000 0.00% Waste 0.030 0.009 0.040 0.03% Wind 0.000 0.000 0.000 0.00% Total 4.897 114.703 119.600 100.00%
* Market Purchases include those made directly by utilities, as well as the fraction of delivered BPA power that can be attributed to BPA’s purchases of market power. Claims on Resources include those made directly by utilities, as well as the fractions of delivered BPA power that can be attributed to specific plants.
101

Calculations are based on power purchases for 2012 reported by the Utility to the Washington State Department of Commerce in 2013.
Northern Lights, Inc.
Claims on Plants Calendar Year 2012 Lake Creek Claim Type: PlntMix 10.644
Water 10.644
102

Calculations are based on power purchases for 2012 reported by the Utility to the Washington State Department of Commerce in 2013.
Northern Lights, Inc.
Claims on BPA* Calendar Year 2012 BPA Slice 104.059
Biomass 0.064
Natural Gas 0.091
Nuclear 10.295
Petroleum (heavy oil) 0.009
Waste 0.009
Water 93.592
*The BPA Resource Mix includes only the fraction of delivered BPA power that can be attributed to specific plants. The fraction of BPA power that BPA purchased on the market is included in the “Market Purchases” table.
103

Calculations are based on power purchases for 2012 reported by the Utility to the Washington State Department of Commerce in 2013.
Northern Lights, Inc.
Market Purchases Calendar Year 2012
Total Market Purchases 4.897
BPA Slice Wind w/o RECs** 4.897
* “BPA Market Purchases” are the fraction of delivered BPA power that BPA purchased on the market.
**The BPA Slice product includes a small amount of wind power that is not bundled with the Renewable Energy Credits (REC) associated with that power. Such power is assigned the net system fuel mix – as though it were a market purchase.
104

Calculations are based on power purchases for 2012 reported by the Utility to the Washington State Department of Commerce in 2013.
Ohop Mutual Light Company
Fuel Mix Calendar Year 2012
Biomass 0.09% Coal 1.60% Cogeneration 0.00% Geothermal 0.00% Hydro 88.03% Landfill Gases 0.01% Natural Gas 0.64% Nuclear 9.57% Other 0.01% Petroleum 0.02% Solar 0.00% Waste 0.04% Wind 0.00%
Total 100.00%
105

Calculations are based on power purchases for 2012 reported by the Utility to the Washington State Department of Commerce in 2013.
Ohop Mutual Light Company
Fuel Mix Calculations Calendar Year 2012
MWh MWh from from Total Fuel Market Purchases* Claims on Resources* Percent Biomass 22.811 49.133 71.944 0.09% Coal 1,342.091 0.000 1,342.091 1.60% Cogeneration 0.000 0.000 0.000 0.00% Geothermal 0.000 0.000 0.000 0.00% Hydro 1,788.835 72,002.867 73,791.702 88.03% Landfill Gases 5.753 0.000 5.753 0.01% Natural Gas 467.110 70.063 537.173 0.64% Nuclear 98.464 7,920.073 8,018.537 9.57% Other 5.906 0.000 5.906 0.01% Petroleum 13.162 6.542 19.705 0.02% Solar 0.000 0.000 0.000 0.00% Waste 23.430 7.007 30.437 0.04% Wind 0.000 0.000 0.000 0.00% Total 3,767.563 80,055.686 83,823.249 100.00%
* Market Purchases include those made directly by utilities, as well as the fraction of delivered BPA power that can be attributed to BPA’s purchases of market power. Claims on Resources include those made directly by utilities, as well as the fractions of delivered BPA power that can be attributed to specific plants.
106

Calculations are based on power purchases for 2012 reported by the Utility to the Washington State Department of Commerce in 2013.
Ohop Mutual Light Company
Claims on BPA* Calendar Year 2012 BPA Resource Mix 80,055.686
Biomass 49.133
Natural Gas 70.063
Nuclear 7,920.073
Petroleum (heavy oil) 6.542
Waste 7.007
Water 72,002.867
*The BPA Resource Mix includes only the fraction of delivered BPA power that can be attributed to specific plants. The fraction of BPA power that BPA purchased on the market is included in the “Market Purchases” table.
107

Calculations are based on power purchases for 2012 reported by the Utility to the Washington State Department of Commerce in 2013.
Ohop Mutual Light Company
Market Purchases Calendar Year 2012
Total Market Purchases 3,767.563
BPA Market Purchase* 3,767.563
* “BPA Market Purchases” are the fraction of delivered BPA power that BPA purchased on the market.
**The BPA Slice product includes a small amount of wind power that is not bundled with the Renewable Energy Credits (REC) associated with that power. Such power is assigned the net system fuel mix – as though it were a market purchase.
108
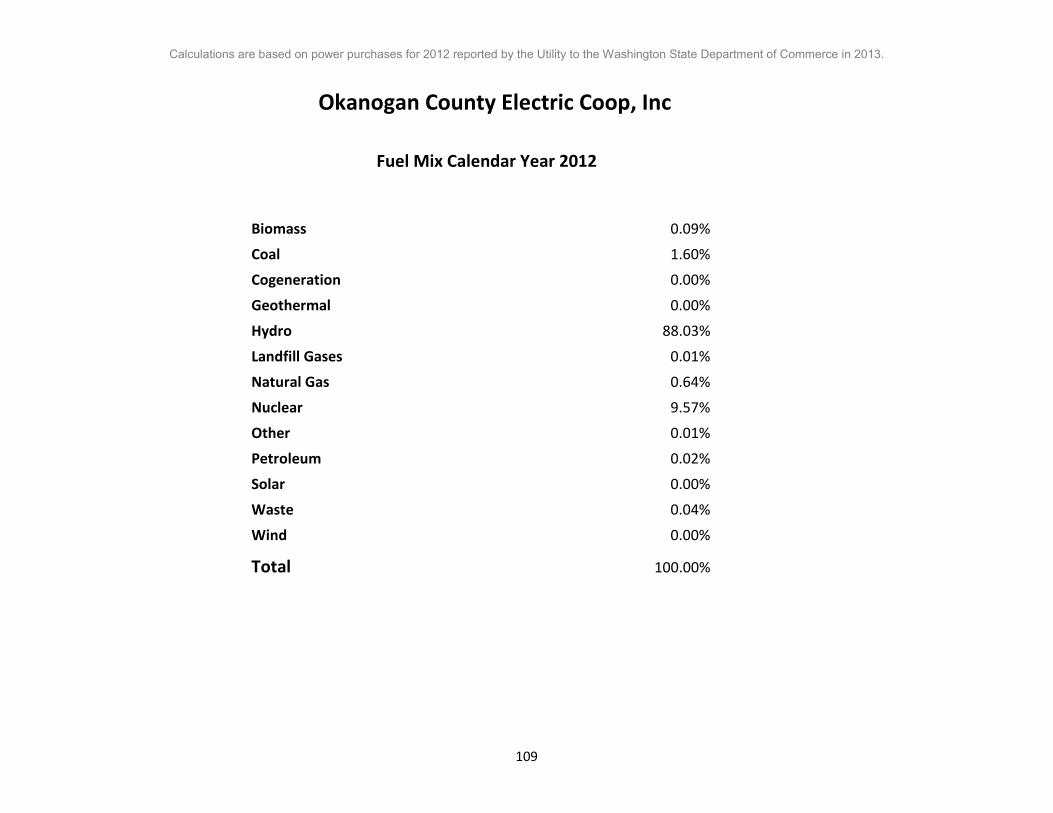
Calculations are based on power purchases for 2012 reported by the Utility to the Washington State Department of Commerce in 2013.
Okanogan County Electric Coop, Inc
Fuel Mix Calendar Year 2012
Biomass 0.09% Coal 1.60% Cogeneration 0.00% Geothermal 0.00% Hydro 88.03% Landfill Gases 0.01% Natural Gas 0.64% Nuclear 9.57% Other 0.01% Petroleum 0.02% Solar 0.00% Waste 0.04% Wind 0.00%
Total 100.00%
109

Calculations are based on power purchases for 2012 reported by the Utility to the Washington State Department of Commerce in 2013.
Okanogan County Electric Coop, Inc
Fuel Mix Calculations Calendar Year 2012
MWh MWh from from Total Fuel Market Purchases* Claims on Resources* Percent Biomass 14.761 31.794 46.555 0.09% Coal 868.467 0.000 868.467 1.60% Cogeneration 0.000 0.000 0.000 0.00% Geothermal 0.000 0.000 0.000 0.00% Hydro 1,157.554 46,593.034 47,750.589 88.03% Landfill Gases 3.723 0.000 3.723 0.01% Natural Gas 302.267 45.338 347.604 0.64% Nuclear 63.716 5,125.077 5,188.793 9.57% Other 3.822 0.000 3.822 0.01% Petroleum 8.517 4.234 12.751 0.02% Solar 0.000 0.000 0.000 0.00% Waste 15.162 4.534 19.696 0.04% Wind 0.000 0.000 0.000 0.00% Total 2,437.989 51,804.011 54,242.000 100.00%
* Market Purchases include those made directly by utilities, as well as the fraction of delivered BPA power that can be attributed to BPA’s purchases of market power. Claims on Resources include those made directly by utilities, as well as the fractions of delivered BPA power that can be attributed to specific plants.
110

Calculations are based on power purchases for 2012 reported by the Utility to the Washington State Department of Commerce in 2013.
Okanogan County Electric Coop, Inc
Claims on BPA* Calendar Year 2012 BPA Resource Mix 51,804.011
Biomass 31.794
Natural Gas 45.338
Nuclear 5,125.077
Petroleum (heavy oil) 4.234
Waste 4.534
Water 46,593.034
*The BPA Resource Mix includes only the fraction of delivered BPA power that can be attributed to specific plants. The fraction of BPA power that BPA purchased on the market is included in the “Market Purchases” table.
111

Calculations are based on power purchases for 2012 reported by the Utility to the Washington State Department of Commerce in 2013.
Okanogan County Electric Coop, Inc
Market Purchases Calendar Year 2012
Total Market Purchases 2,437.989
BPA Market Purchase* 2,437.989
* “BPA Market Purchases” are the fraction of delivered BPA power that BPA purchased on the market.
**The BPA Slice product includes a small amount of wind power that is not bundled with the Renewable Energy Credits (REC) associated with that power. Such power is assigned the net system fuel mix – as though it were a market purchase.
112

Calculations are based on power purchases for 2012 reported by the Utility to the Washington State Department of Commerce in 2013.
Orcas Power & Light Cooperative
Fuel Mix Calendar Year 2012
Biomass 0.09% Coal 1.59% Cogeneration 0.00% Geothermal 0.00% Hydro 87.48% Landfill Gases 0.01% Natural Gas 0.64% Nuclear 9.51% Other 0.01% Petroleum 0.02% Solar 0.00% Waste 0.04% Wind 0.62%
Total 100.00%
113

Calculations are based on power purchases for 2012 reported by the Utility to the Washington State Department of Commerce in 2013.
Orcas Power & Light Cooperative
Fuel Mix Calculations Calendar Year 2012
MWh MWh from from Total Fuel Market Purchases* Claims on Resources* Percent Biomass 58.109 125.159 183.268 0.09% Coal 3,418.790 0.000 3,418.790 1.59% Cogeneration 0.000 0.000 0.000 0.00% Geothermal 0.000 0.000 0.000 0.00% Hydro 4,556.807 183,417.297 187,974.104 87.48% Landfill Gases 14.656 0.000 14.656 0.01% Natural Gas 1,189.897 178.477 1,368.373 0.64% Nuclear 250.824 20,175.285 20,426.109 9.51% Other 15.046 0.000 15.046 0.01% Petroleum 33.529 16.666 50.195 0.02% Solar 0.000 0.000 0.000 0.00% Waste 59.685 17.850 77.535 0.04% Wind 0.000 1,337.000 1,337.000 0.62% Total 9,597.343 205,267.734 214,865.077 100.00%
* Market Purchases include those made directly by utilities, as well as the fraction of delivered BPA power that can be attributed to BPA’s purchases of market power. Claims on Resources include those made directly by utilities, as well as the fractions of delivered BPA power that can be attributed to specific plants.
114

Calculations are based on power purchases for 2012 reported by the Utility to the Washington State Department of Commerce in 2013.
Orcas Power & Light Cooperative
Claims on Plants Calendar Year 2012 Stateline--WA (FPL Energy Claim Type: PlntMix 502.000
Wind 502.000
Foote Creek I Claim Type: PlntMix 103.000
Wind 103.000
Foote Creek II Claim Type: PlntMix 17.000
Wind 17.000
Condon Windpower LLC Claim Type: PlntMix 258.000
Wind 258.000
Klondike Claim Type: PlntMix 125.000
Wind 125.000
Klondike Windpower III Claim Type: PlntMix 332.000
Wind 332.000
115

Calculations are based on power purchases for 2012 reported by the Utility to the Washington State Department of Commerce in 2013.
Orcas Power & Light Cooperative
Claims on BPA* Calendar Year 2012 BPA Resource Mix 203,930.734
Biomass 125.159
Natural Gas 178.477
Nuclear 20,175.285
Petroleum (heavy oil) 16.666
Waste 17.850
Water 183,417.297
*The BPA Resource Mix includes only the fraction of delivered BPA power that can be attributed to specific plants. The fraction of BPA power that BPA purchased on the market is included in the “Market Purchases” table.
116

Calculations are based on power purchases for 2012 reported by the Utility to the Washington State Department of Commerce in 2013.
Orcas Power & Light Cooperative
Market Purchases Calendar Year 2012
Total Market Purchases 9,597.343
BPA Market Purchase* 9,597.343
* “BPA Market Purchases” are the fraction of delivered BPA power that BPA purchased on the market.
**The BPA Slice product includes a small amount of wind power that is not bundled with the Renewable Energy Credits (REC) associated with that power. Such power is assigned the net system fuel mix – as though it were a market purchase.
117

Calculations are based on power purchases for 2012 reported by the Utility to the Washington State Department of Commerce in 2013.
Pacific Power and Light
Fuel Mix Calendar Year 2012
Biomass 0.61% Coal 35.62% Cogeneration 0.00% Geothermal 0.00% Hydro 47.48% Landfill Gases 0.15% Natural Gas 12.40% Nuclear 2.61% Other 0.16% Petroleum 0.35% Solar 0.00% Waste 0.62% Wind 0.00%
Total 100.00%
118

Calculations are based on power purchases for 2012 reported by the Utility to the Washington State Department of Commerce in 2013.
Pacific Power and Light
Fuel Mix Calculations Calendar Year 2012
MWh MWh from from Total Fuel Market Purchases* Claims on Resources* Percent Biomass 27,192.491 0.000 27,192.491 0.61% Coal 1,599,857.530 0.000 1,599,857.530 35.62% Cogeneration 0.000 0.000 0.000 0.00% Geothermal 0.000 0.000 0.000 0.00% Hydro 2,132,404.215 0.000 2,132,404.215 47.48% Landfill Gases 6,858.452 0.000 6,858.452 0.15% Natural Gas 556,824.292 0.000 556,824.292 12.40% Nuclear 117,375.635 0.000 117,375.635 2.61% Other 7,040.883 0.000 7,040.883 0.16% Petroleum 15,690.244 0.000 15,690.244 0.35% Solar 0.000 0.000 0.000 0.00% Waste 27,930.255 0.000 27,930.255 0.62% Wind 0.000 0.000 0.000 0.00% Total 4,491,174.000 0.000 4,491,174.000 100.00%
* Market Purchases include those made directly by utilities, as well as the fraction of delivered BPA power that can be attributed to BPA’s purchases of market power. Claims on Resources include those made directly by utilities, as well as the fractions of delivered BPA power that can be attributed to specific plants.
119

Calculations are based on power purchases for 2012 reported by the Utility to the Washington State Department of Commerce in 2013.
Pacific Power and Light
Market Purchases Calendar Year 2012
Total Market Purchases 4,491,174.000
Utility Market Purchase 4,491,174.000
* “BPA Market Purchases” are the fraction of delivered BPA power that BPA purchased on the market.
**The BPA Slice product includes a small amount of wind power that is not bundled with the Renewable Energy Credits (REC) associated with that power. Such power is assigned the net system fuel mix – as though it were a market purchase.
.
120

Calculations are based on power purchases for 2012 reported by the Utility to the Washington State Department of Commerce in 2013.
Parkland Light & Water Company
Fuel Mix Calendar Year 2012
Biomass 0.09% Coal 1.60% Cogeneration 0.00% Geothermal 0.00% Hydro 88.03% Landfill Gases 0.01% Natural Gas 0.64% Nuclear 9.57% Other 0.01% Petroleum 0.02% Solar 0.00% Waste 0.04% Wind 0.00%
Total 100.00%
121
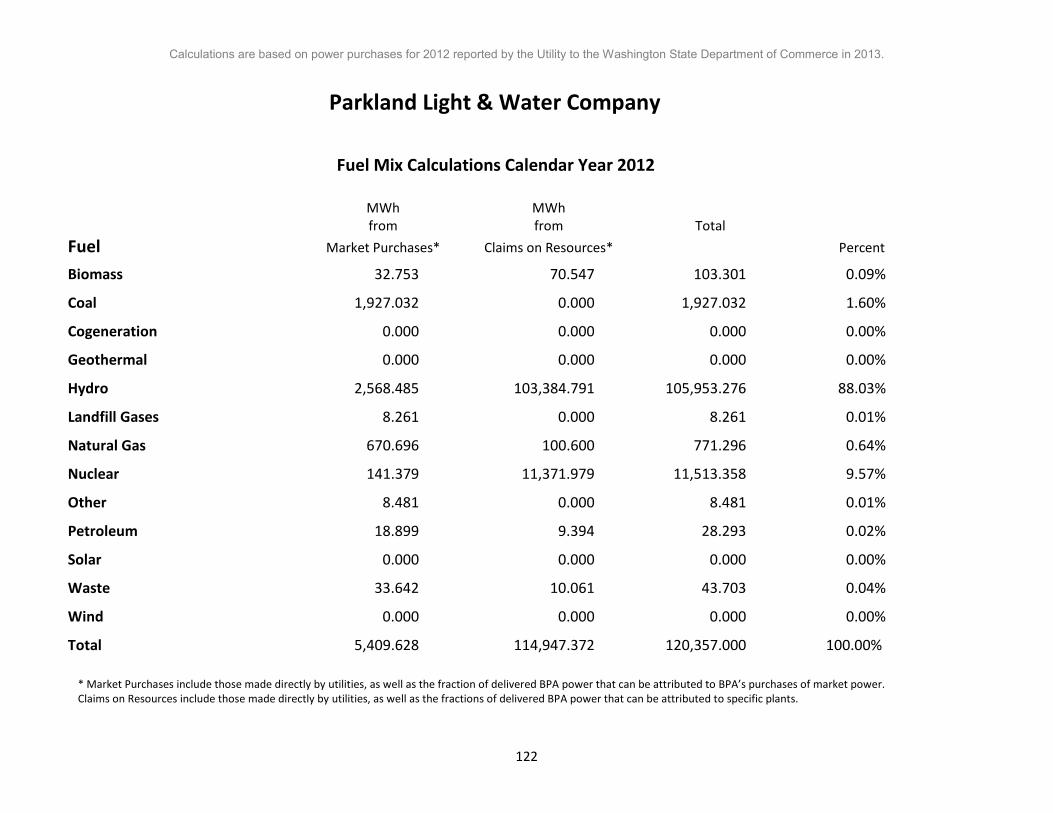
Calculations are based on power purchases for 2012 reported by the Utility to the Washington State Department of Commerce in 2013.
Parkland Light & Water Company
Fuel Mix Calculations Calendar Year 2012
MWh MWh from from Total Fuel Market Purchases* Claims on Resources* Percent Biomass 32.753 70.547 103.301 0.09% Coal 1,927.032 0.000 1,927.032 1.60% Cogeneration 0.000 0.000 0.000 0.00% Geothermal 0.000 0.000 0.000 0.00% Hydro 2,568.485 103,384.791 105,953.276 88.03% Landfill Gases 8.261 0.000 8.261 0.01% Natural Gas 670.696 100.600 771.296 0.64% Nuclear 141.379 11,371.979 11,513.358 9.57% Other 8.481 0.000 8.481 0.01% Petroleum 18.899 9.394 28.293 0.02% Solar 0.000 0.000 0.000 0.00% Waste 33.642 10.061 43.703 0.04% Wind 0.000 0.000 0.000 0.00% Total 5,409.628 114,947.372 120,357.000 100.00%
* Market Purchases include those made directly by utilities, as well as the fraction of delivered BPA power that can be attributed to BPA’s purchases of market power. Claims on Resources include those made directly by utilities, as well as the fractions of delivered BPA power that can be attributed to specific plants.
122

Calculations are based on power purchases for 2012 reported by the Utility to the Washington State Department of Commerce in 2013.
Parkland Light & Water Company
Claims on BPA* Calendar Year 2012 BPA Resource Mix 114,947.372
Biomass 70.547
Natural Gas 100.600
Nuclear 11,371.979
Petroleum (heavy oil) 9.394
Waste 10.061
Water 103,384.791
*The BPA Resource Mix includes only the fraction of delivered BPA power that can be attributed to specific plants. The fraction of BPA power that BPA purchased on the market is included in the “Market Purchases” table.
123

Calculations are based on power purchases for 2012 reported by the Utility to the Washington State Department of Commerce in 2013.
Parkland Light & Water Company
Market Purchases Calendar Year 2012
Total Market Purchases 5,409.628
BPA Market Purchase* 5,409.628
* “BPA Market Purchases” are the fraction of delivered BPA power that BPA purchased on the market.
**The BPA Slice product includes a small amount of wind power that is not bundled with the Renewable Energy Credits (REC) associated with that power. Such power is assigned the net system fuel mix – as though it were a market purchase.
124

Calculations are based on power purchases for 2012 reported by the Utility to the Washington State Department of Commerce in 2013.
Peninsula Light Company
Fuel Mix Calendar Year 2012
Biomass 0.09% Coal 1.79% Cogeneration 0.00% Geothermal 0.00% Hydro 87.80% Landfill Gases 0.01% Natural Gas 0.71% Nuclear 9.53% Other 0.01% Petroleum 0.03% Solar 0.00% Waste 0.04% Wind 0.00%
Total 100.00%
125

Calculations are based on power purchases for 2012 reported by the Utility to the Washington State Department of Commerce in 2013.
Peninsula Light Company
Fuel Mix Calculations Calendar Year 2012
MWh MWh from from Total Fuel Market Purchases* Claims on Resources* Percent Biomass 185.095 353.875 538.970 0.09% Coal 10,889.961 0.000 10,889.961 1.79% Cogeneration 0.000 0.000 0.000 0.00% Geothermal 0.000 0.000 0.000 0.00% Hydro 14,514.917 518,592.393 533,107.310 87.80% Landfill Gases 46.684 0.000 46.684 0.01% Natural Gas 3,790.209 504.623 4,294.832 0.71% Nuclear 798.956 57,043.417 57,842.373 9.53% Other 47.926 0.000 47.926 0.01% Petroleum 106.801 47.121 153.922 0.03% Solar 0.000 0.000 0.000 0.00% Waste 190.117 50.469 240.585 0.04% Wind 0.000 0.000 0.000 0.00% Total 30,570.667 576,591.897 607,162.564 100.00%
* Market Purchases include those made directly by utilities, as well as the fraction of delivered BPA power that can be attributed to BPA’s purchases of market power. Claims on Resources include those made directly by utilities, as well as the fractions of delivered BPA power that can be attributed to specific plants.
126

Calculations are based on power purchases for 2012 reported by the Utility to the Washington State Department of Commerce in 2013.
Peninsula Light Company
Claims on BPA* Calendar Year 2012 BPA Resource Mix 576,591.897
Biomass 353.875
Natural Gas 504.623
Nuclear 57,043.417
Petroleum (heavy oil) 47.121
Waste 50.469
Water 518,592.393
*The BPA Resource Mix includes only the fraction of delivered BPA power that can be attributed to specific plants. The fraction of BPA power that BPA purchased on the market is included in the “Market Purchases” table.
127

Calculations are based on power purchases for 2012 reported by the Utility to the Washington State Department of Commerce in 2013.
Peninsula Light Company
Market Purchases Calendar Year 2012
Total Market Purchases 30,570.667
BPA Market Purchase* 27,135.441
Utility Market Purchase 3,435.226
* “BPA Market Purchases” are the fraction of delivered BPA power that BPA purchased on the market.
**The BPA Slice product includes a small amount of wind power that is not bundled with the Renewable Energy Credits (REC) associated with that power. Such power is assigned the net system fuel mix – as though it were a market purchase.
128

Calculations are based on power purchases for 2012 reported by the Utility to the Washington State Department of Commerce in 2013.
PUD No 1 of Asotin County
Fuel Mix Calendar Year 2012
Biomass 0.09% Coal 1.60% Cogeneration 0.00% Geothermal 0.00% Hydro 88.03% Landfill Gases 0.01% Natural Gas 0.64% Nuclear 9.57% Other 0.01% Petroleum 0.02% Solar 0.00% Waste 0.04% Wind 0.00%
Total 100.00%
129

Calculations are based on power purchases for 2012 reported by the Utility to the Washington State Department of Commerce in 2013.
PUD No 1 of Asotin County
Fuel Mix Calculations Calendar Year 2012
MWh MWh from from Total Fuel Market Purchases* Claims on Resources* Percent Biomass 0.000 0.000 0.000 0.09% Coal 0.005 0.000 0.005 1.60% Cogeneration 0.000 0.000 0.000 0.00% Geothermal 0.000 0.000 0.000 0.00% Hydro 0.007 0.265 0.271 88.03% Landfill Gases 0.000 0.000 0.000 0.01% Natural Gas 0.002 0.000 0.002 0.64% Nuclear 0.000 0.029 0.029 9.57% Other 0.000 0.000 0.000 0.01% Petroleum 0.000 0.000 0.000 0.02% Solar 0.000 0.000 0.000 0.00% Waste 0.000 0.000 0.000 0.04% Wind 0.000 0.000 0.000 0.00% Total 0.014 0.294 0.308 100.00%
* Market Purchases include those made directly by utilities, as well as the fraction of delivered BPA power that can be attributed to BPA’s purchases of market power. Claims on Resources include those made directly by utilities, as well as the fractions of delivered BPA power that can be attributed to specific plants.
130

Calculations are based on power purchases for 2012 reported by the Utility to the Washington State Department of Commerce in 2013.
PUD No 1 of Asotin County
Claims on BPA* Calendar Year 2012 BPA Resource Mix 0.294
Biomass 0.000
Natural Gas 0.000
Nuclear 0.029
Petroleum (heavy oil) 0.000
Waste 0.000
Water 0.265
*The BPA Resource Mix includes only the fraction of delivered BPA power that can be attributed to specific plants. The fraction of BPA power that BPA purchased on the market is included in the “Market Purchases” table.
131

Calculations are based on power purchases for 2012 reported by the Utility to the Washington State Department of Commerce in 2013.
PUD No 1 of Asotin County
Market Purchases Calendar Year 2012
Total Market Purchases 0.014
BPA Market Purchase* 0.014
* “BPA Market Purchases” are the fraction of delivered BPA power that BPA purchased on the market.
**The BPA Slice product includes a small amount of wind power that is not bundled with the Renewable Energy Credits (REC) associated with that power. Such power is assigned the net system fuel mix – as though it were a market purchase.
132

Calculations are based on power purchases for 2012 reported by the Utility to the Washington State Department of Commerce in 2013.
PUD No 1 of Benton County
Fuel Mix Calendar Year 2012
Biomass 0.13% Coal 4.72% Cogeneration 0.00% Geothermal 0.00% Hydro 79.91% Landfill Gases 0.02% Natural Gas 3.87% Nuclear 8.34% Other 0.02% Petroleum 0.05% Solar 0.00% Waste 0.09% Wind 2.85%
Total 100.00%
133

Calculations are based on power purchases for 2012 reported by the Utility to the Washington State Department of Commerce in 2013.
PUD No 1 of Benton County
Fuel Mix Calculations Calendar Year 2012
MWh MWh from from Total Fuel Market Purchases* Claims on Resources* Percent Biomass 1,364.350 842.826 2,207.177 0.13% Coal 80,270.909 0.000 80,270.909 4.72% Cogeneration 0.000 0.000 0.000 0.00% Geothermal 0.000 0.000 0.000 0.00% Hydro 106,990.792 1,251,238.624 1,358,229.416 79.91% Landfill Gases 344.115 0.000 344.115 0.02% Natural Gas 27,937.983 37,766.248 65,704.230 3.87% Nuclear 5,889.180 135,860.759 141,749.939 8.34% Other 353.268 0.000 353.268 0.02% Petroleum 787.239 112.228 899.467 0.05% Solar 0.000 0.000 0.000 0.00% Waste 1,401.367 120.202 1,521.568 0.09% Wind 0.000 48,414.000 48,414.000 2.85% Total 225,339.201 1,474,354.887 1,699,694.088 100.00%
* Market Purchases include those made directly by utilities, as well as the fraction of delivered BPA power that can be attributed to BPA’s purchases of market power. Claims on Resources include those made directly by utilities, as well as the fractions of delivered BPA power that can be attributed to specific plants.
134

Calculations are based on power purchases for 2012 reported by the Utility to the Washington State Department of Commerce in 2013.
PUD No 1 of Benton County
Claims on Plants Calendar Year 2012 Packwood Claim Type: PlntMix 16,103.000
Water 16,103.000
Frederickson Power LP Claim Type: PlntMix 36,564.383
Natural Gas 36,564.383
White Creek Wind Farm Claim Type: PlntMix 24,105.000
Wind 24,105.000
Nine Canyon Claim Type: PlntMix 24,309.000
Wind 24,309.000
135

Calculations are based on power purchases for 2012 reported by the Utility to the Washington State Department of Commerce in 2013.
PUD No 1 of Benton County
Claims on BPA* Calendar Year 2012 BPA Resource Mix 778,036.230
Biomass 477.508
Natural Gas 680.924
Nuclear 76,972.717
Petroleum (heavy oil) 63.583
Waste 68.101
Water 699,773.397
BPA Slice 595,237.273
Biomass 365.318
Natural Gas 520.941
Nuclear 58,888.042
Petroleum (heavy oil) 48.644
Waste 52.101
Water 535,362.227
*The BPA Resource Mix includes only the fraction of delivered BPA power that can be attributed to specific plants. The fraction of BPA power that BPA purchased on the market is included in the “Market Purchases” table.
136
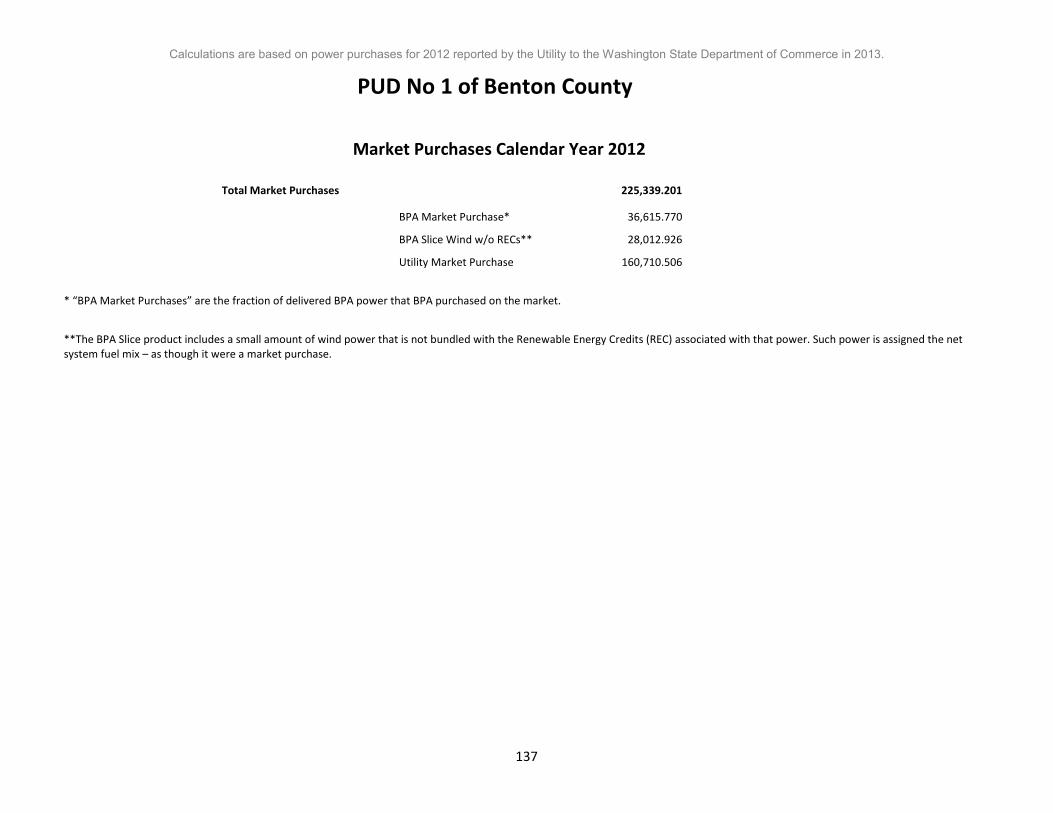
Calculations are based on power purchases for 2012 reported by the Utility to the Washington State Department of Commerce in 2013.
PUD No 1 of Benton County
Market Purchases Calendar Year 2012
Total Market Purchases 225,339.201
BPA Market Purchase* 36,615.770
BPA Slice Wind w/o RECs** 28,012.926
Utility Market Purchase 160,710.506
* “BPA Market Purchases” are the fraction of delivered BPA power that BPA purchased on the market.
**The BPA Slice product includes a small amount of wind power that is not bundled with the Renewable Energy Credits (REC) associated with that power. Such power is assigned the net system fuel mix – as though it were a market purchase.
137

Calculations are based on power purchases for 2012 reported by the Utility to the Washington State Department of Commerce in 2013.
PUD No 1 of Chelan County
Fuel Mix Calendar Year 2012
Biomass 0.10% Coal 5.74% Cogeneration 0.00% Geothermal 0.00% Hydro 91.53% Landfill Gases 0.02% Natural Gas 2.00% Nuclear 0.42% Other 0.03% Petroleum 0.06% Solar 0.00% Waste 0.10% Wind 0.00%
Total 100.00%
138

Calculations are based on power purchases for 2012 reported by the Utility to the Washington State Department of Commerce in 2013.
PUD No 1 of Chelan County
Fuel Mix Calculations Calendar Year 2012
MWh MWh from from Total Fuel Market Purchases* Claims on Resources* Percent Biomass 1,510.599 0.000 1,510.599 0.10% Coal 88,875.393 0.000 88,875.393 5.74% Cogeneration 0.000 0.000 0.000 0.00% Geothermal 0.000 0.000 0.000 0.00% Hydro 118,459.462 1,297,533.000 1,415,992.462 91.53% Landfill Gases 381.001 0.000 381.001 0.02% Natural Gas 30,932.741 0.000 30,932.741 2.00% Nuclear 6,520.459 0.000 6,520.459 0.42% Other 391.136 0.000 391.136 0.03% Petroleum 871.625 29.000 900.625 0.06% Solar 0.000 0.000 0.000 0.00% Waste 1,551.583 0.000 1,551.583 0.10% Wind 0.000 0.000 0.000 0.00% Total 249,494.000 1,297,562.000 1,547,056.000 100.00%
* Market Purchases include those made directly by utilities, as well as the fraction of delivered BPA power that can be attributed to BPA’s purchases of market power. Claims on Resources include those made directly by utilities, as well as the fractions of delivered BPA power that can be attributed to specific plants.
139

Calculations are based on power purchases for 2012 reported by the Utility to the Washington State Department of Commerce in 2013.
PUD No 1 of Chelan County
Claims on Plants Calendar Year 2012 Rocky Reach Claim Type: PlntMix 404,470.000
Water 404,470.000
Rock Island Claim Type: PlntMix 466,774.000
Water 466,774.000
Chelan Claim Type: PlntMix 425,293.000
Water 425,293.000
Stehekin Hydro Claim Type: PlntMix 996.000
Water 996.000
Stehekin Diesel Claim Type: PlntMix 29.000
Petroleum (light oil) 29.000
140

Calculations are based on power purchases for 2012 reported by the Utility to the Washington State Department of Commerce in 2013.
PUD No 1 of Chelan County
Market Purchases Calendar Year 2012
Total Market Purchases 249,494.000
Utility Market Purchase 249,494.000
* “BPA Market Purchases” are the fraction of delivered BPA power that BPA purchased on the market.
**The BPA Slice product includes a small amount of wind power that is not bundled with the Renewable Energy Credits (REC) associated with that power. Such power is assigned the net system fuel mix – as though it were a market purchase.
141

Calculations are based on power purchases for 2012 reported by the Utility to the Washington State Department of Commerce in 2013.
PUD No 1 of Clallam County
Fuel Mix Calendar Year 2012
Biomass 0.08% Coal 1.57% Cogeneration 0.00% Geothermal 0.00% Hydro 88.13% Landfill Gases 0.01% Natural Gas 0.63% Nuclear 9.39% Other 0.01% Petroleum 0.02% Solar 0.00% Waste 0.04% Wind 0.12%
Total 100.00%
142

Calculations are based on power purchases for 2012 reported by the Utility to the Washington State Department of Commerce in 2013.
PUD No 1 of Clallam County
Fuel Mix Calculations Calendar Year 2012
MWh MWh from from Total Fuel Market Purchases* Claims on Resources* Percent Biomass 182.606 393.314 575.920 0.08% Coal 10,743.549 0.000 10,743.549 1.57% Cogeneration 0.000 0.000 0.000 0.00% Geothermal 0.000 0.000 0.000 0.00% Hydro 14,319.768 588,252.871 602,572.639 88.13% Landfill Gases 46.057 0.000 46.057 0.01% Natural Gas 3,739.251 560.863 4,300.114 0.63% Nuclear 788.214 63,400.835 64,189.049 9.39% Other 47.282 0.000 47.282 0.01% Petroleum 105.365 52.372 157.737 0.02% Solar 0.000 0.000 0.000 0.00% Waste 187.560 56.093 243.654 0.04% Wind 0.000 847.000 847.000 0.12% Total 30,159.652 653,563.348 683,723.000 100.00%
* Market Purchases include those made directly by utilities, as well as the fraction of delivered BPA power that can be attributed to BPA’s purchases of market power. Claims on Resources include those made directly by utilities, as well as the fractions of delivered BPA power that can be attributed to specific plants.
143

Calculations are based on power purchases for 2012 reported by the Utility to the Washington State Department of Commerce in 2013.
PUD No 1 of Clallam County
Claims on Plants Calendar Year 2012 Packwood Claim Type: PlntMix 11,864.000
Water 11,864.000
Stateline--WA (FPL Energy Claim Type: PlntMix 376.000
Wind 376.000
Condon Windpower LLC Claim Type: PlntMix 210.000
Wind 210.000
Klondike Claim Type: PlntMix 76.000
Wind 76.000
Klondike Windpower III Claim Type: PlntMix 185.000
Wind 185.000
144

Calculations are based on power purchases for 2012 reported by the Utility to the Washington State Department of Commerce in 2013.
PUD No 1 of Clallam County
Claims on BPA* Calendar Year 2012 BPA Resource Mix 640,852.348
Biomass 393.314
Natural Gas 560.863
Nuclear 63,400.835
Petroleum (heavy oil) 52.372
Waste 56.093
Water 576,388.871
*The BPA Resource Mix includes only the fraction of delivered BPA power that can be attributed to specific plants. The fraction of BPA power that BPA purchased on the market is included in the “Market Purchases” table.
145

Calculations are based on power purchases for 2012 reported by the Utility to the Washington State Department of Commerce in 2013.
PUD No 1 of Clallam County
Market Purchases Calendar Year 2012
Total Market Purchases 30,159.652
BPA Market Purchase* 30,159.652
* “BPA Market Purchases” are the fraction of delivered BPA power that BPA purchased on the market.
**The BPA Slice product includes a small amount of wind power that is not bundled with the Renewable Energy Credits (REC) associated with that power. Such power is assigned the net system fuel mix – as though it were a market purchase.
146

Calculations are based on power purchases for 2012 reported by the Utility to the Washington State Department of Commerce in 2013.
PUD No 1 of Clark County
Fuel Mix Calendar Year 2012
Biomass 0.06% Coal 1.17% Cogeneration 0.00% Geothermal 0.00% Hydro 76.44% Landfill Gases 0.01% Natural Gas 15.27% Nuclear 7.01% Other 0.01% Petroleum 0.02% Solar 0.00% Waste 0.03% Wind 0.00%
Total 100.00%
147

Calculations are based on power purchases for 2012 reported by the Utility to the Washington State Department of Commerce in 2013.
PUD No 1 of Clark County
Fuel Mix Calculations Calendar Year 2012
MWh MWh from from Total Fuel Market Purchases* Claims on Resources* Percent Biomass 910.589 1,961.309 2,871.898 0.06% Coal 53,574.077 0.000 53,574.077 1.17% Cogeneration 0.000 0.000 0.000 0.00% Geothermal 0.000 0.000 0.000 0.00% Hydro 71,407.351 3,420,629.689 3,492,037.040 76.44% Landfill Gases 229.667 0.000 229.667 0.01% Natural Gas 18,646.253 678,747.813 697,394.066 15.27% Nuclear 3,930.532 316,156.356 320,086.888 7.01% Other 235.777 0.000 235.777 0.01% Petroleum 525.416 261.161 786.577 0.02% Solar 0.000 0.000 0.000 0.00% Waste 935.294 279.717 1,215.011 0.03% Wind 0.000 0.000 0.000 0.00% Total 150,394.955 4,418,036.045 4,568,431.000 100.00%
* Market Purchases include those made directly by utilities, as well as the fraction of delivered BPA power that can be attributed to BPA’s purchases of market power. Claims on Resources include those made directly by utilities, as well as the fractions of delivered BPA power that can be attributed to specific plants.
148
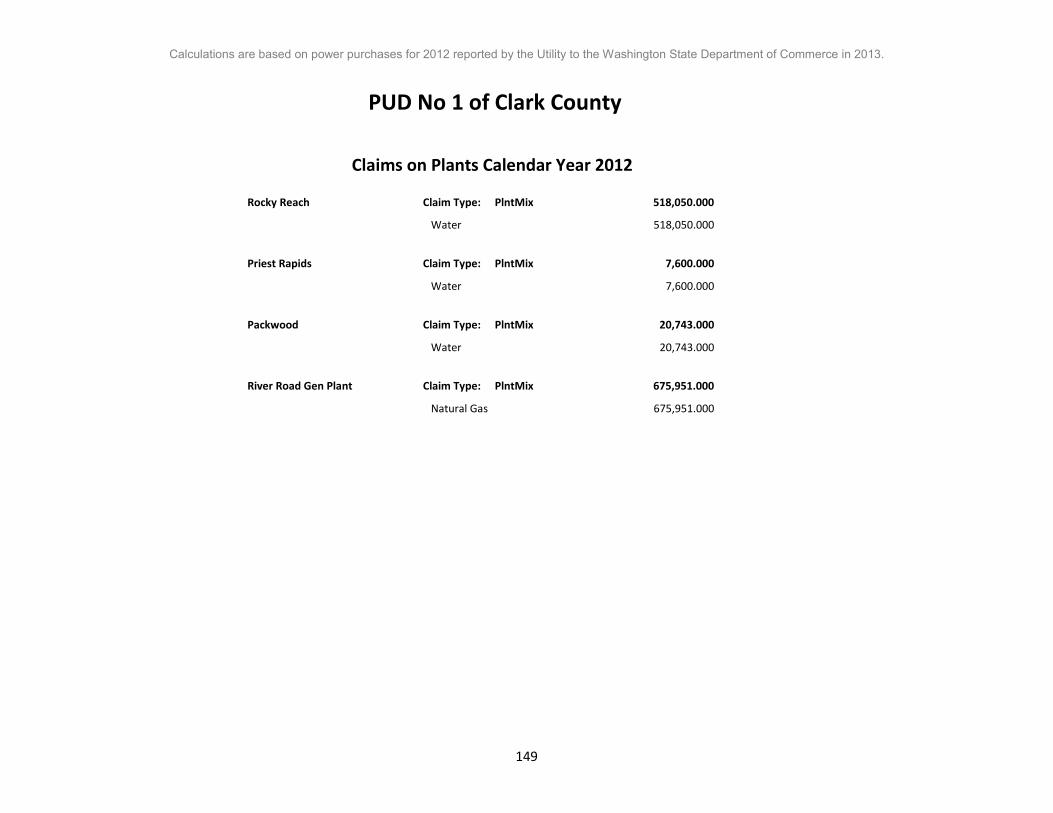
Calculations are based on power purchases for 2012 reported by the Utility to the Washington State Department of Commerce in 2013.
PUD No 1 of Clark County
Claims on Plants Calendar Year 2012 Rocky Reach Claim Type: PlntMix 518,050.000
Water 518,050.000
Priest Rapids Claim Type: PlntMix 7,600.000
Water 7,600.000
Packwood Claim Type: PlntMix 20,743.000
Water 20,743.000
River Road Gen Plant Claim Type: PlntMix 675,951.000
Natural Gas 675,951.000
149
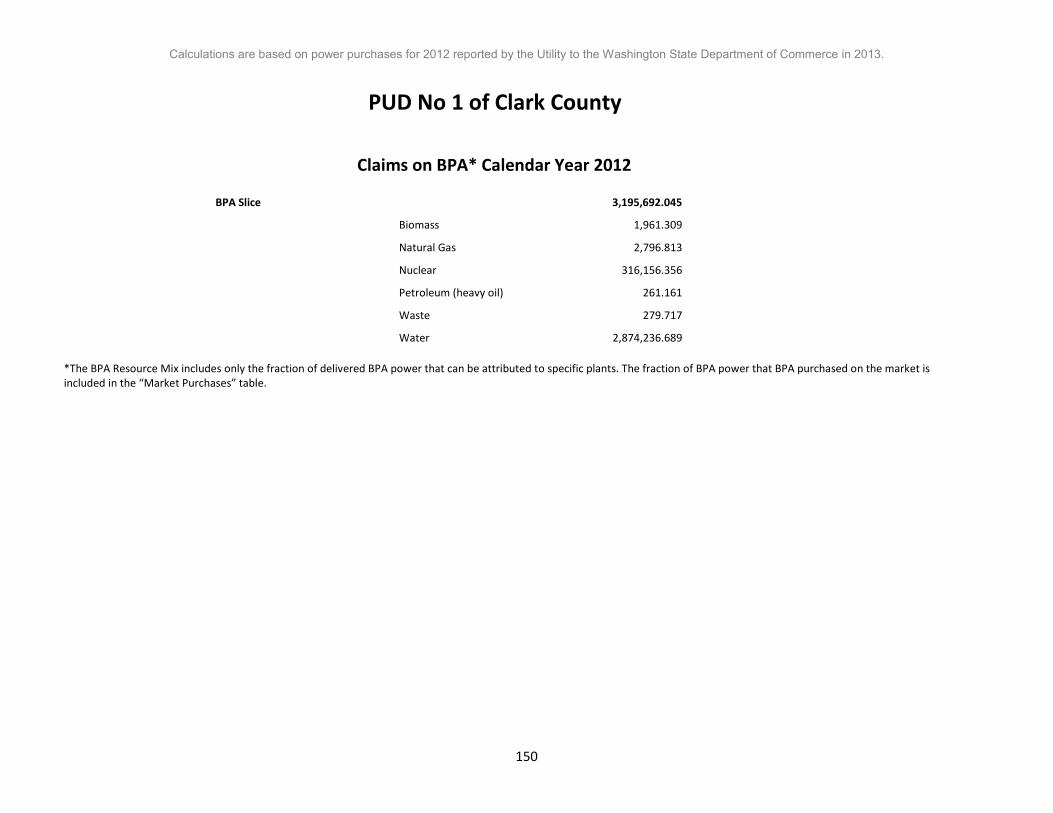
Calculations are based on power purchases for 2012 reported by the Utility to the Washington State Department of Commerce in 2013.
PUD No 1 of Clark County
Claims on BPA* Calendar Year 2012 BPA Slice 3,195,692.045
Biomass 1,961.309
Natural Gas 2,796.813
Nuclear 316,156.356
Petroleum (heavy oil) 261.161
Waste 279.717
Water 2,874,236.689
*The BPA Resource Mix includes only the fraction of delivered BPA power that can be attributed to specific plants. The fraction of BPA power that BPA purchased on the market is included in the “Market Purchases” table.
150

Calculations are based on power purchases for 2012 reported by the Utility to the Washington State Department of Commerce in 2013.
PUD No 1 of Clark County
Market Purchases Calendar Year 2012
Total Market Purchases 150,394.955
BPA Slice Wind w/o RECs** 150,394.955
* “BPA Market Purchases” are the fraction of delivered BPA power that BPA purchased on the market.
**The BPA Slice product includes a small amount of wind power that is not bundled with the Renewable Energy Credits (REC) associated with that power. Such power is assigned the net system fuel mix – as though it were a market purchase.
151

Calculations are based on power purchases for 2012 reported by the Utility to the Washington State Department of Commerce in 2013.
PUD No 1 of Cowlitz County
Fuel Mix Calendar Year 2012
Biomass 0.09% Coal 2.18% Cogeneration 0.00% Geothermal 0.00% Hydro 84.95% Landfill Gases 0.01% Natural Gas 0.84% Nuclear 9.05% Other 0.01% Petroleum 0.03% Solar 0.00% Waste 0.05% Wind 2.78%
Total 100.00%
152

Calculations are based on power purchases for 2012 reported by the Utility to the Washington State Department of Commerce in 2013.
PUD No 1 of Cowlitz County
Fuel Mix Calculations Calendar Year 2012
MWh MWh from from Total Fuel Market Purchases* Claims on Resources* Percent Biomass 1,932.084 2,871.281 4,803.365 0.09% Coal 113,673.273 0.000 113,673.273 2.18% Cogeneration 0.000 0.000 0.000 0.00% Geothermal 0.000 0.000 0.000 0.00% Hydro 151,511.845 4,269,276.247 4,420,788.092 84.95% Landfill Gases 487.308 0.000 487.308 0.01% Natural Gas 39,563.548 4,094.427 43,657.975 0.84% Nuclear 8,339.788 462,840.776 471,180.564 9.05% Other 500.270 0.000 500.270 0.01% Petroleum 1,114.825 382.329 1,497.155 0.03% Solar 0.000 0.000 0.000 0.00% Waste 1,984.504 409.495 2,393.999 0.05% Wind 0.000 144,742.000 144,742.000 2.78% Total 319,107.445 4,884,616.555 5,203,724.000 100.00%
* Market Purchases include those made directly by utilities, as well as the fraction of delivered BPA power that can be attributed to BPA’s purchases of market power. Claims on Resources include those made directly by utilities, as well as the fractions of delivered BPA power that can be attributed to specific plants.
153
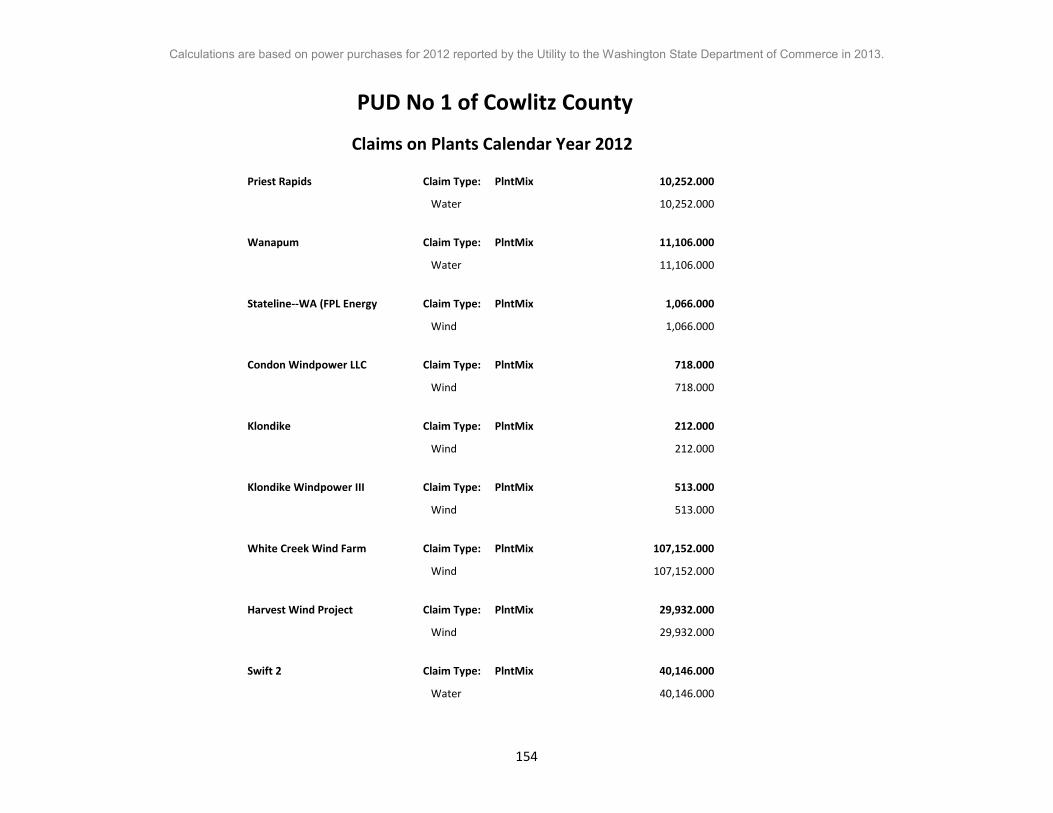
Calculations are based on power purchases for 2012 reported by the Utility to the Washington State Department of Commerce in 2013.
PUD No 1 of Cowlitz County Claims on Plants Calendar Year 2012 Priest Rapids Claim Type: PlntMix 10,252.000
Water 10,252.000
Wanapum Claim Type: PlntMix 11,106.000
Water 11,106.000
Stateline--WA (FPL Energy Claim Type: PlntMix 1,066.000
Wind 1,066.000
Condon Windpower LLC Claim Type: PlntMix 718.000
Wind 718.000
Klondike Claim Type: PlntMix 212.000
Wind 212.000
Klondike Windpower III Claim Type: PlntMix 513.000
Wind 513.000
White Creek Wind Farm Claim Type: PlntMix 107,152.000
Wind 107,152.000
Harvest Wind Project Claim Type: PlntMix 29,932.000
Wind 29,932.000
Swift 2 Claim Type: PlntMix 40,146.000
Water 40,146.000
154

Calculations are based on power purchases for 2012 reported by the Utility to the Washington State Department of Commerce in 2013.
PUD No 1 of Cowlitz County Nine Canyon Claim Type: PlntMix 5,149.000
Wind 5,149.000
155

Calculations are based on power purchases for 2012 reported by the Utility to the Washington State Department of Commerce in 2013.
PUD No 1 of Cowlitz County
Claims on BPA* Calendar Year 2012 BPA Resource Mix 2,145,821.807
Biomass 1,316.967
Natural Gas 1,877.985
Nuclear 212,290.544
Petroleum (heavy oil) 175.363
Waste 187.822
Water 1,929,973.126
BPA Slice 2,532,548.748
Biomass 1,554.314
Natural Gas 2,216.442
Nuclear 250,550.232
Petroleum (heavy oil) 206.967
Waste 221.672
Water 2,277,799.121
*The BPA Resource Mix includes only the fraction of delivered BPA power that can be attributed to specific plants. The fraction of BPA power that BPA purchased on the market is included in the “Market Purchases” table.
156

Calculations are based on power purchases for 2012 reported by the Utility to the Washington State Department of Commerce in 2013.
PUD No 1 of Cowlitz County
Market Purchases Calendar Year 2012
Total Market Purchases 319,107.445
BPA Market Purchase* 100,986.193
BPA Slice Wind w/o RECs** 119,186.252
Utility Market Purchase 98,935.000
* “BPA Market Purchases” are the fraction of delivered BPA power that BPA purchased on the market.
**The BPA Slice product includes a small amount of wind power that is not bundled with the Renewable Energy Credits (REC) associated with that power. Such power is assigned the net system fuel mix – as though it were a market purchase.
157

Calculations are based on power purchases for 2012 reported by the Utility to the Washington State Department of Commerce in 2013.
PUD No 1 of Douglas County
Fuel Mix Calendar Year 2012
Biomass 0.00% Coal 0.00% Cogeneration 0.00% Geothermal 0.00% Hydro 100.00% Landfill Gases 0.00% Natural Gas 0.00% Nuclear 0.00% Other 0.00% Petroleum 0.00% Solar 0.00% Waste 0.00% Wind 0.00%
Total 100.00%
158

Calculations are based on power purchases for 2012 reported by the Utility to the Washington State Department of Commerce in 2013.
PUD No 1 of Douglas County
Fuel Mix Calculations Calendar Year 2012
MWh MWh from from Total Fuel Market Purchases* Claims on Resources* Percent Biomass 0.000 0.000 0.000 0.00% Coal 0.000 0.000 0.000 0.00% Cogeneration 0.000 0.000 0.000 0.00% Geothermal 0.000 0.000 0.000 0.00% Hydro 0.000 724,663.000 724,663.000 100.00% Landfill Gases 0.000 0.000 0.000 0.00% Natural Gas 0.000 0.000 0.000 0.00% Nuclear 0.000 0.000 0.000 0.00% Other 0.000 0.000 0.000 0.00% Petroleum 0.000 0.000 0.000 0.00% Solar 0.000 0.000 0.000 0.00% Waste 0.000 0.000 0.000 0.00% Wind 0.000 0.000 0.000 0.00% Total 0.000 724,663.000 724,663.000 100.00%
* Market Purchases include those made directly by utilities, as well as the fraction of delivered BPA power that can be attributed to BPA’s purchases of market power. Claims on Resources include those made directly by utilities, as well as the fractions of delivered BPA power that can be attributed to specific plants.
159

Calculations are based on power purchases for 2012 reported by the Utility to the Washington State Department of Commerce in 2013.
PUD No 1 of Douglas County
Claims on Plants Calendar Year 2012 Rocky Reach Claim Type: PlntMix 199,686.000
Water 199,686.000
Wells Claim Type: PlntMix 524,977.000
Water 524,977.000
160

Calculations are based on power purchases for 2012 reported by the Utility to the Washington State Department of Commerce in 2013.
PUD No 1 of Ferry County
Fuel Mix Calendar Year 2012
Biomass 0.09% Coal 1.60% Cogeneration 0.00% Geothermal 0.00% Hydro 88.03% Landfill Gases 0.01% Natural Gas 0.64% Nuclear 9.57% Other 0.01% Petroleum 0.02% Solar 0.00% Waste 0.04% Wind 0.00%
Total 100.00%
161

Calculations are based on power purchases for 2012 reported by the Utility to the Washington State Department of Commerce in 2013.
PUD No 1 of Ferry County
Fuel Mix Calculations Calendar Year 2012
MWh MWh from from Total Fuel Market Purchases* Claims on Resources* Percent Biomass 28.897 62.242 91.139 0.09% Coal 1,700.156 0.000 1,700.156 1.60% Cogeneration 0.000 0.000 0.000 0.00% Geothermal 0.000 0.000 0.000 0.00% Hydro 2,266.089 91,212.981 93,479.071 88.03% Landfill Gases 7.288 0.000 7.288 0.01% Natural Gas 591.733 88.756 680.489 0.64% Nuclear 124.734 10,033.121 10,157.855 9.57% Other 7.482 0.000 7.482 0.01% Petroleum 16.674 8.288 24.962 0.02% Solar 0.000 0.000 0.000 0.00% Waste 29.681 8.877 38.558 0.04% Wind 0.000 0.000 0.000 0.00% Total 4,772.736 101,414.264 106,187.000 100.00%
* Market Purchases include those made directly by utilities, as well as the fraction of delivered BPA power that can be attributed to BPA’s purchases of market power. Claims on Resources include those made directly by utilities, as well as the fractions of delivered BPA power that can be attributed to specific plants.
162

Calculations are based on power purchases for 2012 reported by the Utility to the Washington State Department of Commerce in 2013.
PUD No 1 of Ferry County
Claims on BPA* Calendar Year 2012 BPA Resource Mix 101,414.264
Biomass 62.242
Natural Gas 88.756
Nuclear 10,033.121
Petroleum (heavy oil) 8.288
Waste 8.877
Water 91,212.981
*The BPA Resource Mix includes only the fraction of delivered BPA power that can be attributed to specific plants. The fraction of BPA power that BPA purchased on the market is included in the “Market Purchases” table.
163

Calculations are based on power purchases for 2012 reported by the Utility to the Washington State Department of Commerce in 2013.
PUD No 1 of Ferry County
Market Purchases Calendar Year 2012
Total Market Purchases 4,772.736
BPA Market Purchase* 4,772.736
* “BPA Market Purchases” are the fraction of delivered BPA power that BPA purchased on the market.
**The BPA Slice product includes a small amount of wind power that is not bundled with the Renewable Energy Credits (REC) associated with that power. Such power is assigned the net system fuel mix – as though it were a market purchase.
164

Calculations are based on power purchases for 2012 reported by the Utility to the Washington State Department of Commerce in 2013.
PUD No 1 of Franklin County
Fuel Mix Calendar Year 2012
Biomass 0.12% Coal 4.13% Cogeneration 0.00% Geothermal 0.00% Hydro 82.74% Landfill Gases 0.02% Natural Gas 2.60% Nuclear 8.67% Other 0.02% Petroleum 0.05% Solar 0.00% Waste 0.08% Wind 1.58%
Total 100.00%
165

Calculations are based on power purchases for 2012 reported by the Utility to the Washington State Department of Commerce in 2013.
PUD No 1 of Franklin County
Fuel Mix Calculations Calendar Year 2012
MWh MWh from from Total Fuel Market Purchases* Claims on Resources* Percent Biomass 719.772 531.686 1,251.458 0.12% Coal 42,347.445 0.000 42,347.445 4.13% Cogeneration 0.000 0.000 0.000 0.00% Geothermal 0.000 0.000 0.000 0.00% Hydro 56,443.695 791,254.330 847,698.025 82.74% Landfill Gases 181.540 0.000 181.540 0.02% Natural Gas 14,738.866 11,864.181 26,603.047 2.60% Nuclear 3,106.876 85,706.002 88,812.878 8.67% Other 186.369 0.000 186.369 0.02% Petroleum 415.313 70.797 486.110 0.05% Solar 0.000 0.000 0.000 0.00% Waste 739.300 75.828 815.128 0.08% Wind 0.000 16,157.000 16,157.000 1.58% Total 118,879.176 905,659.824 1,024,539.000 100.00%
* Market Purchases include those made directly by utilities, as well as the fraction of delivered BPA power that can be attributed to BPA’s purchases of market power. Claims on Resources include those made directly by utilities, as well as the fractions of delivered BPA power that can be attributed to specific plants.
166

Calculations are based on power purchases for 2012 reported by the Utility to the Washington State Department of Commerce in 2013.
PUD No 1 of Franklin County
Claims on Plants Calendar Year 2012 Packwood Claim Type: PlntMix 12,085.000
Water 12,085.000
Frederickson Power LP Claim Type: PlntMix 11,106.000
Natural Gas 11,106.000
White Creek Wind Farm Claim Type: PlntMix 7,694.000
Wind 7,694.000
Nine Canyon Claim Type: PlntMix 8,463.000
Wind 8,463.000
167

Calculations are based on power purchases for 2012 reported by the Utility to the Washington State Department of Commerce in 2013.
PUD No 1 of Franklin County
Claims on BPA* Calendar Year 2012 BPA Resource Mix 514,534.109
Biomass 315.788
Natural Gas 450.311
Nuclear 50,903.913
Petroleum (heavy oil) 42.049
Waste 45.037
Water 462,777.011
BPA Slice 351,777.715
Biomass 215.898
Natural Gas 307.870
Nuclear 34,802.089
Petroleum (heavy oil) 28.748
Waste 30.791
Water 316,392.318
*The BPA Resource Mix includes only the fraction of delivered BPA power that can be attributed to specific plants. The fraction of BPA power that BPA purchased on the market is included in the “Market Purchases” table.
168

Calculations are based on power purchases for 2012 reported by the Utility to the Washington State Department of Commerce in 2013.
PUD No 1 of Franklin County
Market Purchases Calendar Year 2012
Total Market Purchases 118,879.176
BPA Market Purchase* 24,214.891
BPA Slice Wind w/o RECs** 16,555.285
Utility Market Purchase 78,109.000
* “BPA Market Purchases” are the fraction of delivered BPA power that BPA purchased on the market.
**The BPA Slice product includes a small amount of wind power that is not bundled with the Renewable Energy Credits (REC) associated with that power. Such power is assigned the net system fuel mix – as though it were a market purchase.
169

Calculations are based on power purchases for 2012 reported by the Utility to the Washington State Department of Commerce in 2013.
PUD No 1 of Grays Harbor County
Fuel Mix Calendar Year 2012
Biomass 0.09% Coal 1.60% Cogeneration 0.00% Geothermal 0.00% Hydro 88.03% Landfill Gases 0.01% Natural Gas 0.64% Nuclear 9.57% Other 0.01% Petroleum 0.02% Solar 0.00% Waste 0.04% Wind 0.00%
Total 100.00%
170

Calculations are based on power purchases for 2012 reported by the Utility to the Washington State Department of Commerce in 2013.
PUD No 1 of Grays Harbor County
Fuel Mix Calculations Calendar Year 2012
MWh MWh from from Total Fuel Market Purchases* Claims on Resources* Percent Biomass 279.100 601.150 880.250 0.09% Coal 16,420.700 0.000 16,420.700 1.60% Cogeneration 0.000 0.000 0.000 0.00% Geothermal 0.000 0.000 0.000 0.00% Hydro 21,886.680 880,966.717 902,853.398 88.03% Landfill Gases 70.394 0.000 70.394 0.01% Natural Gas 5,715.162 857.236 6,572.398 0.64% Nuclear 1,204.726 96,903.372 98,108.098 9.57% Other 72.267 0.000 72.267 0.01% Petroleum 161.042 80.047 241.089 0.02% Solar 0.000 0.000 0.000 0.00% Waste 286.672 85.734 372.406 0.04% Wind 0.000 0.000 0.000 0.00% Total 46,096.743 979,494.257 1,025,591.000 100.00%
* Market Purchases include those made directly by utilities, as well as the fraction of delivered BPA power that can be attributed to BPA’s purchases of market power. Claims on Resources include those made directly by utilities, as well as the fractions of delivered BPA power that can be attributed to specific plants.
171

Calculations are based on power purchases for 2012 reported by the Utility to the Washington State Department of Commerce in 2013.
PUD No 1 of Grays Harbor County
Claims on BPA* Calendar Year 2012 BPA Resource Mix 390,594.908
Biomass 239.722
Natural Gas 341.842
Nuclear 38,642.354
Petroleum (heavy oil) 31.921
Waste 34.189
Water 351,304.882
BPA Slice 588,899.349
Biomass 361.428
Natural Gas 515.394
Nuclear 58,261.018
Petroleum (heavy oil) 48.126
Waste 51.546
Water 529,661.835
*Includes that part of claims on BPA electricity products that correspond to the percentage of BPA's power that comes from specific generating facilities. That part of claims on BPA electricity products that correspond to the percentage of BPA's power that comes from market purchases is included in the “Market Purchases” table.
172

Calculations are based on power purchases for 2012 reported by the Utility to the Washington State Department of Commerce in 2013.
PUD No 1 of Grays Harbor County
Market Purchases Calendar Year 2012
Total Market Purchases 46,096.743
BPA Market Purchase* 18,382.092
BPA Slice Wind w/o RECs** 27,714.651
* “BPA Market Purchases” are the fraction of delivered BPA power that BPA purchased on the market.
**The BPA Slice product includes a small amount of wind power that is not bundled with the Renewable Energy Credits (REC) associated with that power. Such power is assigned the net system fuel mix – as though it were a market purchase.
173

Calculations are based on power purchases for 2012 reported by the Utility to the Washington State Department of Commerce in 2013.
PUD No 1 of Kittitas County
Fuel Mix Calendar Year 2012
Biomass 0.09% Coal 1.60% Cogeneration 0.00% Geothermal 0.00% Hydro 88.03% Landfill Gases 0.01% Natural Gas 0.64% Nuclear 9.57% Other 0.01% Petroleum 0.02% Solar 0.00% Waste 0.04% Wind 0.00%
Total 100.00%
174

Calculations are based on power purchases for 2012 reported by the Utility to the Washington State Department of Commerce in 2013.
PUD No 1 of Kittitas County
Fuel Mix Calculations Calendar Year 2012
MWh MWh from from Total Fuel Market Purchases* Claims on Resources* Percent Biomass 26.204 56.440 82.643 0.09% Coal 1,541.680 0.000 1,541.680 1.60% Cogeneration 0.000 0.000 0.000 0.00% Geothermal 0.000 0.000 0.000 0.00% Hydro 2,054.861 82,710.753 84,765.614 88.03% Landfill Gases 6.609 0.000 6.609 0.01% Natural Gas 536.576 80.483 617.058 0.64% Nuclear 113.107 9,097.904 9,211.012 9.57% Other 6.785 0.000 6.785 0.01% Petroleum 15.120 7.515 22.635 0.02% Solar 0.000 0.000 0.000 0.00% Waste 26.915 8.049 34.964 0.04% Wind 0.000 0.000 0.000 0.00% Total 4,327.855 91,961.145 96,289.000 100.00%
* Market Purchases include those made directly by utilities, as well as the fraction of delivered BPA power that can be attributed to BPA’s purchases of market power. Claims on Resources include those made directly by utilities, as well as the fractions of delivered BPA power that can be attributed to specific plants.
175

Calculations are based on power purchases for 2012 reported by the Utility to the Washington State Department of Commerce in 2013.
PUD No 1 of Kittitas County
Claims on BPA* Calendar Year 2012 BPA Resource Mix 91,961.145
Biomass 56.440
Natural Gas 80.483
Nuclear 9,097.904
Petroleum (heavy oil) 7.515
Waste 8.049
Water 82,710.753
*The BPA Resource Mix includes only the fraction of delivered BPA power that can be attributed to specific plants. The fraction of BPA power that BPA purchased on the market is included in the “Market Purchases” table.
176

Calculations are based on power purchases for 2012 reported by the Utility to the Washington State Department of Commerce in 2013.
PUD No 1 of Kittitas County
Market Purchases Calendar Year 2012
Total Market Purchases 4,327.855
BPA Market Purchase* 4,327.855
* “BPA Market Purchases” are the fraction of delivered BPA power that BPA purchased on the market.
**The BPA Slice product includes a small amount of wind power that is not bundled with the Renewable Energy Credits (REC) associated with that power. Such power is assigned the net system fuel mix – as though it were a market purchase.
177

Calculations are based on power purchases for 2012 reported by the Utility to the Washington State Department of Commerce in 2013.
PUD No 1 of Klickitat County
Fuel Mix Calendar Year 2012
Biomass 0.10% Coal 3.33% Cogeneration 0.00% Geothermal 0.00% Hydro 85.28% Landfill Gases 0.01% Natural Gas 1.22% Nuclear 7.48% Other 0.01% Petroleum 0.04% Solar 0.00% Waste 0.06% Wind 2.46%
Total 100.00%
178

Calculations are based on power purchases for 2012 reported by the Utility to the Washington State Department of Commerce in 2013.
PUD No 1 of Klickitat County
Fuel Mix Calculations Calendar Year 2012
MWh MWh from from Total Fuel Market Purchases* Claims on Resources* Percent Biomass 205.262 162.773 368.036 0.10% Coal 12,076.516 0.000 12,076.516 3.33% Cogeneration 0.000 0.000 0.000 0.00% Geothermal 0.000 0.000 0.000 0.00% Hydro 16,096.442 293,135.122 309,231.564 85.28% Landfill Gases 51.771 0.000 51.771 0.01% Natural Gas 4,203.185 232.114 4,435.299 1.22% Nuclear 886.009 26,238.500 27,124.509 7.48% Other 53.148 0.000 53.148 0.01% Petroleum 118.438 21.674 140.112 0.04% Solar 0.000 0.000 0.000 0.00% Waste 210.831 23.214 234.046 0.06% Wind 0.000 8,909.000 8,909.000 2.46% Total 33,901.603 328,722.397 362,624.000 100.00%
* Market Purchases include those made directly by utilities, as well as the fraction of delivered BPA power that can be attributed to BPA’s purchases of market power. Claims on Resources include those made directly by utilities, as well as the fractions of delivered BPA power that can be attributed to specific plants.
179
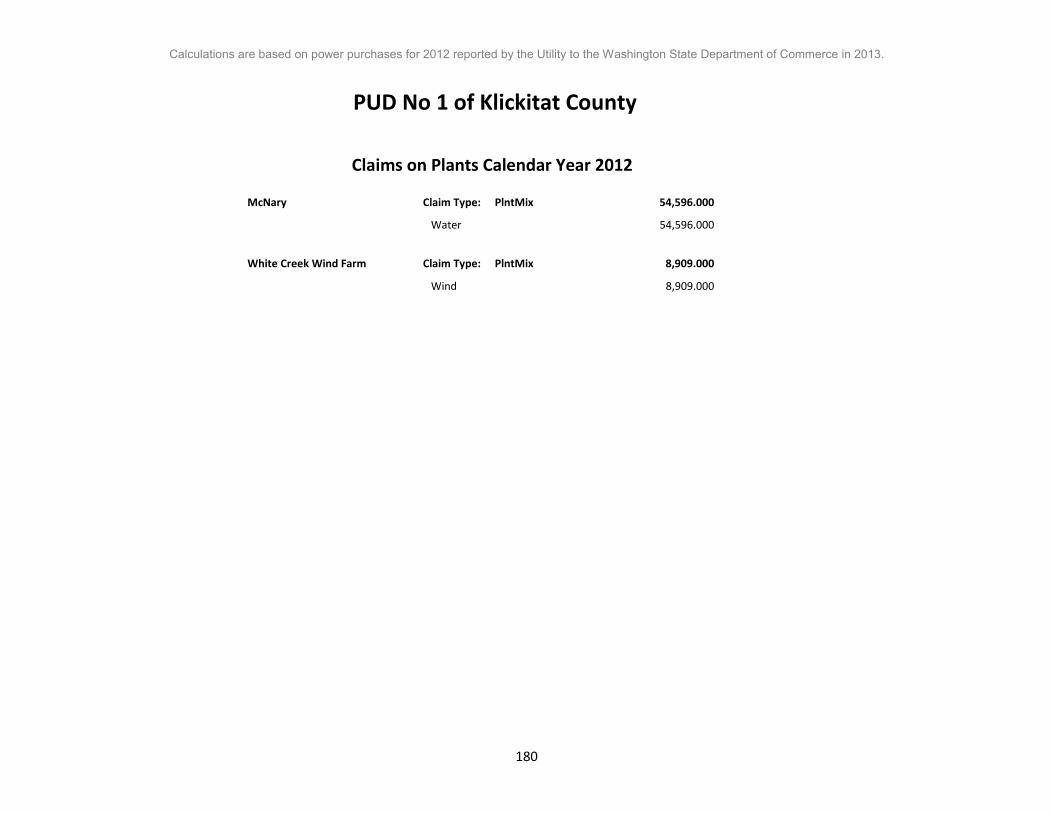
Calculations are based on power purchases for 2012 reported by the Utility to the Washington State Department of Commerce in 2013.
PUD No 1 of Klickitat County
Claims on Plants Calendar Year 2012 McNary Claim Type: PlntMix 54,596.000
Water 54,596.000
White Creek Wind Farm Claim Type: PlntMix 8,909.000
Wind 8,909.000
180
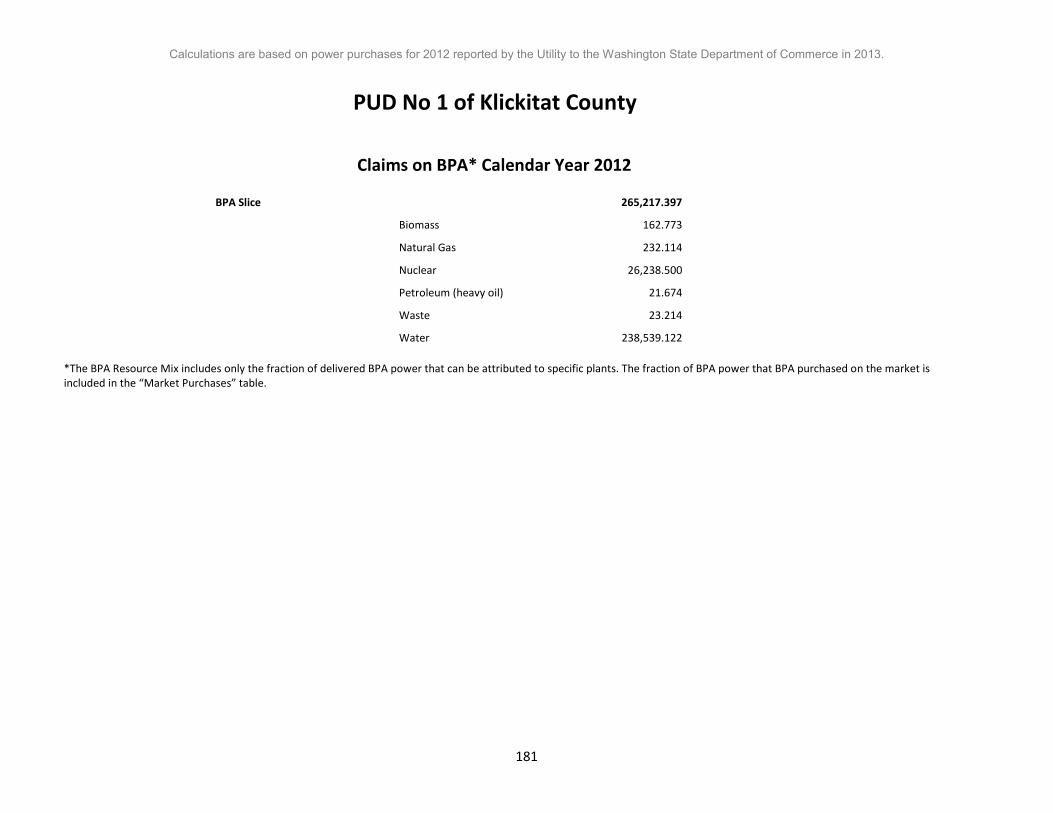
Calculations are based on power purchases for 2012 reported by the Utility to the Washington State Department of Commerce in 2013.
PUD No 1 of Klickitat County
Claims on BPA* Calendar Year 2012 BPA Slice 265,217.397
Biomass 162.773
Natural Gas 232.114
Nuclear 26,238.500
Petroleum (heavy oil) 21.674
Waste 23.214
Water 238,539.122
*The BPA Resource Mix includes only the fraction of delivered BPA power that can be attributed to specific plants. The fraction of BPA power that BPA purchased on the market is included in the “Market Purchases” table.
181

Calculations are based on power purchases for 2012 reported by the Utility to the Washington State Department of Commerce in 2013.
PUD No 1 of Klickitat County
Market Purchases Calendar Year 2012
Total Market Purchases 33,901.603
BPA Slice Wind w/o RECs** 12,481.603
Utility Market Purchase 21,420.000
* “BPA Market Purchases” are the fraction of delivered BPA power that BPA purchased on the market.
**The BPA Slice product includes a small amount of wind power that is not bundled with the Renewable Energy Credits (REC) associated with that power. Such power is assigned the net system fuel mix – as though it were a market purchase.
182

Calculations are based on power purchases for 2012 reported by the Utility to the Washington State Department of Commerce in 2013.
PUD No 1 of Lewis County
Fuel Mix Calendar Year 2012
Biomass 0.11% Coal 3.11% Cogeneration 0.00% Geothermal 0.00% Hydro 85.74% Landfill Gases 0.01% Natural Gas 1.16% Nuclear 9.11% Other 0.01% Petroleum 0.04% Solar 0.00% Waste 0.06% Wind 0.64%
Total 100.00%
183

Calculations are based on power purchases for 2012 reported by the Utility to the Washington State Department of Commerce in 2013.
PUD No 1 of Lewis County
Fuel Mix Calculations Calendar Year 2012
MWh MWh from from Total Fuel Market Purchases* Claims on Resources* Percent Biomass 504.767 525.588 1,030.355 0.11% Coal 29,697.735 0.000 29,697.735 3.11% Cogeneration 0.000 0.000 0.000 0.00% Geothermal 0.000 0.000 0.000 0.00% Hydro 39,583.260 778,281.855 817,865.115 85.74% Landfill Gases 127.312 0.000 127.312 0.01% Natural Gas 10,336.183 749.485 11,085.668 1.16% Nuclear 2,178.813 84,722.976 86,901.789 9.11% Other 130.698 0.000 130.698 0.01% Petroleum 291.254 69.985 361.239 0.04% Solar 0.000 0.000 0.000 0.00% Waste 518.462 74.958 593.420 0.06% Wind 0.000 6,132.000 6,132.000 0.64% Total 83,368.484 870,556.847 953,925.331 100.00%
* Market Purchases include those made directly by utilities, as well as the fraction of delivered BPA power that can be attributed to BPA’s purchases of market power. Claims on Resources include those made directly by utilities, as well as the fractions of delivered BPA power that can be attributed to specific plants.
184

Calculations are based on power purchases for 2012 reported by the Utility to the Washington State Department of Commerce in 2013.
PUD No 1 of Lewis County
Claims on Plants Calendar Year 2012 Packwood Claim Type: PlntMix 6,919.000
Water 6,919.000
Foote Creek I Claim Type: PlntMix 482.000
Wind 482.000
Foote Creek II Claim Type: PlntMix 55.000
Wind 55.000
Condon Windpower LLC Claim Type: PlntMix 1,192.000
Wind 1,192.000
Klondike Claim Type: PlntMix 584.000
Wind 584.000
Stateline--OR (FPL Energy Claim Type: PlntMix 2,312.000
Wind 2,312.000
Klondike Windpower III Claim Type: PlntMix 1,507.000
Wind 1,507.000
Mill Creek Claim Type: PlntMix 1,130.400
Water 1,130.400
185

Calculations are based on power purchases for 2012 reported by the Utility to the Washington State Department of Commerce in 2013.
PUD No 1 of Lewis County
Claims on BPA* Calendar Year 2012 BPA Resource Mix 345,820.091
Biomass 212.242
Natural Gas 302.656
Nuclear 34,212.690
Petroleum (heavy oil) 28.261
Waste 30.269
Water 311,033.973
BPA Slice 510,555.356
Biomass 313.346
Natural Gas 446.829
Nuclear 50,510.287
Petroleum (heavy oil) 41.724
Waste 44.689
Water 459,198.482
*The BPA Resource Mix includes only the fraction of delivered BPA power that can be attributed to specific plants. The fraction of BPA power that BPA purchased on the market is included in the “Market Purchases” table.
186

Calculations are based on power purchases for 2012 reported by the Utility to the Washington State Department of Commerce in 2013.
PUD No 1 of Lewis County
Market Purchases Calendar Year 2012
Total Market Purchases 83,368.484
BPA Market Purchase* 16,274.909
BPA Slice Wind w/o RECs** 24,027.644
Utility Market Purchase 43,065.931
* “BPA Market Purchases” are the fraction of delivered BPA power that BPA purchased on the market.
**The BPA Slice product includes a small amount of wind power that is not bundled with the Renewable Energy Credits (REC) associated with that power. Such power is assigned the net system fuel mix – as though it were a market purchase.
187

Calculations are based on power purchases for 2012 reported by the Utility to the Washington State Department of Commerce in 2013.
PUD No 1 of Mason County
Fuel Mix Calendar Year 2012
Biomass 0.09% Coal 1.60% Cogeneration 0.00% Geothermal 0.00% Hydro 88.03% Landfill Gases 0.01% Natural Gas 0.64% Nuclear 9.57% Other 0.01% Petroleum 0.02% Solar 0.00% Waste 0.04% Wind 0.00%
Total 100.00%
188
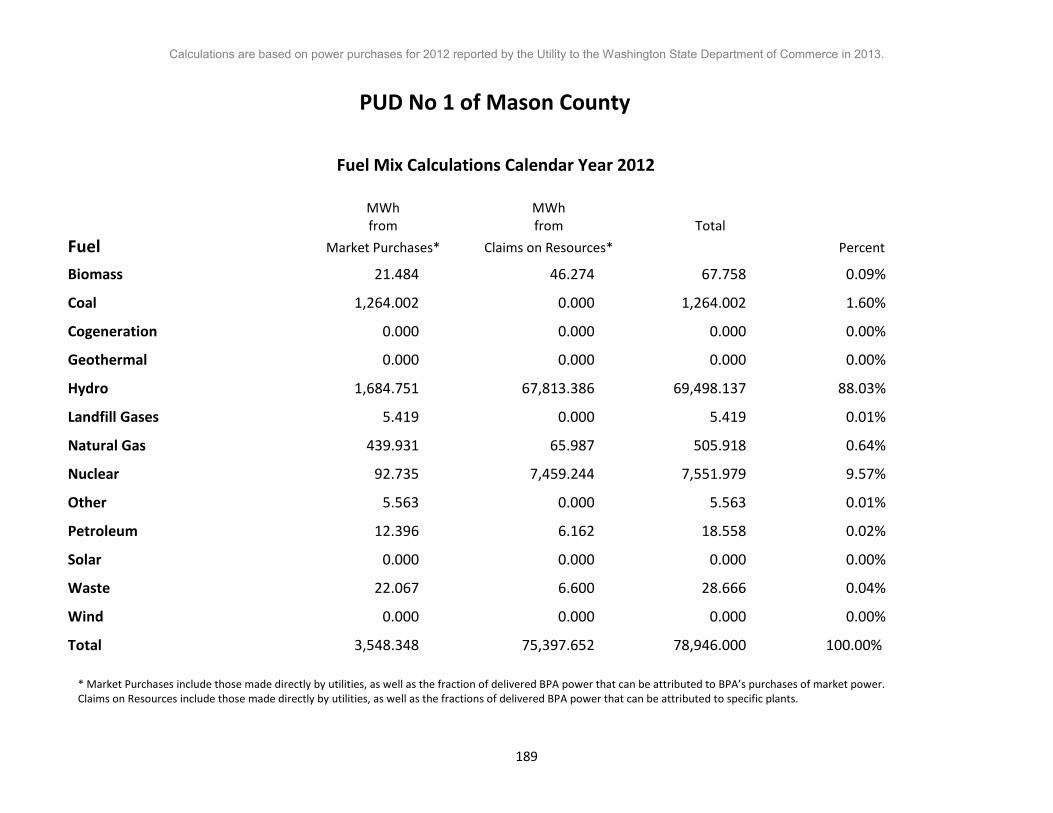
Calculations are based on power purchases for 2012 reported by the Utility to the Washington State Department of Commerce in 2013.
PUD No 1 of Mason County
Fuel Mix Calculations Calendar Year 2012
MWh MWh from from Total Fuel Market Purchases* Claims on Resources* Percent Biomass 21.484 46.274 67.758 0.09% Coal 1,264.002 0.000 1,264.002 1.60% Cogeneration 0.000 0.000 0.000 0.00% Geothermal 0.000 0.000 0.000 0.00% Hydro 1,684.751 67,813.386 69,498.137 88.03% Landfill Gases 5.419 0.000 5.419 0.01% Natural Gas 439.931 65.987 505.918 0.64% Nuclear 92.735 7,459.244 7,551.979 9.57% Other 5.563 0.000 5.563 0.01% Petroleum 12.396 6.162 18.558 0.02% Solar 0.000 0.000 0.000 0.00% Waste 22.067 6.600 28.666 0.04% Wind 0.000 0.000 0.000 0.00% Total 3,548.348 75,397.652 78,946.000 100.00%
* Market Purchases include those made directly by utilities, as well as the fraction of delivered BPA power that can be attributed to BPA’s purchases of market power. Claims on Resources include those made directly by utilities, as well as the fractions of delivered BPA power that can be attributed to specific plants.
189

Calculations are based on power purchases for 2012 reported by the Utility to the Washington State Department of Commerce in 2013.
PUD No 1 of Mason County
Claims on BPA* Calendar Year 2012 BPA Resource Mix 75,397.652
Biomass 46.274
Natural Gas 65.987
Nuclear 7,459.244
Petroleum (heavy oil) 6.162
Waste 6.600
Water 67,813.386 *The BPA Resource Mix includes only the fraction of delivered BPA power that can be attributed to specific plants. The fraction of BPA power that BPA purchased on the market is included in the “Market Purchases” table.
190

Calculations are based on power purchases for 2012 reported by the Utility to the Washington State Department of Commerce in 2013.
PUD No 1 of Mason County
Market Purchases Calendar Year 2012
Total Market Purchases 3,548.348
BPA Market Purchase* 3,548.348
* “BPA Market Purchases” are the fraction of delivered BPA power that BPA purchased on the market.
**The BPA Slice product includes a small amount of wind power that is not bundled with the Renewable Energy Credits (REC) associated with that power. Such power is assigned the net system fuel mix – as though it were a market purchase.
191

Calculations are based on power purchases for 2012 reported by the Utility to the Washington State Department of Commerce in 2013.
PUD No 1 of Okanogan County
Fuel Mix Calendar Year 2012
Biomass 0.09% Coal 2.99% Cogeneration 0.00% Geothermal 0.00% Hydro 89.50% Landfill Gases 0.01% Natural Gas 1.09% Nuclear 6.18% Other 0.01% Petroleum 0.03% Solar 0.00% Waste 0.06% Wind 0.03%
Total 100.00%
192

Calculations are based on power purchases for 2012 reported by the Utility to the Washington State Department of Commerce in 2013.
PUD No 1 of Okanogan County
Fuel Mix Calculations Calendar Year 2012
MWh MWh from from Total Fuel Market Purchases* Claims on Resources* Percent Biomass 313.813 228.702 542.516 0.09% Coal 18,463.052 0.000 18,463.052 2.99% Cogeneration 0.000 0.000 0.000 0.00% Geothermal 0.000 0.000 0.000 0.00% Hydro 24,608.872 528,481.073 553,089.945 89.50% Landfill Gases 79.150 0.000 79.150 0.01% Natural Gas 6,425.995 326.128 6,752.123 1.09% Nuclear 1,354.566 36,866.048 38,220.614 6.18% Other 81.255 0.000 81.255 0.01% Petroleum 181.072 30.453 211.525 0.03% Solar 0.000 0.000 0.000 0.00% Waste 322.327 32.617 354.944 0.06% Wind 0.000 190.877 190.877 0.03% Total 51,830.102 566,155.898 617,986.000 100.00%
* Market Purchases include those made directly by utilities, as well as the fraction of delivered BPA power that can be attributed to BPA’s purchases of market power. Claims on Resources include those made directly by utilities, as well as the fractions of delivered BPA power that can be attributed to specific plants.
193

Calculations are based on power purchases for 2012 reported by the Utility to the Washington State Department of Commerce in 2013.
PUD No 1 of Okanogan County
Claims on Plants Calendar Year 2012 Wells Claim Type: PlntMix 193,324.918
Water 193,324.918
Nine Canyon Claim Type: PlntMix 190.877
Wind 190.877
194

Calculations are based on power purchases for 2012 reported by the Utility to the Washington State Department of Commerce in 2013.
PUD No 1 of Okanogan County
Claims on BPA* Calendar Year 2012 BPA Resource Mix 197,533.712
Biomass 121.233
Natural Gas 172.878
Nuclear 19,542.414
Petroleum (heavy oil) 16.143
Waste 17.290
Water 177,663.753
BPA Slice 175,106.392
Biomass 107.469
Natural Gas 153.250
Nuclear 17,323.634
Petroleum (heavy oil) 14.310
Waste 15.327
Water 157,492.402
*The BPA Resource Mix includes only the fraction of delivered BPA power that can be attributed to specific plants. The fraction of BPA power that BPA purchased on the market is included in the “Market Purchases” table.
195

Calculations are based on power purchases for 2012 reported by the Utility to the Washington State Department of Commerce in 2013.
PUD No 1 of Okanogan County
Market Purchases Calendar Year 2012
Total Market Purchases 51,830.102
BPA Market Purchase* 9,296.288
BPA Slice Wind w/o RECs** 8,240.818
Utility Market Purchase 34,292.995
* “BPA Market Purchases” are the fraction of delivered BPA power that BPA purchased on the market.
**The BPA Slice product includes a small amount of wind power that is not bundled with the Renewable Energy Credits (REC) associated with that power. Such power is assigned the net system fuel mix – as though it were a market purchase.
196

Calculations are based on power purchases for 2012 reported by the Utility to the Washington State Department of Commerce in 2013.
PUD No 1 of Pend Oreille County
Fuel Mix Calendar Year 2012
Biomass 0.02% Coal 0.30% Cogeneration 0.00% Geothermal 0.00% Hydro 97.79% Landfill Gases 0.00% Natural Gas 0.12% Nuclear 1.76% Other 0.00% Petroleum 0.00% Solar 0.00% Waste 0.01% Wind 0.00%
Total 100.00%
197

Calculations are based on power purchases for 2012 reported by the Utility to the Washington State Department of Commerce in 2013.
PUD No 1 of Pend Oreille County
Fuel Mix Calculations Calendar Year 2012
MWh MWh from from Total Fuel Market Purchases* Claims on Resources* Percent Biomass 50.957 109.755 160.711 0.02% Coal 2,998.005 0.000 2,998.005 0.30% Cogeneration 0.000 0.000 0.000 0.00% Geothermal 0.000 0.000 0.000 0.00% Hydro 3,995.955 989,162.261 993,158.215 97.79% Landfill Gases 12.852 0.000 12.852 0.00% Natural Gas 1,043.444 156.510 1,199.954 0.12% Nuclear 219.953 17,692.107 17,912.060 1.76% Other 13.194 0.000 13.194 0.00% Petroleum 29.402 14.615 44.017 0.00% Solar 0.000 0.000 0.000 0.00% Waste 52.339 15.653 67.992 0.01% Wind 0.000 0.000 0.000 0.00% Total 8,416.100 1,007,150.900 1,015,567.000 100.00%
* Market Purchases include those made directly by utilities, as well as the fraction of delivered BPA power that can be attributed to BPA’s purchases of market power. Claims on Resources include those made directly by utilities, as well as the fractions of delivered BPA power that can be attributed to specific plants.
198

Calculations are based on power purchases for 2012 reported by the Utility to the Washington State Department of Commerce in 2013.
PUD No 1 of Pend Oreille County
Claims on Plants Calendar Year 2012 Box Canyon Claim Type: PlntMix 459,036.000
Water 459,036.000
Boundary Claim Type: PlntMix 369,284.000
Water 369,284.000
199

Calculations are based on power purchases for 2012 reported by the Utility to the Washington State Department of Commerce in 2013.
PUD No 1 of Pend Oreille County
Claims on BPA* Calendar Year 2012 BPA Resource Mix 126,070.880
Biomass 77.374
Natural Gas 110.335
Nuclear 12,472.450
Petroleum (heavy oil) 10.303
Waste 11.035
Water 113,389.383
BPA Slice 52,760.020
Biomass 32.381
Natural Gas 46.175
Nuclear 5,219.657
Petroleum (heavy oil) 4.312
Waste 4.618
Water 47,452.878
*The BPA Resource Mix includes only the fraction of delivered BPA power that can be attributed to specific plants. The fraction of BPA power that BPA purchased on the market is included in the “Market Purchases” table.
200

Calculations are based on power purchases for 2012 reported by the Utility to the Washington State Department of Commerce in 2013.
PUD No 1 of Pend Oreille County
Market Purchases Calendar Year 2012
Total Market Purchases 8,416.100
BPA Market Purchase* 5,933.120
BPA Slice Wind w/o RECs** 2,482.980
* “BPA Market Purchases” are the fraction of delivered BPA power that BPA purchased on the market.
**The BPA Slice product includes a small amount of wind power that is not bundled with the Renewable Energy Credits (REC) associated with that power. Such power is assigned the net system fuel mix – as though it were a market purchase.
201

Calculations are based on power purchases for 2012 reported by the Utility to the Washington State Department of Commerce in 2013.
PUD No 1 of Skamania County
Fuel Mix Calendar Year 2012
Biomass 0.09% Coal 1.60% Cogeneration 0.00% Geothermal 0.00% Hydro 88.03% Landfill Gases 0.01% Natural Gas 0.64% Nuclear 9.57% Other 0.01% Petroleum 0.02% Solar 0.00% Waste 0.04% Wind 0.00%
Total 100.00%
202
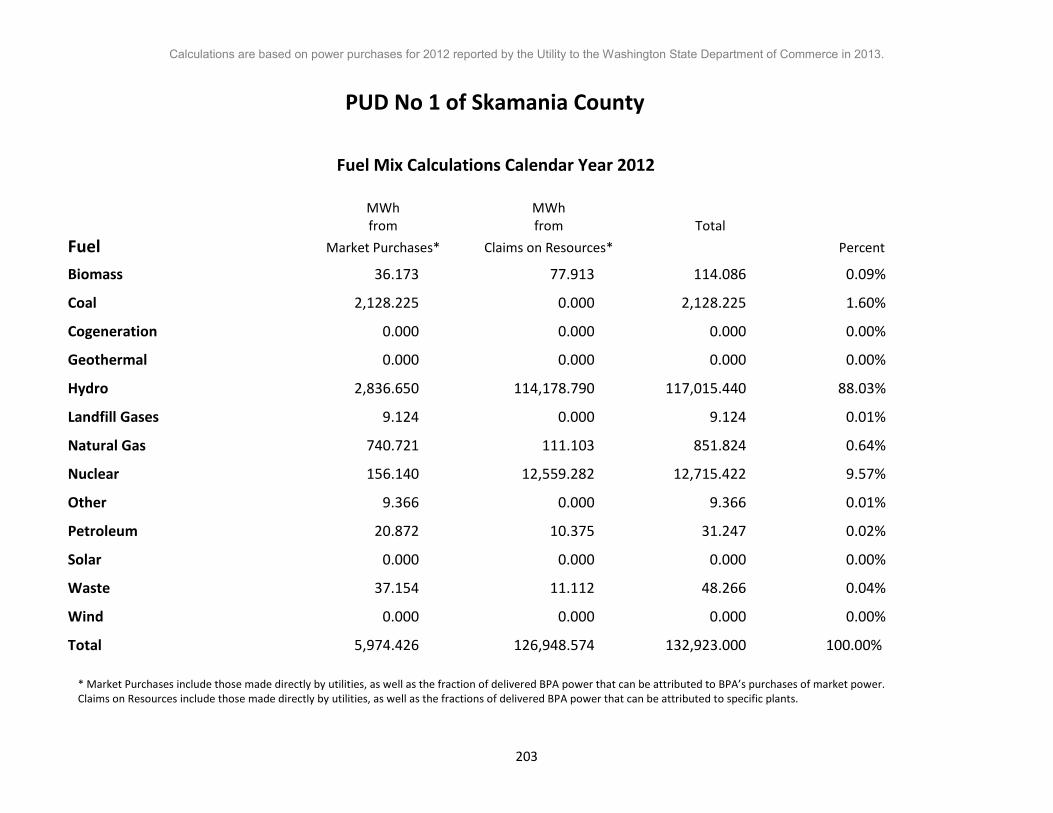
Calculations are based on power purchases for 2012 reported by the Utility to the Washington State Department of Commerce in 2013.
PUD No 1 of Skamania County
Fuel Mix Calculations Calendar Year 2012
MWh MWh from from Total Fuel Market Purchases* Claims on Resources* Percent Biomass 36.173 77.913 114.086 0.09% Coal 2,128.225 0.000 2,128.225 1.60% Cogeneration 0.000 0.000 0.000 0.00% Geothermal 0.000 0.000 0.000 0.00% Hydro 2,836.650 114,178.790 117,015.440 88.03% Landfill Gases 9.124 0.000 9.124 0.01% Natural Gas 740.721 111.103 851.824 0.64% Nuclear 156.140 12,559.282 12,715.422 9.57% Other 9.366 0.000 9.366 0.01% Petroleum 20.872 10.375 31.247 0.02% Solar 0.000 0.000 0.000 0.00% Waste 37.154 11.112 48.266 0.04% Wind 0.000 0.000 0.000 0.00% Total 5,974.426 126,948.574 132,923.000 100.00%
* Market Purchases include those made directly by utilities, as well as the fraction of delivered BPA power that can be attributed to BPA’s purchases of market power. Claims on Resources include those made directly by utilities, as well as the fractions of delivered BPA power that can be attributed to specific plants.
203

Calculations are based on power purchases for 2012 reported by the Utility to the Washington State Department of Commerce in 2013.
PUD No 1 of Skamania County
Claims on BPA* Calendar Year 2012 BPA Resource Mix 126,948.574
Biomass 77.913
Natural Gas 111.103
Nuclear 12,559.282
Petroleum (heavy oil) 10.375
Waste 11.112
Water 114,178.790
*The BPA Resource Mix includes only the fraction of delivered BPA power that can be attributed to specific plants. The fraction of BPA power that BPA purchased on the market is included in the “Market Purchases” table.
204

Calculations are based on power purchases for 2012 reported by the Utility to the Washington State Department of Commerce in 2013.
PUD No 1 of Skamania County
Market Purchases Calendar Year 2012
Total Market Purchases 5,974.426
BPA Market Purchase* 5,974.426
* “BPA Market Purchases” are the fraction of delivered BPA power that BPA purchased on the market.
**The BPA Slice product includes a small amount of wind power that is not bundled with the Renewable Energy Credits (REC) associated with that power. Such power is assigned the net system fuel mix – as though it were a market purchase.
205

Calculations are based on power purchases for 2012 reported by the Utility to the Washington State Department of Commerce in 2013.
PUD No 1 of Snohomish County
Fuel Mix Calendar Year 2012
Biomass 0.21% Coal 2.56% Cogeneration 0.00% Geothermal 0.00% Hydro 85.80% Landfill Gases 0.08% Natural Gas 0.96% Nuclear 8.33% Other 0.01% Petroleum 0.03% Solar 0.00% Waste 0.05% Wind 1.95%
Total 100.00%
206

Calculations are based on power purchases for 2012 reported by the Utility to the Washington State Department of Commerce in 2013.
PUD No 1 of Snohomish County
Fuel Mix Calculations Calendar Year 2012
MWh MWh from from Total Fuel Market Purchases* Claims on Resources* Percent Biomass 2,956.964 11,502.443 14,459.406 0.21% Coal 173,971.566 0.000 173,971.566 2.56% Cogeneration 0.000 0.000 0.000 0.00% Geothermal 0.000 0.000 0.000 0.00% Hydro 231,881.711 5,597,000.327 5,828,882.038 85.80% Landfill Gases 745.801 4,838.000 5,583.801 0.08% Natural Gas 60,550.138 4,894.640 65,444.778 0.96% Nuclear 12,763.651 553,298.165 566,061.816 8.33% Other 765.639 0.000 765.639 0.01% Petroleum 1,706.187 457.052 2,163.239 0.03% Solar 0.000 0.000 0.000 0.00% Waste 3,037.189 489.526 3,526.715 0.05% Wind 0.000 132,676.000 132,676.000 1.95% Total 488,378.847 6,305,156.153 6,793,535.000 100.00%
* Market Purchases include those made directly by utilities, as well as the fraction of delivered BPA power that can be attributed to BPA’s purchases of market power. Claims on Resources include those made directly by utilities, as well as the fractions of delivered BPA power that can be attributed to specific plants.
207

Calculations are based on power purchases for 2012 reported by the Utility to the Washington State Department of Commerce in 2013.
PUD No 1 of Snohomish County
Claims on Plants Calendar Year 2012 Packwood Claim Type: PlntMix 22,813.000
Water 22,813.000
White Creek Wind Farm Claim Type: PlntMix 11,379.000
Wind 11,379.000
Hay Canyon Wind Power LLC Claim Type: PlntMix 102,425.000
Wind 102,425.000
Wheat Field Wind Power Claim Type: PlntMix 18,872.000
Wind 18,872.000
H M Jackson Claim Type: PlntMix 520,254.000
Water 520,254.000
Roosevelt Biogas 1 Claim Type: PlntMix 4,838.000
Landfill Gases 4,838.000
Hampton Lumber Mill Claim Type: PlntMix 8,070.000
Wood 8,070.000
Woods Creek Claim Type: PlntMix 2,522.000
Water 2,522.000
Youngs Creek Claim Type: PlntMix 21,274.000
Water 21,274.000
208

Calculations are based on power purchases for 2012 reported by the Utility to the Washington State Department of Commerce in 2013.
PUD No 1 of Snohomish County
Claims on BPA* Calendar Year 2012 BPA Resource Mix 3,288,519.423
Biomass 2,018.280
Natural Gas 2,878.054
Nuclear 325,339.958
Petroleum (heavy oil) 268.747
Waste 287.842
Water 2,957,726.541
BPA Slice 2,304,189.730
Biomass 1,414.163
Natural Gas 2,016.586
Nuclear 227,958.207
Petroleum (heavy oil) 188.305
Waste 201.684
Water 2,072,410.786
*The BPA Resource Mix includes only the fraction of delivered BPA power that can be attributed to specific plants. The fraction of BPA power that BPA purchased on the market is included in the “Market Purchases” table.
209

Calculations are based on power purchases for 2012 reported by the Utility to the Washington State Department of Commerce in 2013.
PUD No 1 of Snohomish County
Market Purchases Calendar Year 2012
Total Market Purchases 488,378.847
BPA Market Purchase* 154,763.577
BPA Slice Wind w/o RECs** 108,439.270
Utility Market Purchase 225,176.000
* “BPA Market Purchases” are the fraction of delivered BPA power that BPA purchased on the market.
**The BPA Slice product includes a small amount of wind power that is not bundled with the Renewable Energy Credits (REC) associated with that power. Such power is assigned the net system fuel mix – as though it were a market purchase.
210

Calculations are based on power purchases for 2012 reported by the Utility to the Washington State Department of Commerce in 2013.
PUD No 1 of Wahkiakum County
Fuel Mix Calendar Year 2012
Biomass 0.09% Coal 1.60% Cogeneration 0.00% Geothermal 0.00% Hydro 88.03% Landfill Gases 0.01% Natural Gas 0.64% Nuclear 9.57% Other 0.01% Petroleum 0.02% Solar 0.00% Waste 0.04% Wind 0.00%
Total 100.00%
211

Calculations are based on power purchases for 2012 reported by the Utility to the Washington State Department of Commerce in 2013.
PUD No 1 of Wahkiakum County
Fuel Mix Calculations Calendar Year 2012
MWh MWh from from Total Fuel Market Purchases* Claims on Resources* Percent Biomass 12.006 25.860 37.867 0.09% Coal 706.388 0.000 706.388 1.60% Cogeneration 0.000 0.000 0.000 0.00% Geothermal 0.000 0.000 0.000 0.00% Hydro 941.524 37,897.535 38,839.059 88.03% Landfill Gases 3.028 0.000 3.028 0.01% Natural Gas 245.856 36.877 282.732 0.64% Nuclear 51.825 4,168.601 4,220.426 9.57% Other 3.109 0.000 3.109 0.01% Petroleum 6.928 3.443 10.371 0.02% Solar 0.000 0.000 0.000 0.00% Waste 12.332 3.688 16.020 0.04% Wind 0.000 0.000 0.000 0.00% Total 1,982.995 42,136.005 44,119.000 100.00%
* Market Purchases include those made directly by utilities, as well as the fraction of delivered BPA power that can be attributed to BPA’s purchases of market power. Claims on Resources include those made directly by utilities, as well as the fractions of delivered BPA power that can be attributed to specific plants.
212
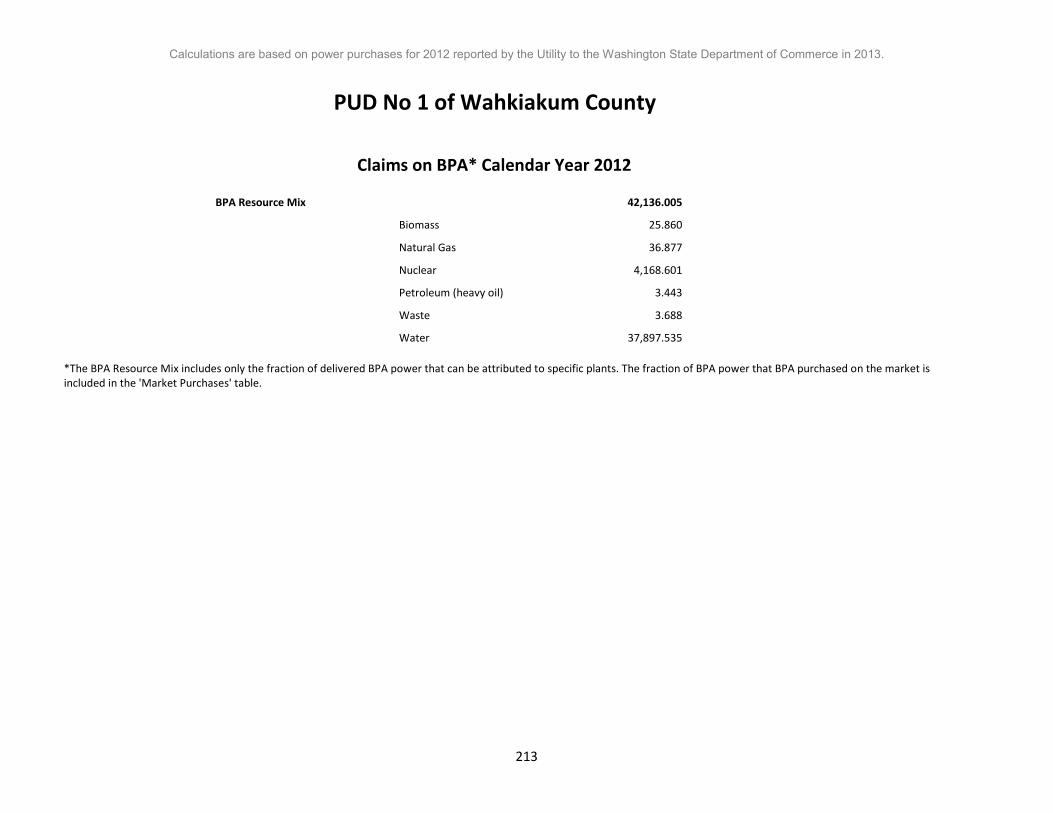
Calculations are based on power purchases for 2012 reported by the Utility to the Washington State Department of Commerce in 2013.
PUD No 1 of Wahkiakum County
Claims on BPA* Calendar Year 2012 BPA Resource Mix 42,136.005
Biomass 25.860
Natural Gas 36.877
Nuclear 4,168.601
Petroleum (heavy oil) 3.443
Waste 3.688
Water 37,897.535
*The BPA Resource Mix includes only the fraction of delivered BPA power that can be attributed to specific plants. The fraction of BPA power that BPA purchased on the market is included in the 'Market Purchases' table.
213

Calculations are based on power purchases for 2012 reported by the Utility to the Washington State Department of Commerce in 2013.
PUD No 1 of Wahkiakum County
Market Purchases Calendar Year 2012
Total Market Purchases 1,982.995
BPA Market Purchase* 1,982.995
* ‘BPA Market Purchases’ are the fraction of delivered BPA power that BPA purchased on the market.
**The BPA Slice product includes a small amount of wind power that is not bundled with the Renewable Energy Credits (REC) associated with that power. Such power is assigned the net system fuel mix -- as though it were a market purchase.
214

Calculations are based on power purchases for 2012 reported by the Utility to the Washington State Department of Commerce in 2013.
PUD No 1 of Whatcom County
Fuel Mix Calendar Year 2012
Biomass 0.09% Coal 1.60% Cogeneration 0.00% Geothermal 0.00% Hydro 88.03% Landfill Gases 0.01% Natural Gas 0.64% Nuclear 9.57% Other 0.01% Petroleum 0.02% Solar 0.00% Waste 0.04% Wind 0.00%
Total 100.00%
215

Calculations are based on power purchases for 2012 reported by the Utility to the Washington State Department of Commerce in 2013.
PUD No 1 of Whatcom County
Fuel Mix Calculations Calendar Year 2012
MWh MWh from from Total Fuel Market Purchases* Claims on Resources* Percent Biomass 55.664 119.893 175.557 0.09% Coal 3,274.947 0.000 3,274.947 1.60% Cogeneration 0.000 0.000 0.000 0.00% Geothermal 0.000 0.000 0.000 0.00% Hydro 4,365.082 175,700.115 180,065.197 88.03% Landfill Gases 14.039 0.000 14.039 0.01% Natural Gas 1,139.833 170.967 1,310.800 0.64% Nuclear 240.271 19,326.421 19,566.692 9.57% Other 14.413 0.000 14.413 0.01% Petroleum 32.118 15.965 48.083 0.02% Solar 0.000 0.000 0.000 0.00% Waste 57.174 17.099 74.273 0.04% Wind 0.000 0.000 0.000 0.00% Total 9,193.540 195,350.460 204,544.000 100.00%
* Market Purchases include those made directly by utilities, as well as the fraction of delivered BPA power that can be attributed to BPA’s purchases of market power. Claims on Resources include those made directly by utilities, as well as the fractions of delivered BPA power that can be attributed to specific plants.
216

Calculations are based on power purchases for 2012 reported by the Utility to the Washington State Department of Commerce in 2013.
PUD No 1 of Whatcom County
Claims on BPA* Calendar Year 2012 BPA Resource Mix 195,350.460
Biomass 119.893
Natural Gas 170.967
Nuclear 19,326.421
Petroleum (heavy oil) 15.965
Waste 17.099
Water 175,700.115
*The BPA Resource Mix includes only the fraction of delivered BPA power that can be attributed to specific plants. The fraction of BPA power that BPA purchased on the market is included in the “Market Purchases” table.
217
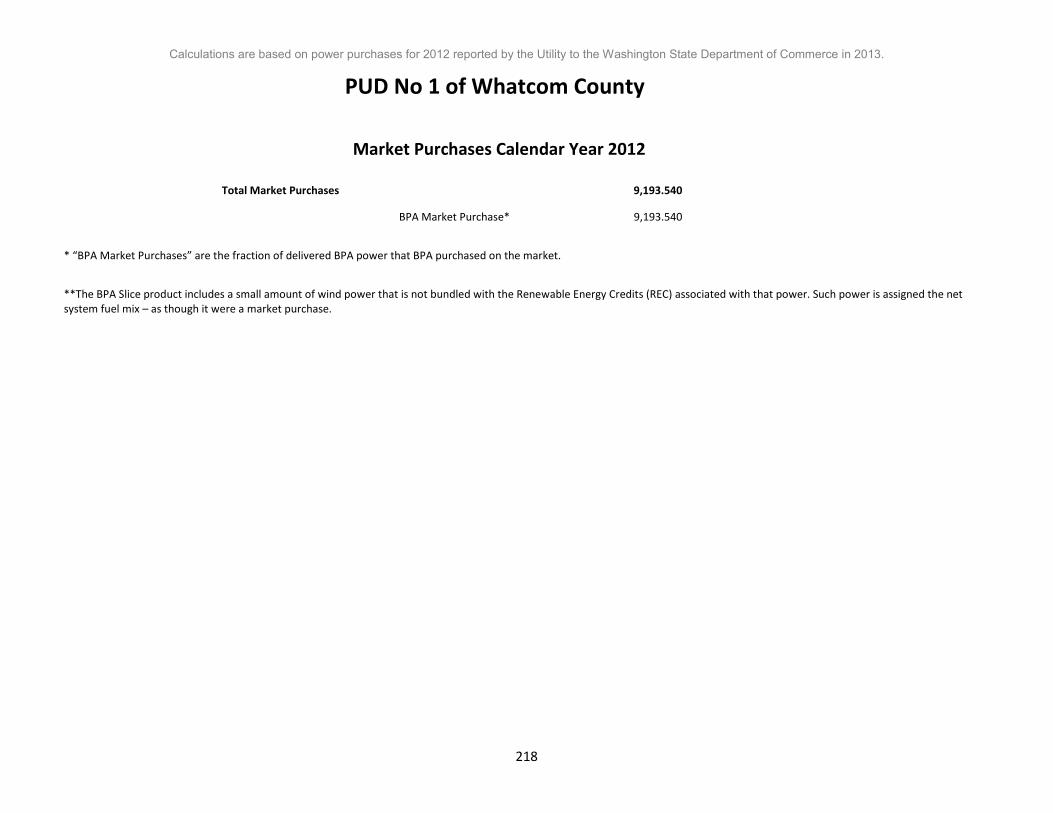
Calculations are based on power purchases for 2012 reported by the Utility to the Washington State Department of Commerce in 2013.
PUD No 1 of Whatcom County
Market Purchases Calendar Year 2012
Total Market Purchases 9,193.540
BPA Market Purchase* 9,193.540
* “BPA Market Purchases” are the fraction of delivered BPA power that BPA purchased on the market.
**The BPA Slice product includes a small amount of wind power that is not bundled with the Renewable Energy Credits (REC) associated with that power. Such power is assigned the net system fuel mix – as though it were a market purchase.
218

Calculations are based on power purchases for 2012 reported by the Utility to the Washington State Department of Commerce in 2013.
PUD No 2 of Grant County
Fuel Mix Calendar Year 2012
Biomass 0.20% Coal 11.82% Cogeneration 0.00% Geothermal 0.00% Hydro 82.47% Landfill Gases 0.05% Natural Gas 4.11% Nuclear 0.98% Other 0.05% Petroleum 0.12% Solar 0.00% Waste 0.21% Wind 0.00%
Total 100.00%
219

Calculations are based on power purchases for 2012 reported by the Utility to the Washington State Department of Commerce in 2013.
PUD No 2 of Grant County
Fuel Mix Calculations Calendar Year 2012
MWh MWh from from Total Fuel Market Purchases* Claims on Resources* Percent Biomass 8,109.129 28.343 8,137.472 0.20% Coal 477,096.843 0.000 477,096.843 11.82% Cogeneration 0.000 0.000 0.000 0.00% Geothermal 0.000 0.000 0.000 0.00% Hydro 635,908.698 2,694,077.334 3,329,986.032 82.47% Landfill Gases 2,045.273 0.000 2,045.273 0.05% Natural Gas 166,051.731 40.416 166,092.147 4.11% Nuclear 35,002.832 4,568.747 39,571.579 0.98% Other 2,099.676 0.000 2,099.676 0.05% Petroleum 4,679.020 3.774 4,682.794 0.12% Solar 0.000 0.000 0.000 0.00% Waste 8,329.140 4.042 8,333.182 0.21% Wind 0.000 0.000 0.000 0.00% Total 1,339,322.344 2,698,722.656 4,038,045.000 100.00%
* Market Purchases include those made directly by utilities, as well as the fraction of delivered BPA power that can be attributed to BPA’s purchases of market power. Claims on Resources include those made directly by utilities, as well as the fractions of delivered BPA power that can be attributed to specific plants.
220

Calculations are based on power purchases for 2012 reported by the Utility to the Washington State Department of Commerce in 2013.
PUD No 2 of Grant County
Claims on Plants Calendar Year 2012 Priest Rapids Claim Type: PlntMix 1,297,804.000
Water 1,297,804.000
Wanapum Claim Type: PlntMix 1,307,722.000
Water 1,307,722.000
Potholes East Canal 66.0 Claim Type: PlntMix 19,229.000
Water 19,229.000
Quincy Chute Claim Type: PlntMix 27,787.000
Water 27,787.000
221

Calculations are based on power purchases for 2012 reported by the Utility to the Washington State Department of Commerce in 2013.
PUD No 2 of Grant County
Claims on BPA* Calendar Year 2012 BPA Resource Mix 46,180.656
Biomass 28.343
Natural Gas 40.416
Nuclear 4,568.747
Petroleum (heavy oil) 3.774
Waste 4.042
Water 41,535.334
*The BPA Resource Mix includes only the fraction of delivered BPA power that can be attributed to specific plants. The fraction of BPA power that BPA purchased on the market is included in the 'Market Purchases' table.
222
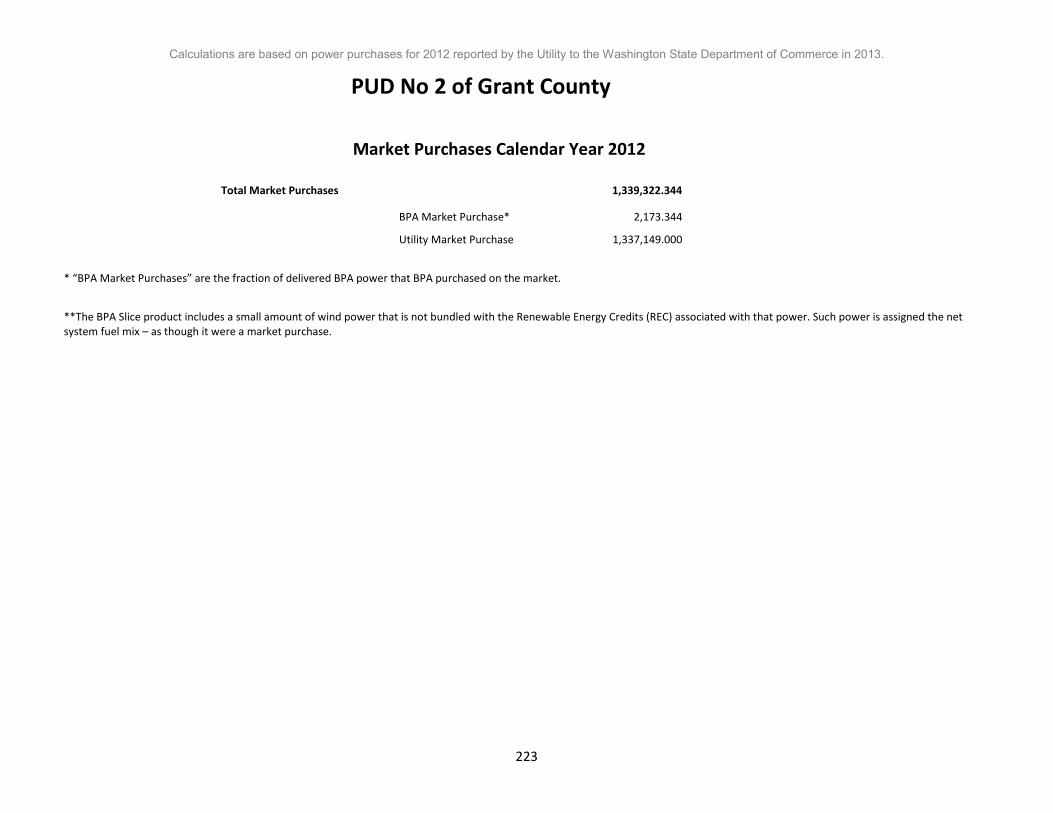
Calculations are based on power purchases for 2012 reported by the Utility to the Washington State Department of Commerce in 2013.
PUD No 2 of Grant County
Market Purchases Calendar Year 2012
Total Market Purchases 1,339,322.344
BPA Market Purchase* 2,173.344
Utility Market Purchase 1,337,149.000
* “BPA Market Purchases” are the fraction of delivered BPA power that BPA purchased on the market.
**The BPA Slice product includes a small amount of wind power that is not bundled with the Renewable Energy Credits (REC) associated with that power. Such power is assigned the net system fuel mix – as though it were a market purchase.
223

Calculations are based on power purchases for 2012 reported by the Utility to the Washington State Department of Commerce in 2013.
PUD No 2 of Pacific County
Fuel Mix Calendar Year 2012
Biomass 0.10% Coal 2.44% Cogeneration 0.00% Geothermal 0.00% Hydro 87.04% Landfill Gases 0.01% Natural Gas 0.93% Nuclear 9.40% Other 0.01% Petroleum 0.03% Solar 0.00% Waste 0.05% Wind 0.00%
Total 100.00%
224

Calculations are based on power purchases for 2012 reported by the Utility to the Washington State Department of Commerce in 2013.
PUD No 2 of Pacific County
Fuel Mix Calculations Calendar Year 2012
MWh MWh from from Total Fuel Market Purchases* Claims on Resources* Percent Biomass 125.700 173.579 299.279 0.10% Coal 7,395.523 0.000 7,395.523 2.44% Cogeneration 0.000 0.000 0.000 0.00% Geothermal 0.000 0.000 0.000 0.00% Hydro 9,857.281 254,374.500 264,231.781 87.04% Landfill Gases 31.704 0.000 31.704 0.01% Natural Gas 2,573.984 247.522 2,821.506 0.93% Nuclear 542.582 27,980.338 28,522.921 9.40% Other 32.547 0.000 32.547 0.01% Petroleum 72.530 23.113 95.643 0.03% Solar 0.000 0.000 0.000 0.00% Waste 129.111 24.755 153.866 0.05% Wind 0.000 0.000 0.000 0.00% Total 20,760.963 282,823.808 303,584.771 100.00%
* Market Purchases include those made directly by utilities, as well as the fraction of delivered BPA power that can be attributed to BPA’s purchases of market power. Claims on Resources include those made directly by utilities, as well as the fractions of delivered BPA power that can be attributed to specific plants.
225

Calculations are based on power purchases for 2012 reported by the Utility to the Washington State Department of Commerce in 2013.
PUD No 2 of Pacific County
Claims on BPA* Calendar Year 2012 BPA Resource Mix 135,911.751
Biomass 83.414
Natural Gas 118.948
Nuclear 13,446.028
Petroleum (heavy oil) 11.107
Waste 11.896
Water 122,240.359
BPA Slice 146,912.057
Biomass 90.165
Natural Gas 128.575
Nuclear 14,534.311
Petroleum (heavy oil) 12.006
Waste 12.859
Water 132,134.141 *The BPA Resource Mix includes only the fraction of delivered BPA power that can be attributed to specific plants. The fraction of BPA power that BPA purchased on the market is included in the “Market Purchases” table.
226

Calculations are based on power purchases for 2012 reported by the Utility to the Washington State Department of Commerce in 2013.
PUD No 2 of Pacific County
Market Purchases Calendar Year 2012
Total Market Purchases 20,760.963
BPA Market Purchase* 6,396.249
BPA Slice Wind w/o RECs** 6,913.943
Utility Market Purchase 7,450.771
* “BPA Market Purchases” are the fraction of delivered BPA power that BPA purchased on the market.
**The BPA Slice product includes a small amount of wind power that is not bundled with the Renewable Energy Credits (REC) associated with that power. Such power is assigned the net system fuel mix – as though it were a market purchase.
227

Calculations are based on power purchases for 2012 reported by the Utility to the Washington State Department of Commerce in 2013.
PUD No 3 of Mason County
Fuel Mix Calendar Year 2012
Biomass 0.08% Coal 1.57% Cogeneration 0.00% Geothermal 0.00% Hydro 87.21% Landfill Gases 0.01% Natural Gas 0.63% Nuclear 9.39% Other 0.01% Petroleum 0.02% Solar 0.03% Waste 0.04% Wind 1.01%
Total 100.00%
228

Calculations are based on power purchases for 2012 reported by the Utility to the Washington State Department of Commerce in 2013.
PUD No 3 of Mason County
Fuel Mix Calculations Calendar Year 2012
MWh MWh from from Total Fuel Market Purchases* Claims on Resources* Percent Biomass 186.978 402.730 589.707 0.08% Coal 11,000.749 0.000 11,000.749 1.57% Cogeneration 0.000 0.000 0.000 0.00% Geothermal 0.000 0.000 0.000 0.00% Hydro 14,662.583 595,948.597 610,611.180 87.21% Landfill Gases 47.159 0.000 47.159 0.01% Natural Gas 3,828.769 574.290 4,403.058 0.63% Nuclear 807.084 64,918.648 65,725.732 9.39% Other 48.414 0.000 48.414 0.01% Petroleum 107.887 53.626 161.513 0.02% Solar 0.000 198.000 198.000 0.03% Waste 192.051 57.436 249.487 0.04% Wind 0.000 7,106.000 7,106.000 1.01% Total 30,881.673 669,259.327 700,141.000 100.00%
* Market Purchases include those made directly by utilities, as well as the fraction of delivered BPA power that can be attributed to BPA’s purchases of market power. Claims on Resources include those made directly by utilities, as well as the fractions of delivered BPA power that can be attributed to specific plants.
229

Calculations are based on power purchases for 2012 reported by the Utility to the Washington State Department of Commerce in 2013.
PUD No 3 of Mason County
Claims on Plants Calendar Year 2012 Packwood Claim Type: PlntMix 5,761.000
Water 5,761.000
Nine Canyon Claim Type: PlntMix 7,106.000
Wind 7,106.000
Johns Prairie Solar Claim Type: PlntMix 198.000
Solar--Photovoltaic 198.000
230

Calculations are based on power purchases for 2012 reported by the Utility to the Washington State Department of Commerce in 2013.
PUD No 3 of Mason County
Claims on BPA* Calendar Year 2012 BPA Resource Mix 656,194.327
Biomass 402.730
Natural Gas 574.290
Nuclear 64,918.648
Petroleum (heavy oil) 53.626
Waste 57.436
Water 590,187.597
*The BPA Resource Mix includes only the fraction of delivered BPA power that can be attributed to specific plants. The fraction of BPA power that BPA purchased on the market is included in the “Market Purchases” table.
231

Calculations are based on power purchases for 2012 reported by the Utility to the Washington State Department of Commerce in 2013.
PUD No 3 of Mason County
Market Purchases Calendar Year 2012
Total Market Purchases 30,881.673
BPA Market Purchase* 30,881.673
* “BPA Market Purchases” are the fraction of delivered BPA power that BPA purchased on the market.
**The BPA Slice product includes a small amount of wind power that is not bundled with the Renewable Energy Credits (REC) associated with that power. Such power is assigned the net system fuel mix – as though it were a market purchase.
232

Calculations are based on power purchases for 2012 reported by the Utility to the Washington State Department of Commerce in 2013.
Puget Sound Energy, Inc
Fuel Mix Calendar Year 2012
Biomass 0.23% Coal 29.76% Cogeneration 2.11% Geothermal 0.00% Hydro 42.16% Landfill Gases 0.06% Natural Gas 15.55% Nuclear 1.28% Other 0.06% Petroleum 0.18% Solar 0.00% Waste 0.24% Wind 8.36%
Total 100.00%
233

Calculations are based on power purchases for 2012 reported by the Utility to the Washington State Department of Commerce in 2013.
Puget Sound Energy, Inc
Fuel Mix Calculations Calendar Year 2012
MWh MWh from from Total Fuel Market Purchases* Claims on Resources* Percent Biomass 49,410.893 1,252.384 50,663.277 0.23% Coal 2,907,066.800 3,752,382.317 6,659,449.117 29.76% Cogeneration 0.000 472,401.567 472,401.567 2.11% Geothermal 0.000 0.000 0.000 0.00% Hydro 3,874,745.957 5,559,402.177 9,434,148.133 42.16% Landfill Gases 12,462.347 0.000 12,462.347 0.06% Natural Gas 1,011,793.477 2,467,072.661 3,478,866.138 15.55% Nuclear 213,280.749 73,695.774 286,976.524 1.28% Other 12,793.838 0.000 12,793.838 0.06% Petroleum 28,510.406 12,576.345 41,086.751 0.18% Solar 0.000 879.015 879.015 0.00% Waste 50,751.468 3,579.840 54,331.308 0.24% Wind 0.000 1,870,768.985 1,870,768.985 8.36% Total 8,160,815.935 14,214,011.065 22,374,827.000 100.00%
* Market Purchases include those made directly by utilities, as well as the fraction of delivered BPA power that can be attributed to BPA’s purchases of market power. Claims on Resources include those made directly by utilities, as well as the fractions of delivered BPA power that can be attributed to specific plants.
234

Calculations are based on power purchases for 2012 reported by the Utility to the Washington State Department of Commerce in 2013.
Puget Sound Energy, Inc
Claims on Plants Calendar Year 2012 Crystal Mountain Claim Type: PlntMix 294.000
Petroleum(light oil) 294.000
Electron Claim Type: PlntMix 48,886.000
Water 48,886.000
Lower Baker Claim Type: PlntMix 344,360.000
Water 344,360.000
Upper Baker Claim Type: PlntMix 344,804.000
Water 344,804.000
Rocky Reach Claim Type: PlntMix 1,779,973.000
Water 1,779,973.000
Wells Claim Type: PlntMix 966,126.000
Water 966,126.000
Priest Rapids Claim Type: PlntMix 38,092.000
Water 38,092.000
Wanapum Claim Type: PlntMix 39,869.000
Water 39,869.000
235

Calculations are based on power purchases for 2012 reported by the Utility to the Washington State Department of Commerce in 2013.
Puget Sound Energy, Inc Port Townsend Paper Corp Claim Type: PlntMix 1,454.000
Petroleum (heavy oil) 309.079
Waste 766.638
Water 76.078
Wood 302.204
Twin Falls Hydro Claim Type: PlntMix 94,479.000
Water 94,479.000
Koma Kulshan Associates Claim Type: PlntMix 41,921.000
Water 41,921.000
March Point Cogeneration Co Claim Type: Cogen 363,996.000
Natural Gas 363,996.000
Weeks Falls Claim Type: PlntMix 16,873.000
Water 16,873.000
Sumas Cogeneration Co LP Claim Type: PlntMix 220,603.000
Natural Gas 220,603.000
Ferndale Cogeneration Claim Type: Cogen 1,584.000
Natural Gas 1,584.000
Hutchinson Creek Claim Type: PlntMix 1,227.000
Water 1,227.000
Black Creek Claim Type: PlntMix 11,320.000
Water 11,320.000
236

Calculations are based on power purchases for 2012 reported by the Utility to the Washington State Department of Commerce in 2013.
Puget Sound Energy, Inc Goldendale Generating Claim Type: PlntMix 896,704.000
Natural Gas 896,704.000
Mint Farm Generation LLC Claim Type: PlntMix 1,082,623.000
Natural Gas 1,082,623.000
Frederickson Power LP Claim Type: PlntMix 172,713.000
Natural Gas 172,713.000
Hopkins Ridge Wind Claim Type: PlntMix 424,582.000
Wind 424,582.000
Wild Horse Wind Claim Type: PlntMix 618,956.000
Solar--Photovoltaic 724.015
Wind 618,231.985
Klondike Windpower III Claim Type: PlntMix 123,039.000
Wind 123,039.000
Lower Snake River Wind Claim Type: PlntMix 704,729.000
Wind 704,729.000
Klamath Falls Bioenergy Facility Claim Type: PlntMix 493.000
Wood 493.000
Fredonia Claim Type: PlntMix 41,954.000
Petroleum (light oil) 3,415.929
Natural Gas 38,538.071
237

Calculations are based on power purchases for 2012 reported by the Utility to the Washington State Department of Commerce in 2013.
Puget Sound Energy, Inc Colstrip Claim Type: PlntMix 3,755,938.000 Coal (bituminous) 3,752,382.317 Petroleum (light oil) 1,650.026 Petroleum (heavy oil) 1,905.657
Whitehorn Claim Type: PlntMix 28,866.000 Petroleum (light oil) 4,130.255 Natural Gas 24,735.745 Rock Island Claim Type: PlntMix 1,115,695.000 Water 1,115,695.000 Skookumchuck Claim Type: PlntMix 6,332.000 Water 6,332.000 The Dalles Fishway Claim Type: PlntMix 37,689.000 Water 37,689.000 Smith Creek Claim Type: PlntMix 212.000 Water 212.000 Encogen Claim Type: Cogen 106,931.000 Petroleum (light oil) 109.433 Natural Gas 106,821.567 Frederickson Claim Type: PlntMix 31,205.000 Petroleum (light oil) 701.090 Natural Gas 30,503.910 Sygitowicz Creek Claim Type: PlntMix 1,457.000 Water 1,457.000 Island Community Solar Claim Type: PlntMix 57.000 Solar--Photovoltaic 57.000 3 Bar G Wind Turbine #3 Claim Type: PlntMix 187.000 Wind 187.000
238

Calculations are based on power purchases for 2012 reported by the Utility to the Washington State Department of Commerce in 2013.
Puget Sound Energy, Inc Smith Creek (Whatcom Claim Type: PlntMix 29.000 Water 29.000 Bio Energy Washington Claim Type: PlntMix 2,748.000 Waste 2,748.000 Cascade Community Solar Claim Type: PlntMix 3.000 Solar--Photovoltaic 3.000 Lake Washington -- Finn Hill Claim Type: PlntMix 95.000 Solar--Photovoltaic 95.000
239

Calculations are based on power purchases for 2012 reported by the Utility to the Washington State Department of Commerce in 2013.
Puget Sound Energy, Inc
Claims on BPA* Calendar Year 2012 BPA Resource Mix 744,913.065
Biomass 457.179
Natural Gas 651.935
Nuclear 73,695.774
Petroleum (heavy oil) 60.876
Waste 65.202
Water 669,982.099
*The BPA Resource Mix includes only the fraction of delivered BPA power that can be attributed to specific plants. The fraction of BPA power that BPA purchased on the market is included in the 'Market Purchases' table.
240

Calculations are based on power purchases for 2012 reported by the Utility to the Washington State Department of Commerce in 2013.
Puget Sound Energy, Inc
Market Purchases Calendar Year 2012
Total Market Purchases 8,160,815.935
BPA Market Purchase* 35,056.935
Utility Market Purchase 8,125,759.000
* “BPA Market Purchases” are the fraction of delivered BPA power that BPA purchased on the market.
**The BPA Slice product includes a small amount of wind power that is not bundled with the Renewable Energy Credits (REC) associated with that power. Such power is assigned the net system fuel mix – as though it were a market purchase.
241

Calculations are based on power purchases for 2012 reported by the Utility to the Washington State Department of Commerce in 2013.
Ruston Electric Utility
Fuel Mix Calendar Year 2012
Biomass 0.08% Coal 2.36% Cogeneration 0.00% Geothermal 0.00% Hydro 89.92% Landfill Gases 0.01% Natural Gas 0.88% Nuclear 6.67% Other 0.01% Petroleum 0.03% Solar 0.00% Waste 0.05% Wind 0.00%
Total 100.00%
242

Calculations are based on power purchases for 2012 reported by the Utility to the Washington State Department of Commerce in 2013.
Ruston Electric Utility
Fuel Mix Calculations Calendar Year 2012
MWh MWh from from Total Fuel Market Purchases* Claims on Resources* Percent Biomass 2.494 2.505 4.999 0.08% Coal 146.711 0.000 146.711 2.36% Cogeneration 0.000 0.000 0.000 0.00% Geothermal 0.000 0.000 0.000 0.00% Hydro 195.547 5,393.876 5,589.423 89.92% Landfill Gases 0.629 0.000 0.629 0.01% Natural Gas 51.062 3.572 54.634 0.88% Nuclear 10.764 403.803 414.567 6.67% Other 0.646 0.000 0.646 0.01% Petroleum 1.439 0.334 1.772 0.03% Solar 0.000 0.000 0.000 0.00% Waste 2.561 0.357 2.919 0.05% Wind 0.000 0.000 0.000 0.00% Total 411.852 5,804.448 6,216.300 100.00%
* Market Purchases include those made directly by utilities, as well as the fraction of delivered BPA power that can be attributed to BPA’s purchases of market power. Claims on Resources include those made directly by utilities, as well as the fractions of delivered BPA power that can be attributed to specific plants.
243
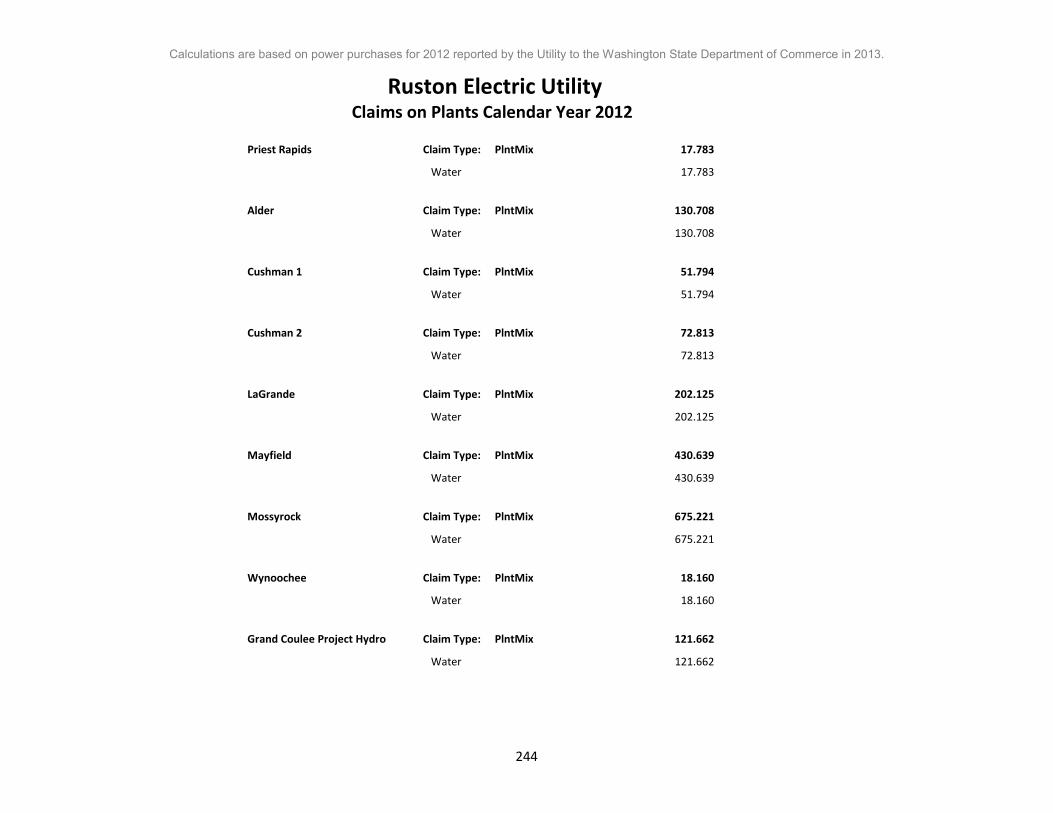
Calculations are based on power purchases for 2012 reported by the Utility to the Washington State Department of Commerce in 2013.
Ruston Electric Utility Claims on Plants Calendar Year 2012 Priest Rapids Claim Type: PlntMix 17.783
Water 17.783
Alder Claim Type: PlntMix 130.708
Water 130.708
Cushman 1 Claim Type: PlntMix 51.794
Water 51.794
Cushman 2 Claim Type: PlntMix 72.813
Water 72.813
LaGrande Claim Type: PlntMix 202.125
Water 202.125
Mayfield Claim Type: PlntMix 430.639
Water 430.639
Mossyrock Claim Type: PlntMix 675.221
Water 675.221
Wynoochee Claim Type: PlntMix 18.160
Water 18.160
Grand Coulee Project Hydro Claim Type: PlntMix 121.662
Water 121.662
244

Calculations are based on power purchases for 2012 reported by the Utility to the Washington State Department of Commerce in 2013.
Ruston Electric Utility Hood Street Reservoir Claim Type: PlntMix 1.919
Water 1.919
245

Calculations are based on power purchases for 2012 reported by the Utility to the Washington State Department of Commerce in 2013.
Ruston Electric Utility
Claims on BPA* Calendar Year 2012 BPA Resource Mix 1,865.330
Biomass 1.145
Natural Gas 1.633
Nuclear 184.541
Petroleum (heavy oil) 0.152
Waste 0.163
Water 1,677.696
BPA Slice 2,216.293
Biomass 1.360
Natural Gas 1.940
Nuclear 219.262
Petroleum (heavy oil) 0.181
Waste 0.194
Water 1,993.356
*The BPA Resource Mix includes only the fraction of delivered BPA power that can be attributed to specific plants. The fraction of BPA power that BPA purchased on the market is included in the “Market Purchases” table.
246

Calculations are based on power purchases for 2012 reported by the Utility to the Washington State Department of Commerce in 2013.
Ruston Electric Utility
Market Purchases Calendar Year 2012
Total Market Purchases 411.852
BPA Market Purchase* 87.786
BPA Slice Wind w/o RECs** 104.303
Utility Market Purchase 219.764
* “BPA Market Purchases” are the fraction of delivered BPA power that BPA purchased on the market.
**The BPA Slice product includes a small amount of wind power that is not bundled with the Renewable Energy Credits (REC) associated with that power. Such power is assigned the net system fuel mix – as though it were a market purchase.
247

Calculations are based on power purchases for 2012 reported by the Utility to the Washington State Department of Commerce in 2013.
Seattle City Light
Fuel Mix Calendar Year 2012
Biomass 0.32% Coal 0.76% Cogeneration 0.00% Geothermal 0.00% Hydro 89.84% Landfill Gases 0.50% Natural Gas 0.30% Nuclear 4.39% Other 0.00% Petroleum 0.01% Solar 0.00% Waste 0.02% Wind 3.86%
Total 100.00%
248

Calculations are based on power purchases for 2012 reported by the Utility to the Washington State Department of Commerce in 2013.
Seattle City Light
Fuel Mix Calculations Calendar Year 2012
MWh MWh from from Total Fuel Market Purchases* Claims on Resources* Percent Biomass 1,303.992 30,688.228 31,992.220 0.32% Coal 76,719.743 0.000 76,719.743 0.76% Cogeneration 0.000 0.000 0.000 0.00% Geothermal 0.000 0.000 0.000 0.00% Hydro 102,257.545 8,927,112.683 9,029,370.228 89.84% Landfill Gases 328.891 49,779.000 50,107.891 0.50% Natural Gas 26,702.013 3,849.080 30,551.093 0.30% Nuclear 5,628.644 435,106.383 440,735.027 4.39% Other 337.639 134.000 471.639 0.00% Petroleum 752.412 359.419 1,111.831 0.01% Solar 0.000 0.000 0.000 0.00% Waste 1,339.371 384.957 1,724.327 0.02% Wind 0.000 388,168.000 388,168.000 3.86% Total 215,370.249 9,835,581.751 10,050,952.000 100.00%
* Market Purchases include those made directly by utilities, as well as the fraction of delivered BPA power that can be attributed to BPA’s purchases of market power. Claims on Resources include those made directly by utilities, as well as the fractions of delivered BPA power that can be attributed to specific plants.
249
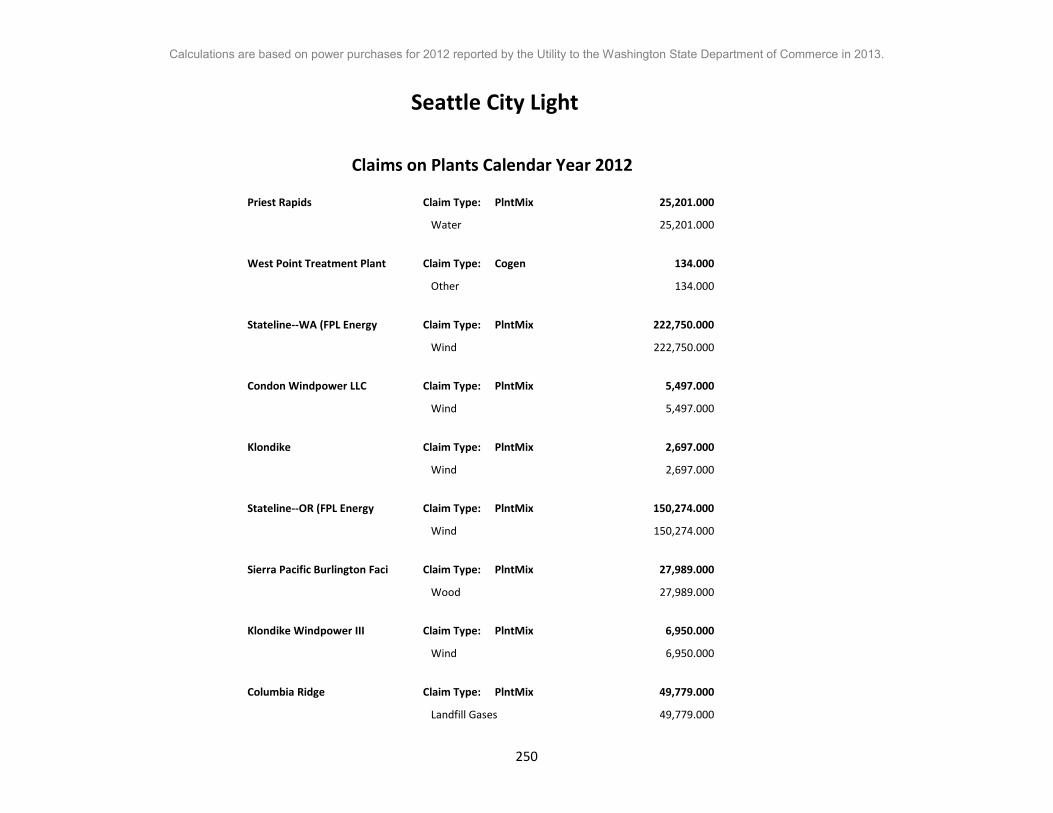
Calculations are based on power purchases for 2012 reported by the Utility to the Washington State Department of Commerce in 2013.
Seattle City Light
Claims on Plants Calendar Year 2012 Priest Rapids Claim Type: PlntMix 25,201.000
Water 25,201.000
West Point Treatment Plant Claim Type: Cogen 134.000
Other 134.000
Stateline--WA (FPL Energy Claim Type: PlntMix 222,750.000
Wind 222,750.000
Condon Windpower LLC Claim Type: PlntMix 5,497.000
Wind 5,497.000
Klondike Claim Type: PlntMix 2,697.000
Wind 2,697.000
Stateline--OR (FPL Energy Claim Type: PlntMix 150,274.000
Wind 150,274.000
Sierra Pacific Burlington Faci Claim Type: PlntMix 27,989.000
Wood 27,989.000
Klondike Windpower III Claim Type: PlntMix 6,950.000
Wind 6,950.000
Columbia Ridge Claim Type: PlntMix 49,779.000
Landfill Gases 49,779.000
250

Calculations are based on power purchases for 2012 reported by the Utility to the Washington State Department of Commerce in 2013.
Seattle City Light Ross Claim Type: PlntMix 649,617.000
Water 649,617.000
South Fork Tolt Claim Type: PlntMix 43,631.000
Water 43,631.000
Cedar Falls Claim Type: PlntMix 84,586.000
Water 84,586.000
Gorge Claim Type: PlntMix 748,112.000
Water 748,112.000
Diablo Claim Type: PlntMix 648,105.000
Water 648,105.000
Boundary Claim Type: PlntMix 2,373,261.000
Water 2,373,261.000
Grand Coulee Project Hydro Claim Type: PlntMix 177,031.000
Water 177,031.000
High Ross Treaty Claim Type: PlntMix 221,935.000
Water 221,935.000
251

Calculations are based on power purchases for 2012 reported by the Utility to the Washington State Department of Commerce in 2013.
Seattle City Light
Claims on BPA* Calendar Year 2012 BPA Resource Mix 2,238,568.960
Biomass 1,373.889
Natural Gas 1,959.156
Nuclear 221,466.210
Petroleum (heavy oil) 182.942
Waste 195.940
Water 2,013,390.824
BPA Slice 2,159,463.791
Biomass 1,325.339
Natural Gas 1,889.924
Nuclear 213,640.173
Petroleum (heavy oil) 176.477
Waste 189.016
Water 1,942,242.860
*Includes that part of claims on BPA electricity products that correspond to the percentage of BPA's power that comes from specific generating facilities. That part of claims on BPA electricity products that correspond to the percentage of BPA's power that comes from market purchases is included in the 'Market Purchases' table.
252

Calculations are based on power purchases for 2012 reported by the Utility to the Washington State Department of Commerce in 2013.
Seattle City Light
Market Purchases Calendar Year 2012
Total Market Purchases 215,370.249
BPA Market Purchase* 105,351.040
BPA Slice Wind w/o RECs** 101,628.209
Utility Market Purchase 8,391.000
* “BPA Market Purchases” are the fraction of delivered BPA power that BPA purchased on the market.
**The BPA Slice product includes a small amount of wind power that is not bundled with the Renewable Energy Credits (REC) associated with that power. Such power is assigned the net system fuel mix – as though it were a market purchase.
253

Calculations are based on power purchases for 2012 reported by the Utility to the Washington State Department of Commerce in 2013.
Tacoma Power
Fuel Mix Calendar Year 2012
Biomass 0.08% Coal 2.36% Cogeneration 0.00% Geothermal 0.00% Hydro 89.92% Landfill Gases 0.01% Natural Gas 0.88% Nuclear 6.67% Other 0.01% Petroleum 0.03% Solar 0.00% Waste 0.05% Wind 0.00%
Total 100.00%
254
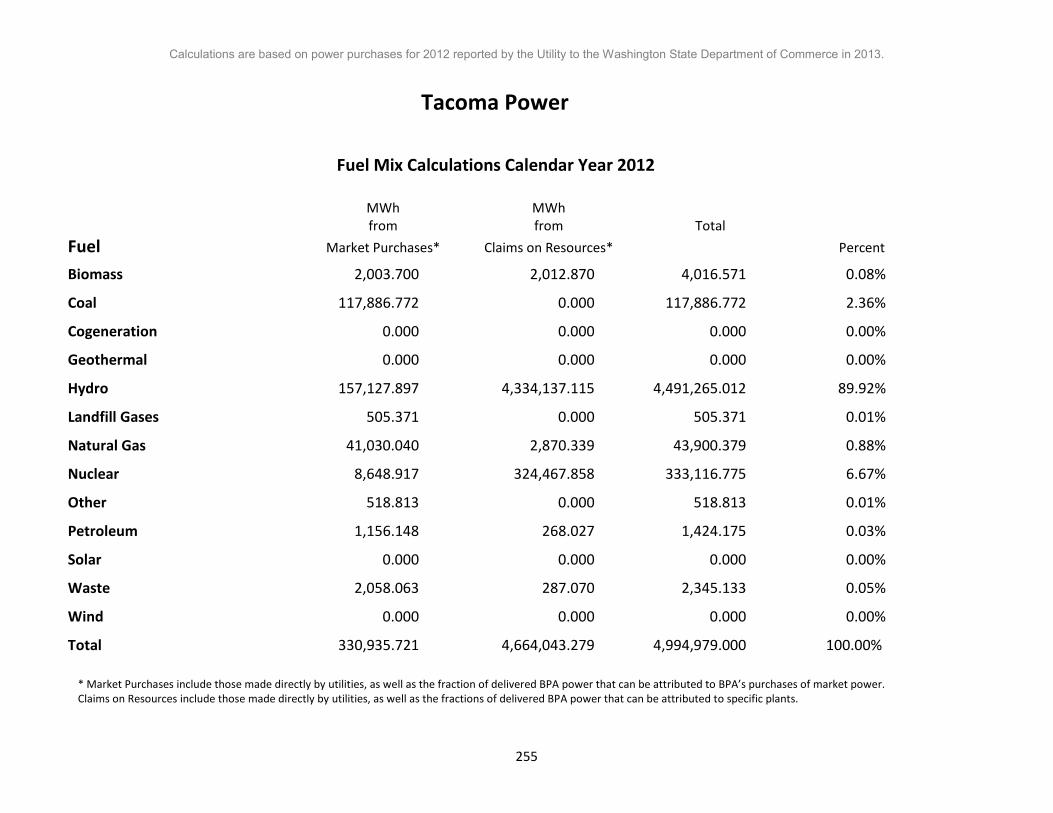
Calculations are based on power purchases for 2012 reported by the Utility to the Washington State Department of Commerce in 2013.
Tacoma Power
Fuel Mix Calculations Calendar Year 2012
MWh MWh from from Total Fuel Market Purchases* Claims on Resources* Percent Biomass 2,003.700 2,012.870 4,016.571 0.08% Coal 117,886.772 0.000 117,886.772 2.36% Cogeneration 0.000 0.000 0.000 0.00% Geothermal 0.000 0.000 0.000 0.00% Hydro 157,127.897 4,334,137.115 4,491,265.012 89.92% Landfill Gases 505.371 0.000 505.371 0.01% Natural Gas 41,030.040 2,870.339 43,900.379 0.88% Nuclear 8,648.917 324,467.858 333,116.775 6.67% Other 518.813 0.000 518.813 0.01% Petroleum 1,156.148 268.027 1,424.175 0.03% Solar 0.000 0.000 0.000 0.00% Waste 2,058.063 287.070 2,345.133 0.05% Wind 0.000 0.000 0.000 0.00% Total 330,935.721 4,664,043.279 4,994,979.000 100.00%
* Market Purchases include those made directly by utilities, as well as the fraction of delivered BPA power that can be attributed to BPA’s purchases of market power. Claims on Resources include those made directly by utilities, as well as the fractions of delivered BPA power that can be attributed to specific plants.
255

Calculations are based on power purchases for 2012 reported by the Utility to the Washington State Department of Commerce in 2013.
Tacoma Power
Claims On Plants Calendar Year 2012 Priest Rapids Claim Type: PlntMix 14,289.000
Water 14,289.000
Alder Claim Type: PlntMix 105,028.000
Water 105,028.000
Cushman 1 Claim Type: PlntMix 41,618.000
Water 41,618.000
Cushman 2 Claim Type: PlntMix 58,507.000
Water 58,507.000
LaGrande Claim Type: PlntMix 162,413.000
Water 162,413.000
Mayfield Claim Type: PlntMix 346,031.000
Water 346,031.000
Mossyrock Claim Type: PlntMix 542,560.000
Water 542,560.000
Wynoochee Claim Type: PlntMix 14,592.000
Water 14,592.000
Grand Coulee Project Hydro Claim Type: PlntMix 97,759.000
Water 97,759.000
256

Calculations are based on power purchases for 2012 reported by the Utility to the Washington State Department of Commerce in 2013.
Tacoma Power Hood Street Reservoir Claim Type: PlntMix 1,542.000
Water 1,542.000
257

Calculations are based on power purchases for 2012 reported by the Utility to the Washington State Department of Commerce in 2013.
Tacoma Power
Claims on BPA* Calendar Year 2012 BPA Resource Mix 1,498,847.566
Biomass 919.896
Natural Gas 1,311.765
Nuclear 148,284.058
Petroleum (heavy oil) 122.490
Waste 131.193
Water 1,348,078.164
BPA Slice 1,780,856.713
Biomass 1,092.975
Natural Gas 1,558.574
Nuclear 176,183.800
Petroleum (heavy oil) 145.537
Waste 155.877
Water 1,601,719.951
*The BPA Resource Mix includes only the fraction of delivered BPA power that can be attributed to specific plants. The fraction of BPA power that BPA purchased on the market is included in the “Market Purchases” table.
258

Calculations are based on power purchases for 2012 reported by the Utility to the Washington State Department of Commerce in 2013.
Tacoma Power
Market Purchases Calendar Year 2012
Total Market Purchases 330,935.721
BPA Market Purchase* 70,538.434
BPA Slice Wind w/o RECs** 83,810.287
Utility Market Purchase 176,587.000
* “BPA Market Purchases” are the fraction of delivered BPA power that BPA purchased on the market.
**The BPA Slice product includes a small amount of wind power that is not bundled with the Renewable Energy Credits (REC) associated with that power. Such power is assigned the net system fuel mix – as though it were a market purchase.
259

Calculations are based on power purchases for 2012 reported by the Utility to the Washington State Department of Commerce in 2013.
Tanner Electric Cooperative
Fuel Mix Calendar Year 2012
Biomass 0.09% Coal 1.60% Cogeneration 0.00% Geothermal 0.00% Hydro 88.03% Landfill Gases 0.01% Natural Gas 0.64% Nuclear 9.57% Other 0.01% Petroleum 0.02% Solar 0.00% Waste 0.04% Wind 0.00%
Total 100.00%
260

Calculations are based on power purchases for 2012 reported by the Utility to the Washington State Department of Commerce in 2013.
Tanner Electric Cooperative
Fuel Mix Calculations Calendar Year 2012
MWh MWh from from Total Fuel Market Purchases* Claims on Resources* Percent Biomass 26.016 56.036 82.052 0.09% Coal 1,530.648 0.000 1,530.648 1.60% Cogeneration 0.000 0.000 0.000 0.00% Geothermal 0.000 0.000 0.000 0.00% Hydro 2,040.157 82,118.913 84,159.070 88.03% Landfill Gases 6.562 0.000 6.562 0.01% Natural Gas 532.736 79.907 612.643 0.64% Nuclear 112.298 9,032.804 9,145.102 9.57% Other 6.736 0.000 6.736 0.01% Petroleum 15.011 7.462 22.473 0.02% Solar 0.000 0.000 0.000 0.00% Waste 26.722 7.992 34.714 0.04% Wind 0.000 0.000 0.000 0.00% Total 4,296.887 91,303.113 95,600.000 100.00%
* Market Purchases include those made directly by utilities, as well as the fraction of delivered BPA power that can be attributed to BPA’s purchases of market power. Claims on Resources include those made directly by utilities, as well as the fractions of delivered BPA power that can be attributed to specific plants.
261
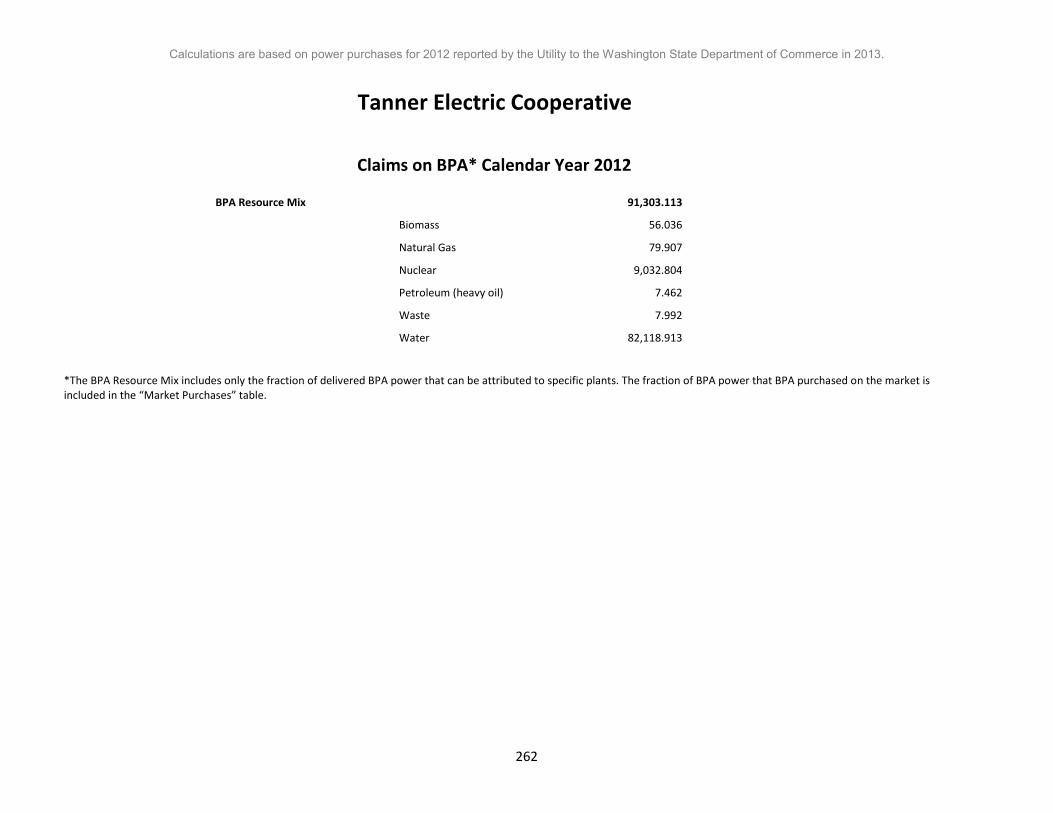
Calculations are based on power purchases for 2012 reported by the Utility to the Washington State Department of Commerce in 2013.
Tanner Electric Cooperative
Claims on BPA* Calendar Year 2012 BPA Resource Mix 91,303.113
Biomass 56.036
Natural Gas 79.907
Nuclear 9,032.804
Petroleum (heavy oil) 7.462
Waste 7.992
Water 82,118.913
*The BPA Resource Mix includes only the fraction of delivered BPA power that can be attributed to specific plants. The fraction of BPA power that BPA purchased on the market is included in the “Market Purchases” table.
262

Calculations are based on power purchases for 2012 reported by the Utility to the Washington State Department of Commerce in 2013.
Tanner Electric Cooperative
Market Purchases Calendar Year 2012
Total Market Purchases 4,296.887
BPA Market Purchase* 4,296.887
* “BPA Market Purchases” are the fraction of delivered BPA power that BPA purchased on the market.
**The BPA Slice product includes a small amount of wind power that is not bundled with the Renewable Energy Credits (REC) associated with that power. Such power is assigned the net system fuel mix – as though it were a market purchase.
263

Calculations are based on power purchases for 2012 reported by the Utility to the Washington State Department of Commerce in 2013.
Town of Eatonville
Fuel Mix Calendar Year 2012
Biomass 0.09% Coal 1.60% Cogeneration 0.00% Geothermal 0.00% Hydro 88.03% Landfill Gases 0.01% Natural Gas 0.64% Nuclear 9.57% Other 0.01% Petroleum 0.02% Solar 0.00% Waste 0.04% Wind 0.00%
Total 100.00%
264
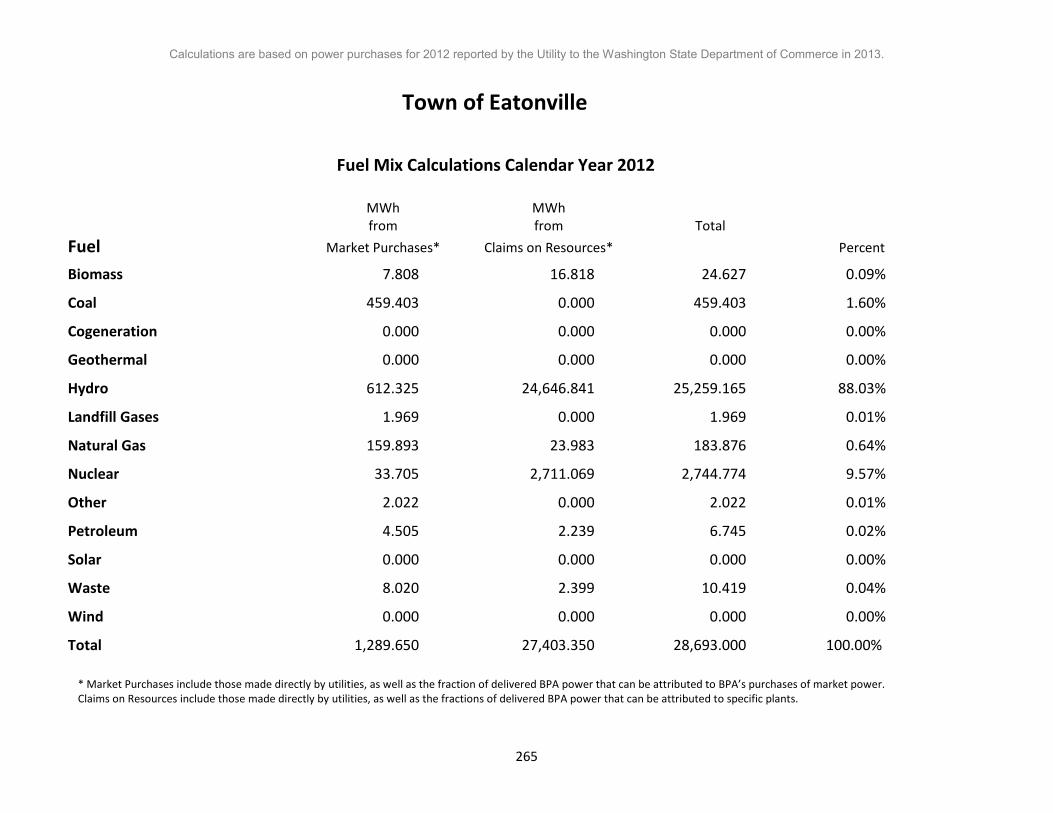
Calculations are based on power purchases for 2012 reported by the Utility to the Washington State Department of Commerce in 2013.
Town of Eatonville
Fuel Mix Calculations Calendar Year 2012
MWh MWh from from Total Fuel Market Purchases* Claims on Resources* Percent Biomass 7.808 16.818 24.627 0.09% Coal 459.403 0.000 459.403 1.60% Cogeneration 0.000 0.000 0.000 0.00% Geothermal 0.000 0.000 0.000 0.00% Hydro 612.325 24,646.841 25,259.165 88.03% Landfill Gases 1.969 0.000 1.969 0.01% Natural Gas 159.893 23.983 183.876 0.64% Nuclear 33.705 2,711.069 2,744.774 9.57% Other 2.022 0.000 2.022 0.01% Petroleum 4.505 2.239 6.745 0.02% Solar 0.000 0.000 0.000 0.00% Waste 8.020 2.399 10.419 0.04% Wind 0.000 0.000 0.000 0.00% Total 1,289.650 27,403.350 28,693.000 100.00%
* Market Purchases include those made directly by utilities, as well as the fraction of delivered BPA power that can be attributed to BPA’s purchases of market power. Claims on Resources include those made directly by utilities, as well as the fractions of delivered BPA power that can be attributed to specific plants.
265
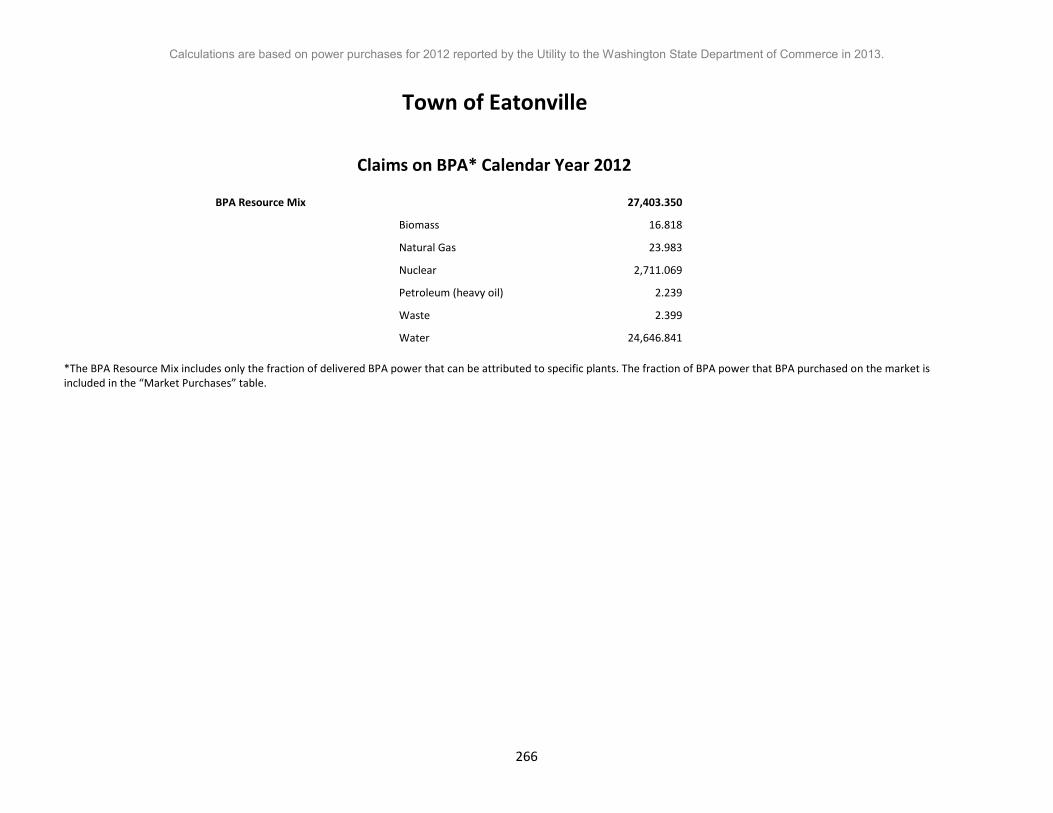
Calculations are based on power purchases for 2012 reported by the Utility to the Washington State Department of Commerce in 2013.
Town of Eatonville
Claims on BPA* Calendar Year 2012 BPA Resource Mix 27,403.350
Biomass 16.818
Natural Gas 23.983
Nuclear 2,711.069
Petroleum (heavy oil) 2.239
Waste 2.399
Water 24,646.841
*The BPA Resource Mix includes only the fraction of delivered BPA power that can be attributed to specific plants. The fraction of BPA power that BPA purchased on the market is included in the “Market Purchases” table.
266

Calculations are based on power purchases for 2012 reported by the Utility to the Washington State Department of Commerce in 2013.
Town of Eatonville
Market Purchases Calendar Year 2012
Total Market Purchases 1,289.650
BPA Market Purchase* 1,289.650
* “BPA Market Purchases” are the fraction of delivered BPA power that BPA purchased on the market.
**The BPA Slice product includes a small amount of wind power that is not bundled with the Renewable Energy Credits (REC) associated with that power. Such power is assigned the net system fuel mix – as though it were a market purchase.
.
267

Calculations are based on power purchases for 2012 reported by the Utility to the Washington State Department of Commerce in 2013.
Town of Steilacoom
Fuel Mix Calendar Year 2012
Biomass 0.09% Coal 1.60% Cogeneration 0.00% Geothermal 0.00% Hydro 88.03% Landfill Gases 0.01% Natural Gas 0.64% Nuclear 9.57% Other 0.01% Petroleum 0.02% Solar 0.00% Waste 0.04% Wind 0.00%
Total 100.00%
268

Calculations are based on power purchases for 2012 reported by the Utility to the Washington State Department of Commerce in 2013.
Town of Steilacoom
Fuel Mix Calculations Calendar Year 2012
MWh MWh from from Total Fuel Market Purchases* Claims on Resources* Percent Biomass 11.251 24.233 35.484 0.09% Coal 661.941 0.000 661.941 1.60% Cogeneration 0.000 0.000 0.000 0.00% Geothermal 0.000 0.000 0.000 0.00% Hydro 882.283 35,512.994 36,395.276 88.03% Landfill Gases 2.838 0.000 2.838 0.01% Natural Gas 230.386 34.556 264.943 0.64% Nuclear 48.564 3,906.310 3,954.874 9.57% Other 2.913 0.000 2.913 0.01% Petroleum 6.492 3.227 9.719 0.02% Solar 0.000 0.000 0.000 0.00% Waste 11.556 3.456 15.012 0.04% Wind 0.000 0.000 0.000 0.00% Total 1,858.224 39,484.776 41,343.000 100.00%
* Market Purchases include those made directly by utilities, as well as the fraction of delivered BPA power that can be attributed to BPA’s purchases of market power. Claims on Resources include those made directly by utilities, as well as the fractions of delivered BPA power that can be attributed to specific plants.
269

Calculations are based on power purchases for 2012 reported by the Utility to the Washington State Department of Commerce in 2013.
Town of Steilacoom
Claims on BPA* Calendar Year 2012 BPA Resource Mix 39,484.776
Biomass 24.233
Natural Gas 34.556
Nuclear 3,906.310
Petroleum (heavy oil) 3.227
Waste 3.456
Water 35,512.994
*The BPA Resource Mix includes only the fraction of delivered BPA power that can be attributed to specific plants. The fraction of BPA power that BPA purchased on the market is included in the “Market Purchases” table.
270
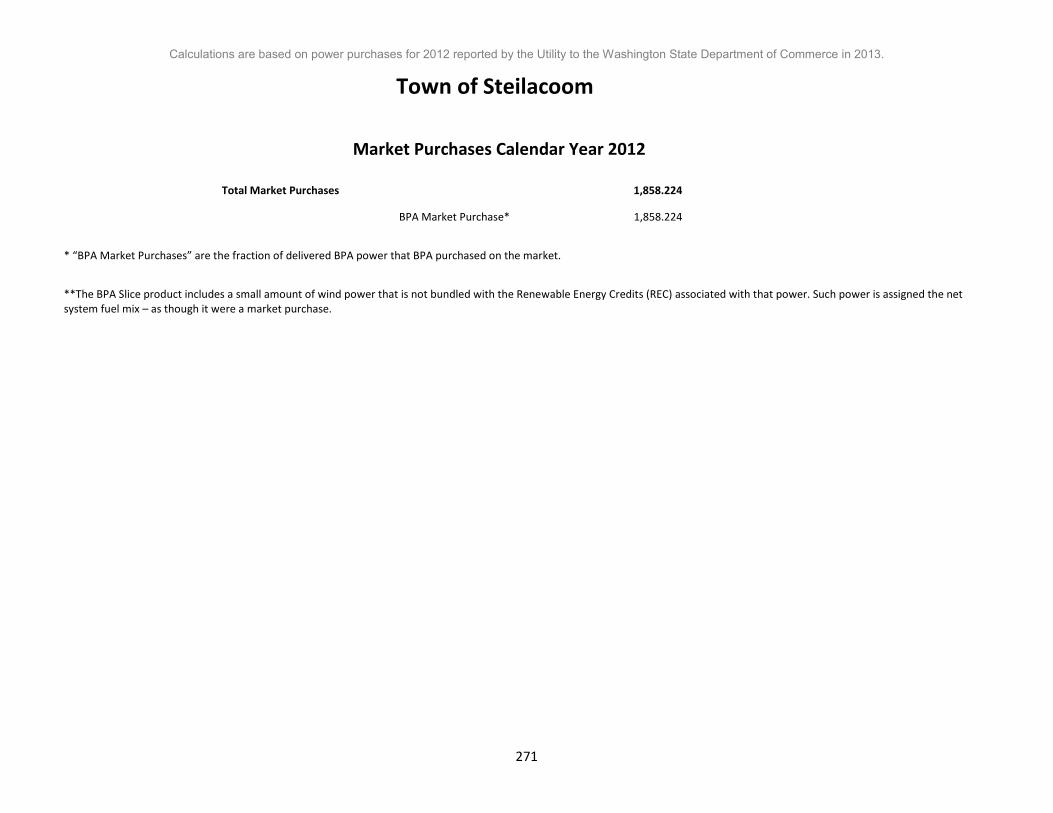
Calculations are based on power purchases for 2012 reported by the Utility to the Washington State Department of Commerce in 2013.
Town of Steilacoom
Market Purchases Calendar Year 2012
Total Market Purchases 1,858.224
BPA Market Purchase* 1,858.224
* “BPA Market Purchases” are the fraction of delivered BPA power that BPA purchased on the market.
**The BPA Slice product includes a small amount of wind power that is not bundled with the Renewable Energy Credits (REC) associated with that power. Such power is assigned the net system fuel mix – as though it were a market purchase.
271
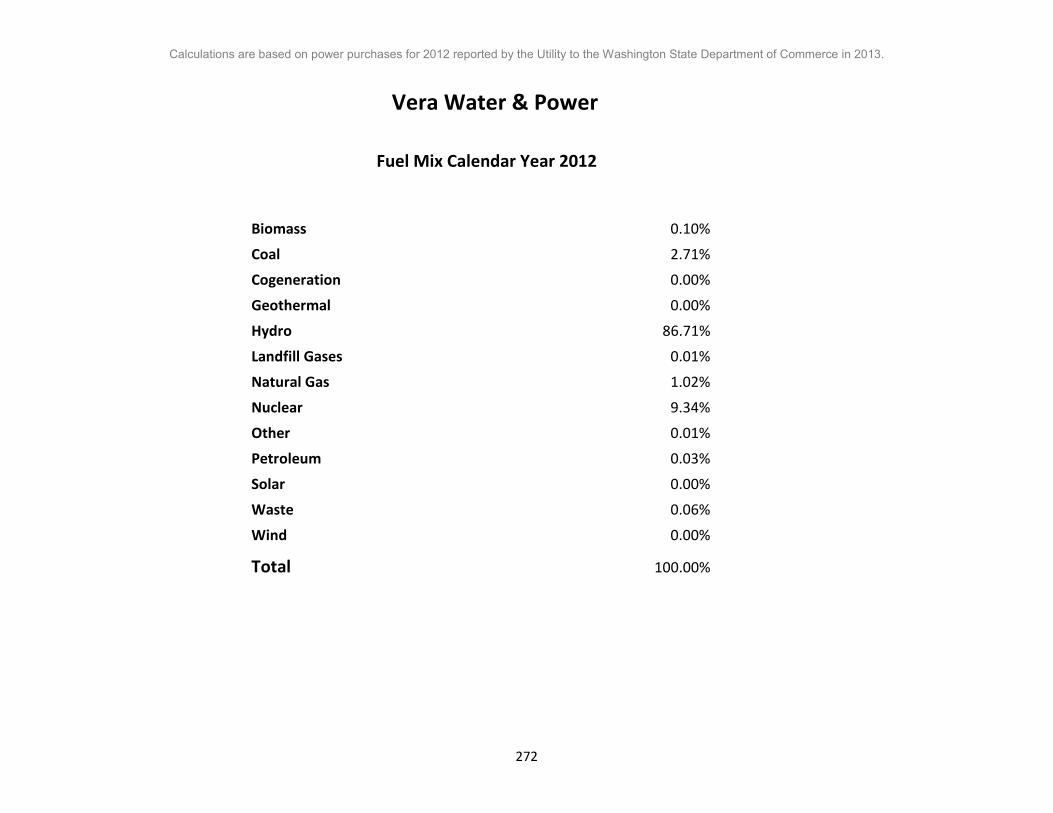
Calculations are based on power purchases for 2012 reported by the Utility to the Washington State Department of Commerce in 2013.
Vera Water & Power
Fuel Mix Calendar Year 2012
Biomass 0.10% Coal 2.71% Cogeneration 0.00% Geothermal 0.00% Hydro 86.71% Landfill Gases 0.01% Natural Gas 1.02% Nuclear 9.34% Other 0.01% Petroleum 0.03% Solar 0.00% Waste 0.06% Wind 0.00%
Total 100.00%
272

Calculations are based on power purchases for 2012 reported by the Utility to the Washington State Department of Commerce in 2013.
Vera Water & Power
Fuel Mix Calculations Calendar Year 2012
MWh MWh from from Total Fuel Market Purchases* Claims on Resources* Percent Biomass 105.888 130.433 236.321 0.10% Coal 6,229.878 0.000 6,229.878 2.71% Cogeneration 0.000 0.000 0.000 0.00% Geothermal 0.000 0.000 0.000 0.00% Hydro 8,303.626 191,145.514 199,449.140 86.71% Landfill Gases 26.707 0.000 26.707 0.01% Natural Gas 2,168.285 185.997 2,354.282 1.02% Nuclear 457.063 21,025.363 21,482.426 9.34% Other 27.417 0.000 27.417 0.01% Petroleum 61.098 17.368 78.466 0.03% Solar 0.000 0.000 0.000 0.00% Waste 108.761 18.602 127.363 0.06% Wind 0.000 0.000 0.000 0.00% Total 17,488.724 212,523.276 230,012.000 100.00%
* Market Purchases include those made directly by utilities, as well as the fraction of delivered BPA power that can be attributed to BPA’s purchases of market power. Claims on Resources include those made directly by utilities, as well as the fractions of delivered BPA power that can be attributed to specific plants.
273

Calculations are based on power purchases for 2012 reported by the Utility to the Washington State Department of Commerce in 2013.
Vera Water & Power
Claims on BPA* Calendar Year 2012 BPA Resource Mix 212,523.276 Biomass 130.433 Natural Gas 185.997 Nuclear 21,025.363 Petroleum (heavy oil) 17.368 Waste 18.602 Water 191,145.514
*The BPA Resource Mix includes only the fraction of delivered BPA power that can be attributed to specific plants. The fraction of BPA power that BPA purchased on the market is included in the “Market Purchases” table.
274

Calculations are based on power purchases for 2012 reported by the Utility to the Washington State Department of Commerce in 2013.
Vera Water & Power
Market Purchases Calendar Year 2012
Total Market Purchases 17,488.724
BPA Market Purchase* 10,001.724 Utility Market Purchase 7,487.000
* “BPA Market Purchases” are the fraction of delivered BPA power that BPA purchased on the market.
**The BPA Slice product includes a small amount of wind power that is not bundled with the Renewable Energy Credits (REC) associated with that power. Such power is assigned the net system fuel mix – as though it were a market purchase.
.
275