WASHINGTON STATE APARTMENT MARKET REPORT SPRING...
7
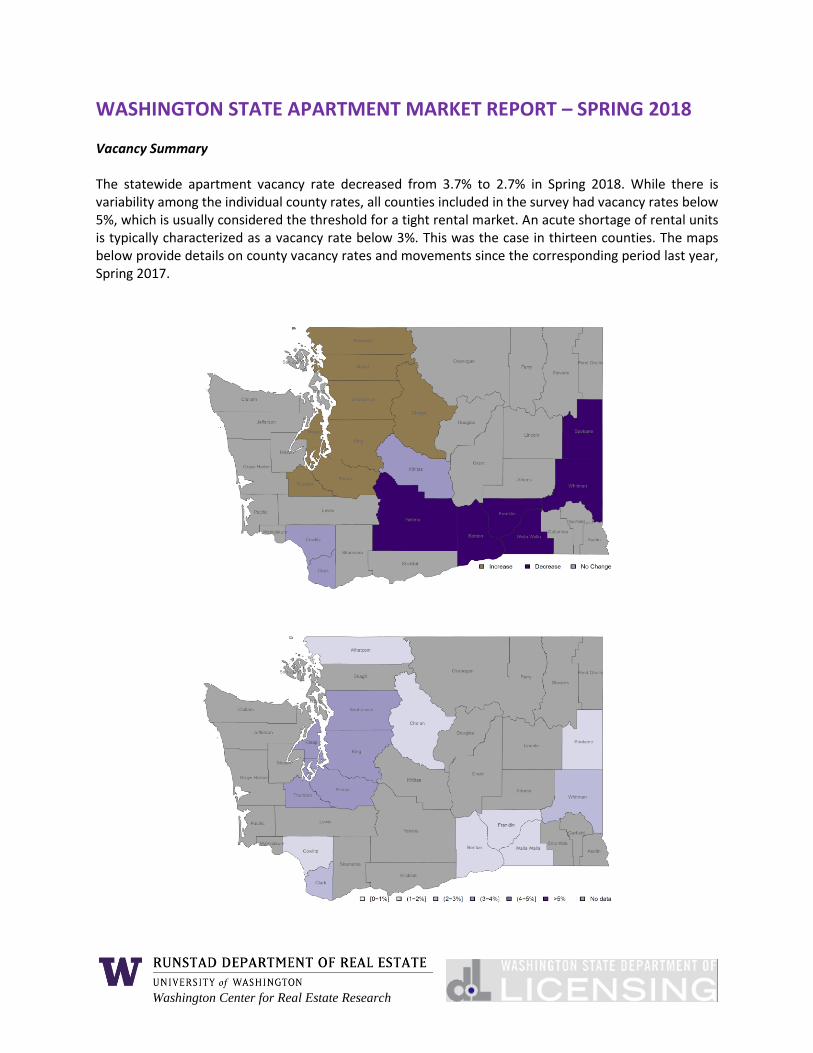
Washington Center for Real Estate Research WASHINGTON STATE APARTMENT MARKET REPORT – SPRING 2018 Vacancy Summary The statewide apartment vacancy rate decreased from 3.7% to 2.7% in Spring 2018. While there is variability among the individual county rates, all counties included in the survey had vacancy rates below 5%, which is usually considered the threshold for a tight rental market. An acute shortage of rental units is typically characterized as a vacancy rate below 3%. This was the case in thirteen counties. The maps below provide details on county vacancy rates and movements since the corresponding period last year, Spring 2017.
Transcript of WASHINGTON STATE APARTMENT MARKET REPORT SPRING...
Washington Center for Real Estate Research
WASHINGTON STATE APARTMENT MARKET REPORT – SPRING 2018 Vacancy Summary The statewide apartment vacancy rate decreased from 3.7% to 2.7% in Spring 2018. While there is variability among the individual county rates, all counties included in the survey had vacancy rates below 5%, which is usually considered the threshold for a tight rental market. An acute shortage of rental units is typically characterized as a vacancy rate below 3%. This was the case in thirteen counties. The maps below provide details on county vacancy rates and movements since the corresponding period last year, Spring 2017.

Washington State Apartment Market Report – Spring 2018
Washington Center for Real Estate Research
Market Summary Apartment markets nationwide have shown declining vacancy rates with a current 15-year low of 7.0%. Washington has shown a more exaggerated trend thanks to inward migration and increased demand for housing, particularly in more urbanized areas of the state. While the statewide vacancy rate stands at 2.7%, a record low. As job growth continues throughout the state and unemployment remains historically low, increased demand for rental housing should also continue.
Over the past year, Benton/Franklin counties (Tri-Cities area) recorded the greatest decline in vacancy rates falling to 1.1%. Out of the 18 counties surveyed, 7 saw an increase in the number of vacancies while 11 showed a decrease or no change in the percentage of units vacant. The lowest vacancy rate was observed in Kittitas County with a vacancy rate of 0.7%, a slight change from 0.5% recorded in the same period last year. The highest vacancy rate was recorded in Snohomish county with a vacancy rate of 4.0%. However, this represents an increase from the 3.7% vacancy rate recorded in Spring 2017. Data and Methods Since the Fall 2017 survey, Dupre + Scott Apartment Advisors (D+S) ceased operations and no longer provide market data for 5 counties in the Puget Sound region (King, Pierce, Snohomish, Kitsap, and Thurston). As a result, surveys were conducted by WCRER in cooperation with several key management companies in the area to produce interim statistics for use in this report. In addition to surveys, field research was conducted to obtain occupancy and rent data where survey response rates were not adequate to obtain a reliable picture of markets across the geographic region. Survey and field data was then cross referenced with other sources (such as appraisers and brokers) in order to provide a reliable base for comparison in relation to geography and unit mix.
0.0
2.0
4.0
6.0
8.0
10.0
12.0
Apartment Vacancy Rate (%)
National Washington

Washington State Apartment Market Report – Spring 2018
Washington Center for Real Estate Research
Caution is advised in using this data as a substitute for D+S for investment decision making, particularly when comparisons are made between the past rental data provided in previous WCRER reports. While all due and reasonable care has been used, response rates differ markedly between the two surveys and there are significant sample differences between the current WCRER survey and past D+S surveys. As a result, the rental rate data contained in this report for King, Snohomish, Pierce, Kitsap and Thurston counties is not directly comparable with past reports. Further, weights in computing statewide averages will vary considerably from past reports because of the relatively high number of multi-family units in the Puget Sound Region and differen in response rates.
Coverage Statistics – Apartment Market Survey
Units Surveyed 1 Bedroom Units 2 Bedroom / 1 Bath units
Benton/Franklin 1,263 398 439
Chelan/Douglas 975 256 374
Clark 6,066 1,630 1,663
Cowlitz 892 187 478
King 12,702 5,737 2,215
Kitsap 3,281 1,349 953
Kittitas 1,052 115 491
Pierce 5,673 2,050 1,684
Skagit 806 286 206
Snohomish 2,919 960 630
Spokane 8,483 2,433 2,119
Thurston 2,182 251 720
Walla Walla 652 188 287
Whatcom 1,429 499 432
Whitman 4,154 1,257 1,500
Yakima 972 385 317
STATEWIDE 53,501 17,981 14,508
While the WCRER survey excludes government-assisted housing, the total universe of rental units within the state includes both subsidized and market rate properties. This is a significant issue particularly within smaller counties where a greater proportion of the multifamily market is dependent on some form of Federal, state or local funding. Note that several counties are combined where they are both contiguous and there is urban development to support defining them as a single ‘market area.’

Washington State Apartment Market Report – Spring 2018
Washington Center for Real Estate Research
Summary Statistics by Unit Type Examining the average floor area of apartments throughout the state reveals significant differences in the price per unit floor area within individual markets. The largest apartment sizes are found in Clark County with an average unit size of 909 square feet. On average, the smallest units are found in Walla Walla County with an average floor area of 720 square feet.
As noted in the graph below, one-bedroom apartments are the most popular type of unit in the state, accounting for about 29.4% of all the units surveyed. The statewide vacancy rate for one-bedroom units has steadily fallen for the past 8 years from a peak of 6.5% in September 2009 to ????% in Spring 2018. One Bedroom Apartments While vacancy rates varied throughout the state, 14 of 19 counties surveyed had vacancy rates below 3% for one-bedroom apartments. The lowest vacancy rate for one-bedroom apartments was recorded in Walla Walla county at 0.5%. The highest vacancy rate recorded for one-bedroom apartments was in Snohomish county at 4.3%.
0%
10%
20%
30%
40%
50%
60%
70%
80%
90%
100%
WCRER Apartment Market Survey Unit CompositionMarch 2018
STUDIO 1 BR 2 BR 3 BR OTHER

Washington State Apartment Market Report – Spring 2018
Washington Center for Real Estate Research
Apartment Summary Statistics – One Bedroom Apartments
Average Size (SF)
Units Surveyed Vacancies
Average Rent
Rent/Unit Floor Area Vacancy Rate
Benton/Franklin 664 398 7 $686 $1.03 1.8%
Chelan/Douglas 657 256 3 $1,217 $1.85 1.2%
Clark 696 1,630 37 $1,024 $1.47 2.3%
Cowlitz 642 187 2 $741 $1.15 1.1%
King 675 5,737 211 $1,624 $2.41 3.7%
Kitsap 676 1,349 40 $1,148 $1.70 3.0%
Kittitas 650 115 1 $748 $1.15 0.9%
Pierce 661 2,050 59 $997 $1.51 2.9%
Skagit 628 286 2 $930 $1.48 0.7%
Snohomish 691 960 41 $1,241 $1.80 4.3%
Spokane 685 2,433 20 $749 $1.09 0.8%
Thurston 664 251 8 $979 $1.47 3.2%
Walla Walla 610 188 1 $686 $1.12 0.5%
Whatcom 612 499 6 $934 $1.53 1.2%
Whitman 573 1,257 43 $688 $1.20 3.4%
Yakima 636 385 6 $609 $0.96 1.6%
Statewide 673 17,981 487 $1,146 $1.70 2.7%
With an average rent of $1,217, the Chelan/Douglas county area (Wenatchee) recorded the highest rent levels for one bedroom apartments outside of the Puget Sound region. Yakima county had the lowest rents at $609 per month. On a floor area basis, the highest rent for one-bedroom units was found in King county at $2.41 per square foot with the lowest found in the Yakima market area at $0.96 per square foot. Two Bedroom – One Bathroom Apartments The second most prevalent type of apartment in Washington consists of 2 bedrooms and 1 bathroom (2BR/1Bath) accounting for 28.9% of all apartment units according to the 2010 Census. King County had the highest average 2BR/1Bath unit rent ($1,658) as well as the highest average rent per square foot ($1.93). Yakima county recorded the lowest average rent of $690 as well as the lowest price per square foot ($0.83).

Washington State Apartment Market Report – Spring 2018
Washington Center for Real Estate Research
Apartment Summary Statistics – Two Bedroom Apartments
Average Size (SF)
Units Surveyed Vacancies
Average Rent
Rent/Unit Floor Area
Vacancy Rate
Benton/Franklin 866 439 2 $808 $0.93 0.5%
Chelan/Douglas 838 374 4 $1,015 $1.21 1.1%
Clark 893 1,663 32 $1,134 $1.27 1.9%
Cowlitz 826 478 6 $859 $1.04 1.3%
King 861 2,215 89 $1,658 $1.93 4.0%
Kitsap 860 953 31 $1,231 $1.43 3.3%
Kittitas 714 491 3 $978 $1.37 0.6%
Pierce 869 1,684 54 $1,126 $1.30 3.2%
Skagit 814 206 3 $971 $1.19 1.5%
Snohomish 882 630 26 $1,323 $1.50 4.1%
Spokane 845 2,119 23 $911 $1.08 1.1%
Thurston 847 720 29 $1,048 $1.24 4.0%
Walla Walla 851 287 5 $871 $1.02 1.7%
Whatcom 836 432 7 $1,105 $1.32 1.6%
Whitman 779 1,500 19 $842 $1.08 1.3%
Yakima 828 317 2 $690 $0.83 0.6%
Statewide 861 14,508 335 $1,115 $1.30 2.3%
Among 2BR/1Bath apartments, vacancies were lowest in the Benton/Franklin (Tri-cities) market area with a vacancy rate of 0.5% representing a decline from a vacancy rate of 2.5% recorded in Spring 2017. The highest vacancy rate was found in Snohomish county with a vacancy rate of 4.1%, and increase of 0.1% from the same period last year. All Unit Types Using the sample of all units surveyed, vacancy rates remained low throughout the state with an overall vacancy rate of 2.7%. Snohomish county recorded the highest overall vacancy rate at 4.0% while the lowest was found in Kittitas county with a vacancy rate of 0.7%.

Washington State Apartment Market Report – Spring 2018
Washington Center for Real Estate Research
Apartment Summary Statistics – All Apartment Units
Average Unit
Size (SF) Units
Surveyed Vacancies Average
Rent Rent/Unit Floor Area
Vacancy Rate
Benton/Franklin 833 1,263 14 $834 $1.00 1.1%
Chelan/Douglas 814 975 11 $1,110 $1.36 1.1%
Clark 909 6,066 126 $1,205 $1.33 2.1%
Cowlitz 766 892 11 $858 $1.12 1.2%
King 800 12,702 484 $1,741 $2.18 3.8%
Kitsap 867 3,281 118 $1,252 $1.44 3.6%
Kittitas 846 1,052 7 $1,028 $1.21 0.7%
Pierce 849 5,673 207 $1,119 $1.32 3.6%
Skagit 777 806 7 $1,044 $1.34 0.9%
Snohomish 883 2,919 117 $1,432 $1.62 4.0%
Spokane 882 8,483 112 $955 $1.08 1.3%
Thurston 849 2,182 80 $1,187 $1.40 3.7%
Walla Walla 720 652 11 $686 $0.95 1.7%
Whatcom 783 1,429 19 $1,067 $1.36 1.3%
Whitman 788 4,154 100 $928 $1.18 2.4%
Yakima 725 972 8 $670 $0.92 0.8%
Statewide 827 53,501 1,432 $1,235 $1.49 2.7%
With all unit types analyzed, the influence of unit mix plays a significant role in determining the average rent. For example, King, Walla Walla, and Yakima counties have a proportionally high number of 1 bedroom and studio units which will provide downward influence on overall rents compared to places with a high proportion of 3 bedroom units which tend to rent for a higher amount. Given those influences, King county recorded the highest average overall rent as well as the highest rent per unit floor area of $1,741 and $2.18 per square foot. Yakima county recorded the lowest rent on both measures with an average rent of $670 and a monthly rental price of $0.92 per square foot. Time and Seasonality The WCRER Apartment survey is conducted in March and September so that seasonal variation between markets is minimized. For example, Whitman and Kittitas counties are greatly influenced by the academic year. Yakima and Chelan/Douglas counties are greatly influenced by agricultural cycles. Taking the surveys at 6 monthly intervals incorporating the timing ensures that more accurate reflections of the market are recorded. Please note that there is limited comparability between this survey and previous versions of the report incorporating rent data from D+S for the 5 counties in the Puget Sound Region.