WASHINGTON GEOWGIC NEWSLETTER
12
OCTOBER 1977 A PU3LICATION OF THE DEPARTMENT OF NATURAL RESCXJRCES WASHINGTON GEOWGIC NEWSLETTER BERT L.COLE COMMISSIONER OF PU3LIC LANDS RALPH A. BESWICK, Supervisor DEPARTMENT OF NATURAL RESOURCES VAUGHN E. LIVINGSTON,JR.,State Geologist DIVISION OF GEOLOGY AND EARTH RESOURCES DEPARTMENT Of NATURAL RESOURCES, DIVISION OF GEOLOGY AND EARTH RESOURCES, OLYMPIA, WASHI NGTON, 9 8504 VOLUME 5 - NUMBER 4 MAJOR MINES OF WASHINGTON' Yield per acre per year SURFACE CROPS
Transcript of WASHINGTON GEOWGIC NEWSLETTER

OCTOBER 1977
A PU3LICATION OF THE DEPARTMENT OF NATURAL RESCXJRCES
WASHINGTON GEOWGIC NEWSLETTER
BERT L.COLE
COMMISSIONER OF PU3LIC LANDS
RALPH A. BESWICK, Supervisor
DEPARTMENT OF NATURAL RESOURCES
VAUGHN E. LIVINGSTON,JR.,State Geologist
DIVISION OF GEOLOGY AND EARTH RESOURCES
DEPARTMENT Of NATURAL RESOURCES, DIVISION OF GEOLOGY AND EARTH RESOURCES, OLYMPIA, WASHINGTON, 98504
VOLUME 5 - NUMBER 4
MAJOR MINES OF WASHINGTON'
Yield per acre per year
SURFACE CROPS

N
LOCATION MAP: DIVISION OF GEOLOGY AND EARTH RESOURCES
DEPT. SOCIAL AND HEALTH SERVICES
D t
j ~J :~ ~ ~ ~GEOLOGY AND EARTH ~ ~ RESOURCES u ,
STATE CAPITOL
Vaughn E. (Ted) Livingston, Jr., Supervisor
Geologic Staff
J. Eric Schuster, Assistant Supervisor
Minerals and Energy Geologists
Clint Milne Wayne S. Moen Weldon W. Rau James G . Rigby Glennda B. Tucker Ellis R. Vonheeder Charles W. Walker
Land Use Geologists
Allen J. Fiksdal Kurt L. Othberg Pamela Palmer Mackey Smith Gerald W. Thorsen
Regulations and Operations
Surface Mined Land Reclamation and Oil and Gas Conservation Act
Donald M. Ford, Assistant Supervisor Ralph H. Kimmel 1 Geologist
TACOMA S~TLE.-
Publications: Library: Laboratory: Secretaries:
Loura Broy Doyal Foster Keith Ikerd Wanda Wa lker
William H. Re ichert Arno Id W. Bowman
Mailing address: Departmeht of Natural Resources Division of Geology and Earth Resources Olympio, WA 98504
(206) 753-6183
Pamela Guffey Joanne Leach Cherie· Dunwoody
THE MINES OF WASHINGTON-THE IR OVERLOOKED WORTH
By Wayne S. Moen
In the course of a year, as o minerals
geologist for Washington State, I om frequently asked
if Washington hos any valuable mines. In answer to
this question I emphatically reply that Washington
does hove valuable mines and has had since the turn
of the century. Considering most people couldn't
care less where metals come from, 1 hove never
thought of this as on unusua l question. However, I
hove often wondered what really determines the value
of a mine. Obviously, its value is related to metals
it produces. To the owner of o mine, meta ls mean
dollars; to a child, metals may mean a cherished toy
or a bicycle; to an adult, metals may mean home
conveniences or a car. But in all cases, whether they
be monetary or intrinsic, certain va lues are placed
on metals by man.
In terms of dollars, which is what most people
relate value to, the mines of Washington have to date
produced metals and nonmetals in excess of several
billion dollars at present-day metal prices. Currently,
Washington's mineral production is at an all-time
yearly high of $181,000,000. In its short life o sin
gle mine may produce os much os one-half bi llion
dollars, or in excess of $25 million yearly, which con
tributes significanfly to the economy of o mining com
munity. However, if the vo l ue of a mine is re lated
to benefits that man derives from its metals or minerals,
it becomes impossible to attach a dollar value to its
worth. As on example, ot the Centralia mine in west
ern Washington, coal mined in 1 day and converted
into electrical energy could supply all homes in the
neighboring communities of Centralia and Chehalis
with electricity for 5 months, or would be sufficient
to supply electricity to all the homes in Seattle for
2 days. Uranium mined at the Midnite mine in eastern
Washington, when converted into electrical energy,
is utilized in thousands of homes along the Atlantic
coast. Copper from the Holden mine in central Wash
ington, if used in copper wire, was enough to wire
over 800,000 homes . A single year's production of
lead from the Pend Orei lie mine in northeastern Wash
ington, when used in car batteries, makes it possible
for nearly 200,000 cars to operate. Silver from Wash
ington mines is utilized by the electronics and film
industries, whereas Washington gold may have been
used in the first space craft that landed on the moon .
It would be impossible to point out all benefits man
derives from metals produced in Washington, because
a single metal may have several hundred uses . How
ever, if each metal hod but a single use, man would
be dependent upon it .
Metals and minerals have always been con
sidered natural resources, and as such, it seems reason
able to express the productivity of a mine in yield
per acre per year, as is done with surface crops
such as wheat and timber . To i I lustrate the produc
tivity of Washington mines , nine major mines have
been selected (table 1). As can be seen in table 1,
five past- producing mines yielded $592. 95 million
from 1,095 acres, three present-day operating mines
have produced $820.42 million to date from 3,147
acres; and one property, that has yet to be placed
into production, contains $560 million within 172
acres. Thus, the mineral wealth of 4,414 acres over
lying the deposits is valued ot $1,973 billion, for on
average worth of$446,986 per acre. To il lustrate
the tremendous yield per acre per year of metal mines,
it is best to consider specific properties. In the case
of the Van Stone mine of Stevens County, this prop
erty, in 18 years produced $71 million from 15.4
acres . With an annual yield of $3.96 million, each
acre of land overlying the mineral deposit yielded
$256,962 per year . In the case of the Sherwood
uranium deposit in Stevens County, this property,
when placed into production wi II yield $560 mi I lion
from 172 acres in a 15- yeor period. Thus, the per
acre per year yield of uranium amounts to $217,000.
The yield per acre of o low-cost mineral commodity I

TABLE 1.-Production and mineral value of major Washington mines
Property Chief product Production!:'!/ Acres'e/ Years of Value per acre Yield per acre (mi II ions) production (mi 11 ions) per rear
Past eroducers
Gold King Gold $ 53.34 30 18 $1 .780 $98,777
Grandview Lead- zinc 67.18 124 32 0.546 17,082
Holden Copper- go Id 243 .60 JOO 20 2.436 121,800
Van Stone Lead-zinc 71.23 15.4 18 4.625 256,962
Bellingham Cool 157.00 826 38 0.190 5,002
Present eroducers
Midn ite Uranium 400.oos/ 500 17 0 . 800 47,059
Pend Orei lie Lead- zinc 273.81 367 40 0.746 18,652
Centralia Cool 146.61d 2,280 6 0.064 10,717
Pit siteij Sand and grovel 0 .918 5 1 0 . 184 183,600
Ouorry siteij Basalt 0 .544 2.5 1 0.218 217,600
Future eroducer
Sherwood Uranium 560.00 172 15 3 .256 217,000
Q./ Production corrected to current metal ond mineral prices.
!?/ Acres of land overlying mineral deposit . d ij
Estimated production.
Unidentified western Washington property .
such as coal is even impressive. At the Centralia
coal mine in western Washington, coal valued at
$146. 6 mi II ion has been produced in 6 years from
2,280 acres with an average yearly yield of $10,717
per acre. Sand and grave I deposits produce as much
as $183., 600 per acre per year, whereas stone quarries
hove produced in excess of $200,000 per acre per year.
As can be seen in table 1, in no case has a major metal
mine in Washington yielded less than $17, 000 per acre
per year, or contained less than $546,000 per acre in
metals.
It is revealing to compare on acre of miner
alized land with an acre of wheat or t imber land.
Considering the nine major mines in table 1, the aver
age yield per a cre per year amounts to $49,665 .
Average wheat land in Washington yields but $140
dollars per acre, whereas prime timber land yields 2
only around $100 per acre per year. The extreme
potential of mineral ized land becori,es readily appar
ent when the production of several of the state's ma jor
mines is compared with the yield in wheat or t imber.
In table 2, the number of years of timber growing
equal to the total production of o specific mine is
shown in column A. Column B of table 2 shows the
do llar value for wheat grown on acreage equa l to
that overlying a mineral deposit for the life of the
mine . In the case of the Sherwood mine , timber
would have to be grown and harvested for 32,560
years to equal the value of uranium that will be pro
duced at this property in only 15 years. Shou ld equal
acreage be planted in wheat, the land in 15 years
would yield $361,200 compared to $560 mi llion in
uran ium. Expressed in another manner, uranium pro
duced at the Sherwood mine in 4 days will exceed

TABLE 2 .-Comparative yield of wheat and timber for Washington mines
A B
Property Production Years of Comparative yield!:!/ Comporat~e yield!/ (mi II ions) production in timber (years) in wheat
Gold King $ 53.34 18 17,780 $ 75,600 Grandview 67.78 32 5,466 555,520 Holden 243 . 60 20 24,360 280,000 Midnite 400.00 17 8,000 1,190,000 Pend Oreille 273.81 40 7,460 2,055,200 Sherwood 560.00 15 32,558 361,200 Von Stone 71.23 18 46,253 38,808
Bellingham 157.00 38 1,900 4,394,320 Centralia 146.61 6 640 1,915,200
Sand and grovel pits/ 0 .918 1 9,180 700
Stone quotryf/ 0. 544 1 5,440 350
!:!/ Number of years of timber harvest on acreage overlying mineral deposit to equal total mine production. Assuming 600 board feet per acre per year.
~/ Value of wheat grown on acreage overlying mineral deposit for lifespan of mine. Assuming 47.4 bushels of wheat per acre per year.
5:/ Unidentified western Washington property.
the value of wheat grown on equal acreage for 15
years.
In no way do I wish to imply that all land is
more valuab le for minerals than for surface crops, such
as wheat and timber, for probably less than 1 percent
of the land area of Wash ington contains valuab le min
eral deposits. I mere ly wish to stress the fact that,
when placed into production and considered on the
dol lar yie ld per acre per year, the mineral resources
of Washington ore without doubt the state's most valu-
able exploitable natural resource.
In this brief discussion I hove pointed out
the value of Washington's mines in terms of benefits
man derives from meta ls and minerals, as well as the
dol lar value of these materials compared to wheat and
timber, which represent the state's major surface crops.
However, the ultimate value of a mine shou ld not be
measured in terms of profits and losses, but rather in
the worth man places on metals and minerals from
mines when uti lized by him.
MOSES COULEE FLASH FLOOD
By J . Eric Schuster
On August 6, 1976, a flash flood originating
on the east side of Moses Coulee washed out al I three
lanes of U.S . Route 2 east of Watervi I le and west of
Coulee City where it enters Moses Coulee. According
to Robert Sprott, maintenance engineer for the Wash
ington State Deportment of Highways District 2 office
in Wenatchee, the flood washed out on estimated
100,000 cubic yards of fi ll material and pavement.
Traffic re locoti on and re poi r costs were opproxi mote ly
$1.2 mill ion.
The damaged section was repai red and opened
to traffic on June 2, 1977. Th is section of highway
3
is located in the E! sec. 3, T. 24 N., R. 25 E. ,
where U.S. Route 2 enters Moses Coulee by way of a
steep-walled rockcut in the east wall of the coulee
and a long section of fill on which the highway de
scends to the floor of the coulee. The sma 11, -gener
ally dry stream channel down which the flood waters
rushed extends eastward from the coulee for about 4
miles and drains an area of 6 or 7 square mi les.
As it enters Moses Coulee, U.S. Route 2 is
three lanes wide, with a gabion-lined drainage chan
nel along the north side of the highway fill. Gabions
are rock- fi I led wire baskets that can be wired together
into large units and used to stabilize fill embankments
or as a replacement for ri prop .
As the floodwaters approached Moses Coulee
from the east, they overtopped the highway and ran
down both sides of the road. Those waters that flowed
FIGURE 1 . - Flash- flood damage to eastbound lanes, and washout of pavement and 50- foot- deep fill, U.S. Route 2 . Looking southwest into Moses Coulee
4
along the existing channelways on the north side of
the highway overflowed and eroded fill material from
behind the gabion walls , causing the wall's col lapse.
There was also considerable damage to the westbound
lane of the highway. Floodwaters on the south side of
the highway removed much of tile outside eastbound
lane of the highway, and, when restricted by a rock
buttress, flowed across to the north side of the road
and washed out al I three lanes of the highway and a
large section of fi II (fig . 1).
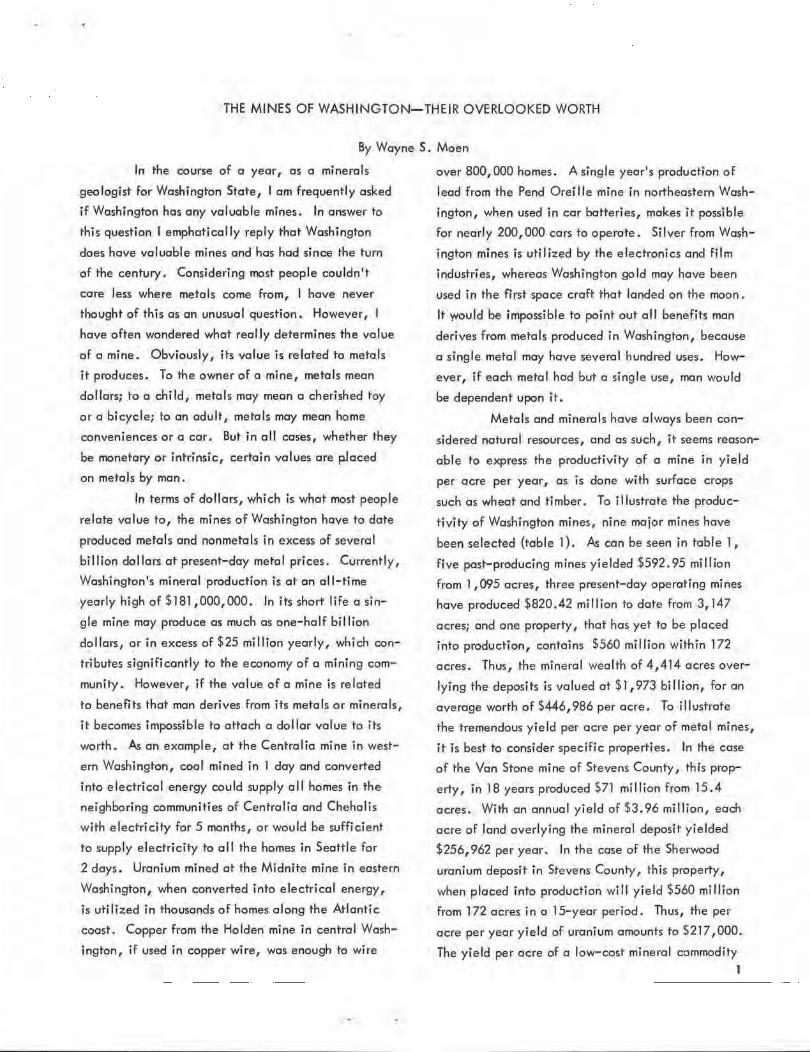
The accompanying photographs were taken
on August 20, 1976, at which time repair work was
getting underway and traffic had been routed to the
old highway located in Sulphur Canyon, about one
half of a mi le north of the damaged section of U. S.
Route 2 .
FIGURE 2. - Flash- flood damage to westbound lane, gabion- lined drainage channel, and washout of all three lanes and 50- foot- deep fi ll. East wall of Moses Coulee, looking southwest.

ADMIRAL TY Tl LL (PLEISTOCENE)
OR
THE RISE AND FALL OF A ROCK STRATIGRAPH IC NAME
By Kurt Othberg
Original reference:
Bailey Willis, 1898, Drift Phenomena of
Puget Sound, Geological Society of
Ameri co, v. 9, p. 152.
For his description of" Admiralty tjll _and
clay," Bailey Willis quoted I. C. Russell (no citation) .
There was no specific type locality, rather, he referred
to characteristic exposures along the shores of Admi
ralty Inlet . Although Admiralty Inlet now refers only
to a narrow inlet between the Olympic Peninsula and
Whidbey Island, it appears from Wil lis1 entire discus
sion that he had in mind sea- cliff exposures in the
Tacoma-Seattle area. The description is as follows:
A thick deposit of stiff, blue clay, usually in evenly stratified beds, but occasionally changing gradually to a we l I characterized_ti 11 filled with subongular stone and gravel, together with occasional boulders, some of which are glaciated. This deposit is frequently e><posed obout the immediate shores of the Sound, and forms precipices from a few feet to fully one hundred feet high.
The upper surface of the lower till is irregular in many places 'and sometimes deeply eroded . For this reason it is not seen at some localities where it might be expected to occur, its place being token by stratified sands and grave I •
In 1913, J Harlen Bretz described stratified
material resting in o few localities on on older till
sheet. For the till he used Willis' Admiralty till, and
he named the overlying stratified material Admiralty
sediments. His Admiralty sediments consisted of sev
erol lithologies, such as clay, sand, grovel, and in a
few places, intercalated till.
Newcomb (l 952) described Admiralty cloy
as bedded silt and clay and a few sand and grovel
beds. One of his measured sections of Admiralty cloy
included on intercalated gravelly till .
Scevo (1957) described Admiralty Drift as
consisting principolly of massive blue clay and si lt,
but containing till, peat, sand, and some gravel.
Crandell, Mullineaux, and Waldron (1958,
p . 3~6) chose not to use "Admiralty ti ll and clay"
nomenclature because it could not be successfully
correlated with their Puyallup Valley stratigraphic
units. Furthermore, Crandel I and others strove to
choose rock units that enabled them to establish gla
cial climatic units; that is, glaciations and intergla
ciations. They interpreted lithologies included within
the "Admiralty till and clay" as representing both
glacial and honglacial conditions . Therefore, it was
not suitable for the new glacial climatic stratigraphy .
In the wake of Crandell, Muflineaux, and
Waldron's initiative, subsequent geo logists mapping
in the Puget Lowland area hove also abandoned
Admiralty nomenclature , reflecting their attempts to
subdivide the stratigraphy into glaciations and inter
glociotions. The sum of all the work indicates that
the Admiralty till and its offsprings- .Admirolty sedi
ments, Admiralty clay and Admiralty drift-may each
consist of more than one formation (assemblage of
mappable lithologies) and probably represents more
than one glacial ond(or} interglacial event. For this
reason Admiralty till and other Admiralty units have
ceased to be used, and probably ought to be formally
redefined or abandoned.
However, this is not to suggest that recent
work has clearly established the glacial-interglacial
history of the Puget Lowland. As Bretz (1913, P. 175)
states in his description of the three tills in the Pos
session Point section: 11 lts suggestion of three glacia
tions • • • is not borne out by a study of the sea cliff
exposures elsewhere in Puget Sound." With due re-
s

spect for the four glaciations of the Puyallup Valley
stratigraphy, what Bretz is saying is that more than
two glaciations are not clearly demonstrated by the
bulk of the Puget Lowland sea cliff exposures. In
order to prove or disprove Bretz' contention, study, as
careful as that accomplished by Crandel I and others
in the Puyallup Valley, will be required.
Although Admiralty nomenclature may have
oversimplified the stratigraphy, it symbol izes the dif
ficulties in mak ing stratigraphic correlations and in
interpreting Quaternary geologic history in the Puget
Lowland.
Selected References
Bretz, J Harlan, 1913, Glaciation of the Puget Sound
region: Washington Geological Survey Bul
letin No. 8, p. 173-194.
NWMA CONVENTION
TO BE HELD IN SPOKANE
ON DEC. 2-3
J. Allen Overton, Jr., president, American
Mining Congress, will chair the Opening General
Session of the Northwest Mining Association 83rd
annual convention. "The theme of the Northwest
Mining Association's convention-Mining at the
crossroads- reflects the uncertainty the mining in
dustry feels today," sa id Overton. "These major
uncertainties involve the way the Senate and House
of Representatives view resources exploration and
the development of public lands, and how they
see prospective changes in our mining laws, 11 he
continued.
John C . Balla, Manager of the Northwest
Exploration Division of ASARCO has been appointed
chairman of the NWMA convention, which will be
held on December 2 and 3 at the Davenport Hotel in
Spokane.
6
Crandell, D.R.; Mullineaux, D.R.; Waldron, H. H.,
1958, Pleistocene sequence in southeastern
part of the Puget Sound Lowland, Washington:
American Journal of Science, v. 256, No. 6,
p . 384-397.
Garling, M. E.;andothers, 1965, Water resources
and geology of the Kitsap Peninsula and
certain adjacent islands: Washington Divi
sion of Water Resources Water Supply Bulle
tin No. 18, p, 27.
Newcomb, R. C., 1952, Ground-water resources of
Snohomish County Washington: U.S. Geo
logical Survey Water-Supply Paper 1135,
p. 13- 18.
Sceva, J. E., 1957, Geo logy and ground-water
resources of Kitsap County Washington:
U.S. Geological Survey Water- Supply
Paper 1413, p . 14-15, 37-38.
J. Allen Overton, Jr . , president, American Mining
Congress, wi ll chair Opening General Session
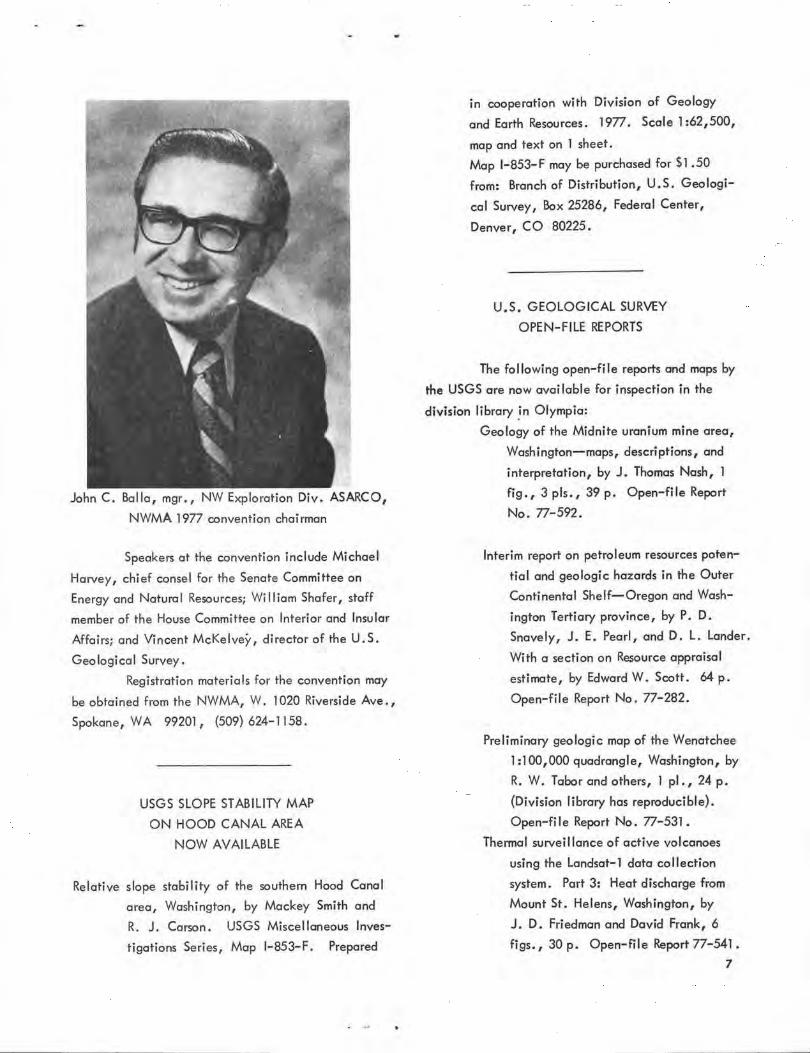
John C. Balla, mgr., NW Exploration Div. ASARCO,
NWMA 1977 convention chairman
Speakers at the convention include Michael
Harvey, chief consel for the Senate Committee on
Energy and Natura I Resources; Wi II iam Shafer, staff
member of the House Committee on Interior and Insular
Affairs; and Vincent McKelvey, director of the U.S.
Geological Survey.
Registration materials for the convention may
be obtained from the NWMA, W. 1020 Riverside Ave.,
Spokane, WA 99201, (509) 624-1158.
USGS SLOPE STABILITY MAP
ON HOOD CANAL AREA
NOW AVAILABLE
Relative slope stability of the southern Hood Canal
area, Washington, by Mackey Smith and
R. J. Carson. USGS Miscellaneous Inves
tigations Series, Map 1-853-F. Prepared
in cooperation with Division of Geology
and Earth Resources. 1977. Scale 1 :62, 500,
map and text on 1 sheet.
Map 1-853-F may be purchased for $1 • 50
from: Branch of Distribution, U.S. Geologi
cal Survey, Bax 25286, Federal Center,
Denver, CO 80225.
U.S. GEOLOGICAL SURVEY
OPEN-FILE REPORTS
The following open-file reports and maps by
the USGS are now available for inspection in the
division library _in Olympia:
Geology of the Midnite uranium mine area,
Wash ington-maps, descriptions, and
interpretation, by J. Thomas Nash, 1
fig., 3 pis . , 39 p. Open-file Report
No. 77-592.
Inte rim report on petroleum resources poten
tia l and geologic hazards in the Outer
Continental Shelf- O regon and Wash
ington Tertiary province, by P. D.
Snavely, J. E. Pearl, and D. L. Lander.
With a section on Resource appraisal
esti mote, by Edward W. Scott. 64 p.
Open- file Report No. 77-282.
Preliminary geologic map of the Wenatchee
1:100,000 quadrangle, Washington, by
R. W. Tabor and others, 1 pl., 24 p.
(Division library has reproducible).
Open-fil e Report No. 77-531.
Thermal surveillance of active volcanoes
using the Landsat-1 data co llection
system. Part 3: Heat discharge from
Mount St. Helens, Washington, by
J . D. Friedman and David Frank, 6
figs., 30 p. Open-file Report 77-541.
7
8
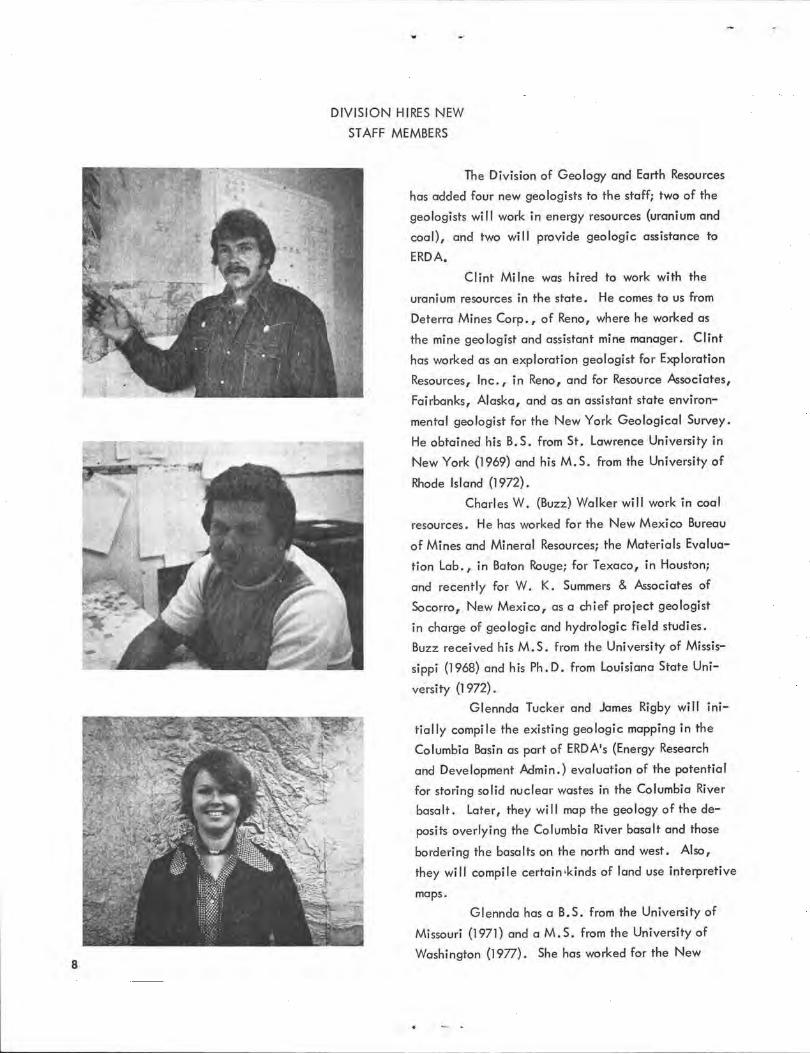
DIVISION HIRES NEW
STAFF MEMBERS
The Division of Geology and Earth Resources
has added four new geologists to the staff; two of the
geologists will work in energy resources (uranium and
coal), and two will provide geo logic assistance to
ERDA.
Clint Milne was hired to work with the
uranium resources in the state. He comes to us from
Deterra Mines Corp., of Reno, where he worked as
the mine geologist and assistant mine manager. Clint
has worked as an exploration geologist for Exploration
Resources, Inc., in Reno, and for Resource Associates,
Fairbanks, Alaska, and as an assistant state environ
mental geologist for the New York Geological Survey.
He obtained his B. S. from St. Lawrence University in
New York (1969) and his M.S. from the University of
Rhode Island (1972).
Charles W. (Buzz) Walker wil l work in coal
resources. He has worked for the New Mexico Bureau
of Mines and Mineral Resources; the Materials Evalua
tion Lab., in Baton Rouge; for Texaco, in Houston;
and recently for W. K. Summers & Associates of
Socorro, New Mexico, as a chief project geologist
in charge of geologic and hydrologic field studies .
Buzz received his M . S. from the University of Missis
sippi (1968) and his Ph.D. from Louisiana State Uni
versity (1972).
G lennda Tucker and James Rigby will ini
tially compile the existing geo logic mapping in the
Columbia Basin as part of ERDA's (Energy Research
and Development Admin.) evaluation of the potential
for storing solid nuclear wastes in the Co lumbia River
basalt . Later, they will map the geology of the de
posits overlying the Columbia River basalt and those
bordering the basa I ts on the north and west. Also,
they will compile certain •kinds of land use interpretive
maps.
Glennda has a B.S. from the University of
Missouri (1971) and a M.S. from the University of
Washington (1977). She has worked for the New

Jomes Rigby
Jersey Bureau of Geology compiling land use, geo
logic, drainage, water resource, and demographic
maps.
Jim got his B. S. from the University of Akron
(1969) and hos pursued graduate studies at Ohio Uni
versity and the University of Idaho, He worked for
the U.S. Bureau of Mines in Spokane , where he con
ducted field sh.Jdies of proposed wilde rness areas to
determine econo mic mineral potential .
YOUR STATE GEOLOG 1ST REPORTS
For those of you who might be interested I
thought I might give a brief resume of what happened
•
to us during the last legis lative session. We started
out asking for a substantial increase in manpower to
help meet the growing need fo r mineral fuel informa
tion in the state . This proposa l budget went through
our deportment with only slight modification . The
governor's budget people, however, re jected the
whole package and cut our program by one man-year.
Our department management then took the fight to
the legislature where we scaled down ou r request to
four new people to work exclusively in mineral fue l
development . The House of Representatives agreed
with our request and included it in their revision of
the budget. The Senate did not consider our request
in their revision of the budget. Because the two budg
ets differed, the final budget was built in a joint
conference committee where the House revision was
accepted so far as our program was concerned. At
tha t point, I fe lt pretty good-it looked like we had
finally made a giant step forward in energy work.
Hold on though, the allotments hod yet to be figured
out. After much de li beration , we concluded that we
had actually been given authority to hire one new
person but had been mandated to work four people in
energy. You might say , "How can that happen, the
budget clearly stated we were to get four new people",
Well , afte r a couple of weeks of investigation we
found that the wrong current level had been used by
those who prepared the budget figures. We ll , there
you have the who le story in a nutshell . One learns
to be philosophica l in this job.
Ted Livingston
U.S . GEOLOG ICAL SURVEY ?! -MINUTE TOPOGRAPHIC QUADRANG LES (Maps received in the division library since July 1, 1977)
knoon Cily Blakely Island Chottoroy Cyprus Island Dortlonl Foothills Graenoc.res lowo Flo1, Little Fot i, Long Loke Molden Spring Mood Mount Kio Cono., Nine Mil• Folts Show !Jlond
1974 1973 1973 1973 1973 1973 1973 1974 1973 1973 1974 1973 1973 1973 1973
looit\lde Lonaaude (indicore, soutneCMt corner)
46°15'00" 48°30'00'' 47°52'30" 48°30'00" 47°45'00" 47°45'00' 47•37•30• 46°22'30" 47°45 100" 47°45'00" 46°22'30" 47°45'00" 47°52'30" 47'45'00" 48°30'00"
119°22'30" 122°45'00" 11 7°15'00" 122°37'30" 117°22'30" 117°07'30° 117°07'30' 119°30'00" 117°52'30" 117°45'00" 119°45'00" 117°15'00" 117°07'30" 117°30'00' 122°52'30"
Benton Son Juan Spokane Skagit Spokane Spokane Spokane Benton l incoln, Stevens S•evens, linooln, Spokone Benton, Yakima Spokan• Spokon• Spokane, Steven, Son Jvon 9

Department of Natural Resources Division of Geology and Earth Resources Olympia, WA 98504
..
IUUC LUI U. S. ,OStAGI PAtO 01,...ple, Wflll"'tfon
,_,. HJ