
Washington, DC
39
Washington, DC Robert Sasson Daniel Veronesi William Higgins Brian Deperry Timothy Lynn
-
Upload
steven-short -
Category
Documents
-
view
31 -
download
0
description
Washington, DC. Robert Sasson Daniel Veronesi William Higgins Brian Deperry Timothy Lynn. Efficiency of Transportation Planning. Develop solutions that maximize access not mobility Street Structure - PowerPoint PPT Presentation
Transcript of Washington, DC
Washington, DCRobert SassonDaniel VeronesiWilliam HigginsBrian DeperryTimothy Lynn
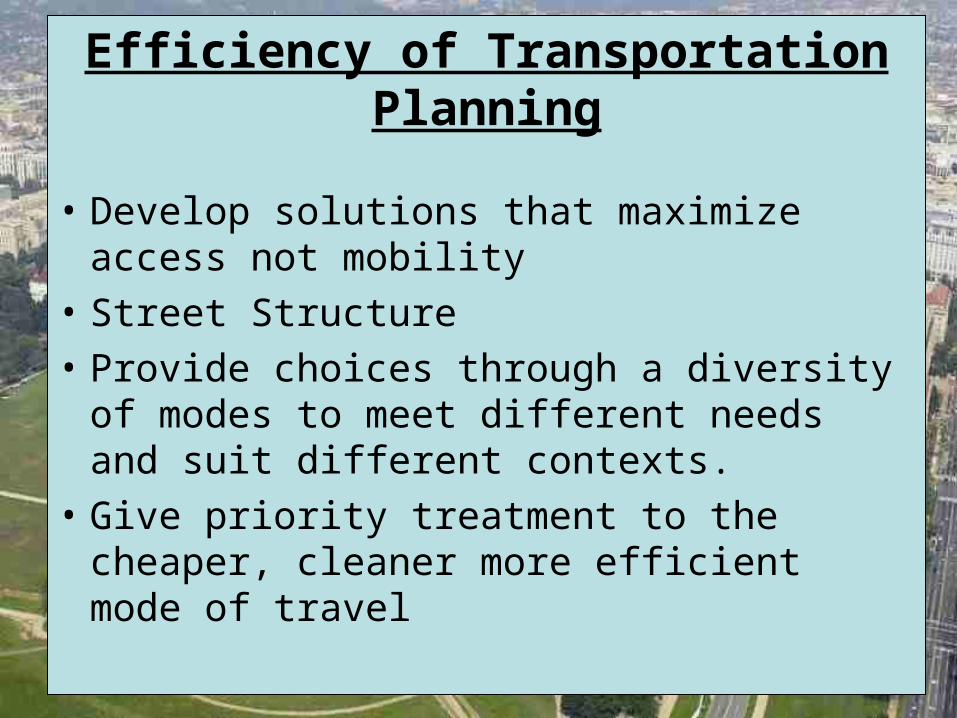
• Develop solutions that maximize access not mobility
• Street Structure
• Provide choices through a diversity of modes to meet different needs and suit different contexts.
• Give priority treatment to the cheaper, cleaner more efficient mode of travel
Efficiency of Transportation Planning
• Take advantage of compact building design
• Creates housing opportunities and range of household types
• Creates walkable neighborhoods
• Fosters distinctive communities and strong sense of place
• Provides variety of transportation choices
Benefits of Land Use Planning

Arlington, VA
• Neighboring urban county of about 207,000 residents
• Arlington today is served by the Orange, Blue, and Yellow lines of the Washington Metro.
• Virginia Railway Express
• Metrobus
• Arlington Transit (ART), a local public bus system

Planning and Development in Arlington
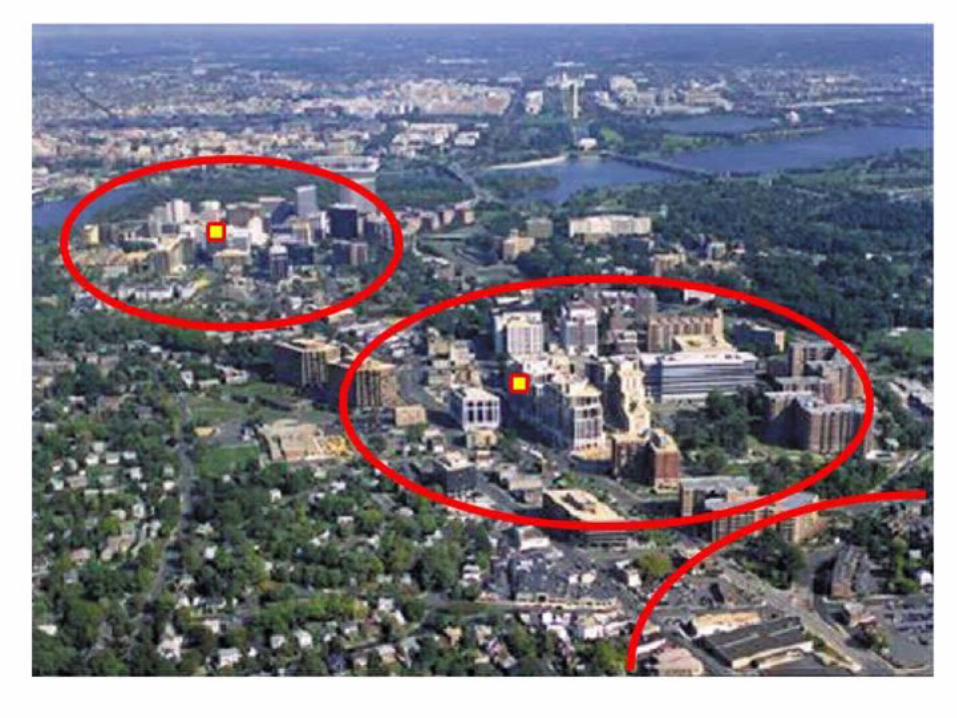
• In 1970, planning focus shifted to the Metrorail
• Much of Arlington's development in the last generation has been concentrated around 7 of the County's 11 Metrorail stations.
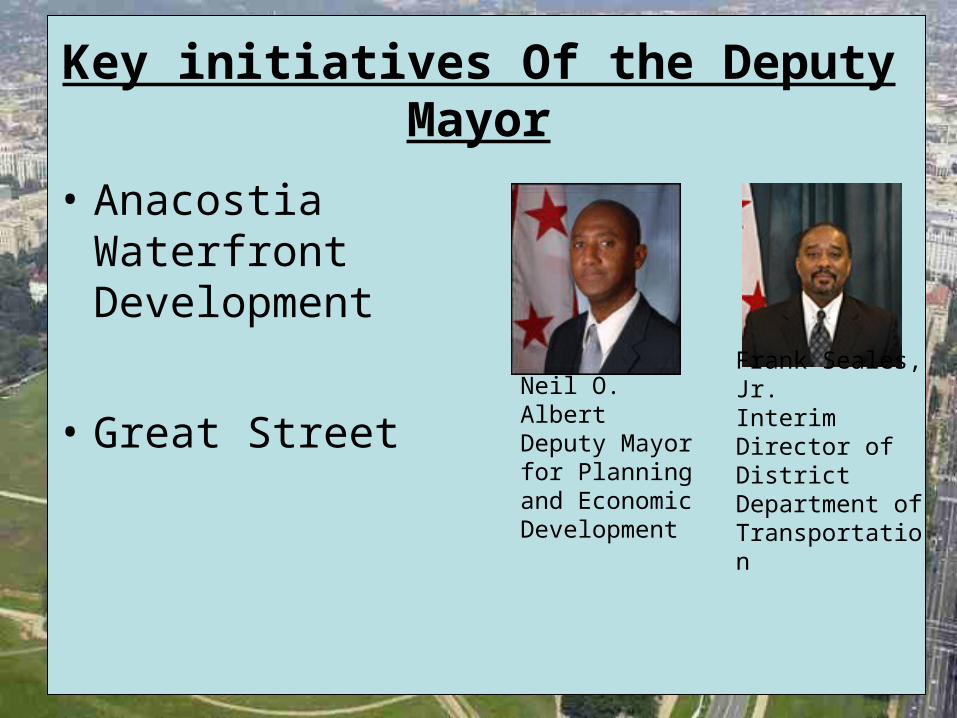
Key initiatives Of the Deputy Mayor
• Anacostia Waterfront Development
• Great StreetFrank Seales, Jr.Interim Director ofDistrict Department of Transportation
Neil O. AlbertDeputy Mayor for Planning and Economic Development
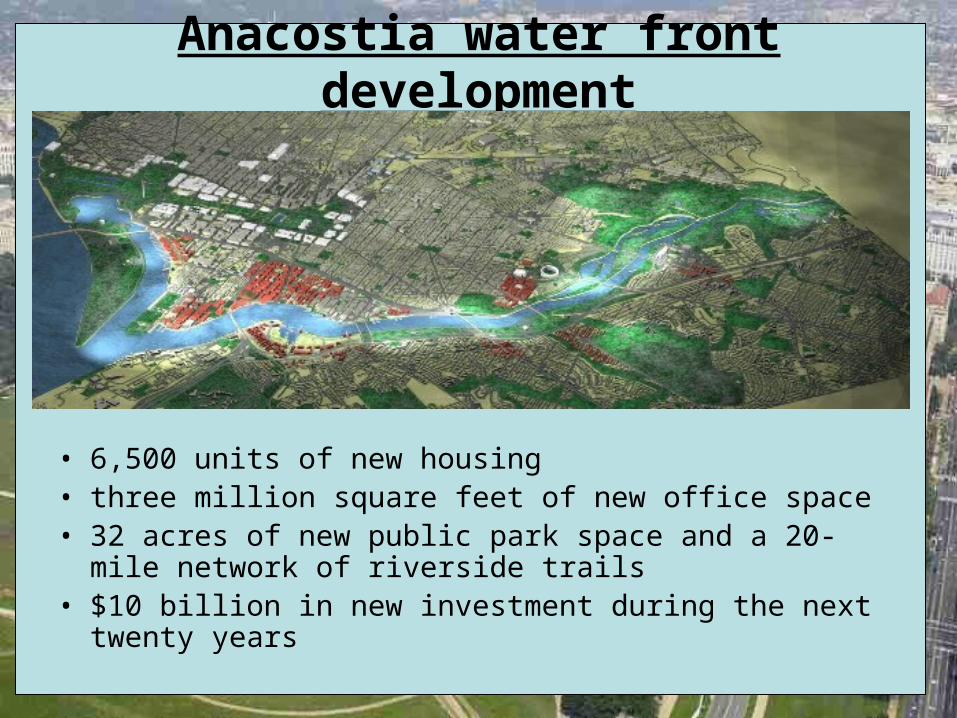
Anacostia water front development
• 6,500 units of new housing• three million square feet of new office space• 32 acres of new public park space and a 20-mile network of
riverside trails• $10 billion in new investment during the next twenty years
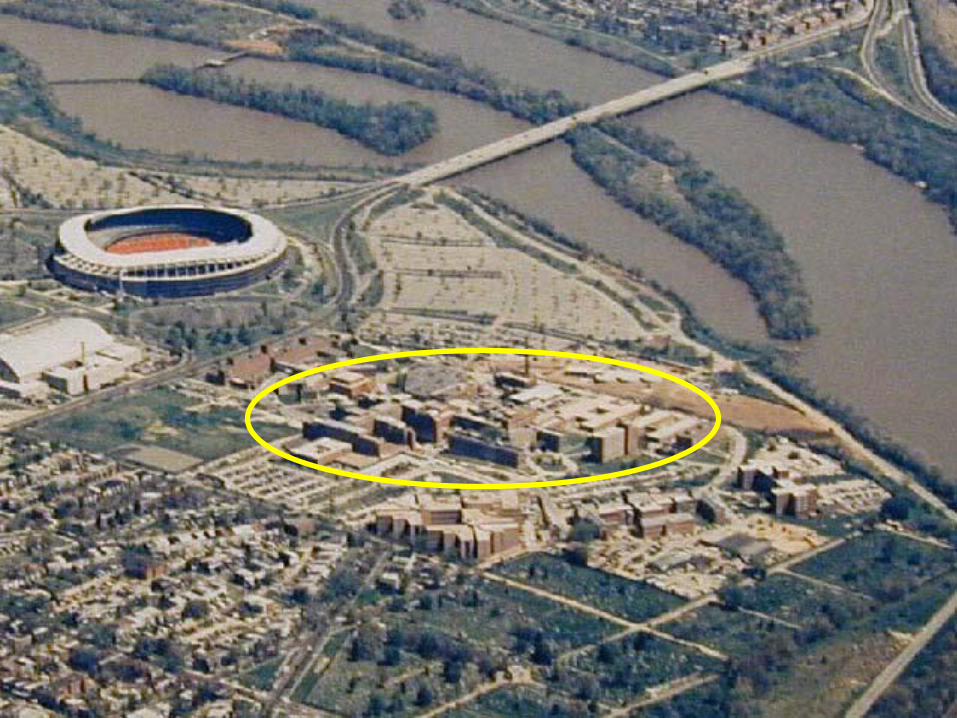
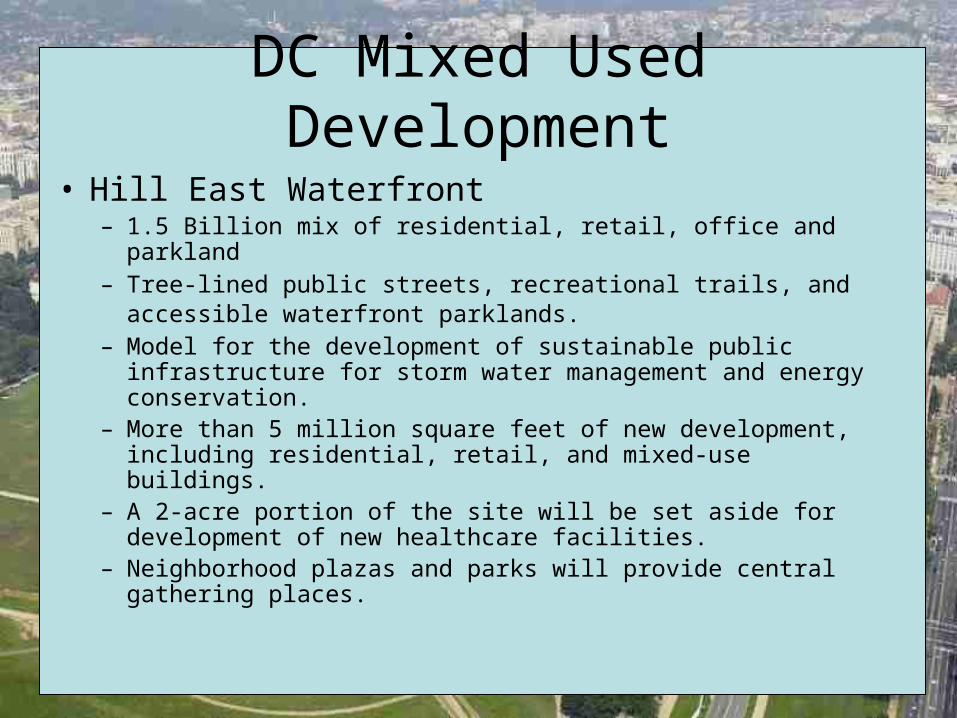
DC Mixed Used Development
• Hill East Waterfront – 1.5 Billion mix of residential, retail, office and parkland– Tree-lined public streets, recreational trails, and accessible
waterfront parklands. – Model for the development of sustainable public infrastructure
for storm water management and energy conservation. – More than 5 million square feet of new development, including
residential, retail, and mixed-use buildings. – A 2-acre portion of the site will be set aside for development of
new healthcare facilities. – Neighborhood plazas and parks will provide central gathering
places.
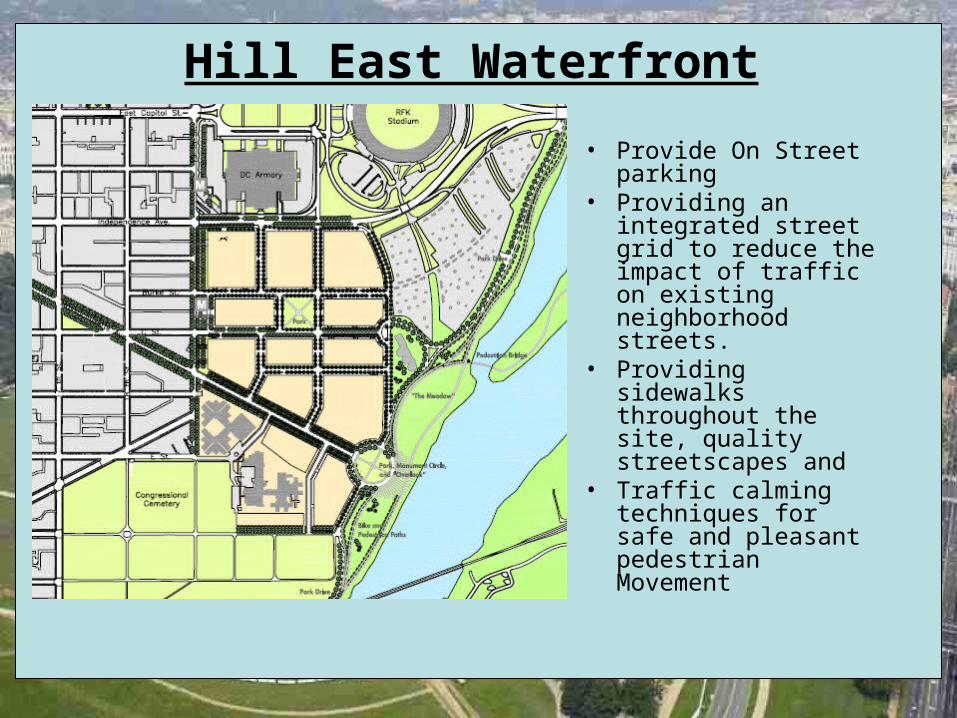
• Provide On Street parking
• Providing an integrated street grid to reduce the impact of traffic on existing neighborhood streets.
• Providing sidewalks throughout the site, quality streetscapes and
• Traffic calming techniques for safe and pleasant pedestrian Movement
Hill East Waterfront
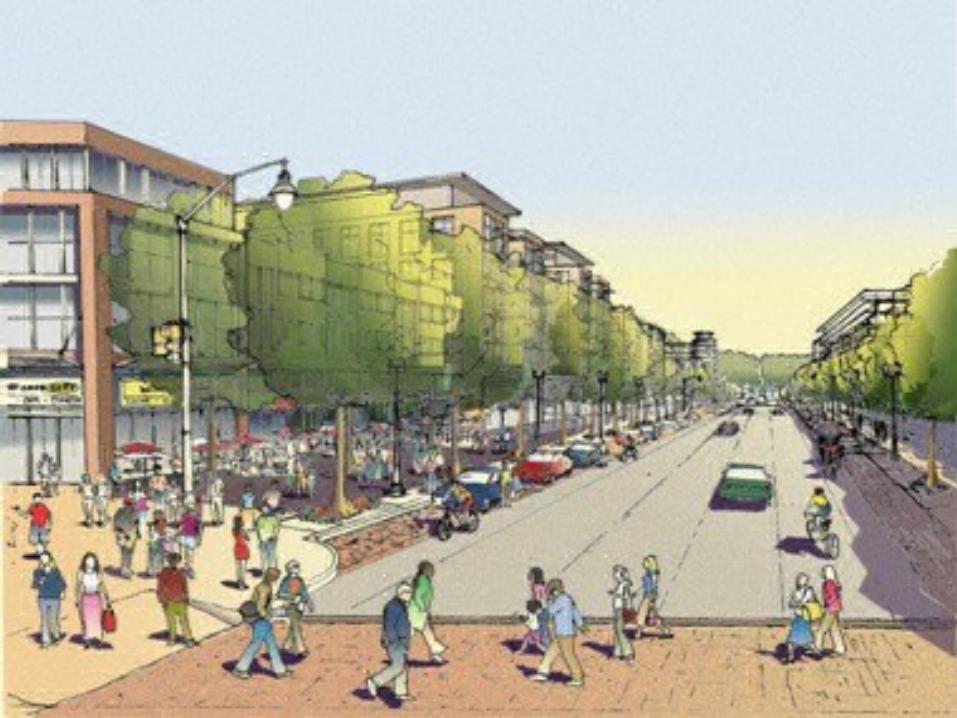
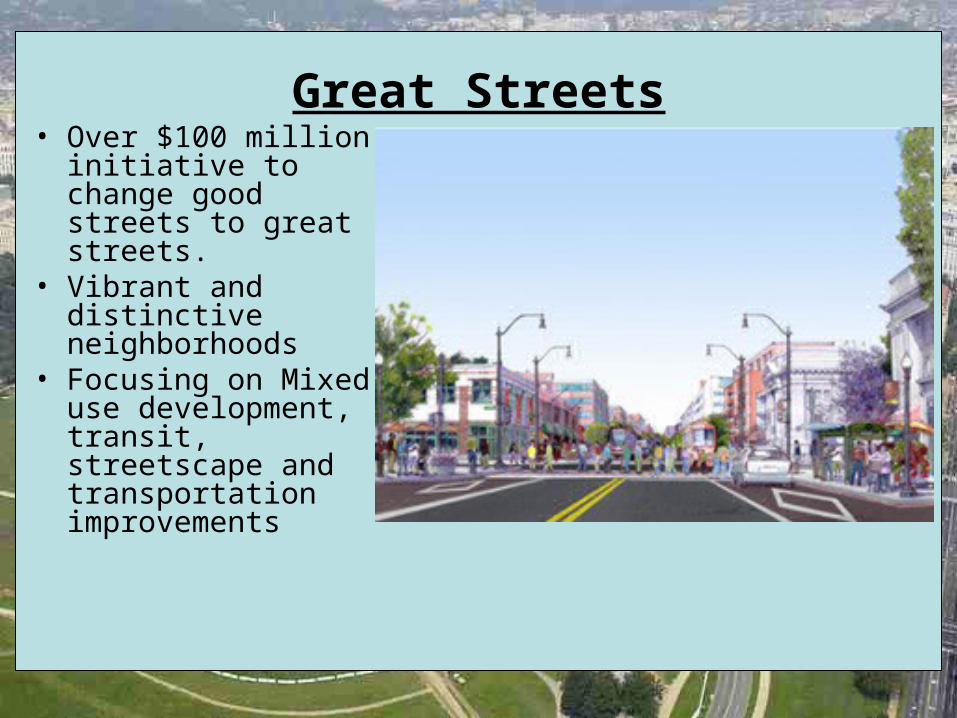
Great Streets• Over $100 million
initiative to change good streets to great streets.
• Vibrant and distinctive neighborhoods
• Focusing on Mixed use development, transit, streetscape and transportation improvements
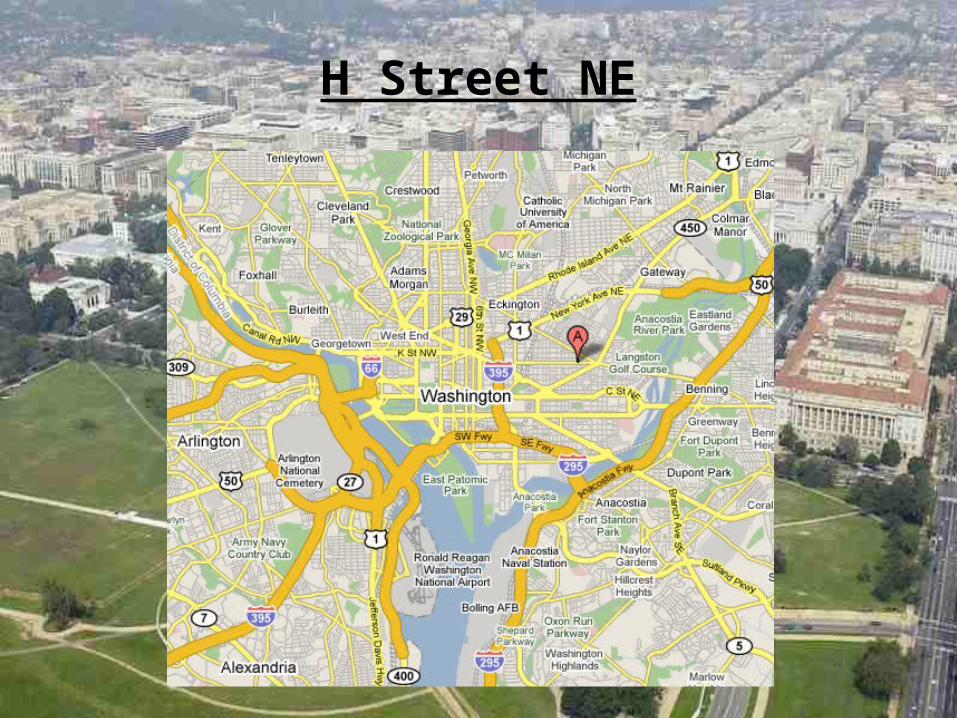
H Street NE
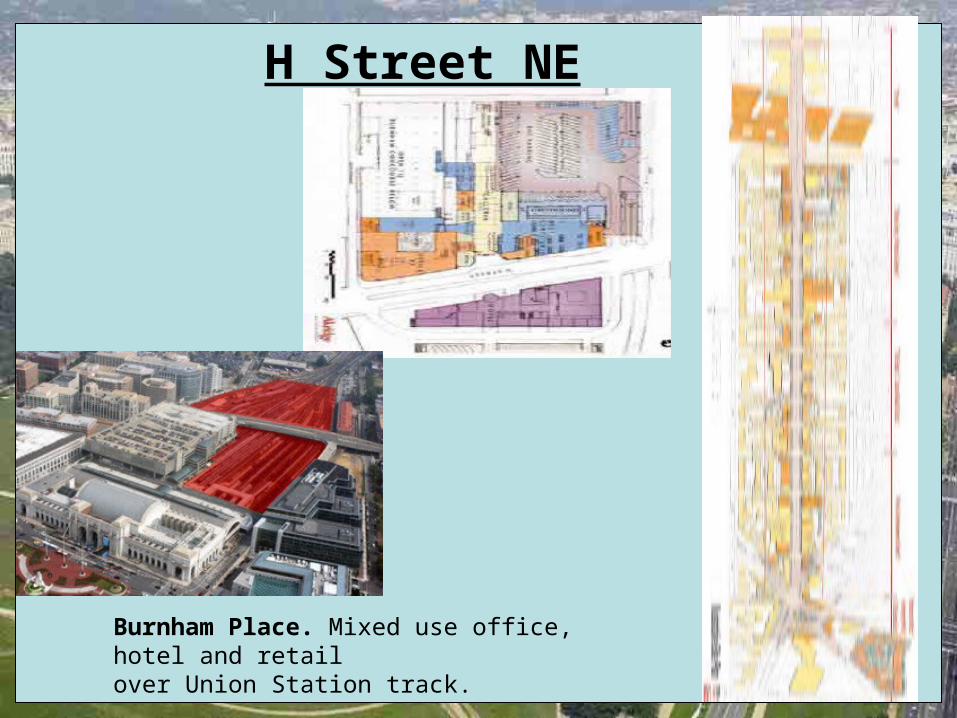
H Street NE
Burnham Place. Mixed use office, hotel and retailover Union Station track.

New bus shelters
• Part of Great streets initiative.
• 700 new shelters to be installed in the city.
Highways
• Eisenhower 1956 Interstate Highway Act
– Gas tax exclusive for highway construction
• Washington D.C. and Detroit went in two separate directions
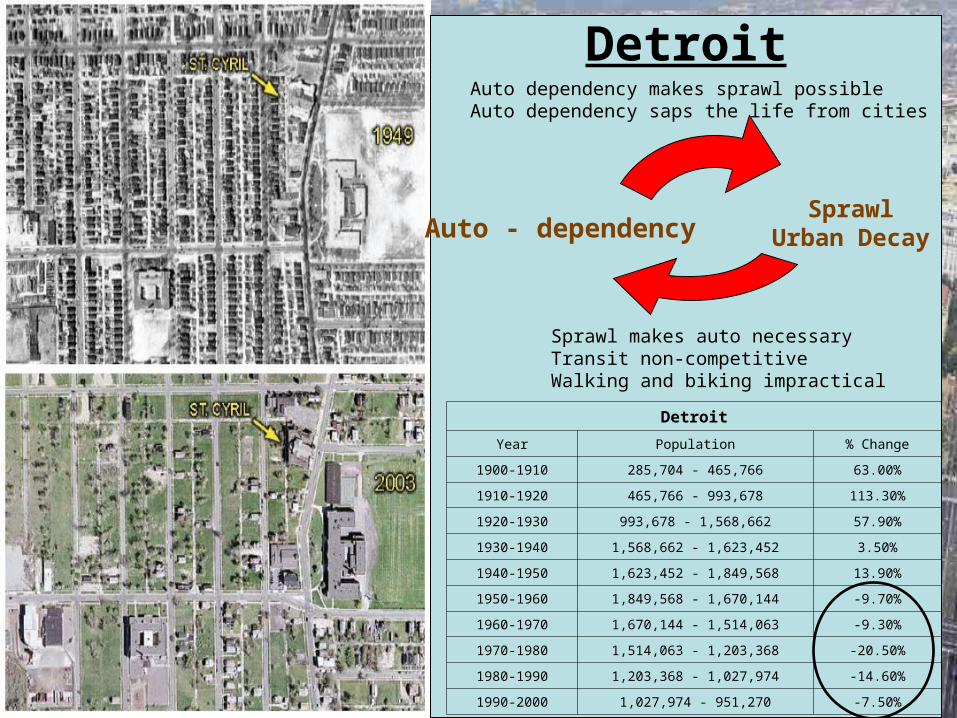
SprawlUrban DecayAuto - dependency
Auto dependency makes sprawl possibleAuto dependency saps the life from cities
Sprawl makes auto necessaryTransit non-competitiveWalking and biking impractical
Detroit
Detroit
Year Population % Change
1900-1910 285,704 - 465,766 63.00%
1910-1920 465,766 - 993,678 113.30%
1920-1930 993,678 - 1,568,662 57.90%
1930-1940 1,568,662 - 1,623,452 3.50%
1940-1950 1,623,452 - 1,849,568 13.90%
1950-1960 1,849,568 - 1,670,144 -9.70%
1960-1970 1,670,144 - 1,514,063 -9.30%
1970-1980 1,514,063 - 1,203,368 -20.50%
1980-1990 1,203,368 - 1,027,974 -14.60%
1990-2000 1,027,974 - 951,270 -7.50%
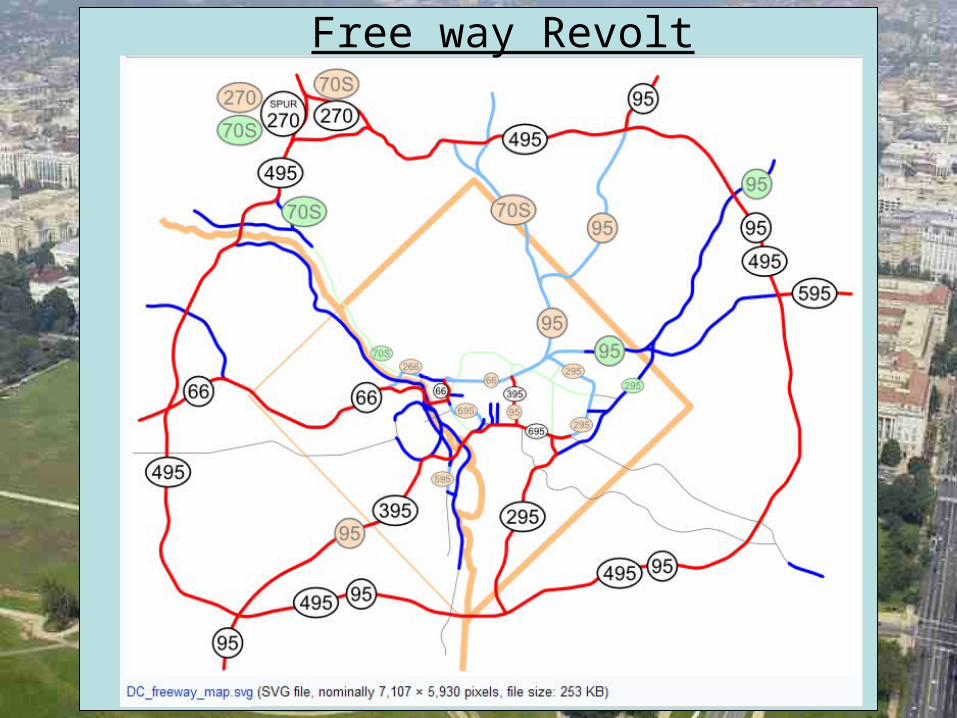
Free way Revolt

Strong, VibrantCommunities
Smart Transportation
Transit is form giver and rejuvenatorWalking and Biking add life and energy
Concentrated land use and attractive places: more access, more choices,more competitive transit, more people choose to walk and bike
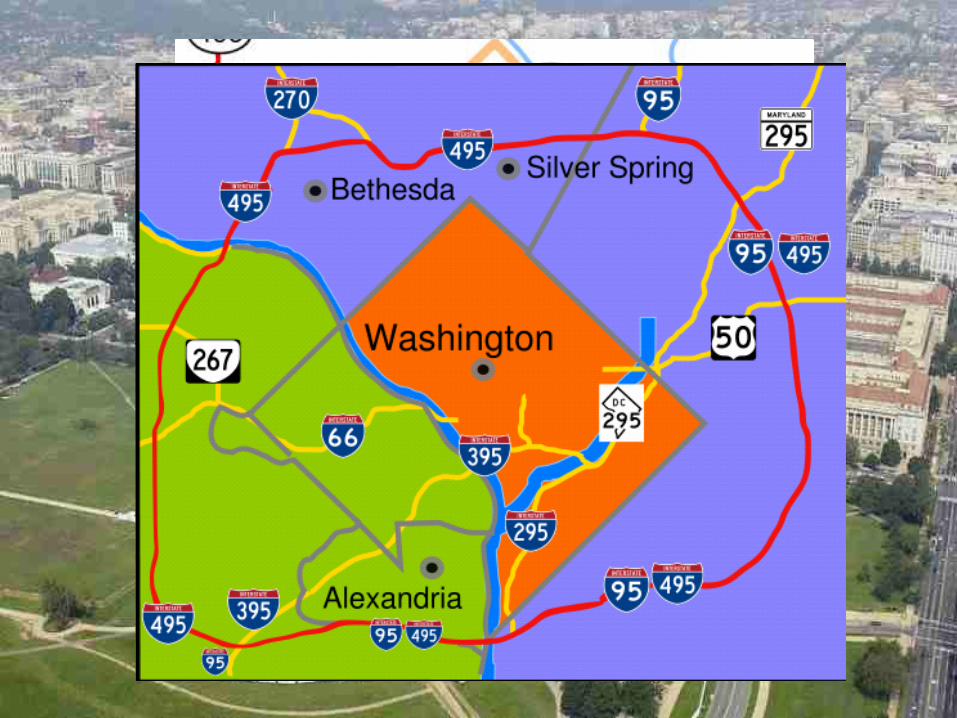
Washington DC
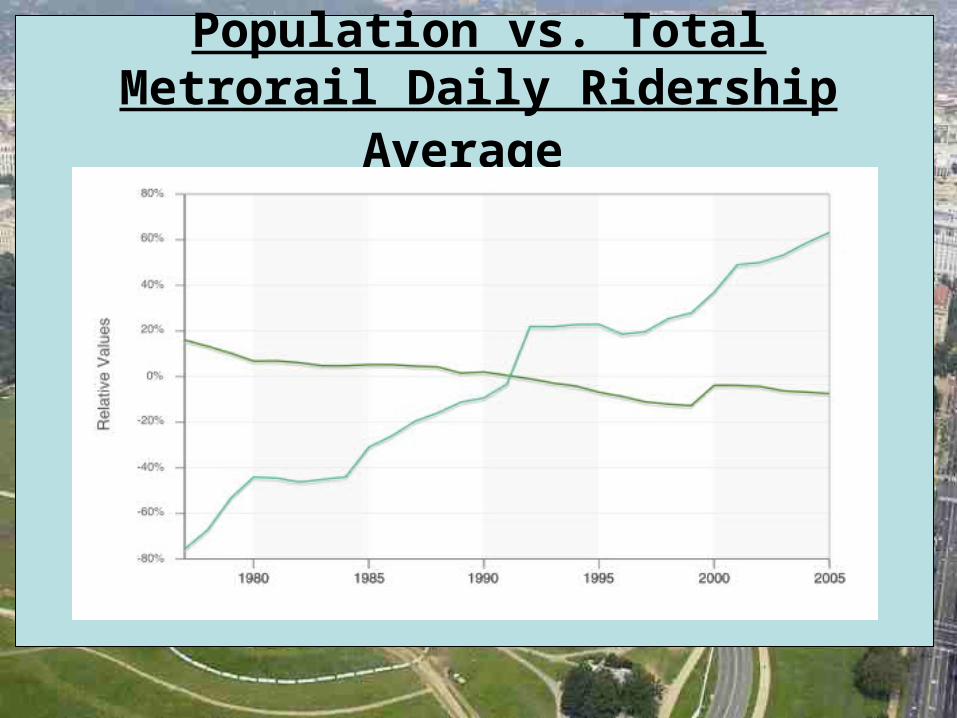
Population vs. Total Metrorail Daily Ridership Average

Population comparison
Population
0
500000
1000000
1500000
2000000
1800 1900 2000 2100
Year
WashingtonDC
Detroit
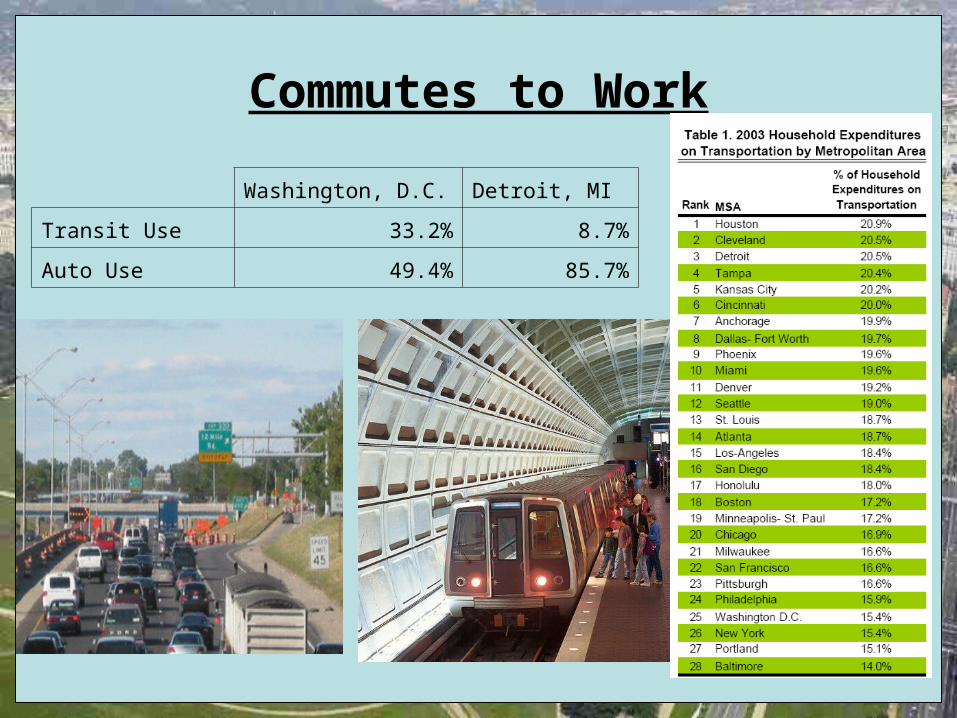
Commutes to Work
Washington, D.C. Detroit, MI
Transit Use 33.2% 8.7%
Auto Use 49.4% 85.7%

• Automobiles consume more energy than buses and trains
• Mass Transit safer than private automobiles.
• Gave priority to Metro by rejecting freeway plan for city– Receives 1.022 billion in local, state and federal
funding.– Collects 712 million in fares alone
Priority to Cleaner, Cheaper, More Efficient mode of Travel
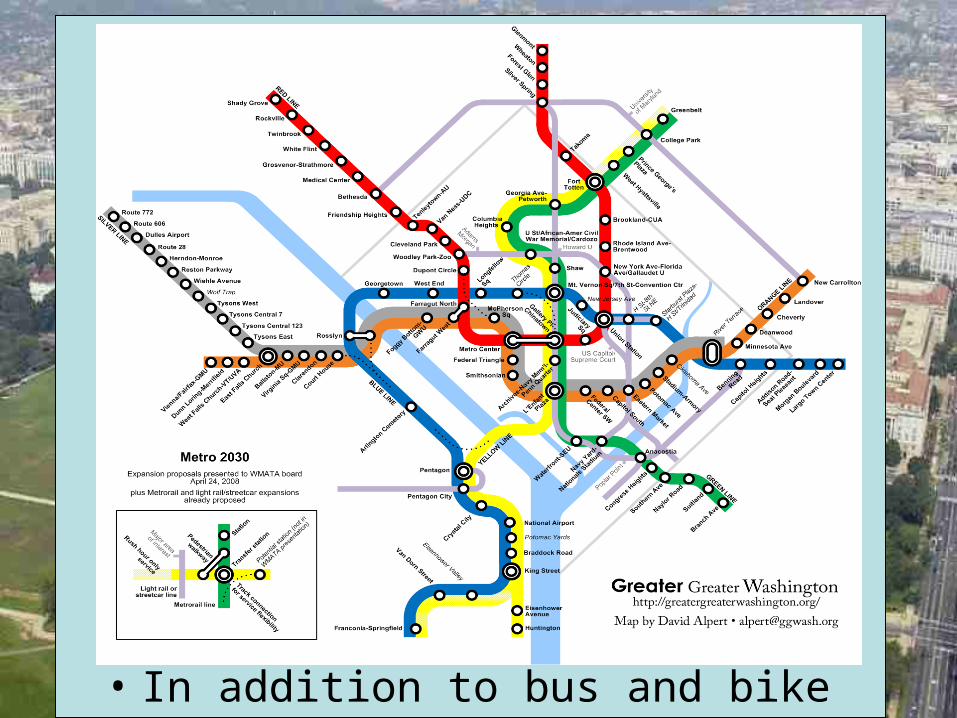
• In addition to bus and bike routes
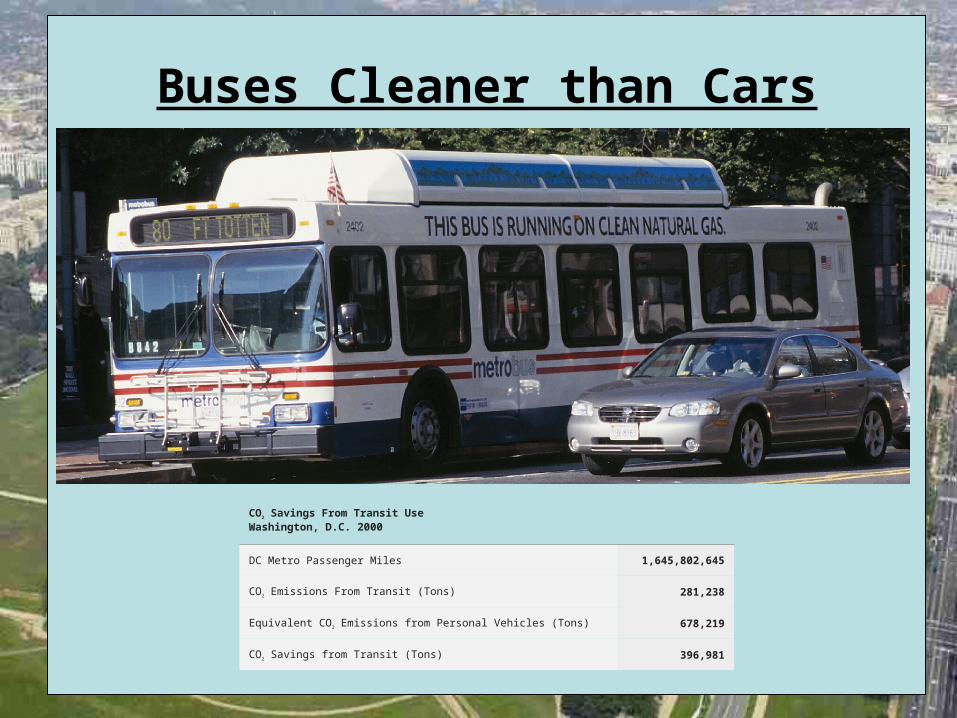
Buses Cleaner than Cars
CO2 Savings From Transit UseWashington, D.C. 2000
DC Metro Passenger Miles 1,645,802,645
CO2 Emissions From Transit (Tons) 281,238
Equivalent CO2 Emissions from Personal Vehicles (Tons) 678,219
CO2 Savings from Transit (Tons) 396,981
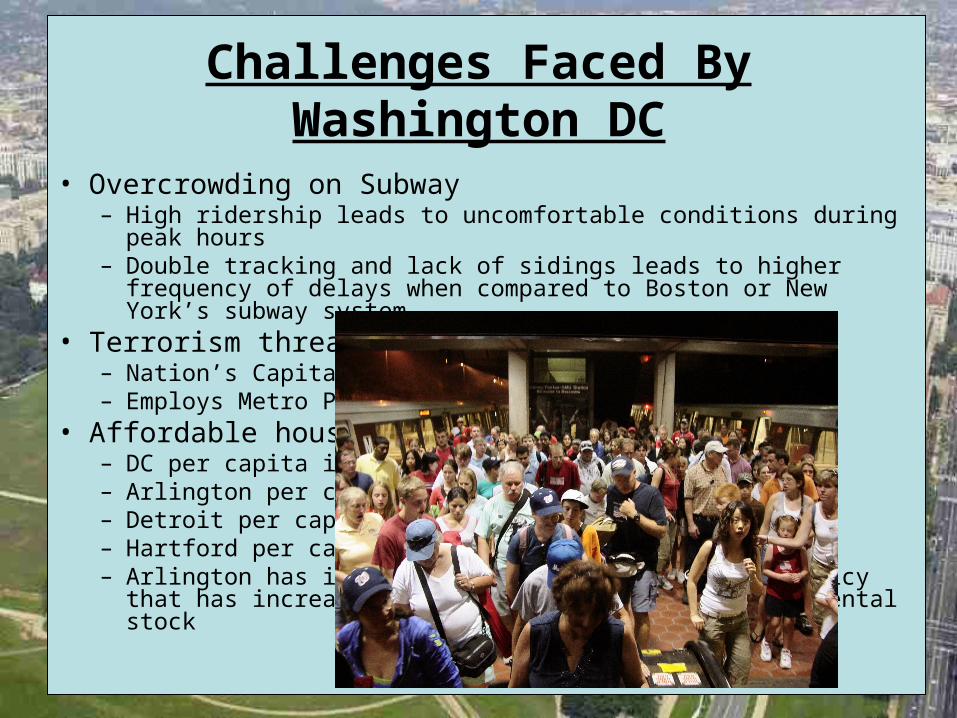
Challenges Faced By Washington DC
• Overcrowding on Subway– High ridership leads to uncomfortable conditions during peak hours– Double tracking and lack of sidings leads to higher frequency of delays
when compared to Boston or New York’s subway system• Terrorism threats
– Nation’s Capital is an obvious terrorist target– Employs Metro Police Department on Metro system
• Affordable housing– DC per capita income was $28,659– Arlington per capita income was $37,706– Detroit per capita income was $14,717– Hartford per capita income was $13,428– Arlington has instituted an affordable housing policy that has increased
the number of units to 14% of rental stock
Diversity of Transportation Modes
• Metro rail
• Metro bus
• DC Circulator
• Bike Rental programs
• Zip car / Flex car
• Plan to start integrating street cars in 2009.

Metrorail
• Five Lines consisting of 106 miles of track• Most of the stations located in DC• Various colleges have access to the metro.• Handicap riders have access with extra wide accessible
fare gates.
•Opens at 5:30 a.m. on weekdays and 7 a.m. weekends.•Closes at midnight Sunday through Thursday. •On Friday and Saturday nights, it stays open until 3 a. m.

Metro Bus
• Operates 24 hours a day 7 days a week• Stops at every Metrorail station.• Feeds into other local bus systems around the region. • All buses are either low floor ramp or lift-equipped. To serve handicap individuals• Priority seating for people with disabilities• Fares range from $1.25 to $2.50 with transfers for $.35.
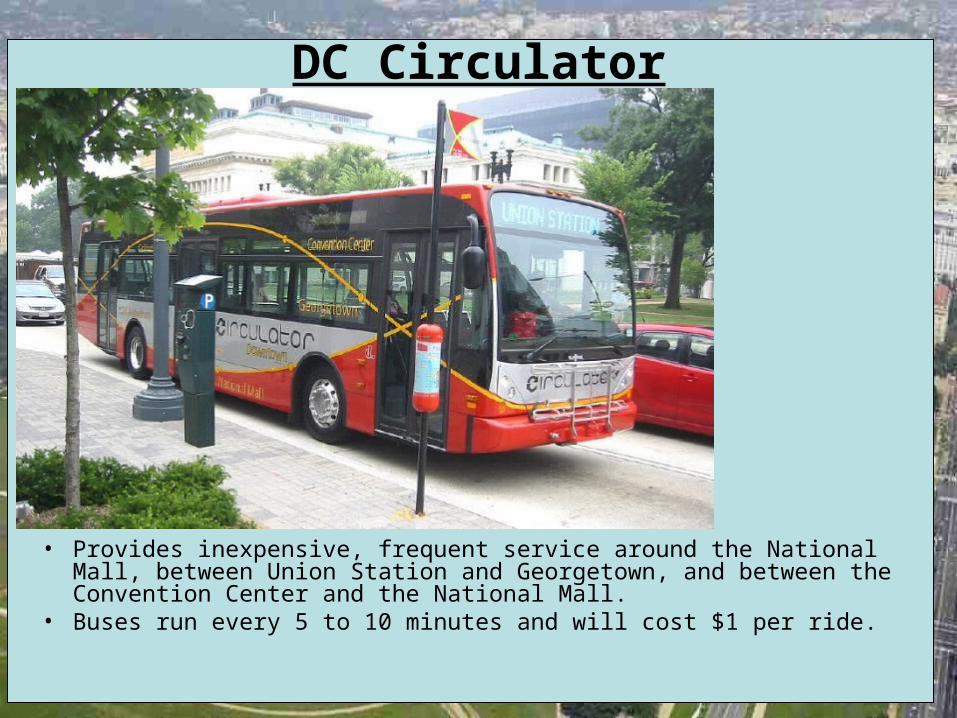
DC Circulator
• Provides inexpensive, frequent service around the National Mall, between Union Station and Georgetown, and between the Convention Center and the National Mall.
• Buses run every 5 to 10 minutes and will cost $1 per ride.
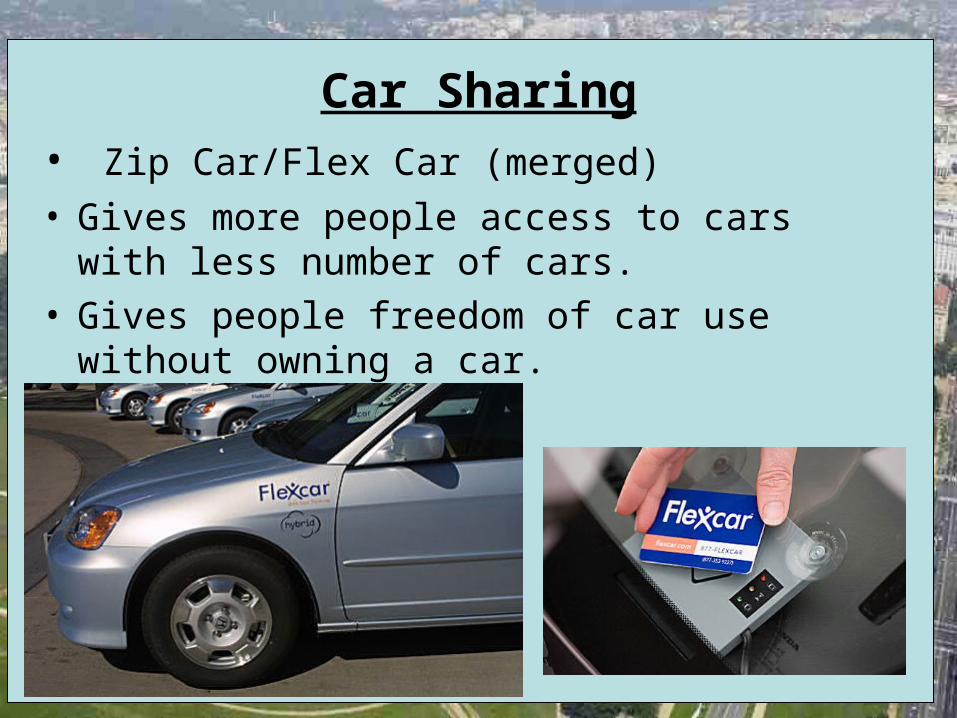
Car Sharing• Zip Car/Flex Car (merged)
• Gives more people access to cars with less number of cars.
• Gives people freedom of car use without owning a car.
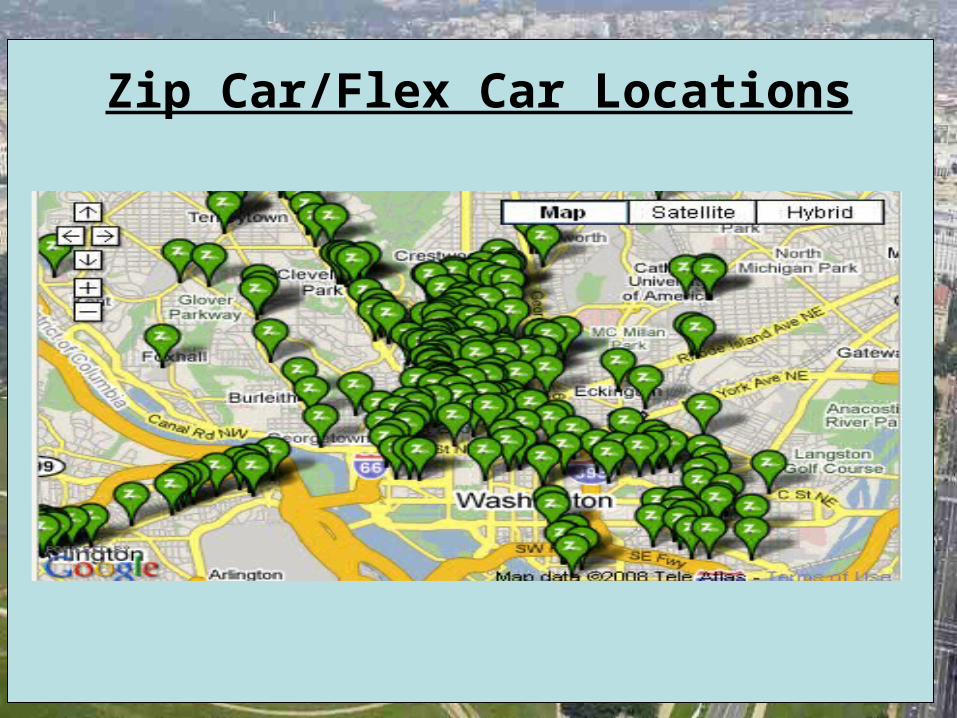
Zip Car/Flex Car Locations
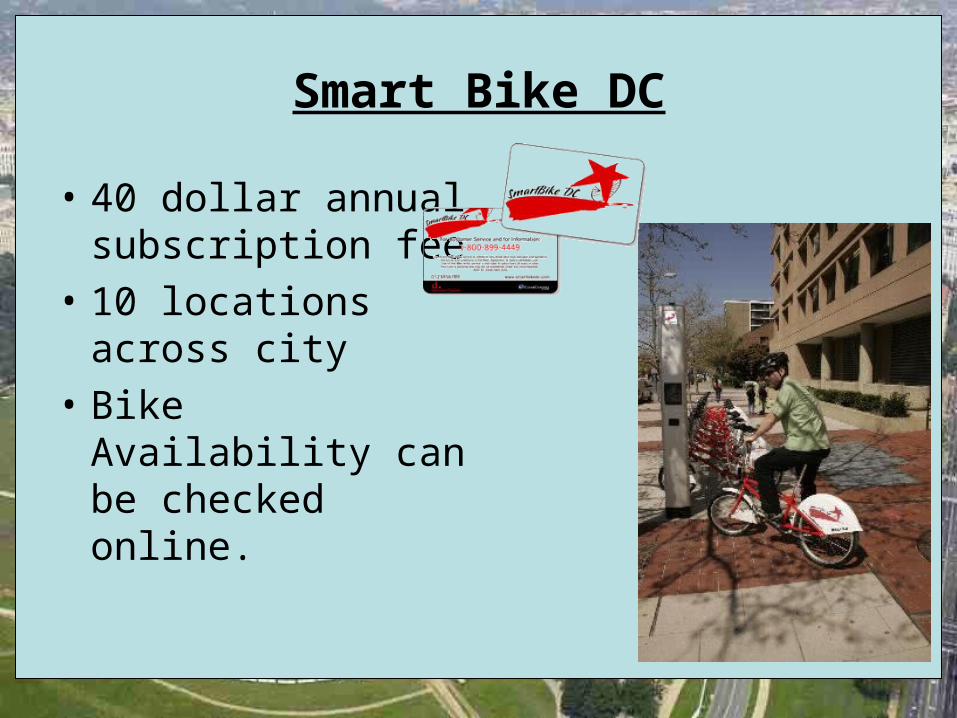
Smart Bike DC
• 40 dollar annual subscription fee
• 10 locations across city
• Bike Availability can be checked online.
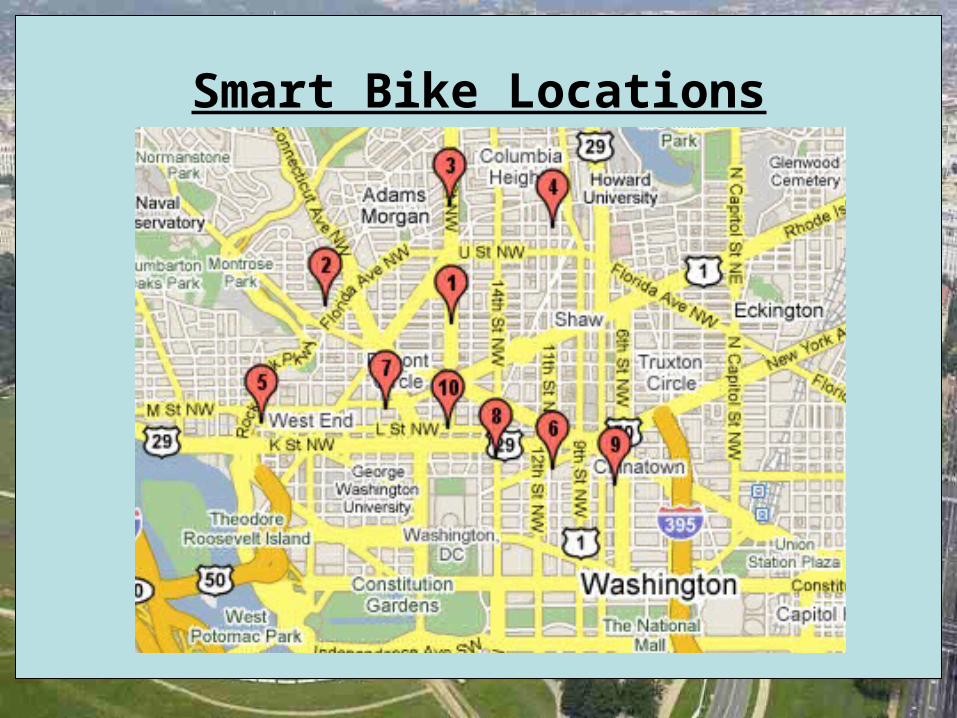
Smart Bike Locations
Successful Transportation System
• Land use
• Accessibility
• Street Structure
• Cheap and efficient
• Modes

Questions?