Washington Center forEquitable Growth Washington, DC...
76
1500 K Street NW, Suite 850 Washington, DC 20005 Kyle Herkenhoff Gordon Phillips Ethan Cohen-Cole http://equitablegrowth.org/working-papers/consumer-credit-access-impacts/ Washington Center for Equitable Growth Working paper series February 2017 © 2017 by Kyle Herkenhoff, Gordon Phillips, and Ethan Cohen-Cole. All rights reserved. Short sections of text, not to exceed two paragraphs, may be quoted without explicit permission provided that full credit, including © notice, is given to the source. The impact of consumer credit access on employment, earnings and entrepreneurship
Transcript of Washington Center forEquitable Growth Washington, DC...
1500 K Street NW, Suite 850 Washington, DC 20005
Kyle HerkenhoffGordon Phillips
Ethan Cohen-Cole
http://equitablegrowth.org/working-papers/consumer-credit-access-impacts/
Washington Center forEquitable Growth
Working paper series
February 2017
© 2017 by Kyle Herkenhoff, Gordon Phillips, and Ethan Cohen-Cole. All rights reserved. Short sections of text, not to exceed two paragraphs, may be quoted without explicit permission provided that full credit, including © notice, is given to the source.
The impact of consumer credit access on employment, earnings and entrepreneurship
The Impact of Consumer Credit Access on Employment, Earnings and Entrepreneurship Kyle Herkenhoff, Gordon Phillips, Ethan Cohen-Cole February 2017
Abstract How does consumer credit access impact job flows, earnings, and entrepreneurship? To answer this question, we build a new administrative dataset which links individual employment and entrepreneur tax records to TransUnion credit reports, and we exploit the discrete increase in consumer credit access following bankruptcy flag removal. After flag removal, individuals flow into self-employment. New entrants earn more, borrow significantly using unsecured and secured consumer credit, and are more likely to become an employer business. In addition, after flag removal, non-employed and self-employed individuals are more likely to find unemployment-insured “formal” jobs at larger firms that pay greater wages. These estimates imply that firms believe previously bankrupt workers are 3.8% less productive than non-bankrupt workers, on average. These results suggest that consumer credit access matters for each stage of entrepreneurship and that credit-checks may be limiting formal sector employment opportunities.
Kyle Herkenhoff Gordon Phillips University of Minnesota Dartmouth College Department of Economics Tuck School of Business [email protected] [email protected] Ethan Cohen-Cole Econ One Research [email protected] We are grateful for discussions with Naoki Aizawa, Carter Braxton, Ja- son Faberman, Andy Glover, Jonathan Heathcote, Loukas Karabarbounis, Miles Kimball, Javier Miranda, Fabrizio Perri, Ellen McGrattan, Anusha Nath, Ben Pugsley, Victor Rios-Rull, Sam Schulhofer-Wohl, Antionette Schoar, Nawid Siassi, Jialan Wang, Moto Yogo, and Owen Zidar. We thank seminar participants at Alberta, ASU, the Board of Governors, Konstanz SaM, Michigan, the Minneapolis Fed, U. of Missouri, Montreal, NBER-SI, PET, SAET, SED, UT Austin, UNC, and the WCEG. We thank Brian Littenberg and the Census for their hospitality and ongoing support. Herkenhoff and Phillips thank the Washington Center for Equitable Growth for generous funding. Cohen-Cole and Phillips thank the NSF (Grant No. 0965328) for funding and TransUnion for providing credit data. Any opinions and conclusions expressed herein are those of the author(s) and do not necessarily represent the views of the U.S. Census Bureau. All results have been reviewed to ensure that no confidential information is disclosed. This research uses data from the Census Bureau’s Longitudinal Employer Household Dynamics Program, which was partially supported by the following National Science Foundation Grants SES-9978093, SES-0339191 and ITR-0427889; National Institute on Aging Grant AG018854; and grants from the Alfred P. Sloan Foundation.
While much is known theoretically and empirically about the interaction between credit
constraints and startup rates (inter alia Cooley and Quadrini [2001], Hurst and Lusardi
[2004], Buera et al. [2009], Hurst and Pugsley [2011], Greenstone et al. [2014], Buera et al.
[2015]), little is known about the way access to consumer credit a↵ects individual job flows,
startup decisions, or subsequent earnings.1 How does consumer credit access a↵ect the
transition rate into and out of employment and self-employment? What are the consequences
of these transitions for labor earnings and business income?
The central issue with determining the causal impact of personal credit on employment
outcomes is that personal credit is highly correlated with an individual’s quality as well
as their wealth and access to funds. Thus, it is hard to separate out wealth e↵ects and
fundamental ability from access to credit. Our approach to this question is to examine
individuals after bankruptcy flags are removed from consumer credit reports, similar to
Musto [2004]. These removals occur, by law, no more than ten years after bankruptcy
and give rise to large increases in credit ratings, while not reflecting large changes in an
individual’s credit worthiness.
We use a standard di↵erence-in-di↵erence approach in which we compare cohorts of
bankrupt individuals whose flags are removed to adjacent cohorts of bankrupt individuals
whose flags are not yet removed. We apply this methodology to a new dataset which merges
millions of credit histories and self-employment tax records to administrative US Census
employment records. We show that consistent with prior studies such as Musto [2004],
access to credit increases dramatically among the subgroup of individuals who have their
bankruptcy flags removed. We show that these increases in credit access a↵ect an individual’s
employment outcomes and the likelihood of starting an employer firm. We then verify our
results in the Survey of Consumer Finances (SCF), a public cross-sectional survey.2
We frame the subsequent discussion in terms of two competing economic forces generated
by a bankruptcy flag removal: (i) the credit-access e↵ect: credit constraints loosen after
1The topic of startups and access to consumer credit has received much attention following the housingbust (inter alia Robb and Robinson [2012], Fairlie and Krashinsky [2012], Chatterji and Seamans [2012],Schmalz et al. [2013], Adelino et al. [2013], Jensen et al. [2014], Kerr et al. [2014]), however, only recently havestudies emerged which assess the impact of consumer credit on job flows and unemployment quantitatively,e.g. Athreya and Simpson [2006], Karahan and Rhee [2011], Midrigan and Philippon [2011], Chen [2012],Carroll et al. [2012] , Chen et al. [2013], Herkenho↵ [2013], Schott [2013], Kehoe et al. [2014] as well asempirically, e.g. Mian and Sufi [2012], Bethune [2015], Mehrotra and Sergeyev [2015], Herkenho↵ et al.[2015].
2See online appendix J for SCF comparison.
2
flag removal allowing individuals to start self-employed businesses or borrow to smooth
consumption while searching for an unemployment-insured (UI) job (we refer to UI jobs as
formal sector jobs, and non-UI jobs such as self-employment as informal sector jobs) (ii) the
credit-check e↵ect: individuals who were non-employed or self-employed subsequently find
jobs in the formal sector after flag removal. Our main contribution is to provide suggestive
evidence of these two economic forces as well as provide a complete picture of how the discrete
rise in consumer credit following bankruptcy flag removal a↵ects job flows, the transition
rate from non-employer to employer businesses, and earnings. Our approach is to build a set
of facts that when viewed together, provide consistent evidence that the credit-access and
credit-check e↵ects influence employment outcomes.
We first study self-employment, and we show that the self-employment rate does not
change among individuals whose bankruptcy flag is removed versus those whose flag is not
removed. However, the lack of movement in the self-employment rate masks o↵setting move-
ments in gross flows. Relative to the control group whose flags are not removed, those whose
flags are removed have both gross flows into self-employment increase by .16% per annum
and gross flows out of self-employment increase by about .17% per annum. As a result, these
flows o↵set and the stock remains constant.
Examining individuals who transition into self-employment, we show that cohorts who
transition into self-employment after a bankruptcy flag removal borrow $15k more than
cohorts who transition into self-employment prior to flag removal. This represents a 12.4%
increase in borrowing relative to the sample average.3 They borrow mainly in the form of
mortgages, HELOCs and credit cards, and they earn ⇠$1k more Schedule C net income
at any time horizon we observe (an increase of about 4% relative to the sample average).4
They are also more likely to enter capital intensive industries such as manufacturing and
industries with high external finance needs.
We then use the new Integrated Longitudinal Business Database (LBD) to measure
transitions from self-employment to employer firms. Those who enter self-employment after
bankruptcy flag removal are .7% more likely to own an employer firm in the LBD compared
to those who enter self-employment before bankruptcy flag removal. This represents a 200%
increase over the sample average LBD firm ownership rate. Among those who own an
3The average total balance across all forms of credit one year prior to removal is $121k in our sample.4Relative to national averages, this is still a 2.2% treatment e↵ect. The median self-employment income
is $45,000 and calculated as the pooled average of all heads of household who have positive self-employmentincome from the 1998 SCF through the 2010 SCF, weighted.
3
employer firm in the LBD, they borrow on average $40k more after flag drop, a 33% gain
relative to the sample average.
We take this set of facts – (a) increased flow rates into self-employment, (b) the fact
that they flow into capital intensive industries and industries with high external finance
needs, (c) disproportionate borrowing by new self-employed entrants relative to other job-
transitioners, (d) the increased likelihood of starting an employer business, and (e) the large
amount borrowed by new employer businesses – as strong evidence of the credit-access e↵ect.
We then examine formal sector job flows (i.e. flows into and out of jobs that are
unemployment-insured (UI)) which we use to measure the credit-check e↵ect. We find that
the formal-sector employment rate of individuals whose bankruptcy flags are removed in-
creases by .32% relative to those whose flags remain on their record. Measured relative to
the control group, gross flows into the formal sector increase by .24% per annum. While
average earnings of formally employed workers remains constant around flag removal, we
find that those who make the transition into formal employment following a bankruptcy
flag removal earn $1.8k more per annum relative to individuals who transition into formal
sector employment prior to flag removal. This earnings gain represents an increase of over
4.3% relative to the sample average. What is striking is that conditional on flowing into
the formal sector after flag removal, individuals are 1.5% more likely to work for large firms
(1000+ employees) and less likely to subsequently exit the formal sector to non-employment
or self-employment. In other words, those who get jobs after the flag removal are not ‘bad’
workers.
While evidence on firm size and credit checks is scarce, Society for Human Resource Man-
agement [2012b] report that 45% of large firms (2,500 to 24,999 employees) conduct credit
checks versus 25% of small firms (100 to 499 employees).5 The fact that workers dispro-
portionately flow into larger firms following flag removal provides one piece of suggestive
evidence that credit-checks may have previously prevented these individuals from obtaining
jobs at those firms.
One potential criticism of inferring the credit-check e↵ect from the employer size result
is that it is also consistent with individuals using consumer credit to smooth consumption
while searching for higher paying jobs at larger and more productive firms. In particular,
5They do not report other size intervals. In terms of background checks, existing evidence from the UK(e.g. Zibarras and Woods [2010]) and US (e.g. Society for Human Resource Management [2012a]) indicatesthat small firms are much less likely to conduct background checks.
4
recent work by Herkenho↵ et al. [2015] shows that displaced workers borrow and take longer
to find a job if they have more credit access. In the current sample, which includes few
displaced workers, those who find a new formal job do not increase borrowing. This lack
of borrowing for our non-displaced workers rules out the explanation that workers are using
increased credit to search for a new job at larger firms that pay greater wages.
As Chen et al. [2013] discuss, 60% of employers conduct credit checks and the main
reason they do so is to reduce theft. Furthermore, Society for Human Resource Management
[2012b] report that among employers who conduct credit checks, 91% of the time they do
so for “job candidates for positions with fiduciary and financial responsibility (e.g., handling
cash, banking, accounting, compliance, technology).” As an additional test of the credit-
check hypothesis, we further stratify job flows by industry, and we show that workers are
more likely to find jobs in the retail and service sectors, which disproportionately involve
handling payments and the use of cash registers, after bankruptcy flag removal. We find
weaker e↵ects in sectors such as transport/communications and manufacturing, which are
less likely to involve jobs which require handling payments.
Since we do not directly observe credit checks, our findings can only be viewed as sug-
gestive evidence that credit checks limit job opportunities for bankrupt workers. But, at
the bare minimum, we take our results – (a) increased flow rates into formal-employment,
(b) increased flow rates into large employers, (c) increased flow rates into jobs that involve
handling of cash payments, (d) lack of borrowing by job finders – as evidence that is broadly
consistent with concurrent and independent regional studies by Shoag and Cli↵ord [2016]
and Cortes et al. [2016] which have demonstrated that credit checks may limit employment
opportunities for certain subgroups of individuals.
In terms of policy implications, we use our point estimates to provide an estimate of the
costs of banning employer credit checks. We calibrate a directed search model using our
empirical estimates, and we show that firms, ex-post, would be willing to pay approximately
$17.6k in net present value to be able to decipher between a potential hire who has a
bankruptcy record versus a potential hire with no bankruptcy record. What drives this result
is the large di↵erence in wage payments between newly hired bankrupt and non-bankrupt
workers, which can be used to back-out that firms believe bankrupt workers are 3.8% less
productive than non-bankrupt workers. This implies that banning credit checks of potential
hires, as many states have done (e.g. Cortes et al. [2016] and Shoag and Cli↵ord [2016]), may
be costly to firms, ex-post. Our empirical estimates also provide the first set of moments for
5
a growing class of quantitative models which study the normative implications of personal
bankruptcy policy on entrepreneurship (e.g. Glover and Short [2010], Akyol and Athreya
[2011], Blanco and Navarro [2014]) and household labor supply decisions (Chatterjee et al.
[2007] and Livshits et al. [2007b]), as well as theories that focus on credit constraints and
subsistence entrepreneurship (e.g. Donovan et al. [2014] and Dinlersoz et al. [2015]).
Our paper contributes to several literatures, including the theoretical and empirical liter-
ature on credit constraints and startup rates, cited on the first page of the introduction. Of
particular note is the concurrent, independent, and innovative work by Bos et al. [2015] and
Dobbie et al. [2016]. Bos et al. [2015] focus on the way delinquencies, i.e. skipped payments
as opposed to debt discharge, a↵ect earnings and self-employment in Sweden. Bos et al.
[2015] show that individuals whose past defaults are publicly available for longer are less
likely to have a job, are more likely to be self-employed and earn lower incomes on average.
They do not focus on transitions into and out of self- and formal-employment.
Dobbie et al. [2016] merge bankruptcy court records with SSA administrative earnings
and study the impact of bankruptcy flag removal on the stock of formal employment and
self-employment as well as earnings. Dobbie et al. [2016] find insignificant impacts of flag
removal across most of their specifications, but, where our papers overlap, our point estimates
fall within their confidence intervals. One key advantage of our dataset is that we observe
credit bureau records, and so we have little measurement error because we see the actual
date bankruptcy flags are removed from credit reports, whereas Dobbie et al. [2016] must
infer removal of bankruptcy flags from court filing records.
Relative to Bos et al. [2015], Dobbie et al. [2016], and the existing literature, to our
knowledge, we are the first to measure gross employment transitions into and out of self-
and formal-employment in response to Chapter 7 and Chapter 13 bankruptcy flag removals,
and we are the first, to our knowledge, to measure the causal impact of consumer credit
access, inclusive of both unsecured and mortgage credit, on the rate at which individuals
move from being a non-employer to employer business. Since we are the first to merge credit
reports with LBD firm ownership records, we also provide the most complete characterization
of the consumer-credit choices of these new entrants (which we believe to be an advance over
survey data which often aggregates or does not measure all sources of consumer credit, e.g.
Census CBO/SBO and SCF – an exception is Robb and Robinson [2012] who conducted a
detailed survey of business financing sources).
6
We also build on the recent literature which studies bankruptcy institutions and labor
supply (e.g. Livshits et al. [2007a], Han and Li [2007], Chen [2012], Chatterjee and Gordon
[2012], Herkenho↵ and Ohanian [2012], Dobbie and Song [2013], Athreya et al. [2014]) as
well as the impact of credit information structures on employment (Chatterjee et al. [2008],
Athreya et al. [2012], Chen et al. [2013], and Corbae and Glover [2015]). In particular, Chen
et al. [2013] develop a model in which credit scores reveal information about the productivity
of a worker, leading employers to discriminate based on credit scores. Our empirical findings
are consistent with this mechanism.
The paper proceeds as follows. Section 1 describes the institutional background. Section
2 summarizes the data and our empirical approach. Section 3 presents the baseline ‘stock’
or ‘level’ results. Section 4 analyzes self-employed transitioners and LBD firm owners, and
Section 5 analyzes those who obtain a job in the formal sector. Section 6 presents a sim-
ple model that uses our point estimates to calculate firms’ beliefs about bankrupt workers
productivity, and Section 7 concludes.
1 Institutional Background
Our discussion of the bankruptcy institutions in the United States is abbreviated and based
largely on the discussion by Han and Li [2007], Li and White [2009], and Han and Li [2011].
There are two main types of bankruptcy filings in the United States, Chapter 7 (liquidation)
and Chapter 13 (repayment plan), however we are unable to di↵erentiate between the two
in our dataset. As Han and Li [2007] discuss, more than 70% of bankruptcy filings in the
US are Chapter 7 filings, and of those filings that initially begin as Chapter 13 filings, many
are subsequently converted into Chapter 7 filings.6 As Han and Li [2011] explain, the Fair
Credit Reporting Act (FCRA) and the original Bankruptcy Code itself largely govern how
bankruptcy filings appear on a credit report. Chapter 7 bankruptcy information is removed
up to 10 years after the date of filing, whereas Chapter 13 is removed up to 7 years after
filing.7 What is important for the purpose of our regression design is that the removal of the
6In short, Chapter 7 involves the liquidation of an individual’s assets and the discharge of certain debts(student debt for instance cannot be discharged, and home equity is often protected up to a state-specificlimit, and so we include individual fixed e↵ects to absorb this variation), whereas Chapter 13 is essentiallya repayment plan and it allows individuals to repay all or part of their debts. See Li and White [2009] fordiscussion of the way repayments are used strategically to save one’s home.
7Quoting from Han and Li [2011]: “The FCRA states: ‘605 (a) Information excluded from consumerreports. (1) Cases under title 11 [United States Code] or under the Bankruptcy Act that, from the date of
7
bankruptcy flag is statutory and follows a cuto↵ rule.
2 Data Description and Empirical Approach
Our data on unemployment-insured (UI) jobs (or formal sector jobs) comes from the Longitudinal-
Employer Household Dynamics (LEHD) database. The LEHD, which is a matched employer-
employee dataset that covers 95% of U.S. private sector jobs, includes information on worker
flows between UI jobs as well as quarterly earnings.8 Our employment and earnings data
span from 1995 (or 1998 in some cases) to 2008 for 11 states: California, Maryland, Illinois,
Texas, Indiana, Nevada, New Jersey, Oregon, Rhode Island, Virginia, and Washington.
Our self-employment and firm-ownership measures are derived from the Integrated Longi-
tudinal Business Database (ILBD). This database integrates self-employment records (iden-
tified by a unique scrambled version of their social security number) with the employer-
firms that are subsequently created and owned by the same individuals. We use the non-
employer/employer links built in the path-breaking work of Davis et al. [2007], but, for
the sake of self-containment, in online appendix A we briefly describe the way the non-
employer/employer universes were linked. The self-employment income comes from the uni-
verse of Schedule C tax records for sole-proprietors across all U.S. states. We therefore have
net self-employment income annually from 1998-2010, as well as indicators of whether or not
the self-employed individual began employing others.
All consumer credit information is taken from TransUnion at an annual frequency from
2001 to 2010. TransUnion is one of the three largest credit scoring companies in the United
States, and it has a similar market share to Equifax and Experian. Our main sample is an
approximately 5% random sample of individuals with credit reports from the 11 states for
which we have LEHD data. The TransUnion data is then merged based on an anonymized
unique identifier to the LEHD. Our data includes information on the balance, limit, and
status (delinquent, current, etc.) of di↵erent classes of accounts held by individuals. Our
entry of the order for relief or the date of adjudication, as the case may be, antedate the report by morethan 10 years’; and ‘(5) Any other adverse item of information, other than records of convictions of crimeswhich antedates the report by more than seven years.’ The FCRA has no rule on the minimum periodof time that credit bureaus have to report a bankruptcy filing. Indeed, it is common that credit bureausremove a Chapter 13 bankruptcy record from a credit report after only seven years. Also, the Act has notime restrictions on using the bankruptcy record that is maintained in the creditors proprietary database.”
8See Abowd et al. [2009] for an extensive description of the LEHD.
8
credit data is measured as of September in each year, so there are instances in which flags
are removed in October, November, or December of the prior year (i.e. prior fiscal year
ending Dec. 31 through which we measure earnings and self-employment earnings), but the
flag removal is classified as a removal only in the following year. In online appendix I, we
attempt to capture these early transitions by using beginning-of-year employment (e.g. if an
individual earned $1k last year and $1k this year, then they were employed at the beginning
of the year, and they transited at some point in the prior year). Under these alternate
beginning-of-year definitions of employment and self-employment, our main results persist.
Each database contains the same anonymized unique identifiers that can be used to link
the datasets together. Our resulting panel is unbalanced and contains earnings (1998-2008),
self-employment income (1998-2010), and credit reports (2001-2010) at an annual frequency.
2.1 Empirical Approach
Our empirical strategy is to compare previously bankrupt individuals before and after their
bankruptcy flag removal to a subset of individuals whose flags are removed later in the
sample, i.e. we implement a di↵erence-in-di↵erence analysis. In particular, our sample
window is 2001-20079 and we always restrict our attention to 24-65 year olds.10 Even though
our sample window stops in 2007, our credit data allows us to identify flag removals between
2002 and 2010. We include all flag removal cohorts in our analysis.
Let i index individuals and t index years (from 2001 to 2007). Let ↵
i
denote a set of
individual fixed e↵ects, and �
t
denote year dummies. Let Yi,t
denote the outcome of interest
(a self employment dummy, earnings, wages, etc.). Let D
x,i,t
be a dummy variable taking
the value 1 when an individual is x periods before (if x is negative) or after (if x is positive)
flag removal. E.g. D�2,i,t is a dummy indicating if an individual is 2 periods before flag
removal, likewise D0,i,t takes a value of 1 if the individual is in the year of flag removal, and
D1+,i,t
takes a value of 1 if the treated individual is 1 or more years past flag removal. The
9Since we use several forward lags of variables, we cannot include 2008 in our sample window. However,our 2007 variables that are forward looking are using 2008 data.
10We do note that while our time period includes individuals whose flags are removed before and afterthe bankruptcy reform act of 2005, our research design is una↵ected since everyone in our sample previouslyfiled bankruptcy before 2005. In online appendix I we limit the sample window to 2001-2005, and we usealternate variable definitions. See Albanesi and Nosal [2015] for more analysis of the how the reform a↵ectednew delinquency behavior.
9
specifications we use are of the following form:
Y
i,t
= ↵
i
+ �
t
+ ��2D�2,i,t + ��1D�1,i,t + �0D0,i,t + �1+D1+,i,t
+ �Xi,t
+ ✏
i,t
(1)
The objects of interest are �0 and �1+ which summarize the impact of flag removal on the
outcome variable in the year of removal as well as subsequent years, respectively. To check
whether our point estimates are valid, we show that the treatment and control group have
parallel trends prior to flag removal, (i.e. ��2 and ��1 are not statistically di↵erent from
zero).
2.2 Variable Definitions
All nominal variables such as labor earnings, credit balance, and self-employed net income
are deflated by the CPI (expressed in 2008 dollars), and we winsorize the top 1% of each
continuous variable, except variables pertaining to the LBD (since fewer than 1% of our
sample has admissible values).
We define an individual to be self-employed in a given year if they earn at least $1k
of real Schedule C net income throughout the year, and we define an individual to be for-
mally employed if they earn at least $1k of real labor earnings throughout the year in an
unemployment-insured job. Transitions are defined at an annual frequency, e.g. an indi-
vidual is counted as transitioning into self-employment if they earn less than $1k of real
Schedule C net income in the prior year and then earn at least that much in the current
year.
An individual is counted as owning a firm in the LBD if their social security number
or any other comparable identifier is linked to the ownership of an LBD firm.11 We define
two measures of LBD firm ownership, the first of which only requires one year of ownership
and includes potentially transitory businesses. Our second definition is more stringent and
requires at least two years of ownership.
A new job accession occurs if the individual begins working at an employer that they
11Links are made to firmids, which refer to firms, not establishments. See online appendix A and Daviset al. [2007] for more details on the links. The 1+ years ownership equals one if the individual has a valid‘firmid’ in that year. The 2+ years ownership equal one if the individual has a valid ‘firmid’ for at least twoyears in a row.
10
previously have not worked for in our sample period.12 Individuals may have multiple job
accessions in a given year, and some job accessions may not necessary result in a separation
from a prior employer (in the case of holding two jobs). Employer measures of size are taken
as the monthly average of 4th quarter employment.
Rather than using a traditional credit risk score, we use the TransUnion bankruptcy
score which is designed to be a measure of bankruptcy propensity. The bankruptcy score
lies between 0 and 1000 and higher scores reveal lower odds of bankruptcy. Bankruptcy
scores are used only by more sophisticated lenders, and when they are used, they are used
in conjunction with a traditional credit risk score. The Revolving Balance variable includes
any type of credit that can be rolled over at a preset interest rate (this includes bankcards,
revolving personal finance loans, and other revolving lines of credit). The combined sum
of Home Equity Lines of Credit (HELOCs) are included in the HELOC Balance variable.
Traditional unsecured credit cards that are issued by banks are included in the Bankcard
Balance variable.
2.3 Summary Statistics
Table 1 compares the mean values of our main variables of interest one year before bankruptcy
flag removal to one year after bankruptcy flag removal.13 This section is designed to provide
raw averages of important variables and summarize broad changes in those variables. In
the sections that follow, we will address compositional issues by including fixed e↵ects and
dynamic controls in all regressions.
Panel (A) of Table 1 describes the main ‘stock’ (or ‘level’) variables. If we define formal
and self employment based on a $1,000 dollar earnings threshold, Column (1) of Table 1 shows
that 78.7% of individuals are formally employed and 9.0% of individuals are self-employed
one year before bankruptcy flag removal. Following flag removal, Column (2) shows that
the formal-employment rate decreases by .1% to 78.6%, whereas the self-employment rate
12We use an end-of-quarter accession definition (Abowd et al. [2009]) that requires the individual to earnat least $500 dollars from the new employer in two consecutive quarters.
13The 2006 and 2007 flag removal cohorts are not in our sample one year after their flag removal, but theyare still used as controls. Therefore, the two sample sizes di↵er by 60k, where 60k is the combined numberof individuals in the 2006 and 2007 cohorts. Likewise, the 2009 cohort and 2010 cohorts (approximately 50kindividuals) will never be in our sample one year before or after their flag removal. But they are still usedas controls in the main tables. So while the total number of individuals in our sample frame is 220k, only170k reach one year before flag removal, and only 110k reach one year after flag removal.
11
increases by .6% to 9.6%. Column (4) shows that the change in self-employment is significant
at the 10% level while the change in formal-employment is not.
Roughly 6.1% of individuals in our sample are simultaneously formally-employed and
self-employed (SE), and roughly 18.4% of the individuals in our sample are non-employed.
Following flag removal, the fraction who hold two jobs increases significantly, whereas non-
employment moves insignificantly. Prior to flag removal, .4% of our sample own a firm in the
LBD for 1+ years, whereas .2% of our sample own a firm in the LBD for 2+ years. Following
flag removal, we see a significant increase in the latter definition of LBD firm ownership by
.1%. In terms of employer characteristics, roughly 1/3 of our workers are employed at large
firms with 500+ employees, and this fraction increases significantly following flag removal.
Panel (B) of Table 1 describes the main flow variables. Approximately 4.6% of individuals
transit into formal-employment in the year before flag removal, whereas 4.4% of individuals
transit out of formal-employment. In both instances, there is an insignificant change in
flows following flag removal. Prior to flag removal, 3.1% of individuals transition into self-
employment whereas 2.8% transition out of self-employment. In the year after flag removal,
the transition rate into self-employment increases by .3% per annum to 3.4%, which is
significant at the 10% level.
Panel (C) of Table 1 describes the main earnings variables. Per capita labor income in
the sample is $32,683. Following flag removal, real annual labor income increases by $300,
and this is a significant change. If we adjust for the fact that some individuals are not
working, annual labor earnings per worker is approximately $41,529 (=$32,683/.787). Per
capita self-employment income is about $2,140 per annum. If we adjust for the fact that
most individuals are not self-employed, annual self-employed net income per self-employed
individual is $23,778 (=$2,140/.09). Following flag removal, self-employed net income per
capita increases by $161. Real annual total income is the sum of both self-employed (SE)
net income and labor (non-SE) earnings.
Panel (D) of Table 1 describes the main credit variables. We see large credit balances
prior to flag removal since the individuals have a partial recovery in credit access before their
flag is removed (for more discussion, see Cohen-Cole et al. [2009]). Following flag removal,
however, we see a large increase across all types of credit, especially mortgage credit (see
Han and Li [2011] for more results on credit portfolios after flag removal).
12
3 Level of Employment
We begin our analysis with what we will call the ‘stock’ (or ‘level’) results, meaning that
we only consider the impact of bankruptcy flag removal on the levels of employment and
self-employment. In the subsequent section, we then turn to our main analysis of gross flows
and examine the individual flow rates into and out of formal and self-employment change
after bankruptcy flag removal, and we further characterize subsequent borrowing, earnings
gains, and transitions into LBD firm ownership.
Table 2 illustrates the baseline stock results. The coe�cients in Table 2 correspond to
(��2, ��1, �0, �+1) in Equation 1, and throughout the paper we will estimate coe�cients using
OLS, and we cluster standard errors at the individual level. In all regressions, we include year
fixed e↵ects and individual fixed e↵ects in order to correct for time trends, and compositional
di↵erences in state laws, industry, occupation, and any other static characteristics of the
individual. We also include dynamic controls such as quadratics in age and tenure.
Table 2 illustrates a large spike in bankruptcy scores in Columns (1) and (2) following
bankruptcy flag removal. This finding corroborates the prior work of Musto [2004] and Han
and Li [2011], and is at the core of the credit access e↵ect we study below. To visualize this
change in bankruptcy scores, Figure 1 illustrates the regression coe�cients from Column (1),
showing the stable trend in bankruptcy scores leading up to the flag removal, followed by a
punctuated one-time level shift in bankruptcy scores. Column (2) illustrates that after we
take out a quadratic age trend, individuals’ credit scores are close to pre-flag removal scores;
however, this subsequent mean-reversion in scores is largely due to the increased borrowing
following flag removal.
Columns (3) and (4) of Table 2 show the impact of flag removal on formal-employment.
Column (3) defines formal employment to be those who have earned at least $1,000 in an
unemployment-insured job, whereas Column (4) defines formal employment to be those who
have earned at least $5,000 in an unemployment-insured job. Using the $1k threshold,
Column (3) shows that the stock of formally employed individuals increases by .465% for
those whose bankruptcy flags were removed relative to the control group who are 3 or
more years before flag removal. Using the 5k definition in Column (3), formal employment
increases by .323%. Ceteris paribus, if all bankruptcy flags in the US were eliminated from
credit reports, our partial equilibrium estimates would imply that roughly 50,000 individuals
13
find formal sector jobs.14 Columns (5) and (6) of Table 2 show the impact of flag removal on
self-employment, defined using $1k and $5k annual net income thresholds, respectively. Both
columns reveal a small, but insignificant increase in self-employment following bankruptcy
flag removal.
In summary, the ‘stock’ or ‘level’ results indicate that while formal-employment responds
to flag removal, self-employment is stagnant. However, this relatively stable stock of self-
employment masks o↵setting changes in gross flows and as such leads to the potential mis-
taken conclusion that self-employment does not respond to credit changes. As we will see in
our main tests in Section 4, following flag removal, there is more churn and reallocation as
flows into and out of self-employment increase. Some individuals leave self-employment for
the formal sector and other individuals move into self-employment.
4 Transitions Into and Out of Self-Employment
In this section, we examine gross flows into and out of self-employment and individuals bor-
rowing patterns. We also use the ILBD to look beyond self-employment and focus on the
transition from non-employer to employer businesses. We examine transitioners earnings,
borrowing behavior, and the subsequent rate at which non-employers become employer busi-
nesses in the LBD. By doing so, we attempt to disentangle the two competing forces following
a bankruptcy flag removal: (i) the credit-access a↵ect which allows previously constrained
individuals to start a business, and the (ii) credit-check a↵ect allows individuals who were
previously unable to find a formal sector job due to poor credit to enter the formal labor
force from self-employment.
Table 3 measures self-employment flows following flag removal. Column (1) illustrates
that flows into self-employment, using the $1k threshold, increase by .16% per annum follow-
ing a bankruptcy flag removal relative to individuals whose flag is not removed. This increase
is quite transitory, and relatively small in economic magnitude. However, individuals who
subsequently flow into self-employment following bankruptcy flag removal, as we show below,
borrow more, earn more net income, and are more likely to become an employer firm. We
argue in the sections that follow, that the increased flow rate into self-employment is due to
14Assuming 1 million individuals per year file, flags stay on for 10 years, and one half percent find jobs.In the online appendix B, we include additional results regarding non-employment, and we show that non-employment drops by over .5% following bankruptcy flag removal.
14
the credit-access e↵ect. Column (2) shows that transitions out of self-employment increase
following bankruptcy flag removal as well. But, the table reveals a significant pretrend in
the time series, which we address this in the next two columns.15
In the next two columns of Table 3, we use a $5k earnings threshold to define self-
employment. Column (3) illustrates that flows into self-employment still increase by .1%;
however, this coe�cient is significant only at the 10% level. Column (4) of Table 3 shows
that flows out of self-employment still exhibit a weak pretrend, but the same general pat-
tern emerges: individuals are exiting self-employment following bankruptcy flag removal. In
online appendix C, we include additional results which show that the rate at which indi-
viduals transition directly from self-employment to formal-employment increases by .12%
after the flag drop. As we discuss in the following sections, the increased flow rate out of
self-employment following flag removal, and the subsequent flow into formal-employment,
is consistent with credit checks precluding bankrupt individuals from finding formal-sector
jobs.
4.1 Earnings After Transitioning into Self-Employment
To isolate the net income of new entrants, Table 4 reports the coe�cients on the window of
dummies surrounding the bankruptcy flag removal in Equation 1 interacted with a dummy
of whether the individual transitioned into self-employment. The non-interacted dummies
around flag removal can be interpreted as the e↵ect of flag removal on the incumbent self-
employed’s earnings, i.e. those who were previously self-employed before flag removal; those
dummies reveal a slightly declining profile of earnings in each specification. How should the
interaction terms be interpreted? Over and above the individual e↵ects of transitioning into
self-employment and having a bankruptcy flag removed, the interaction terms capture the
additional e↵ect of having both events occur simultaneously. To meaningfully interpret the
interaction terms, we compare those who transition into self-employment 2 years before flag
removal to those who transition into self-employment 1 year after flag removal.
Column (1) is the easiest to interpret since all interaction terms and all coe�cients
are negative and monotone, meaning that formal sector employment earnings drop when
individuals enter self-employment following flag removal. This is intuitive since individuals
15In online appendix I, we further address the pretrend issue with an alternate regression design that usesnon-overlapping cohorts. The results are very similar.
15
have less time for a formal sector job if they are running their own business. Column (2)
illustrates that among individuals who transition into self-employment, those who transition
into self-employment 1+ years after flag removal earn on average $991 (=(3376-158.2)-(2274-
47.61)) more in Schedule C net income relative to those who transition into self-employment
2 years prior to flag removal. Relative to the sample average self-employed net income of
$23.8k (adjusting for 0s in Table 1), $991 represents a 4% gain. We arrive at this number
by first computing the net income gain of an individual who transits into self-employment
1+ years after flag removal. For such an individual 3 coe�cients are non-zero and must be
summed to obtain the overall e↵ect of $11,739.8 (=‘1+ Years After Removal (d) x Trans.
into Self-Employed, 1k (d)’ + ‘1+ Years After Removal (d)’ +‘Transition into Self-Employed,
1k (d)’ = 3376-158.2+8522). Repeating this exercise for those who transition 2 years before
flag removal, the overall e↵ect is $10,748.39 (=2274-47.61+8522). Taking the di↵erence
yields $991 (= $11,739.8-$10,748.39). Since the unconditional transition term (‘Transition
into Self-Employed, 1k (d)’) cancels in these calculations, we omit it in the remainder of the
paper. This combined di↵erence of coe�cients between the year after flag removal and two
years before is the key statistic from the transition tables since it capture the impact of flag
removal on transition outcomes. Therefore it is reported in the bottom two rows of every
table along with its significance level.
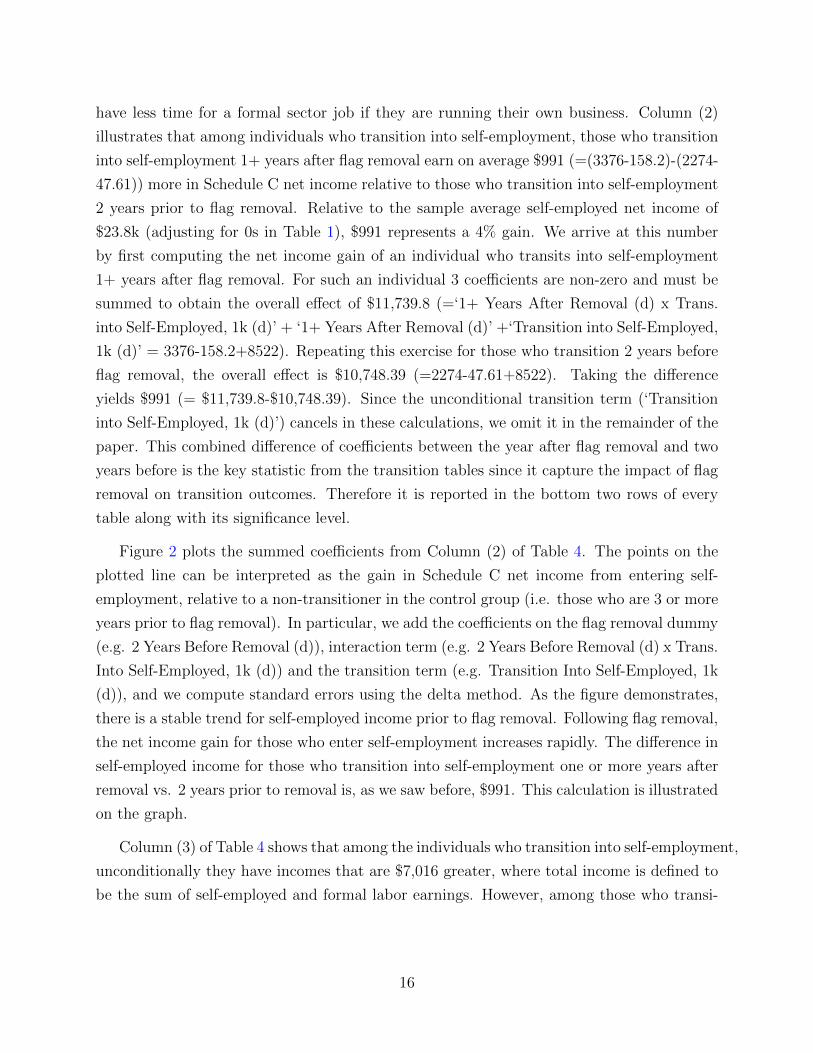
Figure 2 plots the summed coe�cients from Column (2) of Table 4. The points on the
plotted line can be interpreted as the gain in Schedule C net income from entering self-
employment, relative to a non-transitioner in the control group (i.e. those who are 3 or more
years prior to flag removal). In particular, we add the coe�cients on the flag removal dummy
(e.g. 2 Years Before Removal (d)), interaction term (e.g. 2 Years Before Removal (d) x Trans.
Into Self-Employed, 1k (d)) and the transition term (e.g. Transition Into Self-Employed, 1k
(d)), and we compute standard errors using the delta method. As the figure demonstrates,
there is a stable trend for self-employed income prior to flag removal. Following flag removal,
the net income gain for those who enter self-employment increases rapidly. The di↵erence in
self-employed income for those who transition into self-employment one or more years after
removal vs. 2 years prior to removal is, as we saw before, $991. This calculation is illustrated
on the graph.
Column (3) of Table 4 shows that among the individuals who transition into self-employment,
unconditionally they have incomes that are $7,016 greater, where total income is defined to
be the sum of self-employed and formal labor earnings. However, among those who transi-
16
tion into self-employment after flag removal, their total income actually declines by $-670
(=(1667-761.7)-(1629-53.66)) relative to those who transition prior to flag removal. This
indicates that the marginal self-employed entrant, while more profitable running a business,
may not actually be benefiting from increased credit access since they must forgo their labor
earnings.
4.2 Borrowing Among Those Who Transition into Self-Employment
Table 5 illustrates the borrowing behavior of individuals who transition into self-employment.
Individuals who transit into self-employment following a bankruptcy flag removal borrow
heavily using secured credit (mortgages and HELOCs) as well as non-bankcard revolving
credit. This provides a plausible mechanism for the increased earnings of individuals who
transition into self-employment following a bankruptcy flag removal – they simply have more
capital to work with. We further test this hypothesis in Sections 4.3 and 4.4 by analyzing
the external capital needs of the new entrants’ industries and comparing borrowing of new
entrants to other job transitioners.
Column (1) of Table 5 shows that individuals who transit into self-employment, regardless
of whether their flag is removed or not, borrow very little using their bankcards (note,
‘bankcards’ refers to traditional unsecured credit cards issued by banks). However, following
flag removal, those who transition into self-employment borrow significantly using revolving
credit (e.g. revolving personal finance loans) as shown in Column (2). They also take out
large amounts of mortgage credit as shown in Column (3) and HELOCs as shown in Column
(4). Those who transition into self-employment following a bankruptcy flag removal borrow
$3,766 (=1253+3551-(277.8+759.8)) more using HELOCs relative to those who transition
into self-employment prior to flag removal. Turning to the total balance across all types
of consumer credit, Column (5) shows that those who transition into self-employment 1 or
more years after flag removal borrow $15,337 (=(16195+14373)-(6422+8809)) more than
those who transition into self-employment 2 years prior to flag removal.
There are two caveats that must be discussed. Table 5 exhibits a pretrend due to the
fact that credit partially recovers before flag removal (e.g. see the discussion in Cohen-Cole
et al. [2009]). However, we argue that a better gauge of ability to borrow is the credit score.
The total amount which can be borrowed is proportional to the credit score and this exhibits
a stable trend prior to flag removal (e.g. Figure 1) and a large discrete rise following flag
17
removal. Furthermore, we formally test for sources of bias in every specification by including
dummies prior flag removal; this allows readers to assess the parallel trends assumption
throughout the paper. It is the exception that our regressions fail this assumption.
A second caveat is that our data does not specify the use of funds. While our point
estimates imply that self-employed entrants borrow $16k over and above others who have
their flag removed, we do not directly observe whether these loans were used for the small
business. However, our findings are consistent with direct survey questions on mortgage
borrowing by entrepreneurs (e.g. see the discussion in Adelino et al. [2013]), as well as direct
survey questions on credit card borrowing by small business owners (e.g. the Kaufman
Survey studied by Robb and Robinson [2012]). We attempt to alleviate these concerns in
several ways: (i) comparing entry across sectors, stratified by external finance dependence
ratios, (ii) comparing the self-employed entrants to an alternate control, the formal sector
entrants (who should not have a need for working-capital but realize similar earnings gains),
and (iii) looking at subsequent business growth as a function of access to credit.
4.3 External Finance Dependence of Newly Self-Employed
To test the importance of credit access for new startups, online appendix H describes
the industry, based on 1-digit SIC codes, in which individuals enter self-employment af-
ter bankruptcy flag removal. Among new entrants to self-employment, they are more likely
to enter manufacturing, which is very capital intensive, as well as transport/communications,
and retail. There is no di↵erential impact of flag removal on services and finance startups,
which are relatively less capital intensive and relatively less dependent on external finance
than manufacturing or transport/communications startups. We take this as suggestive evi-
dence that consumer credit is being used by the self-employed in order to enter sectors with
large external finance needs and greater capital intensity.
18
4.4 Importance of Credit for Newly Self-Employed vs. Other Job
Transitioners
Are all job-transitioners more likely to borrow, simply because they have earnings gains,
or do the newly self-employed rely particularly heavily on credit?16 As another test of the
importance of credit for the self-employed, Table 6 compares borrowing by those who tran-
sition into formal sector employment and those who transition into self-employment. Both
sets of individuals realize income gains, (recall, $991 for the new self-employed entrants after
flag removal and $1,817 for the new formal-employed entrants after flag removal). However,
Table 6 illustrates that those who transition into formal-employment after flag removal bor-
row $4,526 relative to those who transition prior to flag removal; however, the interaction
terms are negative, indicating that formal transitioners are just like everyone else, and if any-
thing, they borrow less than non-transitioners (this is an important point that we will revisit
shortly since it allows us to rule out consumption smoothing explanations for observed job
finding patterns). In contrast, those who transition into self-employment after flag removal
borrow $15,337 more relative to those who transition prior to flag removal. So even though
self-employed entrants have smaller earnings gains than new formal-employment entrants af-
ter flag removal, the self-employed borrow much more heavily following flag removal, nearly
⇠10k more. This evidence is consistent with the credit-access e↵ect being an important
determinant of self-employment.
4.5 Hiring the First Employee: LBD Firm Ownership
We further explore the importance of credit for job creation by looking at the impact of
flag removal on business startups that employ at least one worker. In particular, Table 7
illustrates the impact of bankruptcy flag removal on whether or not the individual owns a
firm in the Longitudinal Business Dynamics (LBD) database. Firms in the LBD database
must have at least one employee. In Column (1), we define LBD firm ownership to be at
least one or more years of firm ownership. This definition includes relatively transitory firm
ownership spells of 1 year and less. We find that following flag removal, ownership of LBD
firms increases, but insignificantly. In Column (2), we define LBD firm ownership to be
at least two or more years of firm ownership. Column (2) illustrates that under this more
16We thank Nawid Siassi for suggesting this exercise.
19
stringent definition, there is now a significant and positive increase in ownership following
bankruptcy flag removal, relative to the control group. The magnitude of this increase,
however, is economically quite small; following flag removal, the odds that an individual
owns a firm in the LBD increases by .05% (or approximately 1000 startups in our sample of
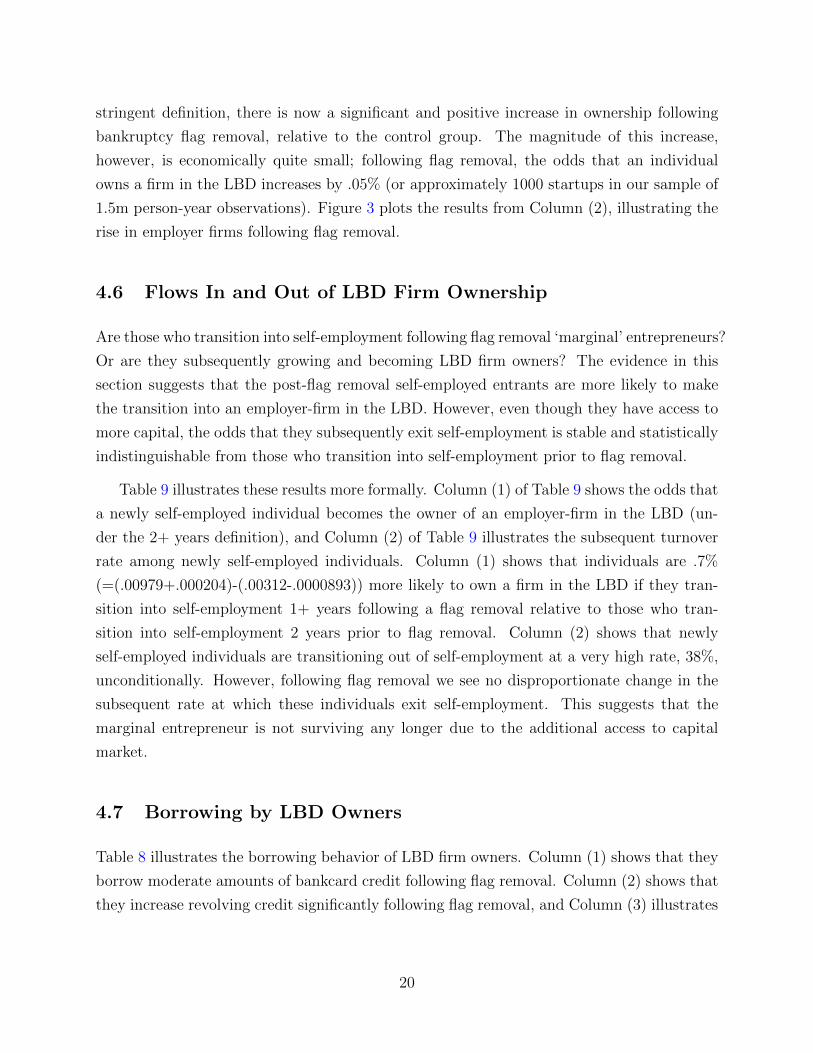
1.5m person-year observations). Figure 3 plots the results from Column (2), illustrating the
rise in employer firms following flag removal.
4.6 Flows In and Out of LBD Firm Ownership
Are those who transition into self-employment following flag removal ‘marginal’ entrepreneurs?
Or are they subsequently growing and becoming LBD firm owners? The evidence in this
section suggests that the post-flag removal self-employed entrants are more likely to make
the transition into an employer-firm in the LBD. However, even though they have access to
more capital, the odds that they subsequently exit self-employment is stable and statistically
indistinguishable from those who transition into self-employment prior to flag removal.
Table 9 illustrates these results more formally. Column (1) of Table 9 shows the odds that
a newly self-employed individual becomes the owner of an employer-firm in the LBD (un-
der the 2+ years definition), and Column (2) of Table 9 illustrates the subsequent turnover
rate among newly self-employed individuals. Column (1) shows that individuals are .7%
(=(.00979+.000204)-(.00312-.0000893)) more likely to own a firm in the LBD if they tran-
sition into self-employment 1+ years following a flag removal relative to those who tran-
sition into self-employment 2 years prior to flag removal. Column (2) shows that newly
self-employed individuals are transitioning out of self-employment at a very high rate, 38%,
unconditionally. However, following flag removal we see no disproportionate change in the
subsequent rate at which these individuals exit self-employment. This suggests that the
marginal entrepreneur is not surviving any longer due to the additional access to capital
market.
4.7 Borrowing by LBD Owners
Table 8 illustrates the borrowing behavior of LBD firm owners. Column (1) shows that they
borrow moderate amounts of bankcard credit following flag removal. Column (2) shows that
they increase revolving credit significantly following flag removal, and Column (3) illustrates
20
that they borrow significant amounts of mortgage credit. Column (3) shows that LBD
firm owners who are 1 or more years after flag removal borrow $29,693 (=(37997+8462)-
(7493+9273)) more using mortgage credit than LBD firm owners who are 2 years prior to
flag removal. A significant fraction of their increased borrowing comes in the form of Home
Equity Lines of Credit (HELOCs), as shown in Column (4). Turning to total debt balances
(including secured and unsecured debts), Column (5) shows that LBD firm owners who are
1 or more years after flag removal borrow $39,835 (=(47332+14812)-(13318+8991)) more
across all lines of credit than LBD firm owners who are 2 years prior to flag removal.
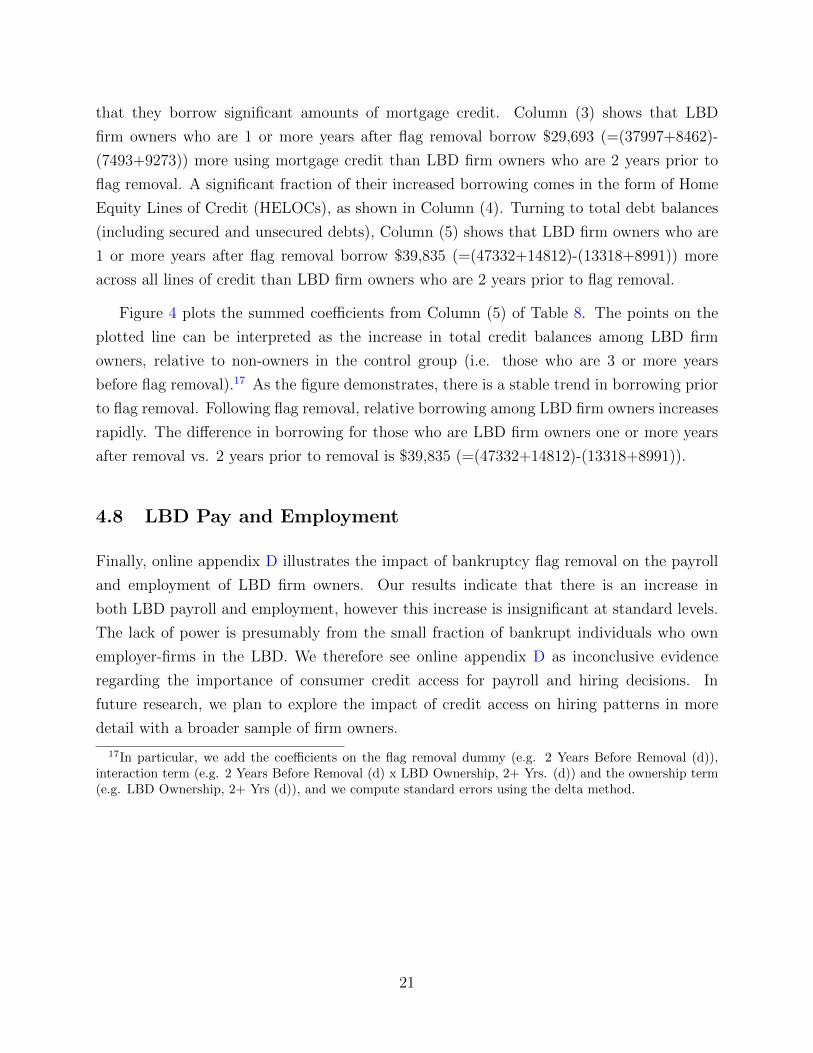
Figure 4 plots the summed coe�cients from Column (5) of Table 8. The points on the
plotted line can be interpreted as the increase in total credit balances among LBD firm
owners, relative to non-owners in the control group (i.e. those who are 3 or more years
before flag removal).17 As the figure demonstrates, there is a stable trend in borrowing prior
to flag removal. Following flag removal, relative borrowing among LBD firm owners increases
rapidly. The di↵erence in borrowing for those who are LBD firm owners one or more years
after removal vs. 2 years prior to removal is $39,835 (=(47332+14812)-(13318+8991)).
4.8 LBD Pay and Employment
Finally, online appendix D illustrates the impact of bankruptcy flag removal on the payroll
and employment of LBD firm owners. Our results indicate that there is an increase in
both LBD payroll and employment, however this increase is insignificant at standard levels.
The lack of power is presumably from the small fraction of bankrupt individuals who own
employer-firms in the LBD. We therefore see online appendix D as inconclusive evidence
regarding the importance of consumer credit access for payroll and hiring decisions. In
future research, we plan to explore the impact of credit access on hiring patterns in more
detail with a broader sample of firm owners.
17In particular, we add the coe�cients on the flag removal dummy (e.g. 2 Years Before Removal (d)),interaction term (e.g. 2 Years Before Removal (d) x LBD Ownership, 2+ Yrs. (d)) and the ownership term(e.g. LBD Ownership, 2+ Yrs (d)), and we compute standard errors using the delta method.
21
4.9 Discussion of Selection Issues
Since flag removal is foreseeable, there may be concern that better entrepreneurs who antici-
pate the need for credit deliberately wait until the flag is removed to start a business. There
are two ways we address this potential issue: (i) if ‘better’ entrepreneurs are waiting until
their flag is removed in order to borrow and start a business, this simply reinforces the point
that credit matters for startups, (ii) to test for selection more formally, we take advantage of
the panel dimension to our data and we use standard selection correction methods. In online
appendix F we show that the entrepreneurs who transition into self-employment following
flag removal are very similar in terms of prior self-employment income and prior labor earn-
ings. And, in online appendix G, we use the heckit selection correction for self-employment
transitions and formal-employment transitions, and we find very similar results.
Moreover, recent independent work by Gross et al. [2016] has also provided formal tests of
the anticipation of bankruptcy flag removal by looking at credit application behavior. They
show that rather than waiting an additional quarter for credit at more favorable rates after
their flag is removed, individuals continue to apply for credit normally prior to the removal,
indicating a lack of foresight.
4.10 Taking Stock: The Credit-Access E↵ect
By analyzing gross flows as opposed to levels, we were able to establish several facts in Sec-
tions 4.1 to 4.8. Namely, following bankruptcy flag removal there is (a) increased flow rates
into self-employment, (b) the fact that they flow into industries with high external finance
needs and greater capital intensity, (c) disproportionate borrowing by new self-employed
entrants relative to other job-transitioners, (d) the increased likelihood of starting an em-
ployer business, and (e) the large amount borrowed by new employer businesses. We believe
that these facts, taken together, provide strong evidence of the credit-access e↵ect. Our
findings also indicate that credit access not only a↵ects the self-employment decision, but
also the decision to become an employer firm, i.e. credit-access influences both stages of
entrepreneurship.
As robustness, we verify that our results regarding entrepreneurship and credit access
hold in pooled SCF cross-sections from 1998-2010 in online appendix J.
22
5 Transitions Into and Out of Formal-Employment
We now turn our attention to gross formal-employment flows where we provide another set
of facts that allows us to partially disentangle the credit-access e↵ect from the credit-check
e↵ect. Among bankrupt individuals who transition into formal employment, we find that if
they make that transition after flag removal as opposed to prior to flag removal, they have
(i) significantly greater earnings, (ii) work for larger firms, (iii) are more likely to work in
jobs that require handling of payments, and (iv) as we show in online appendix J in the SCF,
they are more likely to work for firms with non-wage benefits such as pensions. We argue
throughout the remainder of the section that these findings provide suggestive evidence of
credit-checks precluding bankrupt workers from finding certain types of jobs.
Table 10 illustrates the impact of bankruptcy flag removal on formal-employment flows.
Columns (1) and (2) show that for the baseline definition of formal employment, the flows in
and flows out are insignificant. We attribute the lack of significance to the sample size and
churn, since the levels increase significantly, but the flow regressions are essentially estimating
coe�cients on rare events with noise (since many of these individuals are marginally attached
to the labor force, they may flow in and out of formal employment several times in the span
on a few years).
In Table 10, if we define formal employment using a more stringent earnings threshold of
$5k, we do see flows into and out of formal employment increase significantly following flag
removal. The flow rate into formal employment increases by .24% in the year of removal,
relative to non-transitioners the control group. We can reject equality of coe�cients on the
dummy for the year of removal and the dummy for 2 years prior to removal, but the increase
is short lived. The flow rate out of formal employment also increases following flag removal,
suggesting that some individuals may be leaving formal employment to start businesses once
they have credit access.
In online appendix C we illustrate the impact of flag removal on flows from self-employment
to formal-employment, and vice versa. While point estimates imply that the transition rate
from formal employment to self-employment increases, the results cannot be distinguished
from zero. This suggests that if individuals are leaving formal employment to start businesses
after flag removal, they are first going through a spell of non-employment. For completeness,
online appendix C also shows how bankruptcy flag removal impacts the odds of holding both
a formal sector job and self-employed job, as well as the odds of being only formal-employed
23
and only self-employed.
5.1 Earnings Among New Formal Sector Entrants
Table 11 includes interaction terms between the dummies surrounding the bankruptcy flag
removal and an indicator for whether the individual transitioned into formal employment.
Similar to Table 4, the non-interacted dummies around flag removal can be interpreted
as the e↵ect of flag removal on labor earnings of non-transitioners, i.e. those who remain
employed throughout the flag removal; those dummies show a slightly declining profile of
earnings for non-transitioners. However, the interaction terms in Table 11 illustrate that
among individuals who transition into formal employment, earnings rise significantly, and
this increase is largely driven by the interaction of having a bankruptcy flag removed and
simultaneously transitioning into a formal sector job. For example, Column (1) shows that
individuals who transition into formal employment 1 or more years after bankruptcy flag
removal earn $1,816 (= (4033-847)- (1459-89.74) ) more than individuals who transition into
formal employment 2 years prior to bankruptcy flag removal. Relative to the sample average
of labor earnings which is $41.5k (see Table 1), these labor earnings gains represent a 4.3%
increase.
Column (2) of Table 11 shows that those who transition into formal sector employment
earn less from self-employment. This is an intuitive result, since the individual is taking a
formal sector job, they have less time to devote to self-employment.
Column (3) of Table 11 looks at the sum of labor earnings and self-employment earnings.
Column (3) shows that individuals who transition into formal employment 1 or more years
after bankruptcy flag removal have a total annual income that is $1,696 (= (3726-870.7)-
(1209-49.87) ) more than individuals who transition into formal employment 2 years prior
to bankruptcy flag removal. Relative to the sample average of total income which is $34.8k,
these gains are quite large, approaching 5% of the average individual’s total income.
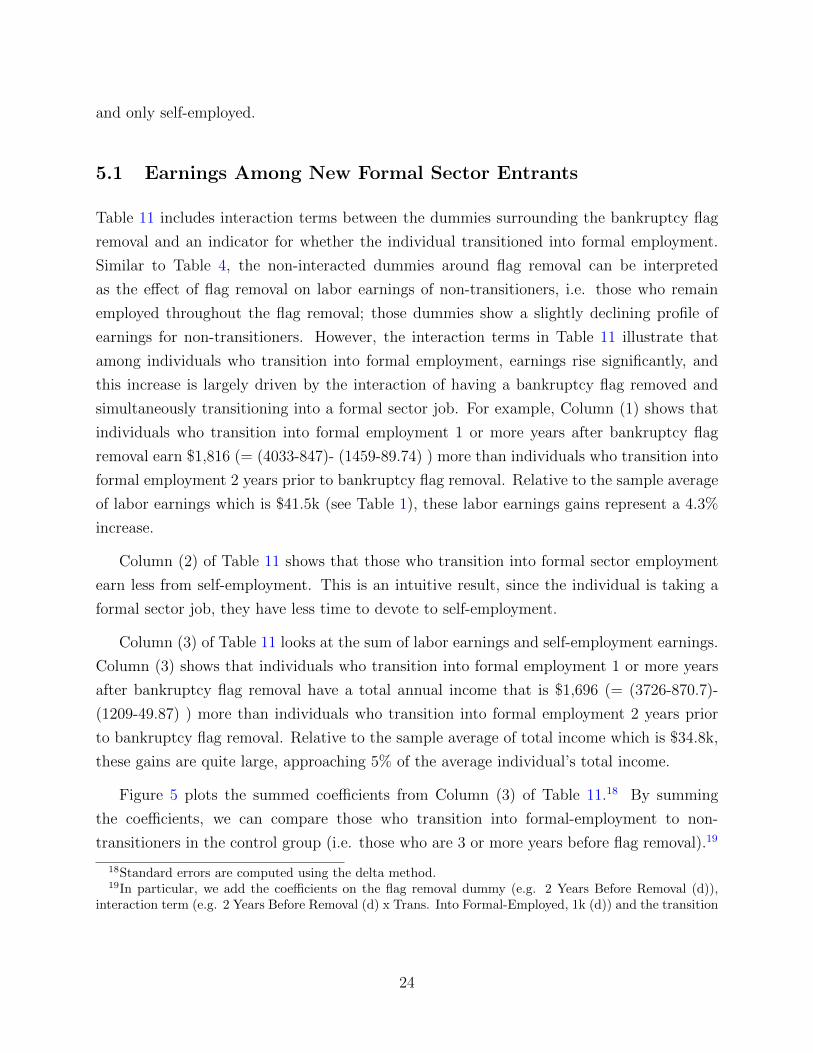
Figure 5 plots the summed coe�cients from Column (3) of Table 11.18 By summing
the coe�cients, we can compare those who transition into formal-employment to non-
transitioners in the control group (i.e. those who are 3 or more years before flag removal).19
18Standard errors are computed using the delta method.19In particular, we add the coe�cients on the flag removal dummy (e.g. 2 Years Before Removal (d)),
interaction term (e.g. 2 Years Before Removal (d) x Trans. Into Formal-Employed, 1k (d)) and the transition
24
As the figure demonstrates, there is a stable trend in total income prior to flag removal. Fol-
lowing flag removal, the gains from transitioning into formal-employment increase rapidly.
The di↵erence in total income for those who transition into formal employment one or more
years after removal vs. 2 years prior to removal is $1,696 (= (3726-870.7)- (1209-49.87) ).
This calculation is illustrated on the graph.
5.2 Firm Size After Transitioning into Formal Employment
Column (1) of Table 12 shows that individuals who transition into formal employment fol-
lowing bankruptcy flag removal are more likely to work at a firm with 1000+ employees
relative to individuals who transition into formal employment prior to flag removal. Column
(1) shows that individuals who transition into formal employment 1 or more years after
bankruptcy flag removal are 1.48% (= (.0357-.0034)- (.0188-.00126) ) more likely to work at
a firm with 1000+ employees than individuals who transition into formal employment 2 years
prior to bankruptcy flag removal. Column (2) illustrates a similar result, showing that indi-
viduals who transition into formal employment following bankruptcy flag removal are more
likely to work for firms with greater than 500 employees relative to those who transition
into formal employment prior to bankruptcy flag removal. Column (3) shows that among
those who transition into formal sector employment, the fraction of individuals who work
for small and young firms (firms with 1 employee or less and 1 year in age or less) remains
unchanged. However, regardless of labor market transitions, the fraction of individuals who
work at young small firms drops by a small, but statistically significant amount .0855%.
These results suggest that individuals are finding jobs at larger firms which may provide
better job security, health insurance, pensions etc. Since the LEHD does not cover healthcare
or pensions, we show in online appendix J that in the SCF, following flag removal, individuals
are more likely to work at larger firms that provide pensions; however, this result is only
significant at the 10% level and occurs with a significant lag. Nonetheless, this suggests
that individuals are able to obtain jobs with better non-wage benefits after bankruptcy flag
removal.
term (e.g. Transition Into Formal-Employed, 1k (d)), and we compute standard errors using the deltamethod. The points on the plotted line can be interpreted as the increase in total income from enteringformal employment, relative to non-transitioners in the control group.
25
5.3 Formal Sector Exit Rates and Job Turnover
Are those who transition into formal employment marginal workers? In online appendix E we
explore this question by computing rates at which workers transit out of formal employment
after finding a new job. In general, these newly employed workers are attached to the
formal sector and are less likely to exit the formal sector after flag removal. In other words,
individuals whose bankruptcy flags are dropped are no more likely to be separated from
an employer when compared to other bankrupt individuals near flag removal. Their new
job accession rate within the formal sector increases after flag removal, but their large and
persistent wage gains suggest that these subsequent accessions are simply reflecting the fact
that these workers are climbing the job ladder.
5.4 Industries of New Job Finders
In online appendix H, we stratify job finders by industry, and we show that workers are
more likely to find jobs in the retail and service sectors after bankruptcy flag removal.
Anecdotal evidence suggests that these sectors disproportionately involve the handling of
payments and the use of cash registers.20 We find weaker e↵ects in sectors such as commu-
nications/transport and manufacturing, which are less likely to involve jobs which require
handling payments.
5.5 Taking Stock: The Credit-Check E↵ect
In Section 4.4 and Sections 5.1 to 5.3 we demonstrated that if a bankrupt individual transi-
tions into formal employment after flag removal as opposed to prior to flag removal, they (a)
earn more, (b) work for larger firms with greater non-wage benefits, (c) find jobs in indus-
tries that require handling payments, and (d) do not borrow more than other transitioners
(recall Section 4.4). We argue that these facts, taken together, provide strong evidence that
credit-checks are generating the formal-employment flows we observe in our data.
20While there appears to be no systematic tabulations of cash handling across industries, the follow-ing websites https://www.glassdoor.com/Job/cash-handler-jobs-SRCH_KO0,12.htm and http://www.ehow.com/list_6941548_jobs-require-cash-handling-balancing.html include lists of jobs that requirehandling cash and they are primarily made of jobs such as ‘cashier’, ‘bartender’, ‘server’, etc. Em-ployee theft accounts for 34.5% of inventory shrinkage at retailers, http://fortune.com/2015/06/24/shoplifting-worker-theft-cost-retailers-32-billion-in-2014/.
26
The fact that workers disproportionately flow into larger firms after flag removal may be
because of two reasons: (1) credit-checks may have previously been preventing these indi-
viduals from obtaining jobs at large firms, or (2) following flag removal access to consumer
credit allows individuals to smooth consumption while searching for higher paying job at
larger and more productive firms. Existing evidence from Society for Human Resource Man-
agement [2012b] corroborates the credit-check explanation since small firms are 2x less likely
to conduct background checks.21 On the other hand, related work by Herkenho↵ et al. [2015]
shows that displaced workers borrow more and take longer to find a job if they have more
credit access, providing support for the consumption smoothing explanation. However, the
sample in this paper includes few displaced workers and as Section 4.4 shows, those who tran-
sition into formal employment after flag removal do not borrow disproportionately relative
to other transitioners. This suggests that the consumption smoothing role is less important
in the sample studied in the current paper, and individuals may be obtaining better jobs
after flag removal because credit-checks by employers were previously limiting employment
opportunities.
As Chen et al. [2013] and Society for Human Resource Management [2012b] discuss, the
primary reason employers conduct credit checks is to reduce theft, and credit checks are
primarily conducted for jobs that require the handling of cash. Our industry results suggest
that credit checks may have been limiting bankrupt workers from finding retail and service
sector jobs, which disproportionately involve handling payments, since individuals are more
likely to flow into those jobs after bankruptcy flag removal. This additional evidence also
points to credit checks as the mechanism for generating these patterns of job flows.
Ultimately, we are unable to observe credit checks directly, and so we take our set of facts
as supportive, but not conclusive, evidence of credit-checks limiting employment opportuni-
ties of bankrupt individuals.
21Society for Human Resource Management [2012b] report that 45% of large firms (2,500 to 24,999 em-ployees) conduct credit checks versus 25% of small firms (100 to 499 employees). Other studies by Society forHuman Resource Management [2012a] and Zibarras and Woods [2010] find similar patterns for backgroundchecks, which may or may not include credit checks.
27
6 Implied Productivity of Bankrupt Workers
Our results have important policy implications, especially for the debate over credit checks
(Chen et al. [2013], Cortes et al. [2016], and Shoag and Cli↵ord [2016]). In this section,
we use the free entry condition from the canonical directed search model, e.g. Moen [1997]
and Menzio and Shi [2011], to calculate firms’ beliefs about the productivity of bankrupt
workers relative to non-bankrupt workers. Using our wage and job-finding estimates from
our empirical analysis, we show that firms would be willing to pay approximately $17.6k,
in net present value, to be able to decipher between a potential hire who has a bankruptcy
record versus a potential hire with no bankruptcy record, ex-post.
Let i 2 {B,N} summarize the bankruptcy status of a worker at match formation (we can
allow for alternate information structures or stochastic types), where B denotes bankrupt
and N denotes non-bankrupt, e.g. yB
is the productivity of a bankrupt worker and y
N
is the
productivity of a non-bankrupt worker. Likewise, let wi
denote the wage, and let Ji
denote
the value of a firm matched with a worker that has bankruptcy status i at match formation.
Let denote the vacancy cost, and let ✓
i
denote market tightness of submarket i, i.e.
✓
i
= v
i
/u
i
where v
i
is the level of vacancies posted by firms in submarket i and u
i
is the
number of workers looking for a job in that submarket. The number of worker-firm matches
that occur in submarket i any given period is given by M(ui
, v
i
) = ui·vi(u⇣
i+v
⇣i )
1/⇣2⇥0, 1).
Define the firm contact rate in submarket i as q
i
= M(ui,vi)vi
. The free entry condition
implies that the expected profits of matching (qi
J
i
) in either submarket equals the vacancy
cost (), = q
i
J
i
.22
Let �
i
be the associated transition rate out of formal employment. Assume that both
productivity and wages are constant throughout the duration of a match so that Ji
can be
expressed as Ji
= yi�wi
1��(1��i). The assumption of constant wages over the duration of a match
can be relaxed with little impact on the results; however, the bankrupt/non-bankrupt wage
premium is important and is discussed in the next section in more detail. Using the free
entry condition in conjunction with the expression for Ji
yields the implied productivity of
22Screening costs are quite low for small businesses, ranging from $30 to $300 (depending on the rangeof checks conducted). E.g. www.businessnewsdaily.com/7638-best-background-check-services.htmlincludes a list of providers of these services and costs. We could incorporate these costs in the model, but itwould only complicate the calculation and have little influence on the results.
28
a worker with bankruptcy status i,
y
i
= w
i
+(1� �(1� �
i
))
q
i
(2)
How can y
i
be interpreted? y
i
is simply a residual. It may capture unmodeled costs
or other unobserved characteristics of workers that a↵ect profitability (tardiness, ability to
handle money, etc.). In what follows, we interpret y
i
as firms’ belief about the per-period
productivity of a type i worker.
6.1 Type Structure
Some discussion of the Bankrupt (B)/Non-bankrupt (N) type structure is warranted. We
are not writing down the individual’s problem, but the implicit assumption in the current
formulation is that individuals switch types, and they only do so when they switch jobs.
Bankrupt workers who remain in a match that was formed when the worker was initially
bankrupt face a flat wage profile dictated by their status at match formation. This assump-
tion is supported by the null average a↵ects on wages shown in Table 11 for non-transitioners;
only transitioners realize the wage gains shown in Table 11. This assumption may also be
justified if employers do not repetitively check credit scores during a match. Limited evi-
dence by Society for Human Resource Management [2012b] suggests that these checks are
only conducted at the interview stage.23 When an individual’s flag is removed, the worker
can switch jobs and search for a job in the ‘non-bankrupt’ submarkets. We adjust for these
on-the-job-search incentives by using the actual separation rate from the data following flag
removal.
6.2 Calibration and Measurement
Let the period be annual, and let � = .96 (implying an annual interest rate of 4%). We
set �N
= .0559 (=.044/.787) based on transition rate out of formal employment (into non-
23Quoting from Society for Human Resource Management [2012b]: “When do organizations initiate creditbackground checks? Of the organizations that conduct credit background checks, most organizations initiatecredit background checks after a contingent job o↵er (58%) or after the job interview (33%).”
29
employment or self-employment) prior to bankruptcy flag removal.24 We measure the va-
cancy cost following Hagedorn and Manovskii [2008] as 4.5% of the quarterly wage of a new
hire, i.e. = .045wB
.25 We use the same matching elasticity, ⇣ = 1.6, as Schaal [2012].
To measure the contact rate between firms and workers, we first recover the job find-
ing rate for workers. The transition rate into formal employment is 4.6% per annum
prior to flag removal, which, after adjusting for the fact that only 18.4% of the sam-
ple are non-employed and 9.0% are self-employed, yields an annual job finding rate of
16.79% = (.046/(.184 + .09)). Using the definition of the matching function, the worker
contact rate is p
B
= M(uB
, v
B
)/uB
= ✓
B
(1 + ✓
B
)�1/⇣ = .1679 which implies ✓
B
= 0.1947.
Therefore the firm contact rate is qB
= M(uB
, v
B
)/vB
= (1 + ✓
B
)�1/⇣ = .862.
After flag removal, the flow transition rate into formal employment increases by .241% per
annum. After adjusting for composition, this implies a 17.67% (=(.046+.00241)/(.184+.09))
annual job finding rate. The firm contact rate with non-bankrupt workers is therefore q
N
=
.855.
The final object that needs to be measured is the di↵erence in wages of those who find jobs
following flag removal versus those who find jobs with a flag still on their record. Using our
wage gain estimates from Table 11, we measure the wage di↵erence to be wN
�w
B
= $1, 696.
Using equation (2), we can now calculate the implied productivity di↵erence:
y
N
� y
B
= w
N
� w
B| {z }⇠=$1,696
+((1� �(1� �
N
))
q
N
� (1� �(1� �
B
))
q
B
)| {z }
⇠=�40
= $1656 (3)
The relatively small di↵erences in firm contact rates drives the second term in equation (3)
to zero. The productivity di↵erence is almost entirely summarized by the wage gap. In net
present value the productivity di↵erence in quite large, yN�yB
(1��(1��N )) = $17, 676. In absolute
value, according to our calibration, non-bankrupt workers produce $43,387 per annum and
bankrupt workers produce on average $41,732. Our productivity estimates imply that firms
believe bankrupt workers are approximately 3.8% (=1.6k/43.3k) less productive than non-
bankrupt workers. Given we are assuming free entry, free entry implies firms are indi↵erent
between the two workers. However, in net present value, firms in our sample would be willing
24The 4.4% transition rate is the odds that any worker transitions out of employment. We adjust for thefact that only the formal-employed individuals can transition out of employment, and 78.7% of individualsin our sample are formally employed.
25Which wage we use as the base wage does not alter the results.
30
to pay approximately $17.6k in order to avoid hiring a bankrupt worker, ex-post.
7 Conclusions
We construct a new administrative dataset in order to examine how consumer credit access
impacts employment prospects, earnings, and entrepreneurship. We use bankruptcy flag
removals to isolate a large discrete increase in credit access which is not directly associated
with credit worthiness, wealth, or any other unobserved characteristics of the individual. We
examine whether bankruptcy flag removals not only increase credit access, but also change
the set of potential jobs available to a individual. We call these two e↵ects from bankruptcy
flag removal (i) the credit access e↵ect, which is the way increased credit access following flag
removal allows previously constrained individuals to start businesses or smooth consumption
while searching for a job, and (ii) the credit check e↵ect, which is the way bankruptcy flag
removal gives individuals previously excluded from formal sector unemployment-insured jobs,
the opportunity to obtain a formal sector job.
We demonstrate that following flag removal there is (a) an increased flow rate into self-
employment, (b) disproportionate borrowing by new self-employed entrants relative to other
job-transitioners, (c) an increased likelihood of starting an employer business, (d) startups
enter capital intensive and external finance intensive industries, and (e) disproportionate
borrowing by new employer businesses. Taken together, we view these facts as strong evi-
dence of the credit-access e↵ect. On the formal sector job side, we examine gross flows into
new formal sector unemployment-insured jobs. Post-flag removal, entrants in the formal sec-
tor (a) earn more, (b) work for larger firms with greater non-wage benefits, (c) find jobs in
industries that disproportionately require cash handling, but (d) do not necessarily borrow
more. This last fact, in conjunction with limited evidence on background checks by firm size
and in sectors that require cash handling, points toward credit-checks preventing bankrupt
workers from obtaining jobs at large firms.
Our results have important policy implications, especially for the debate over credit
checks (Chen et al. [2013], Cortes et al. [2016], and Shoag and Cli↵ord [2016]). Using our
empirical findings, we calibrate a simple directed search model and provide the first estimates
of the implied productivity of bankrupt versus non-bankrupt workers. Our estimates reveal
that firms would be willing to pay $17.6k, ex-post, in order to tell the di↵erence between a
31
bankrupt and non-bankrupt worker. In future work, which is beyond the scope of the paper,
we believe the tools used in Chen et al. [2013] and Davila [2014] can be used to assess the
optimal information structure following bankruptcy.
ReferencesJohn M Abowd, Bryce E Stephens, Lars Vilhuber, Fredrik Andersson, Kevin L McKinney, Marc Roemer,
and Simon Woodcock. The lehd infrastructure files and the creation of the quarterly workforce indicators.In Producer Dynamics: New Evidence from Micro Data, pages 149–230. University of Chicago Press, 2009.
Manuel Adelino, Antoinette Schoar, and Felipe Severino. House prices, collateral and self-employment.Technical report, National Bureau of Economic Research, 2013.
Ahmet Akyol and Kartik Athreya. Credit and self-employment. Journal of Economic Dynamics and Control,35(3):363–385, 2011.
Stefania Albanesi and Jaromir Nosal. Insolvency after the 2005 bankruptcy reform. 2015.
Kartik Athreya, Xuan S Tam, and Eric R Young. A quantitative theory of information and unsecured credit.American Economic Journal: Macroeconomics, pages 153–183, 2012.
Kartik Athreya, Juan M Sanchez, Xuan S Tam, and Eric R Young. Labor market upheaval, default regula-tions, and consumer debt. Federal Reserve Bank of St. Louis Working Paper Series, (2014-002), 2014.
K.B. Athreya and N.B. Simpson. Unsecured debt with public insurance: From bad to worse. Journal ofMonetary economics, 53(4):797–825, 2006.
Zach Bethune. Consumer credit, unemployment, and aggregate labor market dynamics. Technical report,Working Paper, 2015.
Julio Blanco and Gaston Navarro. Equilibrium default and the unemployment accelerator. Technical report,Working Paper, 2014.
Marieke Bos, Emily Breza, and Andres Liberman. The labor market e↵ects of credit market information.Available at SSRN 2654489, 2015.
Francisco J Buera, Joseph Kaboski, and Yongseok Shin. Finance and development: A tale of two sectors.Technical report, National Bureau of Economic Research, 2009.
Francisco J Buera, Roberto N Fattal Jaef, and Yongseok Shin. Anatomy of a credit crunch: from capital tolabor markets. Review of Economic Dynamics, 18(1):101–117, 2015.
Christopher Carroll, Jiri Slacalek, and Martin Sommer. Dissecting saving dynamics: Measuring wealth,precautionary and credit e↵ects. 2012.
S. Chatterjee, D. Corbae, M. Nakajima, and J.V. Rıos-Rull. A quantitative theory of unsecured consumercredit with risk of default. Econometrica, 75(6):1525–1589, 2007.
S. Chatterjee, D. Corbae, and J.V. Rıos-Rull. A theory of credit scoring and competitive pricing of defaultrisk. Unpublished working paper, University of Texas at Austin, 2008.
32
Satyajit Chatterjee and Grey Gordon. Dealing with consumer default: Bankruptcy vs garnishment. Journalof Monetary Economics, 59:S1–S16, 2012.
Aaron K Chatterji and Robert C Seamans. Entrepreneurial finance, credit cards, and race. Journal ofFinancial Economics, 106(1):182–195, 2012.
D. Chen. The interaction between labor and credit markets: The impact of bankruptcy on labor supplydecisions. 2012.
Daphne Chen, Dean Corbae, and Andy Glover. Can employer credit checks create poverty traps? 2013.
Ethan Cohen-Cole, Burcu Duygan-Bump, and Judit Montoriol-Garriga. Forgive and forget: who gets creditafter bankruptcy and why? In EFA 2009 Bergen Meetings Paper, 2009.
Thomas F Cooley and Vincenzo Quadrini. Financial markets and firm dynamics. American EconomicReview, pages 1286–1310, 2001.
Dean Corbae and Andrew Glover. A simple dynamic theory of credit scores under adverse selection. 2015.
Kristle Cortes, Andrew Glover, and Murat Tasci. The unintended consequences of employer credit checkbans on labor and credit markets. Technical report, Manuscript, 2016.
Eduardo Davila. Using elasticities to derive optimal bankruptcy exemptions. Unpublished working paper,2014.
Steven J Davis, John Haltiwanger, Ron S Jarmin, Cornell J Krizan, Javier Miranda, Alfred Nucci, andKristin Sandusky. Measuring the dynamics of young and small businesses: Integrating the employer andnonemployer universes. Technical report, National Bureau of Economic Research, 2007.
Emin Dinlersoz, Henry R Hyatt, and Hubert P Janicki. Who works for whom? worker sorting in a modelof entrepreneurship with heterogeneous labor markets. US Census Bureau Center for Economic StudiesPaper No. CES-WP-15-08, 2015.
Will Dobbie and Jae Song. Debt relief and debtor outcomes: Measuring the e↵ects of consumer bankruptcyprotection. Technical report, working paper, 2013.
Will Dobbie, Paul Goldsmith-Pinkham, Neale Mahoney, and Jae Song. Bad credit, no problem? credit andlabor market consequences of bad credit reports. 2016.
Kevin Donovan et al. Subsistence entrepreneurs and misallocation. In 2014 Meeting Papers, number 771.Society for Economic Dynamics, 2014.
Robert W Fairlie and Harry A Krashinsky. Liquidity constraints, household wealth, and entrepreneurshiprevisited. Review of Income and Wealth, 58(2):279–306, 2012.
Andy Glover and Jacob Short. Bankruptcy, incorporation, and the nature of entrepreneurial risk. In 2010Meeting Papers, number 1010. Society for Economic Dynamics, 2010.
Paul Gompers, Anna Kovner, Josh Lerner, and David Scharfstein. Skill vs. luck in entrepreneurship andventure capital: Evidence from serial entrepreneurs. Technical report, National bureau of economicresearch, 2006.
Michael Greenstone, Alexandre Mas, and Hoai-Luu Nguyen. Do credit market shocks a↵ect the real econ-omy? quasi-experimental evidence from the great recession and normaleconomic times. Technical report,National Bureau of Economic Research, 2014.
33
Tal Gross, Matthew J. Notowidigdo, and Jialan Wang. The marginal propensity to consume over the businesscycle. Technical report, Manuscript, 2016.
M. Hagedorn and I. Manovskii. The cyclical behavior of equilibrium unemployment and vacancies revisited.2008.
Song Han and Geng Li. Household borrowing after personal bankruptcy. Journal of Money, Credit andBanking, 43(2-3):491–517, 2011.
Song Han and Wenli Li. Fresh start or head start? the e↵ects of filing for personal bankruptcy on worke↵ort. Journal of Financial Services Research, 31(2-3):123–152, 2007.
K.F. Herkenho↵. The impact of consumer credit access on unemployment. Manuscript, 2013.
K.F. Herkenho↵ and L.E. Ohanian. Foreclosure delay and us unemployment. Federal Reserve Bank of St.Louis Working Paper 2012-017A, 2012.
Kyle Herkenho↵, Gordon Phillips, and Ethan Cohen-Cole. How credit cosntraints impact job finding rates,sorting, & aggregate output. Manuscript, 2015.
Erik Hurst and Annamaria Lusardi. Liquidity constraints, household wealth, and entrepreneurship. Journalof political Economy, 112(2):319–347, 2004.
Erik Hurst and Benjamin Wild Pugsley. What do small businesses do? Technical report, National Bureauof Economic Research, 2011.
Thais Lærkholm Jensen, Søren Leth-Petersen, and Ramana Nanda. Housing collateral, credit constraintsand entrepreneurship-evidence from a mortgage reform. Technical report, National Bureau of EconomicResearch, 2014.
F. Karahan and S. Rhee. Housing and the labor market: The role of migration on aggregate unemployment.University of Pennsylvania, mimeo, 2011.
Patrick Kehoe, Virgiliu Midrigan, and Elena Pastorino. Debt constraints and employment. Technical report,mimeo, 2014.
Sari Pekkala Kerr, William R Kerr, and Ramana Nanda. House money and entrepreneurship. 2014.
W. Li and M.J. White. Mortgage default, foreclosure, and bankruptcy. Technical report, National Bureauof Economic Research, 2009.
I. Livshits, J. MacGee, and M. Tertilt. Consumer bankruptcy: A fresh start. The American EconomicReview, 97(1):402–418, 2007a.
Igor Livshits, James MacGee, and Michele Tertilt. Accounting for the rise in consumer bankruptcies. Tech-nical report, National Bureau of Economic Research, 2007b.
Neil Mehrotra and Dmitriy Sergeyev. Financial shocks and job flows. Technical report, working paper, 2015.
G. Menzio and S. Shi. E�cient search on the job and the business cycle. Journal of Political Economy, 119(3):468–510, 2011.
Atif R Mian and Amir Sufi. What explains high unemployment? the aggregate demand channel. Technicalreport, National Bureau of Economic Research, 2012.
34
Virgiliu Midrigan and Thomas Philippon. Household leverage and the recession. 2011.
Espen R Moen. Competitive search equilibrium. Journal of Political Economy, 105(2):385–411, 1997.
D.K. Musto. What happens when information leaves a market? evidence from postbankruptcy consumers*.The Journal of Business, 77(4):725–748, 2004.
Raghuram G Rajan and Luigi Zingales. Financial dependence and growth. Technical report, National bureauof economic research, 1996.
Alicia M Robb and David T Robinson. The capital structure decisions of new firms. Review of FinancialStudies, page hhs072, 2012.
Edouard Schaal. Uncertainty, productivity and unemployment in the great recession. Federal Reserve Bankof Minneapolis, mimeo, 2012.
Martin C Schmalz, David A Sraer, and David Thesmar. Housing collateral and entrepreneurship. Technicalreport, National Bureau of Economic Research, 2013.
Immo Schott. Start-ups, house prices, and the jobless recovery. Unpublished manuscript, 2013.
Daniel Shoag and Robert Cli↵ord. ’no more credit score’: Employer credit check bans and signal substitution.2016.
Report Society for Human Resource Management. Shrm survey findings: Background check-ingthe use of criminal background checks in hiring decisions. Technical report, 2012a. URLhttps://www.shrm.org/hr-today/trends-and-forecasting/research-and-surveys/pages/criminalbackgroundcheck.aspx.
Report Society for Human Resource Management. Shrm survey findings: Background checkingthe use ofcredit background checks in hiring decisions. Technical report, 2012b. URL https://www.shrm.org/hr-today/trends-and-forecasting/research-and-surveys/Pages/creditbackgroundchecks.aspx.
Lara D Zibarras and Stephen A Woods. A survey of uk selection practices across di↵erent organization sizesand industry sectors. Journal of Occupational and Organizational Psychology, 83(2):499–511, 2010.
35
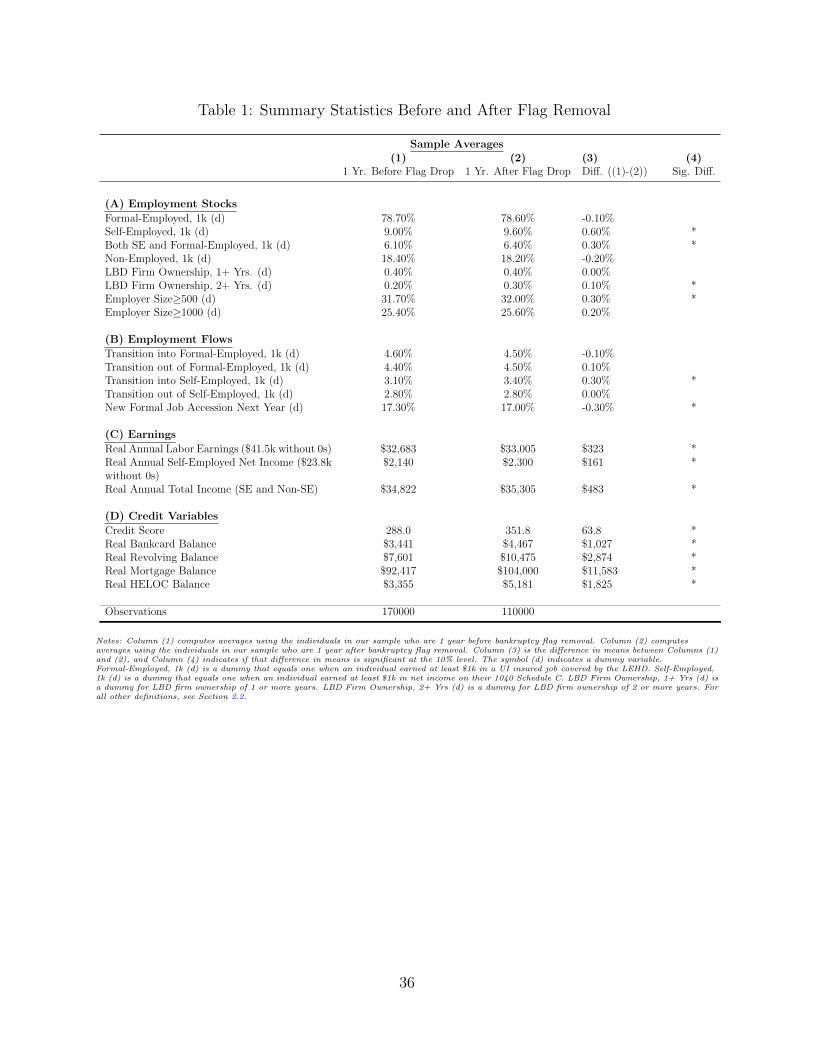
Table 1: Summary Statistics Before and After Flag Removal
Sample Averages(1) (2) (3) (4)
1 Yr. Before Flag Drop 1 Yr. After Flag Drop Di↵. ((1)-(2)) Sig. Di↵.
(A) Employment StocksFormal-Employed, 1k (d) 78.70% 78.60% -0.10%Self-Employed, 1k (d) 9.00% 9.60% 0.60% *Both SE and Formal-Employed, 1k (d) 6.10% 6.40% 0.30% *Non-Employed, 1k (d) 18.40% 18.20% -0.20%LBD Firm Ownership, 1+ Yrs. (d) 0.40% 0.40% 0.00%LBD Firm Ownership, 2+ Yrs. (d) 0.20% 0.30% 0.10% *Employer Size�500 (d) 31.70% 32.00% 0.30% *Employer Size�1000 (d) 25.40% 25.60% 0.20%
(B) Employment FlowsTransition into Formal-Employed, 1k (d) 4.60% 4.50% -0.10%Transition out of Formal-Employed, 1k (d) 4.40% 4.50% 0.10%Transition into Self-Employed, 1k (d) 3.10% 3.40% 0.30% *Transition out of Self-Employed, 1k (d) 2.80% 2.80% 0.00%New Formal Job Accession Next Year (d) 17.30% 17.00% -0.30% *
(C) EarningsReal Annual Labor Earnings ($41.5k without 0s) $32,683 $33,005 $323 *Real Annual Self-Employed Net Income ($23.8kwithout 0s)
$2,140 $2,300 $161 *
Real Annual Total Income (SE and Non-SE) $34,822 $35,305 $483 *
(D) Credit VariablesCredit Score 288.0 351.8 63.8 *Real Bankcard Balance $3,441 $4,467 $1,027 *Real Revolving Balance $7,601 $10,475 $2,874 *Real Mortgage Balance $92,417 $104,000 $11,583 *Real HELOC Balance $3,355 $5,181 $1,825 *
Observations 170000 110000
Notes: Column (1) computes averages using the individuals in our sample who are 1 year before bankruptcy flag removal. Column (2) computesaverages using the individuals in our sample who are 1 year after bankruptcy flag removal. Column (3) is the di↵erence in means between Columns (1)and (2), and Column (4) indicates if that di↵erence in means is significant at the 10% level. The symbol (d) indicates a dummy variable.Formal-Employed, 1k (d) is a dummy that equals one when an individual earned at least $1k in a UI insured job covered by the LEHD. Self-Employed,1k (d) is a dummy that equals one when an individual earned at least $1k in net income on their 1040 Schedule C. LBD Firm Ownership, 1+ Yrs (d) isa dummy for LBD firm ownership of 1 or more years. LBD Firm Ownership, 2+ Yrs (d) is a dummy for LBD firm ownership of 2 or more years. Forall other definitions, see Section 2.2.
36
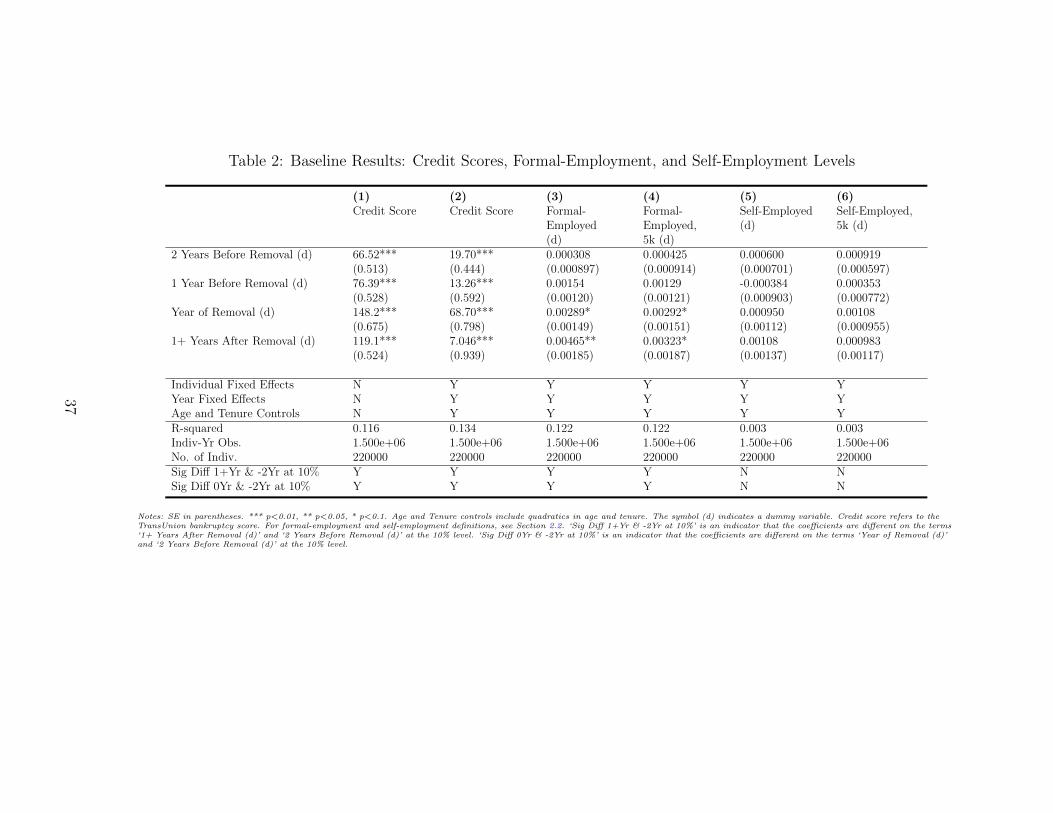
Table 2: Baseline Results: Credit Scores, Formal-Employment, and Self-Employment Levels
(1) (2) (3) (4) (5) (6)Credit Score Credit Score Formal-
Employed(d)
Formal-Employed,5k (d)
Self-Employed(d)
Self-Employed,5k (d)
2 Years Before Removal (d) 66.52*** 19.70*** 0.000308 0.000425 0.000600 0.000919(0.513) (0.444) (0.000897) (0.000914) (0.000701) (0.000597)
1 Year Before Removal (d) 76.39*** 13.26*** 0.00154 0.00129 -0.000384 0.000353(0.528) (0.592) (0.00120) (0.00121) (0.000903) (0.000772)
Year of Removal (d) 148.2*** 68.70*** 0.00289* 0.00292* 0.000950 0.00108(0.675) (0.798) (0.00149) (0.00151) (0.00112) (0.000955)
1+ Years After Removal (d) 119.1*** 7.046*** 0.00465** 0.00323* 0.00108 0.000983(0.524) (0.939) (0.00185) (0.00187) (0.00137) (0.00117)
Individual Fixed E↵ects N Y Y Y Y YYear Fixed E↵ects N Y Y Y Y YAge and Tenure Controls N Y Y Y Y YR-squared 0.116 0.134 0.122 0.122 0.003 0.003Indiv-Yr Obs. 1.500e+06 1.500e+06 1.500e+06 1.500e+06 1.500e+06 1.500e+06No. of Indiv. 220000 220000 220000 220000 220000 220000Sig Di↵ 1+Yr & -2Yr at 10% Y Y Y Y N NSig Di↵ 0Yr & -2Yr at 10% Y Y Y Y N N
Notes: SE in parentheses. *** p<0.01, ** p<0.05, * p<0.1. Age and Tenure controls include quadratics in age and tenure. The symbol (d) indicates a dummy variable. Credit score refers to theTransUnion bankruptcy score. For formal-employment and self-employment definitions, see Section 2.2. ‘Sig Di↵ 1+Yr & -2Yr at 10%’ is an indicator that the coe�cients are di↵erent on the terms‘1+ Years After Removal (d)’ and ‘2 Years Before Removal (d)’ at the 10% level. ‘Sig Di↵ 0Yr & -2Yr at 10%’ is an indicator that the coe�cients are di↵erent on the terms ‘Year of Removal (d)’and ‘2 Years Before Removal (d)’ at the 10% level.
37
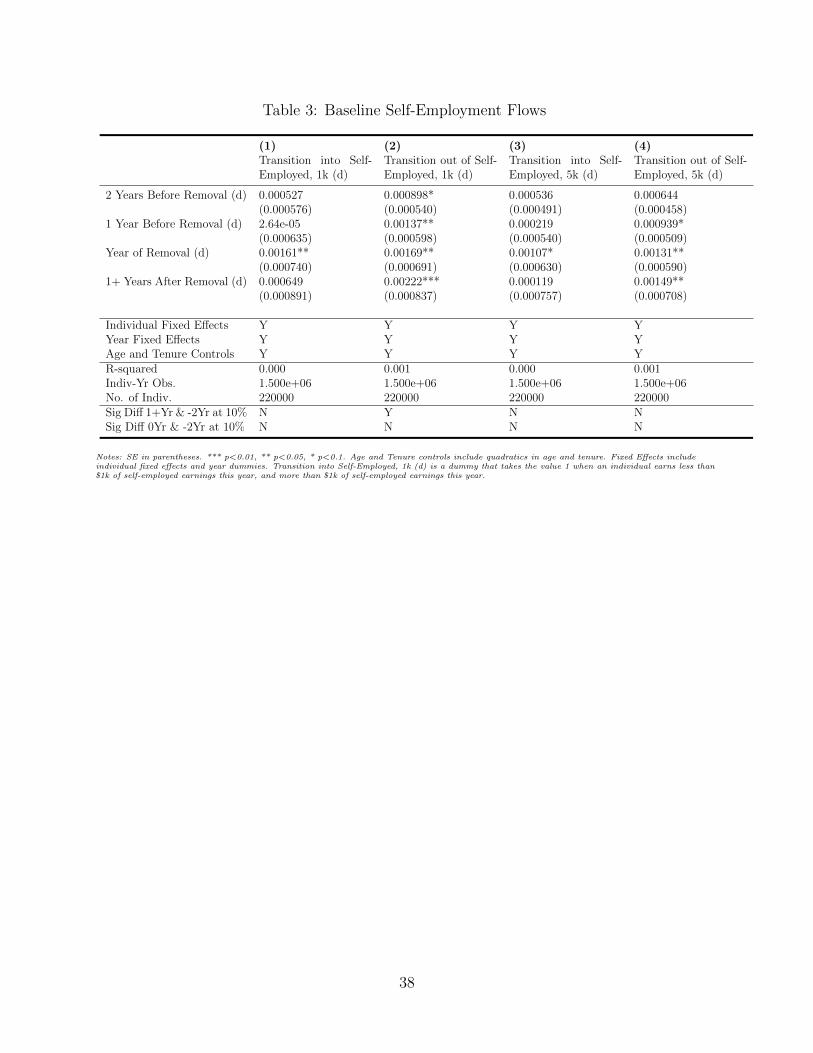
Table 3: Baseline Self-Employment Flows
(1) (2) (3) (4)Transition into Self-Employed, 1k (d)
Transition out of Self-Employed, 1k (d)
Transition into Self-Employed, 5k (d)
Transition out of Self-Employed, 5k (d)
2 Years Before Removal (d) 0.000527 0.000898* 0.000536 0.000644(0.000576) (0.000540) (0.000491) (0.000458)
1 Year Before Removal (d) 2.64e-05 0.00137** 0.000219 0.000939*(0.000635) (0.000598) (0.000540) (0.000509)
Year of Removal (d) 0.00161** 0.00169** 0.00107* 0.00131**(0.000740) (0.000691) (0.000630) (0.000590)
1+ Years After Removal (d) 0.000649 0.00222*** 0.000119 0.00149**(0.000891) (0.000837) (0.000757) (0.000708)
Individual Fixed E↵ects Y Y Y YYear Fixed E↵ects Y Y Y YAge and Tenure Controls Y Y Y YR-squared 0.000 0.001 0.000 0.001Indiv-Yr Obs. 1.500e+06 1.500e+06 1.500e+06 1.500e+06No. of Indiv. 220000 220000 220000 220000Sig Di↵ 1+Yr & -2Yr at 10% N Y N NSig Di↵ 0Yr & -2Yr at 10% N N N N
Notes: SE in parentheses. *** p<0.01, ** p<0.05, * p<0.1. Age and Tenure controls include quadratics in age and tenure. Fixed E↵ects includeindividual fixed e↵ects and year dummies. Transition into Self-Employed, 1k (d) is a dummy that takes the value 1 when an individual earns less than$1k of self-employed earnings this year, and more than $1k of self-employed earnings this year.
38
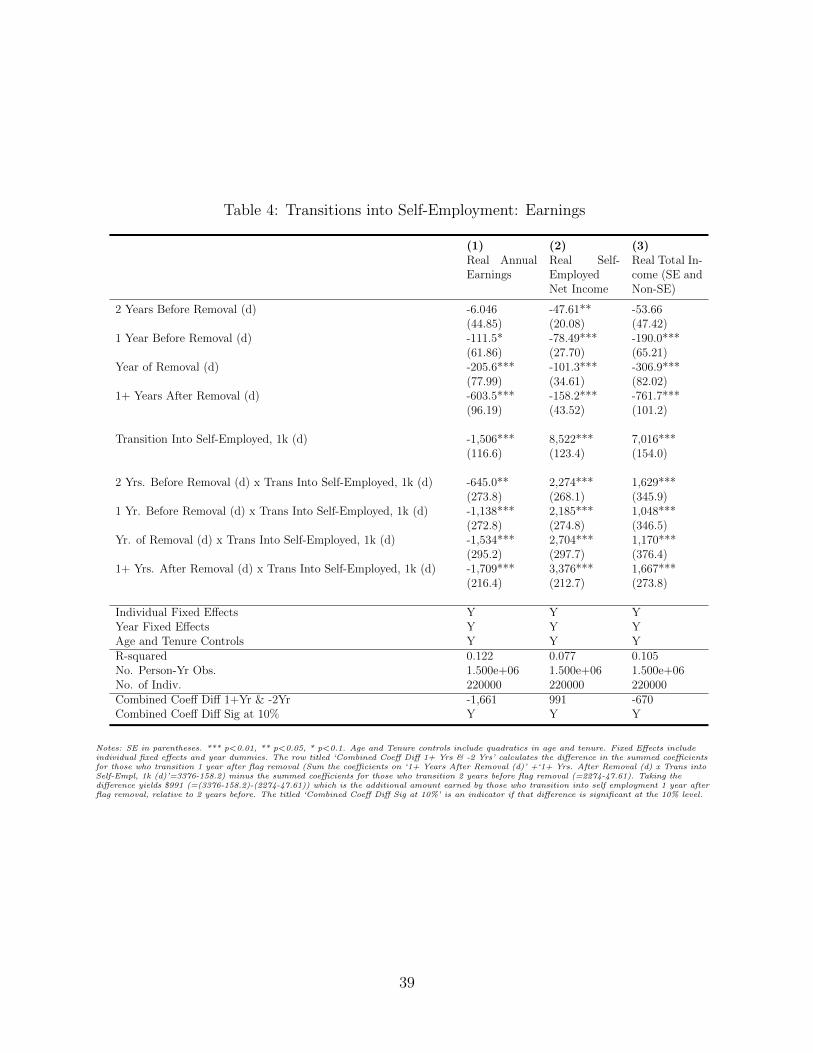
Table 4: Transitions into Self-Employment: Earnings
(1) (2) (3)Real AnnualEarnings
Real Self-EmployedNet Income
Real Total In-come (SE andNon-SE)
2 Years Before Removal (d) -6.046 -47.61** -53.66(44.85) (20.08) (47.42)
1 Year Before Removal (d) -111.5* -78.49*** -190.0***(61.86) (27.70) (65.21)
Year of Removal (d) -205.6*** -101.3*** -306.9***(77.99) (34.61) (82.02)
1+ Years After Removal (d) -603.5*** -158.2*** -761.7***(96.19) (43.52) (101.2)
Transition Into Self-Employed, 1k (d) -1,506*** 8,522*** 7,016***(116.6) (123.4) (154.0)
2 Yrs. Before Removal (d) x Trans Into Self-Employed, 1k (d) -645.0** 2,274*** 1,629***(273.8) (268.1) (345.9)
1 Yr. Before Removal (d) x Trans Into Self-Employed, 1k (d) -1,138*** 2,185*** 1,048***(272.8) (274.8) (346.5)
Yr. of Removal (d) x Trans Into Self-Employed, 1k (d) -1,534*** 2,704*** 1,170***(295.2) (297.7) (376.4)
1+ Yrs. After Removal (d) x Trans Into Self-Employed, 1k (d) -1,709*** 3,376*** 1,667***(216.4) (212.7) (273.8)
Individual Fixed E↵ects Y Y YYear Fixed E↵ects Y Y YAge and Tenure Controls Y Y YR-squared 0.122 0.077 0.105No. Person-Yr Obs. 1.500e+06 1.500e+06 1.500e+06No. of Indiv. 220000 220000 220000Combined Coe↵ Di↵ 1+Yr & -2Yr -1,661 991 -670Combined Coe↵ Di↵ Sig at 10% Y Y Y
Notes: SE in parentheses. *** p<0.01, ** p<0.05, * p<0.1. Age and Tenure controls include quadratics in age and tenure. Fixed E↵ects includeindividual fixed e↵ects and year dummies. The row titled ‘Combined Coe↵ Di↵ 1+ Yrs & -2 Yrs’ calculates the di↵erence in the summed coe�cientsfor those who transition 1 year after flag removal (Sum the coe�cients on ‘1+ Years After Removal (d)’ +‘1+ Yrs. After Removal (d) x Trans intoSelf-Empl, 1k (d)’=3376-158.2) minus the summed coe�cients for those who transition 2 years before flag removal (=2274-47.61). Taking thedi↵erence yields $991 (=(3376-158.2)-(2274-47.61)) which is the additional amount earned by those who transition into self employment 1 year afterflag removal, relative to 2 years before. The titled ‘Combined Coe↵ Di↵ Sig at 10%’ is an indicator if that di↵erence is significant at the 10% level.
39
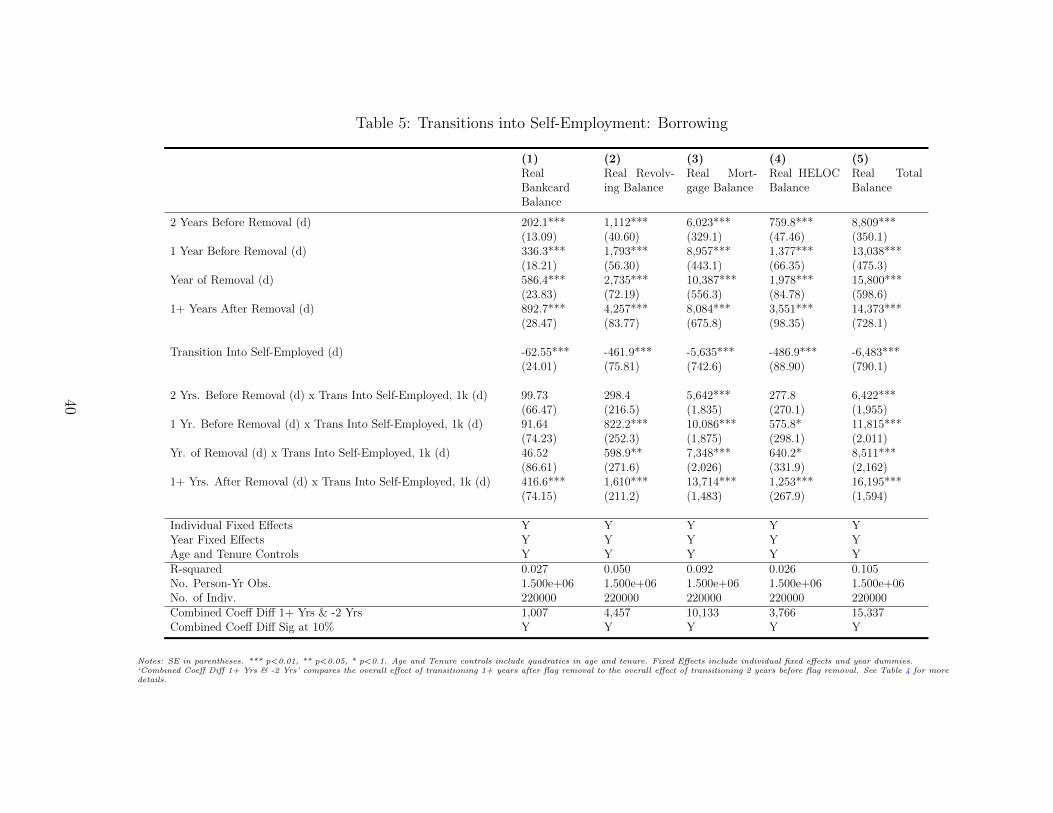
Table 5: Transitions into Self-Employment: Borrowing
(1) (2) (3) (4) (5)RealBankcardBalance
Real Revolv-ing Balance
Real Mort-gage Balance
Real HELOCBalance
Real TotalBalance
2 Years Before Removal (d) 202.1*** 1,112*** 6,023*** 759.8*** 8,809***(13.09) (40.60) (329.1) (47.46) (350.1)
1 Year Before Removal (d) 336.3*** 1,793*** 8,957*** 1,377*** 13,038***(18.21) (56.30) (443.1) (66.35) (475.3)
Year of Removal (d) 586.4*** 2,735*** 10,387*** 1,978*** 15,800***(23.83) (72.19) (556.3) (84.78) (598.6)
1+ Years After Removal (d) 892.7*** 4,257*** 8,084*** 3,551*** 14,373***(28.47) (83.77) (675.8) (98.35) (728.1)
Transition Into Self-Employed (d) -62.55*** -461.9*** -5,635*** -486.9*** -6,483***(24.01) (75.81) (742.6) (88.90) (790.1)
2 Yrs. Before Removal (d) x Trans Into Self-Employed, 1k (d) 99.73 298.4 5,642*** 277.8 6,422***(66.47) (216.5) (1,835) (270.1) (1,955)
1 Yr. Before Removal (d) x Trans Into Self-Employed, 1k (d) 91.64 822.2*** 10,086*** 575.8* 11,815***(74.23) (252.3) (1,875) (298.1) (2,011)
Yr. of Removal (d) x Trans Into Self-Employed, 1k (d) 46.52 598.9** 7,348*** 640.2* 8,511***(86.61) (271.6) (2,026) (331.9) (2,162)
1+ Yrs. After Removal (d) x Trans Into Self-Employed, 1k (d) 416.6*** 1,610*** 13,714*** 1,253*** 16,195***(74.15) (211.2) (1,483) (267.9) (1,594)
Individual Fixed E↵ects Y Y Y Y YYear Fixed E↵ects Y Y Y Y YAge and Tenure Controls Y Y Y Y YR-squared 0.027 0.050 0.092 0.026 0.105No. Person-Yr Obs. 1.500e+06 1.500e+06 1.500e+06 1.500e+06 1.500e+06No. of Indiv. 220000 220000 220000 220000 220000Combined Coe↵ Di↵ 1+ Yrs & -2 Yrs 1,007 4,457 10,133 3,766 15,337Combined Coe↵ Di↵ Sig at 10% Y Y Y Y Y
Notes: SE in parentheses. *** p<0.01, ** p<0.05, * p<0.1. Age and Tenure controls include quadratics in age and tenure. Fixed E↵ects include individual fixed e↵ects and year dummies.‘Combined Coe↵ Di↵ 1+ Yrs & -2 Yrs’ compares the overall e↵ect of transitioning 1+ years after flag removal to the overall e↵ect of transitioning 2 years before flag removal. See Table 4 for moredetails.
40
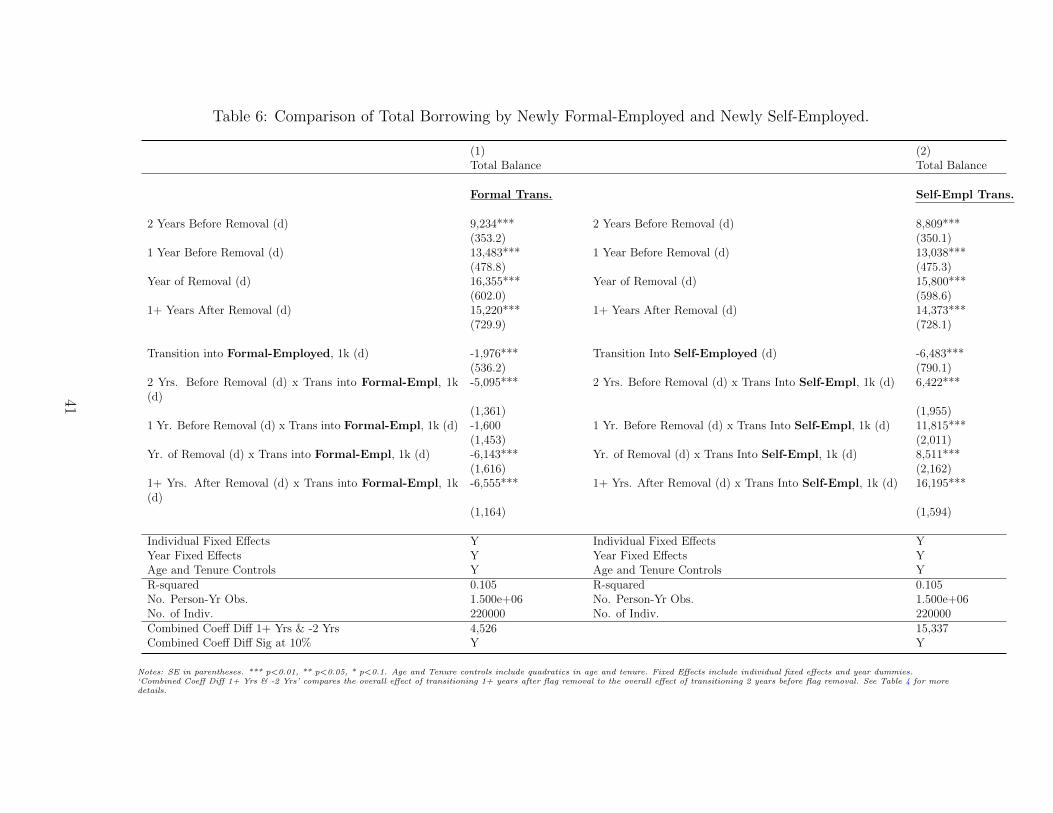
Table 6: Comparison of Total Borrowing by Newly Formal-Employed and Newly Self-Employed.
(1) (2)Total Balance Total Balance
Formal Trans. Self-Empl Trans.
2 Years Before Removal (d) 9,234*** 2 Years Before Removal (d) 8,809***(353.2) (350.1)
1 Year Before Removal (d) 13,483*** 1 Year Before Removal (d) 13,038***(478.8) (475.3)
Year of Removal (d) 16,355*** Year of Removal (d) 15,800***(602.0) (598.6)
1+ Years After Removal (d) 15,220*** 1+ Years After Removal (d) 14,373***(729.9) (728.1)
Transition into Formal-Employed, 1k (d) -1,976*** Transition Into Self-Employed (d) -6,483***(536.2) (790.1)
2 Yrs. Before Removal (d) x Trans into Formal-Empl, 1k(d)
-5,095*** 2 Yrs. Before Removal (d) x Trans Into Self-Empl, 1k (d) 6,422***
(1,361) (1,955)1 Yr. Before Removal (d) x Trans into Formal-Empl, 1k (d) -1,600 1 Yr. Before Removal (d) x Trans Into Self-Empl, 1k (d) 11,815***
(1,453) (2,011)Yr. of Removal (d) x Trans into Formal-Empl, 1k (d) -6,143*** Yr. of Removal (d) x Trans Into Self-Empl, 1k (d) 8,511***
(1,616) (2,162)1+ Yrs. After Removal (d) x Trans into Formal-Empl, 1k(d)
-6,555*** 1+ Yrs. After Removal (d) x Trans Into Self-Empl, 1k (d) 16,195***
(1,164) (1,594)
Individual Fixed E↵ects Y Individual Fixed E↵ects YYear Fixed E↵ects Y Year Fixed E↵ects YAge and Tenure Controls Y Age and Tenure Controls YR-squared 0.105 R-squared 0.105No. Person-Yr Obs. 1.500e+06 No. Person-Yr Obs. 1.500e+06No. of Indiv. 220000 No. of Indiv. 220000Combined Coe↵ Di↵ 1+ Yrs & -2 Yrs 4,526 15,337Combined Coe↵ Di↵ Sig at 10% Y Y
Notes: SE in parentheses. *** p<0.01, ** p<0.05, * p<0.1. Age and Tenure controls include quadratics in age and tenure. Fixed E↵ects include individual fixed e↵ects and year dummies.‘Combined Coe↵ Di↵ 1+ Yrs & -2 Yrs’ compares the overall e↵ect of transitioning 1+ years after flag removal to the overall e↵ect of transitioning 2 years before flag removal. See Table 4 for moredetails.
41

Table 7: Ownership of LBD Firms
(1) (2)LBD Firm Ownership,1+ Yrs (d)
LBD Firm Ownership,2+ Yrs (d)
2 Years Before Removal (d) -0.000126 1.30e-05(0.000172) (0.000110)
1 Year Before Removal (d) -0.000110 0.000113(0.000215) (0.000149)
Year of Removal (d) 0.000179 0.000394**(0.000259) (0.000191)
1+ Years After Removal (d) 0.000297 0.000540**(0.000334) (0.000230)
Individual Fixed E↵ects Y YYear Fixed E↵ects Y YAge and Tenure Controls Y YR-squared 0.001 0.000Indiv-Yr Obs. 1.500e+06 1.500e+06No. of Indiv. 220000 220000Sig Di↵ 1+Yr & -2Yr at 10% N YSig Di↵ 0Yr & -2Yr at 10% N Y
Notes: SE in parentheses. *** p<0.01, ** p<0.05, * p<0.1. The symbol (d) indicates a dummy variable. Age and Tenure controls include quadraticsin age and tenure. LBD Firm Ownership, 1+ Yrs (d) is a dummy for LBD firm ownership of 1 or more years. LBD Firm Ownership, 2+ Yrs (d) is adummy for LBD firm ownership of 2 or more years. For more details on LBD firm ownership measures, see Section 2.2.
42
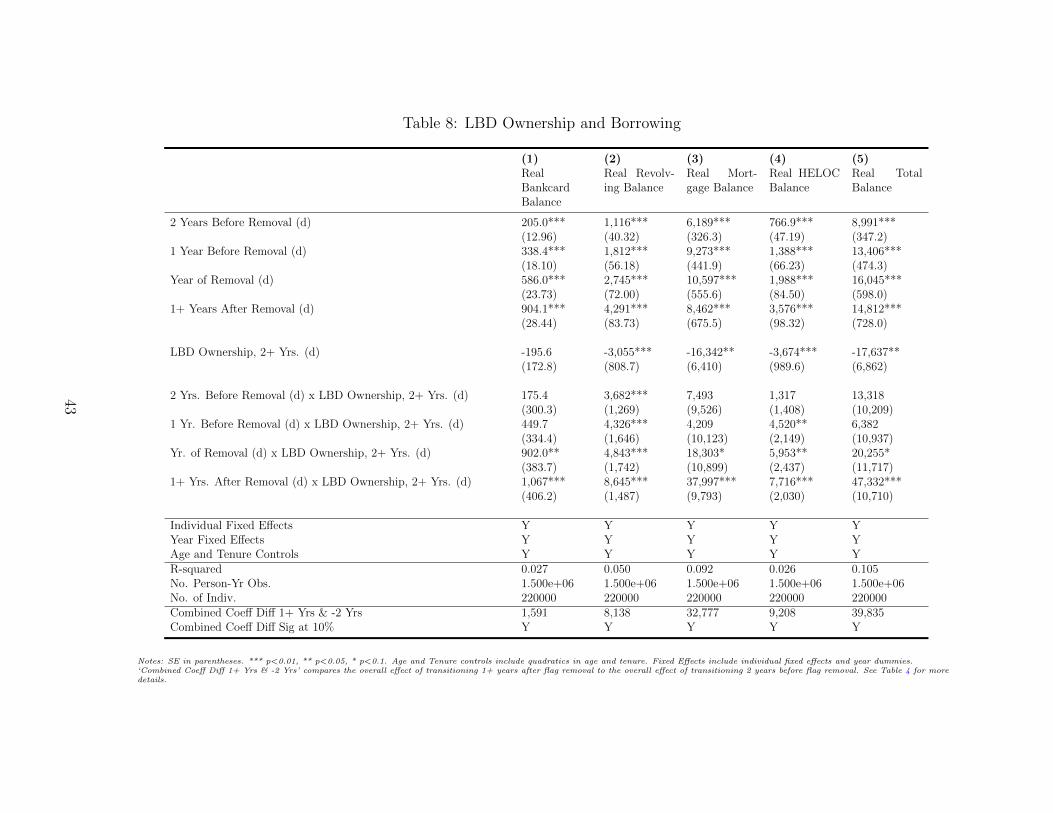
Table 8: LBD Ownership and Borrowing
(1) (2) (3) (4) (5)RealBankcardBalance
Real Revolv-ing Balance
Real Mort-gage Balance
Real HELOCBalance
Real TotalBalance
2 Years Before Removal (d) 205.0*** 1,116*** 6,189*** 766.9*** 8,991***(12.96) (40.32) (326.3) (47.19) (347.2)
1 Year Before Removal (d) 338.4*** 1,812*** 9,273*** 1,388*** 13,406***(18.10) (56.18) (441.9) (66.23) (474.3)
Year of Removal (d) 586.0*** 2,745*** 10,597*** 1,988*** 16,045***(23.73) (72.00) (555.6) (84.50) (598.0)
1+ Years After Removal (d) 904.1*** 4,291*** 8,462*** 3,576*** 14,812***(28.44) (83.73) (675.5) (98.32) (728.0)
LBD Ownership, 2+ Yrs. (d) -195.6 -3,055*** -16,342** -3,674*** -17,637**(172.8) (808.7) (6,410) (989.6) (6,862)
2 Yrs. Before Removal (d) x LBD Ownership, 2+ Yrs. (d) 175.4 3,682*** 7,493 1,317 13,318(300.3) (1,269) (9,526) (1,408) (10,209)
1 Yr. Before Removal (d) x LBD Ownership, 2+ Yrs. (d) 449.7 4,326*** 4,209 4,520** 6,382(334.4) (1,646) (10,123) (2,149) (10,937)
Yr. of Removal (d) x LBD Ownership, 2+ Yrs. (d) 902.0** 4,843*** 18,303* 5,953** 20,255*(383.7) (1,742) (10,899) (2,437) (11,717)
1+ Yrs. After Removal (d) x LBD Ownership, 2+ Yrs. (d) 1,067*** 8,645*** 37,997*** 7,716*** 47,332***(406.2) (1,487) (9,793) (2,030) (10,710)
Individual Fixed E↵ects Y Y Y Y YYear Fixed E↵ects Y Y Y Y YAge and Tenure Controls Y Y Y Y YR-squared 0.027 0.050 0.092 0.026 0.105No. Person-Yr Obs. 1.500e+06 1.500e+06 1.500e+06 1.500e+06 1.500e+06No. of Indiv. 220000 220000 220000 220000 220000Combined Coe↵ Di↵ 1+ Yrs & -2 Yrs 1,591 8,138 32,777 9,208 39,835Combined Coe↵ Di↵ Sig at 10% Y Y Y Y Y
Notes: SE in parentheses. *** p<0.01, ** p<0.05, * p<0.1. Age and Tenure controls include quadratics in age and tenure. Fixed E↵ects include individual fixed e↵ects and year dummies.‘Combined Coe↵ Di↵ 1+ Yrs & -2 Yrs’ compares the overall e↵ect of transitioning 1+ years after flag removal to the overall e↵ect of transitioning 2 years before flag removal. See Table 4 for moredetails.
43
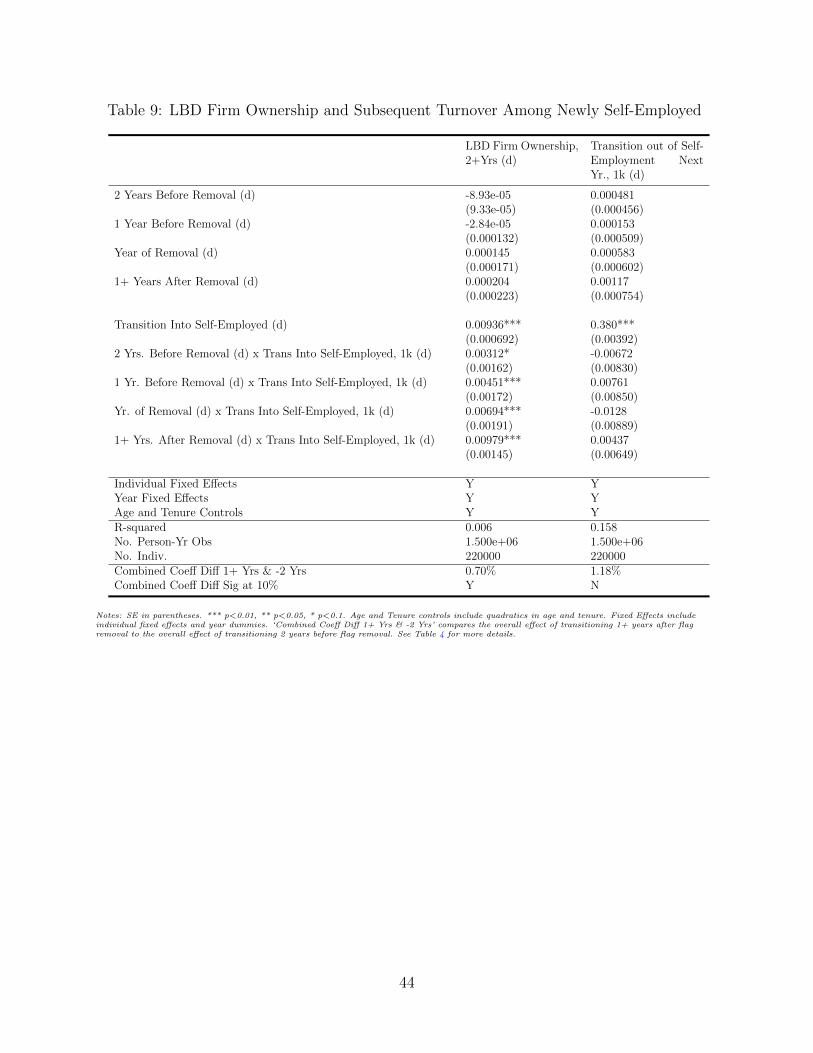
Table 9: LBD Firm Ownership and Subsequent Turnover Among Newly Self-Employed
LBD Firm Ownership,2+Yrs (d)
Transition out of Self-Employment NextYr., 1k (d)
2 Years Before Removal (d) -8.93e-05 0.000481(9.33e-05) (0.000456)
1 Year Before Removal (d) -2.84e-05 0.000153(0.000132) (0.000509)
Year of Removal (d) 0.000145 0.000583(0.000171) (0.000602)
1+ Years After Removal (d) 0.000204 0.00117(0.000223) (0.000754)
Transition Into Self-Employed (d) 0.00936*** 0.380***(0.000692) (0.00392)
2 Yrs. Before Removal (d) x Trans Into Self-Employed, 1k (d) 0.00312* -0.00672(0.00162) (0.00830)
1 Yr. Before Removal (d) x Trans Into Self-Employed, 1k (d) 0.00451*** 0.00761(0.00172) (0.00850)
Yr. of Removal (d) x Trans Into Self-Employed, 1k (d) 0.00694*** -0.0128(0.00191) (0.00889)
1+ Yrs. After Removal (d) x Trans Into Self-Employed, 1k (d) 0.00979*** 0.00437(0.00145) (0.00649)
Individual Fixed E↵ects Y YYear Fixed E↵ects Y YAge and Tenure Controls Y YR-squared 0.006 0.158No. Person-Yr Obs 1.500e+06 1.500e+06No. Indiv. 220000 220000Combined Coe↵ Di↵ 1+ Yrs & -2 Yrs 0.70% 1.18%Combined Coe↵ Di↵ Sig at 10% Y N
Notes: SE in parentheses. *** p<0.01, ** p<0.05, * p<0.1. Age and Tenure controls include quadratics in age and tenure. Fixed E↵ects includeindividual fixed e↵ects and year dummies. ‘Combined Coe↵ Di↵ 1+ Yrs & -2 Yrs’ compares the overall e↵ect of transitioning 1+ years after flagremoval to the overall e↵ect of transitioning 2 years before flag removal. See Table 4 for more details.
44
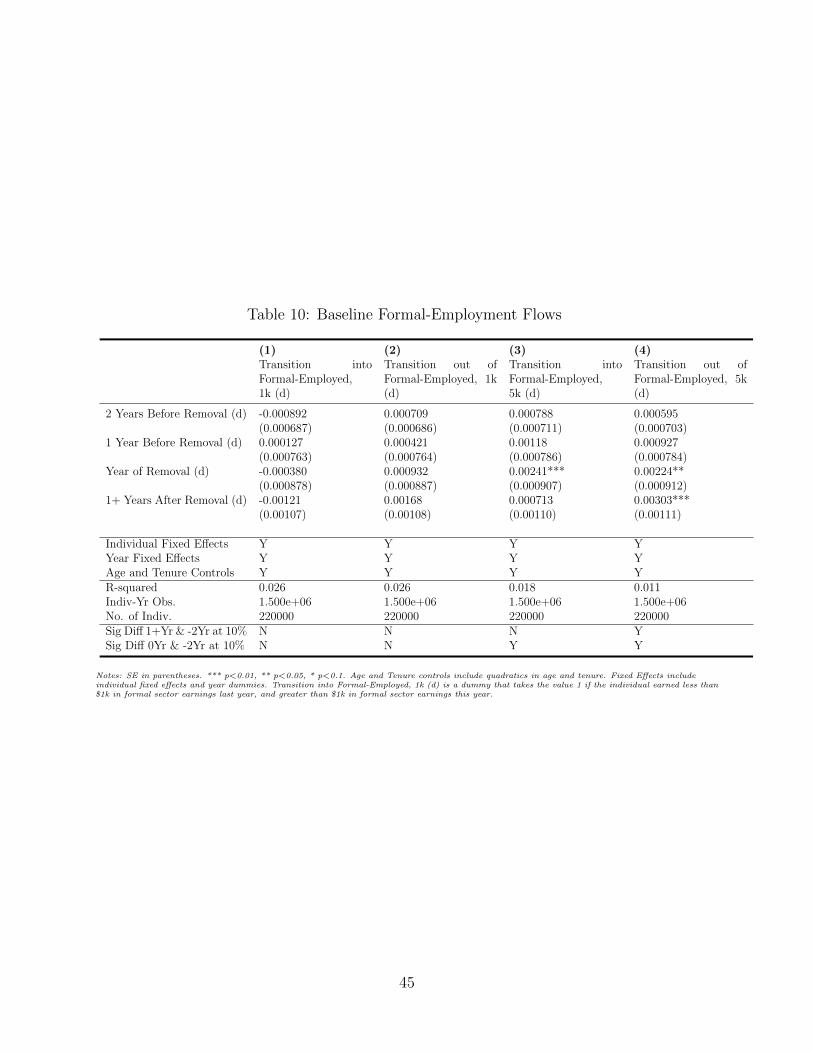
Table 10: Baseline Formal-Employment Flows
(1) (2) (3) (4)Transition intoFormal-Employed,1k (d)
Transition out ofFormal-Employed, 1k(d)
Transition intoFormal-Employed,5k (d)
Transition out ofFormal-Employed, 5k(d)
2 Years Before Removal (d) -0.000892 0.000709 0.000788 0.000595(0.000687) (0.000686) (0.000711) (0.000703)
1 Year Before Removal (d) 0.000127 0.000421 0.00118 0.000927(0.000763) (0.000764) (0.000786) (0.000784)
Year of Removal (d) -0.000380 0.000932 0.00241*** 0.00224**(0.000878) (0.000887) (0.000907) (0.000912)
1+ Years After Removal (d) -0.00121 0.00168 0.000713 0.00303***(0.00107) (0.00108) (0.00110) (0.00111)
Individual Fixed E↵ects Y Y Y YYear Fixed E↵ects Y Y Y YAge and Tenure Controls Y Y Y YR-squared 0.026 0.026 0.018 0.011Indiv-Yr Obs. 1.500e+06 1.500e+06 1.500e+06 1.500e+06No. of Indiv. 220000 220000 220000 220000Sig Di↵ 1+Yr & -2Yr at 10% N N N YSig Di↵ 0Yr & -2Yr at 10% N N Y Y
Notes: SE in parentheses. *** p<0.01, ** p<0.05, * p<0.1. Age and Tenure controls include quadratics in age and tenure. Fixed E↵ects includeindividual fixed e↵ects and year dummies. Transition into Formal-Employed, 1k (d) is a dummy that takes the value 1 if the individual earned less than$1k in formal sector earnings last year, and greater than $1k in formal sector earnings this year.
45
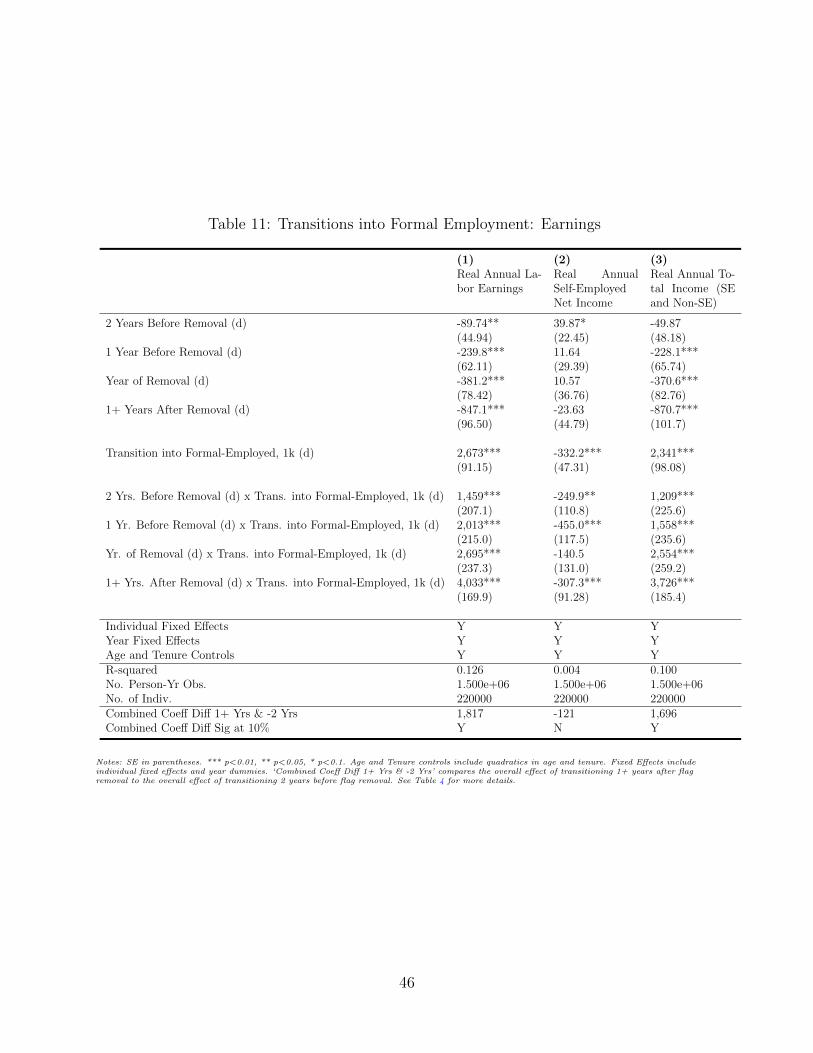
Table 11: Transitions into Formal Employment: Earnings
(1) (2) (3)Real Annual La-bor Earnings
Real AnnualSelf-EmployedNet Income
Real Annual To-tal Income (SEand Non-SE)
2 Years Before Removal (d) -89.74** 39.87* -49.87(44.94) (22.45) (48.18)
1 Year Before Removal (d) -239.8*** 11.64 -228.1***(62.11) (29.39) (65.74)
Year of Removal (d) -381.2*** 10.57 -370.6***(78.42) (36.76) (82.76)
1+ Years After Removal (d) -847.1*** -23.63 -870.7***(96.50) (44.79) (101.7)
Transition into Formal-Employed, 1k (d) 2,673*** -332.2*** 2,341***(91.15) (47.31) (98.08)
2 Yrs. Before Removal (d) x Trans. into Formal-Employed, 1k (d) 1,459*** -249.9** 1,209***(207.1) (110.8) (225.6)
1 Yr. Before Removal (d) x Trans. into Formal-Employed, 1k (d) 2,013*** -455.0*** 1,558***(215.0) (117.5) (235.6)
Yr. of Removal (d) x Trans. into Formal-Employed, 1k (d) 2,695*** -140.5 2,554***(237.3) (131.0) (259.2)
1+ Yrs. After Removal (d) x Trans. into Formal-Employed, 1k (d) 4,033*** -307.3*** 3,726***(169.9) (91.28) (185.4)
Individual Fixed E↵ects Y Y YYear Fixed E↵ects Y Y YAge and Tenure Controls Y Y YR-squared 0.126 0.004 0.100No. Person-Yr Obs. 1.500e+06 1.500e+06 1.500e+06No. of Indiv. 220000 220000 220000Combined Coe↵ Di↵ 1+ Yrs & -2 Yrs 1,817 -121 1,696Combined Coe↵ Di↵ Sig at 10% Y N Y
Notes: SE in parentheses. *** p<0.01, ** p<0.05, * p<0.1. Age and Tenure controls include quadratics in age and tenure. Fixed E↵ects includeindividual fixed e↵ects and year dummies. ‘Combined Coe↵ Di↵ 1+ Yrs & -2 Yrs’ compares the overall e↵ect of transitioning 1+ years after flagremoval to the overall e↵ect of transitioning 2 years before flag removal. See Table 4 for more details.
46
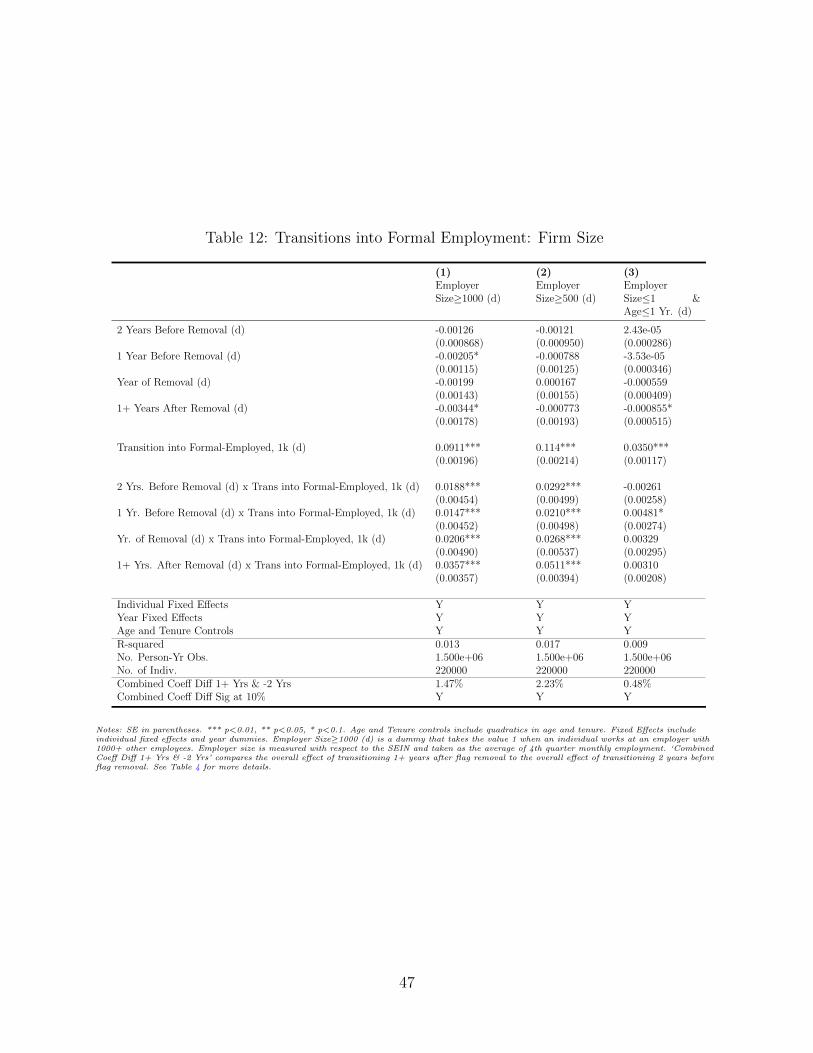
Table 12: Transitions into Formal Employment: Firm Size
(1) (2) (3)EmployerSize�1000 (d)
EmployerSize�500 (d)
EmployerSize1 &Age1 Yr. (d)
2 Years Before Removal (d) -0.00126 -0.00121 2.43e-05(0.000868) (0.000950) (0.000286)
1 Year Before Removal (d) -0.00205* -0.000788 -3.53e-05(0.00115) (0.00125) (0.000346)
Year of Removal (d) -0.00199 0.000167 -0.000559(0.00143) (0.00155) (0.000409)
1+ Years After Removal (d) -0.00344* -0.000773 -0.000855*(0.00178) (0.00193) (0.000515)
Transition into Formal-Employed, 1k (d) 0.0911*** 0.114*** 0.0350***(0.00196) (0.00214) (0.00117)
2 Yrs. Before Removal (d) x Trans into Formal-Employed, 1k (d) 0.0188*** 0.0292*** -0.00261(0.00454) (0.00499) (0.00258)
1 Yr. Before Removal (d) x Trans into Formal-Employed, 1k (d) 0.0147*** 0.0210*** 0.00481*(0.00452) (0.00498) (0.00274)
Yr. of Removal (d) x Trans into Formal-Employed, 1k (d) 0.0206*** 0.0268*** 0.00329(0.00490) (0.00537) (0.00295)
1+ Yrs. After Removal (d) x Trans into Formal-Employed, 1k (d) 0.0357*** 0.0511*** 0.00310(0.00357) (0.00394) (0.00208)
Individual Fixed E↵ects Y Y YYear Fixed E↵ects Y Y YAge and Tenure Controls Y Y YR-squared 0.013 0.017 0.009No. Person-Yr Obs. 1.500e+06 1.500e+06 1.500e+06No. of Indiv. 220000 220000 220000Combined Coe↵ Di↵ 1+ Yrs & -2 Yrs 1.47% 2.23% 0.48%Combined Coe↵ Di↵ Sig at 10% Y Y Y
Notes: SE in parentheses. *** p<0.01, ** p<0.05, * p<0.1. Age and Tenure controls include quadratics in age and tenure. Fixed E↵ects includeindividual fixed e↵ects and year dummies. Employer Size�1000 (d) is a dummy that takes the value 1 when an individual works at an employer with1000+ other employees. Employer size is measured with respect to the SEIN and taken as the average of 4th quarter monthly employment. ‘CombinedCoe↵ Di↵ 1+ Yrs & -2 Yrs’ compares the overall e↵ect of transitioning 1+ years after flag removal to the overall e↵ect of transitioning 2 years beforeflag removal. See Table 4 for more details.
47
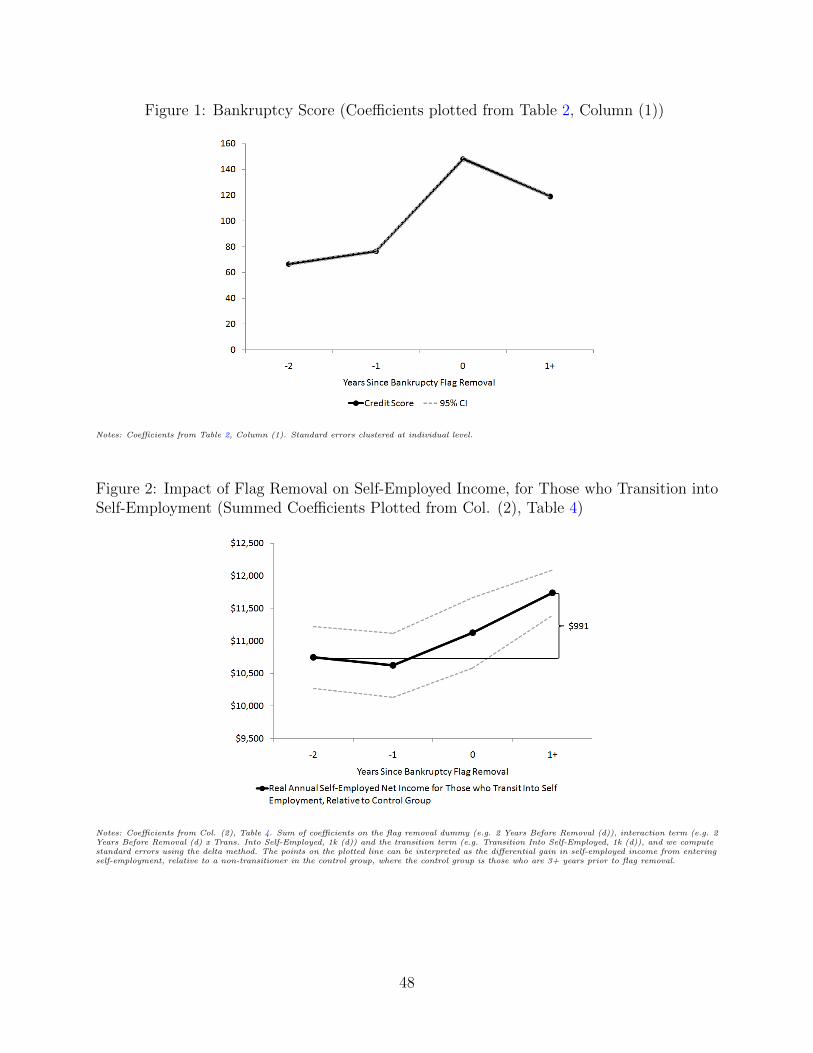
Figure 1: Bankruptcy Score (Coe�cients plotted from Table 2, Column (1))
Notes: Coe�cients from Table 2, Column (1). Standard errors clustered at individual level.
Figure 2: Impact of Flag Removal on Self-Employed Income, for Those who Transition intoSelf-Employment (Summed Coe�cients Plotted from Col. (2), Table 4)
Notes: Coe�cients from Col. (2), Table 4. Sum of coe�cients on the flag removal dummy (e.g. 2 Years Before Removal (d)), interaction term (e.g. 2Years Before Removal (d) x Trans. Into Self-Employed, 1k (d)) and the transition term (e.g. Transition Into Self-Employed, 1k (d)), and we computestandard errors using the delta method. The points on the plotted line can be interpreted as the di↵erential gain in self-employed income from enteringself-employment, relative to a non-transitioner in the control group, where the control group is those who are 3+ years prior to flag removal.
48
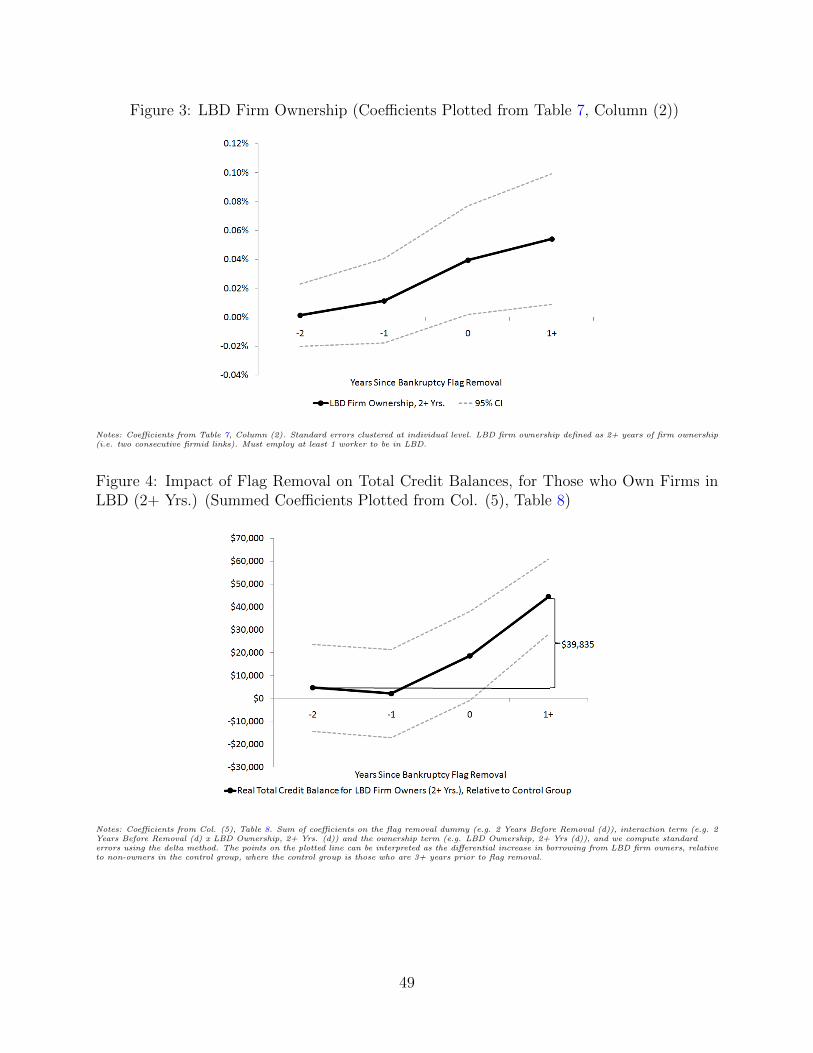
Figure 3: LBD Firm Ownership (Coe�cients Plotted from Table 7, Column (2))
Notes: Coe�cients from Table 7, Column (2). Standard errors clustered at individual level. LBD firm ownership defined as 2+ years of firm ownership(i.e. two consecutive firmid links). Must employ at least 1 worker to be in LBD.
Figure 4: Impact of Flag Removal on Total Credit Balances, for Those who Own Firms inLBD (2+ Yrs.) (Summed Coe�cients Plotted from Col. (5), Table 8)
Notes: Coe�cients from Col. (5), Table 8. Sum of coe�cients on the flag removal dummy (e.g. 2 Years Before Removal (d)), interaction term (e.g. 2Years Before Removal (d) x LBD Ownership, 2+ Yrs. (d)) and the ownership term (e.g. LBD Ownership, 2+ Yrs (d)), and we compute standarderrors using the delta method. The points on the plotted line can be interpreted as the di↵erential increase in borrowing from LBD firm owners, relativeto non-owners in the control group, where the control group is those who are 3+ years prior to flag removal.
49
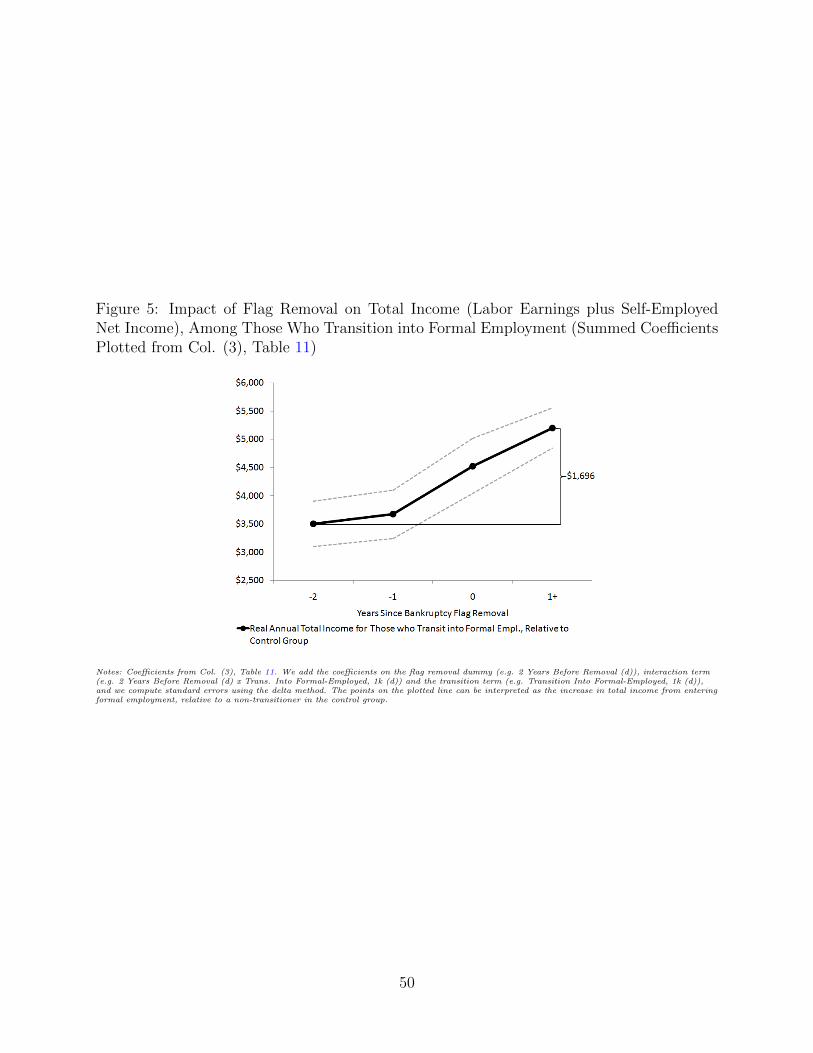
Figure 5: Impact of Flag Removal on Total Income (Labor Earnings plus Self-EmployedNet Income), Among Those Who Transition into Formal Employment (Summed Coe�cientsPlotted from Col. (3), Table 11)
Notes: Coe�cients from Col. (3), Table 11. We add the coe�cients on the flag removal dummy (e.g. 2 Years Before Removal (d)), interaction term(e.g. 2 Years Before Removal (d) x Trans. Into Formal-Employed, 1k (d)) and the transition term (e.g. Transition Into Formal-Employed, 1k (d)),and we compute standard errors using the delta method. The points on the plotted line can be interpreted as the increase in total income from enteringformal employment, relative to a non-transitioner in the control group.
50
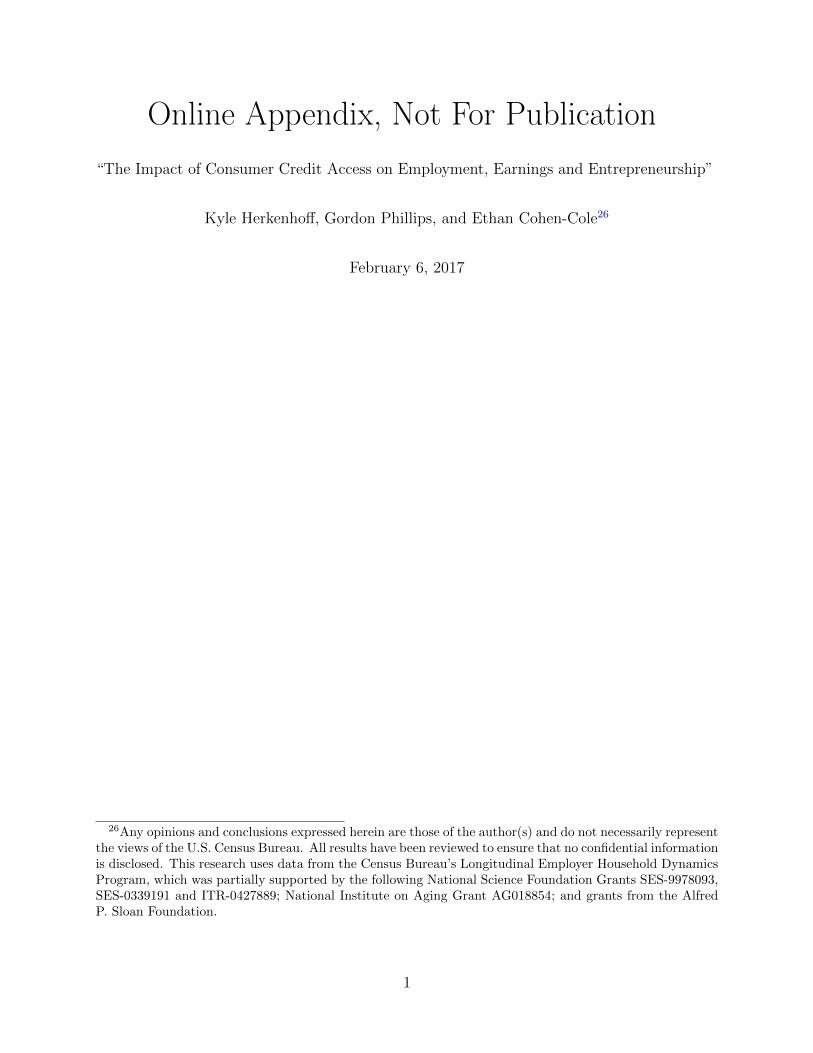
Online Appendix, Not For Publication
“The Impact of Consumer Credit Access on Employment, Earnings and Entrepreneurship”
Kyle Herkenho↵, Gordon Phillips, and Ethan Cohen-Cole26
February 6, 2017
26Any opinions and conclusions expressed herein are those of the author(s) and do not necessarily representthe views of the U.S. Census Bureau. All results have been reviewed to ensure that no confidential informationis disclosed. This research uses data from the Census Bureau’s Longitudinal Employer Household DynamicsProgram, which was partially supported by the following National Science Foundation Grants SES-9978093,SES-0339191 and ITR-0427889; National Institute on Aging Grant AG018854; and grants from the AlfredP. Sloan Foundation.
1
A Details on the Integrated Longitudinal Business Database
(ILBD)
The ILBD merges two di↵erent databases. The first database is the Longitudinal Business
Database (LBD) which tracks the universe of all U.S. establishments that have paid em-
ployees.27 The second database is the universe of IRS non-employer tax records (i.e. those
who fill out 1040 Schedule C tax returns). As soon as an entity hires a non-contractor,
full-time employee, the business owner must obtain an EIN and will enter the LBD.28 Davis
et al. [2007] construct the ILBD using the SSN-EIN link found on the application for an
EIN, and they also use exact business name matches. This yields a crosswalk between non-
employers and the subsequent businesses they become.29 We subsequently merge the ILBD
using anonymized unique identifiers to our credit bureau data and the LEHD.
27“Overview: The Longitudinal Business Database (LBD) is a research dataset constructed at the Centerfor Economic Studies (CES) in the U.S. Census Bureau. The LBD contains the universe of all U.S. business es-tablishments with paid employees listed in the Census Bureaus business register.” http://maryannfeldman.web.unc.edu/data-sources/longitudinal-databases/longitudinal-business-database/
28According to the IRS, “As a business owner, when another person performs work for you, you must firstcorrectly classify that person as an independent contractor or employee. If the person is an independentcontractor, refer to Forms and Associated Taxes for Independent Contractors for your tax responsibilities.If the person is classified as an employee you must have an Employer Identification Number (EIN). Yourtax responsibilities include withholding, depositing, reporting, and paying employment taxes. You mustalso give certain forms to your employees, they must give certain forms to you, and you must send cer-tain forms to the IRS and SSA.” https://www.irs.gov/businesses/small-businesses-self-employed/businesses-with-employees
29Quoting from Davis et al. [2007] “...we create a set of firm-level matches between employers and nonem-ployers for our selected industries. These matches rely on numeric identifiers and exact literal matches onbusiness names. In matching on numeric identifiers, we exploit the fact that many business records containboth an EIN and an SSN. For example, when a business owner or o�cer applies for an EIN, he or she mustfill out an SS-4 form for the IRS. This form includes the business name, the EIN and the SSN of the businessowner or chief o�cer, all of which are included in Census Bureau business registers. These data allow us tobuild a crosswalk between EINs and SSNs, which we then use to match business records across universes...we rely only on the EIN-SSN crosswalk and exact literal matches on business name. As an example of howour matching algorithm works, consider all establishments with employees in our selected industries as of2000. Using the longitudinal links in the LBD, we first create a set of identifiers (EINs, SSNs and businessnames) associated with each establishment with employees in 2000 for each year back to 1992... About 17percent of our employer-nonemployer matches rely on exact literal matches on business name strings.”
2
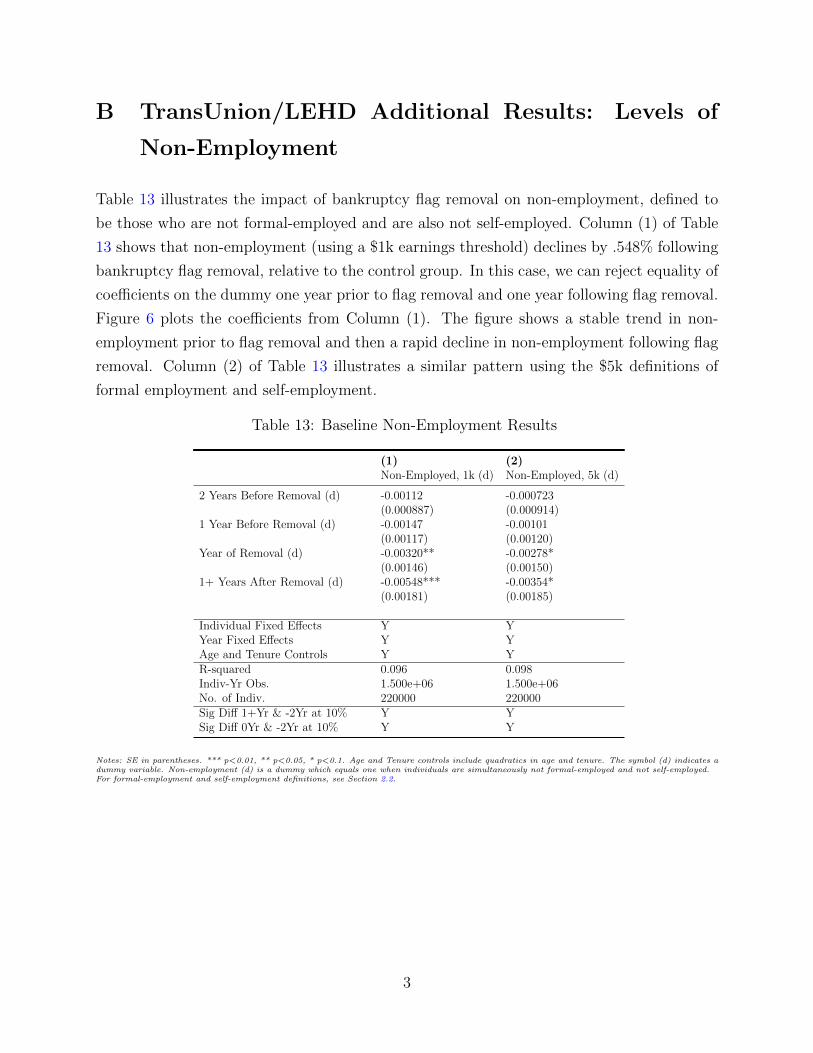
B TransUnion/LEHD Additional Results: Levels of
Non-Employment
Table 13 illustrates the impact of bankruptcy flag removal on non-employment, defined to
be those who are not formal-employed and are also not self-employed. Column (1) of Table
13 shows that non-employment (using a $1k earnings threshold) declines by .548% following
bankruptcy flag removal, relative to the control group. In this case, we can reject equality of
coe�cients on the dummy one year prior to flag removal and one year following flag removal.
Figure 6 plots the coe�cients from Column (1). The figure shows a stable trend in non-
employment prior to flag removal and then a rapid decline in non-employment following flag
removal. Column (2) of Table 13 illustrates a similar pattern using the $5k definitions of
formal employment and self-employment.
Table 13: Baseline Non-Employment Results
(1) (2)Non-Employed, 1k (d) Non-Employed, 5k (d)
2 Years Before Removal (d) -0.00112 -0.000723(0.000887) (0.000914)
1 Year Before Removal (d) -0.00147 -0.00101(0.00117) (0.00120)
Year of Removal (d) -0.00320** -0.00278*(0.00146) (0.00150)
1+ Years After Removal (d) -0.00548*** -0.00354*(0.00181) (0.00185)
Individual Fixed E↵ects Y YYear Fixed E↵ects Y YAge and Tenure Controls Y YR-squared 0.096 0.098Indiv-Yr Obs. 1.500e+06 1.500e+06No. of Indiv. 220000 220000Sig Di↵ 1+Yr & -2Yr at 10% Y YSig Di↵ 0Yr & -2Yr at 10% Y Y
Notes: SE in parentheses. *** p<0.01, ** p<0.05, * p<0.1. Age and Tenure controls include quadratics in age and tenure. The symbol (d) indicates adummy variable. Non-employment (d) is a dummy which equals one when individuals are simultaneously not formal-employed and not self-employed.For formal-employment and self-employment definitions, see Section 2.2.
3
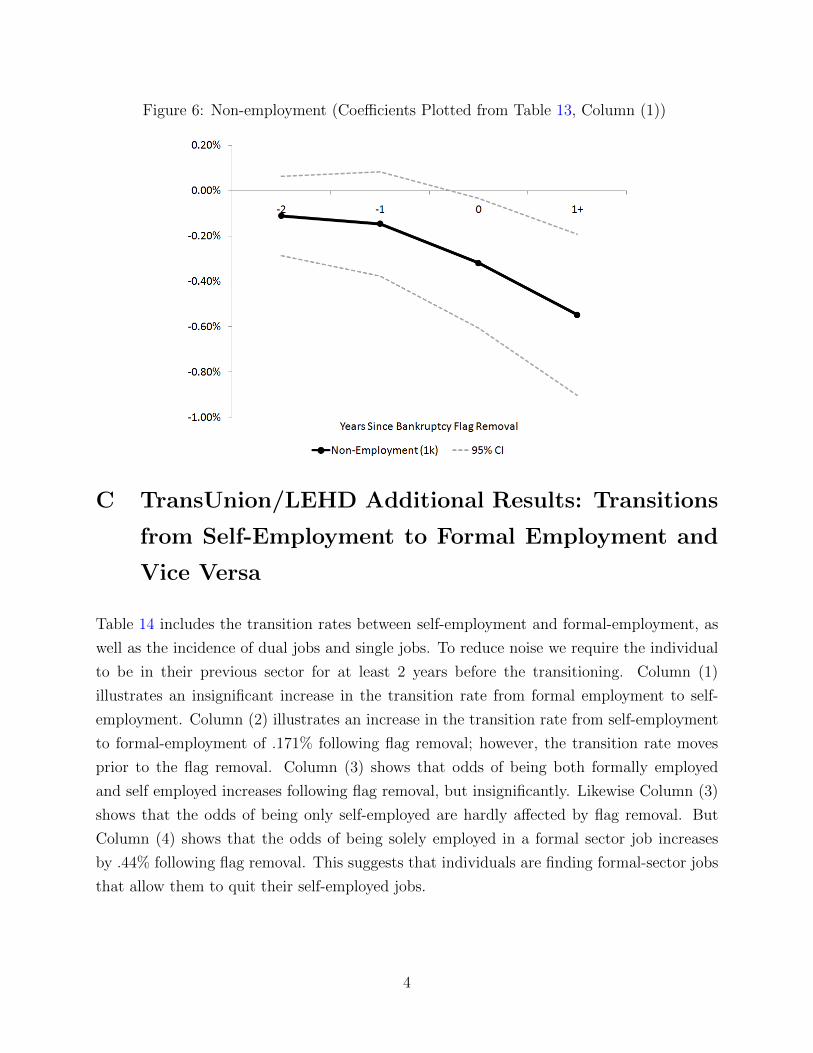
Figure 6: Non-employment (Coe�cients Plotted from Table 13, Column (1))
C TransUnion/LEHD Additional Results: Transitions
from Self-Employment to Formal Employment and
Vice Versa
Table 14 includes the transition rates between self-employment and formal-employment, as
well as the incidence of dual jobs and single jobs. To reduce noise we require the individual
to be in their previous sector for at least 2 years before the transitioning. Column (1)
illustrates an insignificant increase in the transition rate from formal employment to self-
employment. Column (2) illustrates an increase in the transition rate from self-employment
to formal-employment of .171% following flag removal; however, the transition rate moves
prior to the flag removal. Column (3) shows that odds of being both formally employed
and self employed increases following flag removal, but insignificantly. Likewise Column (3)
shows that the odds of being only self-employed are hardly a↵ected by flag removal. But
Column (4) shows that the odds of being solely employed in a formal sector job increases
by .44% following flag removal. This suggests that individuals are finding formal-sector jobs
that allow them to quit their self-employed jobs.
4
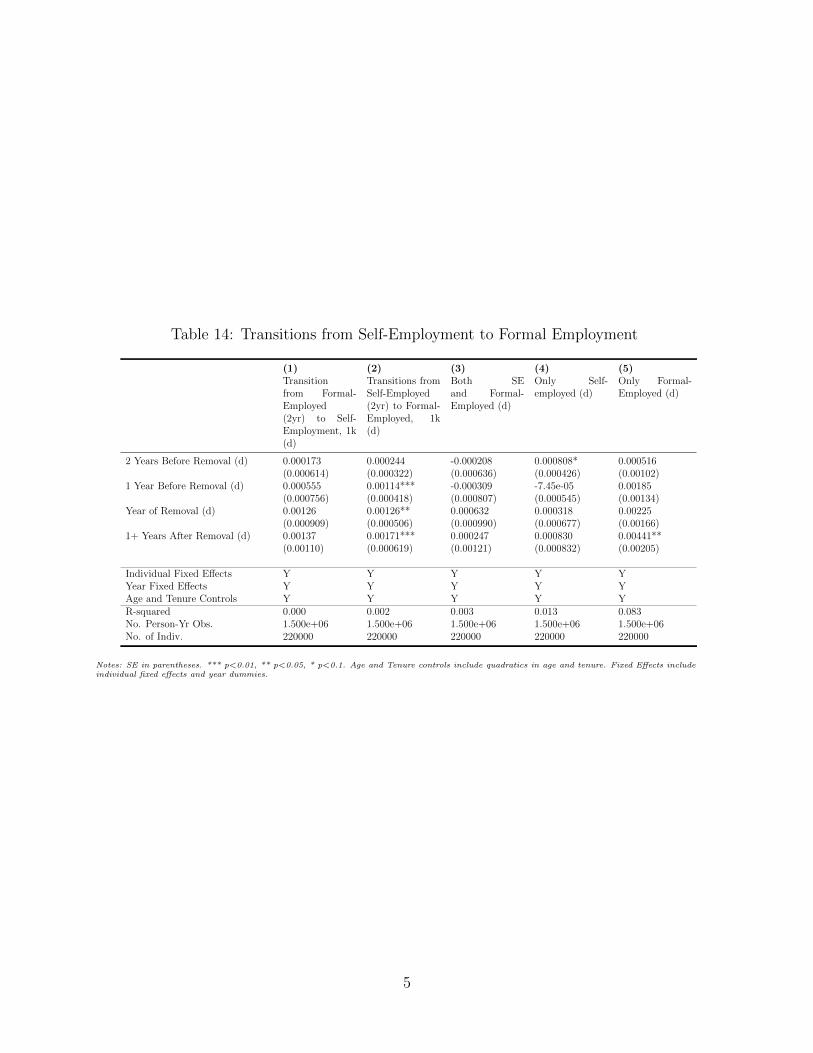
Table 14: Transitions from Self-Employment to Formal Employment
(1) (2) (3) (4) (5)Transitionfrom Formal-Employed(2yr) to Self-Employment, 1k(d)
Transitions fromSelf-Employed(2yr) to Formal-Employed, 1k(d)
Both SEand Formal-Employed (d)
Only Self-employed (d)
Only Formal-Employed (d)
2 Years Before Removal (d) 0.000173 0.000244 -0.000208 0.000808* 0.000516(0.000614) (0.000322) (0.000636) (0.000426) (0.00102)
1 Year Before Removal (d) 0.000555 0.00114*** -0.000309 -7.45e-05 0.00185(0.000756) (0.000418) (0.000807) (0.000545) (0.00134)
Year of Removal (d) 0.00126 0.00126** 0.000632 0.000318 0.00225(0.000909) (0.000506) (0.000990) (0.000677) (0.00166)
1+ Years After Removal (d) 0.00137 0.00171*** 0.000247 0.000830 0.00441**(0.00110) (0.000619) (0.00121) (0.000832) (0.00205)
Individual Fixed E↵ects Y Y Y Y YYear Fixed E↵ects Y Y Y Y YAge and Tenure Controls Y Y Y Y YR-squared 0.000 0.002 0.003 0.013 0.083No. Person-Yr Obs. 1.500e+06 1.500e+06 1.500e+06 1.500e+06 1.500e+06No. of Indiv. 220000 220000 220000 220000 220000
Notes: SE in parentheses. *** p<0.01, ** p<0.05, * p<0.1. Age and Tenure controls include quadratics in age and tenure. Fixed E↵ects includeindividual fixed e↵ects and year dummies.
5
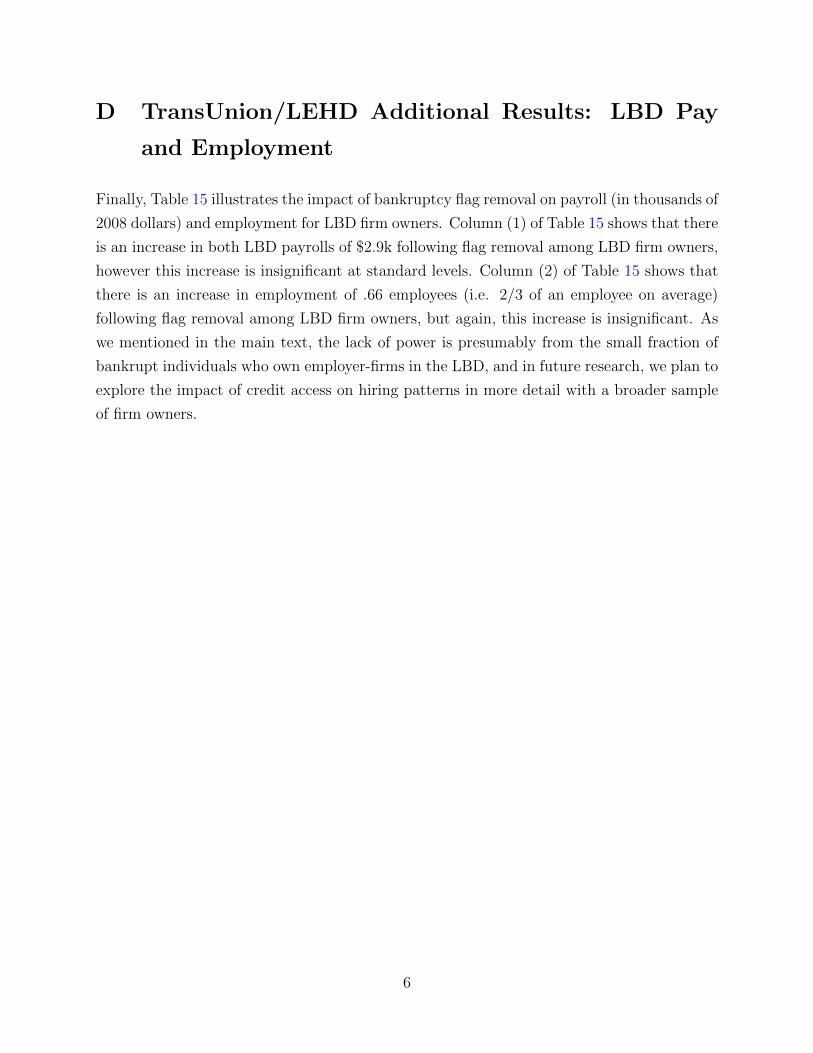
D TransUnion/LEHD Additional Results: LBD Pay
and Employment
Finally, Table 15 illustrates the impact of bankruptcy flag removal on payroll (in thousands of
2008 dollars) and employment for LBD firm owners. Column (1) of Table 15 shows that there
is an increase in both LBD payrolls of $2.9k following flag removal among LBD firm owners,
however this increase is insignificant at standard levels. Column (2) of Table 15 shows that
there is an increase in employment of .66 employees (i.e. 2/3 of an employee on average)
following flag removal among LBD firm owners, but again, this increase is insignificant. As
we mentioned in the main text, the lack of power is presumably from the small fraction of
bankrupt individuals who own employer-firms in the LBD, and in future research, we plan to
explore the impact of credit access on hiring patterns in more detail with a broader sample
of firm owners.
6
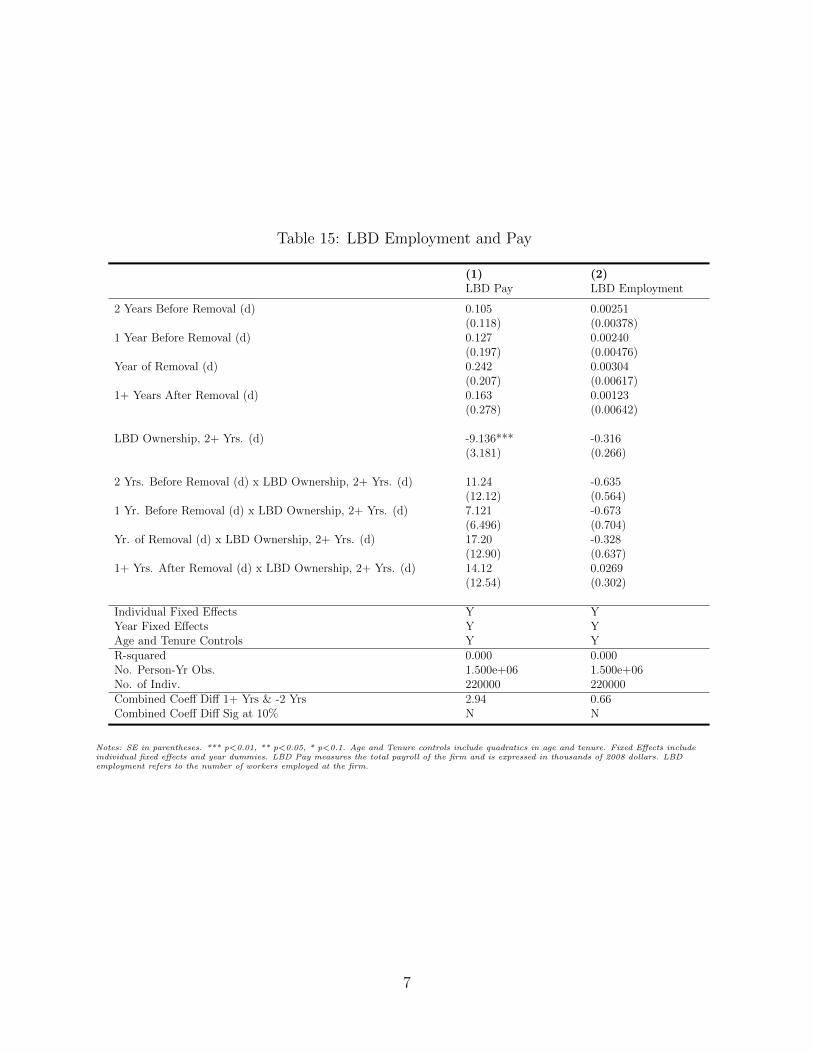
Table 15: LBD Employment and Pay
(1) (2)LBD Pay LBD Employment
2 Years Before Removal (d) 0.105 0.00251(0.118) (0.00378)
1 Year Before Removal (d) 0.127 0.00240(0.197) (0.00476)
Year of Removal (d) 0.242 0.00304(0.207) (0.00617)
1+ Years After Removal (d) 0.163 0.00123(0.278) (0.00642)
LBD Ownership, 2+ Yrs. (d) -9.136*** -0.316(3.181) (0.266)
2 Yrs. Before Removal (d) x LBD Ownership, 2+ Yrs. (d) 11.24 -0.635(12.12) (0.564)
1 Yr. Before Removal (d) x LBD Ownership, 2+ Yrs. (d) 7.121 -0.673(6.496) (0.704)
Yr. of Removal (d) x LBD Ownership, 2+ Yrs. (d) 17.20 -0.328(12.90) (0.637)
1+ Yrs. After Removal (d) x LBD Ownership, 2+ Yrs. (d) 14.12 0.0269(12.54) (0.302)
Individual Fixed E↵ects Y YYear Fixed E↵ects Y YAge and Tenure Controls Y YR-squared 0.000 0.000No. Person-Yr Obs. 1.500e+06 1.500e+06No. of Indiv. 220000 220000Combined Coe↵ Di↵ 1+ Yrs & -2 Yrs 2.94 0.66Combined Coe↵ Di↵ Sig at 10% N N
Notes: SE in parentheses. *** p<0.01, ** p<0.05, * p<0.1. Age and Tenure controls include quadratics in age and tenure. Fixed E↵ects includeindividual fixed e↵ects and year dummies. LBD Pay measures the total payroll of the firm and is expressed in thousands of 2008 dollars. LBDemployment refers to the number of workers employed at the firm.
7
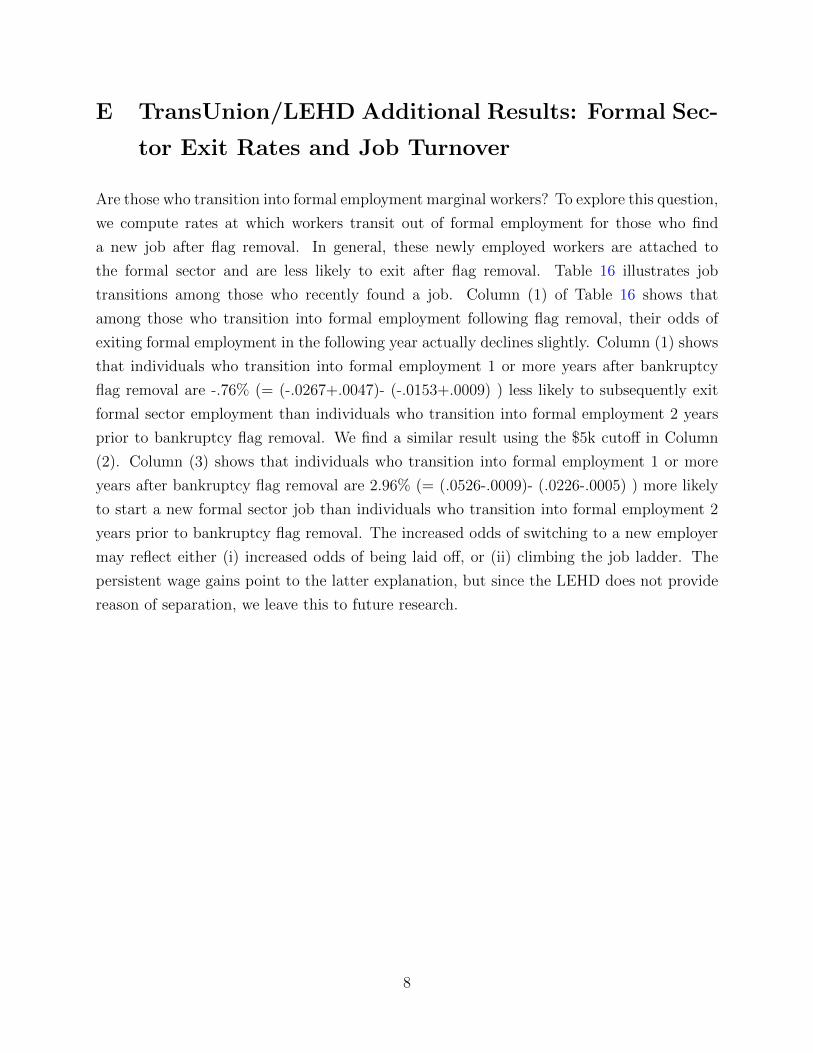
E TransUnion/LEHD Additional Results: Formal Sec-
tor Exit Rates and Job Turnover
Are those who transition into formal employment marginal workers? To explore this question,
we compute rates at which workers transit out of formal employment for those who find
a new job after flag removal. In general, these newly employed workers are attached to
the formal sector and are less likely to exit after flag removal. Table 16 illustrates job
transitions among those who recently found a job. Column (1) of Table 16 shows that
among those who transition into formal employment following flag removal, their odds of
exiting formal employment in the following year actually declines slightly. Column (1) shows
that individuals who transition into formal employment 1 or more years after bankruptcy
flag removal are -.76% (= (-.0267+.0047)- (-.0153+.0009) ) less likely to subsequently exit
formal sector employment than individuals who transition into formal employment 2 years
prior to bankruptcy flag removal. We find a similar result using the $5k cuto↵ in Column
(2). Column (3) shows that individuals who transition into formal employment 1 or more
years after bankruptcy flag removal are 2.96% (= (.0526-.0009)- (.0226-.0005) ) more likely
to start a new formal sector job than individuals who transition into formal employment 2
years prior to bankruptcy flag removal. The increased odds of switching to a new employer
may reflect either (i) increased odds of being laid o↵, or (ii) climbing the job ladder. The
persistent wage gains point to the latter explanation, but since the LEHD does not provide
reason of separation, we leave this to future research.
8
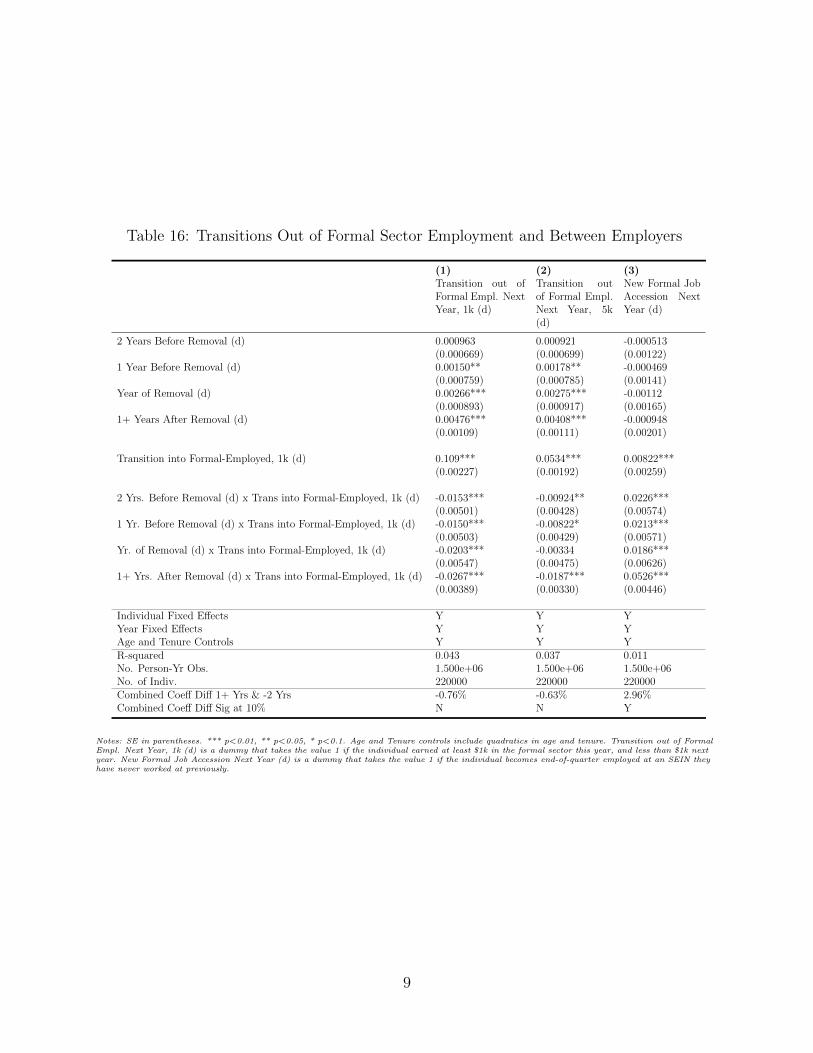
Table 16: Transitions Out of Formal Sector Employment and Between Employers
(1) (2) (3)Transition out ofFormal Empl. NextYear, 1k (d)
Transition outof Formal Empl.Next Year, 5k(d)
New Formal JobAccession NextYear (d)
2 Years Before Removal (d) 0.000963 0.000921 -0.000513(0.000669) (0.000699) (0.00122)
1 Year Before Removal (d) 0.00150** 0.00178** -0.000469(0.000759) (0.000785) (0.00141)
Year of Removal (d) 0.00266*** 0.00275*** -0.00112(0.000893) (0.000917) (0.00165)
1+ Years After Removal (d) 0.00476*** 0.00408*** -0.000948(0.00109) (0.00111) (0.00201)
Transition into Formal-Employed, 1k (d) 0.109*** 0.0534*** 0.00822***(0.00227) (0.00192) (0.00259)
2 Yrs. Before Removal (d) x Trans into Formal-Employed, 1k (d) -0.0153*** -0.00924** 0.0226***(0.00501) (0.00428) (0.00574)
1 Yr. Before Removal (d) x Trans into Formal-Employed, 1k (d) -0.0150*** -0.00822* 0.0213***(0.00503) (0.00429) (0.00571)
Yr. of Removal (d) x Trans into Formal-Employed, 1k (d) -0.0203*** -0.00334 0.0186***(0.00547) (0.00475) (0.00626)
1+ Yrs. After Removal (d) x Trans into Formal-Employed, 1k (d) -0.0267*** -0.0187*** 0.0526***(0.00389) (0.00330) (0.00446)
Individual Fixed E↵ects Y Y YYear Fixed E↵ects Y Y YAge and Tenure Controls Y Y YR-squared 0.043 0.037 0.011No. Person-Yr Obs. 1.500e+06 1.500e+06 1.500e+06No. of Indiv. 220000 220000 220000Combined Coe↵ Di↵ 1+ Yrs & -2 Yrs -0.76% -0.63% 2.96%Combined Coe↵ Di↵ Sig at 10% N N Y
Notes: SE in parentheses. *** p<0.01, ** p<0.05, * p<0.1. Age and Tenure controls include quadratics in age and tenure. Transition out of FormalEmpl. Next Year, 1k (d) is a dummy that takes the value 1 if the individual earned at least $1k in the formal sector this year, and less than $1k nextyear. New Formal Job Accession Next Year (d) is a dummy that takes the value 1 if the individual becomes end-of-quarter employed at an SEIN theyhave never worked at previously.
9
F TransUnion/LEHD Additional Results: Tests for Se-
lection Among Self-Employed Transitioners
In this appendix, we discuss the role of selection for the transition results. Since flag removal
is forseeable, there is concern that better entrepreneurs who anticipate the need for credit
deliberately wait until the flag is removed to start a business. However, such selection still
suggests credit plays an important role for business startups. Nonetheless, we show that
the entrepreneurs who transition into self-employment following flag removal are very close
in terms of 1, 2, and 3 year lags of annual labor earnings relative to those who flow into
self-employment 1 or 2 years prior to flag removal. This set of results suggests that the new
self-employed individuals have similar labor productivity. We repeat the same exercise using
1, 2, and 3 year lags of annual self-employed income. The idea is that if these were repeat
entrepreneurs as in Gompers et al. [2006], then we should see non-zero or greater lagged self-
employed income. Again we find that those who transition into self-employment have very
similar levels of previous self-employed earnings (i.e. they are not people who have previously
failed disproportionately or succeeded disproportionately at entrepreneurship in the past).
This suggests that they have similar prior levels of entrepreneurial talent. However, we
cannot definitively rule out di↵erences in unobserved talent.
Table 17 provides baseline regressions. Columns (1) through (3) regress lagged labor
earnings on the self-employment transition indicator interacted with the window of dummies
around flag removal. Columns (4) through (6) regress lagged self-employed income on an
indicator interacted with the window of dummies around flag removal. To interpret the
coe�cients and test for selection, Table 18 tests whether those who transition into self-
employment in the year of flag removal di↵er from those who transition into self-employment
1 and 2 years before flag removal. For example, the upper left hand cell of Table 17 computes
prior labor earnings of those transitioning into self-employment in the year of removal $552 (=
-120.5+1731 -1058) less the prior labor earnings of those transitioning into self-employment
1 year before flag removal $944 (=-36.63+1731 -749.7) to arrive at a di↵erence in prior labor
earnings between these two cohorts of self-employed individuals of $-391.9 (=-36.63+1,731
-749.7 -( -120.5+1,731 -1,058)). The standard error of this di↵erence in prior labor earnings
is $353, and the corresponding test statistic is -1.11, indicating that there is no di↵erence in
prior labor earnings between those who transition into self-employment one year before flag
removal to one year after flag removal. The right-hand panel of Table 18 conduct the same
10
Table 17: Measures of selection for those who transition into self-employment. Regressionsof past labor earnings and self-employed earnings on transition dummies.
(1) (2) (3) (4) (5) (6)
1 Year LaggedLabor Earnings
2 Year LaggedLabor Earnings
3 Year LaggedLabor Earnings
1 Year LaggedSelf EmployedIncome
2 Year LaggedSelf EmployedIncome
3 Year LaggedSelf EmployedIncome
2 Years Before Removal (d) 42.06 110.4** 283.2*** 40.16* -12.00 15.14(43.19) (45.68) (46.65) (21.50) (21.71) (21.50)
1 Year Before Removal (d) -36.63 86.06 279.4*** 36.16 7.120 35.83(58.90) (62.34) (64.85) (29.28) (28.82) (28.62)
Year of Removal (d) -120.5 24.97 348.5*** 19.74 31.14 70.09**(74.07) (78.21) (82.17) (36.79) (36.17) (35.66)
1+ Years After Removal (d) -469.6*** -291.8*** 178.6* 15.44 -3.157 89.44**(91.25) (96.37) (101.6) (45.19) (44.66) (44.55)
Transition Into Self-Employed (d) 1,731*** 1,934*** 1,507*** -8,960*** -3,902*** -2,516***(118.6) (120.7) (121.1) (94.26) (87.84) (78.77)
2 Yrs. Before Removal (d) x Trans Into Self-Employed, 1k (d)
-462.9* -422.4 -582.9** 655.1*** 1,152*** 1,113***
(271.2) (277.0) (281.8) (184.4) (196.8) (182.1)1 Yr. Before Removal (d) x Trans Into Self-Employed, 1k (d)
-749.7*** -721.5** -483.8* 516.7*** 1,477*** 760.6***
(270.3) (288.2) (289.8) (184.5) (202.4) (183.2)Yr. of Removal (d) x Trans Into Self-Employed, 1k (d)
-1,058*** -418.2 -1.496 847.6*** 1,102*** 1,178***
(286.8) (298.9) (292.7) (191.7) (201.4) (192.1)1+ Yrs. After Removal (d) x Trans Into Self-Employed, 1k (d)
-1,655*** -1,430*** -1,182*** 1,802*** 2,623*** 2,382***
(209.6) (216.6) (213.9) (147.0) (150.5) (141.5)
Individual Fixed E↵ects Y Y Y Y Y YYear Fixed E↵ects Y Y Y Y Y YAge and Tenure Controls Y Y Y Y Y YR-squared 0.181 0.082 0.040 0.055 0.010 0.005Round N 1.500e+06 1.500e+06 1.500e+06 1.500e+06 1.500e+06 1.500e+06N Indiv 220000 220000 220000 220000 220000 220000
Notes: *** p<0.01, ** p<0.05, * p<0.1. Age and Tenure controls include quadratics in age and tenure.
exercise using self-employed earnings. Again, in all but one specification, we fail to reject
that those who waited to start a business after flag removal had any di↵erence in prior self-
employment earnings to those who started their business one year before removal. Table 19
conducts the same exercise for longer lags of self-employed income, from 7 to 12 years, which
includes the period before entering bankruptcy (earnings data is not available at these longer
horizons). Again, the sample passes the selection tests in all but one specification, indicating
that the people who wait to start a business are not necessarily repeat entrepreneurs who
had higher income 7 to 12 years ago before entering bankruptcy.
11
Table 18: Measures of selection for those who transition into self-employment. Comparisonof past labor earnings and past self-employed net income between those who transit intoself-employment 1 and 2 years before flag removal versus those who transition into self-employment in the year of flag removal
Di↵erence in Labor Earnings Xyears ago between those who becomeSE 1 year before flag removal vs.those who wait until year of flag re-moval
Di↵erence inSelf-Employed net income X yearsago between those who become SE1 year before flag removal vs. thosewho wait until year of flag removal
X= 1 Year 2 Years 3 Years 1 Year 2 Years 3 YearsDi↵erence Labor Earnings -391.9 242.1 551.4 Di↵erence in Net Income 314.4 -350.5 451.9*Std. Error 353.7 376.1 371.3 Std. Error 241.3 256.9 240.3T-stat -1.11 0.64 1.49 T-stat 1.30 -1.36 1.88
Di↵erence in Labor Earnings Xyears ago between those who becomeSE 2 years before flag removal vs.those who wait until year of flag re-moval
Di↵erence inSelf-Employed net income X yearsago between those who becomeSelf-Employed 2 years before flagremoval vs. those who wait untilyear of flag removal
X= 1 Year 2 Years 3 Years 1 Year 2 Years 3 YearsDi↵erence in Labor Earn-ings
-757.5** -81.29 646.7* Di↵erence in Net Income 172.1 -6.9 120.6
Std. Error 355.7 365.6 362.8 Std. Error 231.5 252.6 237.2T-stat -2.13 -0.22 1.78 T-stat 0.74 -0.03 0.51
Notes: *** p<0.01, ** p<0.05, * p<0.1. Estimates based on Table 17 and calculations are explained in detail in the text.
Table 19: Measures of selection for those who transition into self-employment. Comparison of7 to 12 year lagged self-employed net income between those who transit into self-employment1 and 2 years before flag removal versus those who transition into self-employment in theyear of flag removal
Di↵erence in Self-Employed net income X years ago between those whobecome Self-Employed 2 years before flag removal vs. those who waituntil year of flag removal
X= 7 Years 8 Years 9 Years 10 Years 11 Years 12 YearsDi↵erence in Net Income -282.6 581.2 35.5 273.3 497.4 319.9Std. Error 458.8 482.3 480.4 569.2 590.0 363.8T-stat -0.62 1.21 0.07 0.48 0.84 0.88
Di↵erence in Self-Employed net income X years ago between those whobecome SE 1 year before flag removal vs. those who wait until year offlag removal
X= 7 Years 8 Years 9 Years 10 Years 11 Years 12 YearsDi↵erence in Net Income -139.6 -1264 936.9 -831.5 727.1 -339.3Std. Error 509.1 1178 470.8 754 551.6 416.6T-stat -0.27 -1.07 1.99 -1.10 1.32 -0.81
Notes: *** p<0.01, ** p<0.05, * p<0.1.
12
G TransUnion/LEHD Additional Results: Alternate
Selection Correction, Inverse Mills Ratios
In this section, we apply the heckit selection correction. We predict the odds that an individ-
ual transitions into self-employment using a probit regression with controls for cumulative
lagged earnings, an equity proxy, quadratics in age and tenure, race dummies, sex, educa-
tion dummies, mortgage and auto loan indicators. We then use the predicted probability
of selecting into entrepreneurship to construct the inverse mills ratio. We then control for
the inverse mills ratio in all of our subsequent transition results. Table 20 illustrates that
our main results are nearly identical, even after controlling for the ex-ante odds of making
the subsequent transition into self and formal employment, respectively. The inverse mills
ratios do enter with significant coe�cients, but the point estimates for our main results are
extremely similar to the main tables in the text.
H TransUnion/LEHD Additional Results: Industry Re-
sults
Table 21 describes the sector in which individuals enter self-employment, and Table 22 de-
scribes the sector in which individuals enter formal employment. Industries are defined
using 1 digit SIC classifications of the self-employment industry or the individual’s primary
employer. Among new entrants to self employment, they are more likely to enter manu-
facturing, telecom, and retail. There is no di↵erential impact of flag removal on services
and finance startups, which are relatively less capital intensive than manufacturing or com-
munications/transport startups and also rely less on external finance (Rajan and Zingales
[1996]).
Table 22 shows that new formal-employment entrants are disproportionately more likely
to work in the retail and service sector. Both sectors potentially require the individual
to operate a cash-register or handle money relative to manufacturing and communica-
tions/transport jobs. However, we see relatively moderate e↵ects of flag removal on the
propensity to find a finance job, and employment in the finance industry continues to trend
down, significantly, even after flag removal among non-transitioners.
13
Table 20: Inverse Mills Selection Correction for Main Results. Columns (1) through (3)apply the heckit correction for self-employment transitions, and Columns (4) through (6)apply the heckit correction for formal-employment transitions
(1) (2) (3) (4) (5) (6)
Labor Earnings Real Income Total Earnings Labor Earnings Real Income Total Earnings
Inverse Mills for Self-Employment Transition 30,957*** -4,797*** 26,160***(725.6) (319.9) (763.5)
Inverse Mills for Formal Employment Transition -18,625*** 1,864*** -16,760***(211.4) (95.75) (223.0)
2 Years Before Removal (d) 37.26 -54.32*** -17.06 10.96 29.79 40.75(44.80) (20.09) (47.39) (44.62) (22.45) (47.95)
1 Year Before Removal (d) -31.61 -90.86*** -122.5* -71.40 -5.213 -76.61(61.80) (27.72) (65.20) (61.69) (29.40) (65.45)
Year of Removal (d) -96.70 -118.2*** -214.9*** -132.7* -14.30 -147.0*(77.90) (34.63) (81.99) (77.84) (36.78) (82.37)
1+ Years After Removal (d) -456.4*** -181.0*** -637.3*** -447.2*** -63.65 -510.9***(96.16) (43.55) (101.3) (96.12) (44.82) (101.5)
Transition Into Self-Employed (d) -1,527*** 8,525*** 6,998***(116.2) (123.3) (154.0)
2 Yrs. Before Removal (d) x Trans Into Self-Empl., 1k (d) -611.5** 2,269*** 1,657***(272.5) (268.1) (345.2)
1 Yr. Before Removal (d) x Trans Into Self-Empl., 1k (d) -1,066*** 2,174*** 1,108***(271.9) (274.7) (346.2)
Yr. of Removal (d) x Trans Into Self-Empl., 1k (d) -1,443*** 2,690*** 1,247***(293.0) (297.6) (375.4)
1+ Yrs. After Removal (d) x Trans Into Self-Empl., 1k (d) -1,572*** 3,355*** 1,783***(214.7) (212.7) (272.8)
Transition Into Formal-Employed (d) 2,920*** -356.9*** 2,563***(90.93) (47.37) (98.00)
2 Yrs. Before Removal (d) x Trans Into Formal-Employed, 1k (d) 787.4*** -182.7* 604.8***(205.0) (110.8) (223.9)
1 Yr. Before Removal (d) x Trans Into Formal-Employed, 1k (d) 1,284*** -382.0*** 902.4***(212.6) (117.5) (233.6)
Yr. of Removal (d) x Trans Into Formal-Employed, 1k (d) 1,700*** -40.95 1,659***(234.1) (131.0) (257.0)
1+ Yrs. After Removal (d) x Trans Into Formal-Employed, 1k (d) 2,397*** -143.5 2,253***(168.1) (91.44) (184.2)
Individual Fixed E↵ects Y Y Y Y Y YYear Fixed E↵ects Y Y Y Y Y YAge and Tenure Controls Y Y Y Y Y YR-squared 0.125 0.077 0.108 0.142 0.004 0.112Round N 1.500e+06 1.500e+06 1.500e+06 1.500e+06 1.500e+06 1.500e+06N Indiv 220000 220000 220000 220000 220000 220000
Notes: *** p<0.01, ** p<0.05, * p<0.1. Inverse mills ratio constructed with first-stage probit that includes controls for cumulative lagged earnings, anequity proxy, quadratics in age and tenure, race dummies, sex, education dummies, mortgage and auto loan indicators
14
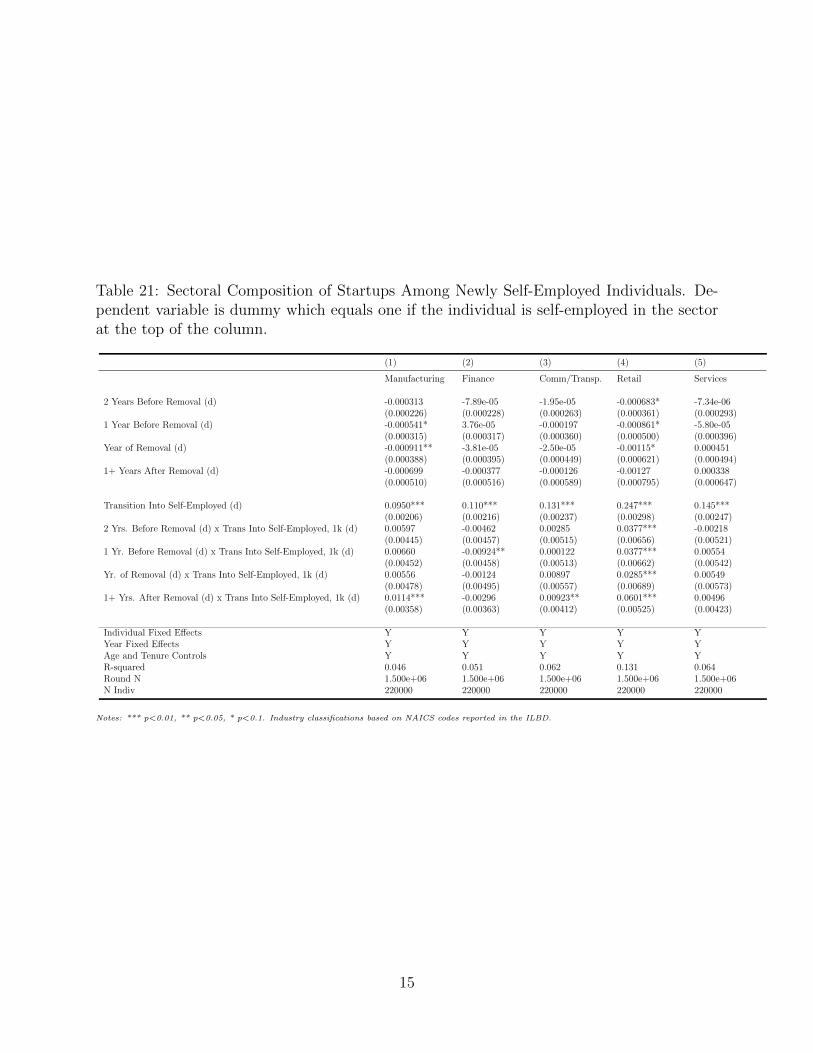
Table 21: Sectoral Composition of Startups Among Newly Self-Employed Individuals. De-pendent variable is dummy which equals one if the individual is self-employed in the sectorat the top of the column.
(1) (2) (3) (4) (5)
Manufacturing Finance Comm/Transp. Retail Services
2 Years Before Removal (d) -0.000313 -7.89e-05 -1.95e-05 -0.000683* -7.34e-06(0.000226) (0.000228) (0.000263) (0.000361) (0.000293)
1 Year Before Removal (d) -0.000541* 3.76e-05 -0.000197 -0.000861* -5.80e-05(0.000315) (0.000317) (0.000360) (0.000500) (0.000396)
Year of Removal (d) -0.000911** -3.81e-05 -2.50e-05 -0.00115* 0.000451(0.000388) (0.000395) (0.000449) (0.000621) (0.000494)
1+ Years After Removal (d) -0.000699 -0.000377 -0.000126 -0.00127 0.000338(0.000510) (0.000516) (0.000589) (0.000795) (0.000647)
Transition Into Self-Employed (d) 0.0950*** 0.110*** 0.131*** 0.247*** 0.145***(0.00206) (0.00216) (0.00237) (0.00298) (0.00247)
2 Yrs. Before Removal (d) x Trans Into Self-Employed, 1k (d) 0.00597 -0.00462 0.00285 0.0377*** -0.00218(0.00445) (0.00457) (0.00515) (0.00656) (0.00521)
1 Yr. Before Removal (d) x Trans Into Self-Employed, 1k (d) 0.00660 -0.00924** 0.000122 0.0377*** 0.00554(0.00452) (0.00458) (0.00513) (0.00662) (0.00542)
Yr. of Removal (d) x Trans Into Self-Employed, 1k (d) 0.00556 -0.00124 0.00897 0.0285*** 0.00549(0.00478) (0.00495) (0.00557) (0.00689) (0.00573)
1+ Yrs. After Removal (d) x Trans Into Self-Employed, 1k (d) 0.0114*** -0.00296 0.00923** 0.0601*** 0.00496(0.00358) (0.00363) (0.00412) (0.00525) (0.00423)
Individual Fixed E↵ects Y Y Y Y YYear Fixed E↵ects Y Y Y Y YAge and Tenure Controls Y Y Y Y YR-squared 0.046 0.051 0.062 0.131 0.064Round N 1.500e+06 1.500e+06 1.500e+06 1.500e+06 1.500e+06N Indiv 220000 220000 220000 220000 220000
Notes: *** p<0.01, ** p<0.05, * p<0.1. Industry classifications based on NAICS codes reported in the ILBD.
15
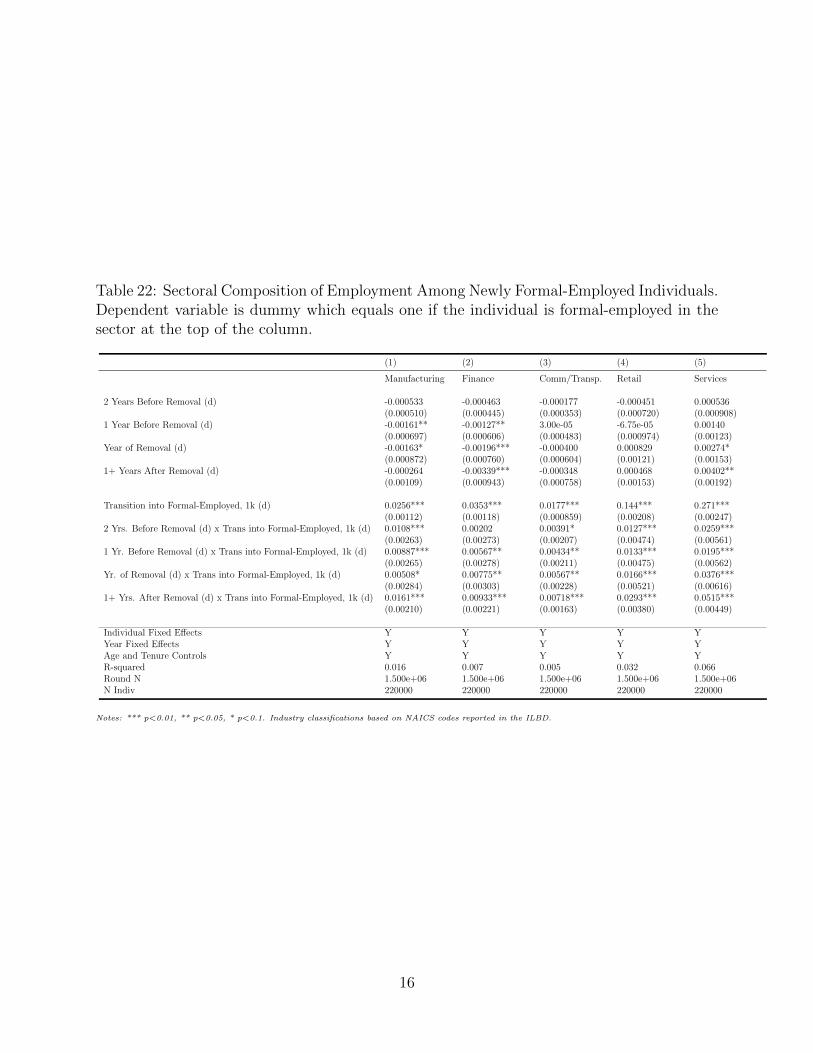
Table 22: Sectoral Composition of Employment Among Newly Formal-Employed Individuals.Dependent variable is dummy which equals one if the individual is formal-employed in thesector at the top of the column.
(1) (2) (3) (4) (5)
Manufacturing Finance Comm/Transp. Retail Services
2 Years Before Removal (d) -0.000533 -0.000463 -0.000177 -0.000451 0.000536(0.000510) (0.000445) (0.000353) (0.000720) (0.000908)
1 Year Before Removal (d) -0.00161** -0.00127** 3.00e-05 -6.75e-05 0.00140(0.000697) (0.000606) (0.000483) (0.000974) (0.00123)
Year of Removal (d) -0.00163* -0.00196*** -0.000400 0.000829 0.00274*(0.000872) (0.000760) (0.000604) (0.00121) (0.00153)
1+ Years After Removal (d) -0.000264 -0.00339*** -0.000348 0.000468 0.00402**(0.00109) (0.000943) (0.000758) (0.00153) (0.00192)
Transition into Formal-Employed, 1k (d) 0.0256*** 0.0353*** 0.0177*** 0.144*** 0.271***(0.00112) (0.00118) (0.000859) (0.00208) (0.00247)
2 Yrs. Before Removal (d) x Trans into Formal-Employed, 1k (d) 0.0108*** 0.00202 0.00391* 0.0127*** 0.0259***(0.00263) (0.00273) (0.00207) (0.00474) (0.00561)
1 Yr. Before Removal (d) x Trans into Formal-Employed, 1k (d) 0.00887*** 0.00567** 0.00434** 0.0133*** 0.0195***(0.00265) (0.00278) (0.00211) (0.00475) (0.00562)
Yr. of Removal (d) x Trans into Formal-Employed, 1k (d) 0.00508* 0.00775** 0.00567** 0.0166*** 0.0376***(0.00284) (0.00303) (0.00228) (0.00521) (0.00616)
1+ Yrs. After Removal (d) x Trans into Formal-Employed, 1k (d) 0.0161*** 0.00933*** 0.00718*** 0.0293*** 0.0515***(0.00210) (0.00221) (0.00163) (0.00380) (0.00449)
Individual Fixed E↵ects Y Y Y Y YYear Fixed E↵ects Y Y Y Y YAge and Tenure Controls Y Y Y Y YR-squared 0.016 0.007 0.005 0.032 0.066Round N 1.500e+06 1.500e+06 1.500e+06 1.500e+06 1.500e+06N Indiv 220000 220000 220000 220000 220000
Notes: *** p<0.01, ** p<0.05, * p<0.1. Industry classifications based on NAICS codes reported in the ILBD.
16
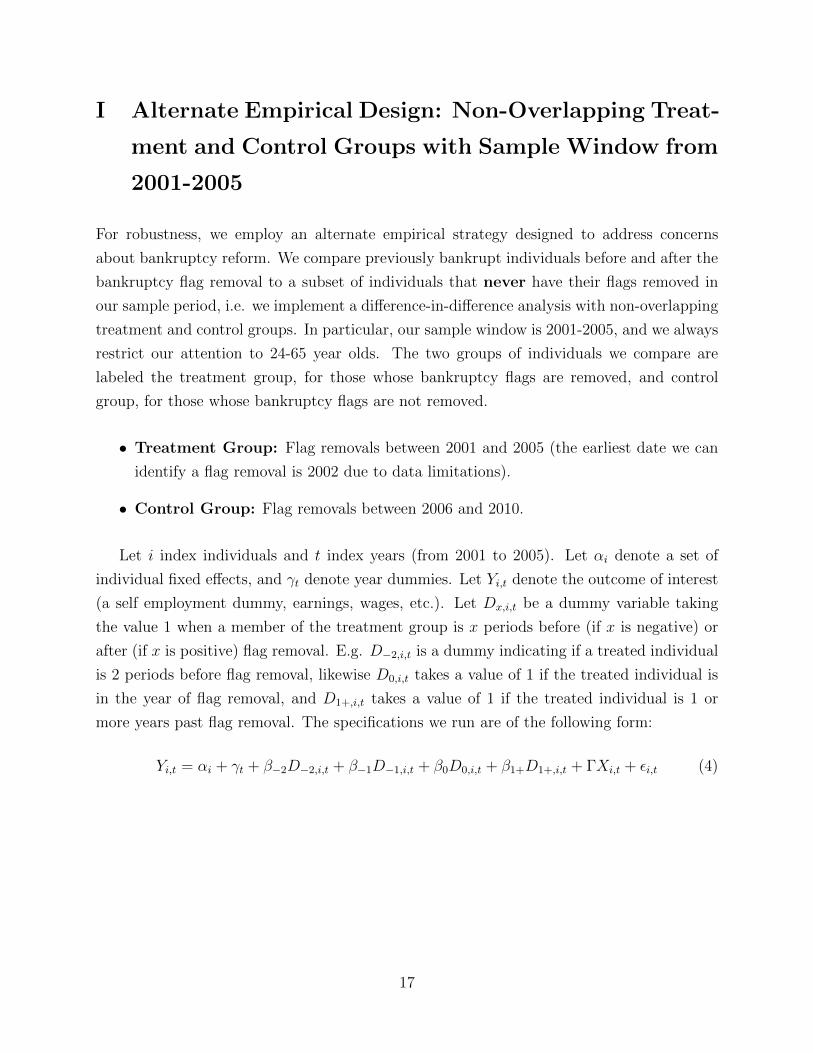
I Alternate Empirical Design: Non-Overlapping Treat-
ment and Control Groups with Sample Window from
2001-2005
For robustness, we employ an alternate empirical strategy designed to address concerns
about bankruptcy reform. We compare previously bankrupt individuals before and after the
bankruptcy flag removal to a subset of individuals that never have their flags removed in
our sample period, i.e. we implement a di↵erence-in-di↵erence analysis with non-overlapping
treatment and control groups. In particular, our sample window is 2001-2005, and we always
restrict our attention to 24-65 year olds. The two groups of individuals we compare are
labeled the treatment group, for those whose bankruptcy flags are removed, and control
group, for those whose bankruptcy flags are not removed.
• Treatment Group: Flag removals between 2001 and 2005 (the earliest date we can
identify a flag removal is 2002 due to data limitations).
• Control Group: Flag removals between 2006 and 2010.
Let i index individuals and t index years (from 2001 to 2005). Let ↵
i
denote a set of
individual fixed e↵ects, and �
t
denote year dummies. Let Yi,t
denote the outcome of interest
(a self employment dummy, earnings, wages, etc.). Let D
x,i,t
be a dummy variable taking
the value 1 when a member of the treatment group is x periods before (if x is negative) or
after (if x is positive) flag removal. E.g. D�2,i,t is a dummy indicating if a treated individual
is 2 periods before flag removal, likewise D0,i,t takes a value of 1 if the treated individual is
in the year of flag removal, and D1+,i,t
takes a value of 1 if the treated individual is 1 or
more years past flag removal. The specifications we run are of the following form:
Y
i,t
= ↵
i
+ �
t
+ ��2D�2,i,t + ��1D�1,i,t + �0D0,i,t + �1+D1+,i,t
+ �Xi,t
+ ✏
i,t
(4)
17
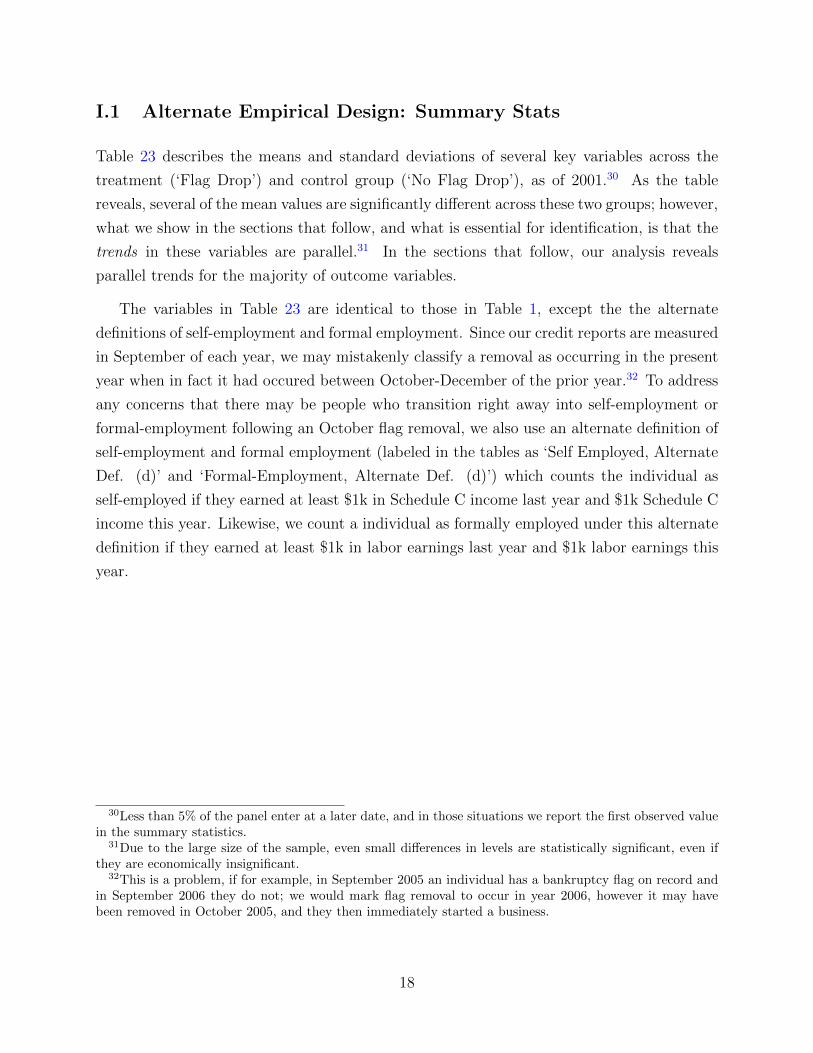
I.1 Alternate Empirical Design: Summary Stats
Table 23 describes the means and standard deviations of several key variables across the
treatment (‘Flag Drop’) and control group (‘No Flag Drop’), as of 2001.30 As the table
reveals, several of the mean values are significantly di↵erent across these two groups; however,
what we show in the sections that follow, and what is essential for identification, is that the
trends in these variables are parallel.31 In the sections that follow, our analysis reveals
parallel trends for the majority of outcome variables.
The variables in Table 23 are identical to those in Table 1, except the the alternate
definitions of self-employment and formal employment. Since our credit reports are measured
in September of each year, we may mistakenly classify a removal as occurring in the present
year when in fact it had occured between October-December of the prior year.32 To address
any concerns that there may be people who transition right away into self-employment or
formal-employment following an October flag removal, we also use an alternate definition of
self-employment and formal employment (labeled in the tables as ‘Self Employed, Alternate
Def. (d)’ and ‘Formal-Employment, Alternate Def. (d)’) which counts the individual as
self-employed if they earned at least $1k in Schedule C income last year and $1k Schedule C
income this year. Likewise, we count a individual as formally employed under this alternate
definition if they earned at least $1k in labor earnings last year and $1k labor earnings this
year.
30Less than 5% of the panel enter at a later date, and in those situations we report the first observed valuein the summary statistics.
31Due to the large size of the sample, even small di↵erences in levels are statistically significant, even ifthey are economically insignificant.
32This is a problem, if for example, in September 2005 an individual has a bankruptcy flag on record andin September 2006 they do not; we would mark flag removal to occur in year 2006, however it may havebeen removed in October 2005, and they then immediately started a business.
18
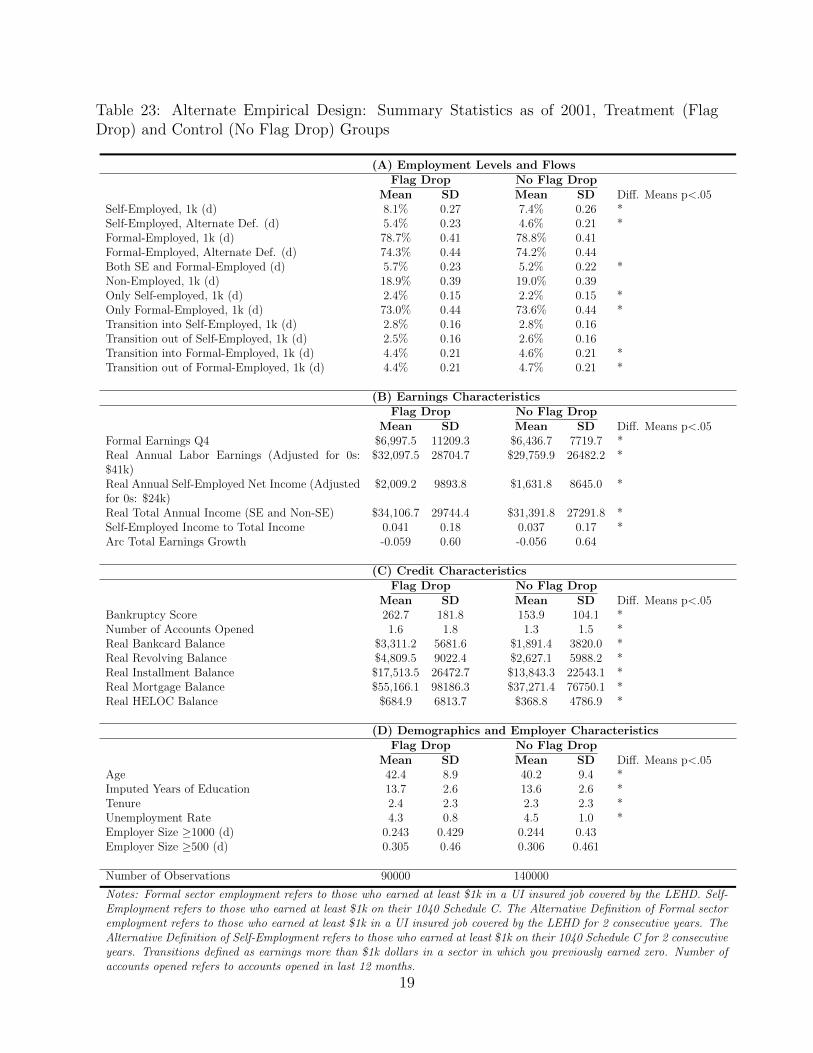
Table 23: Alternate Empirical Design: Summary Statistics as of 2001, Treatment (FlagDrop) and Control (No Flag Drop) Groups
(A) Employment Levels and FlowsFlag Drop No Flag Drop
Mean SD Mean SD Di↵. Means p<.05Self-Employed, 1k (d) 8.1% 0.27 7.4% 0.26 *Self-Employed, Alternate Def. (d) 5.4% 0.23 4.6% 0.21 *Formal-Employed, 1k (d) 78.7% 0.41 78.8% 0.41Formal-Employed, Alternate Def. (d) 74.3% 0.44 74.2% 0.44Both SE and Formal-Employed (d) 5.7% 0.23 5.2% 0.22 *Non-Employed, 1k (d) 18.9% 0.39 19.0% 0.39Only Self-employed, 1k (d) 2.4% 0.15 2.2% 0.15 *Only Formal-Employed, 1k (d) 73.0% 0.44 73.6% 0.44 *Transition into Self-Employed, 1k (d) 2.8% 0.16 2.8% 0.16Transition out of Self-Employed, 1k (d) 2.5% 0.16 2.6% 0.16Transition into Formal-Employed, 1k (d) 4.4% 0.21 4.6% 0.21 *Transition out of Formal-Employed, 1k (d) 4.4% 0.21 4.7% 0.21 *
(B) Earnings CharacteristicsFlag Drop No Flag Drop
Mean SD Mean SD Di↵. Means p<.05Formal Earnings Q4 $6,997.5 11209.3 $6,436.7 7719.7 *Real Annual Labor Earnings (Adjusted for 0s:$41k)
$32,097.5 28704.7 $29,759.9 26482.2 *
Real Annual Self-Employed Net Income (Adjustedfor 0s: $24k)
$2,009.2 9893.8 $1,631.8 8645.0 *
Real Total Annual Income (SE and Non-SE) $34,106.7 29744.4 $31,391.8 27291.8 *Self-Employed Income to Total Income 0.041 0.18 0.037 0.17 *Arc Total Earnings Growth -0.059 0.60 -0.056 0.64
(C) Credit CharacteristicsFlag Drop No Flag Drop
Mean SD Mean SD Di↵. Means p<.05Bankruptcy Score 262.7 181.8 153.9 104.1 *Number of Accounts Opened 1.6 1.8 1.3 1.5 *Real Bankcard Balance $3,311.2 5681.6 $1,891.4 3820.0 *Real Revolving Balance $4,809.5 9022.4 $2,627.1 5988.2 *Real Installment Balance $17,513.5 26472.7 $13,843.3 22543.1 *Real Mortgage Balance $55,166.1 98186.3 $37,271.4 76750.1 *Real HELOC Balance $684.9 6813.7 $368.8 4786.9 *
(D) Demographics and Employer CharacteristicsFlag Drop No Flag Drop
Mean SD Mean SD Di↵. Means p<.05Age 42.4 8.9 40.2 9.4 *Imputed Years of Education 13.7 2.6 13.6 2.6 *Tenure 2.4 2.3 2.3 2.3 *Unemployment Rate 4.3 0.8 4.5 1.0 *Employer Size �1000 (d) 0.243 0.429 0.244 0.43Employer Size �500 (d) 0.305 0.46 0.306 0.461
Number of Observations 90000 140000
Notes: Formal sector employment refers to those who earned at least $1k in a UI insured job covered by the LEHD. Self-Employment refers to those who earned at least $1k on their 1040 Schedule C. The Alternative Definition of Formal sectoremployment refers to those who earned at least $1k in a UI insured job covered by the LEHD for 2 consecutive years. TheAlternative Definition of Self-Employment refers to those who earned at least $1k on their 1040 Schedule C for 2 consecutiveyears. Transitions defined as earnings more than $1k dollars in a sector in which you previously earned zero. Number ofaccounts opened refers to accounts opened in last 12 months.
19
I.2 Alternate Empirical Design: Stocks and Flows of Employment
and Self-Employment
Table 24 illustrates the baseline ‘stock’ or levels of employment results using our alter-
nate empirical design and using alternate definitions of formal and self employment. Ta-
ble 24 generates very similar results to Table 2, and the alternate definitions of formal
and self-employment results are similar to the baseline definitions. Following flag removal
formal-employment under the alternate definition increases by .655%, and self-employment
under the alternate definition remains flat. Table 25 and 26 illustrate the corresponding
self-employment flows and formal employment flows for our alternate empirical design.
Self-employment flows under the alternate definition increase by .2%. Flows out of self-
employment under the alternate definition increase, but the increase is insignificant. In
both tables, however, the broad pattern is the same: flows into self and formal employment
increase, and flows out of self-employment increase (weakly). Generally, Table 25 and 26
support the results shown in Tables 3 and 10 shown in the main text.
Table 24: Alternate Empirical Design: Employment Levels and Bankruptcy Scores
(1) (2) (3) (4) (5) (6)BankruptcyScore
BankruptcyScore
Formal-Employed(d)
Formal-Employed,AlternateDef. (d)
Self-Employed(d)
Self-Employed,AlternateDef. (d)
2 Years Before Removal (d) 77.04*** -13.18*** 6.45e-05 0.000457 0.00175 0.000299(0.732) (0.755) (0.00150) (0.00140) (0.00117) (0.000916)
1 Year Before Removal (d) 80.50*** -26.04*** 0.00157 0.00116 0.000554 4.99e-05(0.655) (0.887) (0.00174) (0.00166) (0.00132) (0.00109)
Year of Removal (d) 147.2*** 29.45*** 0.00397** 0.00353* 0.00170 -0.00107(0.798) (1.047) (0.00193) (0.00185) (0.00147) (0.00122)
1+ Years After Removal (d) 110.1*** -34.51*** 0.00623*** 0.00655*** 0.00320* 0.00126(0.684) (1.162) (0.00222) (0.00213) (0.00168) (0.00140)
Fixed E↵ects (Individualand Year)
N Y Y Y Y Y
Age and Tenure Controls N Y Y Y Y YR-Squared 0.120 0.122 0.113 0.221 0.002 0.003Indiv.-Yr Obs 1,150,000 1,150,000 1,150,000 1,150,000 1,150,000 1,150,000Number of Indiv. 240,000 240,000 240,000 240,000 240,000 240,000
Notes: SE in parentheses. *** p<0.01, ** p<0.05, * p<0.1. Age and Tenure controls include quadratics in ageand tenure. Fixed E↵ects include individual fixed e↵ects and year dummies.
20
Table 25: Alternate Empirical Design: Self-Employment Flows
(1) (2) (3) (4)Transition into Self-Employed (d)
Transition out of Self-Employed (d)
Transition into Self-Employed, AlternateDef (d)
Transition out of Self-Employed, AlternateDef (d)
2 Years Before Removal (d) 0.00145 0.000755 0.000228 0.000301(0.000993) (0.000929) (0.000722) (0.000667)
1 Year Before Removal (d) 0.000504 0.00196** 0.00107 0.000647(0.000969) (0.000924) (0.000745) (0.000675)
Year of Removal (d) 0.00278*** 0.00272*** -8.44e-05 0.000901(0.00104) (0.000988) (0.000775) (0.000721)
1+ Years After Removal (d) 0.00194* 0.00271** 0.00205** 0.000660(0.00117) (0.00111) (0.000895) (0.000809)
Fixed E↵ects (Individualand Year)
Y Y Y Y
Age and Tenure Controls Y Y Y YR-Squared 0.000 0.000 0.001 0.000Indiv.-Yr Obs 1,150,000 1,150,000 1,150,000 1,150,000Number of Indiv. 240,000 240,000 240,000 240,000
Notes: SE in parentheses. *** p<0.01, ** p<0.05, * p<0.1. Age and Tenure controls include quadratics in age andtenure. Fixed E↵ects include individual fixed e↵ects and year dummies. Transition into self-employed if SE annualearnings greater than $1k this year, zero last year. Transition out of self-employed if SE annual earnings greater than$1k last year, zero this year.
Table 26: Alternate Empirical Design: Formal-Employment Flows
(1) (2) (3) (4)Transition intoFormal-Employed(d)
Transition out ofFormal-Employed (d)
Transition intoFormal-Employed,Alternate Def. (d)
Transition out ofFormal-Employed,Alternate Def. (d)
2 Years Before Removal (d) -0.000392 0.00110 0.00138 0.000427(0.00118) (0.00126) (0.00114) (0.00116)
1 Year Before Removal (d) 0.000413 0.000474 0.000970 1.20e-05(0.00118) (0.00124) (0.00114) (0.00116)
Year of Removal (d) 0.000437 0.000679 0.00258** 0.000395(0.00125) (0.00131) (0.00121) (0.00122)
1+ Years After Removal (d) -0.000325 0.00238 0.00263* 0.00162(0.00143) (0.00149) (0.00138) (0.00139)
Fixed E↵ects (Individualand Year)
Y Y Y Y
Age and Tenure Controls Y Y Y YR-Squared 0.025 0.032 0.002 0.037Indiv.-Yr Obs 1,150,000 1,150,000 1,150,000 1,150,000Number of Indiv. 240,000 240,000 240,000 240,000
Notes: SE in parentheses. *** p<0.01, ** p<0.05, * p<0.1. Age and Tenure controls include quadratics in age andtenure. Fixed E↵ects include individual fixed e↵ects and year dummies. Transition into self-employed if SE annualearnings greater than $1k this year, zero last year. Transition out of self-employed if SE annual earnings greater than$1k last year, zero this year.
21
J Verification of Results in Cross-Sectional Public Data:
Survey of Consumer Finances 1998-2010
To compare our results to public data, we turn to the Survey of Consumer Finances (SCF)
from 1998 to 2010. We consider households who have filed for bankruptcy in the last 19 years
(to protect the identity of survey respondents, the year of bankruptcy filing is restricted to
be 0-1, 2-3, 4-5, etc. and therefore so is the removal year). To keep the studies comparable,
we limit ourselves to prime age (24-65) heads of household. Our main independent variable
is years since flag removal which takes values from -9 to +9 (-9 is 9 years before flag removal).
J.1 SCF Summary Statistics
Table 27 summarizes the sample of household heads used in the SCF analysis. Panel (A)
describes the demographic characteristics of households. Approximately 27% have a col-
lege degree, the average age is 45, and the modal household head is white. Turning to
Panel (B) which describes financial characteristics, on average, household heads with a prior
bankruptcy record earn $65k per year (this is gross family income). Individuals have lim-
ited liquid asset positions but have relatively large (and skewed) illiquid asset positions. On
average, households filed for bankruptcy 8 years ago, and roughly 48% of these households
had credit denied when they applied. Bankcard limits total $8k and bankcard balances to-
tal $2k, despite the fact that many of these households have an active bankruptcy flag on
their records. Panel (C) describes the employment and business ownership characteristics
of households. Nearly 17% work for companies with less than 10 employees, and 12% own
their own business.33 Approximately 77% of the household heads are employed, and nearly
33% are working for employers with pensions or retirement plans.
J.2 SCF Results
Table 28 illustrates a distributed lag model around bankruptcy flag removal. Column (1) and
(2) study employed households only. The general pattern in Columns (1) and (2) is that after
33Our Census Self-employment Records cover 1040 Schedule C income, and so for comparability, we excludeSCF households who own multiple businesses are unlikely to be using 1040 Schedule C returns to reportbusiness income.
22
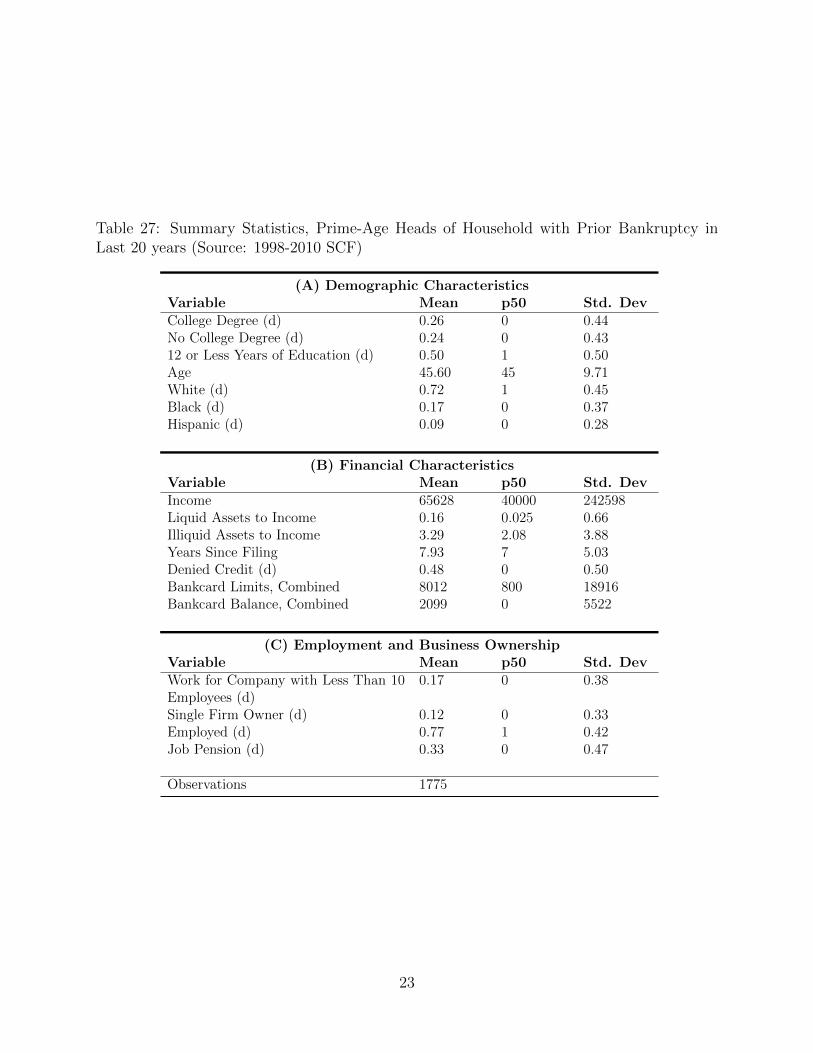
Table 27: Summary Statistics, Prime-Age Heads of Household with Prior Bankruptcy inLast 20 years (Source: 1998-2010 SCF)
(A) Demographic CharacteristicsVariable Mean p50 Std. DevCollege Degree (d) 0.26 0 0.44No College Degree (d) 0.24 0 0.4312 or Less Years of Education (d) 0.50 1 0.50Age 45.60 45 9.71White (d) 0.72 1 0.45Black (d) 0.17 0 0.37Hispanic (d) 0.09 0 0.28
(B) Financial CharacteristicsVariable Mean p50 Std. DevIncome 65628 40000 242598Liquid Assets to Income 0.16 0.025 0.66Illiquid Assets to Income 3.29 2.08 3.88Years Since Filing 7.93 7 5.03Denied Credit (d) 0.48 0 0.50Bankcard Limits, Combined 8012 800 18916Bankcard Balance, Combined 2099 0 5522
(C) Employment and Business OwnershipVariable Mean p50 Std. DevWork for Company with Less Than 10Employees (d)
0.17 0 0.38
Single Firm Owner (d) 0.12 0 0.33Employed (d) 0.77 1 0.42Job Pension (d) 0.33 0 0.47
Observations 1775
23
flag removal, households are finding jobs at larger firms where they are more likely to have
benefits such as a pension; however, point estimates and patterns are unstable in Column
(1). Column (3) shows that self-employment initially rises during bankruptcy and rises once
again when the bankruptcy flag is removed. There are two competing forces at play: (i)
the flag removal gives households access to more non-self-employment opportunities, and (ii)
flag removal gives households access to more credit which may facilitate business formation
and self-employment. In terms of employment, Column (4) shows that employment rises
following flag removal. For credit related outcomes, Column (5) shows that credit denials
fall after flag removal, Column (5) shows that bankcard limits expand, and Column (6) shows
that bankcard balances rise.
The small sample sizes limit the types of inference and experiments that can be conducted;
moreover many of the point estimates and patterns appear unstable. While this analysis
is merely describing correlations, we take the patterns to be consistent with the patterns
observed in our LEHD/TransUnion dataset.
24
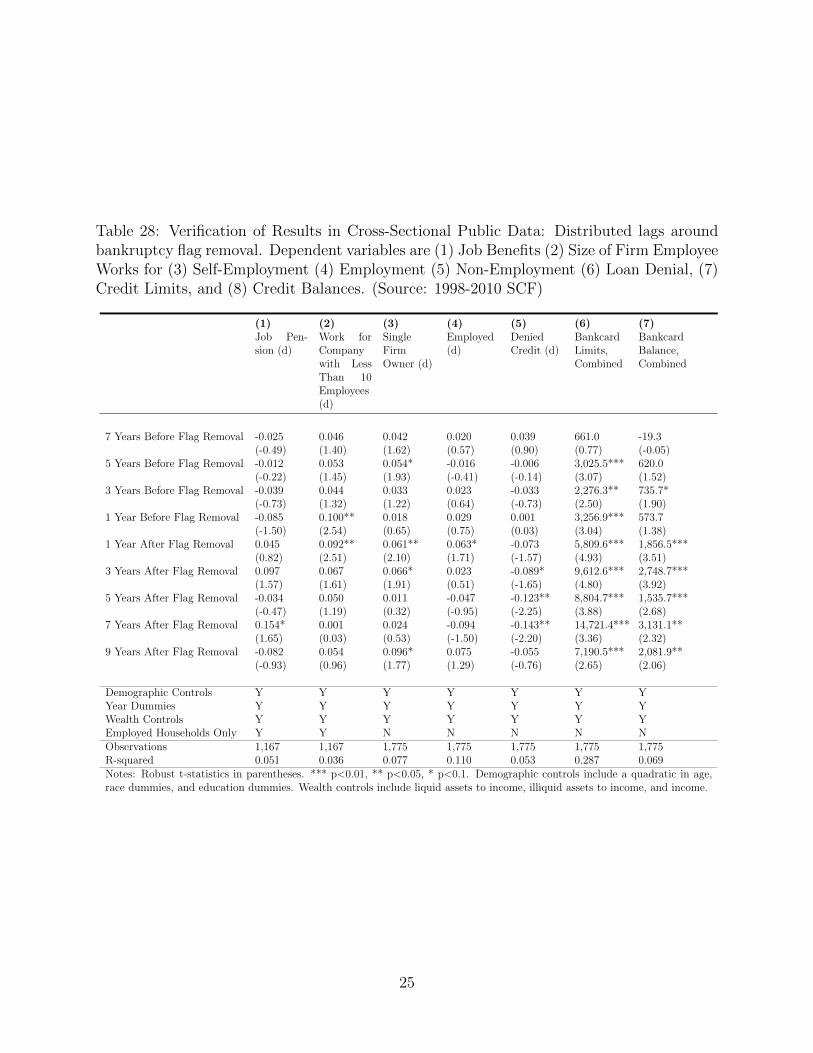
Table 28: Verification of Results in Cross-Sectional Public Data: Distributed lags aroundbankruptcy flag removal. Dependent variables are (1) Job Benefits (2) Size of Firm EmployeeWorks for (3) Self-Employment (4) Employment (5) Non-Employment (6) Loan Denial, (7)Credit Limits, and (8) Credit Balances. (Source: 1998-2010 SCF)
(1) (2) (3) (4) (5) (6) (7)Job Pen-sion (d)
Work forCompanywith LessThan 10Employees(d)
SingleFirmOwner (d)
Employed(d)
DeniedCredit (d)
BankcardLimits,Combined
BankcardBalance,Combined
7 Years Before Flag Removal -0.025 0.046 0.042 0.020 0.039 661.0 -19.3(-0.49) (1.40) (1.62) (0.57) (0.90) (0.77) (-0.05)
5 Years Before Flag Removal -0.012 0.053 0.054* -0.016 -0.006 3,025.5*** 620.0(-0.22) (1.45) (1.93) (-0.41) (-0.14) (3.07) (1.52)
3 Years Before Flag Removal -0.039 0.044 0.033 0.023 -0.033 2,276.3** 735.7*(-0.73) (1.32) (1.22) (0.64) (-0.73) (2.50) (1.90)
1 Year Before Flag Removal -0.085 0.100** 0.018 0.029 0.001 3,256.9*** 573.7(-1.50) (2.54) (0.65) (0.75) (0.03) (3.04) (1.38)
1 Year After Flag Removal 0.045 0.092** 0.061** 0.063* -0.073 5,809.6*** 1,856.5***(0.82) (2.51) (2.10) (1.71) (-1.57) (4.93) (3.51)
3 Years After Flag Removal 0.097 0.067 0.066* 0.023 -0.089* 9,612.6*** 2,748.7***(1.57) (1.61) (1.91) (0.51) (-1.65) (4.80) (3.92)
5 Years After Flag Removal -0.034 0.050 0.011 -0.047 -0.123** 8,804.7*** 1,535.7***(-0.47) (1.19) (0.32) (-0.95) (-2.25) (3.88) (2.68)
7 Years After Flag Removal 0.154* 0.001 0.024 -0.094 -0.143** 14,721.4*** 3,131.1**(1.65) (0.03) (0.53) (-1.50) (-2.20) (3.36) (2.32)
9 Years After Flag Removal -0.082 0.054 0.096* 0.075 -0.055 7,190.5*** 2,081.9**(-0.93) (0.96) (1.77) (1.29) (-0.76) (2.65) (2.06)
Demographic Controls Y Y Y Y Y Y YYear Dummies Y Y Y Y Y Y YWealth Controls Y Y Y Y Y Y YEmployed Households Only Y Y N N N N NObservations 1,167 1,167 1,775 1,775 1,775 1,775 1,775R-squared 0.051 0.036 0.077 0.110 0.053 0.287 0.069Notes: Robust t-statistics in parentheses. *** p<0.01, ** p<0.05, * p<0.1. Demographic controls include a quadratic in age,race dummies, and education dummies. Wealth controls include liquid assets to income, illiquid assets to income, and income.
25

![Jam Session The Washington Diplomat Washington, DC … · The Washington Diplomat ... Jam Session The Washington Diplomat (Washington DC) May 2008 Issue Pg. I [ music ] ... front](https://static.fdocuments.us/doc/165x107/5ad7f00b7f8b9a5b538d453d/jam-session-the-washington-diplomat-washington-dc-washington-diplomat-jam.jpg)