WASHING BRIDGES TO REMOVE CHLORIDE - Oregon€¦ · WASHING BRIDGES TO REDUCE CHLORIDE Interim...
27
WASHING BRIDGES TO REDUCE CHLORIDE Interim Report SPR 304-031
-
Upload
nguyenmien -
Category
Documents
-
view
214 -
download
0
Transcript of WASHING BRIDGES TO REMOVE CHLORIDE - Oregon€¦ · WASHING BRIDGES TO REDUCE CHLORIDE Interim...
WASHING BRIDGES TO REDUCE CHLORIDE
Interim Report
SPR 304-031

WASHING BRIDGES TO REDUCE CHLORIDE
Interim Report
SPR 304-031
by
Steven Soltesz Research Unit
Oregon Department of Transportation
for
Oregon Department of Transportation Research Unit
200 Hawthorne Ave. SE – Suite B240 Salem, OR 97301-5192
and
Federal Highway Administration
400 Seventh Street S.W. Washington, DC 20590
December 2003

Technical Report Documentation Page 1. Report No.
FHWA-OR-DF-04-05
2. Government Accession No.
3. Recipient’s Catalog No.
5. Report Date December 2003
4. Title and Subtitle WASHING BRIDGES TO REDUCE CHLORIDE
6. Performing Organization Code
7. Author(s) Steven Soltesz, Research Unit, Oregon Department of Transportation
8. Performing Organization Report No.
10. Work Unit No. (TRAIS)
9. Performing Organization Name and Address Oregon Department of Transportation Research Unit 200 Hawthorne Avenue SE, Suite B-240 Salem, Oregon 97301-5192
11. Contract or Grant No. SPR 304-031
13. Type of Report and Period Covered Interim Report
12. Sponsoring Agency Name and Address Oregon Department of Transportation Federal Highway Administration Research Unit and 400 Seventh Street S.W. 200 Hawthorne Avenue SE, Suite B-240 Washington, DC 20590 Salem, Oregon 97301-5192
14. Sponsoring Agency Code
15. Supplementary Notes
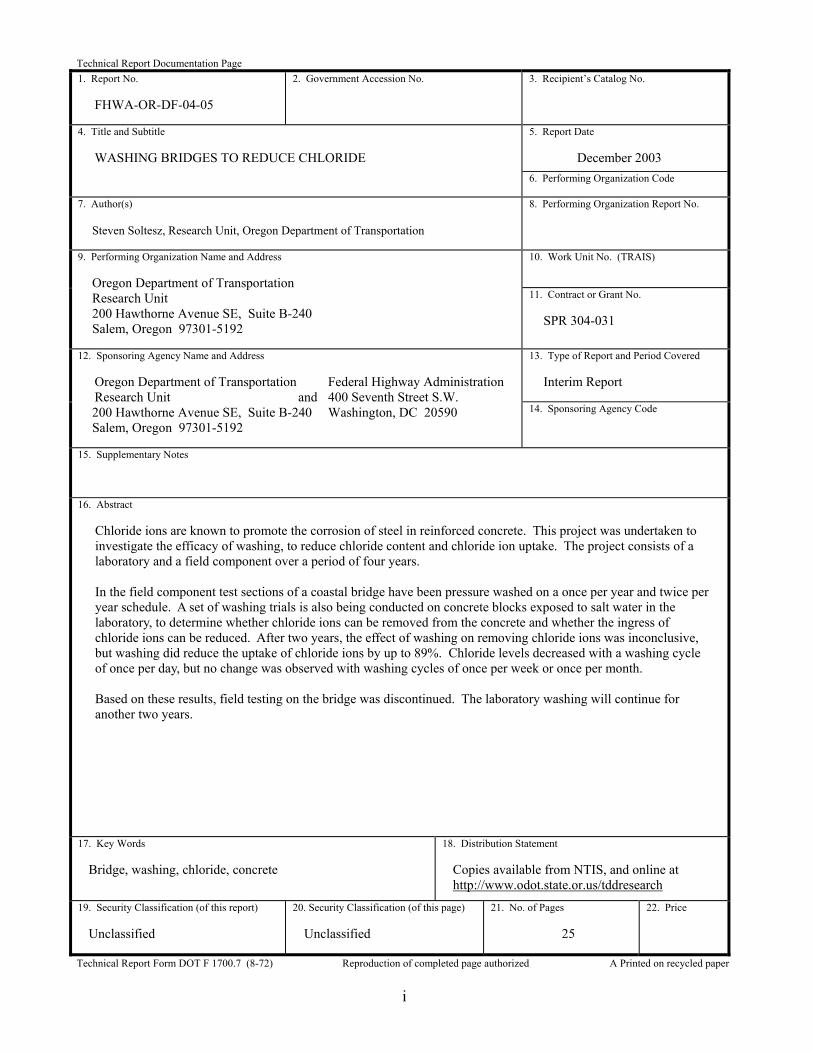
16. Abstract Chloride ions are known to promote the corrosion of steel in reinforced concrete. This project was undertaken to investigate the efficacy of washing, to reduce chloride content and chloride ion uptake. The project consists of a laboratory and a field component over a period of four years. In the field component test sections of a coastal bridge have been pressure washed on a once per year and twice per year schedule. A set of washing trials is also being conducted on concrete blocks exposed to salt water in the laboratory, to determine whether chloride ions can be removed from the concrete and whether the ingress of chloride ions can be reduced. After two years, the effect of washing on removing chloride ions was inconclusive, but washing did reduce the uptake of chloride ions by up to 89%. Chloride levels decreased with a washing cycle of once per day, but no change was observed with washing cycles of once per week or once per month. Based on these results, field testing on the bridge was discontinued. The laboratory washing will continue for another two years.
17. Key Words
Bridge, washing, chloride, concrete
18. Distribution Statement Copies available from NTIS, and online at http://www.odot.state.or.us/tddresearch
19. Security Classification (of this report) Unclassified
20. Security Classification (of this page) Unclassified
21. No. of Pages
25
22. Price
Technical Report Form DOT F 1700.7 (8-72) Reproduction of completed page authorized Α Printed on recycled paper
i
ii
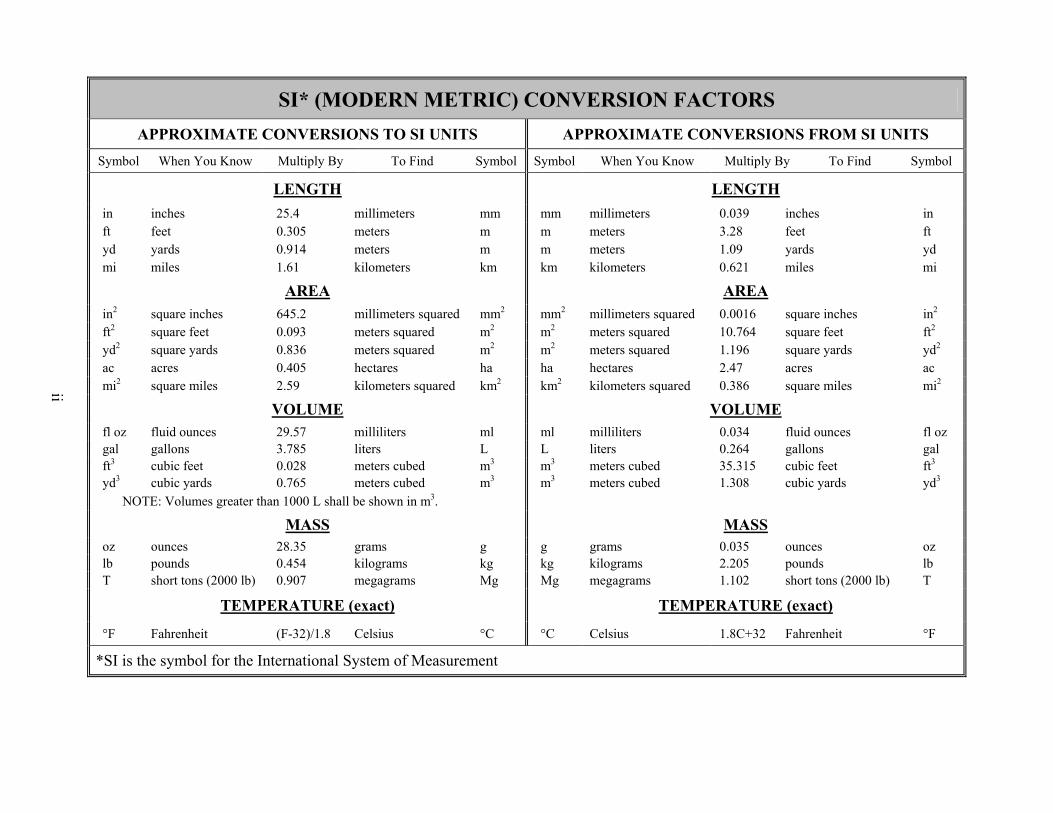
SI* (MODERN METRIC) CONVERSION FACTORS APPROXIMATE CONVERSIONS TO SI UNITS APPROXIMATE CONVERSIONS FROM SI UNITS
Symbol When You Know Multiply By To Find Symbol Symbol When You Know Multiply By To Find Symbol
LENGTH LENGTH in inches 25.4 millimeters mm mm millimeters 0.039 inches in ft feet 0.305 meters m m meters 3.28 feet ft yd yards 0.914 meters m m meters 1.09 yards yd mi miles 1.61 kilometers km km kilometers 0.621 miles mi
AREA AREA in2 square inches 645.2 millimeters squared mm2 mm2 millimeters squared 0.0016 square inches in2
ft2 square feet 0.093 meters squared m2 m2 meters squared 10.764 square feet ft2 yd2 square yards 0.836 meters squared m2 m2 meters squared 1.196 square yards yd2 ac acres 0.405 hectares ha ha hectares 2.47 acres ac mi2 square miles 2.59 kilometers squared km2 km2 kilometers squared 0.386 square miles mi2
VOLUME VOLUME fl oz fluid ounces 29.57 milliliters ml ml milliliters 0.034 fluid ounces fl oz gal gallons 3.785 liters L L liters 0.264 gallons gal ft3 cubic feet 0.028 meters cubed m3 m3 meters cubed 35.315 cubic feet ft3 yd3 cubic yards 0.765 meters cubed m3 m3 meters cubed 1.308 cubic yards yd3
NOTE: Volumes greater than 1000 L shall be shown in m3.
MASS MASS oz ounces 28.35 grams g g grams 0.035 ounces oz lb pounds 0.454 kilograms kg kg kilograms 2.205 pounds lb T short tons (2000 lb) 0.907 megagrams Mg Mg megagrams 1.102 short tons (2000 lb) T
TEMPERATURE (exact) TEMPERATURE (exact)
°F Fahrenheit (F-32)/1.8 Celsius °C °C Celsius 1.8C+32 Fahrenheit °F
*SI is the symbol for the International System of Measurement
ACKNOWLEDGMENTS
The author wishes to thank the following for their assistance and support of this project:
ODOT District 4 personnel for providing needed equipment and materials • • Alan Kirk, ODOT Research Unit for editorial assistance
DISCLAIMER
This document is disseminated under the sponsorship of the Oregon Department of Transportation and the United States Department of Transportation in the interest of information exchange. The State of Oregon and the United States Government assume no liability of its contents or use thereof. The contents of this report reflect the view of the authors who are solely responsible for the facts and accuracy of the material presented. The contents do not necessarily reflect the official views of the Oregon Department of Transportation or the United States Department of Transportation. The State of Oregon and the United States Government do not endorse products of manufacturers. Trademarks or manufacturers’ names appear herein only because they are considered essential to the object of this document. This report does not constitute a standard, specification, or regulation.
iii

iv
WASHING BRIDGES TO REDUCE CHLORIDE
TABLE OF CONTENTS
1.0 INTRODUCTION..................................................................................................................1
2.0 APPROACH...........................................................................................................................3 2.1 FIELD TEST SITE ..............................................................................................................3 2.2 FIELD EVALUATIONS.....................................................................................................4 2.3 LABORATORY EVALUATIONS.....................................................................................4
3.0 RESULTS AND DISCUSSION ............................................................................................9
4.0 CONCLUSIONS ..................................................................................................................11
5.0 REFERENCES.....................................................................................................................13
List of Figures
Figure 2.1: Test section locations and initial chloride profile locations. Dimensions are in meters. ............................3 Figure 2.2: Concrete slab undergoing ponding..............................................................................................................5 Figure 2.3: Rack for washing slabs................................................................................................................................6 Figure 2.4: Schematic of slab position on the wash rack and treatment ........................................................................6 Figure 3.1: Chloride profiles for ponded specimens. Square data points represent chloride levels before washing;
cross data points represent chloride levels after washing. ...........................................................................9 Figure 3.2: Chloride profiles for salt water-sprayed specimens after washing............................................................10
List of Tables Table 2.1: Washing schedule for each section ...........................................................................................................4 Table A-1: Percent total chloride per cement for ponded blocks (no salt spray) before washing ................... A-1 Table A-2: Percent total chloride per cement for ponded blocks (no salt spray) after washing...................... A-1 Table A-3: Percent total chloride per cement for unponded blocks (salt spray) after washing ...................... A-1 Table B-1: Percent total chloride per cement before washing.............................................................................B-1
v

vi
1.0 INTRODUCTION
Oregon has invested heavily in impressed current cathodic protection on reinforced concrete coastal bridges to mitigate chloride induced corrosion. On smaller bridges, cathodic protection may not be practical; however, washing may offer a viable option. In principle, if the chloride concentration at the surface is reduced to near zero, there is a driving force for chloride ions to diffuse to the surface where they may be washed away by subsequent washings. Even if washing does not remove chloride ions, washing may prevent or reduce any further uptake of chloride ions.
If washing is a viable alternative, the washing frequency and amount of water applied for each wash need to be established. These conditions need to be considered in conjunction with the allowed washing period, which in Oregon is from November 15 to March 15 west of the Cascade Mountains. Other considerations include disruption of birds and bats, which might violate environmental regulations.
Though bridge washing is practiced by some transportation agencies, the method seems to be a one-time pressure wash every spring to remove debris and deicing salts (Carter 1989). No work is known to the author that addresses washing as a means to reduce chloride content.
Thus this project has been undertaken to investigate the efficacy of washing to reduce chloride content and chloride ion uptake. The project consists of a laboratory and a field component over a period of four years. Wash frequency and water volume are the varying factors. This interim report covers the methods used in this study and the results of the laboratory component after two years of study.
1

2
2.0 APPROACH
2.1 FIELD TEST SITE
The D River Bridge (Bridge No. 00922A) was selected for field evaluations. The Bridge, located within Lincoln City on the Oregon Coast Highway US 101, is a 30.5 m (110 ft), 3-span, reinforced concrete structure. It was selected because it showed signs of corrosion-induced damage, and it provided easy access to the underside of the deck without ladders or traffic control.
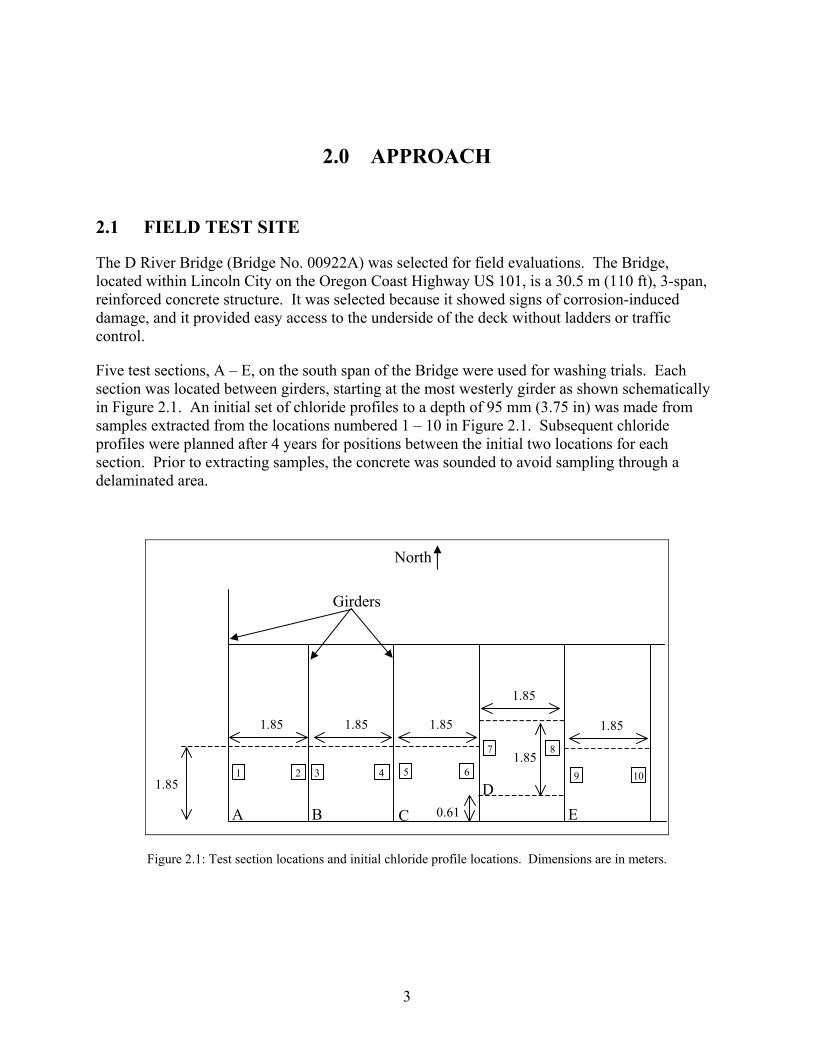
Five test sections, A – E, on the south span of the Bridge were used for washing trials. Each section was located between girders, starting at the most westerly girder as shown schematically in Figure 2.1. An initial set of chloride profiles to a depth of 95 mm (3.75 in) was made from samples extracted from the locations numbered 1 – 10 in Figure 2.1. Subsequent chloride profiles were planned after 4 years for positions between the initial two locations for each section. Prior to extracting samples, the concrete was sounded to avoid sampling through a delaminated area.
1.85
1.85
North
1 2 3
A B
s
Figure 2.1: Test section locations
Girder
0.61
1.85 1.85
1.85
1.85
1.854 5 6
7 8
9 10
CD
E
and initial chloride profile locations. Dimensions are in meters.
3
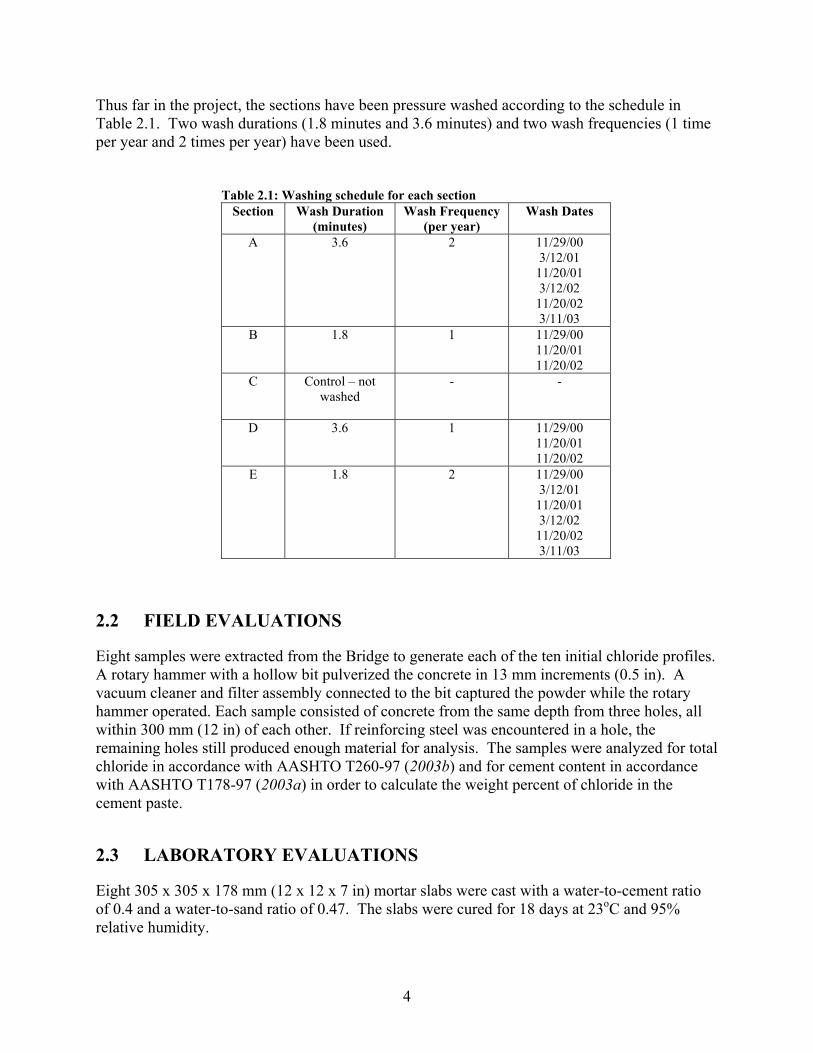
Thus far in the project, the sections have been pressure washed according to the schedule in Table 2.1. Two wash durations (1.8 minutes and 3.6 minutes) and two wash frequencies (1 time per year and 2 times per year) have been used.
Table 2.1: Washing schedule for each section Section Wash Duration
(minutes) Wash Frequency
(per year) Wash Dates
A 3.6 2 11/29/00 3/12/01
11/20/01 3/12/02
11/20/02 3/11/03
B 1.8 1 11/29/00 11/20/01 11/20/02
C Control – not washed
- -
D 3.6 1 11/29/00 11/20/01 11/20/02
E 1.8 2 11/29/00 3/12/01
11/20/01 3/12/02
11/20/02 3/11/03
2.2 FIELD EVALUATIONS
Eight samples were extracted from the Bridge to generate each of the ten initial chloride profiles. A rotary hammer with a hollow bit pulverized the concrete in 13 mm increments (0.5 in). A vacuum cleaner and filter assembly connected to the bit captured the powder while the rotary hammer operated. Each sample consisted of concrete from the same depth from three holes, all within 300 mm (12 in) of each other. If reinforcing steel was encountered in a hole, the remaining holes still produced enough material for analysis. The samples were analyzed for total chloride in accordance with AASHTO T260-97 (2003b) and for cement content in accordance with AASHTO T178-97 (2003a) in order to calculate the weight percent of chloride in the cement paste.
2.3 LABORATORY EVALUATIONS
Eight 305 x 305 x 178 mm (12 x 12 x 7 in) mortar slabs were cast with a water-to-cement ratio of 0.4 and a water-to-sand ratio of 0.47. The slabs were cured for 18 days at 23oC and 95% relative humidity.
4
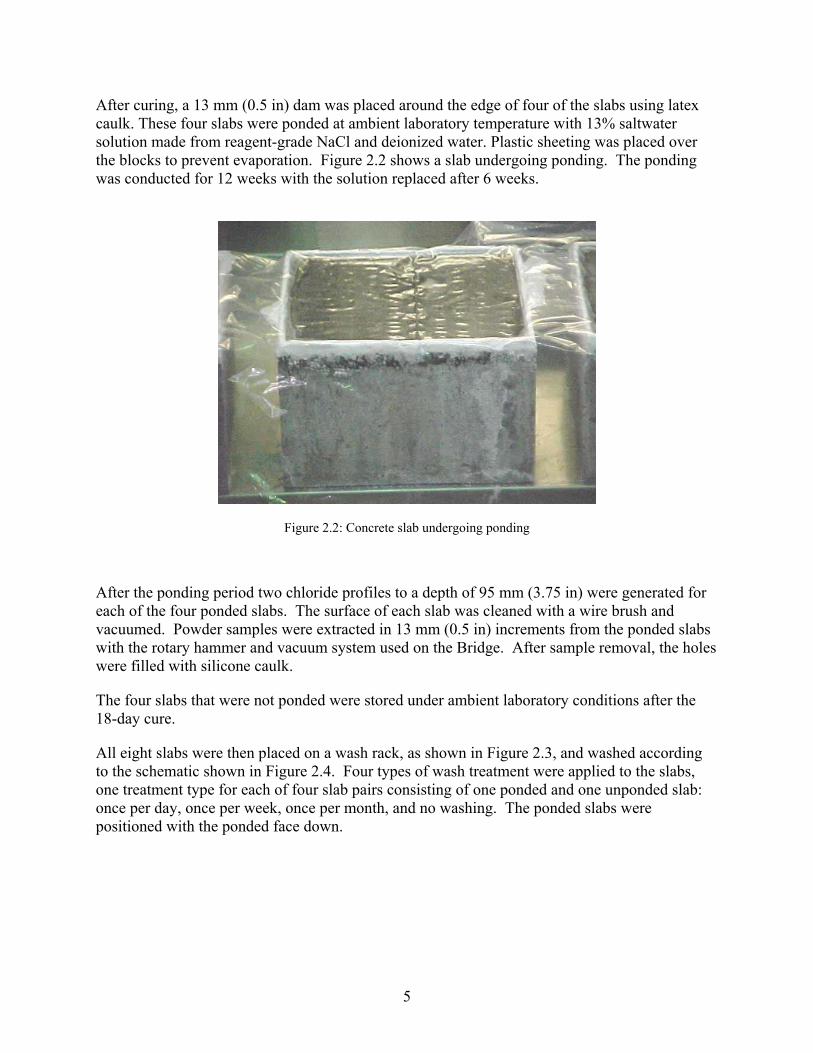
After curing, a 13 mm (0.5 in) dam was placed around the edge of four of the slabs using latex caulk. These four slabs were ponded at ambient laboratory temperature with 13% saltwater solution made from reagent-grade NaCl and deionized water. Plastic sheeting was placed over the blocks to prevent evaporation. Figure 2.2 shows a slab undergoing ponding. The ponding was conducted for 12 weeks with the solution replaced after 6 weeks.
Figure 2.2: Concrete slab undergoing ponding
After the ponding period two chloride profiles to a depth of 95 mm (3.75 in) were generated for each of the four ponded slabs. The surface of each slab was cleaned with a wire brush and vacuumed. Powder samples were extracted in 13 mm (0.5 in) increments from the ponded slabs with the rotary hammer and vacuum system used on the Bridge. After sample removal, the holes were filled with silicone caulk.
The four slabs that were not ponded were stored under ambient laboratory conditions after the 18-day cure.
All eight slabs were then placed on a wash rack, as shown in Figure 2.3, and washed according to the schematic shown in Figure 2.4. Four types of wash treatment were applied to the slabs, one treatment type for each of four slab pairs consisting of one ponded and one unponded slab: once per day, once per week, once per month, and no washing. The ponded slabs were positioned with the ponded face down.
5
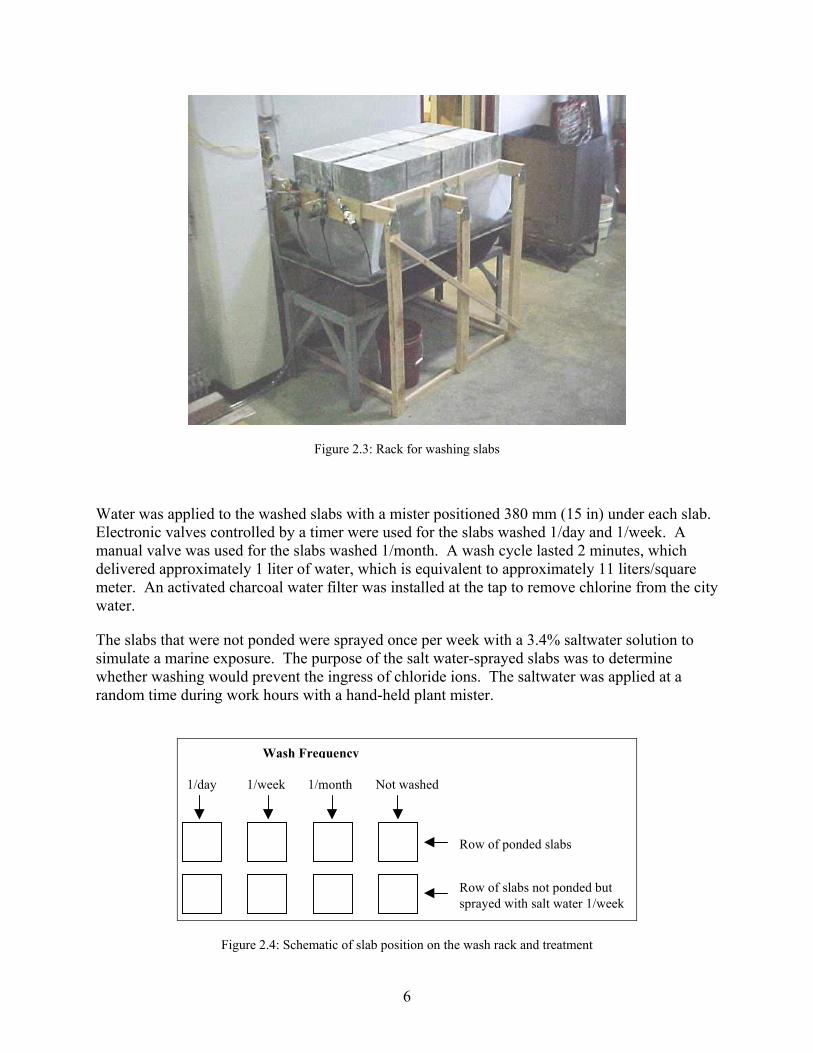
Figure 2.3: Rack for washing slabs
Water was applied to the washed slabs with a mister positioned 380 mm (15 in) under each slab. Electronic valves controlled by a timer were used for the slabs washed 1/day and 1/week. A manual valve was used for the slabs washed 1/month. A wash cycle lasted 2 minutes, which delivered approximately 1 liter of water, which is equivalent to approximately 11 liters/square meter. An activated charcoal water filter was installed at the tap to remove chlorine from the city water.
The slabs that were not ponded were sprayed once per week with a 3.4% saltwater solution to simulate a marine exposure. The purpose of the salt water-sprayed slabs was to determine whether washing would prevent the ingress of chloride ions. The saltwater was applied at a random time during work hours with a hand-held plant mister.
Row of ponded slabs
Row of slabs not ponded butsprayed with salt water 1/week
1/day 1/week 1/month Not washed
Wash Frequency
Figure 2.4: Schematic of slab position on the wash rack and treatment
6

After 25 months, chloride profiles were generated for each slab. Each profile was based on powder samples from two locations on the block. The surface of each slab was cleaned with a wire brush and vacuumed. Powder samples were extracted in 13 mm (0.5 in) increments with the rotary hammer and vacuum system used on the Bridge.
7

8
3.0 RESULTS AND DISCUSSION
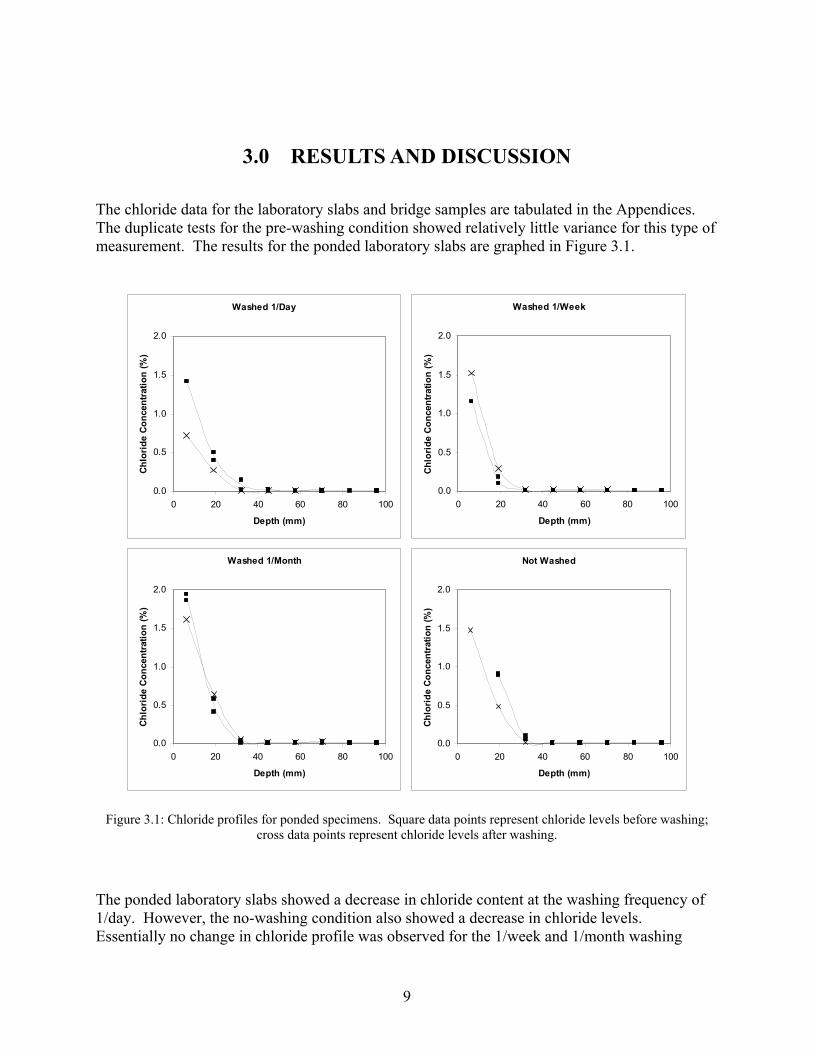
The chloride data for the laboratory slabs and bridge samples are tabulated in the Appendices. The duplicate tests for the pre-washing condition showed relatively little variance for this type of measurement. The results for the ponded laboratory slabs are graphed in Figure 3.1.
Washed 1/Day
0.0
0.5
1.0
1.5
2.0
0 20 40 60 80 100
Depth (mm)
Chl
orid
e C
once
ntra
tion
(%)
Washed 1/Week
0.0
0.5
1.0
1.5
2.0
0 20 40 60 80 100
Depth (mm)
Chlo
ride
Con
cent
ratio
n (%
)
Washed 1/Month
0.0
0.5
1.0
1.5
2.0
0 20 40 60 80 100
Depth (mm)
Chl
orid
e C
once
ntra
tion
(%)
Not Washed
0.0
0.5
1.0
1.5
2.0
0 20 40 60 80 100
Depth (mm)
Chlo
ride
Con
cent
ratio
n (%
)
Figure 3.1: Chloride profiles for ponded specimens. Square data points represent chloride levels before washing; cross data points represent chloride levels after washing.
The ponded laboratory slabs showed a decrease in chloride content at the washing frequency of 1/day. However, the no-washing condition also showed a decrease in chloride levels. Essentially no change in chloride profile was observed for the 1/week and 1/month washing
9
frequencies. Based on these results, the effect of washing on removing chloride ions from concrete is inconclusive.
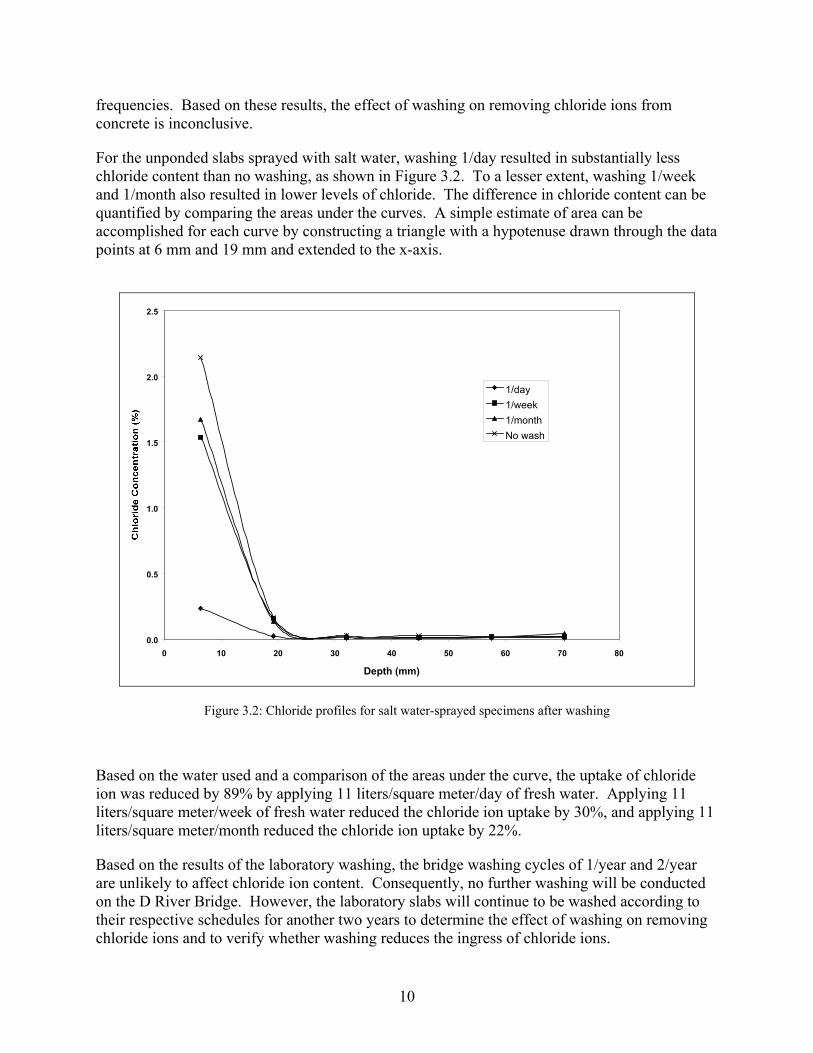
For the unponded slabs sprayed with salt water, washing 1/day resulted in substantially less chloride content than no washing, as shown in Figure 3.2. To a lesser extent, washing 1/week and 1/month also resulted in lower levels of chloride. The difference in chloride content can be quantified by comparing the areas under the curves. A simple estimate of area can be accomplished for each curve by constructing a triangle with a hypotenuse drawn through the data points at 6 mm and 19 mm and extended to the x-axis.
0.0
0.5
1.0
1.5
2.0
2.5
0 10 20 30 40 50 60 70 80
Depth (mm)
1/day1/week1/monthNo wash
Figure 3.2: Chloride profiles for salt water-sprayed specimens after washing
Based on the water used and a comparison of the areas under the curve, the uptake of chloride ion was reduced by 89% by applying 11 liters/square meter/day of fresh water. Applying 11 liters/square meter/week of fresh water reduced the chloride ion uptake by 30%, and applying 11 liters/square meter/month reduced the chloride ion uptake by 22%.
Based on the results of the laboratory washing, the bridge washing cycles of 1/year and 2/year are unlikely to affect chloride ion content. Consequently, no further washing will be conducted on the D River Bridge. However, the laboratory slabs will continue to be washed according to their respective schedules for another two years to determine the effect of washing on removing chloride ions and to verify whether washing reduces the ingress of chloride ions.
10
4.0 CONCLUSIONS
Based on the results of the laboratory tests, the following conclusions can be made at this point during the study:
• The effect of washing with fresh water on removing chloride ions from concrete was inconclusive.
• Washing with fresh water reduced the amount of chloride ion uptake by up to 89%.
• Washing cycles being used in the field component of this study are unlikely to reduce the chloride ion content of the concrete in the Bridge.
11

12
5.0 REFERENCES
AASHTO T178-97. “Cement Content of Hardened Portland Cement Concrete.” Standard Specifications for Transportation Materials and Methods of Sampling and Testing, 23rd edition. Washington, DC: American Association of State Highway and Transportation Officials. 2003a.
AASHTO T260-97. “Sampling and Testing for Chloride Ion in Concrete and Concrete Raw Materials.” Standard Specifications for Transportation Materials and Methods of Sampling and Testing, 23rd edition. Washington, DC: American Association of State Highway and Transportation Officials. 2003b.
Carter, Paul D. “Preventive Maintenance of Concrete Bridge Decks.” Concrete International. Vol. 11, Issue 11. pp. 33-36. November 1989.
13

14
APPENDIX A
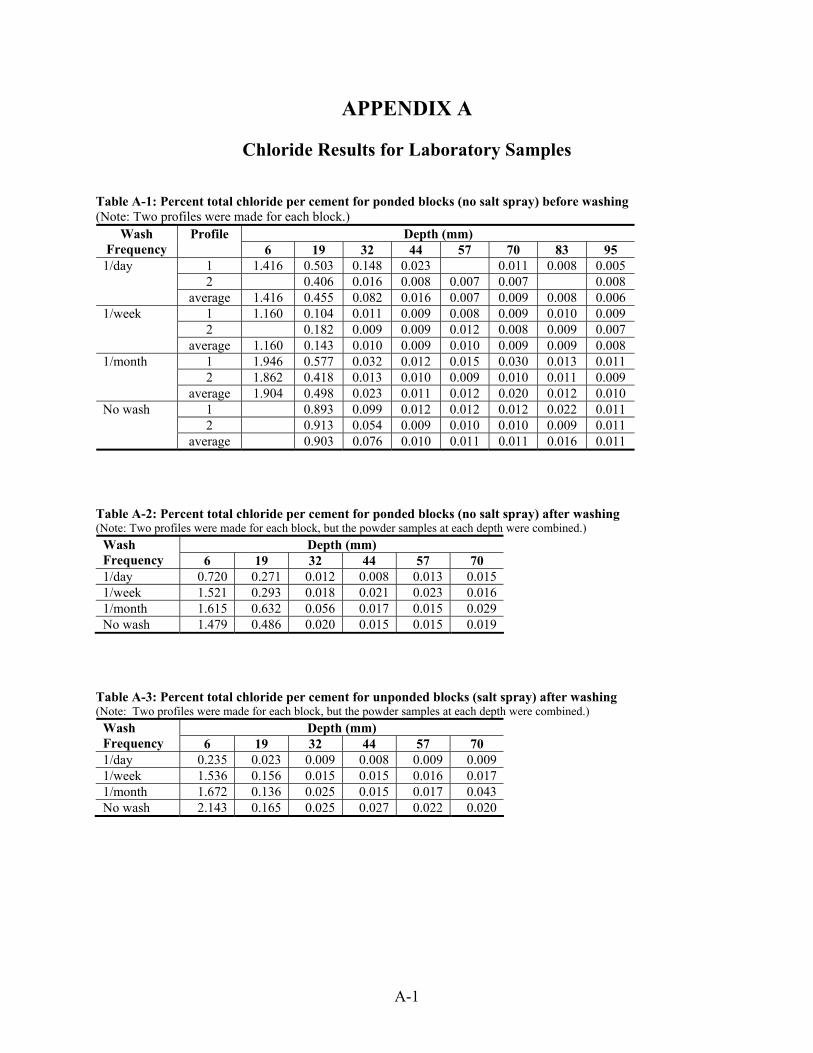
Chloride Results for Laboratory Samples Table A-1: Percent total chloride per cement for ponded blocks (no salt spray) before washing (Note: Two profiles were made for each block.)
Depth (mm) Wash Frequency
Profile 6 19 32 44 57 70 83 95
1 1.416 0.503 0.148 0.023 0.011 0.008 0.005 2 0.406 0.016 0.008 0.007 0.007 0.008
1/day
average 1.416 0.455 0.082 0.016 0.007 0.009 0.008 0.006 1 1.160 0.104 0.011 0.009 0.008 0.009 0.010 0.009 2 0.182 0.009 0.009 0.012 0.008 0.009 0.007
1/week
average 1.160 0.143 0.010 0.009 0.010 0.009 0.009 0.008 1 1.946 0.577 0.032 0.012 0.015 0.030 0.013 0.011 2 1.862 0.418 0.013 0.010 0.009 0.010 0.011 0.009
1/month
average 1.904 0.498 0.023 0.011 0.012 0.020 0.012 0.010 1 0.893 0.099 0.012 0.012 0.012 0.022 0.011 2 0.913 0.054 0.009 0.010 0.010 0.009 0.011
No wash
average 0.903 0.076 0.010 0.011 0.011 0.016 0.011 Table A-2: Percent total chloride per cement for ponded blocks (no salt spray) after washing (Note: Two profiles were made for each block, but the powder samples at each depth were combined.)
Depth (mm) Wash Frequency 6 19 32 44 57 70 1/day 0.720 0.271 0.012 0.008 0.013 0.015 1/week 1.521 0.293 0.018 0.021 0.023 0.016 1/month 1.615 0.632 0.056 0.017 0.015 0.029 No wash 1.479 0.486 0.020 0.015 0.015 0.019
Table A-3: Percent total chloride per cement for unponded blocks (salt spray) after washing (Note: Two profiles were made for each block, but the powder samples at each depth were combined.)
Depth (mm) Wash Frequency 6 19 32 44 57 70 1/day 0.235 0.023 0.009 0.008 0.009 0.009 1/week 1.536 0.156 0.015 0.015 0.016 0.017 1/month 1.672 0.136 0.025 0.015 0.017 0.043 No wash 2.143 0.165 0.025 0.027 0.022 0.020
A-1

A-2
APPENDIX B
Chloride results for D River Bridge
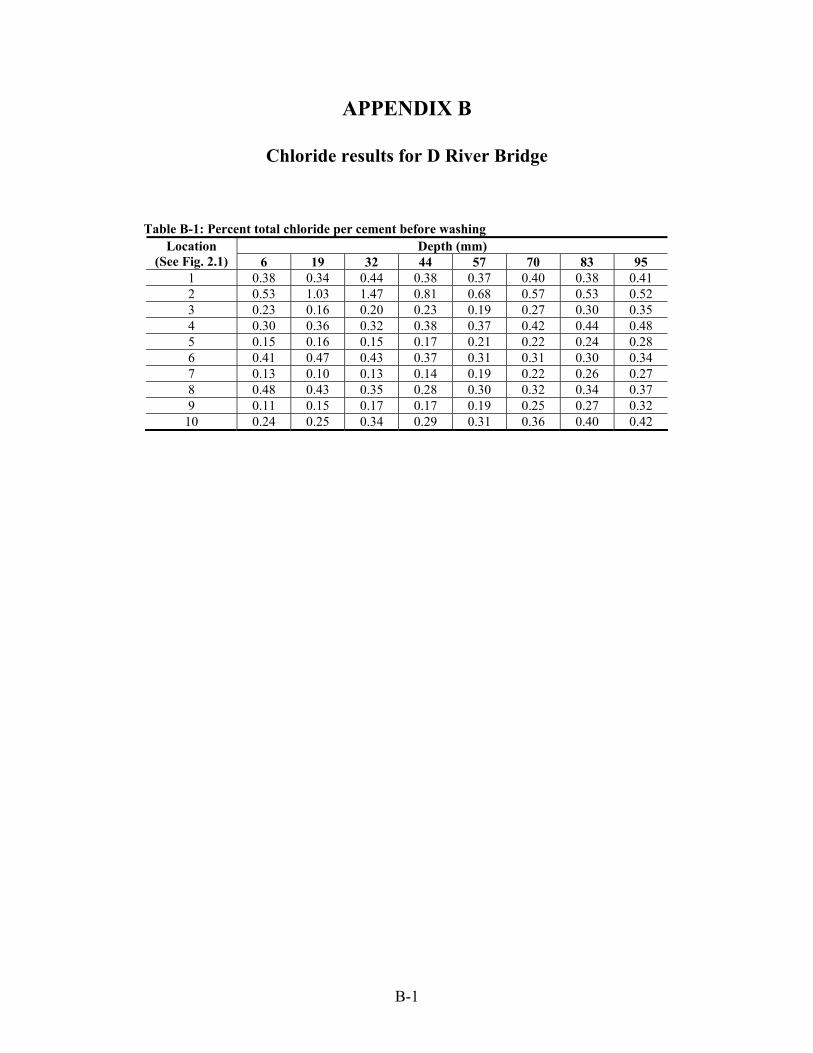
Table B-1: Percent total chloride per cement before washing Depth (mm) Location
(See Fig. 2.1) 6 19 32 44 57 70 83 95 1 0.38 0.34 0.44 0.38 0.37 0.40 0.38 0.41 2 0.53 1.03 1.47 0.81 0.68 0.57 0.53 0.52 3 0.23 0.16 0.20 0.23 0.19 0.27 0.30 0.35 4 0.30 0.36 0.32 0.38 0.37 0.42 0.44 0.48 5 0.15 0.16 0.15 0.17 0.21 0.22 0.24 0.28 6 0.41 0.47 0.43 0.37 0.31 0.31 0.30 0.34 7 0.13 0.10 0.13 0.14 0.19 0.22 0.26 0.27 8 0.48 0.43 0.35 0.28 0.30 0.32 0.34 0.37 9 0.11 0.15 0.17 0.17 0.19 0.25 0.27 0.32
10 0.24 0.25 0.34 0.29 0.31 0.36 0.40 0.42
B-1