
Warszawa, 23 kwietnia 2001 r - nbp.pl · N a r o d o w y B a n k P o l s k i I n s t y t u t E k o...
21
N a r o d o w y B a n k P o l s k i Instytut Ekonomiczny Jacek Łaszek, Hanna Augustyniak 12 March 2012 Krzysztof Olszewski, Krzysztof Gajewski Bureau of Macroprudential Policy Information on home prices and the situation in the residential and commercial real estate market in Poland 1 in 2011 Q4 1 The information was prepared by the Economic Institute to be used the NBP’s authorities and it presents t he authors’ opinions. This document should not be read as an advisory material or the basis for investment decisions. 2 The Act of 16 September 2011 (Journal of Laws no. 232, item 1377) on the protection of home buyers’ rights, defines the real estate development contract and obliged the real estate developer to provide the buyer with appropriate protection measures. Summary Analysis of the situation in the Polish real estate market in 2011 Q4 leads to the following conclusions: the majority of trends observed in the housing market since the beginning of 2011 continued in the analysed period, which may be viewed as the market’s shift toward a new equilibrium with lower home prices and falling production costs; slight declines in home prices, expressed in nominal terms (both offer and transaction prices in the primary market and existing stock) were observed in the largest cities; prices declined more markedly in real terms which was driven by growing wages and inflation; slight declines in margins on PLN housing loan had a positive impact on the demand for loans and housing; yet, despite a significant growth in loan disbursements under the government-subsidized housing scheme Rodzina na Swoim (RnS), the quarter-on-quarter rise in individual debt resulting from housing loans was lower than the one recorded in the corresponding period of 2010; banks’ withdrawal from FX lending to households constituted an important factor supporting the security of the financial system; we assume a slight decrease in banks’ profits on housing loans (in particular, zloty denominated loans), accompanied by a funding gap and growing deposit costs, which is likely to hinder the attempts to increase lending in the future; the share of profits in the price per square meter of housing and the estimated average annual rate of return on real estate developments remained attractive to developers, especially smaller-sized ones; this resulted in the commencement of new real estate development projects despite the already existing large stock of home construction contracts in place, which might be attributed to the vacatio legis of the new act on real estate development 2 ; in the analysed period, the actual financial indicators of real estate developers (ROA, ROE) were weaker that the theoretical ones, yet, the economic situation of the whole sector does not raise any major concerns; the commercial real estate market saw a rise in the value of investment transactions which, by the end of 2011, exceeded their 2010 level, whereas the capitalization rate of investment projects in prime locations continued on a downward trend.
Transcript of Warszawa, 23 kwietnia 2001 r - nbp.pl · N a r o d o w y B a n k P o l s k i I n s t y t u t E k o...

N a r o d o w y B a n k P o l s k i
I n s t y t u t E k o n o m i c z n y
Jacek Łaszek, Hanna Augustyniak 12 March 2012
Krzysztof Olszewski, Krzysztof Gajewski
Bureau of Macroprudential Policy
Information on home prices and the situation in the residential and
commercial real estate market in Poland1 in 2011 Q4
1 The information was prepared by the Economic Institute to be used the NBP’s authorities and it presents the
authors’ opinions. This document should not be read as an advisory material or the basis for investment decisions. 2 The Act of 16 September 2011 (Journal of Laws no. 232, item 1377) on the protection of home buyers’ rights,
defines the real estate development contract and obliged the real estate developer to provide the buyer with
appropriate protection measures.
Summary
Analysis of the situation in the Polish real estate market in 2011 Q4 leads to the following
conclusions:
the majority of trends observed in the housing market since the beginning of 2011
continued in the analysed period, which may be viewed as the market’s shift toward a new
equilibrium with lower home prices and falling production costs;
slight declines in home prices, expressed in nominal terms (both offer and transaction
prices in the primary market and existing stock) were observed in the largest cities; prices
declined more markedly in real terms which was driven by growing wages and inflation;
slight declines in margins on PLN housing loan had a positive impact on the demand for
loans and housing; yet, despite a significant growth in loan disbursements under the
government-subsidized housing scheme Rodzina na Swoim (RnS), the quarter-on-quarter
rise in individual debt resulting from housing loans was lower than the one recorded in the
corresponding period of 2010;
banks’ withdrawal from FX lending to households constituted an important factor
supporting the security of the financial system;
we assume a slight decrease in banks’ profits on housing loans (in particular, zloty
denominated loans), accompanied by a funding gap and growing deposit costs, which
is likely to hinder the attempts to increase lending in the future;
the share of profits in the price per square meter of housing and the estimated average
annual rate of return on real estate developments remained attractive to developers,
especially smaller-sized ones; this resulted in the commencement of new real estate
development projects despite the already existing large stock of home construction
contracts in place, which might be attributed to the vacatio legis of the new act on real
estate development2;
in the analysed period, the actual financial indicators of real estate developers (ROA, ROE)
were weaker that the theoretical ones, yet, the economic situation of the whole sector does
not raise any major concerns;
the commercial real estate market saw a rise in the value of investment transactions which,
by the end of 2011, exceeded their 2010 level, whereas the capitalization rate of investment
projects in prime locations continued on a downward trend.

2 / 21
The study provides a synthetic description of key developments affecting the housing
market in Poland’s largest cities in 2011 Q4 and contains an attachment with charts and figures
presenting: 1/ home prices (Figures 1-12), 2/ availability: loan availability, housing availability,
availability of loan-financed housing, loan limits and loan disbursements under the government-
subsidized housing scheme Family on their own (Rodzina na Swoim - RnS) (Figures 13-24)
3/loan disbursements and real interest rates (Figures 25-40), 4/ costs of construction and assembly
output, profitability of real estate development projects and economic situation of real estate
developers in Poland (Figures 41-60), residential construction in Poland (Figures 61-72), and
6/ commercial real estates (Figures 73-88).
This study was based on the data from the Real Estate Market Database BaRN3, database
of offer prices of housing provided by PONT Info Nieruchomości, databases SARFIN and
AMRON of the Polish Banks’ Association (ZBP), collective data of the Credit Information
Bureau (Biuro Informacji Kredytowej), data presented by Sekocenbud, the Central Statistical
Office (GUS) and the National Bank of Poland (NBP). Offer prices of housing put on sale and
information concerning profitability of real estate development projects were based on the data
furnished by the Real Estate Advisory Service (REAS) and information supplied by the GUS (F01
and F02).
Information concerning the commercial real estate market4 was prepared on the basis of
data provided, on a voluntary basis, by commercial real estate agents and commercial real estate
management companies as well as companies involved in commercial real estate consultancy.
The analysis also draws on the expertise of experts of various consulting companies and the NBP.
The study relied on the data and information provided by the following consulting companies:
CBRE, Colliers International, Cushman & Wakefield, DTZ, Horwath HTL, Jones Lang LaSalle,
Ober Haus, BRE Bank Hipoteczny and associations: the Retail Research Forum of the Polish
Council of Shopping Centres and the Warsaw Research Forum.
------------------------
In 2011 Q4 the housing real estate sector, similarly to the previous four quarters, saw
processes accompanying the search for a new long-term equilibrium. This involved many different
processes connected with both the demand side, but also with the rebuilding of the existing stock,
thus the supply side. Factors affecting household income and loan availability were of particular
importance in the first group of processes. This coincided with regulatory measures and
speculation of both producers and buyers, which is typical in the real estate market. While
speculation, by boosting supply, enhanced the cyclic nature of the market in a short-term horizon,
regulatory measures had both a short-term and long-term impact.
The discussed processes are clearly visible when comparing the time series presenting the
main sector proportions from the perspective of housing supply (see Figure 41 and Figure 42).
The housing market boom in the years 2005-2007 triggered a dramatic surge in prices, which,
with a certain time lag, gave rise to growing costs of construction and assembly production and
production factors, including materials and labour. In the subsequent years, home prices, in real
terms, decreased gradually and real-term prices of production factors, including materials and
3 The BaRN database of the National Bank of Poland is created thanks to voluntary provision of data by the real
estate agents and real estate developers with the participation of regional branches of the NBP; the study analyses
both home sales offers and transactions as well as home rentals within city limits of sixteen voivoship cities, where
the majority of real estate deals are closed. 4 The study focuses on modern commercial real estates as they are the object of transactions conducted by large
real estate agents and since there is a strong and direct relationship between the scale of those transactions and the
domestic economy. Introductory information on the commercial real estate market, definitions and in-depth analysis
of major economic variables are presented in the NBP’s report: “Report on the situation in the residential and
commercial real estate market in Poland in 2010”, available on the NBP’s website.

3 / 21
labour, showed a sustainable growth. The market also saw continued high land prices. As a result,
prices of construction and assembly production failed to return to their previously observed level,
and the profitability of real estate development is closer to the one noted in 2005 than its 2007
level. Consequently, for fundamental reasons, there is no room for larger home price reductions
than those observed in the past. Yet, a moderate price adjustment will continue in the nearest
future, which is connected with a gradual attainment of the equilibrium and business cycle factors.
Still, further moderate price adjustments may be expected as a result of gradual limitation of
public infrastructure schemes. This will give rise to falling prices of materials and labour, and,
consequently, lower prices of construction and assembly works.
The main factor behind imbalances on the demand side, namely the lower interest rate on
FX loans affecting loan availability, is on the wane. As a result, availability of loan-financed
housing (see Figure 16, Figure 18, Figure 20, Figure 22) and the average home price to average
income ratio (see Figure 70) revert to the pre-boom level. This level may be considered as close to
the equilibrium level. The less favourable level of those indices is the effect of continued
relatively high home prices.
General trends discussed in this paper are reflected in analytical indicators, including the
2011 Q4 indicators. The largest markets continued to experience a slight downward trend in prices
(see Figure 1-Figure 12), which is especially visible in real-term, CPI-deflated prices (see Figure
4). A particularly marked decline was observed in offer prices; moreover, real estate developers
started to value home construction contracts in a more realistic way.
The decline of the share of FX loan made the loan availability and availability of loan-
financed housing levels reverse to similar ones as in2004 (see Figure 15-Figure 22). The
relatively lower availability of loan-financed housing continues to be driven by persistently high
home prices. Although high inflation observed in 2011 drives down the costs of home financing in
real terms (see: Figure 14), there are no products to make use of the low real interest rates
prevailing in the market (like loans with delayed repayment). As a result, of paramount
importance are high nominal interest rates, based on which banks determine loan availability, thus
curbing demand.
Undoubtedly, the government-subsidized housing scheme RnS is a factor supporting
demand, which, despite limits for major markets being reduced below the average, continued to
see peak popularity (see Figure 24). Yet, it should be remembered that the consequences of
reduced limits will show their impact at the earliest in 2012, when the scheme is scheduled to end.
This may, as past experience shows, further increase demand for lending under the scheme, and
consequently, increase demand for housing.
Restricted FX lending combined with regulatory measures and banks’ concerns about
further declines in home prices resulted in a lower loan availability and led to a lower debt
increase (see Figure 25-Figure 27). Yet, neither the geographical location of loans nor the loan
quality saw any significant changes. The return on mortgage loans continued at a stable level since
the beginning of the year and did not pose any barrier to lending. On the other hand, the funding
gap proved to be a problem for some banks, which on account of the poorly operating interbank
market incurred significant costs of loan funding (see Figure 31-Figure 32).
In the real estate development sector, relatively high home prices (margins at approx. 40%)
enabled the newly commenced real estate development projects to generate gross annual operating
return of approximately 25%. This gave rise to good business conditions in the sector and
commencement of new projects despite the existing surplus of unsold housing. This was driven by
developers’ assumption that at this level of return they might continue to lower home price and
succeed in selling housing. In the absence of official GUS data, we base on the knowledge on the
market and assume that the return surplus did not change significantly in 2011 Q4, continuing at
a high level.
4 / 21
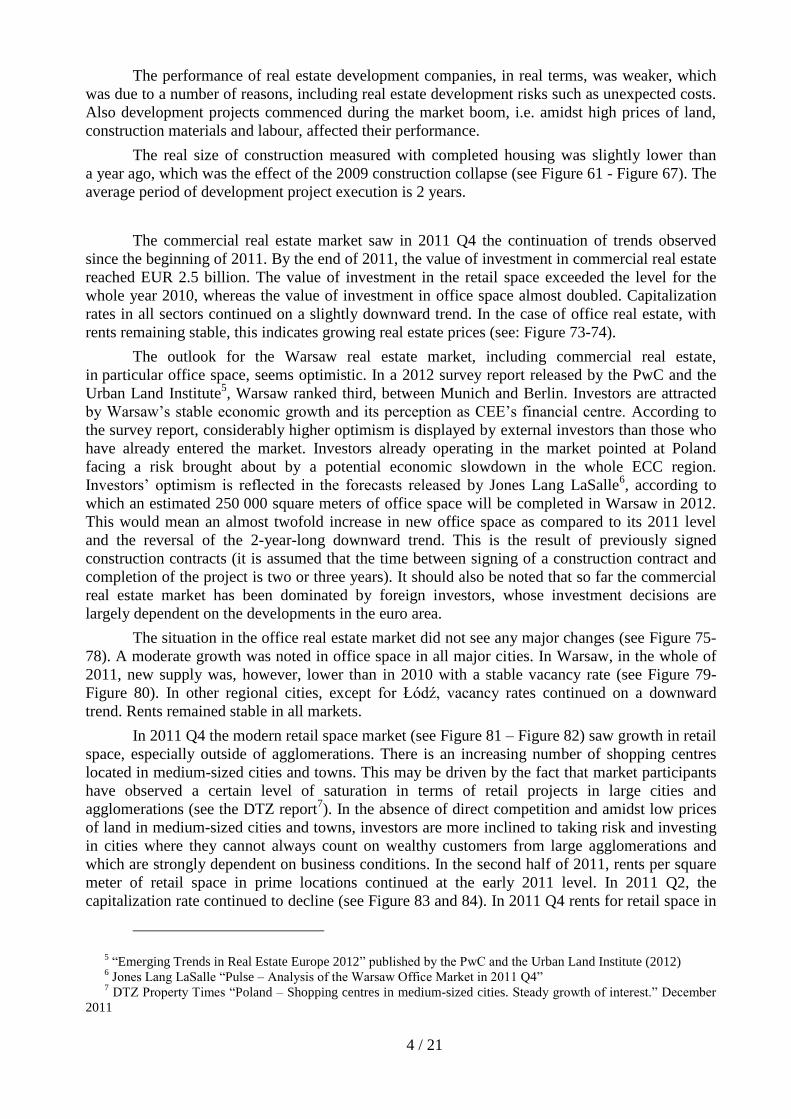
The performance of real estate development companies, in real terms, was weaker, which
was due to a number of reasons, including real estate development risks such as unexpected costs.
Also development projects commenced during the market boom, i.e. amidst high prices of land,
construction materials and labour, affected their performance.
The real size of construction measured with completed housing was slightly lower than
a year ago, which was the effect of the 2009 construction collapse (see Figure 61 - Figure 67). The
average period of development project execution is 2 years.
The commercial real estate market saw in 2011 Q4 the continuation of trends observed
since the beginning of 2011. By the end of 2011, the value of investment in commercial real estate
reached EUR 2.5 billion. The value of investment in the retail space exceeded the level for the
whole year 2010, whereas the value of investment in office space almost doubled. Capitalization
rates in all sectors continued on a slightly downward trend. In the case of office real estate, with
rents remaining stable, this indicates growing real estate prices (see: Figure 73-74).
The outlook for the Warsaw real estate market, including commercial real estate,
in particular office space, seems optimistic. In a 2012 survey report released by the PwC and the
Urban Land Institute5, Warsaw ranked third, between Munich and Berlin. Investors are attracted
by Warsaw’s stable economic growth and its perception as CEE’s financial centre. According to
the survey report, considerably higher optimism is displayed by external investors than those who
have already entered the market. Investors already operating in the market pointed at Poland
facing a risk brought about by a potential economic slowdown in the whole ECC region.
Investors’ optimism is reflected in the forecasts released by Jones Lang LaSalle6, according to
which an estimated 250 000 square meters of office space will be completed in Warsaw in 2012.
This would mean an almost twofold increase in new office space as compared to its 2011 level
and the reversal of the 2-year-long downward trend. This is the result of previously signed
construction contracts (it is assumed that the time between signing of a construction contract and
completion of the project is two or three years). It should also be noted that so far the commercial
real estate market has been dominated by foreign investors, whose investment decisions are
largely dependent on the developments in the euro area.
The situation in the office real estate market did not see any major changes (see Figure 75-
78). A moderate growth was noted in office space in all major cities. In Warsaw, in the whole of
2011, new supply was, however, lower than in 2010 with a stable vacancy rate (see Figure 79-
Figure 80). In other regional cities, except for Łódź, vacancy rates continued on a downward
trend. Rents remained stable in all markets.
In 2011 Q4 the modern retail space market (see Figure 81 – Figure 82) saw growth in retail
space, especially outside of agglomerations. There is an increasing number of shopping centres
located in medium-sized cities and towns. This may be driven by the fact that market participants
have observed a certain level of saturation in terms of retail projects in large cities and
agglomerations (see the DTZ report7). In the absence of direct competition and amidst low prices
of land in medium-sized cities and towns, investors are more inclined to taking risk and investing
in cities where they cannot always count on wealthy customers from large agglomerations and
which are strongly dependent on business conditions. In the second half of 2011, rents per square
meter of retail space in prime locations continued at the early 2011 level. In 2011 Q2, the
capitalization rate continued to decline (see Figure 83 and 84). In 2011 Q4 rents for retail space in
5 “Emerging Trends in Real Estate Europe 2012” published by the PwC and the Urban Land Institute (2012)
6 Jones Lang LaSalle “Pulse – Analysis of the Warsaw Office Market in 2011 Q4”
7 DTZ Property Times “Poland – Shopping centres in medium-sized cities. Steady growth of interest.” December
2011

5 / 21
prime high streets continued at the levels observed since the beginning of 2011. Only the Wrocław
prime high street rents have seen a downward trend, persisting since the beginning of 2009. Prime
high street rents in different cities continued to differ considerably (see Figure 85 and 86).
The warehouse space market in the second half of 2011 experienced a supply growth
exceeding 250 thousand square meters. In the majority of markets, rents remained stable (see
Figure 87 and Figure 88). The Cracow market saw warehouse space rents decline, which may be
driven by proportionally large volume of newly completed warehouse space. In 2011 more than
46 thousand square meters of warehouse space was completed which accounts for an annual space
growth of almost 70%. In accordance with the CBRE data8 in 2011 approx. 40% of warehouse
space in Poland was built in the build-to-suit format, which may point to a prudential attitude of
real estate developers. According to the Spring 2012 Marketbeat report by Cushman & Wakefield,
at the end of 2011 approximately 270 thousand square meters of warehouse space was under
construction.
8 CBRE “Big Box Poland – Warehouse market in Poland”, 2011 Q4.

6 / 21
Attachment
1. Offer, transaction and hedonic9 prices of housing, primary market and secondary
market
Figure 1 Offer prices per square meter of housing –
primary market
Figure 2 Offer prices per square meter of housing as per
new contracts– primary market
Source: PONT Info Nieruchomości. Source: REAS.
Figure 3 Offer prices per square meter of housing –
secondary market
Figure 4 Weighted average*/ price per square meter of
housing and CPI-deflated price (2006 Q3 =100) – primary
market, offer
Source: PONT Info Nieruchomości. */ Price weighted with the share of housing in the housing
market stock;
Source: NBP.
7 cities: Warsaw, Cracow, Poznań, Wrocław, Łódź, Gdańsk, Gdynia;
10 cities: Białystok, Bydgoszcz, Kielce, Katowice, Lublin, Olsztyn, Opole, Rzeszów, Szczecin, Zielona Góra;
Figure 5 Transaction prices per square meter of housing –
primary market
Figure 6 Transaction prices per square meter of housing –
existing stock
Source: NBP. Source: NBP.
9 The hedonic price index is a measure reflecting the price change resulting from factors other than differences in
housing quality. The index accounts for changes in the quality of housing in the empirical samples in each period.

7 / 21
Figure 7 Average transaction price per square meter of
housing, and price adjusted with the hedonic index 9/
–
existing stock
Figure 8 Average transaction price per square meter of
housing, and price adjusted with the hedonic index 9/
–
existing stock
Source: NBP. Source: NBP.
Figure 9 Growth (y/y) in average prices per square meter of
housing – primary market, offers and transactions
Figure 10 Growth (y/y) in average prices per square meter
of housing – existing stock, offers and transactions
7 cities: Warsaw, Cracow, Poznań, Wrocław, Łódź, Gdańsk, Gdynia;
10 cities: Białystok, Bydgoszcz, Kielce, Katowice, Lublin, Olsztyn, Opole, Rzeszów, Szczecin, Zielona Góra;
Source: NBP (transactions), PONT Info Nieruchomości
(offers).
Source: NBP (transactions), PONT Info Nieruchomości
(offers).
Figure 11 Average weighted*/ price per square meter of
housing – primary market, transactions
Figure 12 Average weighted*/ price per square meter of
housing and hedonic price – existing stock, transactions
Note: */ Price weighted with the share of housing in the housing market stock;
Source: NBP.

8 / 21
2. Housing availability, loan availability, availability of loan-financed housing
Figure 13 Availability of square meters’ of housing for
an average wage in the enterprise sector
Figure 14 Profitability of housing loan for consumer
Housing availability – a measure of the potential ability to purchase housing space at offer prices for an average
monthly wage in the enterprise sector; it expresses the number of square metres of housing with an average offer
price in a particular market (PONT Info) , that can be purchased for an average wage in the enterprise sector in a
particular city (GUS);
Source: NBP, GUS, PONT Info Nieruchomości. Source: NBP, GUS, PONT Info Nieruchomości.
Figure 15 Available housing loan in PLN (in thousand
PLN)
Figure 16 Availability of loan-financed housing per
square meter of housing (in the case of PLN loan)
Availability of loan-financed housing – a measure, specifying how many square metres of housing at an average
offer price in a particular market (PONT Info) may be purchased, for a housing loan obtained basing on an average
monthly wage in the enterprises sector in a particular market (GUS), in view of bank’s lending requirements and
loan parameters (interest rate, depreciation period, social minimum understood as the minimum income
after payment of loan instalments). The speed of changes of the index and differences between particular markets
provide important information.
Source: NBP, GUS, PONT Info Nieruchomości. Source: NBP, GUS, PONT Info Nieruchomości.
Figure 17 A CHF (in PLN thousand)
Figure 18 Availability of loan-financed housing per 1
square meter of housing (in the case of CHF-
denominated loan)
Source: NBP, GUS, PONT Info Nieruchomości. Source: NBP, GUS, PONT Info Nieruchomości

9 / 21
Figure 19 Available housing loans denominated in EUR
(in thousand PLN)
Figure 20 Availability of loan-financed housing per
square meter of housing (in the case of EUR-
denominated loans)
Source: NBP, GUS, PONT Info Nieruchomości. Source: NBP, GUS, PONT Info Nieruchomości.
Figure 21 Available weighted housing loans 10/
(in PLN
thousand)
Figure 22 Availability of loan-financed housing per
square meter of housing (in the case of weighted
loans10/
)
10/
Loans weighted with FX structure of the quarterly increase in housing loans to individuals;
Source: NBP, GUS, PONT Info Nieruchomości.
Source: NBP, GUS, PONT Info Nieruchomości.
Figure 23 Gap between limits under the government-
subsidized housing scheme RnS and the median
transaction price in six cities – primary market
Figure 24 Loan disbursements under the government-
subsidized housing scheme RnS
Source: NBP, BGK. Source: BGK.

10 / 21
3. Disbursement of housing loans, interest rates
Figure 25 Q-o-q increases in housing loan receivables
from individuals in FX adjusted terms (in PLN million)
Figure 26 Currency structure of q-o-q increases in
housing loan receivables from individuals in FX
adjusted terms (in PLN million)
Source: NBP. Source: NBP.
Figure 27 Structure of housing loan receivables from
individuals (in %)
Figure 28 New housing loans in terms of values and
quantities, quarter-on-quarter changes (in PLN billion)
Source: NBP. Source: ZBP.
Figure 29 Geographical breakdown of housing loans in
Poland, in Q4
Figure 30 New housing loans in Poland’s six largest
cities, in Q4
Note: BIK data do not cover the total of housing loans
6 cities: Warsaw, Cracow, Poznań, Wrocław, Łódź,
Gdańsk;
10 cities: Białystok, Bydgoszcz, Kielce, Katowice,
Lublin, Olsztyn, Opole, Rzeszów, Szczecin, Zielona
Góra;
Source: NBP based on BIK data.
Source: NBP based on BIK data.

11 / 21
Figure 31 Banking sector funding gap in Poland (actual
situation in PLN million)
Figure 32 Banking sector funding gap in Poland (quarter-
on-quarter changes, in PLN million)
Source: NBP. Source: NBP
Figure 33 Interest rates in Poland
Figure 34 Interest rates on housing loans in Poland
Source: NBP. Source: NBP.
Figure 35 Bank margins (to WIBOR, LIBOR,
EURIBOR 3M) on new housing loans
Figure 36 New housing loan risk assessement12/
by banks
Bank margin is the difference between housing loan rate (NBP) and LIBOR3MCHF rate, LIBOR3MEUR rate or
WIBOR3M rate; 12/
Risk assessment: for PLN denominated loans (PLN housing loan rate minus Treasury bond rate 10L), for CHF –
denominated loans (CHF loan rate minus PLN loan risk assessment minus LIBOR3MCHF), for EUR denominated
loans (EUR loan rate minus PLN loan risk assessment minus LIBOR3MEUR);
Source: NBP. Source: NBP.

12 / 21
Figure 37 Quality 13/
of housing loan portfolio in Poland’s
six cities in Q4
Figure 38 Estimated banks’ return on FX loans granted and
repaid in Poland 14/
13/
Percentage share of substandard/non-performing
housing loans (i.e. in arrears for 91-180 days) in the total
of housing loans of a particular city and the average
level for the six cities; up-to-date data as at the end of
Q3;
*/average weighted with the city’s share in loan
increase;
14/Income on FX transactions is calculated as follows. New
FX loans are disbursed in PLN. It has been assumed that
an average FX spread amounts to 6% which means that
the bank charges 3% on each FX transaction. Likewise,
when the client pays subsequent foreign currency loan
instalments, FX transactions take place, and the bank
charges additional 3% on this amount. Rate of return is
calculated as the ratio of income on FX transactions to the
whole loan portfolio, i.e. composed of PLN and foreign
currency loans. Repayment of loan instalments has been
calculated with the use of fixed instalments, under the
assumption of a 20-year lending period;
Source: NBP based on BIK data.
Source: NBP, AMRON.
Figure 39 Estimated banks’ return on housing loans, in
PLN in Poland 15/
Figure 40 Estimated banks’ return on housing loans in
foreign currencies in Poland 15/
15/
Income and costs related to housing loan portfolio. Estimated ROE* (Return on Equity) is calculated as the adjusted
interest margin on housing loans with respect to the minimum own capital required. The minimum own capital
requirement is assessed on the basis on the LTV estimate derived from AMRON data and capital requirement for
housing loans as set by the Polish Financial Supervisory Authority (KNF). The adjusted interest margin is the result of
all income being added and all costs being deducted. Closing of foreign currency position and effective interest rate on
loans are based on a study prepared by the Financial Systems Department of the NBP. The effective funding cost was
computed based on WIBOR and LIBOR rates through adding the estimative costs of this operation.
Source: NBP, AMRON.
13 / 21
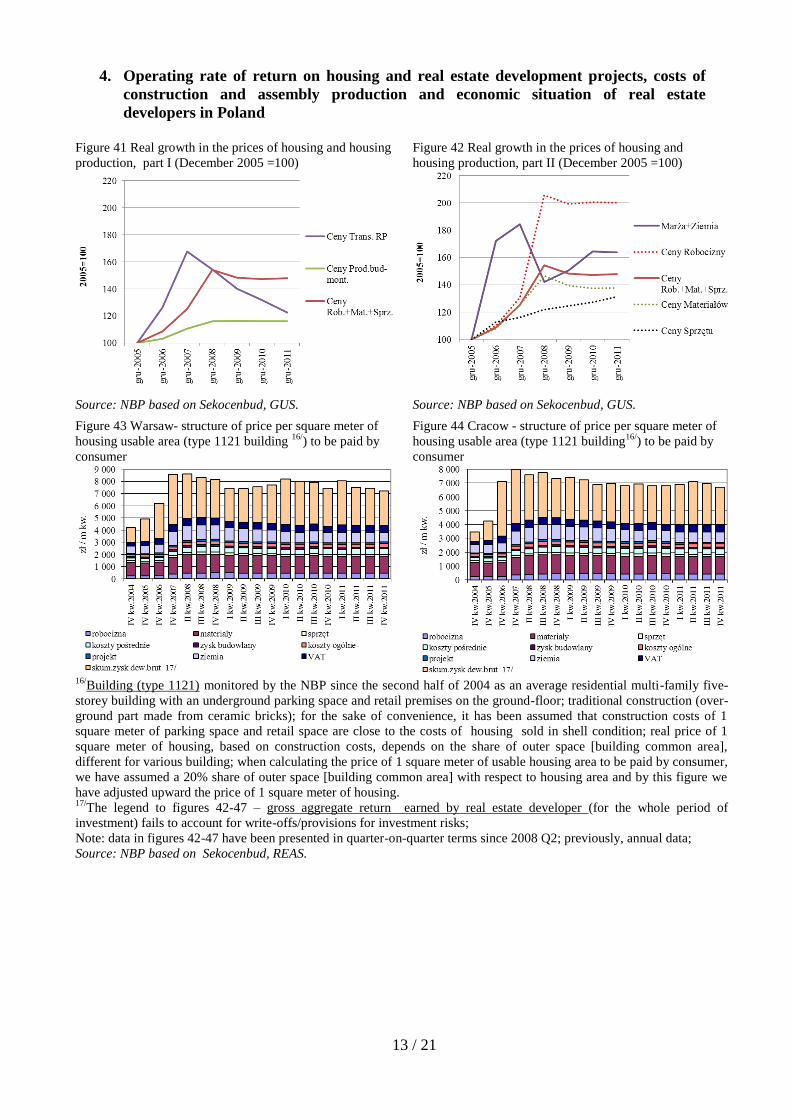
4. Operating rate of return on housing and real estate development projects, costs of
construction and assembly production and economic situation of real estate
developers in Poland
Figure 41 Real growth in the prices of housing and housing
production, part I (December 2005 =100)
Figure 42 Real growth in the prices of housing and
housing production, part II (December 2005 =100)
Source: NBP based on Sekocenbud, GUS. Source: NBP based on Sekocenbud, GUS.
Figure 43 Warsaw- structure of price per square meter of
housing usable area (type 1121 building 16/
) to be paid by
consumer
Figure 44 Cracow - structure of price per square meter of
housing usable area (type 1121 building16/
) to be paid by
consumer
16/
Building (type 1121) monitored by the NBP since the second half of 2004 as an average residential multi-family five-
storey building with an underground parking space and retail premises on the ground-floor; traditional construction (over-
ground part made from ceramic bricks); for the sake of convenience, it has been assumed that construction costs of 1
square meter of parking space and retail space are close to the costs of housing sold in shell condition; real price of 1
square meter of housing, based on construction costs, depends on the share of outer space [building common area],
different for various building; when calculating the price of 1 square meter of usable housing area to be paid by consumer,
we have assumed a 20% share of outer space [building common area] with respect to housing area and by this figure we
have adjusted upward the price of 1 square meter of housing. 17/
The legend to figures 42-47 – gross aggregate return earned by real estate developer (for the whole period of
investment) fails to account for write-offs/provisions for investment risks;
Note: data in figures 42-47 have been presented in quarter-on-quarter terms since 2008 Q2; previously, annual data;
Source: NBP based on Sekocenbud, REAS.

14 / 21
Figure 45 Gdańsk – structure of price per square meter of
housing usable area (type 1121building 16/
) to be paid by
consumer
Figure 46 Wrocław - structure of price per square meter of
housing usable area (type 1121 building 16/
) to be paid by
consumer
Source: NBP based on Sekocenbud, REAS.
Figure 47 Poznań - structure of price per square meter of
housing usable area (type 1121 building 16/
) to be paid by
consumer
Figure 48 Łódź - structure of price per square meter of
housing usable area (type 1121 building 16/
) to be paid by
consumer
Source: NBP based on Sekocenbud, REAS.
Figure 49 Share of direct construction costs per square
meter of a residential building’s usable area (type 1121
building 16/
) in the transaction price in the primary market
Figure 50 Share of real estate developer’s return in the price
per square meter of a residential building’s usable area (type
1121 building 16/
) in the transaction price in the primary
market
Source: NBP based on Sekocenbud.
Source: NBP based on Sekocenbud.

15 / 21
Figure 51 Year-on-year growth in the expected price of
construction and assembly production and costs of
construction of a residential building’s usable area (type
1121 building 16/
)
Figure 52 Cost of construction per square meter of a
residential building’s usable area (type 1121 building 16/
)
Source: NBP based on data published by the GUS (business
conditions survey), Sekocenbud.
Source: NBP based on Sekocenbud.
Figure 53 Costs incurred by a typical large real estate
development company (DF) 18/
in Q3
Figure 54 Share of own costs in the costs incurred by a
large real estate development company (DF) 18/
and the share
of real estate developer’s return in the price per square
meter of housing in the primary market
18/
According to GUS, a large company employs on average
more than 50 persons;
Source: NBP based on GUS (F01).
Source: NBP based on GUS and Sekocenbud.
Figure 55 Economic indicators of a typical large real estate
company 18/
in Q3
Figure 56 Situation of a typical large real estate development
company 18/
in Q3
Source: NBP based on GUS (F01). Source: NBP based on GUS (F01).

16 / 21
Figure 57 Funding structure of a typical large real estate
development company 18/
in Q3
Figure 58 Cost structure of a typical large real estate
development company 18/
in Q3
Source: NBP based on GUS (F01). Source: NBP based on GUS (F01).
Figure 59 Lending to real estate developers in the years
2002-2011 (in PLN billion)
Figure 60 Quality of liabilities 19/
of real estate
development companies in Q3
Source: ZBP.
19/ Liabilities classified as non-performing debts.
Source: NBP based on GUS (F01).

17 / 21
5. Residential construction and housing market in Poland in selected cities
Figure 61 Poland – ownership structure of residential
construction in 2010 and 2011
Figure 62 Poland – completed housing
Source: GUS. Source: GUS.
Figure 63 Poland – housing units under construction
Figure 64 Poland – permits issued for housing
construction
Source: GUS. Source: GUS.
Figure 65 Housing market indicator20/
in Poland and in
Poland’s six largest cities */
(housing under construction
minus completed and sold housing)
Figure 66 Number of housing units on the market, both
sold and offered for sale in Poland’s six largest markets*/
20/
The index is a 12-month rolling number of dwellings;
*/Poland’s six largest cities: Warsaw, Cracow, Gdańsk,
Łódź, Poznań, Wrocław;
*/Poland’s six largest markets: Warsaw, Cracow,
Gdańsk- Sopot-Gdynia agglomeration, Wrocław,
Poznań, Łódź;
Source: NBP based on PABB and GUS.
Źródło: REAS.
18 / 21
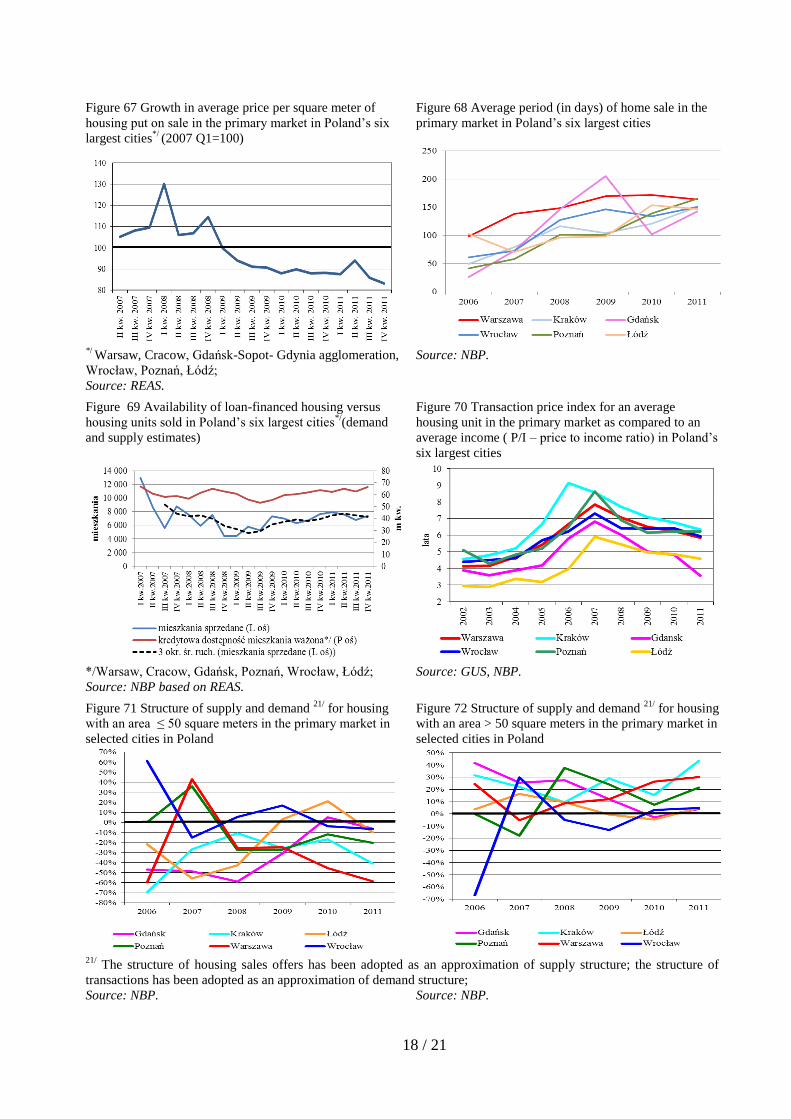
Figure 67 Growth in average price per square meter of
housing put on sale in the primary market in Poland’s six
largest cities*/
(2007 Q1=100)
Figure 68 Average period (in days) of home sale in the
primary market in Poland’s six largest cities
*/
Warsaw, Cracow, Gdańsk-Sopot- Gdynia agglomeration,
Wrocław, Poznań, Łódź;
Source: REAS.
Source: NBP.
Figure 69 Availability of loan-financed housing versus
housing units sold in Poland’s six largest cities*/
(demand
and supply estimates)
Figure 70 Transaction price index for an average
housing unit in the primary market as compared to an
average income ( P/I – price to income ratio) in Poland’s
six largest cities
*/Warsaw, Cracow, Gdańsk, Poznań, Wrocław, Łódź;
Source: NBP based on REAS.
Source: GUS, NBP.
Figure 71 Structure of supply and demand 21/
for housing
with an area ≤ 50 square meters in the primary market in
selected cities in Poland
Figure 72 Structure of supply and demand 21/
for housing
with an area > 50 square meters in the primary market in
selected cities in Poland
21/
The structure of housing sales offers has been adopted as an approximation of supply structure; the structure of
transactions has been adopted as an approximation of demand structure;
Source: NBP. Source: NBP.

19 / 21
6. Commercial real estate
Figure 73 Value of investment transactions (EUR million)
Figure 74 Capitalization rate on investments in
commercial real estates in prime locations
Source: Cushman & Wakefield. Source: DTZ.
Figure 75 Aggregate supply of modern office space (in
square meters)
Figure 76 Vacancy rate
Figure: DTZ. Figure: DTZ.
Figure 77 Rents (EUR/per square meters/per month) for
office space in prime locations
Figure 78 Capitalization rate on investments in modern
office space in prime locations
Source: Cushman & Wakefield. Source: Cushman & Wakefield.

20 / 21
Figure 79 Annual supply of modern office space in
Warsaw (square metres)
Figure 80 Vacancy rate in particular parts of Warsaw
Source: Jones Lang LaSalle. Source: Jones Lang LaSalle.
Figure 81 Aggregate supply of modern retail space (in
millions of square metres) in large agglomerations and in
other parts of Poland
Figure 82 Aggregate supply of modern retail space in
large agglomerations (square meters per 1000
inhabitants)
Source: Polish Council of Shopping Centres Source: Polish Council of Shopping Centres
Figure 83 Rents (EUR/per square meter/per month) for
retail space in prime locations
Figure 84 Capitalization rate on investments in retail real
estates in prime locations
Source: Cushman & Wakefield. Note: Capitalization rates for all markets, except for the
Warsaw market, were identical by the end of 2008
Source: Cushman & Wakefield.
Figure 85 Rents (EUR/per square meter/per month) in Figure 86 Highest rents (EUR/per square meter/per

21 / 21
prime high streets in the first half of 2011
month) in prime high streets
Source: Ober-Haus. Souce: Cushman & Wakefield.
Figure 87 Aggregate supply of modern warehouse space in
Poland’s regions (in millions of square meters)
Figure 88 Rents (EUR/per square meter/per month) for
warehousing space in prime locations
Source: Cushman & Wakefield. Source: Cushman & Wakefield.