Warsaw, Ministry of Finance October 28, 2009 EU10 Regular Economic Report October 2009.
32
Warsaw, Ministry of Finance October 28, 2009 EU10 Regular Economic Report October 2009
-
Upload
camron-douglas -
Category
Documents
-
view
217 -
download
2
Transcript of Warsaw, Ministry of Finance October 28, 2009 EU10 Regular Economic Report October 2009.

Warsaw, Ministry of Finance
October 28, 2009
EU10 Regular Economic ReportOctober 2009

What we have seen– Stabilization
Why Poland is different– Initial conditions, depreciation, market size
What we can expect– Slow recovery
What should be done– Exit strategies and structural reform
Overview

What we have seen

What we have seen
Economy – stabilization
% change, yoy, nsa
Source: Eurostat, World Bank Staff calculations.
-25
-20
-15
-10
-5
0
5
10
15
1Q 08 2Q 08 3Q 08 4Q 08 1Q 09 2Q 09
BG
CZ
EE
HU
LT
LV
PL
RO
SI
SK-25
-20
-15
-10
-5
0
5
10
15
1Q 07 2Q 07 3Q 07 4Q 07 1Q 08 2Q 08 3Q 08 4Q 08 1Q 09 2Q 09
EU15
EU10
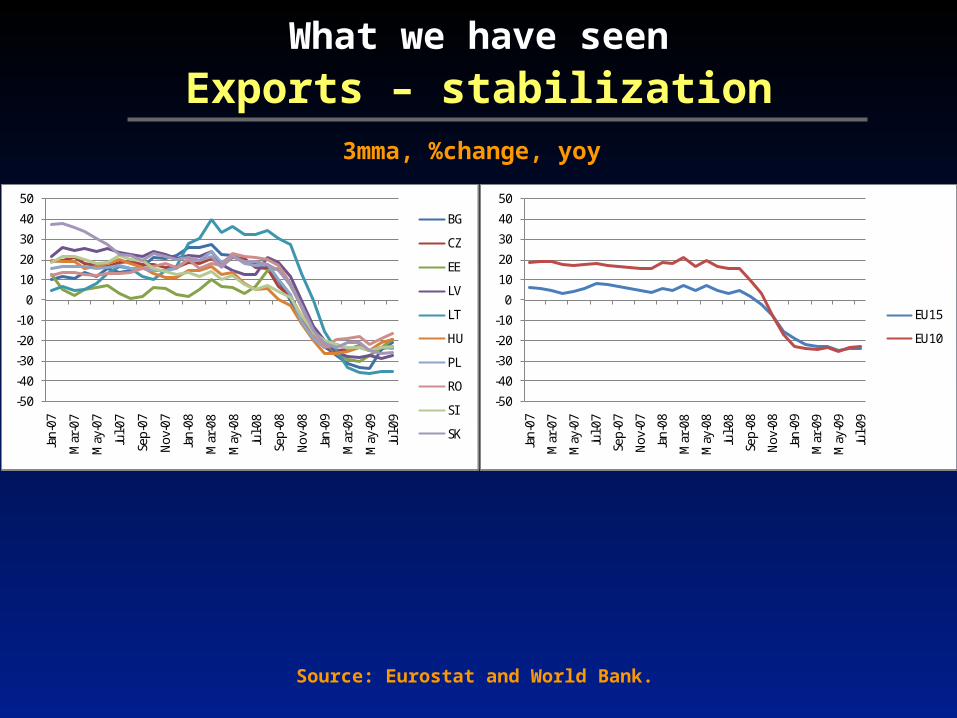
What we have seen
Exports – stabilization3mma, %change, yoy
Source: Eurostat and World Bank.
-50
-40
-30
-20
-10
0
10
20
30
40
50
Jan-
07
Mar
-07
May
-07
Jul-0
7
Sep-
07
Nov
-07
Jan-
08
Mar
-08
May
-08
Jul-0
8
Sep-
08
Nov
-08
Jan-
09
Mar
-09
May
-09
Jul-0
9
BG
CZ
EE
LV
LT
HU
PL
RO
SI
SK
-50
-40
-30
-20
-10
0
10
20
30
40
50
Jan-
07
Mar
-07
May
-07
Jul-0
7
Sep-
07
Nov
-07
Jan-
08
Mar
-08
May
-08
Jul-0
8
Sep-
08
Nov
-08
Jan-
09
Mar
-09
May
-09
Jul-0
9
EU15
EU10
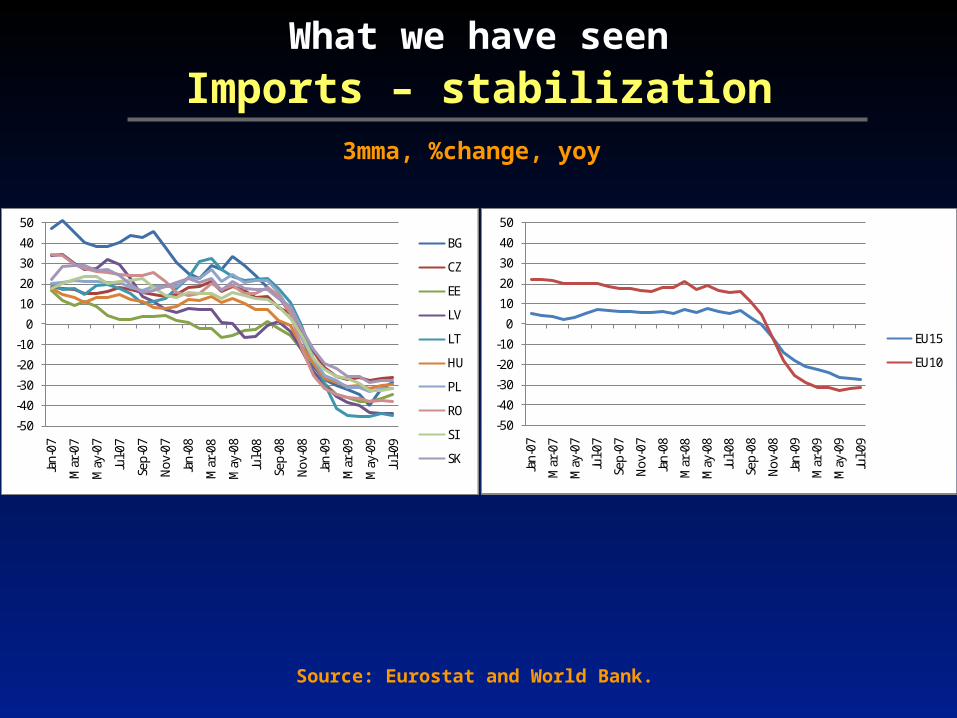
What we have seen
Imports – stabilization3mma, %change, yoy
Source: Eurostat and World Bank.
-50
-40
-30
-20
-10
0
10
20
30
40
50
Jan-
07
Mar
-07
May
-07
Jul-0
7
Sep-
07
Nov
-07
Jan-
08
Mar
-08
May
-08
Jul-0
8
Sep-
08
Nov
-08
Jan-
09
Mar
-09
May
-09
Jul-0
9
EU15
EU10
-50
-40
-30
-20
-10
0
10
20
30
40
50
Jan-
07
Mar
-07
May
-07
Jul-0
7
Sep-
07
Nov
-07
Jan-
08
Mar
-08
May
-08
Jul-0
8
Sep-
08
Nov
-08
Jan-
09
Mar
-09
May
-09
Jul-0
9
BG
CZ
EE
LV
LT
HU
PL
RO
SI
SK

What we have seen
Industrial production – modest rebound3mma, wda, %change, yoy
Source: Eurostat and World Bank.
-40
-30
-20
-10
0
10
20
Jan-
07
Mar
-07
May
-07
Jul-0
7
Sep-
07
Nov
-07
Jan-
08
Mar
-08
May
-08
Jul-0
8
Sep-
08
Nov
-08
Jan-
09
Mar
-09
May
-09
Jul-0
9
BG
CZ
EE
LV
LT
HU
PL
RO
SI
SK
-40
-30
-20
-10
0
10
20
Jan-
07
Mar
-07
May
-07
Jul-0
7
Sep-
07
Nov
-07
Jan-
08
Mar
-08
May
-08
Jul-0
8
Sep-
08
Nov
-08
Jan-
09
Mar
-09
May
-09
Jul-0
9
EU15
EU10

What we have seen
Retail sales – stabilization3mma, wda, %change, yoy
Source: Eurostat and World Bank.
-30
-20
-10
0
10
20
30
40
50
Jan-
07
Mar
-07
May
-07
Jul-0
7
Sep-
07
Nov
-07
Jan-
08
Mar
-08
May
-08
Jul-0
8
Sep-
08
Nov
-08
Jan-
09
Mar
-09
May
-09
Jul-0
9
BG
CZ
EE
LV
LT
HU
PL
RO
SI
SK
-30
-20
-10
0
10
20
30
40
50
Jan-
07
Mar
-07
May
-07
Jul-0
7
Sep-
07
Nov
-07
Jan-
08
Mar
-08
May
-08
Jul-0
8
Sep-
08
Nov
-08
Jan-
09
Mar
-09
May
-09
Jul-0
9
EU15
EU10

What we have seen
Inflation – stabilizationHICP overall index for EU10 and EU15, annual rate of change, %
Source: Eurostat and World Bank.
-5
0
5
10
15
20
Jan-
07
Mar
-07
May
-07
Jul-0
7
Sep-
07
Nov
-07
Jan-
08
Mar
-08
May
-08
Jul-0
8
Sep-
08
Nov
-08
Jan-
09
Mar
-09
May
-09
Jul-0
9
BG
CZ
EE
LV
LT
HU
PL
RO
SI
SK
-5
0
5
10
15
20
Jan-
07
Mar
-07
May
-07
Jul-0
7
Sep-
07
Nov
-07
Jan-
08
Mar
-08
May
-08
Jul-0
8
Sep-
08
Nov
-08
Jan-
09
Mar
-09
May
-09
Jul-0
9
EU15
EU10

What we have seen
Capital flows – strong bond issuanceGross capital inflows to emerging EU10 (US$ billion)
Source: World Bank Global Prospect Group, World Bank Staff calculations.
0
5
10
15
20
25
1Q 0
7
2Q 0
7
3Q 0
7
4Q 0
7
1Q 0
8
2Q 0
8
3Q 0
8
4Q 0
8
1Q 0
9
2Q 0
9
3Q 0
9
Bank
Equity
Bond
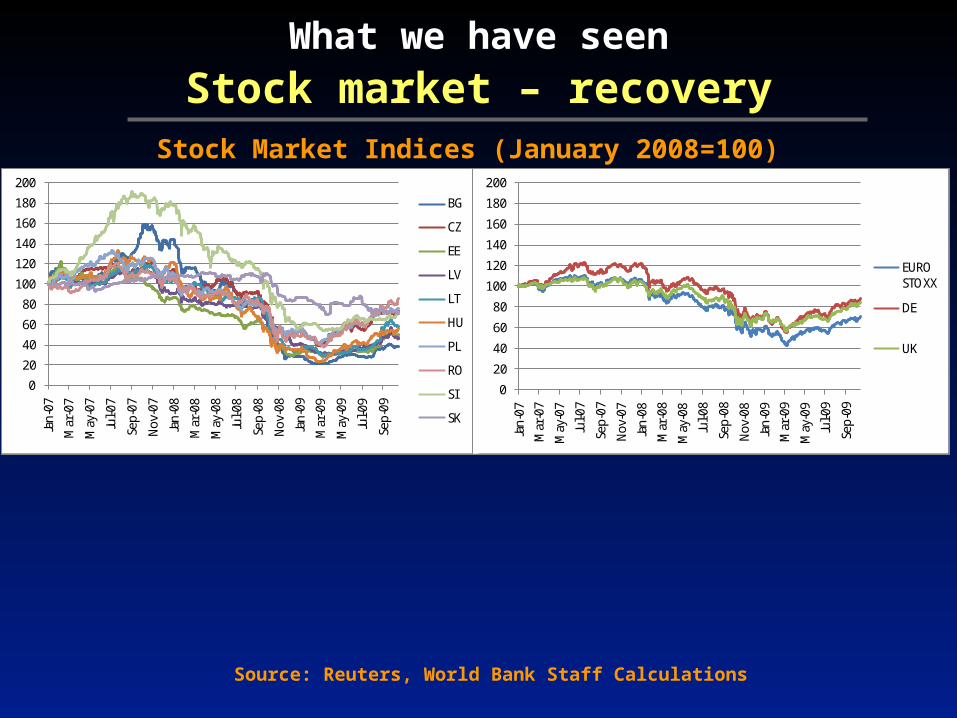
What we have seen
Stock market – recoveryStock Market Indices (January 2008=100)
Source: Reuters, World Bank Staff Calculations
0
20
40
60
80
100
120
140
160
180
200
Jan-
07
Mar
-07
May
-07
Jul-0
7
Sep-
07
Nov
-07
Jan-
08
Mar
-08
May
-08
Jul-0
8
Sep-
08
Nov
-08
Jan-
09
Mar
-09
May
-09
Jul-0
9
Sep-
09
BG
CZ
EE
LV
LT
HU
PL
RO
SI
SK
0
20
40
60
80
100
120
140
160
180
200
Jan-
07
Mar
-07
May
-07
Jul-0
7
Sep-
07
Nov
-07
Jan-
08
Mar
-08
May
-08
Jul-0
8
Sep-
08
Nov
-08
Jan-
09
Mar
-09
May
-09
Jul-0
9
Sep-
09
EURO STOXX
DE
UK

What we have seen
Sovereign bonds – easing of CDS
5-Year Credit Default Swaps (%)
Source: JP Morgan. World Bank Global Prospect Group, World Bank Staff calculations.
Source: World Bank Global Prospect Group, World Bank Staff calculations.
0100200300400500600700800900
100011001200
Jan-
07
Apr
-07
Jul-0
7
Oct
-07
Jan-
08
Apr
-08
Jul-0
8
Oct
-08
Jan-
09
Apr
-09
Jul-0
9
Oct
-09
BG
CZ
EE
LV
LT
HU
PL
RO
SI
SK
0100200300400500600700800900
100011001200
Jan-
07
Apr
-07
Jul-0
7
Oct
-07
Jan-
08
Apr
-08
Jul-0
8
Oct
-08
Jan-
09
Apr
-09
Jul-0
9
Oct
-09
IT
GR
DE
ES

What we have seenBanks – interbank rates down, spreads persistent
Interbank rates (3 months)
Source: World Bank Global Prospect Group, World Bank Staff calculations.
0
5
10
15
20
25
30
35
Jan-
08
Mar
-08
May
-08
Jul-0
8
Sep-
08
Nov
-08
Jan-
09
Mar
-09
May
-09
Jul-0
9
Sep-
09
BG
CZ
EE
LV
LT
HU
PL
RO
SI
SK -200
0
200
400
600
800
1000
1200
1400
SI CZ SK PL BG EE LT HU LV RO
average June 2008
average Feb 2009
average 1H Oct 2009
Interbank rate spreads over Libor
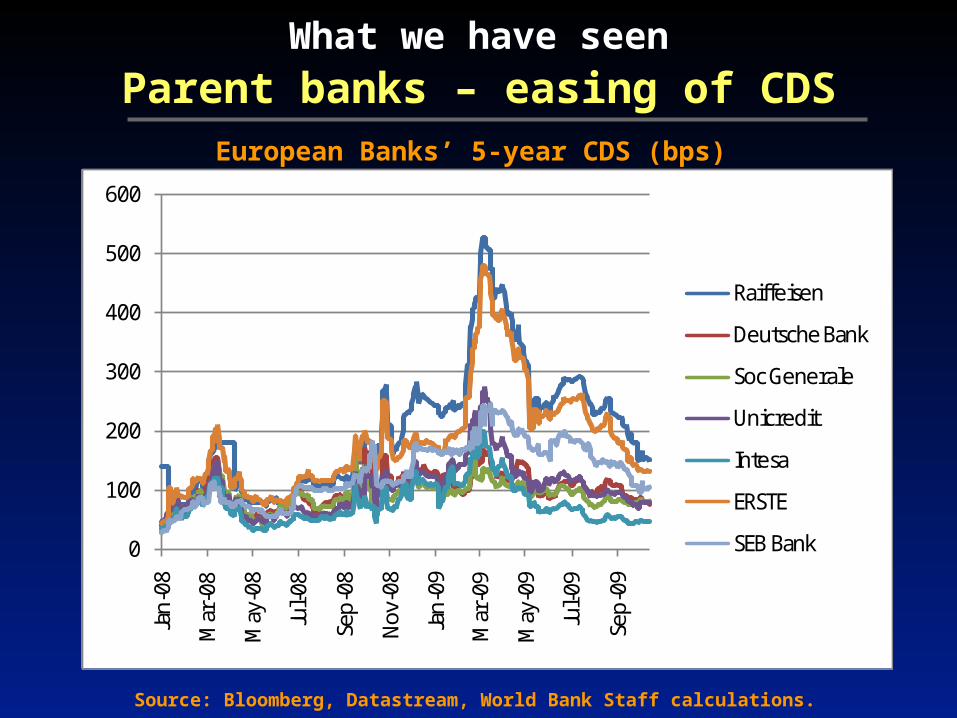
What we have seen
Parent banks – easing of CDSEuropean Banks’ 5-year CDS (bps)
Source: Bloomberg, Datastream, World Bank Staff calculations.
0
100
200
300
400
500
600Ja
n-08
Mar
-08
May
-08
Jul-0
8
Sep-
08
Nov-
08
Jan-
09
Mar
-09
May
-09
Jul-0
9
Sep-
09
Raiffeisen
Deutsche Bank
Soc Generale
Unicredit
Intesa
ERSTE
SEB Bank

What we have seen
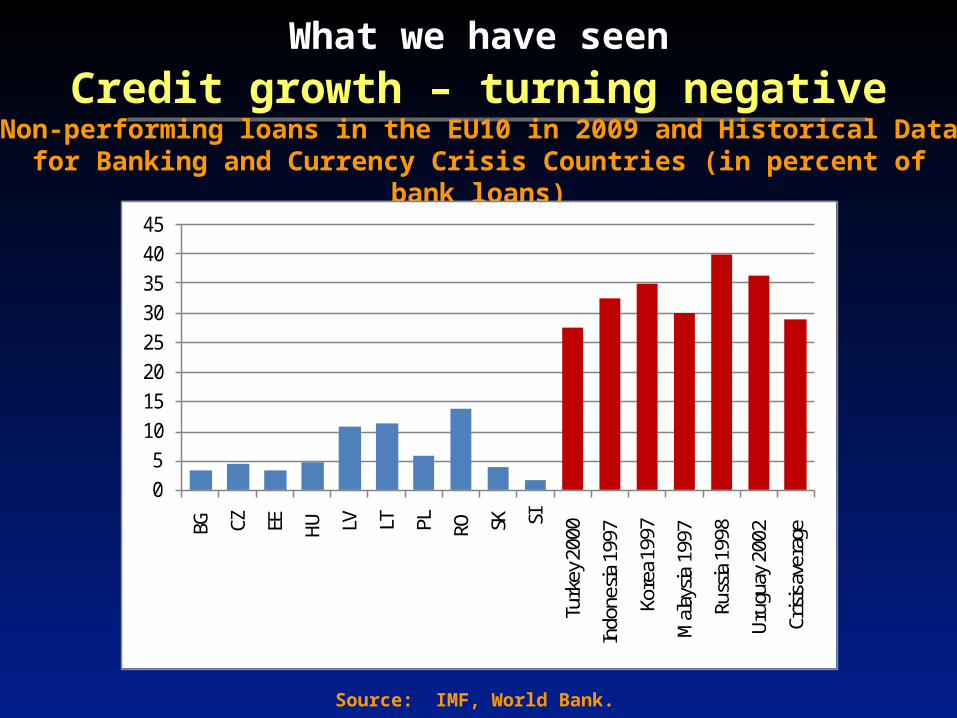
Credit growth – turning negativeCredit growth to non-financial enterprises (%, y-o-y)
Source: World Bank Global Prospect Group, World Bank Staff calculations.
-20
-10
0
10
20
30
40
50
60
70
80
Jan-
07
Mar
-07
May
-07
Jul-0
7
Sep-
07
Nov
-07
Jan-
08
Mar
-08
May
-08
Jul-0
8
Sep-
08
Nov
-08
Jan-
09
Mar
-09
May
-09
Jul-0
9
BG
CZ
EE
LV
LT
HU
PL
RO
SI
SK
-20
-10
0
10
20
30
40
50
60
70
80
Jan-
07
Mar
-07
May
-07
Jul-0
7
Sep-
07
Nov
-07
Jan-
08
Mar
-08
May
-08
Jul-0
8
Sep-
08
Nov
-08
Jan-
09
Mar
-09
May
-09
Jul-0
9
EU15
EU10
What we have seen
Credit growth – turning negativeNon-performing loans in the EU10 in 2009 and Historical Data for Banking
and Currency Crisis Countries (in percent of bank loans)
Source: IMF, World Bank.
05
1015202530354045
BG CZ EE HU LV LT PL RO SK SI
Turk
ey 2
000
Indo
nesia
199
7
Kore
a 199
7
Mal
aysia
199
7
Russ
ia 1
998
Urug
uay
2002
Crisi
s ave
rage

What we have seen
Labor – wage growth slowingReal wage growth (% change, yoy)
Source: Statistical Offices, World Bank Staff calculations
-10
-5
0
5
10
15
20
251Q
07
2Q 0
7
3Q 0
7
4Q 0
7
1Q 0
8
2Q 0
8
3Q 0
8
4Q 0
8
1Q 0
9
2Q 0
9
CZ
EE
HU
LV
LT
PL
SK
SI
BG
RO

What we have seenLabor – unemployment rising slowly only
Source: Eurostat, Statistical Offices, World Bank Staff calculations
Harmonized unemployment rate (%)
0
5
10
15
20
Jan-
07
Mar
-07
May
-07
Jul-0
7
Sep-
07
Nov
-07
Jan-
08
Mar
-08
May
-08
Jul-0
8
Sep-
08
Nov
-08
Jan-
09
Mar
-09
May
-09
Jul-0
9
BG
CZ
EE
LV
LT
HU
PL
RO
SI
SK
0
5
10
15
20
Jan-
07
Mar
-07
May
-07
Jul-0
7
Sep-
07
Nov
-07
Jan-
08
Mar
-08
May
-08
Jul-0
8
Sep-
08
Nov
-08
Jan-
09
Mar
-09
May
-09
Jul-0
9
EU15
EU10

What we have seenLabor – … but faster for the young
Source: Eurostat, World Bank Staff calculations
Change in unemployment rate from June 2008 to June 2009 by age (%)
CZ
LT
SK
LV
EE
PL
HU
SI
ROBG
0
4
8
12
16
20
0 4 8 12 16 20
Ch
ange
in u
nem
ploy
men
t rat
e am
on
g y
oung
(p.p
)
Change in overall unemployment rate (p.p.)

Why Poland is different
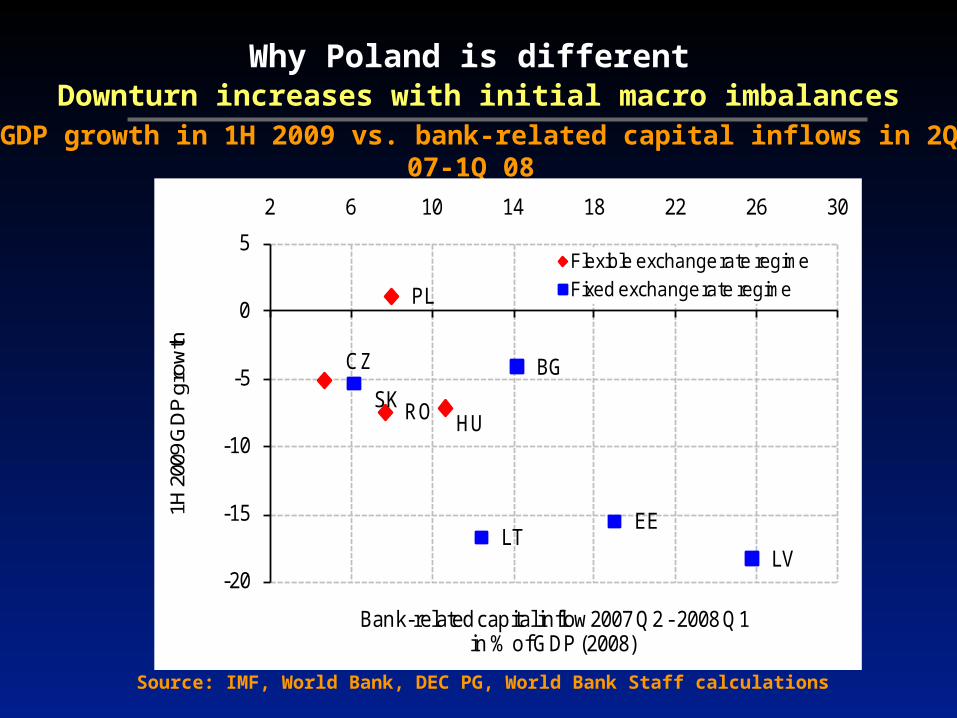
Why Poland is different Downturn increases with initial macro imbalances
GDP growth in 1H 2009 vs. bank-related capital inflows in 2Q 07-1Q 08
Source: IMF, World Bank, DEC PG, World Bank Staff calculations
RO HU
CZ
PL
LVLT
EE
BG
SK
-20
-15
-10
-5
0
5
2 6 10 14 18 22 26 301H
200
9 G
DP
gro
wth
Bank-related capital inflow 2007 Q2 - 2008 Q1in % of GDP (2008)
Flexible exchange rate regime
Fixed exchange rate regime

Why Poland is different Large domestic market
Exports as % of GDP in 2008
Source: World Bank

Why Poland is different Monetary policy – depreciation, modest appreciation
Exchange Rates vs. Euro(Aug08 = 100)
Source: ECB. World Bank Staff Calculations
80
90
100
110
120
130
140
150
160
Aug
-08
Sep-
08
Oct
-08
Nov
-08
Dec
-08
Jan-
09
Feb-
09
Mar
-09
Apr
-09
May
-09
Jun-
09
Jul-0
9
Aug
-09
Sep-
09
Oct
-09
CZ
HU
RO
PL
Real Effective Exchange Rates (Aug08 = 100)

What we can expect

What we can expect
Economy – sentiment improvingEconomic Sentiment Indicator (long-term mean = 100)
Source: European Commission, World Bank Staff Calculations
30
40
50
60
70
80
90
100
110
120
130
Jan-
07
Mar
-07
May
-07
Jul-0
7
Sep-
07
Nov
-07
Jan-
08
Mar
-08
May
-08
Jul-0
8
Sep-
08
Nov
-08
Jan-
09
Mar
-09
May
-09
Jul-0
9
Sep-
09
BG
CZ
EE
LV
LT
HU
PL
RO
SI
SK
30
40
50
60
70
80
90
100
110
120
130
Jan-
07
Mar
-07
May
-07
Jul-0
7
Sep-
07
Nov
-07
Jan-
08
Mar
-08
May
-08
Jul-0
8
Sep-
08
Nov
-08
Jan-
09
Mar
-09
May
-09
Jul-0
9
Sep-
09
EU15
EU10

What we can expect
Growth – slow recoveryEU10, EU15, & Poland - Real Growth 2008 - 2010, (% change, yoy)
Source: IIMF WEO, Government Budget 2010, World Bank
-5
-4
-3
-2
-1
0
1
2
3
4
5
EU15 - IMF EU10 - IMF EU10 - Governments
2008
2009
2010

What should be done

Stabilize Financial Sector Protect People
Continue with coordinated solutions: crisis requires concerted action
Preserve Jobs Avoid Backsliding
What should be doneEconomic policy – Address the urgent

What should be doneMonetary policy – cautious easing to support demand
Policy interest rates (percent)
Source: Central Banks
0
2
4
6
8
10
12
14
Ma
y-08
Jun-0
8
Jul-0
8
Au
g-08
Se
p-08
Oc
t-08
No
v-08
De
c-08
Jan-0
9
Fe
b-09
Ma
r-09
Ap
r-09
Ma
y-09
Jun-0
9
Jul-0
9
Au
g-09
Se
p-09
Oc
t-09
CZ HU PLBG RO EURO

What should be done
Fiscal policy – stimulus spending not an option
Pensions Public wages New revenue measures Supplementary budget in 2009
Freeze No change Freeze (or cut)
No change VAT Direct Tax Others
BG2009
N2010 Y Y Y
CZ2009
N2010 Y Y Y Y Y
EE2009 Y Y Y Y Y
Y2010 Y Y Y
LV2009 Y Y Y Y Y
Y2010 Y Y Y Y
LT2009 Y Y Y Y Y
Y2010 Y Y Y
HU2009 Y Y Y Y Y
Y2010 Y Y Y Y
PL2009 Y Y Y Y
Y2010 Y Y Y Y
RO2009 Y Y Y
Y2010
SI2009 Y Y Y
Y2010 Y Y
SK2009 Y Y Y
Y2010 Y Y Y
Source: EU10 Governments.

3131
Declining PopulationIncreasing Population
CLIMATE CHANGE
ENERGY SECURITY AND EFFICIENCY DEMOGRAPHY
GOVERNANCE
What should be doneEconomic policy – … without losing sight of the longer-term agenda

THANK YOU!