Warehousing Distribution Marketpublic/@bbl/@secr_gen... · Economic Analysis of the Warehousing &...
39
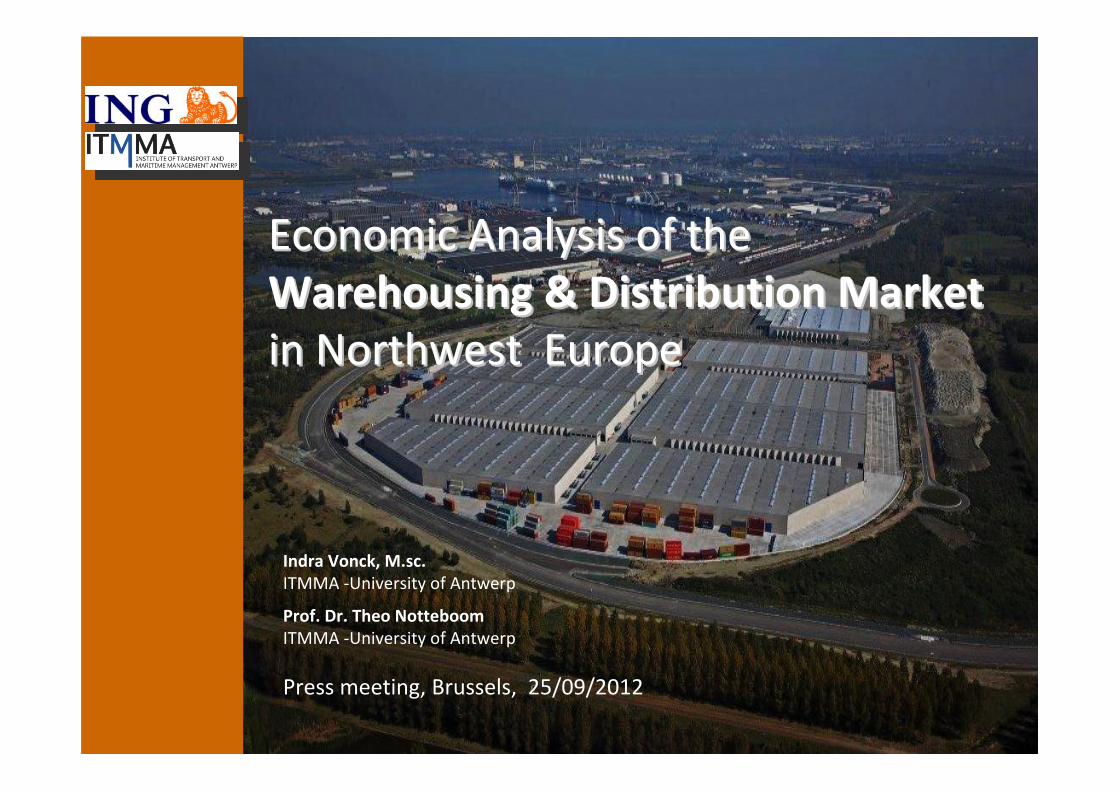
Economic Analysis of the Economic Analysis of the Warehousing & Distribution Market Warehousing & Distribution Market in Northwest Europe in Northwest Europe Prof. Dr. Theo Notteboom ITMMA ‐University of Antwerp Press meeting, Brussels, 25/09/2012 Indra Vonck, M.sc. ITMMA ‐University of Antwerp
Transcript of Warehousing Distribution Marketpublic/@bbl/@secr_gen... · Economic Analysis of the Warehousing &...
Economic Analysis of the Economic Analysis of the Warehousing & Distribution Market Warehousing & Distribution Market in Northwest Europein Northwest Europe
Prof. Dr. Theo Notteboom ITMMA ‐University of Antwerp
Press meeting, Brussels, 25/09/2012
Indra Vonck, M.sc. ITMMA ‐University of Antwerp

General information
• Title: Economic Analysis of the Warehousing & Distribution Market in Northwest Europe
• Authors: Indra Vonck & Theo Notteboom (ITMMA, University of Antwerp, www.itmma.ua.ac.be)
• For further information on the services of ING Bank in transport and logistics, please visit www.ing.be
• Other recent ITMMA/ING studies:
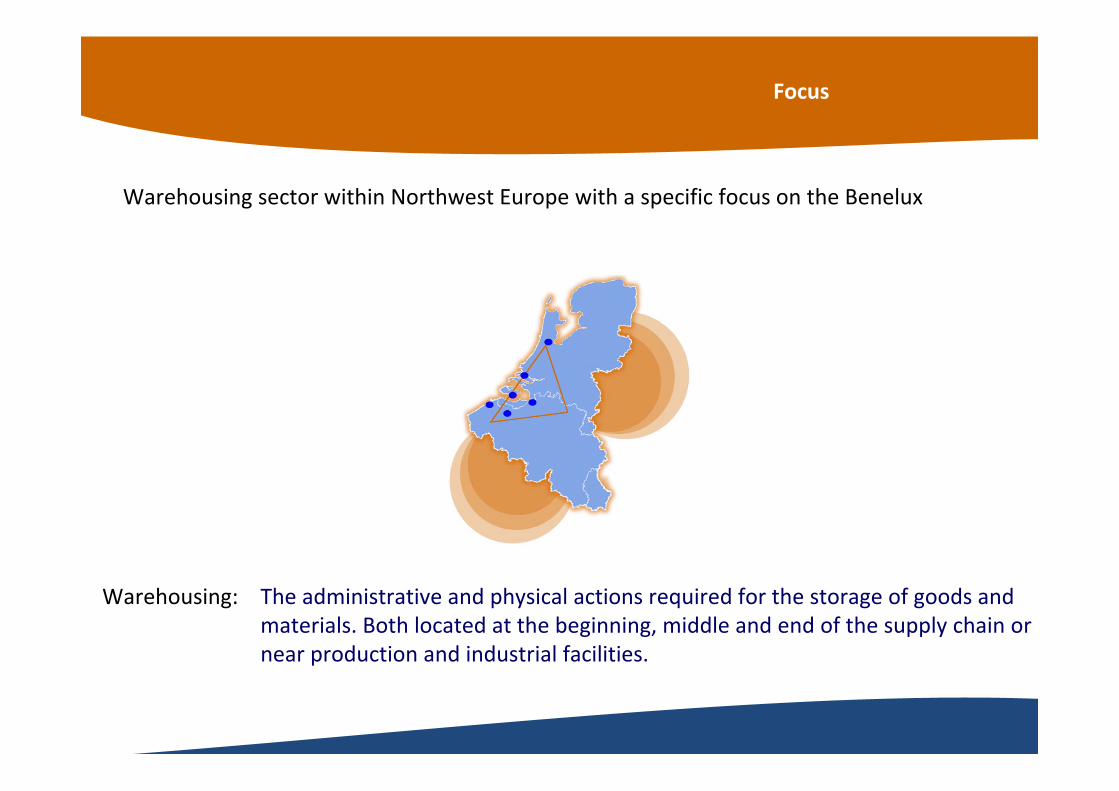
Focus
Warehousing sector within Northwest Europe with a specific focus on the Benelux
The administrative and physical actions required for the storage of goods and materials. Both located at the beginning, middle and end of the supply chain or near production and industrial facilities.
Warehousing:

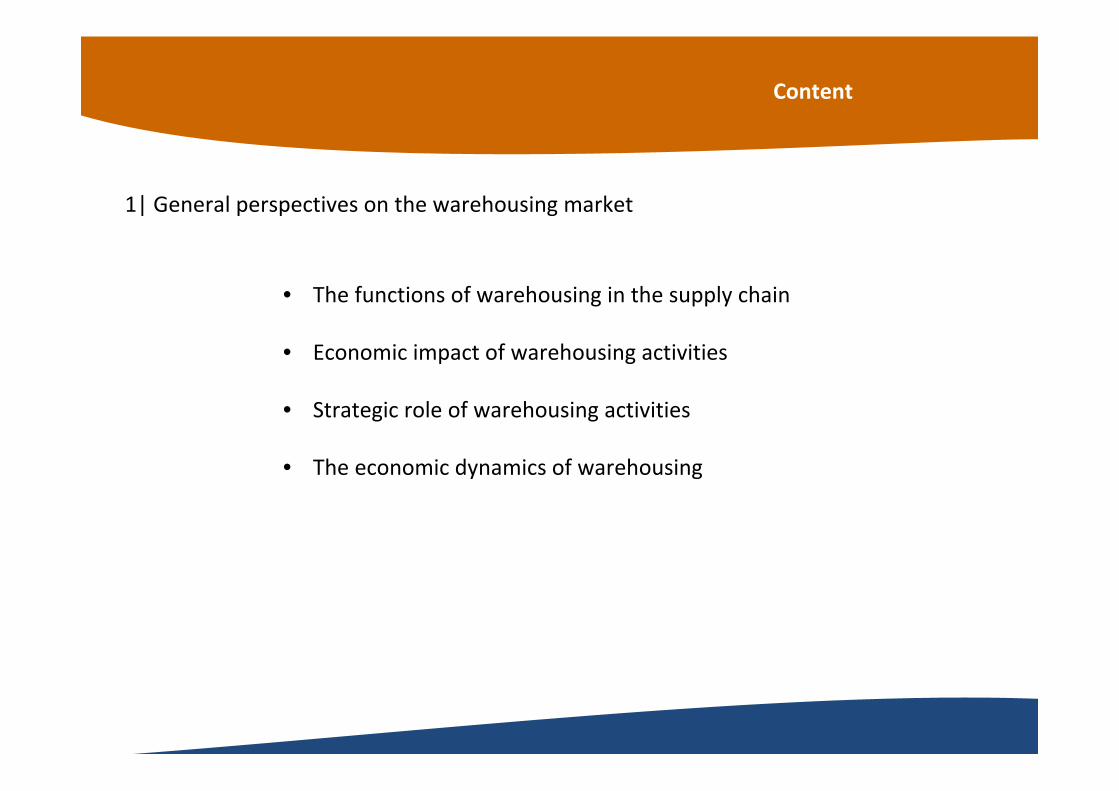
Content
1| General perspectives on the warehousing market
2| Warehousing locations and determining factors
3| Warehousing developments
4| Strategic reflections and recommendations in light of market developments
Content
1| General perspectives on the warehousing market
• The functions of warehousing in the supply chain
• Economic impact of warehousing activities
• Strategic role of warehousing activities
• The economic dynamics of warehousing

The functions of warehousing in the supply chain
Economic impact of warehousing activities
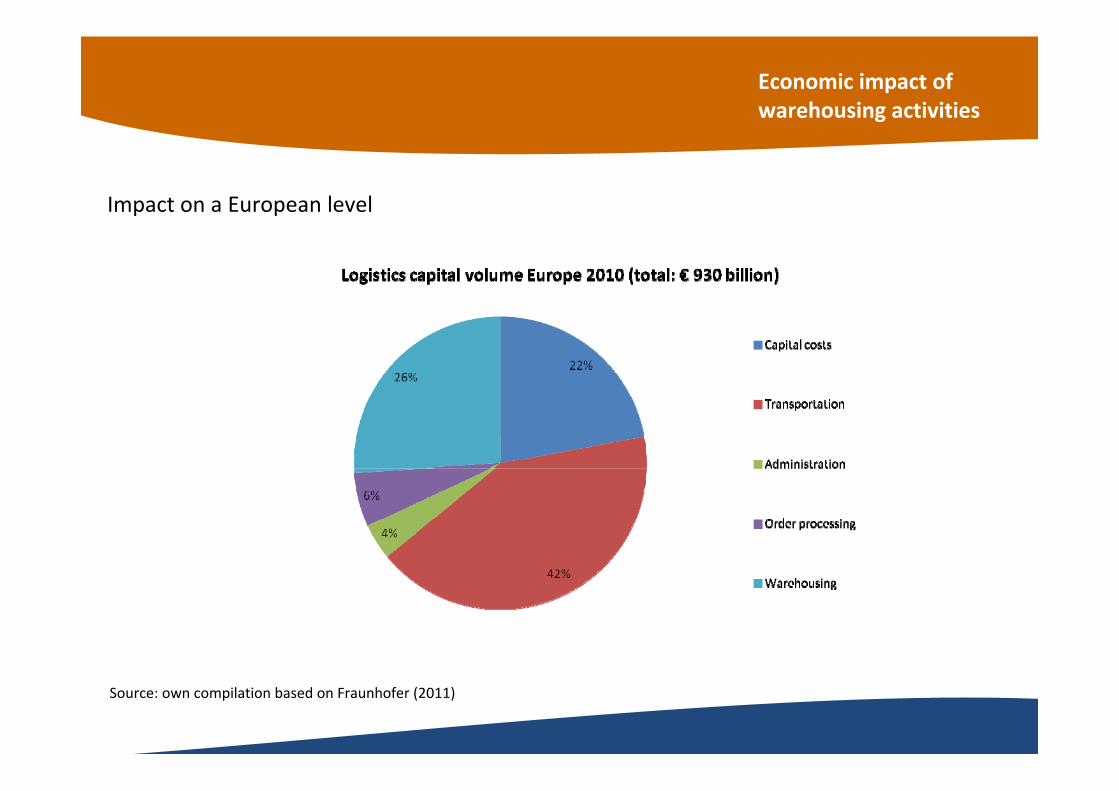
Impact on a European level
Source: own compilation based on Fraunhofer (2011)
Economic impact of warehousing activities
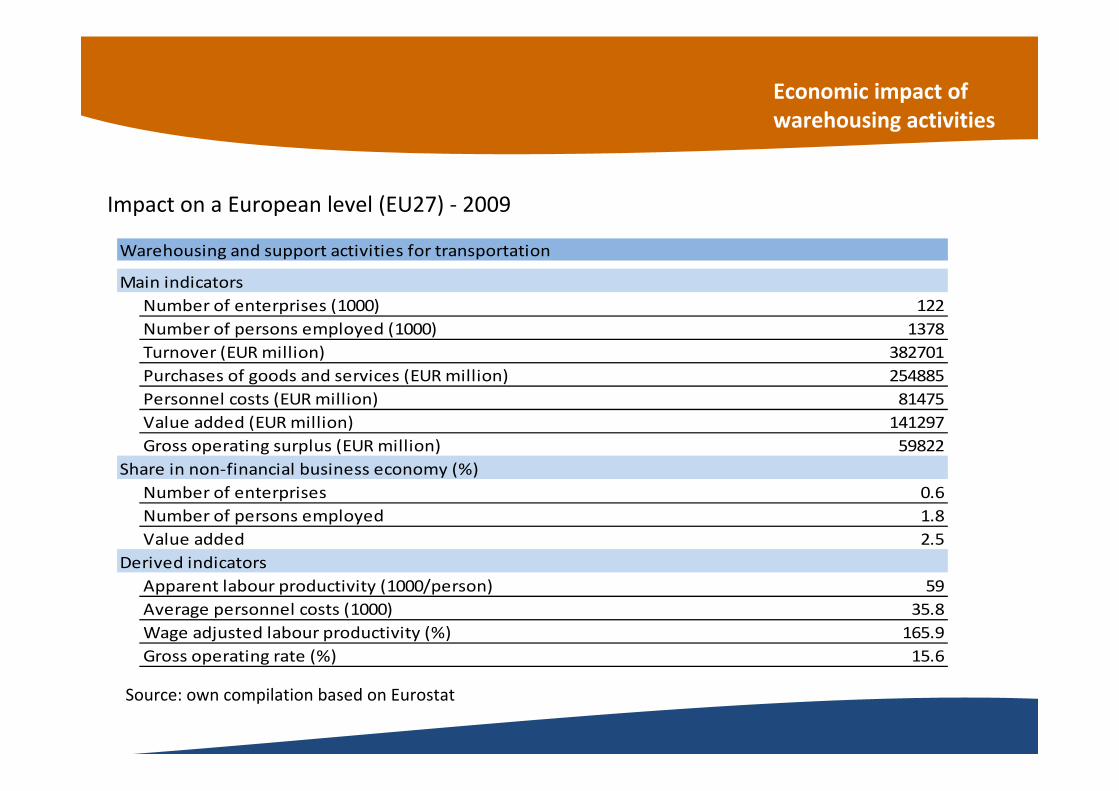
Impact on a European level (EU27) ‐ 2009
Source: own compilation based on Eurostat
Warehousing and support activities for transportation
Main indicatorsNumber of enterprises (1000) 122Number of persons employed (1000) 1378Turnover (EUR million) 382701Purchases of goods and services (EUR million) 254885Personnel costs (EUR million) 81475Value added (EUR million) 141297Gross operating surplus (EUR million) 59822
Share in non‐financial business economy (%)Number of enterprises 0.6Number of persons employed 1.8Value added 2.5
Derived indicatorsApparent labour productivity (1000/person) 59Average personnel costs (1000) 35.8Wage adjusted labour productivity (%) 165.9Gross operating rate (%) 15.6

Economic impact of warehousing activities
Impact on a European level (EU27) – index evolution
Source: own compilation based on Eurostat
High personnel cost not compensated by high turnover per employee
00102030405060708090100
Personnel costs/# personnel
0102030405060708090
100
Turnover/#personnel

Economic impact of warehousing activities
Belgium (year 2009)Belgium (year 2009)
Geographical concentration of Geographical concentration of warehousing and storage activitieswarehousing and storage activities
Source: own compilation based on Eurostat
Warehousing and support activities for transportationNumber of enterprises 2,882
Warehousing and storage 387
Support activities for transportation 2,495
Turnover or gross premiums written (€ mill ion) 17,891.8
Warehousing and storage 4,072.7
Support activities for transportation 16,031.5
Value added at factor cost (€ mill ion) 5,338.8
Warehousing and storage 747.5
Support activities for transportation 4,591.3
Number of persons employed 50,211
Warehousing and storage 8,040
Support activities for transportation 42,171
Turnover per person employed (€ 1000) 356.3
Warehousing and storage 231.4
Support activities for transportation 380.2
Apparent labour productivity (Gross value added per person employed) 106.3
Warehousing and storage (€1000/person) 93.0
Support activities for transportation (€1000/person) 108.9
Growth rate of employment (%) ‐1.2
Warehousing and storage ‐7.1
Support activities for transportation 0.1
Avg umber of persons employed per enterprise 17.4
Warehousing and storage 20.8
Support activities for transportation 16.9

Economic impact of warehousing activities
The Netherlands (year 2009)The Netherlands (year 2009)
Geographical concentration of Geographical concentration of warehousing and storage activitieswarehousing and storage activities
Source: own compilation based on Eurostat
Warehousing and support activities for transportationNumber of enterprises 4,481
Warehousing and storage 637
Support activities for transportation 3,844
Turnover or gross premiums written (€ mill ion) 21,404.4
Warehousing and storage 4,072.7
Support activities for transportation 17,331.8
Value added at factor cost (€ mill ion) 7,236.3
Warehousing and storage 1,446.7
Support activities for transportation 5,789.6
Number of persons employed 77,973
Warehousing and storage 13,237
Support activities for transportation 64,736
Turnover per person employed (€ 1000) 274.5
Warehousing and storage 307.7
Support activities for transportation 267.7
Apparent labour productivity (Gross value added per person employed) 92.8
Warehousing and storage 109.3
Support activities for transportation 89.4
Growth rate of employment (%) ‐2.0
Warehousing and storage 7.7
Support activities for transportation ‐3.7
Avg umber of persons employed per enterprise 17.4
Warehousing and storage 20.8
Support activities for transportation 16.8

Economic impact of warehousing activities
Logistics regions in the NetherlandsLogistics regions in the Netherlands
Own elaboration, Understanding logistics in The Netherlands
0%
5%
10%
15%
20%
25%
30%
35%
40%
01%10%
Growth‐Share Dutch logistics regions
Mainports
North
Centre
A15 zone
West Brabant
Central Brabant
East Brabant
Limburg
Growth‐Share analysis for Netherlands, Total sq. m. / growth 2006‐2010

Strategic role of warehousing activities
Source: own compilation based on Van den Bosch et al (2011)
SpSpill‐over
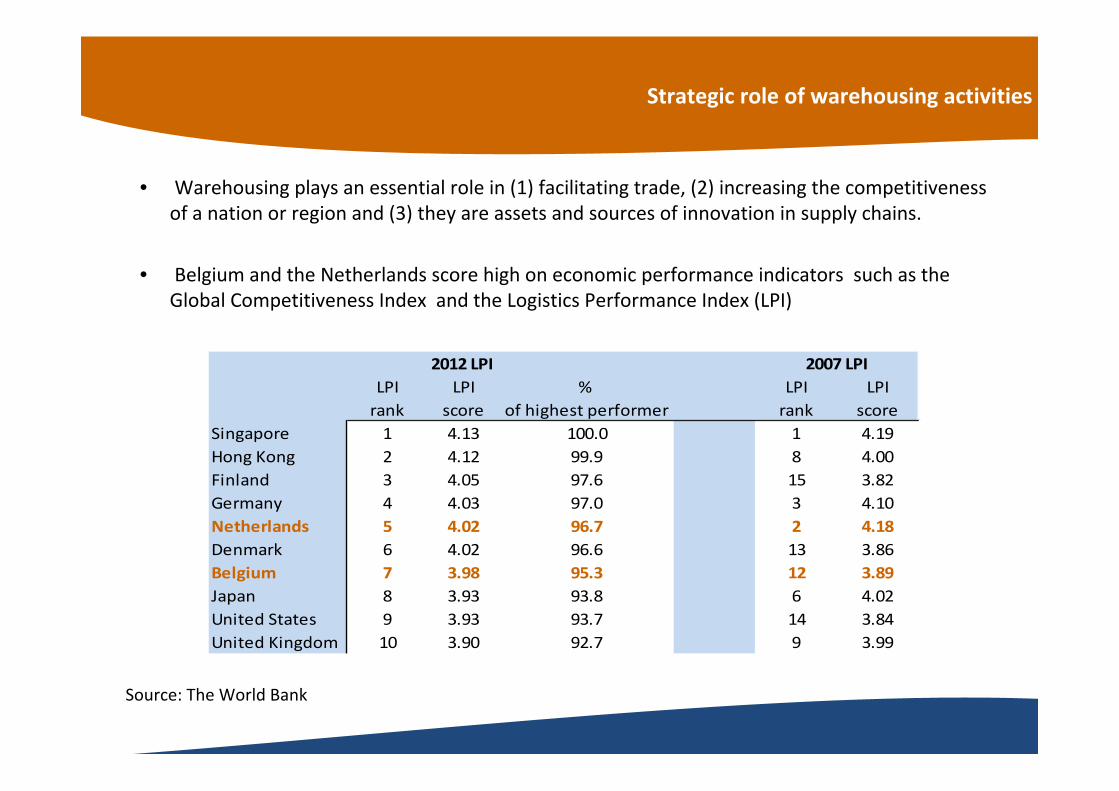
2012 LPILPI LPI % LPI LPIrank score of highest performer rank score
Singapore 1 4.13 100.0 1 4.19Hong Kong 2 4.12 99.9 8 4.00Finland 3 4.05 97.6 15 3.82Germany 4 4.03 97.0 3 4.10Netherlands 5 4.02 96.7 2 4.18Denmark 6 4.02 96.6 13 3.86Belgium 7 3.98 95.3 12 3.89Japan 8 3.93 93.8 6 4.02United States 9 3.93 93.7 14 3.84United Kingdom 10 3.90 92.7 9 3.99
2007 LPI
Strategic role of warehousing activities
• Warehousing plays an essential role in (1) facilitating trade, (2) increasing the competitiveness of a nation or region and (3) they are assets and sources of innovation in supply chains.
• Belgium and the Netherlands score high on economic performance indicators such as the Global Competitiveness Index and the Logistics Performance Index (LPI)
Source: The World Bank

The economic dynamics of warehousing
• The warehousing sector is also a real estate sector and undergoes similar dynamics
Class Description 2007 2008 2009 2010 2011Offices CBD 5,40% 6,50% 6,25% 6,25% 6,75%Offices CBD 4,75% 5,75% 5,50% 5,20% 5,00%Offices Suburban 6,25% 7,50% 7,50% 7,50% 7,75%Logistics Modern on logistics corridor 6,00% 7,75% 7,50% 7,25% 7,25%Retail Highstreet 4,50% 5,00% 4,75% 4,50% 4,50%Retail Shopping center 5,00% 5,75% 6,00% 6,00% 6,00%Retail Retail warehouse 6,00% 6,75% 6,50% 6,50% 6,25%Residential >100 units 5,00% 5,00% 5,00%
Yields per class in Belgium 2011
Source: DWZ
BTS: build to suit

Content
1| General perspectives on the warehousing market
2| Warehousing locations and determining factors
3| Warehousing developments
4| Strategic reflections and recommendations in light of market developments

Content
2| Warehousing locations and determining factors
‐ The European warehousing landscape
‐ Logistics zones surrounding the RSD
‐ Port‐hinterland dynamics in warehousing
‐ Location factors‐ Transport‐based‐ Economic‐ Other

The Netherlands
15%
France13%
UK13%
Germany10%
Spain7%Belgium
6%
Poland6%
Other30%
Distribution centers in Europe/country
The European warehousing landscape
Center of gravity of distribution facilities still in Benelux, (northern) France and (western) Germany

The European warehousing landscape
Benelux still going strong…

The European warehousing landscape
Belgium and the Netherlands at top positions in many warehousing and distribution segments
Source: Cushman and Wakefield
# Distribution centres in Europe
Rank Food and beverage High Tech Consumer goods Pharma1 The Netherlands 36% The Netherlands 20% France 40% The Netherlands 15%2 France 13% Germany 17% Belgium 17% Spain 9%3 Belgium 11% France 13% Spain 9% Switerzland 9%4 Germany 8% UK 9% The Netherlands 5% France 6%5 UK 8% Spain 8% Switzerland 5% UK 6%6 Spain 8% Sweden 6% Germany 5% Belgium 6%7 Poland 5% Italy 6% Sweden 5% Italy 6%8 Other 11% Other 21% Other 14% Other 43%
The European warehousing landscape
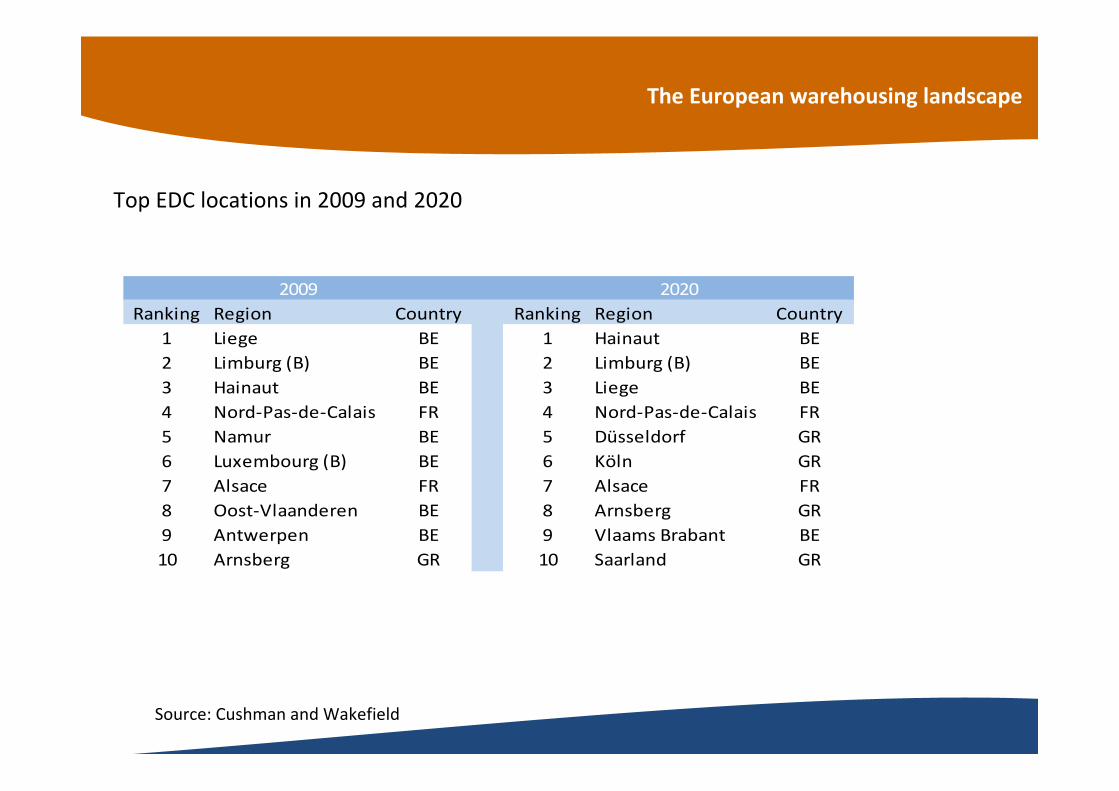
Top EDC locations in 2009 and 2020
Source: Cushman and Wakefield
2009 2020Ranking Region Country Ranking Region Country
1 Liege BE 1 Hainaut BE2 Limburg (B) BE 2 Limburg (B) BE3 Hainaut BE 3 Liege BE4 Nord‐Pas‐de‐Calais FR 4 Nord‐Pas‐de‐Calais FR5 Namur BE 5 Düsseldorf GR6 Luxembourg (B) BE 6 Köln GR7 Alsace FR 7 Alsace FR8 Oost‐Vlaanderen BE 8 Arnsberg GR9 Antwerpen BE 9 Vlaams Brabant BE10 Arnsberg GR 10 Saarland GR

The European warehousing landscape
… but new logistics hubs on the horizon?

The European warehousing landscape
Prime logistics yields are not expected to shift dramatically over the coming years

Logistics zones surrounding Belgium and the Netherlands
France Germany

Port‐hinterland dynamics in warehousing
• Role of corridors and inland ports
• Emergence of logistics poles consisting of a set of gateway ports and logistics zones in the (immediate) hinterland (cf. Rhine‐Scheldt Delta)
• Importance of routing flexibility
LAND
SEA
Multimodal transshipment center
Logistics site
Primary logistics zone
Transport corridors
Secondarylogistics zone
Comp
any-s
pecif
ic log
istics
netw
ork
LAND
SEA
Source: Notteboom & Rodrigue (2004)
FROM TO

Port‐hinterland dynamics in warehousing
• The following logistics and warehousing activities typically find a good habitat in ports :
– Logistics activities resulting in a considerable reduction in the transported volume;
– Logistics activities involving big volumes of bulk cargoes, suitable for inland navigation and rail;
– Logistics activities directly related to companies which have a site in the port area;
– Logistics activities related to cargo that needs flexible storage to create a buffer (products subject to season dependent fluctuations or irregular supply);
– Logistics activities with a high dependency on short‐sea shipping.
Port‐hinterland dynamics in warehousing
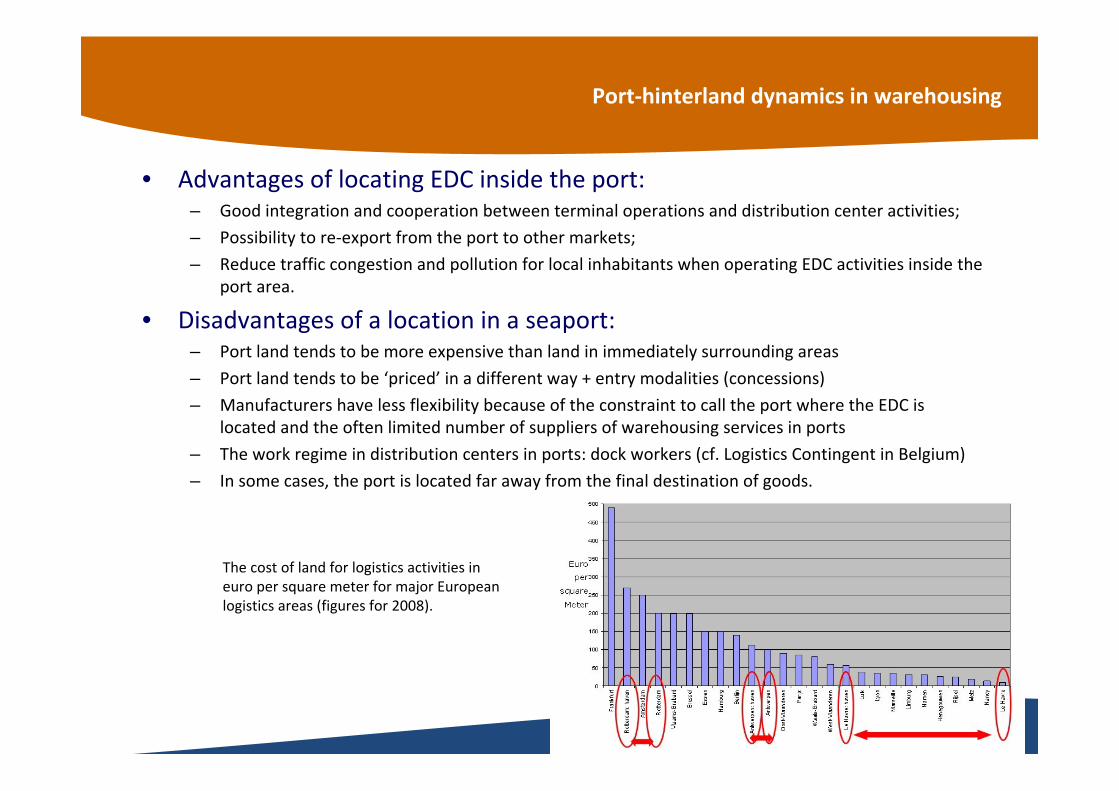
• Advantages of locating EDC inside the port:– Good integration and cooperation between terminal operations and distribution center activities;
– Possibility to re‐export from the port to other markets;
– Reduce traffic congestion and pollution for local inhabitants when operating EDC activities inside the port area.
• Disadvantages of a location in a seaport:– Port land tends to be more expensive than land in immediately surrounding areas
– Port land tends to be ‘priced’ in a different way + entry modalities (concessions)
– Manufacturers have less flexibility because of the constraint to call the port where the EDC is located and the often limited number of suppliers of warehousing services in ports
– The work regime in distribution centers in ports: dock workers (cf. Logistics Contingent in Belgium)
– In some cases, the port is located far away from the final destination of goods.
The cost of land for logistics activities in euro per square meter for major European logistics areas (figures for 2008).
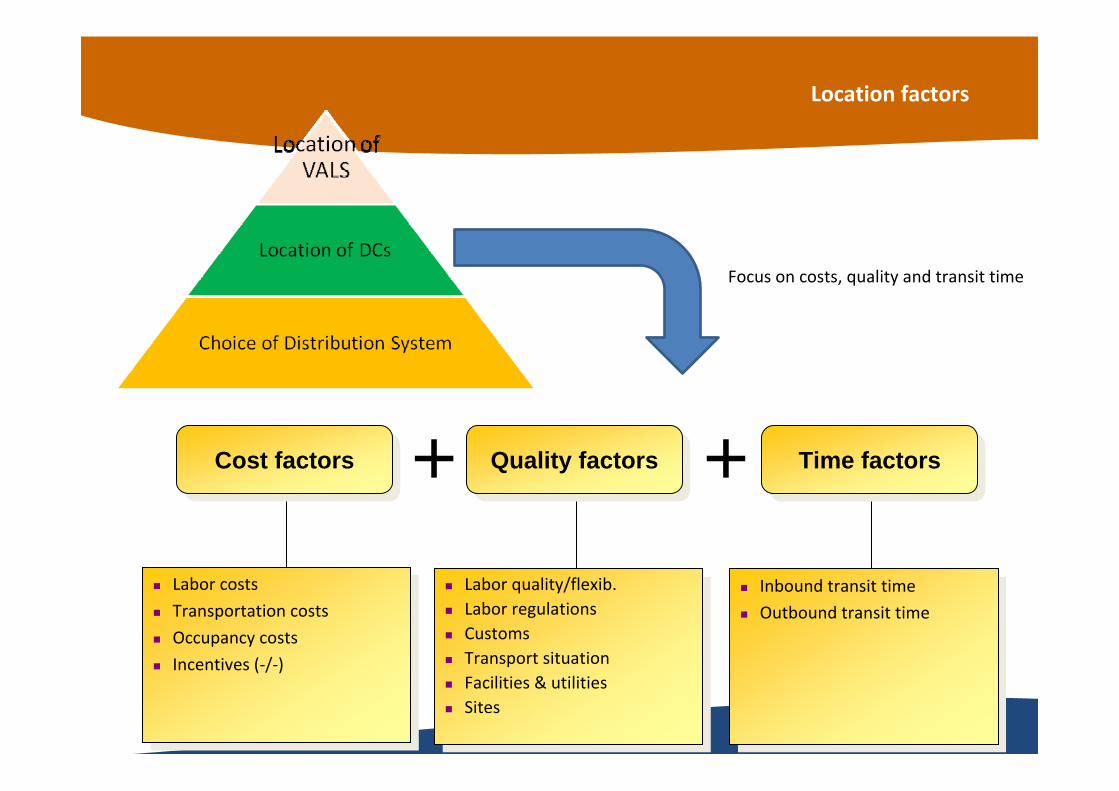
Location factors
Labor costs
Transportation costs
Occupancy costs
Incentives (‐/‐)
Labor costs
Transportation costs
Occupancy costs
Incentives (‐/‐)
Cost factorsCost factors +
Labor quality/flexib. Labor regulations Customs Transport situation Facilities & utilities Sites
Labor quality/flexib. Labor regulations Customs Transport situation Facilities & utilities Sites
Quality factorsQuality factors
Inbound transit time
Outbound transit time
Inbound transit time
Outbound transit time
Time factorsTime factors+
Focus on costs, quality and transit time

Transport based location factors
Corridors

Transport based location factors
Gateways & Clusters
>20% of container traffic in Rhine‐Scheldt Delta is linked to EDC and re‐exporting activities.
Source: Notteboom (2011)

Economic location factors
Proximity and access to target markets
Source: Cushman & Wakefield

Economic location factors
Proximity and access to target markets
Estimated shares of the Delta port region in containerized inland cargo (by road, rail and barge) compared to Hamburg, Bremerhaven and Le Havre (2007)
Strong in Benelux, West‐Germany and northern and northeastern France ..
.. but weak in East, Central and South Europe.
Growing importance of 24h rule puts pressure on centralised distributuon systems

Economic location factors
Proximity and access to target marketsThe increasing importance of the ‘24h rule’ and its impact on distribution systems
Source: Response, Netwerkontwerp en -optimalisatie

Content
1| General perspectives on the warehousing market
2| Warehousing locations and determining factors
3| Warehousing developments
4| Strategic reflections and recommendations in light of market developments

Emerging trends
General trends impact on warehousing sector•Globalization of production and trade•Mass customization and time to market
•Liner shipping network developments
•Increased logistics outsourcing and the rise of 3PL and 4PL•Safety and ecology•The rise of intermodality (?)
Emerging trends
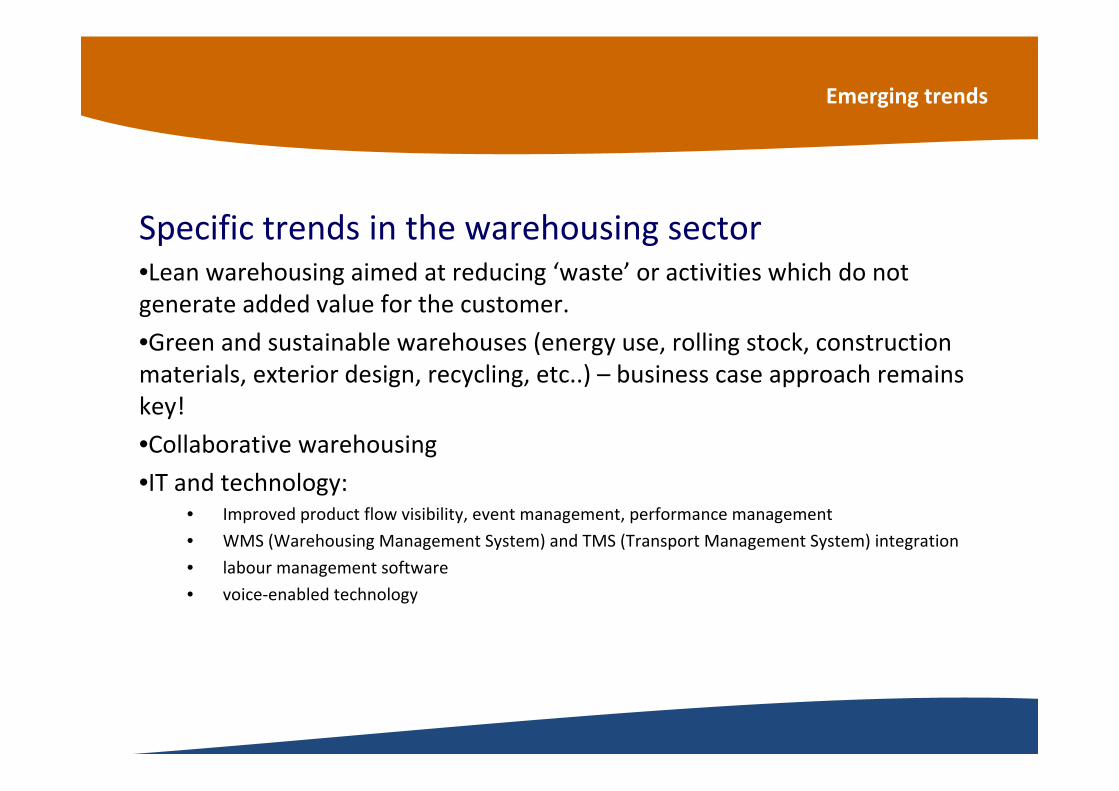
Specific trends in the warehousing sector•Lean warehousing aimed at reducing ‘waste’ or activities which do not generate added value for the customer.
•Green and sustainable warehouses (energy use, rolling stock, construction materials, exterior design, recycling, etc..) – business case approach remains key!
•Collaborative warehousing•IT and technology:
• Improved product flow visibility, event management, performance management
• WMS (Warehousing Management System) and TMS (Transport Management System) integration
• labour management software
• voice‐enabled technology

Emerging trendsChanges in logistics networks
Distribution based on RDCs Distribution based on one EDC
Distribution based on tiered system (EDC+RDCs)
Towards a new wave in logistics networks?
• Networked EDC• Less VALS in EDC• DC bypass• Twin/triple EDC system
Automotive Electronics Food Health care Textile
Direct (*) +++ + + + +
EDC + + + + +++
NDC/RDC + ++ +++ ++ ‐
Tiered (**) ‐ + ‐ + +
Direct (*) ++ + + + +
EDC ++ + + ++ ++
NDC/RDC ‐ + +++ + ‐
Tiered (**) + ++ ‐ + ++
Present
Future
Trends in distribution systems per segment
Overall trends in European distribution systems

Content
1| General perspectives on the warehousing market
2| Warehousing locations and determining factors
3| Warehousing developments
4| Strategic reflections and recommendations in light of market developments

Strategic reflections and recommendations
• Warehousing is a key economic activity, an important component of distribution systems and supply chain solutions and an enabler of gateway and industrial activities
• Belgium and the Netherlands remain top locations but reconfigurations and adaptations to logistics networks are eminent (e.g. twin EDC‐concept, rise of eastern Europe, etc..)
• Key actions include:– Sustained focus on cost base (land, labour, energy, taxes, etc..);
– Availability of land for further warehousing and distribution activities;
– Market access and operational modalities in seaports;
– Warehousing diversity (size, no. of players) in ports and inland locations;
– Intermodal connectivity of logistics sites and supply/use of intermodal services;
– Innovation in hardware/software and sustainability
– Principles of lean warehousing and flexibility
– Enhance culture of coordination and collective actions among market players and nodes