Ware Elementary
24
Report to the Board Date May 2014 Ware Elementary
-
Upload
morpheus-zephyr -
Category
Documents
-
view
68 -
download
2
description
Ware Elementary. Report to the Board Date May 2014. School Improvement Process. SITE COUNCIL MEMBERS Alicia Scofield , Jared Larson- Co- Chairs - PowerPoint PPT Presentation
Transcript of Ware Elementary
Report to the BoardDate May 2014
Ware Elementary
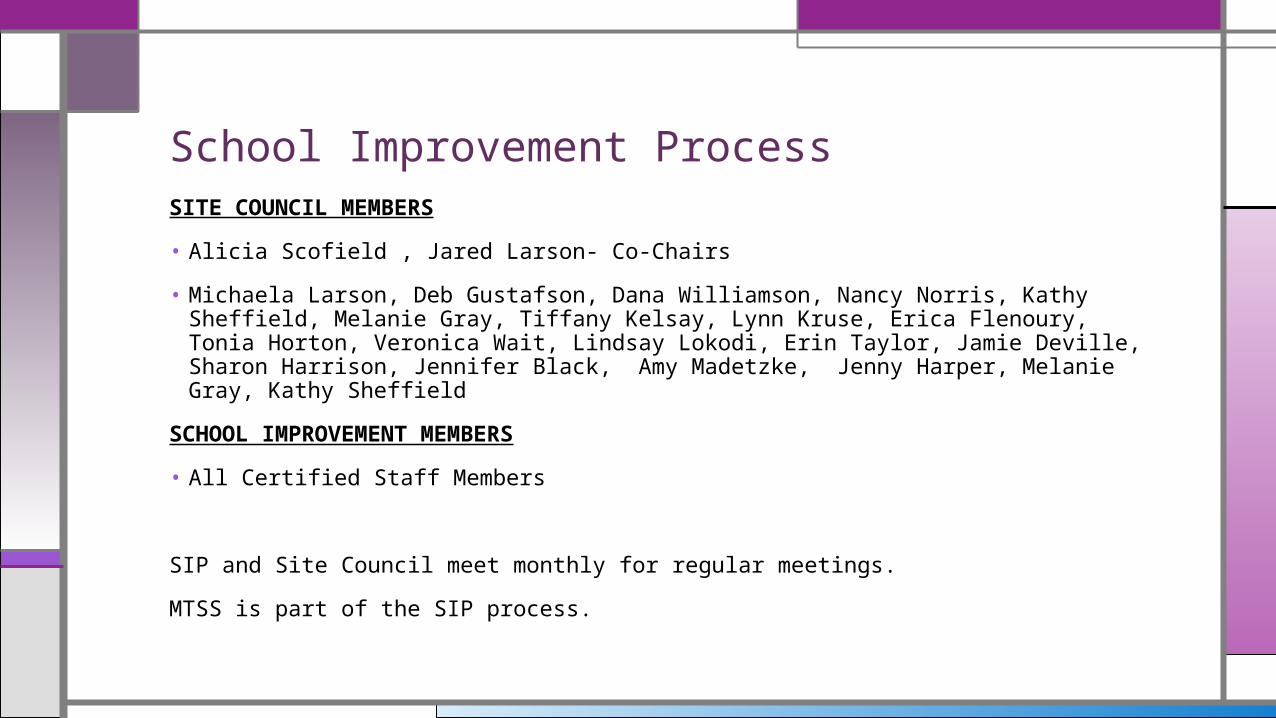
SITE COUNCIL MEMBERS
• Alicia Scofield , Jared Larson- Co-Chairs
• Michaela Larson, Deb Gustafson, Dana Williamson, Nancy Norris, Kathy Sheffield, Melanie Gray, Tiffany Kelsay, Lynn Kruse, Erica Flenoury, Tonia Horton, Veronica Wait, Lindsay Lokodi, Erin Taylor, Jamie Deville, Sharon Harrison, Jennifer Black, Amy Madetzke, Jenny Harper, Melanie Gray, Kathy Sheffield
SCHOOL IMPROVEMENT MEMBERS
• All Certified Staff Members
SIP and Site Council meet monthly for regular meetings.
MTSS is part of the SIP process.
School Improvement Process
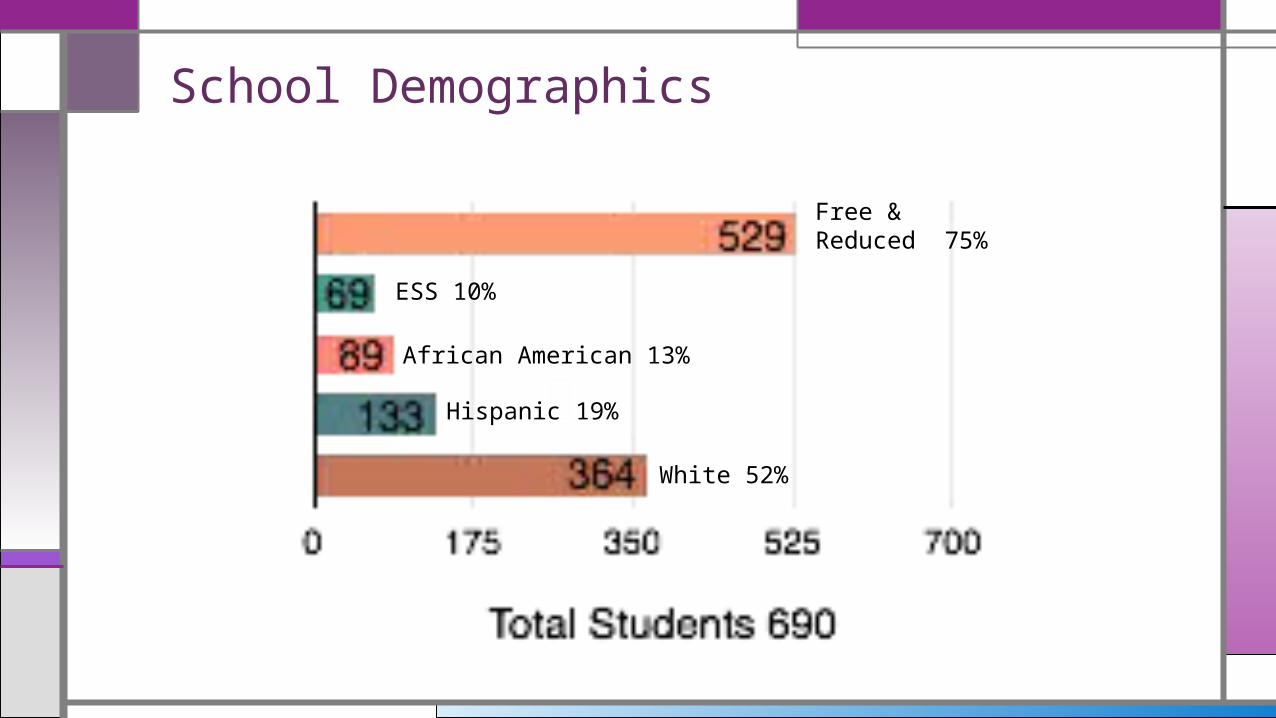
School Demographics
Free &Reduced 75%
ESS 10%
African American 13%
Hispanic 19%
White 52%

API increase by 5 points to 677
– State assessment data
– Formative assessment data – SRI
Reduce Non Proficient by .48
– State assessment data
– Formative assessment data-SRI
Reading Goals

Kindercorner strategies– Learning Labs to increase vocabulary development
– Placement of students in Roots if achieving passing ROOTS assessment.
Roots strategies
– Aggressive placement of students
– Reading Counts assessment
– SRI assessments once passed story 48.
– Cooperative Learning
Wings strategies
– Aggressive placement of students
– Reading Counts assessment
– Cooperative Learning
– Posting objectives and goals
Strategies for Supporting Goals
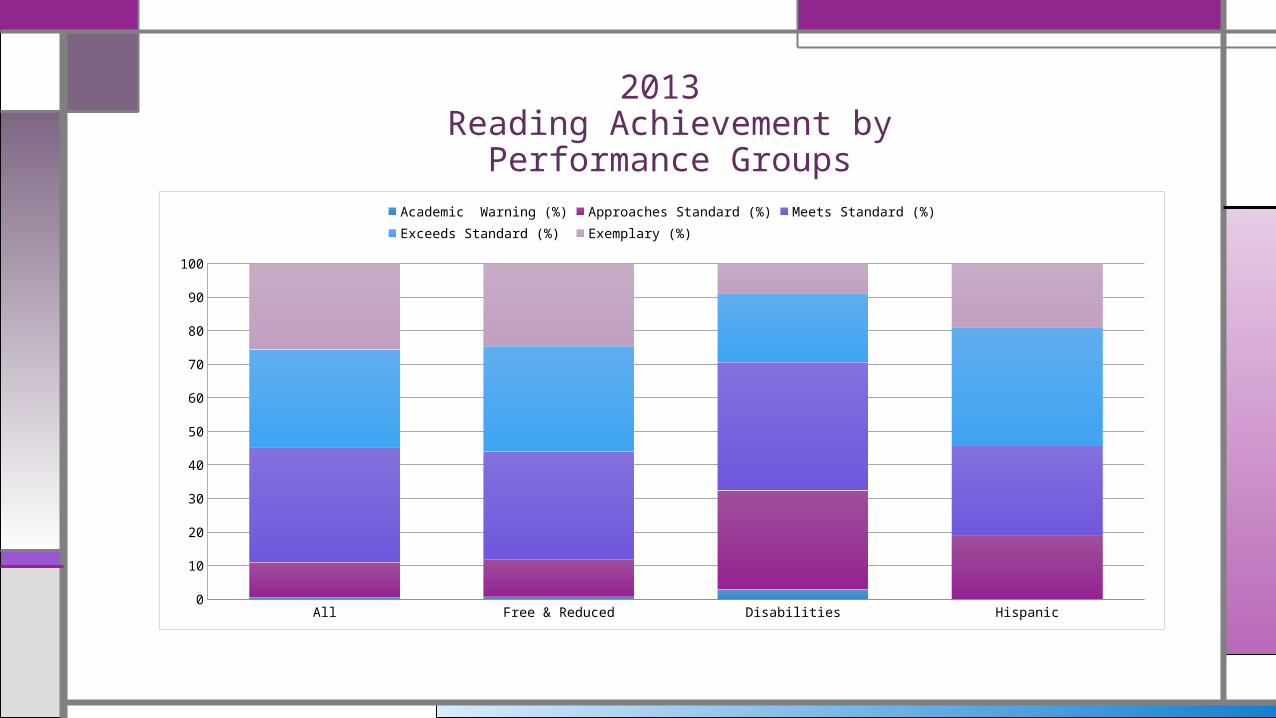
2013 Reading Achievement by
Performance Groups
All Free & Reduced Disabilities Hispanic0
10
20
30
40
50
60
70
80
90
100
Academic Warning (%) Approaches Standard (%) Meets Standard (%) Exceeds Standard (%) Exemplary (%)
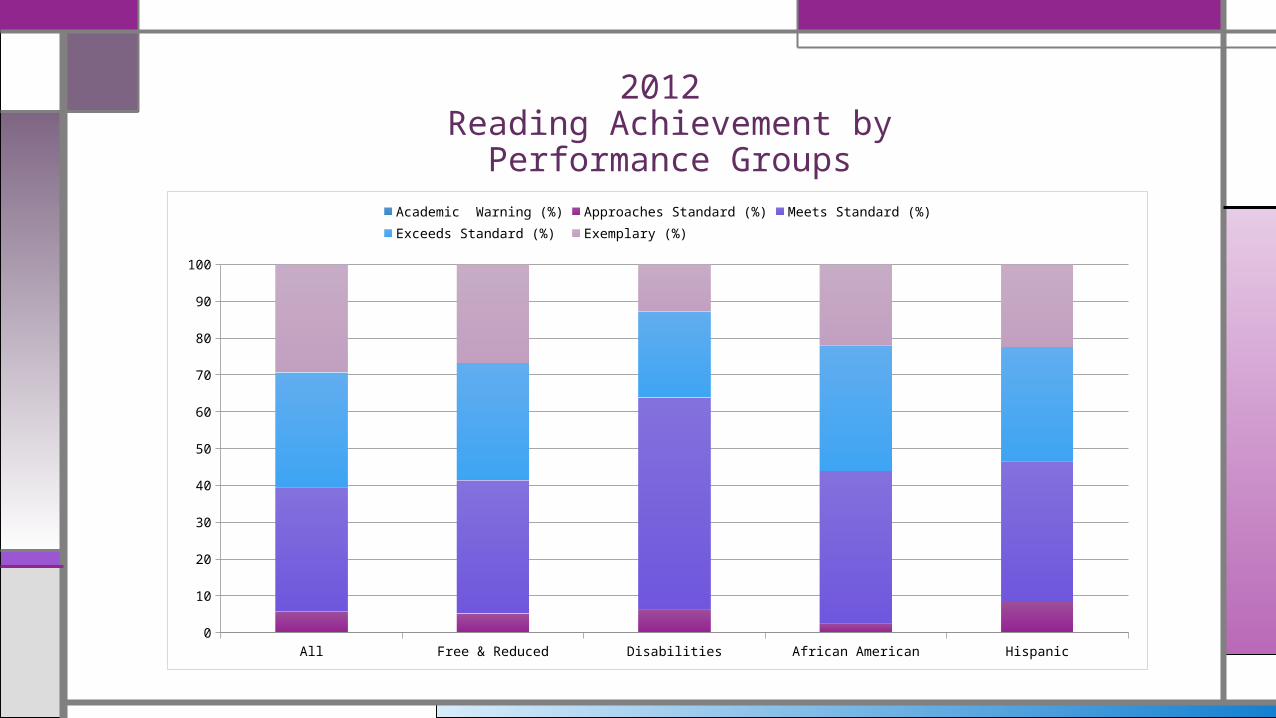
2012 Reading Achievement by
Performance Groups
All Free & Reduced Disabilities African American Hispanic0
10
20
30
40
50
60
70
80
90
100
Academic Warning (%) Approaches Standard (%) Meets Standard (%) Exceeds Standard (%) Exemplary (%)
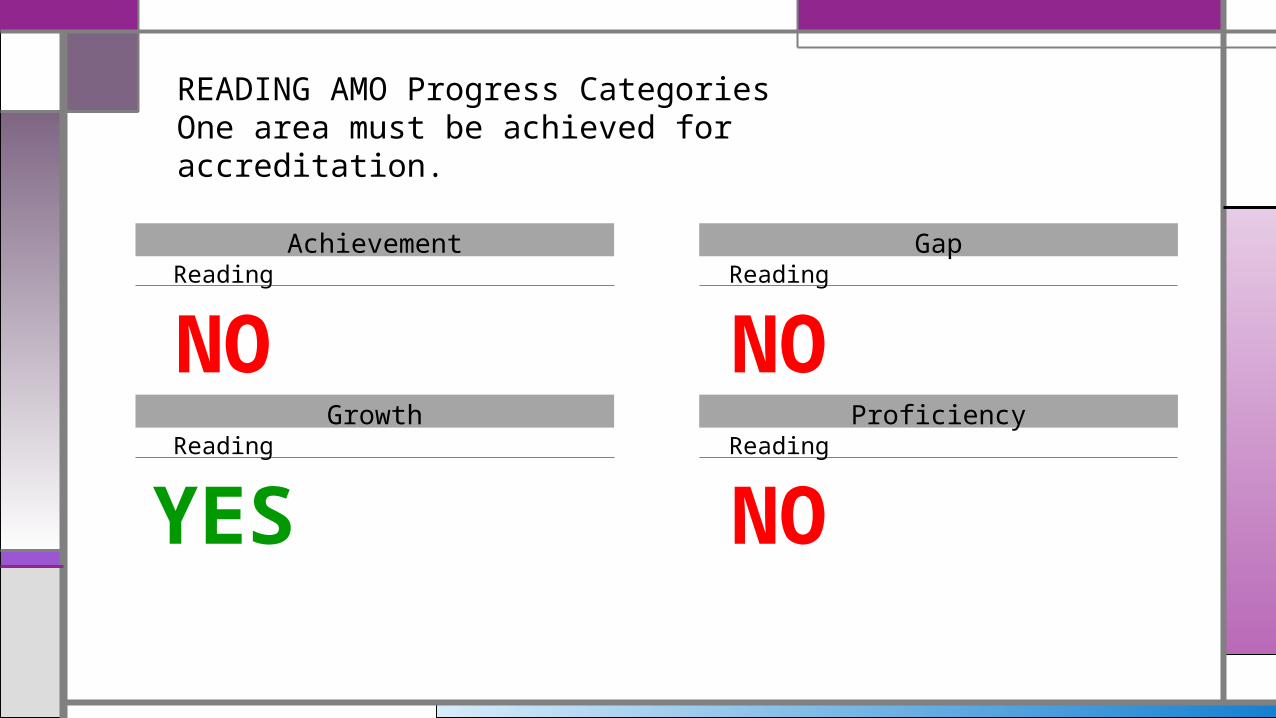
READING AMO Progress CategoriesOne area must be achieved for accreditation.
Achievement GapReading Reading
NO NO
Growth ProficiencyReading Reading
YES NO

2013 Reading API Comparison
Kansas USD 475 Ware620
630
640
650
660
670
680

APIReading
NO

GAP ReductionReading
NO

Reduction of Non-ProficientReading
NO
Elementary Annual Measureable Objective
2012 % Below
Proficient2013 % Below Proficient Goal
2013 % Below Proficient
Actual ChangeReach AMO
Goal?
Reading 5.8 5.32 10.98 +5.18 NO

Growth (Individual)Reading
YESBuilding’s Median Student Growth Percentile:Reading: 53
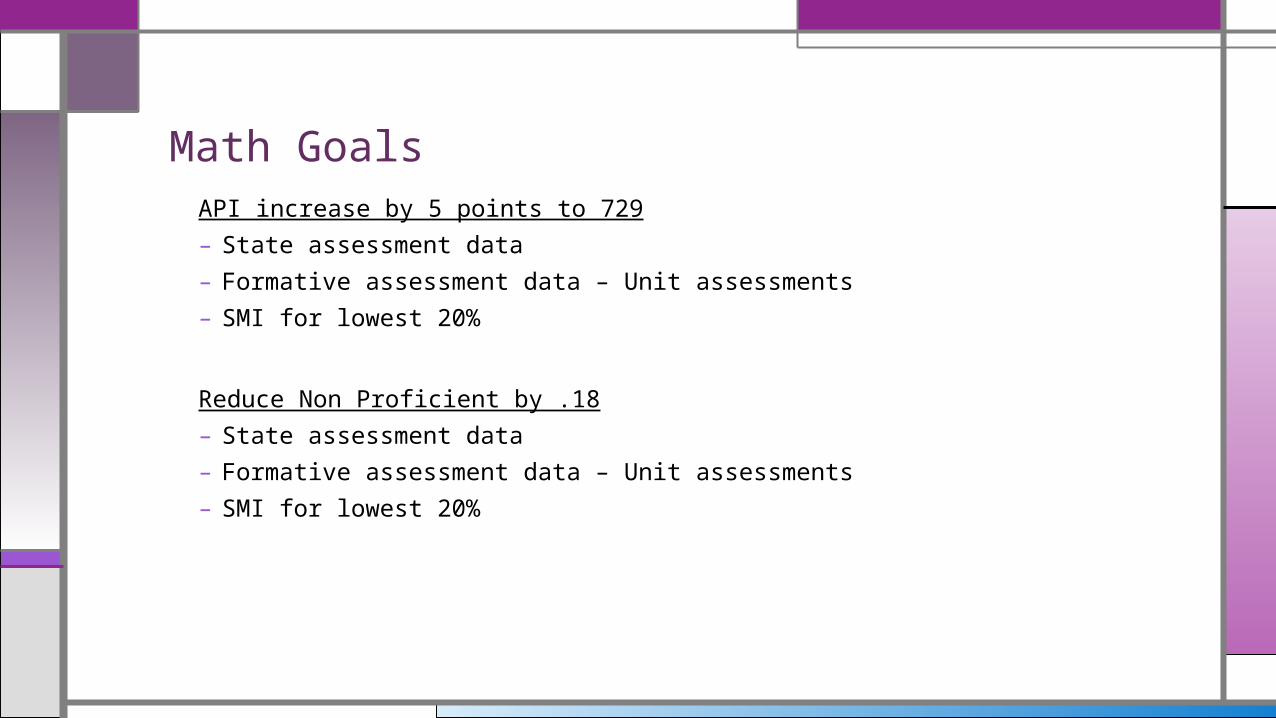
API increase by 5 points to 729
– State assessment data
– Formative assessment data – Unit assessments
– SMI for lowest 20%
Reduce Non Proficient by .18
– State assessment data
– Formative assessment data – Unit assessments
– SMI for lowest 20%
Math Goals

• Implementation of district common core strategies as outlined by the grade level task force.
• Depth of knowledge questions.
• Increase student explanation of math answers.
• Multi-step math problems.
Share your strategies for supporting your goals
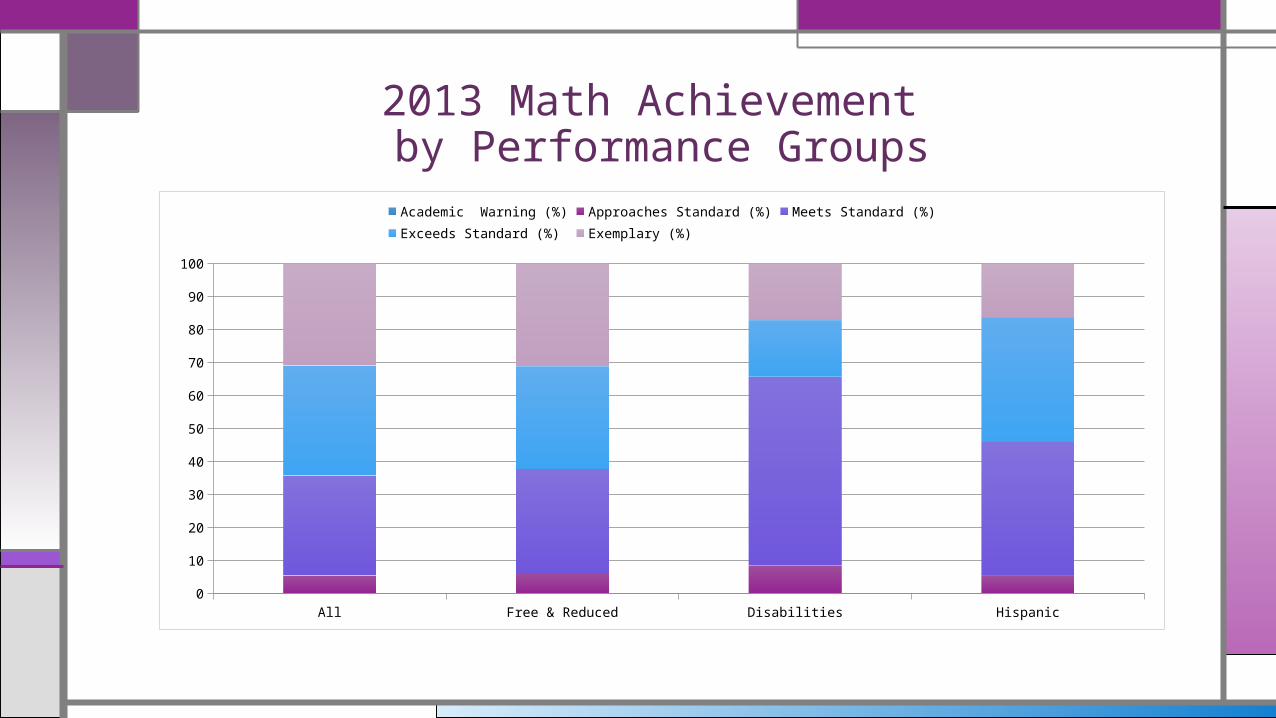
2013 Math Achievement by Performance Groups
All Free & Reduced Disabilities Hispanic0
10
20
30
40
50
60
70
80
90
100
Academic Warning (%) Approaches Standard (%) Meets Standard (%) Exceeds Standard (%) Exemplary (%)
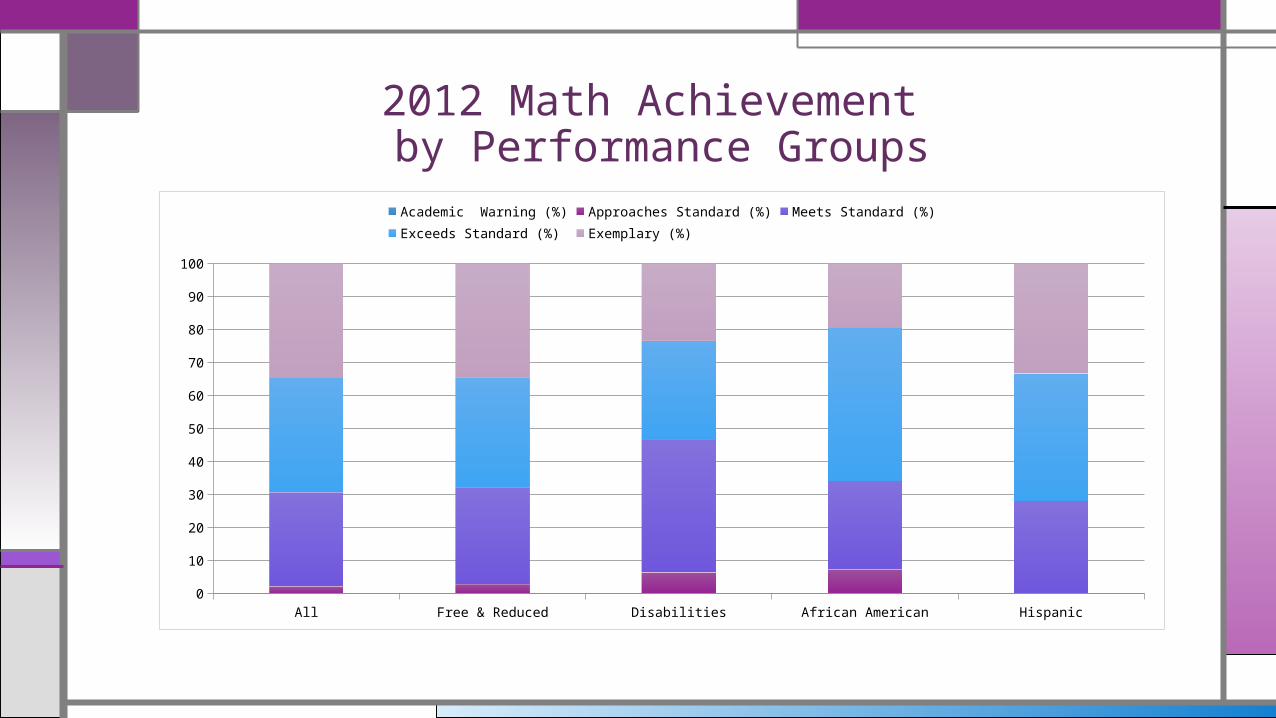
2012 Math Achievement by Performance Groups
All Free & Reduced Disabilities African American Hispanic0
10
20
30
40
50
60
70
80
90
100
Academic Warning (%) Approaches Standard (%) Meets Standard (%) Exceeds Standard (%) Exemplary (%)

MATH AMO Progress CategoriesOne area must be achieved for accreditation.
Achievement GapReading Reading
NO NO
Growth ProficiencyReading Reading
YES NO
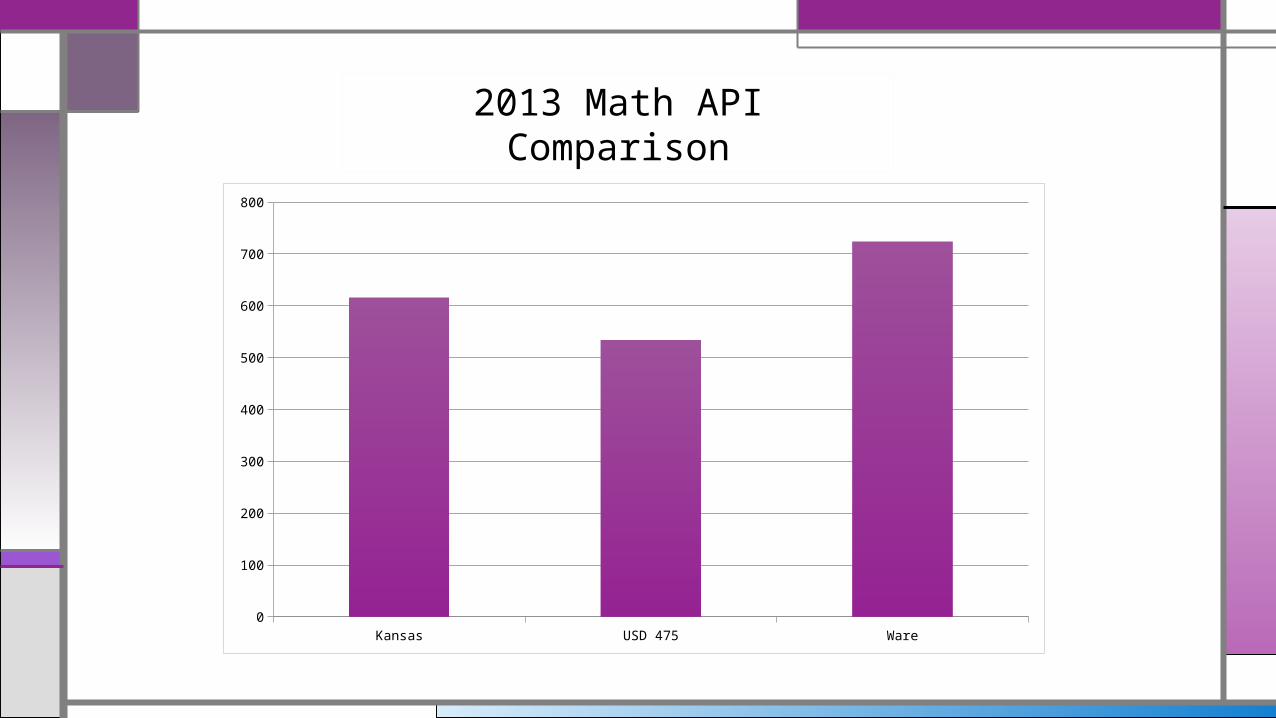
Kansas USD 475 Ware0
100
200
300
400
500
600
700
800
2013 Math API Comparison

AchievementMath
NO Elementary Annual Measureable Objective
2012 API2013
Goal API2013
Actual API 2013 CategoryReach AMO
Goal?
Math 755 757 724 Transitioning NO
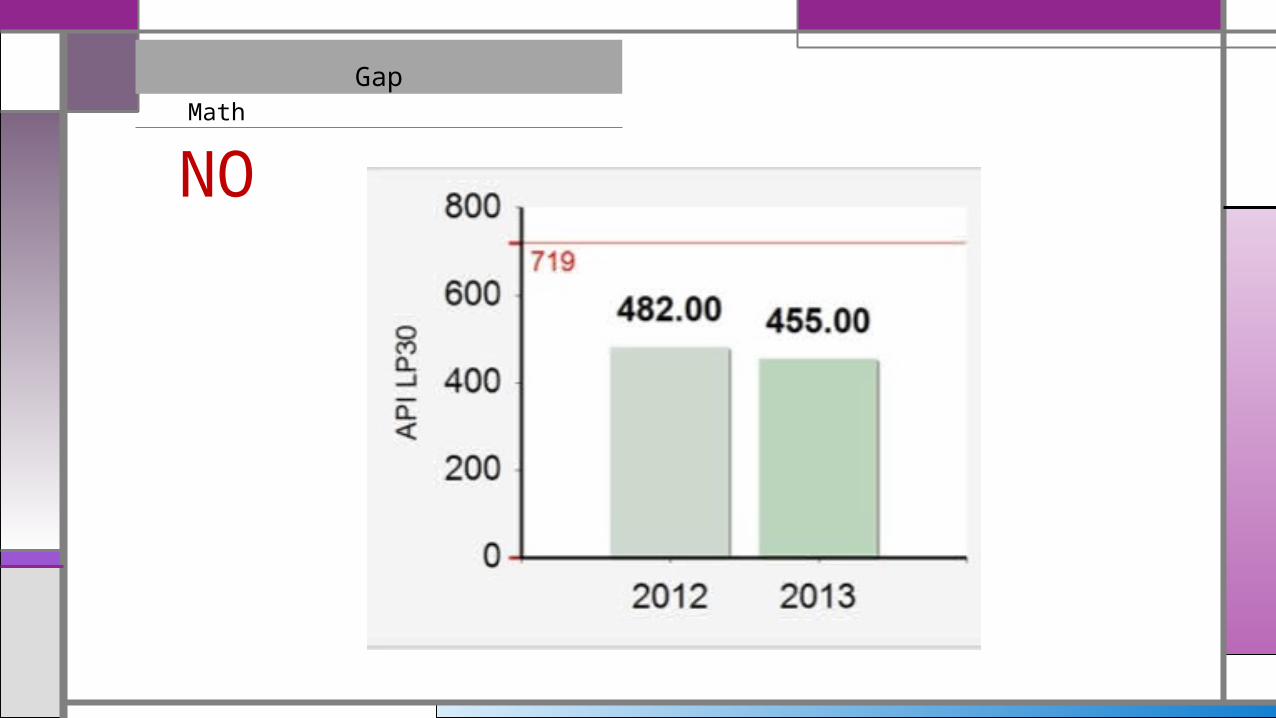
GapMath
NO

Reduction of Non- ProficientMath
NO Elementary Annual Measureable Objective
2012 % Below
Proficient2013 % Below Proficient Goal
2013 % Below Proficient
Actual ChangeReach AMO
Goal?
Math 2.17 1.69 5.45 +3.76 NO
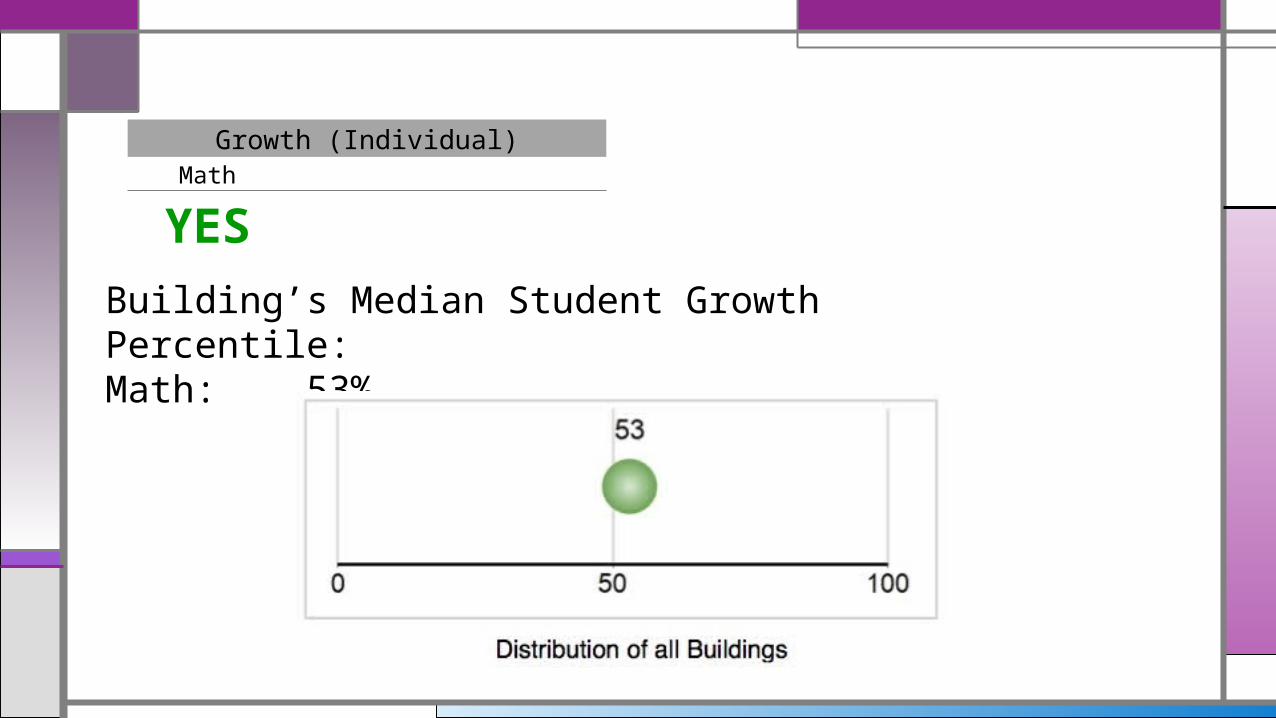
Growth (Individual)Math
YES
Building’s Median Student Growth Percentile:Math: 53%

• Ware Elementary met their AMO in the area of growth in reading and math.
• Hispanic students met AMO in RNP.
Met/Not Met Summary