Wanki Moon manuscript SouthernAgEconMeeting...
36
0 Assessing Public Preferences and Holistic Economic Value for Multifunctional Agriculture in the U.S. Wanki Moon Department of Agribusiness Economics Southern Illinois University Carbondale, IL 62901 Tel) 618-453-6741 Email) [email protected] and Wayne Griffith Ph.D Candidate Environmental Resources and Policy Program Southern Illinois University Carbondale, IL 62901 Selected Paper prepared for presentation at the Southern Agricultural Economics Association Annual Meeting, Orlando, FL. February 6-9, 2010 Copyright 2010 by Wanki Moon and Wayne Griffith. All Rights Reserved. Readers may make verbatim copies of this document for non-commercial purposes by any means, provided that this copyright notice appears on all such copies.
Transcript of Wanki Moon manuscript SouthernAgEconMeeting...

0
Assessing Public Preferences and Holistic Economic Value for Multifunctional Agriculture in the U.S.
Wanki Moon Department of Agribusiness Economics
Southern Illinois University Carbondale, IL 62901
Tel) 618-453-6741 Email) [email protected]
and
Wayne Griffith Ph.D Candidate
Environmental Resources and Policy Program Southern Illinois University
Carbondale, IL 62901
Selected Paper prepared for presentation at the Southern Agricultural Economics Association Annual Meeting, Orlando, FL. February 6-9, 2010
Copyright 2010 by Wanki Moon and Wayne Griffith. All Rights Reserved. Readers may make verbatim copies of this document for non-commercial purposes by any means, provided that this copyright notice appears on all such copies.
1
Assessing Public Preferences and Holistic Economic Value for Multifunctional Agriculture in the U.S.
Multifunctionality of agriculture is gaining momentum in academics as a concept
that plays a growing role in shaping public policies concerning agriculture around the world
(Bergstrom, 2002; Burrell, 2001; Vanzetti and Wymen, 2004; Libby 2002; Vatn, 2002; Batie,
2003).1 Multifunctional agriculture is a term integrating the nontrade concerns (NTCs) that
have been coined during the Uruguay Round trade talks in the 1990s (preamble and article 20
of AoA) and the European Model of Agriculture (EMA) that has been in support of EU’s
Common Agricultural Policy (CAP) since 1980s. From a broader perspective,
multifunctional agriculture is being suggested as a way of viewing agriculture’s changing role
in industrialized nations in the 21st century from a base solely for food production to a more
inclusive one that encompasses ecosystem/environmental, cultural, rural development, and
recreational management (Potter, 2002; Dobbs, 2002; Dobbs and Pretty, 2004).
The ultimate question about the concept of multifunctional agriculture is whether it
can be legitimately institutionalized into WTO trade rules. The green box of the Uruguay
Round trade talks was a major breakthrough in officially recognizing the demand for
multifunctional agriculture and a critical step toward incorporating the concept into the
design of domestic farm policies and trade rules. Yet, the system stirred a great deal of
controversies because it was lacking detailed principles/guidelines determining the scope of
the policies and the types of nonmarket goods and services permitted to be included in the
box (Swinbank, 2001; Hudson et al, 2005; Paarlberg, Bredahl, and Lee, 2002 ).
1 Multifunctional agriculture refers to nonmarket benefits (positive externalities) that agriculture produces
jointly with varying degrees of jointness with either farmlands or market commodities. Such nonmarket
benefits include national food security, rural amenities, recreational opportunities, cultural heritage, viability of
rural communities, and a broad range of ecosystem services such as nutrient recycling, carbon sequestration, or
groundwater recharge.

2
From an economic standpoint, three preconditions need to be met for the concept of
multifunctional agriculture to be legitimately incorporated into domestic farm policies and
global trade rules, thereby resolving the controversies surrounding the green box: (i)
verifying the existence of social demand for each type of nonmarket goods and services of
agriculture in a particular country and measuring the magnitude of such demand, if any, (ii)
assessing whether the nonmarket goods and services are jointly produced either with farm
commodities, or farm/rural lands (Abler, 2001), and (iii) assessing transaction costs
associated with policies decoupled from production and targeted at specific nonmarket goods
and services. 2 The second precondition is required to determine whether or not production
(or farmlands/rural lands)-linked subsidies should be permitted, while the third is needed to
compare the efficacy of decoupled and targeted policies with traditional ones in inducing
optimal supply of nonmarket goods and services of agriculture.
This article undertakes to make a contribution to the first task in consideration that
the assessment of the latter two tasks hinges on credible knowledge of public demand for the
nonmarket goods and services of agriculture. Specifically, this article pursues two
objectives: (1) assessing public preferences about the multifuncitional roles of the U.S.
agriculture and USDA farm policies, and (2) holistically measuring monetary value of the
entire set of multifunctional roles at the national level.
We use the contingent valuation method to address these two objectives in light of
the strategy proposed by Randall (2002) that involves valuing the whole good and utilizing
such a value as an upper bound to the sum of the values of all the local and particular
component goods. The holistic approach is necessary given that there are likely to be
2 Transaction costs refer to costs involved in designing and implementing the policies and monitoring results as
well as costs to farmers such as learning about the program, deciding whether to apply for payments, and
complying with audits and other reporting requirements. See Vatn (2001) for more details about transaction
costs of targeted policies.
3
upward biases associated with individual valuation and summation (IVS) for the large
number of multifunctional outputs geographically widely dispersed (Hoehn and Randall,
1989; Hoehn, 1991; Santos, 2000).3
We organize the article as follows. The next section provides a review of literature
valuing multifunctional agriculture around the world. The third section presents the
theoretical model, contingent valuation survey design, sampling, and survey administration
process, followed by the fourth section describing how Yea-saying tendency associated with
closed-ended format is addressed in our study. The fifth section shows WTP empirical
model specifications using social psychological approach that combines Fishbein’s model
with mediation hypothesis. Estimation results are discussed in the sixth section, followed
by concluding remarks.
Multifunctionality Valuation Literature
The literature on the valuation of multifunctional agriculture has been growing in
recent decades particularly in Europe. Hall, McVittie, and Moran (2004) present a
comprehensive review of research valuing multifunctionality of agriculture in the U.K.
They reviewed 22 studies for the U.K. that use an array of methods including public opinion
polls, experts survey, or nonmarket valuation methods such as contingent valuation and
choice modeling approaches. The review overall presents a strong case for the existence of
a considerable demand for the multifunctional roles of the U.K. agriculture.
There are some notable studies valuing multifunctional agriculture in other parts of
the Europe. For example, using contingent valuation methods, Drake (1992) estimated the
Swedes’ willingness to pay to preserve the agricultural landscape and found that Swedish
3 The IVS bias may arise primarily from three reasons: (i) failure to consider substitution effects on
geographically separated multifunctional goods, (ii) aggregating the effects of a public policy on the large
number of multifunctional outputs of agriculture, and (ii) people’s psychological tendency to overvalue part of a
whole good and undervalue the whole.

4
people were willing to pay 78 ECU per person annually. Brouwer and Slangen (1998)
estimated the public benefits of agricultural wildlife management (peat meadow) in
Netherlands and showed that visitors were willing to pay 84 Dutch guilders per household
annually, while non-visitors were willing to pay 53 Dutch guilders. Consequently, 70
percent of a household’s total WTP consists of a value that is not related to any past or
present use of the amenities involved.4 More recently, using choice experiments, contingent
valuation, and Analytical Hierarchy Process, Kallas, Gomez-Limon, and Arriaza (2007) and
Kallas, Gomez-Limon, and Hurle (2007) reported the existence of a significant demand for
the multifunctional agriculture in Spain (cereal steppes in Tierra de Campos) with the
demand heterogeneous across soci-economic characteristics.
Evidence is presented that Australian public (particularly urban dwellers) are willing
to pay to maintain rural populations, demonstrating a positive nonuse (existence) value
associated with rural communities (Bennett, Buren, and Whitten, 2004). This research
focusing on Austrailia is noteworthy because it demonstrates that the demand for
multifunctional agriculture is not exclusively unique to developed countries with high density
of population. Oh (2003) estimated the nonmarket value of rice production in Korea using
multiple valuation methods. He showed that its combined nonmarket value including food
security, farmland amenities, flood control, purification of water and air, and ground water
recharge was $ 8.75 billion, 98 percent of national gross revenue of rice, and 51 percent of
agricultural GDP.
In contrast to the studies above conducted at the national level, most studies in the
U.S. have been conducted at the state or county level. Bergstrom and Ready (2009) present
a review of such studies valuing farmland amenity in an effort to identify factors driving
4 Such a value is called “nonuse value and first introduced by Krutilla (1967) in his seminal paper entitled
“Conservation Revisited”.

5
consumers’ willingness to pay for farmland preservation programs. They show that
estimated willingness to pays for farmland amenity are influenced by increasing acreage,
regional scarcity, alternative land uses, public accessibility, productivity quality, human food
plants, active farming, and intensive agriculture. While most studies used nonmarket
valuation methods including stated and revealed preference techniques to measure the
demand for the multifunctional roles of agriculture, Kline and Wichelns (1994) and Kahn and
Matsusaka (1997) used referenda voting records on farmland conservation programs in the
Northeast region and on various environmental propositions in California, respectively.
Similarly, Hellerstein et al (2002) probed legislations enabling farmlands preservation
programs in 48 states in an effort to indirectly assess public demand for various nonmarket
goods and services of agriculture, presuming that such legislations are reasonable
manifestations of public preferences.
The above research presents evidence that the public in the U.S., particularly in some
regions (e.g., Northeast and Pacific) value the non-market outputs associated with farmlands.
However, there has been little systematic effort to measure public preferences or economic
value for the nonmarket goods and services of agriculture at the national level in the US.
The only exception is research by Variyam, Jordan, and Epperson (1990) investigating public
attitudes toward governmental involvement in agriculture and policies to protect small farms
using a national survey, although their study was not designed to assign economic value on
farm policies or nonmarket goods and services of agriculture.
Valuation Design of Multifunctional Agriculture
Theoretical Model
To derive conceptual model underlying the valuation of multifunctional outputs of
the U.S. agriculture, assume that an individual’s utility is shaped by two types of goods:
market goods Xi = (Xi1, Xi2,……..XiN) with prices P = (P1, P2……PN) and multifunctional

6
(nonmarket) goods Zi = (Z1, Z2,……ZM) available at zero price (Santos, 2000). The
individual i’s utility function can be stated as,
(1) Ui = Ui (Xi1, Xi2,……..XiN ; Z1, Z2,……ZM) = Ui (Xi, Zi)
The individual is expected to maximize his/her utility given income constraint (yi), prices (P),
and the vector of multifunctional outputs (Z) as determined externally by farming practices
and/or farm policies. Indirect utility function (Vi) is obtained by substituting optimally
determined vector Xi* (P, yi, Z) into the direct utility function
(2) Vi [Xi* (P, yi, Z), Z] = Vi (P, yi, Z)
Consider USDA farm policies that alters the quantity/quality of both market and nonmarket
goods. As a consequence of such multidimensional policies, utility difference between the
initial and alternative level can arise as shown below
(3) Welfare Change = Vi0 - Vi1 = Vi
0 (P0, yi0, Z0) - Vi1 (P1, yi1, Z1)
Given equation (3), the economic value that the consumer i place on the USDA policies can
be defined using the welfare change measure of Hicksian compensating variation (HCi)
(4) Vi0 (P0, yi0, Z0) = Vi1 (P1, yi1 - HCi, Z1)
HCi denotes welfare change for consumer i that arises from the USDA policies, representing
the amount of income that should be taken away (given) from the consumer i to restore
welfare back to the initial utility. When the USDA policies increases the consumer’s
welfare, HCi would denote the maximum amount of money (taxes) that the consumer is
willing to pay for the policy, and the minimum amount of money (compensation) that the
consumer is willing to accept when it decreases the consumer’s welfare. Hence, maximum
WTP (minimum WTA) represents the economic value that the consumer assigns to the USDA
policies. Summing over individual taxpayers (∑HCi = HC) gives the aggregate value of the
USDA policies.
Survey Instrument Design and Ipsos Web-based Sampling

7
Contingent valuation survey instrument was designed to holistically measure the
aggregate value HC (maximum WTP) for the multidimensional USDA public policies and to
shed new light on the general public’s perceptions and attitudes about the multifunctional
roles of the U.S. agriculture.5 The final questionnaire was administered as an online survey
in June 2008 to a nationally representative web-based household panel maintained by the
Ipsos-Observer, a market research/consulting firm specializing in research of consumer
behavior on various social issues.
The sample was stratified by geographic regions, household income, education, and
age in accordance with 2000 U.S. Census. Questionnaires were emailed to a sub-sample of
5,000 participants of this panel that was representative of the U.S. population. A total of
1,070 consumers completed the online survey within seven days, accounting for an
impressive 39 % response rate. The on line survey elicited sociodemogprahic information
including respondents’ age, education, income, household size, geographic region, gender,
and ethnic background.
The permission-based research approach is often used to explore consumer behavior
because it offers two advantages-higher response rate and disclosure of demographic
information for nonrespondents as well as respondents, thereby facilitating assessment of
potential nonresponse bias. Comparison of socio-demographic characteristics between
respondents and nonrespondents shows that males were more likely to choose not to respond
(62 % vs. 56 %) and whites were slightly more prone to respond to our survey (87 % vs.
80.6). Other than these two categories, there are no major discrepancies between
respondents and nonrespondents, suggesting that there is little reason to be concerned about
potential biases due to systematic nonresponses from particular groups of nonrespondents.
The survey instrument consists of two major parts: (i) general survey, (ii) contingent
5 The full survey instrument is available upon request.
8
valuation scenario. The general survey part includes various sets of questions on issues
pertinent to the concept of multifunctional agriculture (e.g., family farm, farmland
preservation, or government intervention in agricultural markets). In order to measure such
concepts, some question items were drawn from Variyam, Jordan, and Epperson (1990)
investigating citizens’ preferences about U.S. farm policies. Additional set of 15 questions
known as new ecological paradigm (NEP) in the literature was incorporated to measure
respondents’ perceptions of our ecology (Dunlap and Van Liere, 2008; Dunlap et al, 2000).
Contingent Valuation Scenario
The CV part of the survey instrument focused on measuring how consumers value
the multifunctional roles of the U.S. agriculture. Specifically, the CV section asked
respondents to consider the current U.S. agriculture with a particular emphasis on the positive
and negative externalities associated with it and the role of USDA farm policies in dealing
with them (see the Appendix for the entire information box). Further, the information box
succinctly characterizes the USDA’s policy goals as manifested in its strategic plan
framework (USDA, 2008).6 This strategic plan is directly connected with the preservation
of the multifunctional roles of the U.S. agriculture. Given this information box, respondents
were asked the following question.
Suppose that government decides to hold a referendum designed to determine whether to keep spending
[$ X billion] for agriculture for the foreseeable future. The referendum would indicate if you agree
with the idea that agriculture provides intangible benefits/nonmarket goods and services and if you agree
that the government should spend [$ X billion] of your annual taxes for continuing to support agriculture
programs/subsidies that offset the negative environmental effects of farming, enhance rural economies,
and boost farm incomes. If the referendum were rejected, your annual income taxes will be lowered
accordingly. In short, this is asking how much the intangible benefits of agriculture are worth to you 6 The strategic framework includes; (i) Enhancing international competitiveness of American agriculture, (ii)
Enhancing the competitiveness and sustainability of rural and farm economies, (iii) Supporting increased
economic opportunities and improved quality of life in rural America, (iv) Enhancing protection and safety of
the Nation’s Agriculture and Food supply, (v) Improving the Nation’s Nutrition and Health, and (vi) Protecting
and enhancing the Nation’s Natural Resource Base and Environment
9
and how much of your tax dollars would you be willing to pay for them.
In this CV section, respondents face a tradeoff between the two choices: (i) paying [$X] taxes
to continue to enjoy the benefits of nonmarket goods and services of the US agriculture and
(ii) rejecting the referendum (paying reduced taxes by $X) and living without government
subsidies for farming. The amounts of outlays designed to support agriculture [$ X billion,
cost of farm policies] were varied from $20 billion to $220 billion. These numbers were
determined based on annual USDA budget, focus group studies, and pretest result. The
USDA annual overall budget ranged from $88 billion to $93 billion during the period of
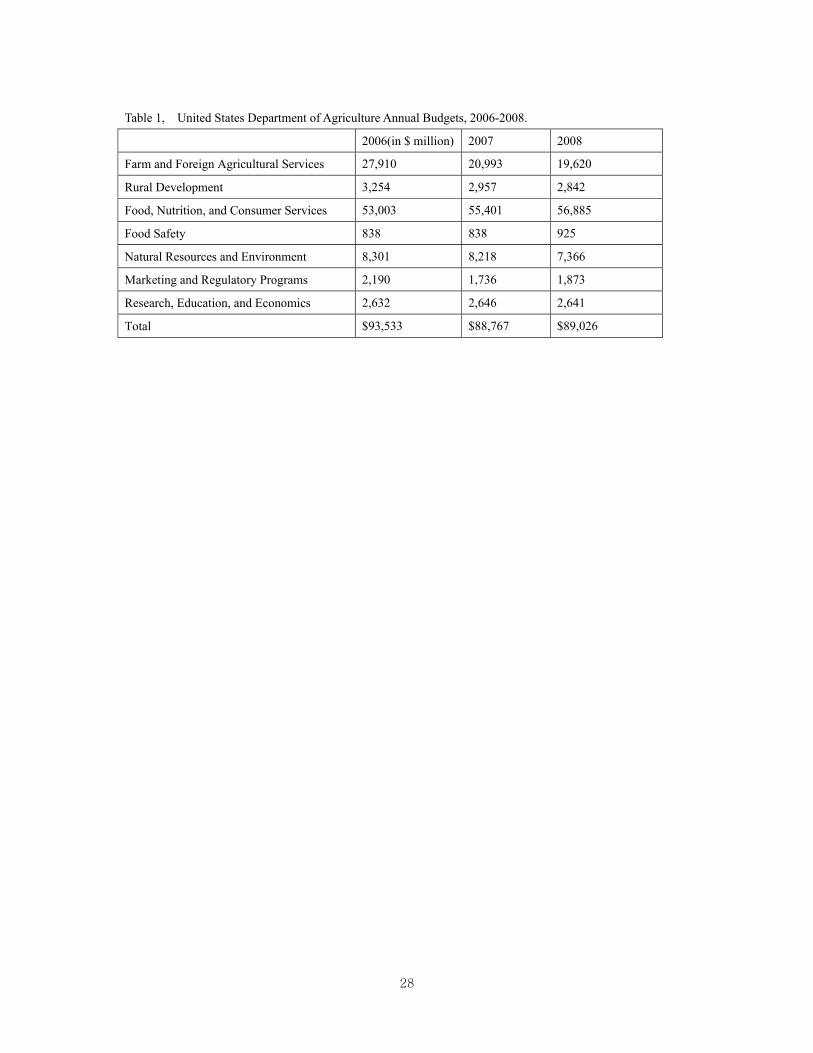
2006-2008 (table 1 shows USDA budgets for various programs). To place these dollar
figures in perspectives, the full value of farm production was ranging from $220 billion in
2000 to nearly $300 billion in 2007, while the net farm income was $66.6 billion in 2007.
Pilot test result indicated that nearly 75 % of respondents (n=198) were willing to endorse the
government to spend $60 billion annually (all of the 198 respondents faced the identical bid
amount of $60 billion).
The above survey instrument was created, revised, and finalized through several
preliminary steps including focus group studies, cognitive interviews, and pilot testing. To
facilitate the researchers to understand how the general public viewed the issues related to the
multifunctionality of the U.S. agriculture and to gain insights into designing survey
instrument, four focus groups were convened through the Applied Research Consultants
(ARC) group affiliated with the Department of Psychology at a University in Midwest. As a
result of the completion of four focus groups, a survey instrument was developed for use
during a series of 13 cognitive interviews in cooperation with the ARC group. The
cognitive interview process involved two major steps: (i) administering draft survey
questions, and (ii) collecting additional verbal information about the survey responses. The
information gained was used to determine whether the questions were generating intended
10
information. Further, pre-test with a sample of 198 participants was conducted as an
additional check prior to finalizing the survey instrument.
Closed-Ended Format and Yea-Saying Tendency
An array of approaches can be used to elicit consumers’ willingness-to-pay for the
multifunctional role of the U.S. agriculture. We chose closed-ended referendum format to
avoid the problems associated with open-ended format and to take advantage of its merit of
resembling actual referendum/market behavior.7 Indeed, this property of the closed-ended
format motivated the National Oceanic Atmospheric Administration (NOAA) panel to
strongly recommend it when they convened in 1993 to evaluate the pros and cons of various
CV survey question formats (NOAA 1993). The closed-ended format can be presented
either in single-bounded or double-bounded formats, although the latter has been shown to be
statistically more efficient when compared to the former.
A major controversy with the application of the contingent valuation method is
potential hypothetical bias whereby respondents overstate the amount they are willing to pay
for public or private goods of research interest. A number of studies present evidence that
transactions typically addressed in CV questions are associated with hypothetical bias (e.g.,
Cummings, Harrison, and Elisabet, 1995; Loomis, Gonzalez-Caban, and Gregory, 1994).
When it comes to hypothetical bias associated with closed-ended format, the problem is often
manifested in the form of Yea-saying tendency (Holmes and Kramer, 1995). Brown et al
(1996) argue that the closed-ended format is not likely to fulfill respondents’ two objectives
in responding to a WTP question: (1) respondents want to truthfully answer the question, and
(2) they want to indicate how favorably they view the good at issue. While open-ended or
7 The open-ended format usually produces an unacceptably large number of non-responses or “protest zero”
responses given the cognitive challenge of ascribing a dollar value to say, a public good. Moreover, this
format may encourage strategic underbidding or overbidding of WTP responses in an attempt to influence
public policies related to the good in question.

11
payment card formats satisfy both these objectives, only “yes” responses indicate a positive
attitude toward the good in the closed-ended format. If it is more important to indicate a
favorable impression of the good than to indicate a truthful WTP, the respondent will say
“yes”. Hence, the two objectives may conflict with each other, causing Yea-saying tendency.
To address this yea-saying problem, we adopted DM (dissonance-minimizing)
elicitation method as proposed by Blamey et al (1999). The DM elicitation method allows
respondents to express multiple attitudes in closed-ended format question in anticipation of
reducing respondents’ dissonance between the two objectives above. Specifically, the CV
survey presented the following four options;
(i) I agree agriculture provides intangible benefits and they are worth [$ X] per year to me and I
would be willing to endorse the government to spend [$ X] out of my annual taxes,
(ii) I agree agriculture provides intangible benefits and the use of tax dollars but they are not worth
per year to me
(iii) I agree agriculture provides intangible benefits but oppose the use of any public tax dollars.
(iv) I disagree agriculture provides intangible benefits regardless whether it costs me anything
If the referendum format were presented with binary options including only yes and
no, we conjecture that some respondents who chose option (ii) would have chosen ‘Yes’ due
to Yea-saying tendency. Hence, estimating willingness to pay with option (ii) treated as
‘Yes’ may produce an estimate that is likely to embed bias due to Yea-saying tendency. This
research treats only respondents who chose option (i) as ‘Yes’.
The option (iii) is considered as protest responses and a follow-up question was asked
to distinguish those who are not true protesters;
i. I would allow our society to spend [$ X] for the intangible benefits provided by agriculture, if
an alternative, acceptable way of collecting the money could be found.
ii. I would be willing to endorse the government to use tax dollars if I am convinced that is the
only way of ensuring the intangible benefits provided by agriculture.
iii. I believe that the cost to pay for the intangible benefits provided by agriculture should be
paid by market demand instead of by the government
Only those respondents who chose option (iii) were dropped from the data analysis.

12
We varied the amount of government outlays on agriculture from $20 billion to $ 220
billion in six steps including $60 billion, $100 billion, $140 billion, and $180 billion. They
translate into $100, $300, $500, $700, $900 and $1100 per person 20 years old or older
among the U.S. population. With the closed-ended question, a dichotomous choice (probit)
model with modified likelihood function to allow for the varying sizes of threshold value (bid
size) is estimated using the maximum likelihood procedure proposed by Cameron and James
(1987). The modified discrete choice model to measure WTP for the multifunctional roles
of the U.S. agriculture can be described as follows:
(1) WTPi *= Xβ + ui
Di = 1 if WTPi * => Pj
= 0 otherwise i = 1, 2, .. , n; # of obs: j = 1, 2, .6: # of bids
where WTPi * denotes a continuous latent variable representing the maximum willingness to
pay for the multifunctional roles of agriculture: X is a vector of explanatory variables shaping
consumers’ WTP*; the error term ui is distributed normally; and Di is a binary variable
indicating whether or not WTPi * exceeds Pj (bid size confronted by each individual ranging
from $100 to $1100). Hence, the probability function can be expressed as,
(2) Prob (Di = 1) =Prob (WTPi * > Pj) = Prob (ui >Pi - Xβ)
= Prob (ui/Φ - (Pj - Xβ)/σ) = 1 - Φ (Pj - X β)/σ
where Φ (.) is the cumulative standard normal distribution function: σ is standard deviation of
error terms. The modified log likelihood function becomes,
(3) log L = D i log [1 - Φ (Pj - X β)/σ]
+ (1 - Di) log [Φ (Pj - X β)/σ]
In contrast to the conventional probit model, the log likelihood function can be maximized
with respect to both the vector of parameters ( β) and the standard deviation (σ), using general
nonlinear function optimization programs. The presence of Pj in the log likelihood function
enables us to identify the scale of the underlying continuous measures of willingness-to-pay

13
for the multifunctional roles of agriculture (Cameron and James 1987). Therefore, the
conditional mean WTP can be calculated simply with X β^ evaluated at the mean values of
the vector (X).
Model Specification
Social Psychological Approach
We use social psychological approach as a theoretical framework to guide our
empirical model specification for the multifunctional roles of agriculture. Social
psychological approach has been frequently applied to environmental valuation studies. For
example, Kotchen and Reiling (2000) combine attitude-behavior theory with economic
valuation technique to explore the relationship among environmental attitudes, nonuse values
for endangered species, and underlying motivations for CV responses. Hyytia and Kola
(2006) examines Finnish citizen’s attitudes towards multifunctional agriculture and link them
to consumers’ willingness to pay. In general, social psychology literature refers primarily to
the tradition of Ajzen-Fishbein’s theory of reasoned behavior.
Under the premise that stated willingness-to-pay represents behavioral intentions
toward nonmarket goods and services of the U.S. agriculture, Fishbein’s theory implies that
consumers’ WTP is determined by their attitudes toward multifunctional agriculture. Such
attitudes are in turn determined by consumer perceptions about salient attributes associated
with the multifunctional roles of the U.S. agriculture. The theory implies causal flows from
attributes to attitudes and from attitudes to behavioral intentions (Moon et al, 2004).
Mediation Model
We use mediation model as proposed by Baron and Kenny (1986) to operationalize
Fishbein’s theory in modeling the linkages among behavioral intentions, attitudes, and
attributes. The central idea of the mediation model, when coupled with Fishbein’s theory, is
that attitudes mediate the effects of attributes on behavioral intentions (willingness to pay).

14
To test this hypothesis, Baron and Kenny suggest that four criteria be examined (as shown in
Figure 1): (i) attitudes have a significant effect on behavior (path c); (ii) attributes have a
significant effect on attitudes (path b) ; (iii) attributes have a significant effect on WTP (path
a), and (iv) when both attitudes and attributes are included in the WTP model, attitudes are
significant, while attributes are no longer significant or the size of effect is diminished. In
accordance with these criteria, four conceptual models are developed below.
(4) Attitudes = f ( Attributes associated with multifunctionality of agriculture) (5) Willingness to pay = f (Attitudes toward multifunctional roles of agriculture) (6) Willingness to pay = f ( Attributes) (7) Willingness to pay = f (Attitudes, Attributes)
Attitudes toward the multifunctional roles of agriculture (Att_M) are constructed from two
question items: (i) agriculture produces intangible goods and services, and (ii) government
should compensate farmers for their supply of such intangible goods and services. These
questions were asked immediately after respondents were exposed to the information box of
the U.S. agriculture (see Appendix for the full script) and before the willingness to pay
questions were asked.
Attributes of Multifunctional Agriculture
Four attributes are identified as salient that underlie public attitudes and behavioral
intentions toward the multifunctional agriculture: government involvement in agricultural
markets (Gov_Int), family farms (F_farms), farmland preservation (Farmland), and
environmental/ecological integrity (Eco_sys).
Government involvement in agricultural market has been seriously contested and
debated since 1980s in the U.S. given the argument of the market-oriented reformers that
returns to farm resources (labor and capital) became comparable to those in nonagricultural
sectors. The market-oriented reformers indicate that government intervention should be
replaced with risk management tools, while advocates of traditional government support

15
argue that farming sector is not viable without government involvement because of intrinsic
uncertainties in farm production and prices (Tweenten, 2002). We hypothesize that
respondents who are in favor of government involvement are more likely to be willing to
endorse the government to spend taxes for supporting agriculture.
There is a sentiment among some people that farmland represents an important
national asset that needs to be protected from poorly considered development plans (Libby,
2002). In support of this sentiment, there is a broad range of farmland preservation
programs/policies at federal, state, and local government levels. Such farmland preservation
programs are in recognition of the various ecological and amenity services associated with
actively farmed land (Hellerstein et al, 2002). We anticipate a positive relationship between
respondents’ perceptions about the farmland preservation programs and willingness-to-pay
taxes.
Concern has been growing about corporate-style farms increasingly replacing family
farms (Rosset, 2000). USDA recognizes the protection of family farms as one of its
missions in acknowledgment of the benefits that they offer to our society in the form of
fostering diversity (ownership, cropping systems, landscape, biological organization, culture
and traditions), environmental benefits, and empowerment and community responsibility. We
hypothesize that respondents who sympathize that family farms should be preserved would
be more likely to be willing to endorse the government to use tax monies to support
agriculture.
Another important attribute of multifunctional agriculture is
environmental/ecological conservation (Antle and Valdivia, 2006; Antle and Stoorvogel,
2006). In fact, agri-environmental programs of the USDA has been expanding rapidly in
recent years as demonstrated in the creation of conservation security payment (CSP) and
environmental quality incentive payment (EQIP) on working agricultural landscapes in
16
contrast to conservation reserve program (CRP) of 1980s which was targeted at idling highly
erodible land. We used revised version of NEP (new ecological paradigm) to measure
consumers’ perceptions about ecological issues (Dunlap and Van Liere, 2008; Dunlap et al,
2000). Revised NEP consists of 15 questions measuring five aspects of environmental
attitudes: (i) reality of limits to growth; (ii) anti-anthropocentrism; (iii) the fragility of
nature’s balance; (iv) rejection of the idea that humans are exempt from the constraints of
nature; and (v) the possibility of an eco-crisis or ecological catastrophe (Kotchen and Reiling,
2000). From these 15 question items, we developed an index consisting of seven question
items reflecting optimistic views (Eco_sys).
Table 2 shows question items used to construct indices measuring respondents’
attitudes toward multifunctionality of agriculture and perceptions about each of the four
attributes along with summary statistics.
Empirical Analysis
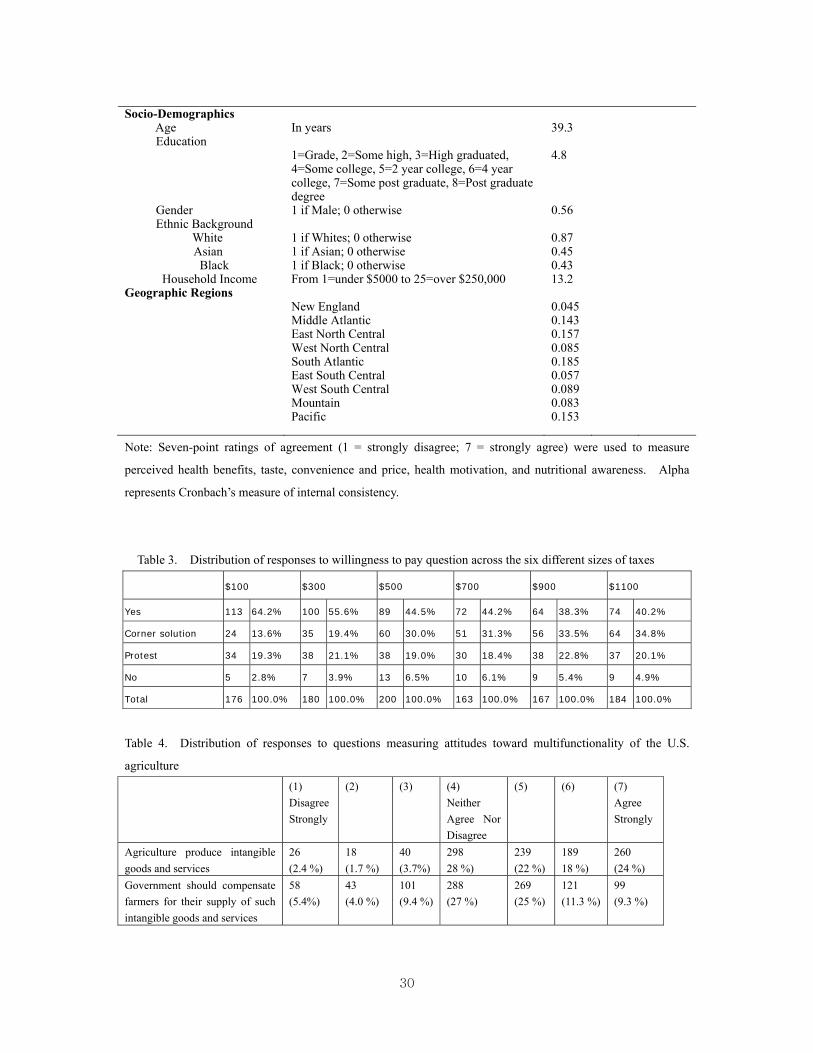
Table 3 presents the distribution of responses to WTP questions across the six
different sizes of taxes. The Ipsos sample (N=1076) was divided into six groups with each
of them being exposed to different bid amounts ($100, $300, $500, $700, $900, $1100).
The size of the subgroups were n=176, 180, 200, 163, 167, and 184, respectively. The
percentage of respondents saying ‘Yes’ decreases from 64.2 % (for $100) to 38.3 % (for $900)
and to 40.2 % (for $1100). Consistent with our prior expectation, the percentage of
respondents (corner solutions) indicating that they believe the multifunctional agriculture has
certain value to them but not quite the amount of dollars given in the questionnaire increases
from 13.6 % (for $100) to 34.8 (for $1100). The percentage of protest responses were fairly
stable (ranging from 19.3 % to 22.8 %) across the six different sizes of annual taxes, whereas
those of “no” responses increases from 2.8 % and 3.9 % (for $100 and $300) to 6.5 % for
$1100. Table 4 shows the distribution of responses to two questions measuring respondents’

17
attitudes toward the multifunctionality of the U.S. agriculture. About 64 % of respondents
(combining response options of 5, 6, and 7) agree that agriculture produces intangible goods
and services beyond market commodities. However, when it comes to the question of
whether the government should compensate farmers for such nonmarket goods and services,
the percentage decreases to 45.6 %. The decrease indicates that attitudes toward
multifunctionality of agriculture differ from those toward government involvement designed
to address market failures associated with multifunctional agriculture.
WTP Regression Models
Corresponding to conceptual models (4) through (7), we estimate the following four
regression models that shed light on individual characteristics driving willingness to pay for
the multifunctional roles of the U.S. agriculture.
(8) Att_M = β0 + β1 Г + γ Z + ε
(9) WTP = β0 + β1 Bid + β2 Atti_M + ε (10) WTP = β0 + β1 Bid + β2 Г + β3 Z + ε
(11) WTP = β0 + β1 Bid + β2 Atti_M + β3 Г + β4 Z + ε
Dichotomous willingness-to-pay models (WTP) commonly include Bid as an explanatory
variable. Г is a vector including the four attributes that underlie consumers’ attitudes toward
multifunctionality of agriculture: Г= [Gov_Int, F_farm, Farmland, Eco_sys]; Z is a vector
that involves socio-economic, demographic, and geographic regional variables: Z = [Income,
Age, Geographic regions, Ethnicity]. Equation (8) links attitudes toward multifunctional
roles of the U.S. agriculture to attributes hypothesized to underlie such attitudes; equation (9)
estimates the relationship of WTP to bid size and attitudes; equation (10) links WTP to only
attributes; and equation (11) incorporates both attitudes and attributes in explaining WTP.
Estimation Results
Testing Mediation Hypothesis
Table 5 presents estimated results of the four regression models from (8) to (11).

18
Comparing estimated coefficients across equations (8) through (11) allows us to assess
whether Att_M mediates the effects of the four attribute variables on WTP. Upon applying
the four criteria of Baron and Kenny, the following two conclusions can be drawn as to the
mediation hypotheses. First, attitudes almost completely mediate the effect of F_farms; i.e.,
the size of coefficient for F_farms decreases from β=0.04896 (t=2.76) in equation (10) only
with attributes to β=0.01353 (t=0.718) in equation (11) with both attitudes and attributes.
The coefficient in equation (11) is not statistically different from zero, indicating that F_farm
affects WTP only indirectly through Att_M. Second, the size of coefficients for Farmland
and Gov_Int decreases modestly from β=0.0825 (t=6.11) and β=0.0735 (t=6.769) in equation
(10) to β=0.0467 (t=3.218) and β=0.0586 (t=5.193), respectively, in equation (11). These
results indicate that Farmland and Gov_Int affect WTP directly as well as indirectly through
Att_M. In other words, the effects of Farmland and Gov_Int are partially mediated by
Att_M.
Estimated Coefficients of Attributes
We use the estimation results of equation (11) for interpretation and calculation of
mean WTPs for the multifunctional roles of the U.S. agriculture. Two variables (Bid and
Income) related to economic incentives are of particular significance given the results of
these variables play an important role in evaluating the validity of nonmarket valuation
research using stated preference methods. The size of bids (Bid) is highly significant,
clearly indicating that respondents were sensitive to the size of bids in their decisions of
whether or not to endorse the government to use taxes to support agriculture. Using the
estimated coefficients of equation (11), we simulated how the cumulative probability of
willingness to pay changes in response to the six different bid sizes. Figure 2 shows that the
likelihood of willingness to endorse the government to use their taxes is about 74 percent
when the bid size is $100, and such likelihood decreases to 44 percent when the bid size
19
increases to $1100. This represents nearly 30 % difference in the probability of willingness
to pay between consumers exposed to bid sizes $100 and $1100. Income is a significant
determinant of consumers’ preferences about the multifunctional roles of agriculture,
suggesting that as income increases, so does the likelihood of willingness to pay.
In sum, the results of these two variables (Bid and Income) indicate that respondents
considered the cost of farm programs and stated their preferences in line with their financial
ability, presenting an internal validity to our contingent valuation design.
Compatible with the Fishbein’s theory, consumers’ attitudes toward the
multifunctional roles of agriculture (Att_M) was exerting highly significant impact on their
WTP. Drake (1991) shows that willingness to pay for the preservation of agricultural
landscapes is significantly correlated with positive attitudes towards the idea of preserving
agricultural landscapes. Brouwer and Slangen (1998) show that attitude toward paying for
public environmental goods is a significant variable explaining willingness to pay for the
agricultural wildlife management (peat meadow) in Netherlands.
The coefficient of Gov_Int had a negative and statistically significant effect,
suggesting that respondents not favorable to government involvement in agricultural markets
are predisposed to be less willing to pay for the multifunctional roles of agriculture.
Indirectly supporting our result, Variyam et al (1990) reported that Democrats and
Independents were more likely to favor farm support policies compared to Republicans.
Respondents who are in support of the idea of farmland conservation programs (Farmland)
turned out to be more willing to pay taxes to ensure that agricultural sector continues to play
the role of supplying nonmarket goods and services it produces jointly with market
commodities. Foltz and Larson (2002) present a similar result that residents in Connecticut
in support of preserving farms for future generations are more likely to endorse PDR
(purchase of development rights) program.

20
Comprising of seven question items, Eco_sys is an index variable that represents
how optimistically respondents view the environmental/ecological state of our world.
Eco_sys had a statistically significant and negative sign, indicating that consumers who have
optimistic views of our environment are predisposed to be less willing to pay for the
multifunctional roles of the U.S. agriculture. Kotchen and Reiling (2000) show that NEP
scale had a statistically significant effect on willingness to pay for the preservation of
endangered species (peregrine falcon and shortnose sturgeon).
When combined with the results of Bid and Income, statistically significant and
theoretically consistent effects of these attribute variables reinforce the construct validity of
this study.
The coefficient estimates for geographic regional dummies indicate significant
differences in willingness to pay taxes between New England and other regions: i.e.,
consumers from the region of New England were more likely to be willing to pay taxes to
support the multifunctional roles of agriculture than any other regions. This result is
consistent with prior studies: i.e., Variyam et al (1990) showed that individuals from the
Northeast were likely to be more supportive of a governmental role in agriculture; and
Hellerstein et al (2002) found that the greatest interest in preserving rural amenities are in the
farmland protection legislation of the more densely populated States such as Northeast or
Pacific regions.
Mean WTP Estimate
Based on the estimated coefficients of equation (11), we computed mean WTP. The
estimated mean WTP was $515 per person annually. We constructed confidence interval for
the estimated mean WTP using bootstrapping method and it ranges between [$ 381.94,
$ 622.56] at α=0.05 % level. Aggregation of individual WTPs across the U.S. taxpayers
above 20 years old amounts to $105 billion. Note that the estimated WTP is conditional on
21
several factors specific to our research design including: (i) the information given by our CV
scenario, (ii) the particular bid design, and (iii) the referendum WTP elicitation format used in
this study. With these conditions in mind, the amount of $105 billion represents a crude
estimate of the economic value that the U.S. consumers place on the multifunctional roles of
the U.S. agriculture. The estimated aggregate value of multifunctional agriculture is about
one-third of the value of total farm production ($300 billion) in 2007.
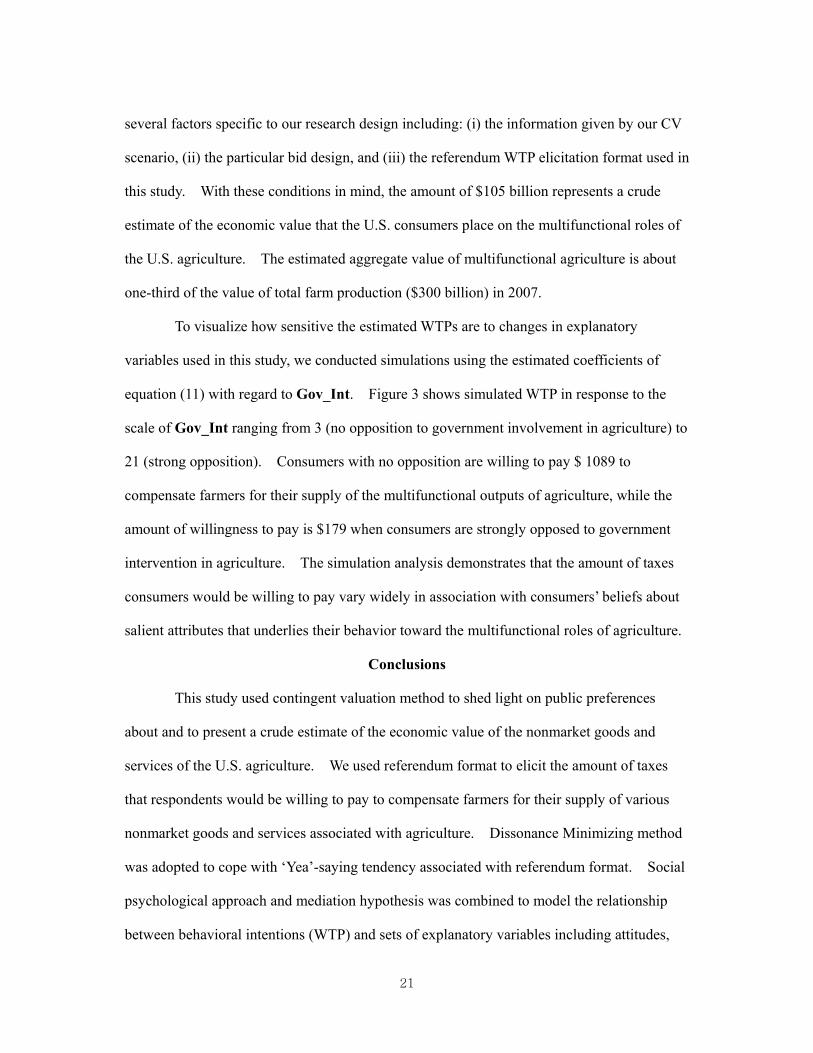
To visualize how sensitive the estimated WTPs are to changes in explanatory
variables used in this study, we conducted simulations using the estimated coefficients of
equation (11) with regard to Gov_Int. Figure 3 shows simulated WTP in response to the
scale of Gov_Int ranging from 3 (no opposition to government involvement in agriculture) to
21 (strong opposition). Consumers with no opposition are willing to pay $ 1089 to
compensate farmers for their supply of the multifunctional outputs of agriculture, while the
amount of willingness to pay is $179 when consumers are strongly opposed to government
intervention in agriculture. The simulation analysis demonstrates that the amount of taxes
consumers would be willing to pay vary widely in association with consumers’ beliefs about
salient attributes that underlies their behavior toward the multifunctional roles of agriculture.
Conclusions
This study used contingent valuation method to shed light on public preferences
about and to present a crude estimate of the economic value of the nonmarket goods and
services of the U.S. agriculture. We used referendum format to elicit the amount of taxes
that respondents would be willing to pay to compensate farmers for their supply of various
nonmarket goods and services associated with agriculture. Dissonance Minimizing method
was adopted to cope with ‘Yea’-saying tendency associated with referendum format. Social
psychological approach and mediation hypothesis was combined to model the relationship
between behavioral intentions (WTP) and sets of explanatory variables including attitudes,

22
perceived attributes (about family farms, farmland preservation programs, government
involvement in agricultural markets, and ecological state of our world), and socio-
demographic profiles.
Estimated results show that consumers’ willingness to pay taxes for the
multifunctional roles of the U.S. agriculture is shaped by how they view family farms,
farmland conservation programs, government intervention in agricultural markets, and
ecological state of our world. Further, the results show that, while exerting a highly
significant impact on WTP, attitudes mediate the effects of the four attribute variables on
WTP: i.e., the four attributes influence WTP directly as well as indirectly through attitudes.
In particular, the significant association of Eco_sys with willingness to pay taxes for the
multifunctional roles of the U.S. agriculture is noteworthy given that this article is the first
attempt linking NEP (new ecological paradigm) index to economic valuation of
multifunctional agriculture. The result of Eco_sys demonstrates that ecosystem protection
is an important component of the nonmarket goods of agriculture that the U.S. general public
expects from the governmental intervention in agriculture (Antle and Stoorvogel, 2006;
Swinton, 2008; Kraft, 2008; Ruhl, 2008).
The valuation scenario in this research can be interpreted as assessing whether the
public approves the current size of USDA outlays designed to subsidize/support agriculture.
Estimated value of the multifunctional outputs of the U.S. agriculture ($105 billion) suggests
that the public overall renders strong endorsement of the USDA outlays in recent years and
justify government involvement in agriculture, although our study offers little insights into
the specific question of where the budget should be spent.
In closing, this study represents an effort to holistically measure the monetary value
of and expand the body of empirical evidence on public preferences of the multifunctional
outputs of the U.S. agriculture. Given the holistic nature of the description of the

23
multifunctional outputs to be valued in our CV scenario, further research is needed with
valuation scenarios that define the multifunctional outputs in a more concrete manner.
24
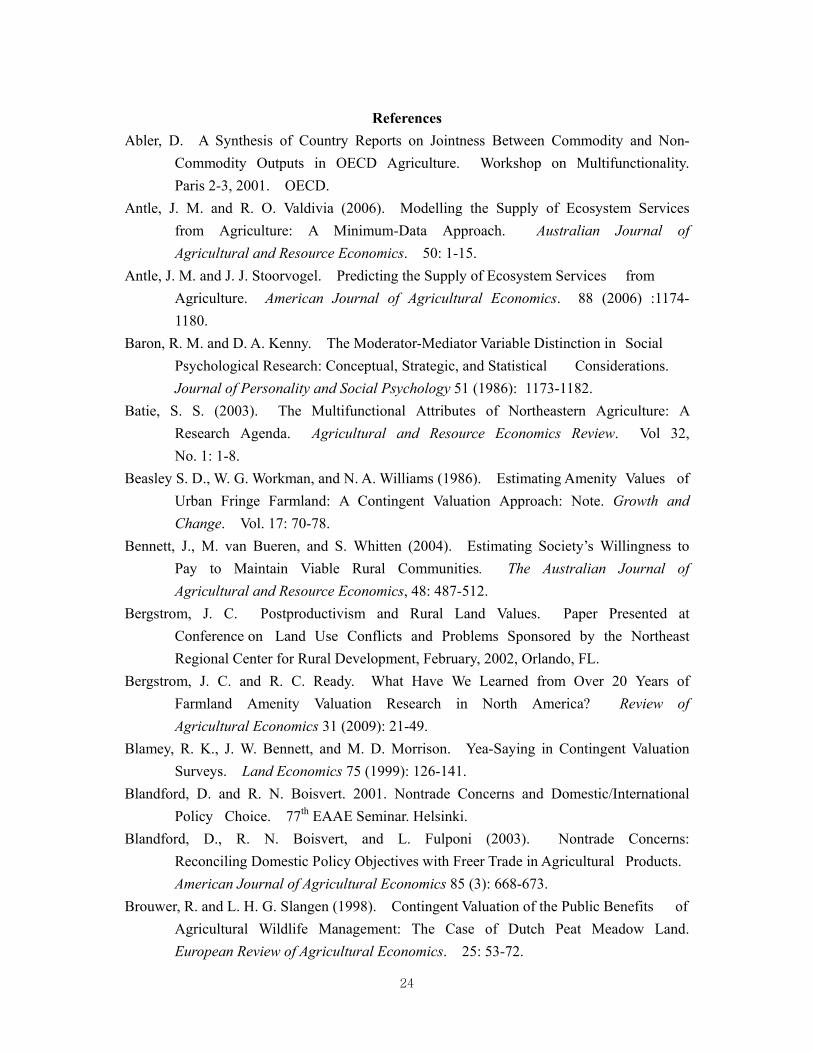
References Abler, D. A Synthesis of Country Reports on Jointness Between Commodity and Non- Commodity Outputs in OECD Agriculture. Workshop on Multifunctionality. Paris 2-3, 2001. OECD. Antle, J. M. and R. O. Valdivia (2006). Modelling the Supply of Ecosystem Services from Agriculture: A Minimum-Data Approach. Australian Journal of Agricultural and Resource Economics. 50: 1-15. Antle, J. M. and J. J. Stoorvogel. Predicting the Supply of Ecosystem Services from Agriculture. American Journal of Agricultural Economics. 88 (2006) :1174- 1180. Baron, R. M. and D. A. Kenny. The Moderator-Mediator Variable Distinction in Social Psychological Research: Conceptual, Strategic, and Statistical Considerations. Journal of Personality and Social Psychology 51 (1986): 1173-1182. Batie, S. S. (2003). The Multifunctional Attributes of Northeastern Agriculture: A Research Agenda. Agricultural and Resource Economics Review. Vol 32, No. 1: 1-8. Beasley S. D., W. G. Workman, and N. A. Williams (1986). Estimating Amenity Values of Urban Fringe Farmland: A Contingent Valuation Approach: Note. Growth and Change. Vol. 17: 70-78. Bennett, J., M. van Bueren, and S. Whitten (2004). Estimating Society’s Willingness to Pay to Maintain Viable Rural Communities. The Australian Journal of Agricultural and Resource Economics, 48: 487-512. Bergstrom, J. C. Postproductivism and Rural Land Values. Paper Presented at Conference on Land Use Conflicts and Problems Sponsored by the Northeast Regional Center for Rural Development, February, 2002, Orlando, FL. Bergstrom, J. C. and R. C. Ready. What Have We Learned from Over 20 Years of Farmland Amenity Valuation Research in North America? Review of Agricultural Economics 31 (2009): 21-49. Blamey, R. K., J. W. Bennett, and M. D. Morrison. Yea-Saying in Contingent Valuation Surveys. Land Economics 75 (1999): 126-141. Blandford, D. and R. N. Boisvert. 2001. Nontrade Concerns and Domestic/International Policy Choice. 77th EAAE Seminar. Helsinki. Blandford, D., R. N. Boisvert, and L. Fulponi (2003). Nontrade Concerns: Reconciling Domestic Policy Objectives with Freer Trade in Agricultural Products. American Journal of Agricultural Economics 85 (3): 668-673. Brouwer, R. and L. H. G. Slangen (1998). Contingent Valuation of the Public Benefits of Agricultural Wildlife Management: The Case of Dutch Peat Meadow Land. European Review of Agricultural Economics. 25: 53-72.
25
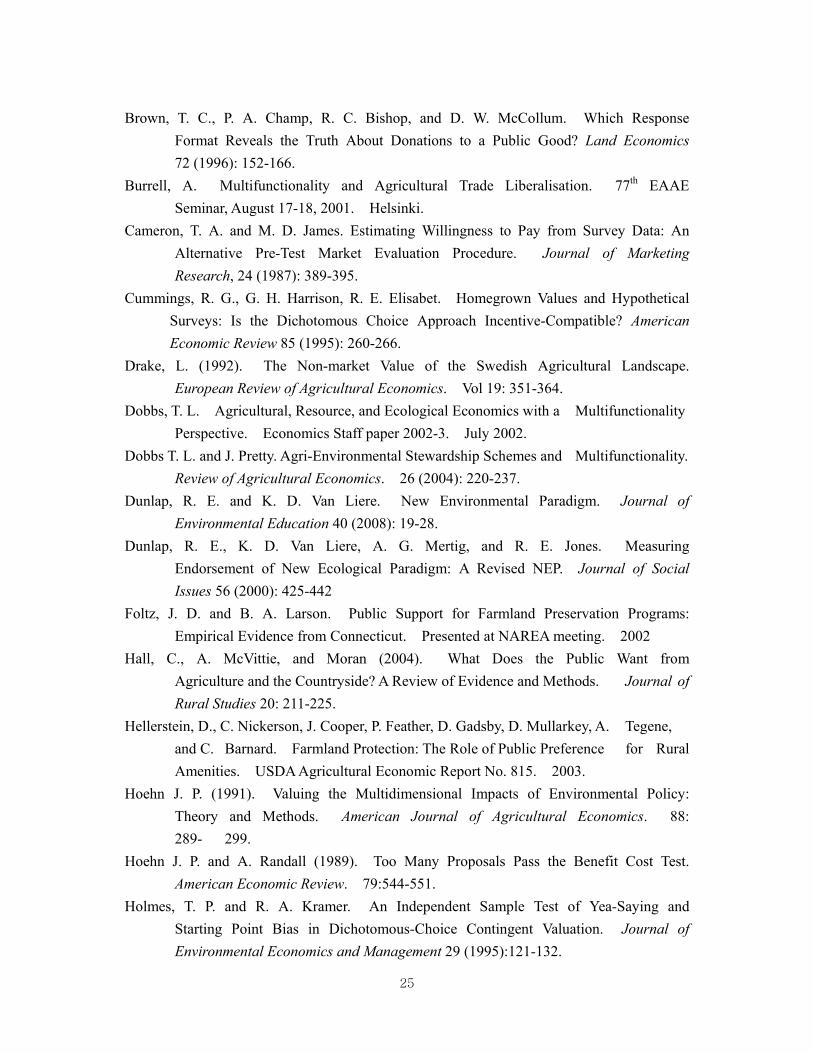
Brown, T. C., P. A. Champ, R. C. Bishop, and D. W. McCollum. Which Response Format Reveals the Truth About Donations to a Public Good? Land Economics 72 (1996): 152-166. Burrell, A. Multifunctionality and Agricultural Trade Liberalisation. 77th EAAE Seminar, August 17-18, 2001. Helsinki. Cameron, T. A. and M. D. James. Estimating Willingness to Pay from Survey Data: An Alternative Pre-Test Market Evaluation Procedure. Journal of Marketing Research, 24 (1987): 389-395. Cummings, R. G., G. H. Harrison, R. E. Elisabet. Homegrown Values and Hypothetical
Surveys: Is the Dichotomous Choice Approach Incentive-Compatible? American Economic Review 85 (1995): 260-266.
Drake, L. (1992). The Non-market Value of the Swedish Agricultural Landscape. European Review of Agricultural Economics. Vol 19: 351-364. Dobbs, T. L. Agricultural, Resource, and Ecological Economics with a Multifunctionality Perspective. Economics Staff paper 2002-3. July 2002. Dobbs T. L. and J. Pretty. Agri-Environmental Stewardship Schemes and Multifunctionality. Review of Agricultural Economics. 26 (2004): 220-237. Dunlap, R. E. and K. D. Van Liere. New Environmental Paradigm. Journal of Environmental Education 40 (2008): 19-28. Dunlap, R. E., K. D. Van Liere, A. G. Mertig, and R. E. Jones. Measuring Endorsement of New Ecological Paradigm: A Revised NEP. Journal of Social Issues 56 (2000): 425-442 Foltz, J. D. and B. A. Larson. Public Support for Farmland Preservation Programs: Empirical Evidence from Connecticut. Presented at NAREA meeting. 2002 Hall, C., A. McVittie, and Moran (2004). What Does the Public Want from Agriculture and the Countryside? A Review of Evidence and Methods. Journal of Rural Studies 20: 211-225. Hellerstein, D., C. Nickerson, J. Cooper, P. Feather, D. Gadsby, D. Mullarkey, A. Tegene, and C. Barnard. Farmland Protection: The Role of Public Preference for Rural Amenities. USDA Agricultural Economic Report No. 815. 2003. Hoehn J. P. (1991). Valuing the Multidimensional Impacts of Environmental Policy: Theory and Methods. American Journal of Agricultural Economics. 88: 289- 299. Hoehn J. P. and A. Randall (1989). Too Many Proposals Pass the Benefit Cost Test. American Economic Review. 79:544-551. Holmes, T. P. and R. A. Kramer. An Independent Sample Test of Yea-Saying and Starting Point Bias in Dichotomous-Choice Contingent Valuation. Journal of Environmental Economics and Management 29 (1995):121-132.
26
Hudson, D., C. P. Rosson III, J. Robinson, and J. Malaga (2005). The WTO Cotton Case and US Domestic Policy. Choices, 2nd Quarter, 20: 143-147. Hyytia, N. and J. Kola. Finnish Citizens’ Attitudes Towards Multifunctional Agriculture. International Food and Agribusiness Management Review 9 (2006): 2-22 Kahn, M. E. and J. G. Matsusaka. Demand for Environmental Goods: Evidence from Voting Patterns on California Initiatives. The Journal of Law and Economics 40 (1997): 137-174. Kallas, Z., J. A. Gomez-Limon, and M. Arriaza (2007). Are Citizens Willing to Pay for Agricultural Multifunctionality? Agricultural Economics 36: 405-419. Kallas, Z., J. A. Gomez-Limon, and J. B. Hurle. Decomposing the Value of Agricultural Multifunctionality: Combining Contingent Valuation and the Analytical Hierarchy Process. Journal of Agricultural Economics 58 (2007): 218-241. Kline, J. and D. Wichelns (1994). Using Referendum Data to Characterize Public Support for Purchasing Development Rights to Farmland. Land Economics. Vol 70 (2): 223- 233. Kotchen, M. J. and S. D. Reiling. Environmental Attitudes, Motivations, and Contingent Valuation of Nonuse Values: a Case Study Involving Endangered Species. Ecological Economics 32 (2000): 93-107. Kraft, S. E. Ecosystem Services: 21st Century Policy Challenges. Choices 23 (2), 2008: 26-27. Libby, L. Farmland is Not Just for Farming Any More: The Policy Trends. In Agricultural Policy for the 21st Century, ed by L. Tweenten and S. R. Thompson. Iowa State Press. 2002 Loomis J., A. Gonalez-Caban, and R. Gregory. “Do Reminders of Substitutes and Budget
Constraints Influence Contingent Valuation Estimates?” Land Economics 70 (1994): 499-506.
Moon, W. and S. K. Balasubramanian. Public Attitudes Toward Agrobiotechnology: The Mediating Role of Risk Perceptions on the Impact of Trust, Awareness, and Outrage. Review of Agricultural Economics 26 (2004): 186-208
NOAA. Natural Resource Damage Assessments under the Oil Pollution Act of 1990. Fed Register 58 (1993): 4601-4614. OECD. 2001. Multifunctionality: Towards an Analytical Framework, Paris. Peterson, J. M., R. N. Boisvert, and H. de Gorter (2002). Environmental policies for a multifunctional agricultural sector in open economies. European Review of Agricultural Economics. Vol 29: 423-443. Oh Se-Ik. Multifunctionality of Korean Agriculture. 2nd RDA/ARNOA International Conference on Asian Organic Agriculture. November 11, 2003.
27
Paarlberg, P. L., M. Bredahl, and J. G. Lee. Multifunctionality and Agricultural Trade Negotiations. Review of Agricultural Economics 24 (2002): 322-335. Potter, C. Multifunctionality as an Agricultural and Rural Policy Concept. In Sustaining Agriculture and the Rural Environment. Ed. By Brouwer, F. 2002. Randall, A. Valuing the Outputs of Multifunctional Agriculture (2002). European Review of Agricultural Economics, vol 29 (3). Rosset, P. The Multiple Functions and Benefits of Small Farm Agriculture in the Context of Global Trade Negotiations. World Food Programme, Special Section on Food Security. The Society for Development. SAGE Publications. 43 (2000): 77-82. Ruhl, J. B. Farms and Ecosystem Services. Choices 23 (2) 2008: 32-36. Santos, J. M. L. Problems and Potential in Valuaing Multiple Outputs: Externality and Public-Good Non-Commodity Outputs from Agriculture, Ch 3 from Valuing Rural Amenities. OECD, 2000. Swanton, S.M. Reimaging Farms as Managed Ecosystem. Choices 23 (2) 2008: 28-31. Swinbank, A. Multifunctionality: A European Euphemism for Protection? FWAG
Conference. National Agriculture Centre, Stoneleigh, 29 Nov 2001. Tweenten, Farm Commodity Programs: Essential Safety Net or Corporate Welfare? In Agricultural Policy for the 21st Century, ed by L. Tweenten and S. R. Thompson. Iowa State Press. 2002 USDA. FY 2008 Budget Summary and Annual Performance Plan. United States
Department of Agriculture, 2008. Vanzetti, D. and E. Wymen. The Multifunctionality of Agriculture and Its Implications for Policy. In Agriculture and the WTO: Creating A System for Development. Ed. By Ingco M. D. and J. D. Nash. World Bank. 2004, Washington, DC. Variyam, J. N., J. L. Jordan, and J. E. Epperson (1990). Preferences of Citizens for Agricultural Policies: Evidence from A National Survey. American Journal of Agricultural Economics. 72 (1990): 258-267. Vatn, A. Multifunctional Agriculture: Some Consequences for International Trade Regimes. European Review of Agricultural Economics 29 (2002): 309-327. Vatn, A. Transaction Costs and Multifunctionality. Workshop on Multifunctionality. Paris 2-3 July 2001. OECD.
28
Table 1, United States Department of Agriculture Annual Budgets, 2006-2008.
2006(in $ million) 2007 2008
Farm and Foreign Agricultural Services 27,910 20,993 19,620
Rural Development 3,254 2,957 2,842
Food, Nutrition, and Consumer Services 53,003 55,401 56,885
Food Safety 838 838 925
Natural Resources and Environment 8,301 8,218 7,366
Marketing and Regulatory Programs 2,190 1,736 1,873
Research, Education, and Economics 2,632 2,646 2,641
Total $93,533 $88,767 $89,026

29
Table 2. Description and summary statistics of variables used in estimation.
Variable Description Mean
Alpha St. Dev.
Attitudes Toward Multifunctional Agriculture (Att_M)
1. I agree agriculture provides intangible benefits that can not be sold
2. Government should compensate farmers for the intangible benefits produced by agriculture
5.16 4.40
1.44 1.45
Government Intervention in Agricultural Markets (Gov_Int)
1. The government should reduce their involvement in agriculture to a level comparable with other sectors of the economy
2. Farmers should compete in a free market without government support
3. Government should guarantee a minimum price to farmers for their products
4.25 4.18 3.36
0.727 1.59 1.61 1.75
Family Farms (F_Farms) 1. The family farm should be preserved because it is a vital part of our cultural heritage
2. Obtaining greater efficiency in food production is more important than preserving the family farm
3. Government should have a special policy to ensure that family farms survive
5.32 3.30 4.94
0.871 1.48 1.59 1.58
Farmland Preservation (Farmland)
1. Farmland should be protected from urban sprawl
2. There should be no developmental restrictions on the use of farmland
5.43 4.80
0.712 1.35 1.44
Environmental/Ecological Issues (Eco_sys)
1. The earth has plenty of natural resources if we just learn to develop them.
2. Humans have the right to modify the natural environment to suit their needs
3. Humans were meant to rule over nature 4. The balance of nature is strong enough
to cope with the impacts of modern industrial nations
5. Human ingenuity will ensure that we do not make the earth unlivable
6. Humans will eventually learn enough about how nature works to be able to control it
7. The so-called ecological crisis facing human kind has been greatly exaggerated
3.35 3.49 3.39 4.00 3.81 3.33 3.55
0.893 1.65 1.82 1.64 1.63 1.64 1.87 1.49
30
Socio-Demographics Age Education
Gender Ethnic Background White Asian Black
Household Income Geographic Regions
In years 1=Grade, 2=Some high, 3=High graduated, 4=Some college, 5=2 year college, 6=4 year college, 7=Some post graduate, 8=Post graduate degree 1 if Male; 0 otherwise 1 if Whites; 0 otherwise 1 if Asian; 0 otherwise 1 if Black; 0 otherwise From 1=under $5000 to 25=over $250,000 New England Middle Atlantic East North Central West North Central South Atlantic East South Central West South Central Mountain Pacific
39.3 4.8 0.56 0.87 0.45 0.43 13.2 0.045 0.143 0.157 0.085 0.185 0.057 0.089 0.083 0.153
Note: Seven-point ratings of agreement (1 = strongly disagree; 7 = strongly agree) were used to measure
perceived health benefits, taste, convenience and price, health motivation, and nutritional awareness. Alpha
represents Cronbach’s measure of internal consistency.
Table 3. Distribution of responses to willingness to pay question across the six different sizes of taxes
$100 $300 $500 $700 $900 $1100
Yes 113 64.2% 100 55.6% 89 44.5% 72 44.2% 64 38.3% 74 40.2%
Corner solution 24 13.6% 35 19.4% 60 30.0% 51 31.3% 56 33.5% 64 34.8%
Protest 34 19.3% 38 21.1% 38 19.0% 30 18.4% 38 22.8% 37 20.1%
No 5 2.8% 7 3.9% 13 6.5% 10 6.1% 9 5.4% 9 4.9%
Total 176 100.0% 180 100.0% 200 100.0% 163 100.0% 167 100.0% 184 100.0%
Table 4. Distribution of responses to questions measuring attitudes toward multifunctionality of the U.S.
agriculture (1)
Disagree Strongly
(2) (3) (4) Neither Agree Nor Disagree
(5) (6) (7) Agree Strongly
Agriculture produce intangible goods and services
26 (2.4 %)
18 (1.7 %)
40 (3.7%)
298 28 %)
239 (22 %)
189 18 %)
260 (24 %)
Government should compensate farmers for their supply of such intangible goods and services
58 (5.4%)
43 (4.0 %)
101 (9.4 %)
288 (27 %)
269 (25 %)
121 (11.3 %)
99 (9.3 %)

31
Figure 1. Mediation Model Linking Willingness to Pay to Attitudes and Attributes.
0.735850.68247
0.625010.56462
0.502680.44068
0
0.1
0.2
0.3
0.4
0.5
0.6
0.7
0.8
$100 $300 $500 $700 $900 $1,100
Probability of WTP
Bid SIZE
Figure 2. Effect of Bid Sizes on Probability of Willingness to Pay Taxes to Support the Supply of
Multifunctional Outputs of Agriculture.
Attitudes Toward
Multifunctional Agriculture
(Mediators)
Behavioral Intentions
(Willingness to Pay Taxes for
Multifunctionality)
(Dependent Variable)
Perceptions of
Government Intervention
Family Farms
Farmland Preservation
Ecosystem
Attributes of Multifunctional
Agriculture
(Predictor Variables)
a
c b

32
Figure 3. Simulated willingness to pay in connection with the scales of Gov_Int (3-21)
1089937
786634
483331
1790
200
400
600
800
1000
1200
3 6 9 12 15 18 21
WTP
($)
Government Intervention
33
Appendix Less than 2% of the U.S. population is currently engaged in farm production. While the U.S. both
imports and exports food, the U.S. is essentially self-sufficient in terms of being able to produce the food it
needs for its population. However, some other countries are not so lucky and have a strategic goal of
achieving a socially acceptable minimum level of self-sufficiency in terms of food production. This
minimum level is desired in order to promote national food security (defined as an access to a sufficient
amount of food in crises such as war and disruptions in crop supply due to adverse weather).
Intensively managed farming practices using pesticides, fertilizers, and herbicides can negatively
impact the environment, polluting ground and surface water. However, when these negative effects are
controlled, the U.S. agricultural system is able to produce a wide range of positive effects on the environment
including ground water purification, reduction of carbon in the atmosphere, increase in wildlife habitat areas,
and recycling nutrients back into the soil. Some people also believe that farmland increase the amount of
open space in the country with the aesthetics and amenities open space provides. And that it also enriches
our culture by continuing the farming heritage.
Therefore, U.S. agriculture produces not only products for sale (e.g., market commodities such as corn
and soybeans), but also provides us with intangible benefits (such as national food security, positive
environmental impact, open space, and cultural heritage) that cannot be traded in markets. While farmers
are not paid for providing these intangible goods and services, everyone in our society is able to experience
agriculture’s direct and indirect benefits. Further, people may attach value to the mere existence of farms in
our country. Although it is difficult to place a monetary value or price on these intangible goods and
services, people would sorely miss these intangible benefits if they were not there.
U.S. agricultural policies have played an important role in shaping today’s agriculture. The policies
include programs/subsidies that offset the negative environmental effects of farming, enhance rural
economies, and boost farm incomes. These policies are at least partly in place in recognition of the
intangible goods and services agriculture provides to our society. While the cost of these programs/subsidies
vary year by year, the U.S. government spends on average approximately [$X billion], which translates into
about [$Y] per each person 20 years and older per year.

34
Table 5. Estimation Results for Willingness to Pay for Multifunctionality of the U.S. agriculture.
Attitude: Equation (8) WTP: Equation (9) WTP: Equation (10) WTP: Equation (11) Estimates t-values Estimates (β1) t-values Estimates (β2) t-values Estimates (β3) t-values
Constant 3.7944*** -1.8634*** -9.454 -0.0468 -0.107 -0.7377* -1.6127
Bid ___ ___ -0.0007*** -5.994 -0.0007*** -5.780 -0.0007*** -6.1917
ATT_M ___ ___ 0.2335*** 12.004 __ __ 0.1919*** 8.1576
Gov_Int -0.1035*** -6.937 -0.0733*** -6.759 -0.0591*** -5.247
F_Farms 0.2235*** 9.172 0.0501** 2.876 0.0117 0.631
Farmland 0.2217*** 12.24 0.0835*** 6.305 0.0454*** 3.170
Eco_sys 0.0073 0.932 -0.0215*** -3.819 -0.0250*** -4.286
INCOME 0.0013 0.142 0.0215*** 3.267 0.0224*** 3.312
AGE 0.0027 0.719 0.0045* 1.709 0.0042 1.562
Geographic Regions1
MIDATL -0.2707 -0.864 -0.4446* -1.983 -0.3927* -1.716
ENORCEN 0.0274 0.088 -0.4075* -1.846 -0.4068* -1.806
WNORCEN -0.3826 -1.133 -0.4665* -1.931 -0.4051* -1.634
SOUATL 0.3271 1.074 -0.4188* -1.924 -0.4852** -2.179
ESCEN -0.4163 -1.137 -0.0721 -0.278 -0.0019 -0.007
WSCEN -0.0325 -0.096 -0.4326* -1.799 -0.4289* -1.746
MOUNTAIN -0.1778 -0.525 -0.3965* -1.639 -0.3734 -1.502
PACIFIC -0.2122 -0.678 -0.5286** -2.377 -0.4911* -2.164
Ethnic Background2
BLACK -0.5646* -1.93375 -0.2589 -1.199 -0.1700 -0.768
ASIAN -0.2654 -0.89706 0.2197 1.075 0.2757 1.316
OTHERS 0.5339 0.92772 0.0795 0.192 -0.0133 -0.031
HISPANIC 0.2753 1.5882 -0.0707 -0.599 -0.1353 -1.124
R-Square 0.3479 0.1751 0.1947 0.2559 Correct Prediction(%) ___ 0.6869 0.6747 0.7093
LR (zero slopes) Test 29.4 [.000] 192.4[.000] 214[.000] 284 [.000]
Note: *** p < 0.01; **p < 0.05; * p < 0.1. 1New England was dropped as a base. 2 White was dropped as a base.

35