Walnut Nutrition Management: Getting the Best Resultsceyolo.ucanr.edu/files/200738.pdf · •...
39
Walnut Nutrition Management: Getting the Best Results Katherine Pope, Farm Advisor Yolo-Solano-Sacramento Oct 30, 2014
Transcript of Walnut Nutrition Management: Getting the Best Resultsceyolo.ucanr.edu/files/200738.pdf · •...

Walnut Nutrition Management:
Getting the Best Results
Katherine Pope, Farm Advisor Yolo-Solano-Sacramento
Oct 30, 2014

Overview • Principles of N Management
• N Budget Worksheet
• Areas for improved efficiency

Why Care? Ag 94%
groundwater N 30+% of wells
over EPA limits
94% from Crops
Images: Harter et al, 2012

4 R’s of N Management • Apply the Right Rate
• Apply at the Right Time
• Apply in the Right Place
• Using the Right Source

4 R’s of N Management
• Apply the Right Rate
• Match SUPPLY w/ tree DEMAND
• 1 ton in-shell = 40 lbs N
• Fertilizer + organic N + water

4 R’s of N Management
• Apply at the Right Time
• Match w/ timing of tree demand, root uptake
• Trees take up nutrients when needed, not when applied

20%
30%
30%
20%
Data: P. Brown, S. Muhammad

4 R’s of N Management
• Apply in the Right Place • Delivery to active roots
• N moves w/ water
• Minimize movement below root zone

Courtesy www.IPNI.org Courtesy A. Olivos, P. Brown
Surface N + 90 min irrig’t Roots in top 2 feet
N moves 6-9” in 90 min

Show worksheet


Nutrients
Kathy Kelley-Anderson et al: ANR Pub # 21623
Supply = Demand
Loss

Show worksheet

Show worksheet

Show worksheet
DEMAND

Show worksheet
DEMAND
(supply)
(supply)
(supply)

Show worksheet
DEMAND
(supply)
(supply)
(supply)
NonFert N Supply

Show worksheet
DEMAND
(supply)
(supply)
(supply)
NonFert N Supply
NonFert Demand - = Tree Needs

Show worksheet DEMAND
(supply)
(supply)
(supply)
NonFert N Supply
NonFert Demand - = Tree Needs
Need / = Effic. Amt of
Fertilizer to Apply

Hypothetical
• Jane Walnut Grower – Yield: 3 tons / ac / year – Groundwater: 12 ppm Nitrate – Compost: 5 tons / ac, 1% N – Cover Crop: 50 lbs N / ac

1. Nitrogen removed in crop
3 120

2. Nitrogen from irrigation water
12 4 29 20

3. Nitrogen from manure or compost
1 5 10 5

4. Nitrogen from cover crops
50 0.5 25

5. Total nitrogen available from nonfertilizer sources
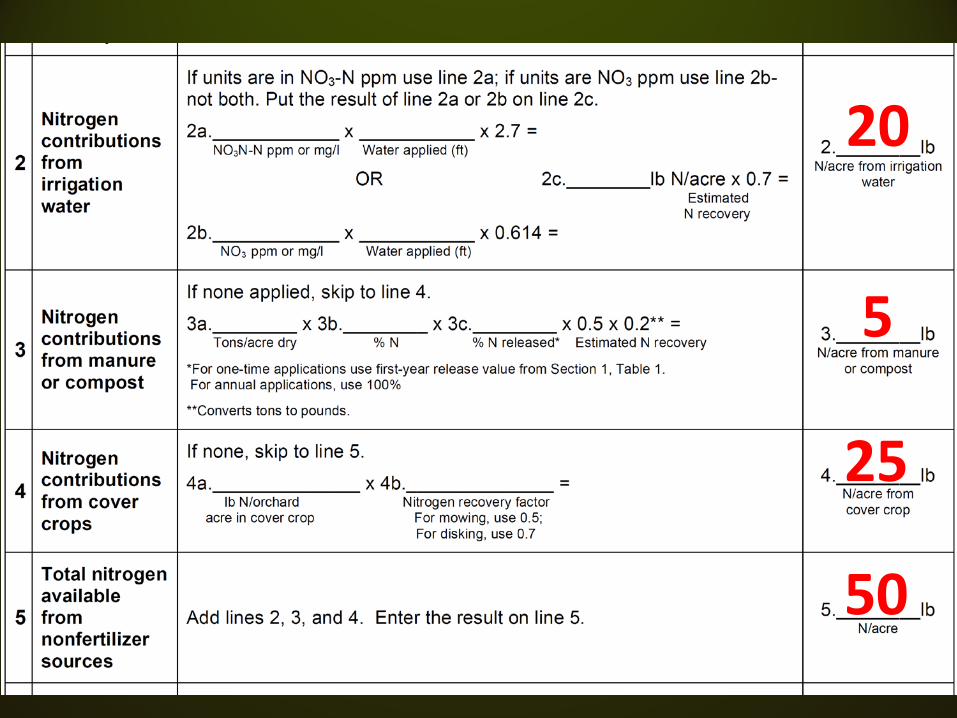
5
20
25
50

6. Additional nitrogen needed

6. Additional nitrogen needed
3 120
50
70

7. Nitrogen fertilizer application rate
70
70 0.4 175

70 0.4 175
Right Time Right Place
4 R’s of N Management
Right Rate

70 0.5 140
Right Time Right Place
4 R’s of N Management
Right Rate

4 R’s of N Management
• Apply at the Right Time
• Match w/ timing of tree demand, root uptake
• Trees take up nutrients when needed, not when applied

.20 x 140 =
28 lb/ac
.30 x 140 = 42 lb/ac
.30 x 140 = 42 lb/ac
.20 x 140 = 28 lb/ac
Data: P. Brown, S. Muhammad

4 R’s of N Management
• Apply in the Right Place • Delivery to active roots
• N moves w/ water
• Minimize movement below root zone

Courtesy www.IPNI.org Courtesy A. Olivos, P. Brown
Surface N + 90 min irrig’t Roots in top 2 feet
N moves 6-9” in 90 min

5th R – Leaf MonitoRing • Monitor impact of changing practices • Deficiencies affect crop before leaves • Protocol:
• Sample in July • Only terminal leaflets • 6-8 ft from ground, tree periphery • ~50 leaflets from area of interest,
scattered

Resources • Walnut Production Manual, ANR 3373 • Guide to Efficient Nitrogen Fertilizer Use
in Walnut Orchards, ANR 21623 • Fruit & Nut Research and Information
Center (FNRIC) fruitsandnuts.ucdavis.edu • [email protected]
• Patrick Brown, Ted DeJong, Sebastian Saa, Andres Olivos, Kathy Kelley, Joe Grant, Janine Hasey
• Funding: CWB, CDFA
Contributors