WALMART INC. -...
47
UNITED STATES SECURITIES AND EXCHANGE COMMISSION Washington, D.C. 20549 FORM 10-Q (Mark One) ý Quarterly Report Pursuant to Section 13 or 15(d) of the Securities Exchange Act of 1934. For the quarterly period ended April 30, 2018 . or o Transition Report Pursuant to Section 13 or 15(d) of the Securities Exchange Act of 1934. For the transition period from to . Commission File Number 001-6991 WALMART INC. (Exact name of registrant as specified in its charter) Delaware 71-0415188 (State or other jurisdiction of incorporation or organization) (I.R.S. Employer Identification No.) 702 S.W. 8th Street Bentonville, Arkansas 72716 (Address of principal executive offices) (Zip Code) Registrant's telephone number, including area code: (479) 273-4000 Former name, former address and former fiscal year, if changed since last report: N/A Indicate by check mark whether the registrant (1) has filed all reports required to be filed by Section 13 or 15(d) of the Securities Exchange Act of 1934 during the preceding 12 months (or such shorter periods that the registrant was required to file such reports), and (2) has been subject to such filing requirements for the past 90 days. Yes ý No o Indicate by check mark whether the registrant has submitted electronically and posted on its corporate Web site, if any, every Interactive Data File required to be submitted and posted pursuant to Rule 405 of Regulation S-T (§232.405 of this chapter) during the preceding 12 months (or for such shorter period that the registrant was required to submit and post such files). Yes ý No o Indicate by check mark whether the registrant is a large accelerated filer, an accelerated filer, a non-accelerated filer, smaller reporting company, or an emerging growth company. See definitions of "large accelerated filer," "accelerated filer," "smaller reporting company," and "emerging growth company" in Rule 12b-2 of the Exchange Act. Large Accelerated Filer ý Accelerated Filer o Non-Accelerated Filer o Smaller Reporting Company o Emerging Growth Company o If an emerging growth company, indicate by check mark if the registrant has elected not to use the extended transition period for complying with any new or revised financial accounting standards provided pursuant to Section 13(a) of the Exchange Act. o Indicate by a check mark whether the registrant is a shell company (as defined in Rule 12b-2 of the Exchange Act). Yes o No ý The registrant had 2,950,844,393 shares of common stock outstanding as of May 31, 2018.
Transcript of WALMART INC. -...

UNITED STATESSECURITIES AND EXCHANGE COMMISSION
Washington, D.C. 20549FORM 10-Q
(Mark One)
ý Quarterly Report Pursuant to Section 13 or 15(d) of the Securities Exchange Act of 1934.
For the quarterly period ended April 30, 2018 .or
o Transition Report Pursuant to Section 13 or 15(d) of the Securities Exchange Act of 1934.
For the transition period from to .Commission File Number 001-6991
WALMART INC.(Exact name of registrant as specified in its charter)
Delaware 71-0415188(State or other jurisdiction of
incorporation or organization) (I.R.S. Employer
Identification No.)
702 S.W. 8th Street
Bentonville, Arkansas 72716(Address of principal executive offices) (Zip Code)
Registrant's telephone number, including area code: (479) 273-4000Former name, former address and former fiscal year, if changed since last report: N/A
Indicate by check mark whether the registrant (1) has filed all reports required to be filed by Section 13 or 15(d) of the Securities Exchange Act of 1934 during the preceding12 months (or such shorter periods that the registrant was required to file such reports), and (2) has been subject to such filing requirements for the past 90 days. Yes ý No o
Indicate by check mark whether the registrant has submitted electronically and posted on its corporate Web site, if any, every Interactive Data File required to be submittedand posted pursuant to Rule 405 of Regulation S-T (§232.405 of this chapter) during the preceding 12 months (or for such shorter period that the registrant was required tosubmit and post such files). Yes ý No o
Indicate by check mark whether the registrant is a large accelerated filer, an accelerated filer, a non-accelerated filer, smaller reporting company, or an emerging growthcompany. See definitions of "large accelerated filer," "accelerated filer," "smaller reporting company," and "emerging growth company" in Rule 12b-2 of the Exchange Act.
Large Accelerated Filer ý Accelerated Filer o
Non-Accelerated Filer o Smaller Reporting Company o
Emerging Growth Company o
If an emerging growth company, indicate by check mark if the registrant has elected not to use the extended transition period for complying with any new or revised financialaccounting standards provided pursuant to Section 13(a) of the Exchange Act. o
Indicate by a check mark whether the registrant is a shell company (as defined in Rule 12b-2 of the Exchange Act). Yes o No ý
The registrant had 2,950,844,393 shares of common stock outstanding as of May 31, 2018.

Table of Contents
Walmart Inc.Form 10-Q
For the Quarterly Period Ended April 30, 2018
Table of Contents
Page
Part I. Financial Information Item 1. Financial Statements Condensed Consolidated Statements of Income 3
Condensed Consolidated Statements of Comprehensive Income 4
Condensed Consolidated Balance Sheets 5
Condensed Consolidated Statement of Shareholders' Equity 6
Condensed Consolidated Statements of Cash Flows 7
Notes to Condensed Consolidated Financial Statements 8
Item 2. Management's Discussion and Analysis of Financial Condition and Results of Operations 20
Item 3. Quantitative and Qualitative Disclosures About Market Risk 33
Item 4. Controls and Procedures 34
Part II. Other Information Item 1. Legal Proceedings 35
Item 1A. Risk Factors 37
Item 2. Unregistered Sales of Equity Securities and Use of Proceeds 37
Item 5. Other Information 37
Item 6. Exhibits 39
Signatures 40
2

Table of Contents
PART I. FINANCIAL INFORMATIONItem 1. Financial Statements
Walmart Inc.Condensed Consolidated Statements of Income
(Unaudited)
Three Months Ended
April 30,
(Amounts in millions, except per share data) 2018 2017Revenues:
Net sales $ 121,630 $ 116,526
Membership and other income 1,060 1,016
Total revenues 122,690 117,542
Costs and expenses: Cost of sales 91,707 87,688
Operating, selling, general and administrative expenses 25,829 24,617
Operating income 5,154 5,237
Interest: Debt 437 506
Capital lease and financing obligations 93 92
Interest income (43) (35)
Interest, net 487 563
Unrealized (gains) and losses 1,845 —
Income before income taxes 2,822 4,674
Provision for income taxes 546 1,522
Consolidated net income 2,276 3,152
Consolidated net income attributable to noncontrolling interest (142) (113)
Consolidated net income attributable to Walmart $ 2,134 $ 3,039
Net income per common share:
Basic net income per common share attributable to Walmart $ 0.72 $ 1.00
Diluted net income per common share attributable to Walmart 0.72 1.00
Weighted-average common shares outstanding:
Basic 2,950 3,035
Diluted 2,967 3,047
Dividends declared per common share $ 2.08 $ 2.04
See accompanying notes.
3

Table of Contents
Walmart Inc.Condensed Consolidated Statements of Comprehensive Income
(Unaudited)
Three Months Ended
April 30,
(Amounts in millions) 2018 2017
Consolidated net income $ 2,276 $ 3,152
Consolidated net income attributable to noncontrolling interest (142) (113)
Consolidated net income attributable to Walmart 2,134 3,039
Other comprehensive income (loss), net of income taxes
Currency translation and other 1,465 1,159
Net investment hedges 68 (113)
Cash flow hedges (77) 28
Minimum pension liability 43 5
Unrealized gain on available-for-sale securities — 481
Other comprehensive income (loss), net of income taxes 1,499 1,560
Other comprehensive (income) loss attributable to noncontrolling interest (163) (282)
Other comprehensive income (loss) attributable to Walmart 1,336 1,278
Comprehensive income, net of income taxes 3,775 4,712
Comprehensive (income) loss attributable to noncontrolling interest (305) (395)
Comprehensive income attributable to Walmart $ 3,470 $ 4,317
See accompanying notes.
4

Table of Contents
Walmart Inc.Condensed Consolidated Balance Sheets
(Unaudited)
April 30, January 31, April 30,
(Amounts in millions) 2018 2018 2017ASSETS Current assets:
Cash and cash equivalents $ 7,885 $ 6,756 $ 6,545
Receivables, net 4,568 5,614 5,252
Inventories 43,303 43,783 43,361
Prepaid expenses and other 3,486 3,511 2,178
Total current assets 59,242 59,664 57,336
Property and equipment: Property and equipment 187,029 185,154 181,075
Less accumulated depreciation (79,407) (77,479) (73,625)
Property and equipment, net 107,622 107,675 107,450
Property under capital lease and financing obligations: Property under capital lease and financing obligations 12,735 12,703 11,854
Less accumulated amortization (5,557) (5,560) (5,135)
Property under capital lease and financing obligations, net 7,178 7,143 6,719
Goodwill 18,850 18,242 17,575
Other long-term assets 12,035 11,798 10,638
Total assets $ 204,927 $ 204,522 $ 199,718
LIABILITIES AND EQUITY Current liabilities:
Short-term borrowings $ 7,762 $ 5,257 $ 2,617
Accounts payable 44,612 46,092 41,367
Dividends payable 4,607 — 4,628
Accrued liabilities 20,782 22,122 19,708
Accrued income taxes 718 645 2,018
Long-term debt due within one year 1,576 3,738 3,256
Capital lease and financing obligations due within one year 700 667 599
Total current liabilities 80,757 78,521 74,193
Long-term debt 29,477 30,045 33,774
Long-term capital lease and financing obligations 6,828 6,780 6,251
Deferred income taxes and other 9,541 8,354 9,386
Commitments and contingencies Equity:
Common stock 294 295 302
Capital in excess of par value 2,557 2,648 2,223
Retained earnings 82,982 85,107 84,120
Accumulated other comprehensive loss (10,281) (10,181) (12,954)
Total Walmart shareholders' equity 75,552 77,869 73,691
Noncontrolling interest 2,772 2,953 2,423
Total equity 78,324 80,822 76,114
Total liabilities and equity $ 204,927 $ 204,522 $ 199,718
See accompanying notes.

5

Table of Contents
Walmart Inc.Condensed Consolidated Statement of Shareholders' Equity
(Unaudited)
Accumulated Total Capital in Other Walmart
(Amounts in millions)
Common Stock Excess of Retained Comprehensive Shareholders' Noncontrolling Total
Shares Amount Par Value Earnings Loss Equity Interest EquityBalances as of February 1, 2018 2,952 $ 295 $ 2,648 $ 85,107 $ (10,181) $ 77,869 $ 2,953 $ 80,822Adoption of new accounting standards on February 1,2018, net of income taxes — — — 2,361 (1,436) 925 (1) 924
Consolidated net income — — — 2,134 — 2,134 142 2,276
Other comprehensive income (loss), net of income taxes — — — — 1,336 1,336 163 1,499
Cash dividends declared ($2.08 per share) — — — (6,135) — (6,135) — (6,135)
Purchase of Company stock (5) (1) (15) (492) — (508) — (508)
Cash dividend declared to noncontrolling interest — — — — — — (489) (489)Other 4 — (76) 7 — (69) 4 (65)
Balances as of April 30, 2018 2,951 $ 294 $ 2,557 $ 82,982 $ (10,281) $ 75,552 $ 2,772 $ 78,324
See accompanying notes.
6

Table of Contents
Walmart Inc.Condensed Consolidated Statements of Cash Flows
(Unaudited)
Three Months Ended April 30,
(Amounts in millions) 2018 2017Cash flows from operating activities:
Consolidated net income $ 2,276 $ 3,152
Adjustments to reconcile consolidated net income to net cash provided by operating activities: Depreciation and amortization 2,678 2,551
Deferred income taxes (50) 2
Unrealized (gains) and losses 1,845 —
Other operating activities 265 (170)
Changes in certain assets and liabilities, net of effects of acquisitions: Receivables, net 1,134 726
Inventories 547 66
Accounts payable (1,770) (155)
Accrued liabilities (1,813) (1,838)
Accrued income taxes 49 1,051
Net cash provided by operating activities 5,161 5,385
Cash flows from investing activities:
Payments for property and equipment (1,818) (1,990)
Proceeds from the disposal of property and equipment 198 196
Payments for business acquisitions, net of cash acquired — (88)Other investing activities (62) 21
Net cash used in investing activities (1,682) (1,861)
Cash flows from financing activities:
Net change in short-term borrowings 2,501 1,482
Repayments of long-term debt (2,521) (1,513)
Dividends paid (1,533) (1,549)
Purchase of Company stock (539) (2,185)
Dividends paid to noncontrolling interest (66) (54)
Purchase of noncontrolling interest — (8)
Other financing activities (328) (145)
Net cash used in financing activities (2,486) (3,972)
Effect of exchange rates on cash, cash equivalents and restricted cash (1) 143 139
Net increase (decrease) in cash, cash equivalents and restricted cash (1) 1,136 (309)
Cash, cash equivalents and restricted cash (1) at beginning of year 7,014 7,144
Cash, cash equivalents and restricted cash (1) at end of period $ 8,150 $ 6,835
(1) Restricted cash held outside of cash and cash equivalents is primarily recorded in other-long term assets.
See accompanying notes.
7

Table of Contents
Walmart Inc.Notes to Condensed Consolidated Financial Statements
Note 1. Accounting Policies
Basis of PresentationThe Condensed Consolidated Financial Statements of Walmart Inc. and its subsidiaries ("Walmart" or the "Company") and the accompanying notes included inthis Quarterly Report on Form 10-Q are unaudited. In the opinion of management, all adjustments necessary for the fair presentation of the CondensedConsolidated Financial Statements have been included. Such adjustments are of a normal, recurring nature. The Condensed Consolidated Financial Statements, andthe accompanying notes, are prepared in accordance with generally accepted accounting principles in the United States ("GAAP") and do not contain certaininformation included in the Company's Annual Report on Form 10-K for the fiscal year ended January 31, 2018 ("fiscal 2018"). Therefore, the interim CondensedConsolidated Financial Statements should be read in conjunction with that Annual Report on Form 10-K .The Company's Condensed Consolidated Financial Statements are based on a fiscal year ending January 31 for the United States ("U.S.") and Canadian operations.The Company consolidates all other operations generally using a one-month lag and based on a calendar year. There were no intervening events during the monthof April related to the operations consolidated using a lag that materially affected the Condensed Consolidated Financial Statements.The Company's business is seasonal to a certain extent due to calendar events and national and religious holidays, as well as weather patterns. Historically, theCompany's highest sales volume and operating income have occurred in the fiscal quarter ending January 31.
InventoriesAt April 30, 2018 and January 31, 2018 , the Company's inventories valued at LIFO approximated those inventories as if they were valued at FIFO.
Fair Value MeasurementIn January 2016, the Financial Accounting Standards Board ("FASB") issued Accounting Standards Update ("ASU") 2016-01, Financial Instruments–Overall (Topic 825) , which updates certain aspects of recognition, measurement, presentation and disclosure of financial instruments ("ASU 2016-01"). The Companyadopted this ASU on February 1, 2018, which primarily impacts the Company's accounting for its investment in JD.com ("JD") and resulted in a positiveadjustment to retained earnings of approximately $2.6 billion , net of tax, based on the market value of the Company's investment in JD at January 31, 2018. Theadoption requires changes in fair value of the Company's investment in JD to be recorded in the Condensed Consolidated Statement of Income.The Company records and discloses certain financial and non-financial assets and liabilities at fair value. The fair value of an asset is the price at which the assetcould be sold in an orderly transaction between unrelated, knowledgeable and willing parties able to engage in the transaction. The fair value of a liability is theamount that would be paid to transfer the liability to a new obligor in a transaction between such parties, not the amount that would be paid to settle the liabilitywith the creditor. Refer to Note 5 for additional fair value disclosures.
Revenue RecognitionIn May 2014, the FASB issued ASU 2014-09, Revenue from Contracts with Customers (Topic 606). This ASU is a comprehensive new revenue recognition modelthat requires a company to recognize revenue to depict the transfer of goods or services to a customer at an amount that reflects the consideration it expects toreceive in exchange for those goods or services. The Company adopted the ASU on February 1, 2018, using the modified retrospective approach and applied theASU only to contracts not completed as of February 1, 2018. Updated accounting policies and other disclosures are below. Note 11 provides the relateddisaggregated revenue disclosures. The impact of adopting the ASU was not material to the Condensed Consolidated Financial Statements.
SalesThe Company recognizes sales revenue, net of sales taxes and estimated sales returns, at the time it sells merchandise to the customer. eCommerce sales includeshipping revenue and are recorded upon delivery to the customer. Additionally, estimated sales returns are calculated based on expected returns.
8

Table of Contents
Membership Fee RevenueThe Company recognizes membership fee revenue both in the U.S. and internationally over the term of the membership, which is typically 12 months.Membership fee revenue is included in membership and other income in the Company's Condensed Consolidated Statements of Income. The deferred membershipfee is included in accrued liabilities in the Company's Condensed Consolidated Balance Sheets.
Gift cardsCustomer purchases of gift cards, to be utilized at the Company's stores or eCommerce websites, are not recognized as sales until the card is redeemed and thecustomer purchases merchandise using the gift card. Gift cards in the U.S. and some countries do not carry an expiration date; therefore, customers and memberscan redeem their gift cards for merchandise indefinitely. Gift cards in some foreign countries where the Company does business have expiration dates. While giftcards are generally redeemed within 12 months, a certain number of gift cards, both with and without expiration dates, will not be fully redeemed. Managementestimates unredeemed gift cards and recognizes revenue for these amounts in membership and other income in the Company's Condensed Consolidated Statementsof Income over the expected redemption period. Management periodically reviews and updates its estimates.
Financial and Other ServicesThe Company recognizes revenue from service transactions at the time the service is performed. Generally, revenue from services is classified as a component ofnet sales in the Company's Condensed Consolidated Statements of Income.
Contract BalancesContract balances as a result of transactions with customers primarily consist of receivables included in receivables, net, and deferred gift card revenue included inaccrued liabilities in the Company's Condensed Consolidated Balance Sheets. The following table provides the Company's receivables and deferred gift cardrevenue from transactions with customers:
(Amounts in millions) As of April 30, 2018Assets:
Receivables from transactions with customers, net $ 2,025
Liabilities: Deferred gift card revenue $ 2,014
The Company did not record any significant impairment charges to receivables from transactions with customers during the three months ended April 30, 2018 .An immaterial amount of the February 1, 2018, deferred gift card revenue liability was recognized into revenue during the three months ended April 30, 2018 .
Income taxesIn December 2017, the Securities and Exchange Commission (SEC) staff issued Staff Accounting Bulletin No. 118, Income Tax Accounting Implications of theTax Cuts and Jobs Act ("SAB 118"), in response to the Tax Cuts and Jobs Act of 2017 ("Tax Act"). The Company recorded a provisional benefit, as allowed bySAB 118, of $207 million during fiscal 2018 and an additional provisional benefit of $142 million during the three months ended April 30, 2018. Management isstill evaluating the Tax Act, but expects to complete the analysis within the allowable measurement period of one year from the enactment date.In February 2018, the FASB issued Accounting Standards Update ASU 2018-02, Income Statement–Reporting Comprehensive Income (Topic 220):Reclassification of Certain Tax Effects from Accumulated Other Comprehensive Income ("ASU 2018-02"). The ASU provides that the stranded tax effects from theTax Act in accumulated other comprehensive loss may be reclassified to retained earnings. The Company adopted this ASU on February 1, 2018, which resulted inan immaterial negative adjustment to retained earnings.
Restricted cashIn November 2016, the FASB issued ASU 2016-18, Statement of Cash Flows–Restricted Cash (Topic 230) , which requires restricted cash to be included with cashand cash equivalents when reconciling the beginning and ending amounts on the statement of cash flows. The Company adopted this ASU on February 1, 2018.Restricted cash held outside of cash and cash equivalents is primarily recorded in other-long term assets in the Condensed Consolidated Balance Sheets and wasapproximately $0.3 billion as of April 30, 2018 , January 31, 2018 and April 30, 2017 .
9

Table of Contents
Recent Accounting PronouncementsIn February 2016, the FASB issued ASU 2016-02, Leases (Topic 842) , which requires lease assets and liabilities to be recorded on the balance sheet. Certainqualitative and quantitative disclosures are also required, as well as retrospective recognition and measurement of impacted leases. The Company will adopt thisASU on February 1, 2019 and is implementing new lease systems in connection with the adoption. Management is progressing with implementation andcontinuing to evaluate the effect to the Company's Condensed Consolidated Financial Statements and disclosures. Management expects a material impact to theCompany's Condensed Consolidated Balance Sheet.In June 2016, the FASB issued ASU 2016-13, Financial Instruments–Credit Losses (Topic 326) , which modifies the measurement of expected credit losses ofcertain financial instruments. The Company will adopt this ASU on February 1, 2020. Management is currently evaluating this ASU to determine its impact to theCompany's Condensed Consolidated Financial Statements and disclosures.
Note 2. Net Income Per Common ShareBasic net income per common share attributable to Walmart is based on the weighted-average common shares outstanding during the relevant period. Diluted netincome per common share attributable to Walmart is based on the weighted-average common shares outstanding during the relevant period adjusted for the dilutiveeffect of share-based awards. The Company did not have significant share-based awards outstanding that were anti-dilutive and not included in the calculation ofdiluted net income per common share attributable to Walmart for the three months ended April 30, 2018 and 2017 . The following table provides a reconciliation ofthe numerators and denominators used to determine basic and diluted net income per common share attributable to Walmart:
Three Months Ended April 30,
(Amounts in millions, except per share data) 2018 2017Numerator
Consolidated net income $ 2,276 $ 3,152
Consolidated net income attributable to noncontrolling interest (142) (113)
Consolidated net income attributable to Walmart $ 2,134 $ 3,039
Denominator
Weighted-average common shares outstanding, basic 2,950 3,035
Dilutive impact of stock options and other share-based awards 17 12
Weighted-average common shares outstanding, diluted 2,967 3,047
Net income per common share attributable to Walmart
Basic $ 0.72 $ 1.00Diluted 0.72 1.00
10

Table of Contents
Note 3. Accumulated Other Comprehensive LossThe following table provides the changes in the composition of total accumulated other comprehensive loss for the three months ended April 30, 2018 :
(Amounts in millions and net of income taxes)
Currency Translation and
Other
Unrealized Gain onAvailable-for-Sale
Securities Net Investment
Hedges Cash Flow
Hedges
Minimum Pension Liability Total
Balances as of February 1, 2018 $ (12,136) $ 1,646 $ 1,030 $ 122 $ (843) $ (10,181)Adoption of new accounting standards on February 1,2018 (1) (2) 89 (1,646) 93 28 — (1,436)
Other comprehensive income (loss) beforereclassifications, net (1) 1,302 — 68 (86) 32 1,316
Reclassifications to income, net (1) — — — 9 11 20
Balances as of April 30, 2018 $ (10,745) $ — $ 1,191 $ 73 $ (800) $ (10,281)
(1) Income tax impact is immaterial
(2) Primarily relates to the adoption of ASU 2016-01 and ASU 2018-02
Amounts reclassified from accumulated other comprehensive loss to net income for derivative instruments are recorded in interest, net, in the Company'sCondensed Consolidated Statements of Income, and amounts reclassified for the minimum pension liability are recorded in unrealized gains and losses in theCompany's Condensed Consolidated Statements of Income.
Note 4. Long-term DebtThe following table provides the changes in the Company's long-term debt for the three months ended April 30, 2018 :
(Amounts in millions) Long-term debt due
within one year Long-term debt TotalBalances as of February 1, 2018 $ 3,738 $ 30,045 $ 33,783
Repayments of long-term debt (2,521) — (2,521)
Reclassifications of long-term debt 364 (364) —
Other (5) (204) (209)Balances as of April 30, 2018 $ 1,576 $ 29,477 $ 31,053
MaturitiesThe following table provides details of debt repayments during the three months ended April 30, 2018 :
(Amounts in millions)
Maturity Date Principal Amount Fixed vs. Floating Interest Rate Repayment
February 15, 2018 500 USD Fixed 5.800% $ 500
February 15, 2018 750 USD Fixed 5.800% 750
April 11, 2018 1,250 USD Fixed 1.125% 1,250
Various 21 USD Various Various 21
Total repayment of matured debt $ 2,521
11

Table of Contents
Note 5. Fair Value MeasurementsAssets and liabilities recorded at fair value are measured using the fair value hierarchy, which prioritizes the inputs used in measuring fair value. The levels of thefair value hierarchy are:
• Level 1: observable inputs such as quoted prices in active markets;• Level 2: inputs other than quoted prices in active markets that are either directly or indirectly observable; and• Level 3: unobservable inputs for which little or no market data exists, therefore requiring the Company to develop its own assumptions.
The Company has equity investments, primarily its investment in JD, measured at fair value on a recurring basis included in other long-term assets in theaccompanying Condensed Consolidated Balance Sheet. Beginning in fiscal 2019 due to the adoption of the new financial instrument standard, changes in fair valueare recorded in unrealized gains and losses on the Condensed Consolidated Statements of Income. Additional detail about the Company's two portions of theinvestment in JD are as follows:
• The purchased portion of the investment in JD is measured using Level 1 inputs, which prior to fiscal 2019 was classified as available-for-sale withchanges in fair value recognized through other comprehensive income; and
• The portion of the investment in JD received in exchange for selling certain assets related to Yihaodian, the Company's former eCommerce operations inChina, is measured using Level 2 inputs. Fair value is determined primarily using quoted prices in active markets for similar assets. Prior to fiscal 2019,the investment was carried at cost.
The investment in JD cost basis, fair value at April 30, 2018 and February 1, 2018, and carrying value at January 31, 2018 , are as follows:
(Amounts in millions) Cost Basis Carrying Value as of
January 31, 2018 Fair Value as of
February 1, 2018 Fair Value as ofApril 30, 2018
Investment in JD measured using Level 1 inputs $ 1,901 $ 3,547 $ 3,547 (1) $ 2,631
Investment in JD measured using Level 2 inputs 1,490 1,490 3,559 (2) 2,637 Total $ 3,391 $ 5,037 $ 7,106 $ 5,268 (3)
(1) Fair value was already recognized on the balance sheet. Upon adoption of the new financial instrument standard on February 1, 2018, the excess of fair value over cost was reclassified fromaccumulated other comprehensive loss to retained earnings.
(2) Upon adoption of the new financial instrument standard on February 1, 2018, the excess of fair value over cost was recognized by increasing the carrying value of the asset and retainedearnings.
(3) The decrease in fair value from February 1, 2018 to April 30, 2018 of $ 1.8 billion was recognized in net income and included in unrealized gains and losses on the Condensed ConsolidatedStatements of Income.
The Company also holds derivative instruments. Derivative fair values are the estimated amounts the Company would receive or pay upon termination of therelated derivative agreements as of the reporting dates. The fair values have been measured using the income approach and Level 2 inputs, which include therelevant interest rate and foreign currency forward curves. As of April 30, 2018 and January 31, 2018 , the notional amounts and fair values of these derivativeswere as follows:
April 30, 2018 January 31, 2018
(Amounts in millions)NotionalAmount Fair Value
NotionalAmount Fair Value
Receive fixed-rate, pay variable-rate interest rate swaps designated as fair value hedges $ 4,000 $ (145) $ 4,000 $ (91)
Receive fixed-rate, pay fixed-rate cross-currency swaps designated as net investment hedges 2,250 217 2,250 208
Receive fixed-rate, pay fixed-rate cross-currency swaps designated as cash flow hedges 4,395 131 4,523 205
Total $ 10,645 $ 203 $ 10,773 $ 322
Nonrecurring Fair Value MeasurementsIn addition to assets and liabilities that are recorded at fair value on a recurring basis, the Company's assets and liabilities are also subject to nonrecurring fair valuemeasurements. Generally, assets are recorded at fair value on a nonrecurring basis as a result of impairment charges. The Company did not record any significantimpairment charges to assets measured at fair value on a nonrecurring basis during the three months ended April 30, 2018 . For the fiscal year ended January 31,2018 , the Company recorded impairment charges related to assets measured at fair value on a non-recurring basis of approximately $1.4 billion primarily relatedto restructuring charges for the Sam's Club closures and the wind-down of the Brazil first-party eCommerce business, as well as discontinued real estate projects inthe U.S. and decisions to exit certain international properties.
12

Table of Contents
Other Fair Value DisclosuresThe Company records cash and cash equivalents, restricted cash, and short-term borrowings at cost. The carrying values of these instruments approximate their fairvalue due to their short-term maturities.The Company's long-term debt is also recorded at cost. The fair value is estimated using Level 2 inputs based on the Company's current incremental borrowing ratefor similar types of borrowing arrangements. The carrying value and fair value of the Company's long-term debt as of April 30, 2018 and January 31, 2018 , are asfollows:
April 30, 2018 January 31, 2018
(Amounts in millions) Carrying Value Fair Value Carrying Value Fair ValueLong-term debt, including amounts due within one year $ 31,053 $ 34,770 $ 33,783 $ 38,766
Note 6. Derivative Financial InstrumentsThe Company uses derivative financial instruments for hedging and non-trading purposes to manage its exposure to changes in interest and currency exchangerates, as well as to maintain an appropriate mix of fixed- and variable-rate debt. Use of derivative financial instruments in hedging programs subjects the Companyto certain risks, such as market and credit risks. Market risk represents the possibility that the value of the derivative financial instrument will change. In a hedgingrelationship, the change in the value of the derivative financial instrument is offset to a great extent by the change in the value of the underlying hedged item.Credit risk related to a derivative financial instrument represents the possibility that the counterparty will not fulfill the terms of the contract. The notional, orcontractual, amount of the Company's derivative financial instruments is used to measure interest to be paid or received and does not represent the Company'sexposure due to credit risk. Credit risk is monitored through established approval procedures, including setting concentration limits by counterparty, reviewingcredit ratings and requiring collateral (generally cash) from the counterparty when appropriate.The Company only enters into derivative transactions with counterparties rated "A-" or better by nationally recognized credit rating agencies. Subsequent toentering into derivative transactions, the Company regularly monitors the credit ratings of its counterparties. In connection with various derivative agreements,including master netting arrangements, the Company held cash collateral from counterparties of $256 million and $279 million at April 30, 2018 and January 31,2018 , respectively. The Company records cash collateral received as amounts due to the counterparties exclusive of any derivative asset. Furthermore, as part ofthe master netting arrangements with each of these counterparties, the Company is also required to post collateral with a counterparty if the Company's netderivative liability position exceeds $150 million with such counterparties. The Company did not have any cash collateral posted with counterparties at April 30,2018 or January 31, 2018 . The Company records cash collateral it posts with counterparties as amounts receivable from those counterparties exclusive of anyderivative liability.The contractual terms of the Company's hedged instruments closely mirror those of the hedged items, providing a high degree of risk reduction and correlation.Contracts that are effective at meeting the risk reduction and correlation criteria are recorded using hedge accounting. If a derivative financial instrument isrecorded using hedge accounting, depending on the nature of the hedge, changes in the fair value of the instrument will either be offset against the change in fairvalue of the hedged assets, liabilities or firm commitments through earnings or be recognized in accumulated other comprehensive loss until the hedged item isrecognized in earnings. Any hedge ineffectiveness is immediately recognized in earnings. The Company's net investment and cash flow instruments are highlyeffective hedges and the ineffective portion has not been, and is not expected to be, significant. Instruments that do not meet the criteria for hedge accounting, orcontracts for which the Company has not elected hedge accounting, are recorded at fair value with unrealized gains or losses reported in earnings during the periodof the change.Fair Value InstrumentsThe Company is a party to receive fixed-rate, pay variable-rate interest rate swaps that the Company uses to hedge the fair value of fixed-rate debt. The notionalamounts are used to measure interest to be paid or received and do not represent the Company's exposure due to credit loss. The Company's interest rate swaps thatreceive fixed-interest rate payments and pay variable-interest rate payments are designated as fair value hedges. As the specific terms and notional amounts of thederivative instruments match those of the fixed-rate debt being hedged, the derivative instruments are assumed to be perfectly effective hedges. Changes in the fairvalues of these derivative instruments are recorded in earnings, but are offset by corresponding changes in the fair values of the hedged items, also recorded inearnings, and, accordingly, do not impact the Company's Condensed Consolidated Statements of Income. These fair value instruments will mature on dates rangingfrom October 2020 to April 2024 .
13

Table of Contents
Net Investment InstrumentsThe Company is a party to cross-currency interest rate swaps that the Company uses to hedge its net investments. The agreements are contracts to exchange fixed-rate payments in one currency for fixed-rate payments in another currency. All changes in the fair value of these instruments are recorded in accumulated othercomprehensive loss, offsetting the currency translation adjustment of the related investment that is also recorded in accumulated other comprehensive loss. Theseinstruments will mature on dates ranging from July 2020 to February 2030 .The Company has issued foreign-currency-denominated long-term debt as hedges of net investments of certain of its foreign operations. These foreign-currency-denominated long-term debt issuances are designated and qualify as nonderivative hedging instruments. Accordingly, the foreign currency translation of these debtinstruments is recorded in accumulated other comprehensive loss, offsetting the foreign currency translation adjustment of the related net investments that is alsorecorded in accumulated other comprehensive loss. At April 30, 2018 and January 31, 2018 , the Company had ¥180 billion of outstanding long-term debtdesignated as a hedge of its net investment in Japan, as well as outstanding long-term debt of £1.7 billion at April 30, 2018 and January 31, 2018 , that wasdesignated as a hedge of its net investment in the United Kingdom. These nonderivative net investment hedges will mature on dates ranging from July 2020 toJanuary 2039 .Cash Flow InstrumentsThe Company is a party to receive fixed-rate, pay fixed-rate cross-currency interest rate swaps to hedge the currency exposure associated with the forecastedpayments of principal and interest of certain non-U.S. denominated debt. The swaps are designated as cash flow hedges of the currency risk related to payments onthe non-U.S. denominated debt. The effective portion of changes in the fair value of derivatives designated as cash flow hedges of foreign exchange risk isrecorded in accumulated other comprehensive loss and is subsequently reclassified into earnings in the period that the hedged forecasted transaction affectsearnings. The hedged items are recognized foreign currency-denominated liabilities that are re-measured at spot exchange rates each period, and the assessment ofeffectiveness (and measurement of any ineffectiveness) is based on total changes in the related derivative's cash flows. As a result, the amount reclassified intoearnings each period includes an amount that offsets the related transaction gain or loss arising from that re-measurement and the adjustment to earnings for theperiod's allocable portion of the initial spot-forward difference associated with the hedging instrument. These cash flow instruments will mature on dates rangingfrom April 2022 to March 2034 .Financial Statement PresentationAlthough subject to master netting arrangements, the Company does not offset derivative assets and derivative liabilities in its Condensed Consolidated BalanceSheets. Derivative instruments with an unrealized gain are recorded in the Company's Condensed Consolidated Balance Sheets as either current or non-currentassets, based on maturity date, and those hedging instruments with an unrealized loss are recorded as either current or non-current liabilities, based on maturitydate. Refer to Note 5 for the net presentation of the Company's derivative instruments.The Company's derivative instruments, as well as its nonderivative debt instruments designated and qualifying as net investment hedges, were classified as followsin the Company's Condensed Consolidated Balance Sheets:
April 30, 2018 January 31, 2018
(Amounts in millions)Fair Value Instruments
Net Investment Instruments
Cash Flow Instruments
Fair Value Instruments
Net InvestmentInstruments
Cash Flow Instruments
Derivative instruments Derivative assets: Other long-term assets $ — $ 217 $ 252 $ — $ 208 $ 300
Derivative liabilities: Deferred income taxes and other 145 — 121 91 — 95
Nonderivative hedging instruments Long-term debt — 3,975 — — 4,041 —
Gains and losses related to the Company's derivatives primarily relate to interest rate hedges, which are recorded in interest, net, in the Company's CondensedConsolidated Statements of Income. Amounts related to the Company's derivatives expected to be reclassified from accumulated other comprehensive loss to netincome during the next 12 months are not significant.
14

Table of Contents
Note 7. Share RepurchasesFrom time to time, the Company repurchases shares of its common stock under share repurchase programs authorized by the Company's Board of Directors. Allrepurchases made during the three months ended April 30, 2018 were made under the plan in effect at the beginning of the fiscal year. The current $20.0 billionshare repurchase program approved in October 2017 has no expiration date or other restrictions limiting the period over which the Company can make sharerepurchases. As of April 30, 2018 , authorization for $18.3 billion of share repurchases remained under the current share repurchase program. Any repurchasedshares are constructively retired and returned to an unissued status.The Company considers several factors in determining when to execute share repurchases, including, among other things, current cash needs, capacity for leverage,cost of borrowings and the market price of its common stock. The following table provides, on a settlement date basis, the number of shares repurchased, averageprice paid per share and total amount paid for share repurchases for the three months ended April 30, 2018 and 2017 :
Three Months Ended April 30,
(Amounts in millions, except per share data) 2018 2017Total number of shares repurchased 5.5 31.1
Average price paid per share $ 97.75 $ 70.25
Total amount paid for share repurchases $ 539 $ 2,185
Note 8. Common Stock Dividends
Dividends DeclaredOn February 20, 2018 , the Board of Directors approved the fiscal year ending January 31, 2019 ("fiscal 2019 ") annual dividend of $2.08 per share, an increaseover the fiscal 2018 annual dividend of $2.04 per share. For fiscal 2019 , the annual dividend will be paid in four quarterly installments of $0.52 per share,according to the following record and payable dates:
Record Date Payable DateMarch 9, 2018 April 2, 2018May 11, 2018 June 4, 2018August 10, 2018 September 4, 2018December 7, 2018 January 2, 2019
The dividend installments payable on April 2, 2018 and June 4, 2018 were paid as scheduled.
Note 9. ContingenciesLegal ProceedingsThe Company is involved in a number of legal proceedings. The Company has made accruals with respect to these matters, where appropriate, which are reflectedin the Company's Condensed Consolidated Financial Statements. For some matters, a liability is not probable or the amount cannot be reasonably estimated andtherefore an accrual has not been made. However, where a liability is reasonably possible and may be material, such matters have been disclosed. The Companymay enter into discussions regarding settlement of these matters, and may enter into settlement agreements, if it believes settlement is in the best interest of theCompany and its shareholders.Unless stated otherwise, the matters discussed below, if decided adversely to or settled by the Company, individually or in the aggregate, may result in a liabilitymaterial to the Company's financial condition or results of operations.
ASDA Equal Value ClaimsASDA Stores Ltd. ("Asda"), a wholly-owned subsidiary of the Company, is a defendant in over 10,000 equal value ("Equal Value") claims that begun in 2008 andare proceeding before an Employment Tribunal in Manchester (the "Employment Tribunal") in the United Kingdom ("UK") on behalf of current and former Asdastore employees, and further claims may be asserted in the future. The claimants allege that the work performed by female employees in Asda's retail stores is ofequal value in terms of, among other things, the demands of their jobs compared to that of male employees working in Asda's warehouse and distribution facilities,and that the disparity in pay between these different job positions is not objectively justified. As a result, claimants are requesting differential back pay based onhigher wage rates in the warehouse and distribution facilities and higher wage rates on a prospective basis.On March 23, 2015, Asda asked the Employment Tribunal to stay all proceedings and to "strike out" substantially all of the claims because the claimants had notadhered to the Tribunal's procedural rule for including multiple claimants on the same claim form. On July 23, 2015, the Employment Tribunal denied Asda'srequests. Following additional proceedings, on June 20, 2017, the Employment Appeal Tribunal ruled in favor of Asda on the "strike out" issue and remitted thematter to the
15

Table of Contents
Employment Tribunal to determine whether the improperly filed claims should be struck out. On July 12, 2017, claimants sought permission from the Court ofAppeals to appeal this ruling, which was granted on October 3, 2017. A hearing before the Court of Appeals is scheduled for October 23, 2018.As to the initial phase of the Equal Value claims, on October 14, 2016, following a preliminary hearing, the Employment Tribunal ruled that claimants couldcompare their positions in Asda's retail stores with those of employees in Asda's warehouse and distribution facilities. On August 31, 2017, the EmploymentAppeal Tribunal affirmed the Employment Tribunal's ruling. The Employment Appeal Tribunal also granted permission for Asda to appeal substantially all of itsfindings on August 31, 2017. Asda sought permission to appeal the remainder of the Employment Appeal Tribunal's findings to the Court of Appeals on September21, 2017. A hearing before the Court of Appeals is scheduled for October 10, 2018.Claimants are now proceeding in the next phase of their claims. That phase will determine whether the work performed by the claimants is of equal value to thework performed by employees in Asda's warehouse and distribution facilities.At present, the Company cannot predict the number of such claims that may be filed, and cannot reasonably estimate any loss or range of loss that may arise fromthese proceedings. The Company believes it has substantial factual and legal defenses to these claims, and intends to defend the claims vigorously.
National Prescription Opiate Litigation and Related MattersIn December 2017, the United States Judicial Panel on Multidistrict Litigation ordered numerous lawsuits filed against a wide array of defendants by variousplaintiffs be consolidated, including counties, cities, healthcare providers, Native American tribes, and third-party payors, asserting claims generally concerning theimpacts of widespread opioid abuse. The consolidated multidistrict litigation is entitled In re National Prescription Opiate Litigation (MDL No. 2804) , and ispending in the U.S. District Court for the Northern District of Ohio. The Company is named as a defendant in some of the cases included in this multidistrictlitigation. Similar cases that name the Company have been filed in state courts by various counties and municipalities; by health care providers; and by variousNative American Tribes. The relief sought by various plaintiffs is compensatory and punitive damages, as well as injunctive relief including abatement. TheCompany cannot predict the number of such claims that may be filed, and cannot reasonably estimate any loss or range of loss that may arise from such claims.The Company believes it has substantial factual and legal defenses to these claims, and intends to defend the claims vigorously. The Company has also beenresponding to subpoenas, information requests and investigations from governmental entities related to nationwide controlled substance dispensing practicesinvolving the sale of opioids. The Company can provide no assurance as to the scope and outcome of these matters and no assurance as to whether its business,financial condition or results of operations will not be materially adversely affected.
FCPA Investigation and Related MattersThe Audit Committee (the "Audit Committee") of the Board of Directors of the Company has been conducting an internal investigation into, among other things,alleged violations of the U.S. Foreign Corrupt Practices Act ("FCPA") and other alleged crimes or misconduct in connection with foreign subsidiaries, includingWal-Mart de México, S.A.B. de C.V. ("Walmex"), and whether prior allegations of such violations and/or misconduct were appropriately handled by theCompany. The Audit Committee and the Company have engaged outside counsel from a number of law firms and other advisors who are assisting in the on-goinginvestigation of these matters.The Company has also been conducting a voluntary global review of its policies, practices and internal controls for anti-corruption compliance. The Company isengaged in strengthening its global anti-corruption compliance program through appropriate remedial anti-corruption measures. In November 2011, the Companyvoluntarily disclosed that investigative activity to the U.S. Department of Justice (the "DOJ") and the Securities and Exchange Commission (the "SEC"). Since theimplementation of the global review and the enhanced anti-corruption compliance program, the Audit Committee and the Company have identified or been madeaware of additional allegations regarding potential violations of the FCPA. When such allegations have been reported or identified, the Audit Committee and theCompany, together with their third party advisors, have conducted inquiries and when warranted based on those inquiries, opened investigations. Inquiries orinvestigations regarding allegations of potential FCPA violations were commenced in a number of foreign markets where the Company operates, including, but notlimited to, Brazil, China and India.As previously disclosed, the Company is under investigation by the DOJ and the SEC regarding possible violations of the FCPA. The Company has beencooperating with the agencies and discussions have been ongoing regarding the resolution of these matters. These discussions have progressed to a point that, infiscal 2018, the Company reasonably estimated a probable loss and has recorded an aggregate accrual of $283 million with respect to these matters (the "Accrual").As the discussions are continuing, there can be no assurance as to the timing or the terms of the final resolution of these matters.A number of federal and local government agencies in Mexico have also initiated investigations of these matters. Walmex is cooperating with the Mexicangovernmental agencies conducting these investigations. Furthermore, lawsuits relating to the matters under investigation have been filed by several of theCompany's shareholders against it, certain of its current directors, and certain of its former directors, certain of its former officers and certain of Walmex's formerofficers.
16

Table of Contents
The Company could be exposed to a variety of negative consequences as a result of the matters noted above. There could be one or more enforcement actions inrespect of the matters that are the subject of some or all of the on-going government investigations, and such actions, if brought, may result in judgments,settlements, fines, penalties, injunctions, cease and desist orders, debarment or other relief, criminal convictions and/or penalties and the shareholder lawsuitsreferenced above may result in judgments against the Company and its current and former directors and officers named in those proceedings. The Companyexpects that there will be on-going media and governmental interest, including additional news articles from media publications on these matters, which couldimpact the perception among certain audiences of the Company's role as a corporate citizen.In addition, the Company has incurred and expects to continue to incur costs in responding to requests for information or subpoenas seeking documents, testimonyand other information in connection with the government investigations, in defending the shareholder lawsuits, and in conducting the review and investigations.These costs will be expensed as incurred. For the three months ended April 30, 2018 and 2017 , the Company incurred the following third-party expenses inconnection with the FCPA investigation and related matters:
Three Months Ended April 30,
(Amounts in millions) 2018 2017Ongoing inquiries and investigations $ 4 $ 13
Global compliance program and organizational enhancements 3 3
Total $ 7 $ 16
The Company does not presently believe that these matters, including the Accrual (and the payment of the Accrual at some point-in-time in the future), will have amaterial adverse effect on its business, although given the inherent uncertainties in such situations, the Company can provide no assurance that these matters willnot be material to its business in the future.
Note 10. Acquisitions, Disposals and Subsequent Events
The following significant transactions impact, or are expected to impact, the operations of the Company's Walmart International segment. Other immaterialtransactions have also occurred or been announced.AsdaIn April 2018, the Company entered into a definitive agreement and announced the combination of J Sainsbury plc and Asda Group Limited ("Asda Group"), theCompany's wholly owned UK retail subsidiary. Under the terms of the combination, the Company would receive approximately 42 percent of the share capital ofthe combined business. In addition, the Company would receive approximately £3 billion in cash, subject to customary closing adjustments, and retain obligationsunder the Asda Group defined benefit pension plan . Due to a complex regulatory review process, the outcome of which is uncertain and may take some time tocomplete, the held for sale classification criteria for the disposal group has not been met as of April 30, 2018. Upon the transaction closing, the Company woulddeconsolidate the financial statements of the Asda Group and the ongoing investment in the combined company would be accounted for as an equity methodinvestment.SuburbiaIn April 2017, the Company sold Suburbia, the apparel retail division in Mexico, for $1.0 billion . As part of the sales agreement, the Company is also leasingcertain real estate to the purchaser. The sale resulted in a pre-tax gain of $0.7 billion , of which $0.4 billion was recognized in the second quarter of fiscal 2018 inmembership and other income, and the remainder was deferred and is being recognized over the lease terms of approximately 20 years .Subsequent EventsIn May 2018, the Company announced it will pay approximately $16 billion in exchange for approximately 77 percent of the outstanding shares of Flipkart Group("Flipkart"). The investment includes $2 billion of new equity funding. Closing is expected later this calendar year, and is subject to regulatory approval. Tofinance the acquisition, the Company intends to use a combination of newly issued debt and cash on hand. Upon regulatory approval and the transaction closing,the Company would consolidate the financial statements of Flipkart with the Company's Condensed Consolidated Financial Statements.In June 2018, the Company agreed to sell an 80 percent stake of Walmart Brazil to Advent International ("Advent"). Under the terms, the Company would receiveup to $250 million in contingent consideration, Advent would contribute additional capital to the business over a three-year period, and Walmart would provide anindemnification for pre-closing tax and legal contingencies, as well as certain other matters. Due to its decision to sell, the Company will record an estimated netloss of approximately $4.5 billion in the second quarter of fiscal 2019, a significant portion of which is due to the recognition of cumulative foreign currencytranslation losses. The transaction is subject to regulatory approval and is expected to close in the second half of fiscal 2019. Upon closing, the Company woulddeconsolidate the financial statements of Walmart Brazil and account for its remaining 20 percent ownership interest as an equity method investment.
17

Table of Contents
Note 11. Segments and Disaggregated Revenue
SegmentsThe Company is engaged in the operation of retail, wholesale and other units, as well as eCommerce websites, located throughout the U.S., Africa, Argentina,Brazil, Canada, Central America, Chile, China, India, Japan, Mexico and the United Kingdom. The Company's operations are conducted in three reportablesegments: Walmart U.S., Walmart International and Sam's Club. The Company defines its segments as those operations whose results the chief operating decisionmaker ("CODM") regularly reviews to analyze performance and allocate resources. The Company sells similar individual products and services in each of itssegments. It is impractical to segregate and identify revenues for each of these individual products and services entity wide.The Walmart U.S. segment includes the Company's mass merchant concept in the U.S., as well as eCommerce. The Walmart International segment consists of theCompany's operations outside of the U.S., as well as eCommerce. The Sam's Club segment includes the warehouse membership clubs in the U.S., as well aseCommerce. Corporate and support consists of corporate overhead and other items not allocated to any of the Company's segments.The Company measures the results of its segments using, among other measures, each segment's net sales and operating income, which includes certain corporateoverhead allocations. From time to time, the Company revises the measurement of each segment's operating income, including any corporate overhead allocations,as determined by the information regularly reviewed by its CODM. In fiscal 2019, the Company revised certain of its corporate overhead allocations to theoperating segments and, accordingly, revised prior period amounts for comparability .Net sales by segment are as follows:
Three Months Ended April 30,
(Amounts in millions) 2018 2017Net sales:
Walmart U.S. $ 77,748 $ 75,436
Walmart International 30,260 27,097
Sam's Club 13,622 13,993
Net sales $ 121,630 $ 116,526
Operating income by segment, as well as operating loss for corporate and support, interest, net, and unrealized (gains) and losses are as follows:
Three Months Ended April 30,
(Amounts in millions) 2018 2017Operating income (loss):
Walmart U.S. $ 3,927 $ 4,052
Walmart International 1,265 1,139
Sam's Club 325 399
Corporate and support (363) (353)
Operating income 5,154 5,237
Interest, net 487 563
Unrealized (gains) and losses 1,845 —
Income before income taxes $ 2,822 $ 4,674
Disaggregated Revenues
In the following tables, segment net sales are disaggregated by either merchandise category or market. In addition, net sales related to eCommerce are provided foreach segment, which include omni-channel sales, where a customer initiates an order online and the order is fulfilled through a store or club.
(Amounts in millions) Three Months Ended
April 30, 2018Walmart U.S. net sales by merchandise category Grocery $ 43,860
General merchandise 24,174
Health and wellness 9,128
Other categories 586
Total $ 77,748
Of Walmart U.S.'s total net sales, approximately $3.2 billion relates to eCommerce for the three months ended April 30, 2018 .
18
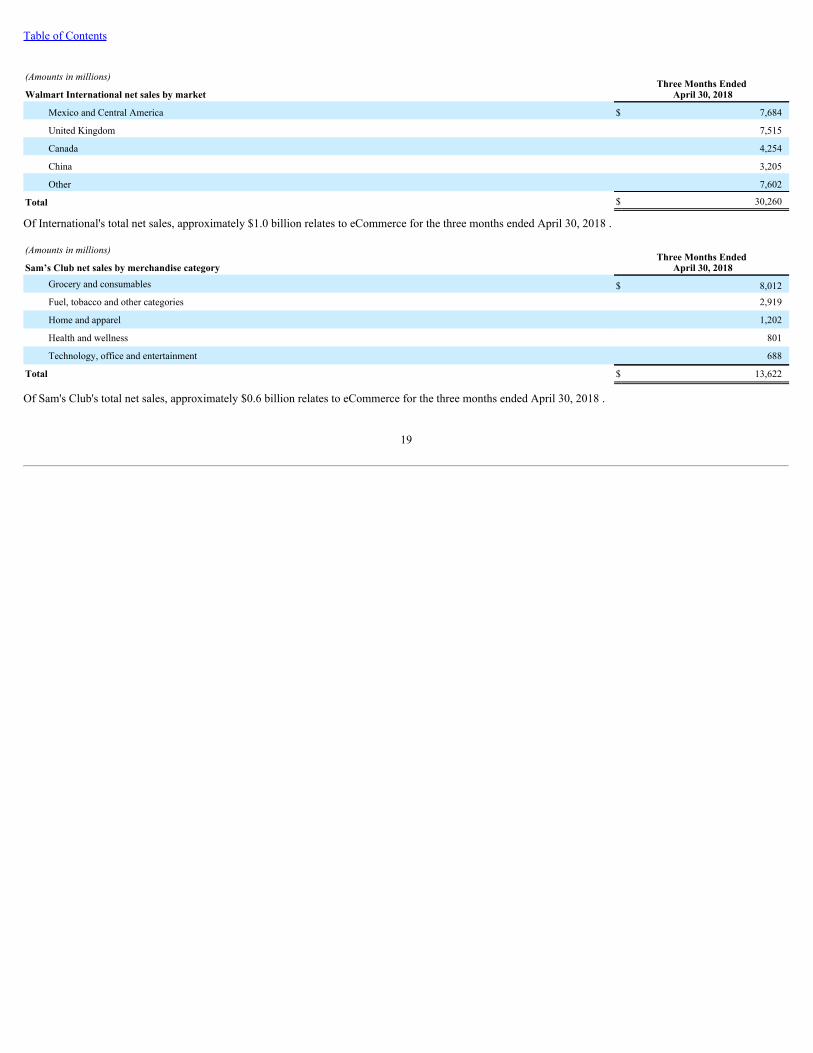
Table of Contents
(Amounts in millions) Three Months Ended
April 30, 2018Walmart International net sales by market
Mexico and Central America $ 7,684
United Kingdom 7,515
Canada 4,254
China 3,205
Other 7,602
Total $ 30,260
Of International's total net sales, approximately $1.0 billion relates to eCommerce for the three months ended April 30, 2018 .
(Amounts in millions) Three Months Ended
April 30, 2018Sam’s Club net sales by merchandise category Grocery and consumables $ 8,012Fuel, tobacco and other categories 2,919
Home and apparel 1,202
Health and wellness 801
Technology, office and entertainment 688
Total $ 13,622
Of Sam's Club's total net sales, approximately $0.6 billion relates to eCommerce for the three months ended April 30, 2018 .
19

Table of Contents
Item 2. Management's Discussion and Analysis of Financial Condition and Results of OperationsOverviewWalmart Inc. ("Walmart," the "Company" or "we") is engaged in retail and wholesale operations in various formats around the world. Through our operations, wehelp people around the world save money and live better – anytime and anywhere – in retail stores and through eCommerce. Through innovation, we are striving tocreate a customer-centric experience that seamlessly integrates digital and physical shopping into an omni-channel offering that saves time for our customers.Physical retail encompasses our brick and mortar presence in each of the markets in which we operate. Digital retail, or eCommerce, is comprised of oureCommerce websites, mobile commerce applications and transactions involving both an eCommerce platform and a physical format, which we refer to as omni-channel. Each week, we serve nearly 270 million customers who visit our more than 11,700 stores and numerous eCommerce websites under 65 banners in 28countries. Our strategy is to lead on price, invest to differentiate on access, be competitive on assortment and deliver a great experience. By leading on price weearn the trust of our customers every day by providing a broad assortment of quality merchandise and services at everyday low prices ("EDLP"). EDLP is ourpricing philosophy under which we price items at a low price every day so our customers trust that our prices will not change under frequent promotional activity.Price leadership is core to who we are. Everyday low cost ("EDLC") is our commitment to control expenses so our cost savings can be passed along to ourcustomers. Our physical and digital presence, in which we are investing to integrate into a seamless omni-channel, provides customers convenient access to ourbroad assortment anytime and anywhere. We strive to give our customers and members a great shopping experience through whichever shopping method theyprefer.Our operations consist of three reportable segments: Walmart U.S., Walmart International and Sam's Club.
• Walmart U.S. is our largest segment with three primary store formats and eCommerce, as well as an omni-channel offering. Of our three reportablesegments, Walmart U.S. has historically had the highest gross profit as a percentage of net sales ("gross profit rate"). In addition, it has historicallycontributed the greatest amount to the Company's net sales and operating income.
• Walmart International consists of our operations outside of the U.S. and includes retail, wholesale and other businesses. These categories, includingeCommerce, consist of many formats, including: supercenters, supermarkets, hypermarkets, warehouse clubs (including Sam's Clubs) and cash & carry.Overall gross profit rate for Walmart International is lower than that of Walmart U.S. primarily because of its merchandise mix. Walmart International isour second largest segment and has grown in recent years by adding retail, wholesale and other units, and expanding eCommerce.
• Sam's Club consists of membership-only warehouse clubs as well as eCommerce through samsclub.com. As a membership-only warehouse club,membership income is a significant component of the segment's operating income. Sam's Club operates with a lower gross profit rate and lower operatingexpenses as a percentage of net sales than our other segments.
Each of our segments contributes to the Company's operating results differently. Each, however, has generally maintained a consistent contribution rate to theCompany's net sales and operating income in recent years other than minor changes to the contribution rate for the Walmart International segment due tofluctuations in currency exchange rates. Recently, including events subsequent to April 30, 2018, we took some strategic actions to further position our portfoliofor long-term growth. These actions included the recently announced:
• Acquisition of Flipkart Group ("Flipkart"), an Indian eCommerce company, for approximately $16 billion in exchange for approximately 77 percent ofthe outstanding shares of Flipkart Group. Closing is expected later this calendar year, and is subject to regulatory approval. Upon closing andconsolidating the financial statements of Flipkart, we expect the ongoing operations of Flipkart to negatively impact fiscal 2019 net income.
• Combination of J Sainsbury plc and Asda Group Limited ("Asda"), our wholly owned United Kingdom retail subsidiary. Under the terms, we wouldreceive approximately 42 percent of the share capital of the combined business and approximately £3.0 billion in cash, subject to customary closingadjustments, while retaining obligations under the Asda defined benefit pension plan . Due to a complex regulatory review process, the outcome of whichis uncertain and may take some time to complete, the held for sale classification criteria for the disposal group has not been met as of April 30, 2018.Upon meeting the held for sale classification criteria for the disposal group, we expect to recognize a loss, the amount of which may fluctuate based onthe changes in the value of share capital received and foreign exchange rates.
• Divestiture of 80% of Walmart Brazil to Advent International (“Advent”). Under the terms, we would receive up to $250 million in contingentconsideration, Advent would contribute additional capital to the business over a three-year period, and we would provide an indemnification for pre-closing tax and legal contingencies, as well as certain other matters. Due to our decision to sell, we will record an estimated net loss of approximately$4.5 billion in the second quarter of fiscal 2019, a significant portion of which is due to the recognition of cumulative foreign currency
20

Table of Contents
translation losses. The transaction is subject to regulatory approval and is expected to close in the second half of fiscal 2019.• Pending divestitures of banking operations in Walmart Canada and Walmart Chile, both classified as held for sale as of April 30, 2018 , and subject to
closing procedures, consistent with our focus on core retail capabilities.Our fiscal year ends on January 31 for our U.S. and Canadian operations. We consolidate all other operations generally using a one-month lag and on a calendaryear basis. Our business is seasonal to a certain extent due to calendar events and national and religious holidays, as well as weather patterns. Historically, ourhighest sales volume and operating income have occurred in the fiscal quarter ending January 31 .This discussion, which presents our results for periods occurring in the fiscal year ending January 31, 2019 ("fiscal 2019 ") and the fiscal year ended January 31,2018 ("fiscal 2018"), should be read in conjunction with our Condensed Consolidated Financial Statements as of and for the three months ended April 30, 2018 ,and the accompanying notes included in Part I, Item 1 of this Quarterly Report on Form 10-Q, as well as our Consolidated Financial Statements as of and for theyear ended January 31, 2018 , the accompanying notes and the related Management's Discussion and Analysis of Financial Condition and Results of Operations,contained in our Annual Report of Form 10-K for the year ended January 31, 2018 incorporated by reference.We intend for this discussion to provide the reader with information that will assist in understanding our financial statements, the changes in certain key items inthose financial statements from period to period and the primary factors that accounted for those changes. We also discuss certain performance metrics thatmanagement uses to assess the Company's performance. Additionally, the discussion provides information about the financial results of each of the three segmentsof our business to provide a better understanding of how each of those segments and its results of operations affect the financial condition and results of operationsof the Company as a whole.Throughout this Management's Discussion and Analysis of Financial Condition and Results of Operations, we discuss segment operating income, comparable storeand club sales and other measures. Management measures the results of the Company's segments using each segment's operating income, including certaincorporate overhead allocations, as well as other measures. From time to time, we revise the measurement of each segment's operating income and other measuresas determined by the information regularly reviewed by our chief operating decision maker. In fiscal 2019, the Company revised certain of its corporate overheadallocations to the operating segments and, accordingly, revised prior period amounts for comparability .Comparable store and club sales, or comparable sales, is a metric that indicates the performance of our existing stores and clubs by measuring the change in salesfor such stores and clubs, including eCommerce sales, for a particular period from the corresponding period in the previous year. Walmart's definition ofcomparable sales includes sales from stores and clubs open for the previous 12 months, including remodels, relocations, expansions and conversions, as well aseCommerce sales. We measure the eCommerce sales impact by including all sales initiated online or though mobile applications, including omni-channeltransactions which are fulfilled through our stores and clubs. Sales at a store that has changed in format are excluded from comparable sales when the conversionof that store is accompanied by a relocation or expansion that results in a change in the store's retail square feet of more than five percent. Additionally, salesrelated to eCommerce acquisitions are excluded until such acquisitions have been owned for 12 months. Comparable sales are also referred to as "same-store" salesby others within the retail industry. The method of calculating comparable sales varies across the retail industry. As a result, our calculation of comparable sales isnot necessarily comparable to similarly titled measures reported by other companies.In discussing our operating results, we use the term "currency exchange rates" to refer to the currency exchange rates we use to convert the operating results for allcountries where the functional currency is not the U.S. dollar into U.S. dollars for financial reporting purposes. We calculate the effect of changes in currencyexchange rates from the prior period to the current period as the difference between current period activity translated using the current period's currency exchangerates, and current period activity translated using the comparable prior year period's currency exchange rates. Throughout our discussion, we refer to the results ofthis calculation as the impact of currency exchange rate fluctuations. Volatility in currency exchange rates may impact the results, including net sales and operatingincome, of the Company and the Walmart International segment in the future.
The Retail Industry
We operate in the highly competitive retail industry in all of the markets we serve. We face strong sales competition from other discount, department, drug, dollar,variety and specialty stores, warehouse clubs and supermarkets, as well as eCommerce businesses. Many of these competitors are national, regional or internationalchains or have a national or international online presence. We compete with a number of companies for prime retail site locations, as well as in attracting andretaining quality employees ("associates"). We, along with other retail companies, are influenced by a number of factors including, but not limited to: catastrophicevents, weather, competitive pressures, consumer disposable income, consumer debt levels and buying patterns, consumer credit availability, cost of goods,currency exchange rate fluctuations, customer preferences, deflation, inflation, fuel and energy prices, general economic conditions, insurance costs, interest rates,labor costs, tax rates, cybersecurity attacks and unemployment.
21

Table of Contents
Company Performance MetricsWe are committed to helping customers save money and live better through everyday low prices, supported by everyday low costs. At times, we adjust ourbusiness strategies to maintain and strengthen our competitive positions in the countries in which we operate. We define our financial framework as:
• strong, efficient growth;• operating discipline; and• strategic capital allocation.
As we execute on this financial framework, we believe our returns on capital will improve over time.
Strong, Efficient GrowthOur objective of prioritizing strong, efficient growth means we will focus on increasing comparable store and club sales and accelerating eCommerce sales growthwhile slowing the rate of growth of new stores and clubs. At times, we make strategic investments which are focused on the long-term growth of the Company.Comparable sales is a metric that indicates the performance of our existing stores and clubs by measuring the change in sales for such stores and clubs, includingeCommerce sales, for a particular period over the corresponding period in the previous year. The retail industry generally reports comparable sales using the retailcalendar (also known as the 4-5-4 calendar). To be consistent with the retail industry, we provide comparable sales using the retail calendar in our quarterlyearnings releases. However, when we discuss our comparable sales below, we are referring to our calendar comparable sales calculated using our fiscal calendar.As our fiscal calendar differs from the retail calendar, our fiscal calendar comparable sales also differ from the retail calendar comparable sales provided in ourquarterly earnings releases. Calendar comparable sales, as well as the impact of fuel, for the three months ended April 30, 2018 and 2017 , were as follows:
Three Months Ended April 30,
2018 2017 2018 2017
With Fuel Fuel Impact
Walmart U.S. 2.4% 1.1% 0.1% 0.1%
Sam's Club 5.3% 2.1% 1.4% 1.4%
Total U.S. 2.8% 1.2% 0.3% 0.2%
Comparable sales in the U.S., including fu el, increased 2.8% for the three months ended April 30, 2018 , when compared to the same period in the previous fiscalyear. Total U.S. comparable sales were positively impacted by continued traffic improvement and higher eCommerce sales at both Walmart U.S. and Sam's Club.eCommerce sales positively impacted comparable sales by approximately 1.0% and 0.8% for the three months ended April 30, 2018 for Walmart U.S. and Sam'sClub, respectively.
22

Table of Contents
Operating DisciplineWe operate with discipline by managing expenses and optimizing the efficiency of how we work. We measure operating discipline through expense leverage,which we define as net sales growing at a faster rate than operating expenses.
Three Months Ended April 30,
(Amounts in millions, except unit counts) 2018 2017Net sales $ 121,630 $ 116,526
Percentage change from comparable period 4.4% 1.3%
Operating, selling, general and administrative expenses $ 25,829 $ 24,617
Percentage change from comparable period 4.9% 2.2%
Operating, selling, general and administrative expenses as a percentage of net sales 21.2% 21.1%
For the three months ended April 30, 2018 , operating, selling, general and administrative ("operating") expenses as a percentage of net sales increased 11 basispoints when compared to the same periods in the previous fiscal year. As a result, we did not leverage expenses primarily due to investments we are making ineCommerce and technology as well as a charge related to the pending divestiture of our banking operations in Canada and continuing expenses related to disposaland closure events, which began in the fourth quarter of fiscal 2018.
Strategic Capital AllocationWe are allocating more capital to store remodels, eCommerce, technology and supply chain and less to new store and club openings, when compared to prior years.This allocation aligns with our initiatives of improving our customer proposition in stores and clubs and integrating digital and physical shopping. The followingtable provides additional detail:
(Amounts in millions) Three Months Ended April 30,
Allocation of Capital Expenditures 2018 2017Remodels $ 475 $ 447
eCommerce, technology, supply chain and other 805 767
New stores and clubs, including expansions and relocations 103 305
Total U.S. 1,383 1,519
Walmart International 435 471
Total capital expenditures $ 1,818 $ 1,990
Although capital expenditures remained relatively flat in total, how we expended capital varied consistent with our shift in capital allocation strategy.
23

Table of Contents
ReturnsAs we execute our financial framework, we believe our return on capital will improve over time. We measure return on capital with our return on investment andfree cash flow metrics. In addition, we provide returns in the form of share repurchases and dividends, which are discussed in the Liquidity and Capital Resourcessection.
Return on Assets and Return on InvestmentWe include Return on Assets ("ROA"), the most directly comparable measure based on our financial statements presented in accordance with generally acceptedaccounting principles in the U.S. ("GAAP"), and Return on Investment ("ROI") as metrics to assess returns on assets. While ROI is considered a non-GAAPfinancial measure, management believes ROI is a meaningful metric to share with investors because it helps investors assess how effectively Walmart is deployingits assets. Trends in ROI can fluctuate over time as management balances long-term potential strategic initiatives with possible short-term impacts. ROA was 4.8%and 7.1% for the trailing twelve months ended April 30, 2018 and 2017 , respectively. The decline in ROA was primarily due to the losses on extinguishment ofdebt of $3.1 billion and the decrease in operating income over the trailing twelve months ended April 30, 2018 . ROI was 13.9% and 15.1% for the trailing twelvemonths ended April 30, 2018 and 2017 , respectively. The decline in ROI was primarily due to the decrease in operating income over the trailing twelve monthsended April 30, 2018 .We define ROI as adjusted operating income (operating income plus interest income, depreciation and amortization, and rent expense) for the trailing 12 monthsdivided by average invested capital during that period. We consider average invested capital to be the average of our beginning and ending total assets, plusaverage accumulated depreciation and average amortization, less average accounts payable and average accrued liabilities for that period, plus a rent factor equal tothe rent for the fiscal year or trailing 12 months multiplied by a factor of 8. When we have discontinued operations, we exclude the impact of the discontinuedoperations.Our calculation of ROI is considered a non-GAAP financial measure because we calculate ROI using financial measures that exclude and include amounts that areincluded and excluded in the most directly comparable GAAP financial measure. For example, we exclude the impact of depreciation and amortization from ourreported operating income in calculating the numerator of our calculation of ROI. In addition, we include a factor of 8 for rent expense that estimates thehypothetical capitalization of our operating leases. As mentioned above, we consider return on assets to be the financial measure computed in accordance withgenerally accepted accounting principles most directly comparable to our calculation of ROI. ROI differs from ROA (which is consolidated net income for theperiod divided by average total assets for the period) because ROI: adjusts operating income to exclude certain expense items and adds interest income; adjuststotal assets for the impact of accumulated depreciation and amortization, accounts payable and accrued liabilities; and incorporates a factor of rent to arrive at totalinvested capital. Because of the adjustments mentioned above, we believe ROI more accurately measures how we are deploying our key assets and is moremeaningful to investors than ROA.Although ROI is a standard financial measure, numerous methods exist for calculating a company's ROI. As a result, the method used by management to calculateour ROI may differ from the methods used by other companies to calculate their ROI.
24

Table of Contents
The calculation of ROA and ROI, along with a reconciliation of ROI to the calculation of ROA, the most comparable GAAP financial measure, is as follows:
For the Trailing Twelve Months Ending April
30,
(Amounts in millions) 2018 2017CALCULATION OF RETURN ON ASSETSNumerator
Consolidated net income $ 9,647 $ 14,229
Denominator Average total assets (1) $ 202,323 $ 199,212
Return on assets (ROA) 4.8% 7.1%
CALCULATION OF RETURN ON INVESTMENTNumerator
Operating income $ 20,354 $ 22,726
+ Interest income 160 111
+ Depreciation and amortization 10,656 10,243
+ Rent 3,036 2,601
= Adjusted operating income $ 34,206 $ 35,681
Denominator
Average total assets (1) $ 202,323 $ 199,212
+ Average accumulated depreciation and amortization (1) 81,862 76,115
- Average accounts payable (1) 42,990 39,682
- Average accrued liabilities (1) 20,245 19,657
+ Rent x 8 24,288 20,808
= Average invested capital $ 245,238 $ 236,796
Return on investment (ROI) 13.9% 15.1%
As of April 30,
2018 2017 2016
Certain Balance Sheet Data Total assets $ 204,927 $ 199,718 $ 198,705
Accumulated depreciation and amortization 84,964 78,760 73,469
Accounts payable 44,612 41,367 37,997
Accrued liabilities 20,782 19,708 19,605 (1) The average is based on the addition of the account balance at the end of the current period to the account balance at the end of the prior period and dividing by 2.
25

Table of Contents
Free Cash FlowFree cash flow is considered a non-GAAP financial measure. Management believes, however, that free cash flow, which measures our ability to generate additionalcash from our business operations, is an important financial measure for use in evaluating the Company's financial performance. Free cash flow should beconsidered in addition to, rather than as a substitute for, consolidated net income as a measure of our performance and net cash provided by operating activities as ameasure of our liquidity. See Liquidity and Capital Resources for discussions of GAAP metrics including net cash provided by operating activities, net cash used ininvesting activities and net cash used in financing activities.We define free cash flow as net cash provided by operating activities in a period minus payments for property and equipment made in the same period. We had netcash provided by operating activities of $5.2 billion and $5.4 billion for the three months ended April 30, 2018 and 2017 , respectively. The decrease in net cashprovided by operating activities was due to the timing of payments. We generated free cash flow of $3.3 billion for the three months ended April 30, 2018 , whichwas relatively flat compared to $3.4 billion for the three months ended April 30, 2017 .Walmart's definition of free cash flow is limited in that it does not represent residual cash flows available for discretionary expenditures due to the fact that themeasure does not deduct the payments required for debt service and other contractual obligations or payments made for business acquisitions. Therefore, webelieve it is important to view free cash flow as a measure that provides supplemental information to our Condensed Consolidated Statements of Cash Flows.Although other companies report their free cash flow, numerous methods may exist for calculating a company's free cash flow. As a result, the method used byWalmart's management to calculate our free cash flow may differ from the methods used by other companies to calculate their free cash flow.The following table sets forth a reconciliation of free cash flow, a non-GAAP financial measure, to net cash provided by operating activities, which we believe tobe the GAAP financial measure most directly comparable to free cash flow, as well as information regarding net cash used in investing activities and net cash usedin financing activities.
Three Months Ended April 30,
(Amounts in millions) 2018 2017Net cash provided by operating activities $ 5,161 $ 5,385
Payments for property and equipment (1,818) (1,990)
Free cash flow $ 3,343 $ 3,395
Net cash used in investing activities (1) $ (1,682) $ (1,861)
Net cash used in financing activities (2,486) (3,972)
(1) "Net cash used in investing activities" includes payments for property and equipment, which is also included in our computation of free cash flow.
26

Table of Contents
Results of Operations
Consolidated Results of Operations
Three Months Ended April 30,
(Amounts in millions, except unit counts) 2018 2017Total revenues $ 122,690 $ 117,542
Percentage change from comparable period 4.4% 1.4%
Net sales $ 121,630 $ 116,526
Percentage change from comparable period 4.4% 1.3%
Total U.S. calendar comparable sales increase 2.8% 1.2%
Gross profit margin as a percentage of net sales 24.6% 24.8%
Operating income $ 5,154 $ 5,237
Operating income as a percentage of net sales 4.2% 4.5%Unrealized (gains) and losses $ 1,845 —
Consolidated net income $ 2,276 $ 3,152
Unit counts at period end 11,717 11,723
Retail square feet at period end 1,157 1,166
Our total revenues, which are mostly comprised of net sales, but also include membership and other income, increased $5.1 billion or 4.4% for the three monthsended April 30, 2018 . when compared to the same periods in the previous fiscal year. The increase in revenues was due to an increase in net sales, which wasprimarily due to overall positive comparable sales in all of our segments and year-over-year net growth in retail square feet of 0.6% in the Walmart U.S. segment,partially offset by club closures in the Sam's Club segment. Additionally, for the three months ended April 30, 2018 , fluctuations in currency exchange ratespositively impacted net sales by $1.9 billion .Our gross profit rate decreased 15 basis points for the three months ended April 30, 2018 , when compared to the same period in the previous fiscal year. Thedecrease for the three months ended April 30, 2018 was due to strategic price investments and higher fuel costs at the Walmart U.S. and Sam's Club segments.Operating expenses as a percentage of net sales increased 11 basis points for the three months ended April 30, 2018 , when compared to the same periods in theprevious fiscal year, primarily due to continued investments in eCommerce and technology and the charge related to the pending divestiture of our Canada bankingoperations of approximately $81 million. Currency fluctuations partially offset these charges.Unrealized losses were $1.8 billion for the three months ended April 30, 2018 , primarily as a result of the decrease in the market value of our investment inJD.com. Beginning in fiscal 2019 due to the adoption of the new financial instrument standard, changes in fair value are recognized in unrealized gains and lossesin the Condensed Consolidated Statements of Income.Our effective income tax rate was 19.3% for the three months ended April 30, 2018 , compared to 32.6% , for the same period in the previous fiscal year. Thedecrease in the effective income tax rate for the three months ended April 30, 2018 was primarily due to the Tax Cuts and Jobs Act of 2017 and related accountingstandards updates. Our effective income tax rate may fluctuate from quarter to quarter as a result of factors including changes in our assessment of certain taxcontingencies, valuation allowances, changes in tax law, outcomes of administrative audits, the impact of discrete items and the mix of earnings among our U.S.operations and international operations, which are subject to statutory rates that are generally lower than the U.S. statutory rate.Consolidated net income decreased $0.9 billion for three months ended April 30, 2018 , when compared to the same period in the previous fiscal year. Thedecrease was due to the unrealized loss on our investment in JD.com, which was partially offset by the other factors discussed above. Diluted net income percommon share attributable to Walmart was $0.72 for the three months ended April 30, 2018 , which represents a decline of $0.28 , when compared to the sameperiod in the previous fiscal year.
27

Table of Contents
Walmart U.S. Segment
Three Months Ended April 30,
(Amounts in millions, except unit counts) 2018 2017
Net sales $ 77,748 $ 75,436
Percentage change from comparable period 3.1% 2.9%
Calendar comparable sales increase 2.4% 1.1%
Operating income $ 3,927 $ 4,052
Operating income as a percentage of net sales 5.1% 5.4%
Unit counts at period end 4,761 4,692
Retail square feet at period end 705 701
Net sales for the Walmart U.S. segment increased $2.3 billion or 3.1% for the three months ended April 30, 2018 , when compared to the same period in theprevious fiscal year. The increase in net sales was primarily due to increases in comparable sales of 2.4% and year-over-year net growth in retail square feet of0.6% .Gross profit rate decreased 23 basis points for the three months ended April 30, 2018 , when compared to the same period in the previous fiscal year. The decreasewas primarily due to price investments as well as higher transportation expenses, resulting from higher fuel costs and third-party trucking rates.Operating expenses as a percentage of net sales increased 11 basis points for the three months ended April 30, 2018 , when compared to the same period in theprevious fiscal year, primarily due to continued investments in eCommerce and technology.As a result of the factors discussed above, operating income decreased $125 million for the three months ended April 30, 2018 , when compared to the same periodin the previous fiscal year.
28

Table of Contents
Walmart International Segment
Three Months Ended April 30,
(Amounts in millions, except unit counts) 2018 2017
Net sales $ 30,260 $ 27,097
Percentage change from comparable period 11.7% (3.5)%
Operating income $ 1,265 $ 1,139
Operating income as a percentage of net sales 4.2% 4.2 %
Unit counts at period end 6,359 6,369
Retail square feet at period end 372 376
Net sales for the Walmart International segment increased $3.2 billion or 11.7% for the three months ended April 30, 2018 , when compared to the same period inthe previous fiscal year. The increase in net sales was primarily due to a $1.9 billion positive impact from fluctuations in currency exchange rates, positivecomparable sales in the majority of our markets and the timing of Easter compared to the same period in the previous fiscal year. The positive impacts werepartially offset by a reduction in net sales of approximately $200 million due to divesting our Suburbia business in the second quarter of fiscal 2018 and a reductionin net sales due to the wind down of the first party Brazil eCommerce operations.Gross profit r ate de creased 10 basis points for the three months ended April 30, 2018 , when compared to the same period in the previous fiscal year. Thedecrease in the gross profit rate was primarily due to price investments.Operating expenses as a percentage of net sales decreased 7 basis points for the three months ended April 30, 2018 , when compared to the same period in theprevious fiscal year. The decrease in operating expenses as a percentage of net sales was primarily due to currency fluctuations of 23 basis points. The decreasewas offset by the charge related to the pending divestiture of our Canada banking operations of approximately $81 million and the wind down of the first partyBrazil eCommerce operations.As a result of the factors discussed above, operating income increased $126 million for the three months ended April 30, 2018 , when compared to the same periodin the previous fiscal year.
29

Table of Contents
Sam's Club Segment
We believe the information in the following table under the caption "Excluding Fuel" is useful to investors because it permits investors to understand the effect ofthe Sam's Club segment's fuel sales on its results of operations, which are impacted by the volatility of fuel prices. Volatility in fuel prices may continue to impactthe operating results of the Sam's Club segment in the future.
Three Months Ended April 30,
(Amounts in millions, except unit counts) 2018 2017Including Fuel
Net sales $ 13,622 $ 13,993
Percentage change from comparable period (2.7)% 2.8%
Calendar comparable sales increase (decrease) 5.3 % 2.1%
Operating income $ 325 $ 399
Operating income as a percentage of net sales 2.4 % 2.9%
Unit counts at period end 597 662
Retail square feet at period end 80 89
Excluding Fuel
Net sales $ 12,380 $ 12,909
Percentage change from comparable period (4.1)% 1.4%
Operating income $ 313 $ 391
Operating income as a percentage of net sales 2.5 % 3.0%
Net sales for the Sam's Club segment decreased $371 million or 2.7% for the three months ended April 30, 2018 , when compared to the same period in theprevious fiscal year. The decrease in net sales was primarily due to the net closure of 63 clubs in fiscal 2018. The decrease in net sales was partially offset by anincrease in comparable sales of 5.3% of which fuel positively impacted by approximately 1.4% due to higher fuel prices.Gross profit r ate decreased 34 basis points for the three months ended April 30, 2018 when compared to the same period in the previous fiscal year, primarily dueto higher inventory shrink partially related to the above mentioned club closures, higher transportation costs, increased shipping costs at samsclub.com, and priceinvestments.Membership and other incom e decreased 0.9% for the three months ended April 30, 2018 when compared to the same period in the previous fiscal year. Thedecrease was primarily due to lower recycling income, partially offset by an increase in membership income driven by an increase in Plus memberships.Operating expenses as a percentage of segment net sal es increased 17 basis points for the three months ended April 30, 2018 , when compared to the same periodin the previous fiscal year. The increase was primarily due to charges related to the exit of leased clubs, which were closed as part of the club closures in fiscal2018.As a result of the factors discussed above, operating inco me decreased $74 million for the three months ended April 30, 2018 when compared to the same periodin the previous fiscal year.
30

Table of Contents
Liquidity and Capital ResourcesLiquidityThe strength and stability of our operations have historically supplied us with a significant source of liquidity. Our cash flows provided by operating activities,supplemented with our long-term debt and short-term borrowings, have been sufficient to fund our operations while allowing us to invest in activities that supportthe long-term growth of our operations. For example, to finance the recently announced Flipkart acquisition, which is subject to regulatory approval, we intend touse a combination of newly issued debt and cash on hand. Generally, some or all of the remaining available cash flow has been used to fund the dividends on ourcommon stock and share repurchases. We believe our sources of liquidity will continue to be adequate to fund operations, finance our global investment andexpansion activities, pay dividends and fund our share repurchases for the foreseeable future.
Net Cash Provided by Operating Activities
Three Months Ended April 30,(Amounts in millions) 2018 2017Net cash provided by operating activities $ 5,161 $ 5,385
Net cash provided by operating activities was $5.2 billion and $5.4 billion for the three months ended April 30, 2018 and 2017 , respectively. The decrease in netcash provided by operating activities was due to the timing of payments.
Cash Equivalents and Working CapitalCash and cash equivalents were $7.9 billion and $6.5 billion at April 30, 2018 and 2017 , respectively. Our working capital deficit was $21.5 billion and $16.9billion at April 30, 2018 and 2017 , respectively. We generally operate with a working capital deficit due to our efficient use of cash in funding operations,consistent access to the capital markets and returns provided to our shareholders in the form of payments of cash dividends and share repurchases.We use intercompany financing arrangements in an effort to ensure cash can be made available in the country in which it is needed with the minimum costpossible. We do not believe it will be necessary to repatriate earnings held outside of the U.S. and anticipate our domestic liquidity needs will be met through cashflows provided by domestic operating activities, supplemented with long-term debt and short-term borrowings. Accordingly, we intend, with only certainexceptions, to continue to indefinitely reinvest our earnings held outside of the U.S. in our foreign operations. As part of Tax Reform and Jobs Act of 2017, wecontinue to assess the impact of the new U.S. tax laws, which can in turn, impact our assertion regarding any potential future repatriation. If our intentions withrespect to reinvestment were to change, most of the amounts held within our foreign operations could be repatriated to the U.S., although any repatriation undernew U.S. tax laws could be subject to incremental withholding taxes. We do not expect current local laws, other existing limitations or potential taxes onanticipated future repatriations of cash amounts held outside of the U.S. to have a material effect on our overall liquidity, financial condition or results ofoperations.As of April 30, 2018 and January 31, 2018 , cash and cash equivalents of approximately $1.4 billion may not be freely transferable to the U.S. due to local laws orother restrictions.
Net Cash Used in Investing Activities
Three Months Ended April 30,(Amounts in millions) 2018 2017
Net cash used in investing activities $ (1,682) $ (1,861)
Net cash used in investing activities was $1.7 billion and $1.9 billion for the three months ended April 30, 2018 and 2017 , respectively, and generally consisted ofpayments to remodel existing stores and clubs, expand our eCommerce capabilities, invest in other technologies and add stores and clubs. Net cash used ininvesting activities decreased $0.2 billion for the three months ended April 30, 2018 due to fewer capital expenditures.
Net Cash Used in Financing Activities
Three Months Ended April 30,(Amounts in millions) 2018 2017
Net cash used in financing activities $ (2,486) $ (3,972)
Net cash used in financing activities generally consists of transactions related to our short-term and long-term debt, financing obligations, dividends paid and therepurchase of Company stock. Transactions with noncontrolling interest shareholders are also classified as cash flows from financing activities. Net cash used infinancing activities decreased $1.5 billion for the three months ended April 30, 2018 , when compared to the same period in the previous fiscal year, primarily dueto decreased repurchases of Company stock as we suspended repurchases in anticipation of the Flipkart announcement .
31

Table of Contents
Long-term DebtThe following table provides the changes in our long-term debt for the three months ended April 30, 2018 :
(Amounts in millions) Long-term debt due
within one year Long-term debt TotalBalances as of February 1, 2018 $ 3,738 $ 30,045 $ 33,783
Proceeds from issuance of long-term debt — — —
Repayments of long-term debt (2,521) — (2,521)
Reclassifications of long-term debt 364 (364) —
Other (5) (204) (209)Balances as of April 30, 2018 $ 1,576 $ 29,477 $ 31,053
Our total outstanding long-term debt balance decreased $2.7 billion for the three months ended April 30, 2018 , primarily due to repayments of long-term debt.Additionally, we expect our long–term debt balances will increase later in the year in order to fund the recently announced $16 billion Flipkart acquisition, whichis subject to regulatory approval.
DividendsOn February 20, 2018 , the Board of Directors approved the fiscal 2019 annual dividend of $ 2.08 per share, an increase over the fiscal 2018 annual dividend of$2.04 per share. For fiscal 2019 , the annual dividend will be paid in four quarterly installments of $0.52 per share, according to the following record and payabledates:
Record Date Payable DateMarch 9, 2018 April 2, 2018May 11, 2018 June 4, 2018August 10, 2018 September 4, 2018December 7, 2018 January 2, 2019
The dividend installments payable on April 2, 2018 and June 4, 2018 were paid as scheduled.
Company Share Repurchase ProgramFrom time to time, the Company repurchases shares of its common stock under share repurchase programs authorized by the Company's Board of Directors. Allrepurchases made during the three months ended April 30, 2018 were made under the plan in effect at the beginning of the fiscal year. The current $20.0 billionshare repurchase program approved in October 2017 has no expiration date or other restrictions limiting the period over which the Company can make sharerepurchases. As of April 30, 2018 , authorization for $18.3 billion of share repurchases remained under the current share repurchase program. Any repurchasedshares are constructively retired and returned to an unissued status.We regularly review share repurchase activity and consider several factors in determining when to execute share repurchases, including, among other things,current cash needs, capacity for leverage, cost of borrowings, our results of operations and the market price of our common stock. We anticipate that a majority ofthe ongoing share repurchase program will be funded through the Company's free cash flow. The following table provides, on a settlement date basis, the numberof shares repurchased, average price paid per share and total amount paid for share repurchases for the three months ended April 30, 2018 and 2017 :
Three Months Ended April 30,
(Amounts in millions, except per share data) 2018 2017Total number of shares repurchased 5.5 31.1
Average price paid per share $ 97.75 $ 70.25
Total amount paid for share repurchases $ 539 $ 2,185
Share repurchases decreased $1.6 billion for the three months ended April 30, 2018 , when compared to the same period in the previous year, primarily due tosuspended repurchases in anticipation of the Flipkart announcement .
Capital ResourcesWe intend to fund the acquisition of Flipkart with a combination of newly issued debt and cash on hand. We believe cash flows from operations, our current cashposition and access to capital markets will continue to be sufficient to meet our anticipated operating cash needs, which include funding seasonal buildups inmerchandise inventories and funding our capital expenditures, acquisitions, dividend payments and share repurchases.
32

Table of Contents
We have strong commercial paper and long-term debt ratings that have enabled and should continue to enable us to refinance our debt as it becomes due atfavorable rates in capital markets. At April 30, 2018 , the ratings assigned to our commercial paper and rated series of our outstanding long-term debt were asfollows:
Rating agency Commercial paper Long-term debtStandard & Poor's A-1+ AAMoody's Investors Service P-1 Aa2Fitch Ratings F1+ AA
Credit rating agencies review their ratings periodically and, therefore, the credit ratings assigned to us by each agency may be subject to revision at any time.Accordingly, we are not able to predict whether our current credit ratings will remain consistent over time. Factors that could affect our credit ratings includechanges in our operating performance, the general economic environment, conditions in the retail industry, our financial position, including our total debt andcapitalization, and changes in our business strategy. Any downgrade of our credit ratings by a credit rating agency could increase our future borrowing costs orimpair our ability to access capital and credit markets on terms commercially acceptable to us. In addition, any downgrade of our current short-term credit ratingscould impair our ability to access the commercial paper markets with the same flexibility that we have experienced historically, potentially requiring us to relymore heavily on more expensive types of debt financing. The credit rating agency ratings are not recommendations to buy, sell or hold our commercial paper ordebt securities. Each rating may be subject to revision or withdrawal at any time by the assigning rating organization and should be evaluated independently of anyother rating. Moreover, each credit rating is specific to the security to which it applies.
Other MattersIn Note 9 to our Condensed Consolidated Financial Statements, which is captioned "Contingencies" and appears in Part I of this Quarterly Report on Form 10-Qunder the caption " Item 1. Financial Statements ," we discuss, under the sub-caption "FCPA Investigation and Related Matters," our existing FCPA investigationand related matters and possible effects of those matters on Walmart's business. In that Note 9 , we also discuss, under the sub-caption "ASDA Equal ValueClaims," certain existing employment claims against ASDA. Further, in that Note 9 , we also discuss, under the sub-caption "National Prescription OpiateLitigation", the national prescription opiate litigation including certain risks arising therefrom. We also discuss various legal proceedings related to the FCPAinvestigation, ASDA Equal Value Claims, and National Prescription Opiate Litigation, in Part II of this Quarterly Report on Form 10-Q under the caption " Item 1.Legal Proceedings ," under the sub-caption "II. Certain Other Proceedings." The foregoing matters and other matters described elsewhere in this Quarterly Reporton Form 10-Q represent contingent liabilities of the Company that may or may not result in the incurrence of a material liability by the Company upon their finalresolution.
Item 3. Quantitative and Qualitative Disclosures about Market RiskMarket risks relating to our operations result primarily from changes in interest rates or currency exchange rates, as well as changes in the market value of ourinvestments. Our market risks at April 30, 2018 , are similar to those disclosed in our Form 10-K for the fiscal year ended January 31, 2018 .
Interest Rate RiskAt April 30, 2018 , the fair value of our derivative instruments decreased approximately $0.1 billion since January 31, 2018 , primarily due to fluctuations inmarket interest rates and currency rates during the three months ended April 30, 2018 .
Foreign Currency RiskMovements in currency exchange rates and the related impact on the translation of the balance sheets of the Company's subsidiaries in the UK and Mexico werethe primary cause of the $1.3 billion net gain for the three months ended April 30, 2018 , in the currency translation and other category of accumulated othercomprehensive loss.
Investment Risk
We are exposed to changes in the JD.com ("JD") stock price as a result of our equity investment in JD. At April 30, 2018 , the fair value of our equity investmentin JD was $5.3 billion . Since February 1, 2018, when we adopted the new financial instrument accounting standard, the fair value decreased approximately $1.8billion due to a decrease in the stock price of JD.The information concerning market risk under the sub-caption "Market Risk" of the caption "Management's Discussion and Analysis of Financial Condition andResults of Operations" on pages 19 and 20 of the parts of our Annual Report to Shareholders for the fiscal year ended January 31, 2018 , which is incorporated inand included in our Annual Report on Form 10-K for the fiscal year ended January 31, 2018 , is hereby incorporated by reference into this Quarterly Report onForm 10-Q.
33

Table of Contents
Item 4. Controls and ProceduresWe maintain disclosure controls and procedures that are designed to provide reasonable assurance that information, which is required to be timely disclosed, isaccumulated and communicated to management in a timely fashion. In designing and evaluating such controls and procedures, we recognize that any controls andprocedures, no matter how well designed and operated, can provide only reasonable assurance of achieving the desired control objectives. Our management isnecessarily required to use judgment in evaluating controls and procedures. Also, we have investments in unconsolidated entities. Since we do not control ormanage those entities, our controls and procedures with respect to those entities are substantially more limited than those we maintain with respect to ourconsolidated subsidiaries.In the ordinary course of business, we review our internal control over financial reporting and make changes to our systems and processes to improve such controlsand increase efficiency, while ensuring that we maintain an effective internal control environment. Changes may include such activities as implementing new,more efficient systems, updating existing systems, automating manual processes, standardizing controls globally, migrating certain processes to our shared servicesorganizations and increasing monitoring controls. These changes have not materially affected, and are not reasonably likely to materially affect, the Company'sinternal control over financial reporting. However, they allow us to continue to enhance our internal controls over financial reporting and ensure that they remaineffective.An evaluation of the effectiveness of the design and operation of our disclosure controls and procedures as of the end of the period covered by this report wasperformed under the supervision and with the participation of management, including our Chief Executive Officer and Chief Financial Officer. Based upon thatevaluation, our Chief Executive Officer and Chief Financial Officer concluded that our disclosure controls and procedures are effective to provide reasonableassurance that information required to be disclosed by the Company in the reports that it files or submits under the Securities Exchange Act of 1934, as amended, isaccumulated and communicated to management, including our Chief Executive Officer and Chief Financial Officer, as appropriate, to allow timely decisionsregarding required disclosure and are effective to provide reasonable assurance that such information is recorded, processed, summarized and reported within thetime periods specified by the SEC's rules and forms.There has been no change in the Company's internal control over financial reporting as of April 30, 2018 , that has materially affected, or is reasonably likely tomaterially affect, the Company's internal control over financial reporting.
34

Table of Contents
PART II. OTHER INFORMATION
Item 1. Legal Proceedings
I. SUPPLEMENTAL INFORMATION: We discuss certain legal proceedings in Part I of this Quarterly Report on Form 10-Q under the caption "Item 1.Financial Statements," in Note 9 to our Condensed Consolidated Financial Statements, which is captioned "Contingencies," under the sub-caption "LegalProceedings,". We refer you to that discussion for important information concerning those legal proceedings, including the basis for such actions and, whereknown, the relief sought. We provide the following additional information concerning those legal proceedings, including the name of the lawsuit, the court inwhich the lawsuit is pending, and the date on which the petition commencing the lawsuit was filed.ASDA Equal Value Claims: Ms S Brierley & Others v ASDA Stores Ltd (2406372/2008 & Others - Manchester Employment Tribunal); ASDA Stores Ltd vBrierley & Ors (A2/2016/0973 - United Kingdom Court of Appeal); ASDA Stores Ltd v Ms S Brierley & Others (UKEAT/0059/16/DM - United KingdomEmployment Appeal Tribunal); ASDA Stores Ltd v Ms S Brierley & Others (UKEAT/0009/16/JOJ - United Kingdom Employment Appeal Tribunal).National Prescription Opiate Litigation: In re National Prescription Opiate Litigation (MDL No. 2804) (the "MDL") which includes sixty-nine (69) cases as ofMay 30, 2018; Thirty-one (31) cases are in the process of being transferred to the MDL or have remand motions pending; There are fourteen (14) additional statecases pending as of May 30, 2018: Board of County Commissioners of Ottawa County, Oklahoma v. Purdue Pharma LP, et al., Okla. Dist. Ct., Ottawa Cty.,4/24/2018; Board of County Commissioners of Delaware County, Oklahoma v. Purdue Pharma LP, et al., Okla. Dist. Ct., Del. Cty., 4/24/2018; Levy County v.Purdue Pharma L.P., et al., Fl. Cir. Ct., 8th Jud. Cir., Levy Cty., 4/9/2018; Palm Beach County v. Purdue Pharma, L.P., et al., Fl. Cir. Ct., 15th Jud. Cir., PalmBeach Cty., 4/5/2018; Cty. of Greenville v. Rite Aid of S.C., Inc., et al., SC Ct. of Common Pleas, 13th Judicial Dist., 3/5/2018; Odyssey House La., Inc. v. Morris& Dickson Co., et al., LA Civil Dist. Ct., New Orleans Parish, 2/6/2018; Brooke Cty. Comm'n v. Purdue Pharma L.P., et al., WV Circuit Ct., Marshall County,12/13/2017; Hancock Cty. Comm'n v. Purdue Pharma L.P., et al., WV Circuit Ct., Marshall County, 12/13/2017; Harrison Cty. Comm'n v. Purdue Pharma L.P., etal., WV Circuit Ct., Marshall County, 12/13/2017; Lewis Cty. Comm'n v. Purdue Pharma L.P., et al., WV Circuit Ct., Marshall County, 12/13/2017; Marshall Cty.Comm'n v. Purdue Pharma L.P., et al., WV Circuit Ct., Marshall County, 12/13/2017; Ohio Cty. Comm'n v. Purdue Pharma L.P., et al., WV Circuit Ct., MarshallCounty, 12/13/2017; Tyler Cty. Comm'n v. Purdue Pharma L.P., et al., WV Circuit Ct., Marshall County, 12/13/2017; Wetzel Cty. Comm'n v. Purdue Pharma L.P.,et al., WV Circuit Ct., Marshall County, 12/13/2017.
II. CERTAIN OTHER PROCEEDINGS: The Company is a defendant in several lawsuits in which the complaints closely track the allegations set forth in anews story that appeared in The New York Times ( the " Times " ) on April 21, 2012. One of these is a securities lawsuit that was filed on May 7, 2012, in theUnited States District Court for the Middle District of Tennessee, and subsequently transferred to the Western District of Arkansas, in which the plaintiff allegesvarious violations of the U.S. Foreign Corrupt Practices Act (the "FCPA") beginning in 2005, and asserts violations of Sections 10(b) and 20(a) of the SecuritiesExchange Act of 1934, as amended, relating to certain prior disclosures of the Company. The plaintiff seeks to represent a class of shareholders who purchased oracquired stock of the Company between December 8, 2011, and April 20, 2012, and seeks damages and other relief based on allegations that the defendants'conduct affected the value of such stock. On September 20, 2016, the court granted plaintiff's motion for class certification. On October 6, 2016, the defendantsfiled a petition to appeal the class certification ruling to the U.S. Court of Appeals for the Eighth Circuit. On November 7, 2016, the U.S. Court of Appeals for theEighth Circuit denied the Company's petition.In addition, a number of derivative complaints have been filed in Delaware and Arkansas, also tracking the allegations of the Times story, and naming variouscurrent and former directors and certain former officers as additional defendants. The plaintiffs in the derivative suits (in which the Company is a nominaldefendant) allege, among other things, that the defendants who are or were directors or officers of the Company breached their fiduciary duties in connection withtheir oversight of FCPA compliance. All of the derivative suits have been combined into two consolidated proceedings, one of which was consolidated in theUnited States District Court for the Western District of Arkansas and the other in the Delaware Court of Chancery. On March 31, 2015, the Western District ofArkansas granted the defendants' motion to dismiss the consolidated derivative proceedings in that court. On April 15, 2015, plaintiffs filed their notice of appealwith the United States Court of Appeals for the Eighth Circuit. On July 22, 2016, the United States Court of Appeals for the Eighth Circuit affirmed the dismissalof the consolidated derivative proceedings in Arkansas. There was no appeal from that ruling. On May 13, 2016, the Delaware Court of Chancery granted thedefendants' motion to dismiss the consolidated derivative proceedings in that court. On June 10, 2016, plaintiffs in the Delaware consolidated derivativeproceedings filed their notice of appeal to the Delaware Supreme Court. On January 25, 2018, the Delaware Supreme Court affirmed the dismissal of theconsolidated derivative proceedings in Delaware.Management does not believe any possible loss or the range of any possible loss that may be incurred in connection with these proceedings will be material to theCompany's financial condition or results of operations.Securities Class Action: City of Pontiac General Employees Retirement System v. Wal-Mart Stores, Inc., USDC, Western Dist. of AR; 5/7/12.
35

Table of Contents
Derivative Lawsuits: In re Wal-Mart Stores, Inc. Delaware Derivative Litigation, Delaware Ct. of Chancery, 4/25/12; Delaware Supreme Court, Dover, DE;6/10/16.
III. ENVIRONMENTAL MATTERS: Item 103 of SEC Regulation S-K requires disclosure of certain environmental matters. The following matters aredisclosed in accordance with that requirement. For the matters listed below, management does not believe any possible loss or the range of any possible loss thatmay be incurred in connection with each matter, individually or in the aggregate, will be material to the Company's financial condition or results of operations.On March 6, 2018, the Ecology Protection Prosecutor of the State of Guerrero (Procuraduría de Protección Ecológica de Guerrero) in Mexico imposed a fine of$474,091 for the absence of an Environmental Impact Authorization License of the waste management plan, related to the 12 stores located in that State. TheCompany plans to challenge the fine before an administrative court.On January 25, 2018, the Environmental Prosecutor of the State of Chiapas (Procuraduría Ambiental del Estado de Chiapas) in Mexico imposed a fine of $163,000for the absence of an Environmental Impact Authorization License related to the store Mi Bodega Las Rosas. The Company is challenging the fine at a trial beforean administrative court.In May 2017, WMS Supermercados do Brasil Ltda ("Walmart Brazil") self-reported to the relevant municipal environmental agency, and proposed a remediationplan for, an oil contamination in the soil and underground water at the Walmart and Sam's Club store location in Barueri, São Paulo (Tamboré), whichcontamination had been confirmed by an internal investigation in April 2017. Walmart Brazil is cooperating with the agency, including seeking authorization tostart a remediation plan.In April 2017, the California Air Resources Board ("ARB") notified the Company that it had taken the position that retailers are required to use unclaimed depositscollected on sales of small containers of automotive refrigerant to fund certain consumer education programs. The ARB alleged that the Company had improperlyretained approximately $4.2 million in unclaimed deposits and has sought reimbursement. The Company has denied any wrongdoing.In November and December 2016, the Environmental and Natural History Ministry of Chiapas, Mexico ("Ministry") notified a subsidiary of the Company,Arrendadora de Centros Comerciales, S. de R.L. de C.V. ("Arrendadora"), that it was proposing aggregated penalties approximating $430,000 in respect to fourstores which the Ministry believed may have been constructed without first obtaining a required environmental impact license. Arrendadora has challenged thepenalties before an administrative court and the trials are in process. The Ministry had previously proposed penalties of approximately $640,000 related to thismatter in 2014, but Arrendadora was released by an administrative court from payment of such penalties on the basis that the Ministry had failed to comply withlegal formalities in connection with their imposition.On April 6, 2015, representatives for the Brazilian Institute of the Environment alleged that Walmart Brazil had failed to file required reports documenting thenumber of tires imported, sold and recycled. The agency proposed a penalty of approximately $857,000, which may be doubled and excludes additional amounts inrespect of inflation and interest, and prohibited Walmart Brazil from selling or importing tires until the matter is resolved. In October 2015, Walmart Brazil filed itsdefense with the agency against the imposition of this penalty.In April 2013, a subsidiary of the Company, Corporacion de Compañias Agroindustriales, operating in Costa Rica, became aware that the Municipality ofCurridabat is seeking a penalty of approximately $380,000 in connection with the construction of a retaining wall seventeen years ago for a perishables distributioncenter that is situated along a protected river bank. The subsidiary obtained permits from the Municipality and the Secretaria Técnica Nacional Ambiental at thetime of construction, but the Municipality now alleges that the wall is non-conforming.In January 2011, the Environmental Department of Porto Alegre Municipality formally notified Walmart Brazil of soil inspection reports indicating soilcontamination due to leakage of oil from power generating equipment at nine store locations in Brazil. Walmart Brazil is cooperating with the agency as well as theDistrict Attorney's Office for the State of Rio Grande do Sul and has filed a mitigation plan to address the situation.
36

Table of Contents
Item 1A. Risk Factors
In addition to the other information set forth in this report, you should carefully consider the risk factors disclosed in Item 1A, "Risk Factors" of our Annual Reporton Form 10-K for the fiscal year ended January 31, 2018 , which risks could materially and adversely affect our business, results of operations, financial condition,and liquidity. No material change in the risk factors discussed in such Form 10-K has occurred. Such risk factors do not identify all risks that we face because ourbusiness operations could also be affected by additional factors that are not presently known to us or that we currently consider to be immaterial to our operations.Our business operations could also be affected by additional factors that apply to all companies operating in the U.S. and globally.
Item 2. Unregistered Sales of Equity Securities and Use of ProceedsFrom time to time, the Company repurchases shares of its common stock under share repurchase programs authorized by the Company's Board of Directors. Allrepurchases made during the three months ended April 30, 2018 were made under the plan in effect at the beginning of the fiscal year. The current $20.0 billionshare repurchase program approved in October 2017 has no expiration date or other restrictions limiting the period over which the Company can make sharerepurchases. As of April 30, 2018 , authorization for $18.3 billion of share repurchases remained under the current share repurchase program. Any repurchasedshares are constructively retired and returned to an unissued status.The Company regularly reviews its share repurchase activity and considers several factors in determining when to execute share repurchases, including, amongother things, current cash needs, capacity for leverage, cost of borrowings and the market price of its common stock. Share repurchase activity under our sharerepurchase program, on a trade date basis, for the three months ended April 30, 2018 , was as follows:
Fiscal Period
TotalNumber of
SharesPurchased
AveragePrice Paidper Share
Total Number ofShares Purchasedas Part of Publicly
Announced Plans orPrograms
Approximate Dollar Value of Shares that
May Yet BePurchased Under thePlans or Programs (1)
(billions)February 1-28, 2018 5,225,381 $ 97.20 5,225,381 $ 18.3
March 1-31, 2018 — — — 18.3
April 1-30, 2018 — — — 18.3
Total 5,225,381 5,225,381
(1) Represents approximate dollar value of shares that could have been purchased under the plan in effect at the end of the month.
Item 5. Other Information
Cautionary Statement Regarding Forward-Looking StatementsThis Quarterly Report on Form 10-Q contains statements that Walmart believes are "forward-looking statements" within the meaning of the Private SecuritiesLitigation Reform Act of 1995. Those forward-looking statements are intended to enjoy the protection of the safe harbor for forward-looking statements providedby that Act.
Forward-looking StatementsThe forward-looking statements in this report include:
• statements in Note 1 to Walmart's Condensed Consolidated Financial Statements as of and for the three months ended April 30, 2018 , regardingmanagement's expectations of or determinations regarding the materiality of any impact of certain ASUs issued by the FASB; statements in Note 6 tothose Condensed Consolidated Financial Statements regarding the expected insignificance of any ineffective portion of certain net investment and cashflow derivative financial instruments to which Walmart is a party and of the amounts relating to such derivative financial instruments expected to bereclassified from accumulated other comprehensive loss to net income in the next 12 months; a statement in Note 8 to those Condensed ConsolidatedFinancial Statements regarding the payment of dividends in fiscal 2019 ; statements in Note 9 to those Condensed Consolidated Financial Statementsregarding the possible outcome of, and future effect on Walmart's financial condition and results of operations of, certain litigation and other proceedingsto which Walmart is a party, the possible outcome of, and future effect on Walmart's business of, certain other matters to which Walmart is subject,including Walmart's existing FCPA matters, and the liabilities, losses, expenses and costs that Walmart may incur in connection with such matters; andstatements in Note 10 to the anticipated impacts to the operations of the Company's Walmart International segment regarding the announced Asda,Flipkart and Walmart Brazil transactions.;
• in Part I, Item 2 " Management's Discussion and Analysis of Financial Condition and Results of Operations ": statements under the caption " Overview "relating to the possible impact of volatility in currency exchange rates on the results, including net sales and operating income, of Walmart and theWalmart International segment; statements under
37

Table of Contents
the caption " Company Performance Metrics - Strong, Efficient Growth " regarding the focus of our investments and the impact of such investments;statements under the caption " Company Performance Metrics ", and the "- Returns" sub-heading under that caption, regarding our belief that returns oncapital will improve as we execute on our strategic framework; statements under the caption " Results of Operations - Consolidated Results of Operations" regarding the possibility of fluctuations in Walmart's effective income tax rate from quarter to quarter and the factors that may cause those fluctuations;a statement under the caption " Results of Operations - Sam's Club Segment " relating to the possible continuing impact of volatility in fuel prices on thefuture operating results of the Sam's Club segment; a statement under the caption " Liquidity and Capital Resources - Liquidity " that Walmart's sourcesof liquidity will be adequate to fund its operations, finance its global investment and expansion activities, pay dividends and fund share repurchases;statements under the caption " Liquidity and Capital Resources - Liquidity - Net Cash Provided by Operating Activities - Cash Equivalents and WorkingCapital " regarding management's expectation that domestic liquidity needs will be met through funding sources other than earnings held outside of theUnited States, Walmart's intent with respect to its reinvestment of such earnings in its foreign operations, its need to repatriate such earnings andmanagement's expectations with respect to the effect on Walmart's overall liquidity, financial condition and results of operations of local laws, otherlimitations or potential taxes on repatriation of such cash; a statement under the caption " Liquidity and Capital Resources Liquidity - Net Cash Used inFinancing Activities - Dividends " regarding the payment of dividends in fiscal 2019 ; and statements under the caption " Liquidity and Capital Resources- Capital Resources " regarding management's expectations regarding the Company's cash flows from operations, current cash position and access tocapital markets continuing to be sufficient to meet its anticipated operating cash needs, the Company's commercial paper and long-term debt ratingscontinuing to enable it to refinance its debts at favorable rates, factors that could affect its credit ratings, and the effect that lower credit ratings wouldhave on its access to capital and credit markets and borrowing costs;
• in Part I, Item 4 " Controls and Procedures ": the statements regarding the effect of changes to systems and processes on our internal control over financialreporting; and
• statements in Part II, Item 1 " Legal Proceedings " regarding the effect that possible losses or the range of possible losses that might be incurred inconnection with the legal proceedings and other matters discussed therein may have on our financial condition or results of operations.
Risks, Factors and Uncertainties Regarding our BusinessThese forward-looking statements are subject to risks, uncertainties and other factors, domestically and internationally, including:
Economic Factors
• economic, geo-political, capital markets and business conditions, trends and events around the world and in the markets in which Walmart operates;• currency exchange rate fluctuations;• changes in market rates of interest;• changes in market levels of wages;• changes in the size of various markets, including eCommerce markets;• unemployment levels;• inflation or deflation, generally and in certain product categories;• transportation, energy and utility costs;• commodity prices, including the prices of oil and natural gas;• consumer confidence, disposable income, credit availability, spending levels, shopping patterns, debt levels, and demand for certain merchandise;• trends in consumer shopping habits around the world and in the markets in which Walmart operates;• consumer enrollment in health and drug insurance programs and such programs' reimbursement rates and drug formularies; and• initiatives of competitors, competitors' entry into and expansion in Walmart's markets, and competitive pressures;Operating Factors
• the amount of Walmart's net sales and operating expenses denominated in U.S. dollar and various foreign currencies;• the financial performance of Walmart and each of its segments, including the amounts of Walmart's cash flow during various periods;• Walmart's need to repatriate earnings held outside of the United States and changes in U.S. and international tax regulations;• customer traffic and average ticket in Walmart's stores and clubs and on its eCommerce platforms;• the mix of merchandise Walmart sells and its customers purchase;• the availability of goods from suppliers and the cost of goods acquired from suppliers;
38

Table of Contents
• the effectiveness of the implementation and operation of Walmart's strategies, plans, programs and initiatives;• the impact of acquisitions, divestitures, store or club closures, and other strategic decisions;• Walmart's ability to successfully integrate acquired businesses, including within the eCommerce space;• unexpected changes in Walmart's objectives and plans;• the amount of shrinkage Walmart experiences;• consumer acceptance of and response to Walmart's stores and clubs, eCommerce websites, mobile apps, programs and merchandise offerings, including
the Walmart U.S. segment's Grocery Pickup program;• new methods of delivery of purchased merchandise to customers;• Walmart's gross profit margins, including pharmacy margins and margins of other product categories;• the selling prices of gasoline and diesel fuel;• disruption of seasonal buying patterns in Walmart's markets;• Walmart's expenditures for FCPA and other compliance-related costs, including the adequacy of our accrual for the FCPA matter;• disruptions in Walmart's supply chain;• cybersecurity events affecting Walmart and related costs and impact of any disruption in business;• Walmart's labor costs, including healthcare and other benefit costs;• Walmart's casualty and accident-related costs and insurance costs;• the size of and turnover in Walmart's workforce and the number of associates at various pay levels within that workforce;• the availability of necessary personnel to staff Walmart's stores, clubs and other facilities;• delays in the opening of new, expanded or relocated units;• developments in, and the outcome of, legal and regulatory proceedings and investigations to which Walmart is a party or is subject, and the liabilities,
obligations and expenses, if any, that Walmart may incur in connection therewith;• changes in the credit ratings assigned to the Company's commercial paper and debt securities by credit rating agencies;• Walmart's effective tax rate; and• unanticipated changes in accounting judgments and estimates;Regulatory and Other Factors
• changes in existing, tax, labor and other laws and changes in tax rates, including the enactment of laws and the adoption and interpretation ofadministrative rules and regulations;
• adoption or creation of new, and modification of existing, governmental policies, programs, initiatives and actions in the markets in which Walmartoperates and elsewhere and actions with respect to such policies, programs and initiatives;
• the possibility of imposition of new taxes on imports and new tariffs and trade restrictions and changes in existing tariff rates and trade restrictions;• changes in currency control laws;• changes in the level of public assistance payments;• the timing of federal income tax refunds;• natural disasters, public health emergencies, civil disturbances, and terrorist attacks; and• changes in generally accepted accounting principles in the United States.
Other Risk Factors; No Duty to UpdateThis Quarterly Report on Form 10-Q should be read in conjunction with Walmart's Annual Report on Form 10-K for the fiscal year ended January 31, 2018 and allof Walmart's subsequent other filings, including Quarterly Reports on Form 10-Q and Current Reports on Form 8-K, made with the SEC. Walmart urges the readerto consider all of these risks, uncertainties and other factors carefully in evaluating the forward-looking statements contained in this Quarterly Report on Form 10-Q. The Company cannot assure you that the results or developments anticipated by the Company and reflected or implied by any forward-looking statementcontained in this Quarterly Report on Form 10-Q will be realized or, even if substantially realized, that those results or developments will result in the forecasted orexpected consequences for the Company or affect the Company, its operations or its financial performance as the Company has forecasted or expected. As a resultof the matters discussed above and other matters, including changes in facts, assumptions not being realized or other factors, the actual results relating to thesubject matter of any forward-looking statement in this Quarterly Report on Form 10-Q may differ materially from the anticipated results expressed or implied inthat forward-looking statement. The forward-looking statements included in this Quarterly Report on Form 10-Q are made only as of the date of this report, andWalmart undertakes no obligation to update any such statements to reflect subsequent events or circumstances.
Item 6. ExhibitsThe required exhibits are included at the end of the Form 10-Q or are incorporated herein by reference and are described in the Index to Exhibits immediatelyfollowing the signatures page.
39

Table of Contents
SIGNATURES
Pursuant to the requirements of the Securities Exchange Act of 1934, the registrant has duly caused this report to be signed on its behalf by the undersignedthereunto duly authorized.
WALMART INC.
Date: June 4, 2018 By: /s/ C. Douglas McMillon
C. Douglas McMillonPresident and Chief Executive Officer
(Principal Executive Officer)
Date: June 4, 2018 By: /s/ M. Brett Biggs
M. Brett BiggsExecutive Vice President and Chief Financial Officer
(Principal Financial Officer)
Date: June 4, 2018 By: /s/ David M. Chojnowski
David M. ChojnowskiSenior Vice President and Controller
(Principal Accounting Officer)
40

Table of Contents
Index to Exhibits
The following documents are filed as an exhibit to this Quarterly Report on Form 10-Q:
Exhibit 3.1
Restated Certificate of Incorporation of the Company dated February 1, 2018 is incorporated herein by reference to Exhibit 3.1 tothe Report on Form 8-K that the Company filed on February 1, 2018 (File No. 001-06991)
Exhibit 3.2
Amended and Restated Bylaws of the Company are incorporated herein by reference to Exhibit 3.2 to the Report on Form 8-K thatthe Company filed on February 1, 2018 (File No. 001-06991)
Exhibit 12.1* Ratio of Earnings to Fixed Charges Exhibit 31.1* Chief Executive Officer Section 302 Certification Exhibit 31.2* Chief Financial Officer Section 302 Certification Exhibit 32.1** Chief Executive Officer Section 906 Certification Exhibit 32.2** Chief Financial Officer Section 906 Certification Exhibit 99
The information incorporated by reference in Part I, Item 3 of this Quarterly Report on Form 10-Q is incorporated herein byreference to the material set forth under the sub-caption "Market Risk" in Management's Discussion and Analysis of FinancialCondition and Results of Operations, which is contained in the Company's Annual Report on Form 10-K for the year endedJanuary 31, 2018, as filed with the SEC.
Exhibit 101.INS* XBRL Instance Document Exhibit 101.SCH* XBRL Taxonomy Extension Schema Document Exhibit 101.CAL* XBRL Taxonomy Extension Calculation Linkbase Document Exhibit 101.DEF* XBRL Taxonomy Extension Definition Linkbase Document Exhibit 101.LAB* XBRL Taxonomy Extension Label Linkbase Document Exhibit 101.PRE* XBRL Taxonomy Extension Presentation Linkbase Document
* Filed herewith as an Exhibit.** Furnished herewith as an Exhibit.
41

Exhibit 12.1
Walmart Inc.Ratio of Earnings to Fixed Charges
Three Months Ended Fiscal Years Ended April 30, January 31,
(Amounts in millions) 2018 2017 2018 2017 2016 2015 2014
Income before income taxes (1) $ 2,822 $ 4,674 $ 15,123 $ 20,497 $ 21,638 $ 24,799 $ 24,656
Capitalized interest (4) (6) (17) (36) (39) (59) (78)
Consolidated net income attributable to the noncontrolling interest (142) (113) (661) (650) (386) (736) (673)
Adjusted income before income taxes 2,676 4,555 14,445 19,811 21,213 24,004 23,905
Fixed charges:
Interest (2) 534 604 2,347 2,403 2,587 2,520 2,413
Interest component of rent 258 206 890 862 836 916 933
Total fixed charges 792 810 3,237 3,265 3,423 3,436 3,346
Income before income taxes and fixed charges $ 3,468 $ 5,365 $ 17,682 $ 23,076 $ 24,636 $ 27,440 $ 27,251
Ratio of earnings to fixed charges 4.4 6.6 5.5 7.1 7.2 8.0 8.1
(1) Effective February 1, 2018, changes in fair values of the Company's equity investments are included in income before income taxes. (2) Includes interest on debt, capital leases and financing obligations, amortization of debt issuance costs and capitalized interest; excludes loss on extinguishment of debt.

Exhibit 31.1
I, C. Douglas McMillon, certify that:1. I have reviewed this Quarterly Report on Form 10-Q of Walmart Inc. (the "registrant");2. Based on my knowledge, this report does not contain any untrue statement of a material fact or omit to state a material fact necessary to make the
statements made, in light of the circumstances under which such statements were made, not misleading with respect to the period covered by thisreport;
3. Based on my knowledge, the financial statements, and other financial information included in this report, fairly present in all material respects thefinancial condition, results of operations and cash flows of the registrant as of, and for, the periods presented in this report;
4. The registrant's other certifying officer and I are responsible for establishing and maintaining disclosure controls and procedures (as defined inExchange Act Rules 13a-15(e) and 15d-15(e)) and internal control over financial reporting (as defined in Exchange Act Rules 13a-15(f) and 15d-15(f))for the registrant and have:
a) designed such disclosure controls and procedures, or caused such disclosure controls and procedures to be designed under our supervision, toensure that material information relating to the registrant, including its consolidated subsidiaries, is made known to us by others within thoseentities, particularly during the period in which this report is being prepared;
b) designed such internal control over financial reporting, or caused such internal control over financial reporting to be designed under oursupervision, to provide reasonable assurance regarding the reliability of financial reporting and the preparation of financial statements forexternal purposes in accordance with generally accepted accounting principles;
c) evaluated the effectiveness of the registrant's disclosure controls and procedures and presented in this report our conclusions about theeffectiveness of the disclosure controls and procedures, as of the end of the period covered by this report, based on such evaluations; and
d) disclosed in this report any change in the registrant's internal control over financial reporting that occurred during the registrant's most recentfiscal quarter that has materially affected, or is reasonably likely to materially affect, the registrant's internal control over financial reporting.
5. The registrant's other certifying officer and I have disclosed, based on our most recent evaluation of internal control over financial reporting, to theregistrant's auditors and the Audit Committee of registrant's Board of Directors:
a) all significant deficiencies and material weaknesses in the design or operation of internal control over financial reporting which are reasonablylikely to adversely affect the registrant's ability to record, process, summarize and report financial information; and
b) any fraud, whether or not material, that involves management or other employees who have a significant role in the registrant's internal controlover financial reporting.
Date: June 4, 2018 /s/ C. Douglas McMillon
C. Douglas McMillonPresident and Chief Executive Officer

Exhibit 31.2
I, M. Brett Biggs, certify that:1. I have reviewed this Quarterly Report on Form 10-Q of Walmart Inc. (the "registrant");2. Based on my knowledge, this report does not contain any untrue statement of a material fact or omit to state a material fact necessary to make the
statements made, in light of the circumstances under which such statements were made, not misleading with respect to the period covered by thisreport;
3. Based on my knowledge, the financial statements, and other financial information included in this report, fairly present in all material respects thefinancial condition, results of operations and cash flows of the registrant as of, and for, the periods presented in this report;
4. The registrant's other certifying officer and I are responsible for establishing and maintaining disclosure controls and procedures (as defined inExchange Act Rules 13a-15(e) and 15d-15(e)) and internal control over financial reporting (as defined in Exchange Act Rules 13a-15(f) and 15d-15(f))for the registrant and have:
a) designed such disclosure controls and procedures, or caused such disclosure controls and procedures to be designed under our supervision, toensure that material information relating to the registrant, including its consolidated subsidiaries, is made known to us by others within thoseentities, particularly during the period in which this report is being prepared;
b) designed such internal control over financial reporting, or caused such internal control over financial reporting to be designed under oursupervision, to provide reasonable assurance regarding the reliability of financial reporting and the preparation of financial statements forexternal purposes in accordance with generally accepted accounting principles;
c) evaluated the effectiveness of the registrant's disclosure controls and procedures and presented in this report our conclusions about theeffectiveness of the disclosure controls and procedures, as of the end of the period covered by this report, based on such evaluations; and
d) disclosed in this report any change in the registrant's internal control over financial reporting that occurred during the registrant's most recentfiscal quarter that has materially affected, or is reasonably likely to materially affect, the registrant's internal control over financial reporting.
5. The registrant's other certifying officer and I have disclosed, based on our most recent evaluation of internal control over financial reporting, to theregistrant's auditors and the Audit Committee of registrant's Board of Directors:
a) all significant deficiencies and material weaknesses in the design or operation of internal control over financial reporting which are reasonablylikely to adversely affect the registrant's ability to record, process, summarize and report financial information; and
b) any fraud, whether or not material, that involves management or other employees who have a significant role in the registrant's internal controlover financial reporting.
Date: June 4, 2018 /s/ M. Brett Biggs
M. Brett BiggsExecutive Vice President and Chief Financial Officer

Exhibit 32.1
CERTIFICATION PURSUANT TO18 U.S.C. SECTION 1350 (AS ADOPTEDPURSUANT TO SECTION 906 OF THE
SARBANES-OXLEY ACT OF 2002)
In connection with the Quarterly Report of Walmart Inc. (the "Company") on Form 10-Q for the period ending April 30, 2018 as filed with the Securities andExchange Commission on the date hereof (the "Report"), I, C. Douglas McMillon, President and Chief Executive Officer of the Company, certify to my knowledgeand in my capacity as an officer of the Company, pursuant to 18 U.S.C. 1350, as adopted pursuant to Section 906 of the Sarbanes-Oxley Act of 2002, that:
1. The Report fully complies with the requirements of Section 13(a) or 15(d) of the Securities Exchange Act of 1934, as amended; and
2. The information contained in the Report fairly presents, in all material respects, the financial condition and results of operations of the Company as of thedates and for the periods expressed in the Report.
IN WITNESS WHEREOF, the undersigned has executed this Certificate, effective as of June 4, 2018 .
/s/ C. Douglas McMillonC. Douglas McMillonPresident and Chief Executive Officer

Exhibit 32.2
CERTIFICATION PURSUANT TO18 U.S.C. SECTION 1350 (AS ADOPTEDPURSUANT TO SECTION 906 OF THE
SARBANES-OXLEY ACT OF 2002)
In connection with the Quarterly Report of Walmart Inc. (the "Company") on Form 10-Q for the period ending April 30, 2018 as filed with the Securities andExchange Commission on the date hereof (the "Report"), I, M. Brett Biggs, Executive Vice President and Chief Financial Officer of the Company, certify to myknowledge and in my capacity as an officer of the Company, pursuant to 18 U.S.C. 1350, as adopted pursuant to Section 906 of the Sarbanes-Oxley Act of 2002,that:
1. The Report fully complies with the requirements of Section 13(a) or 15(d) of the Securities Exchange Act of 1934, as amended; and
2. The information contained in the Report fairly presents, in all material respects, the financial condition and results of operations of the Company as of thedates and for the periods expressed in the Report.
IN WITNESS WHEREOF, the undersigned has executed this Certificate, effective as of June 4, 2018 .
/s/ M. Brett BiggsM. Brett BiggsExecutive Vice President and Chief Financial Officer