Walking School Bus and Its Impact on BMI Janette Quarles, DrPH, CPH, MPH, MA, CCC/SLP University of...
33
Walking School Bus and Its Impact on BMI Janette Quarles, DrPH, CPH, MPH, MA, CCC/SLP University of Oklahoma Health Sciences Center
-
Upload
posy-warren -
Category
Documents
-
view
213 -
download
0
Transcript of Walking School Bus and Its Impact on BMI Janette Quarles, DrPH, CPH, MPH, MA, CCC/SLP University of...

Walking School Bus and Its Impact on BMI
Janette Quarles, DrPH,CPH, MPH, MA, CCC/SLP
University of Oklahoma Health Sciences Center

2
Mandatory DisclosureStatement
Dr. Janette Quarles and research team had no personal financial relationships with commercial interests relevant to
this presentation during the past 12 months.
3
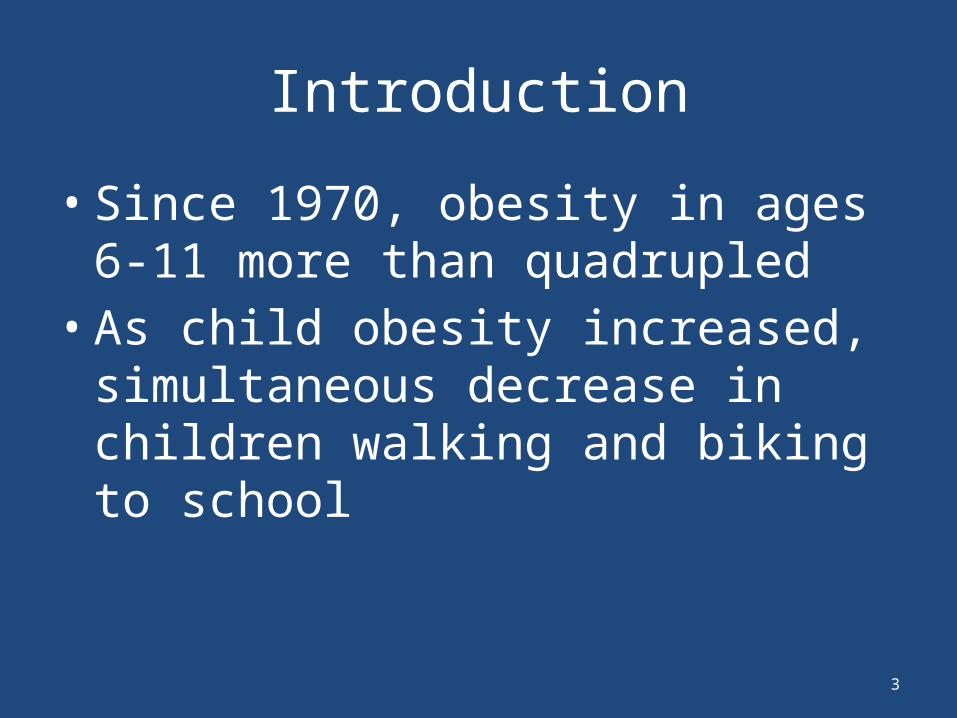
Introduction
• Since 1970, obesity in ages 6-11 more than quadrupled
• As child obesity increased, simultaneous decrease in children walking and biking to school

4
1966-69 1972-77 1978-83 1990-91 20010
10
20
30
40
50
Figure 1: Obesity trend and active commute to school, Alliance for
Biking and Walking, 2010.
% children who walk or bike to school% of children who are obese

5
Background
• Many families cannot – or will not – sacrifice time or money to purposely pursue exercise
• Normal daily routines can be useful to increase physical activity
• For children, a normal daily routine is the trip to and from school
6
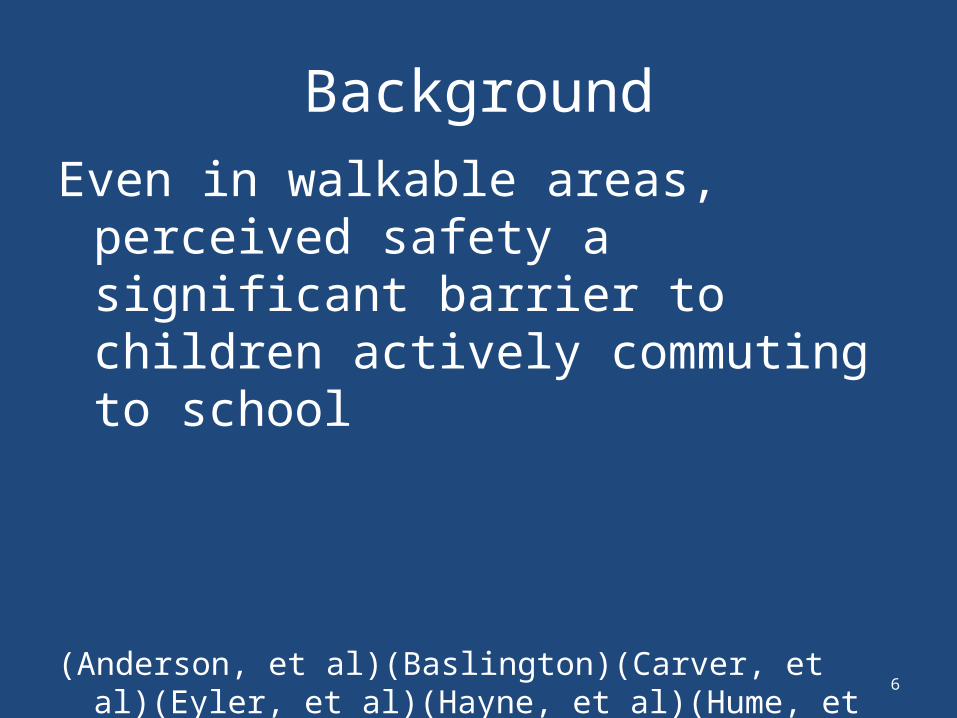
Background
Even in walkable areas, perceived safety a significant barrier to children actively commuting to school
(Anderson, et al)(Baslington)(Carver, et al)(Eyler, et al)(Hayne, et al)(Hume, et al)(Lorenc, et al)(Merom, et al)(Ridgewell, et al)(Sallis, et al, 2009)(Zhu, et al)

7
Introduction
Many parents’ work schedules – or other life situations – prevent them from walking the child to school
Research indicated parents allow children to walk to school when chaperoned
(Hayne, et al)(Johnston)(Kingham, et al)(National Center for Bicycling and Walking)

8
Walking School Bus
• Adult-chaperoned walk-to-school program
• Follows same route each day• Has a specific starting point…
…safe place for children to gather
9
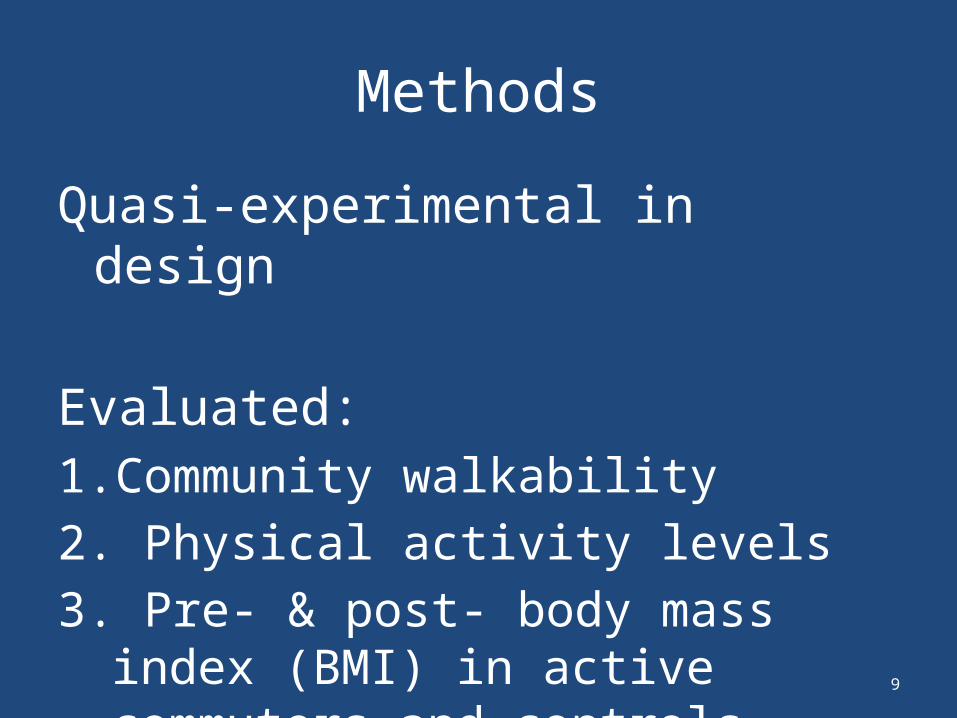
Methods
Quasi-experimental in design
Evaluated:1. Community walkability
2. Physical activity levels
3. Pre- & post- body mass index (BMI) in active commuters and controls
10
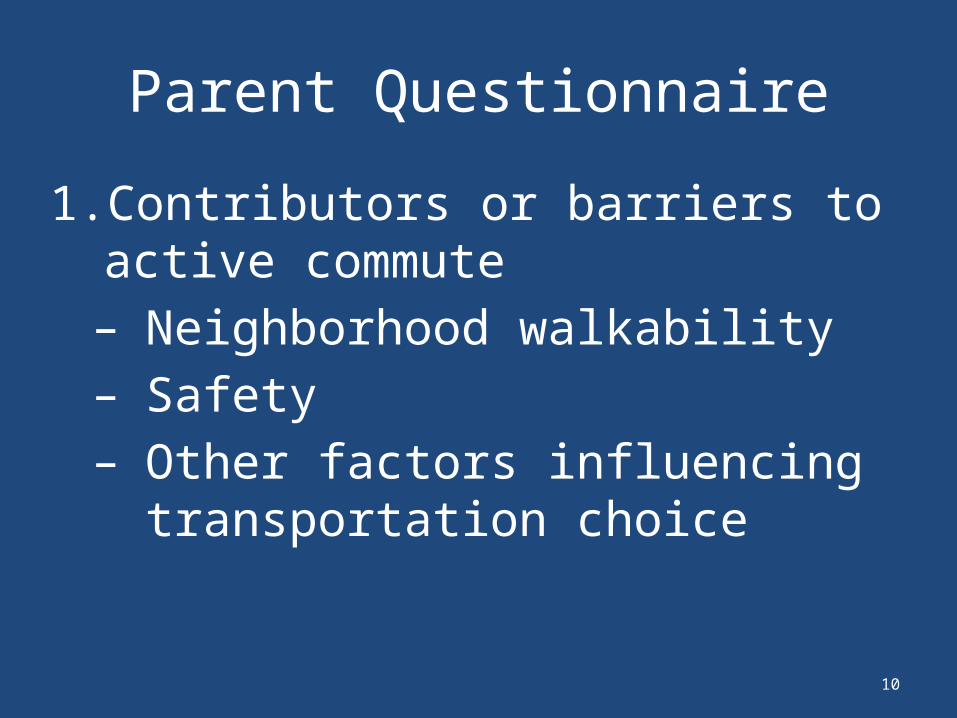
Parent Questionnaire
1. Contributors or barriers to active commute– Neighborhood walkability– Safety– Other factors influencing
transportation choice

11
Parent Questionnaire
2. Dose response – Distance and frequency of active commute
3. Confounders– Measures of recreational physical activity
4. Differing beliefs for the active commute vs. other outdoor activities
12
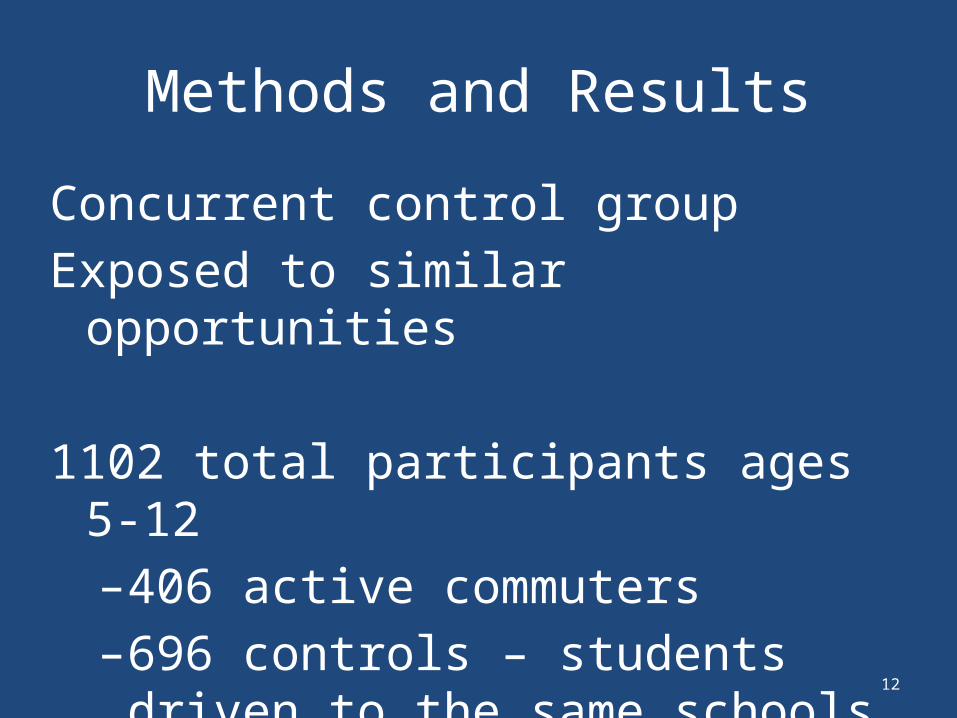
Methods and Results
Concurrent control group
Exposed to similar opportunities
1102 total participants ages 5-12–406 active commuters–696 controls – students driven to the
same schools
13
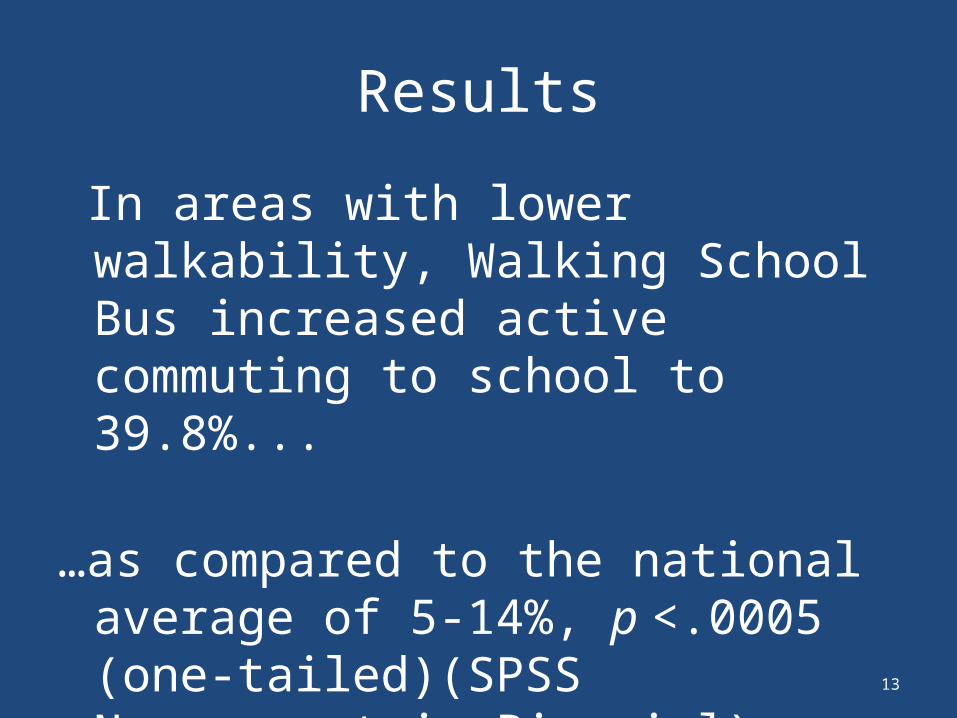
Results
In areas with lower walkability, Walking School Bus increased active commuting to school to 39.8%...
…as compared to the national average of 5-14%, p <.0005 (one-tailed)(SPSS Nonparametric Binomial)…
14
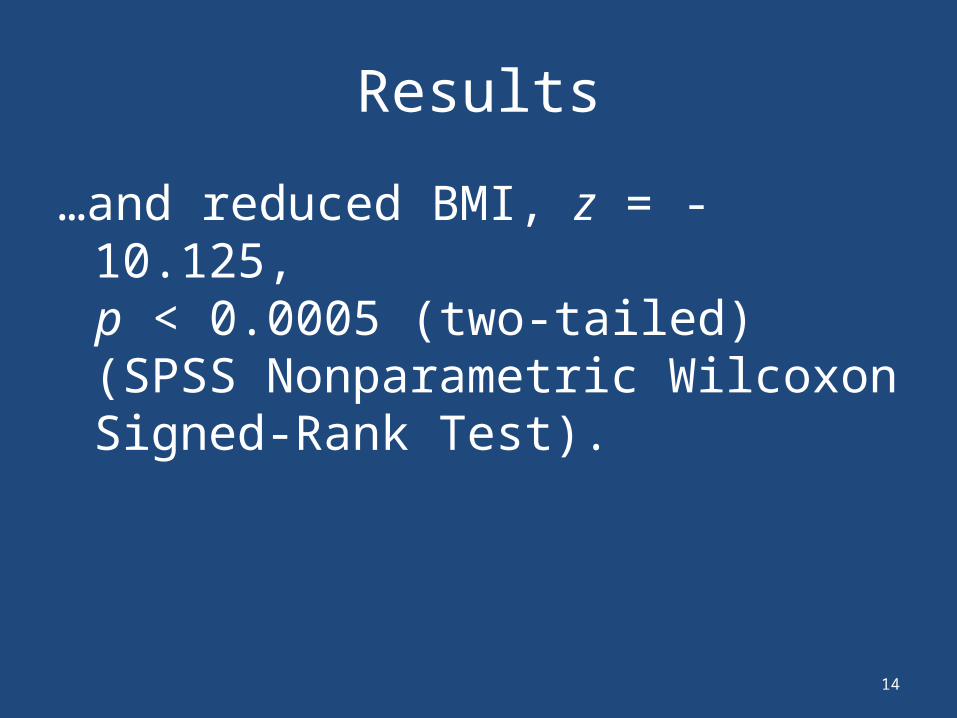
Results
…and reduced BMI, z = -10.125, p < 0.0005 (two-tailed) (SPSS
Nonparametric Wilcoxon Signed-Rank Test).
15
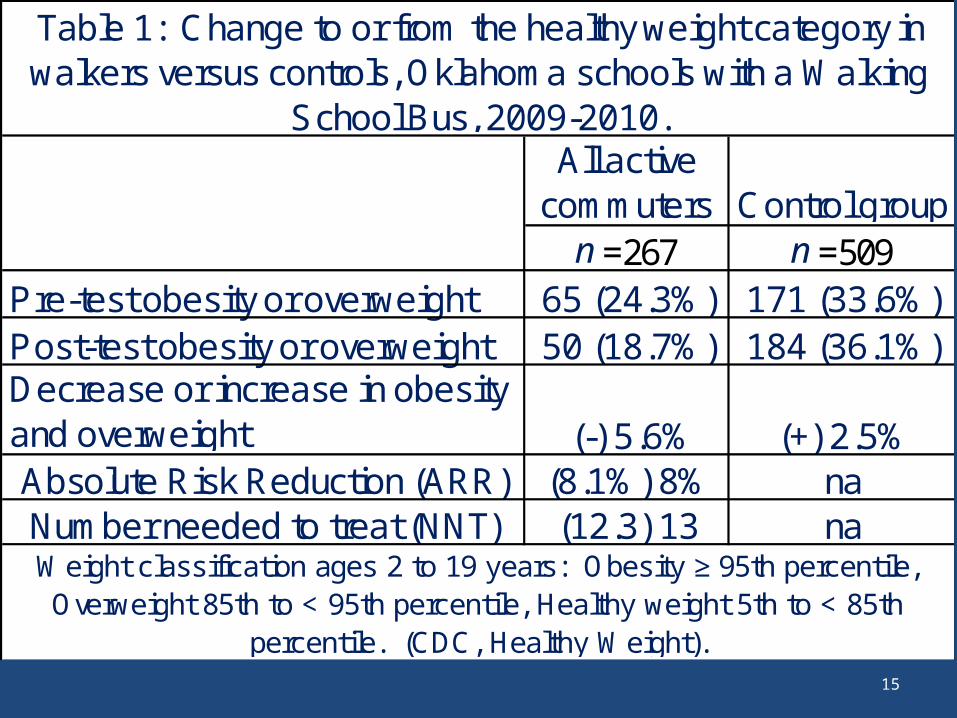
All active commuters Control group
n =267 n =509Pre-test obesity or overweight 65 (24.3%) 171 (33.6%)Post-test obesity or overweight 50 (18.7%) 184 (36.1%)Decrease or increase in obesity and overweight (-) 5.6% (+) 2.5%Absolute Risk Reduction (ARR) (8.1%) 8% naNumber needed to treat (NNT) (12.3) 13 na
Table 1: Change to or from the healthy weight category in walkers versus controls, Oklahoma schools with a Walking
School Bus, 2009-2010.
Weight classification ages 2 to 19 years: Obesity ≥ 95th percentile, Overweight 85th to < 95th percentile, Healthy weight 5th to < 85th
percentile. (CDC, Healthy Weight).
16
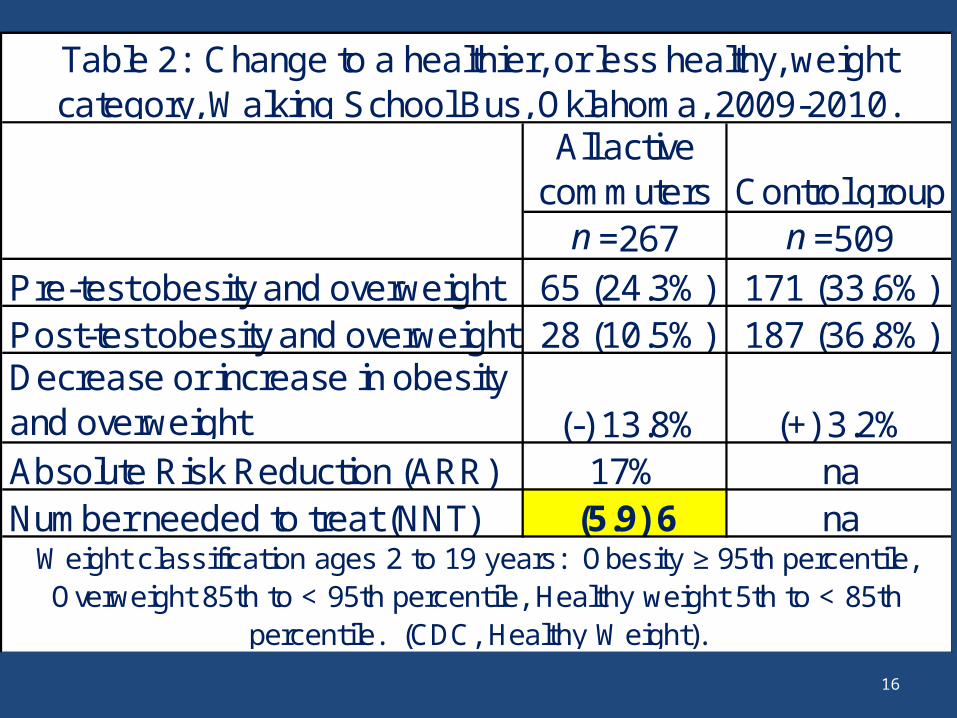
All active commuters Control group
n =267 n =509Pre-test obesity and overweight 65 (24.3%) 171 (33.6%)Post-test obesity and overweight 28 (10.5%) 187 (36.8%)Decrease or increase in obesity and overweight (-) 13.8% (+) 3.2%Absolute Risk Reduction (ARR) 17% naNumber needed to treat (NNT) (5.9) 6 na
Table 2: Change to a healthier, or less healthy, weight category, Walking School Bus, Oklahoma, 2009-2010.
Weight classification ages 2 to 19 years: Obesity ≥ 95th percentile, Overweight 85th to < 95th percentile, Healthy weight 5th to < 85th
percentile. (CDC, Healthy Weight).
17
Dose Response
• Both distance and frequency of active commute demonstrated statistically significant association and correlation with BMI…
• Distance demonstrated a stronger correlation than frequency
18
Results - Distance
• Walking School Bus allowed children to walk farther…overcoming distance, a significant barrier to the active commute.
• Participants in the Walking School Bus walked an average of 65% farther than students that walked without an adult chaperone.
19
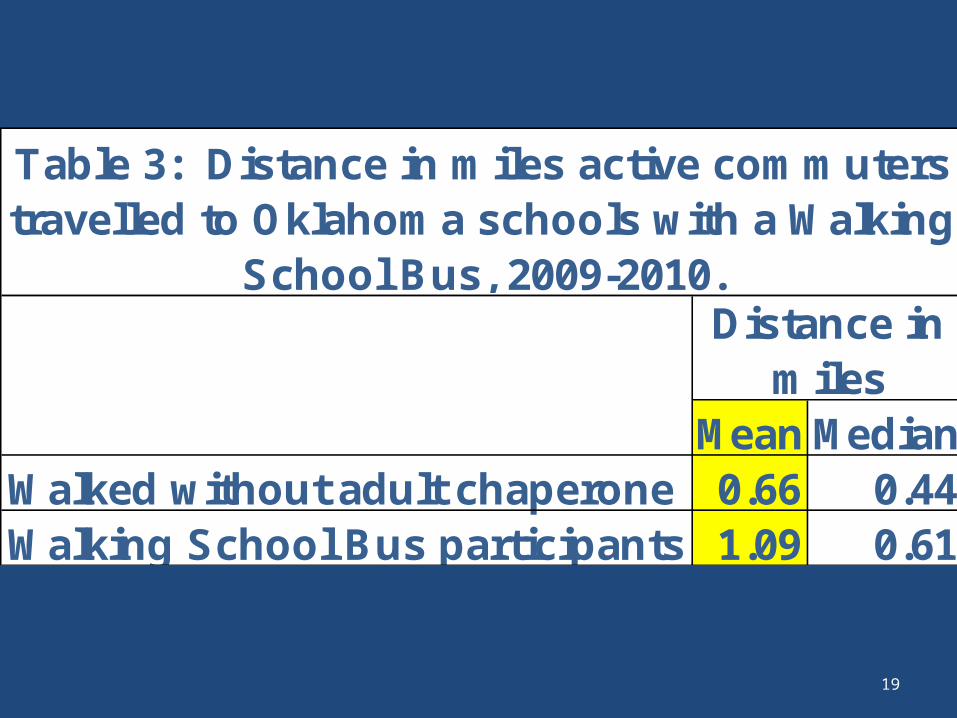
Mean MedianWalked without adult chaperone 0.66 0.44Walking School Bus participants 1.09 0.61
Distance in miles
Table 3: Distance in miles active commuters travelled to Oklahoma schools with a Walking
School Bus, 2009-2010.

20
Physical Activity
• Measures of recreational physical activity also demonstrated a statistically significant association with BMI…
• After controlling for confounders, active commute continued to demonstrate statistically significant association with BMI.
21
Results – Physical Activity
• No statistically significant association between the active commute and measures of recreational physical activity
• Measures were independent of one another
22
Results – Physical Activity
In other words…• Participation in the Walking School
Bus was not limited to more physically active students.
• Walking School Bus increased opportunities for inactive students to actively commute to school.

23My child enjoys itIt's good for him
Live close to schoolNo family car
Required-parent worksAdult chaperone
Travels with peersCrossing guard/light
Sidewalks
21%
50%
Figure 2: Primary contributor to active commute to Oklahoma schools with a
Walking School Bus, 2009-2010.

24Safety
Bridge-no safe sidewalk
Live too far from school
Daycare drives child
No traffic light
No crossing guard
Curbs need ramps
Not enough sidewalks
32%
55%
Figure 3: Primary barrier to active commute to Oklahoma schools with a
Walking School Bus, 2009-2010.
25
Practical Applications
By measuring existing programs…
…real world application should contribute to generalization and replication of the results with the knowledge gained regarding the simplicity, feasibility, sustainability and effectiveness of an adult-chaperoned walk-to-school program
26
Practical Applications
• Walking School Bus potential “big bang” for virtually no “bucks”!
• Uses existing school personnel or volunteers
• Simple strategy• Does not interfere with instruction
time

27
Summary
1. Walking School Bus sufficient to overcome many barriers to active commute to school– Age, Disability, Gender,– Physically inactive lifestyle, – Distance, Other environmental
factors,– Parental safety concerns
28
Summary
2. …therefore significantly increasing percentage of children actively commuting to school and significantly decreasing BMI

29
Summary
3. Schools should recruit adult chaperones for routes…
…in areas with high populations of students (apartment complexes)
…overcoming environmental barriers

30
Questions?
www.safekidsreflectors.com

31
http://library.ouhsc.edu/epub/dissertations/quarles-janette.pdf
http://gradworks.umi.com/34/67/3467259.html

32
ReferencesAction for Healthy Kids. (2004). The learning connection: The value of improving nutrition and
physical activity in our schools. Retrieved October 26, 2010 from www.actionforhealthykids.org/resources/files/learning-connection.pdf
Anderson, P., Butcher, K. (2006). Childhood obesity: Trends and potential causes. The Future of Children, 16(1), 19-45.
Bain, M. Walk Score. Retrieved August 17, 2009 from www.walkscore.com
Baslington, H. (2008). School travel plans: Overcoming barriers to implementation. Transport Reviews, 28(2), 239-258.
Carver, A., Timperio, A., Crawford, D. (2008). Playing it safe: The influence of neighborhood safety on children’s physical safety – a review. Health & Place, 14(2), 217-227.
Eyler, A., Brownson, R., Doescher, M., Evenson, K., Fesperman, C., Litt, J., et al. (2008). Policies related to active transport to and from school: A multisite case study. Health Education Research, 23(6), 963-975.
Google Maps. Obtained March 10, 2010 from www.google.com
Hayne, C., Moran, P., Ford, M. (2004). Regulating environments to reduce obesity. Journal of Public Health Policy, 25(3/4), 391-407.
Hume, C., Timperio, A., Salmon, J., Carver, A., Giles-Corti, B., Crawford, D. (2009). Walking and cycling to school: Predictors of increases among children and adolescents. Am J Prev Med, 36(3), 195-200.
Johnston, B. (2008). Planning for child pedestrians: Issues of health, safety and social justice. Journal of Urban Design, 13(1), 141-145.
33
ReferencesKingham, S., Ussher, S. (2007). An assessment of the benefits of the walking school bus in
Christchurch, New Zealand. Transportation Research, 4(6), 502-510.
Lorenc, T., Brunton, G., Oliver, S., Oliver, K., Oakley, A. (2008). Attitudes to walking and cycling among children, young people and parents: A systematic review. Journal of Epidemiology and Community Health, 62(10), 852-857.
Merom, D., Tudor-Locke, C., Bauman, A., Rissel, C. (2006). Active commuting to school among NSW primary school children: Implications for public health. Health & Place, 12(4), 678-687.
National Center for Bicycling and Walking. (2002). Increasing physical activity through community design: A guide for public health practitioners. Retrieved June 11, 2009 from www.bikewalk.org
Ridgewell, C., Sipe, N., Buchanan, N. (2009). School travel modes: Factors influencing parental choice in four Brisbane schools. Urban Policy & Research, 27(1), 43-57.
Robert Wood Johnson Foundation (RWJF), Trust for America’s Health. (2009). F as in fat: How obesity threatens America’s future. Retrieved July 2, 2010 from www.rwjf.org/childhoodobesity
Sallis, J., Story, M., Lou, D. (2009). Study designs and analytic strategies for environmental and policy research on obesity, physical activity and diet. Am J Prev Med, 36(S), S72-S77.
U.S. Department of Health and Human Services (USHHS), Centers for Disease Control and Prevention (CDC). (2010). The association between school-based physical activity, including physical education, and academic performance. Atlanta, Georgia: U.S. Department of Health and Human Services.
White House Task Force on Childhood Obesity. (2010). Solving the problem of childhood obesity within a generation. Retrieved October 26, 2010 from www.letsmove.gov
Zhu, X., Arch, B., Lee, C. (2008). Personal, social, and environmental correlates of walking to school behaviors: Case study in Austin, Texas. The Scientific World Journal, 8, 859-872.