WALK WILMINGTON Comprehensive Pedestrian Plan Final Plan Presentation July 7, 2009.
39
WALK WILMINGTON Comprehensive Pedestrian Plan Final Plan Presentation July 7, 2009
-
Upload
phebe-marshall -
Category
Documents
-
view
216 -
download
0
Transcript of WALK WILMINGTON Comprehensive Pedestrian Plan Final Plan Presentation July 7, 2009.

WALK WILMINGTON Comprehensive Pedestrian
PlanFinal Plan Presentation
July 7, 2009

Today’s Presentation
• Vision and Goals
• Plan Overview
• Plan Highlights
• Questions
Vision
• The City of Wilmington will become a pedestrian-friendly environment where citizens and visitors have safe and attractive alternatives for walking in and around the city.
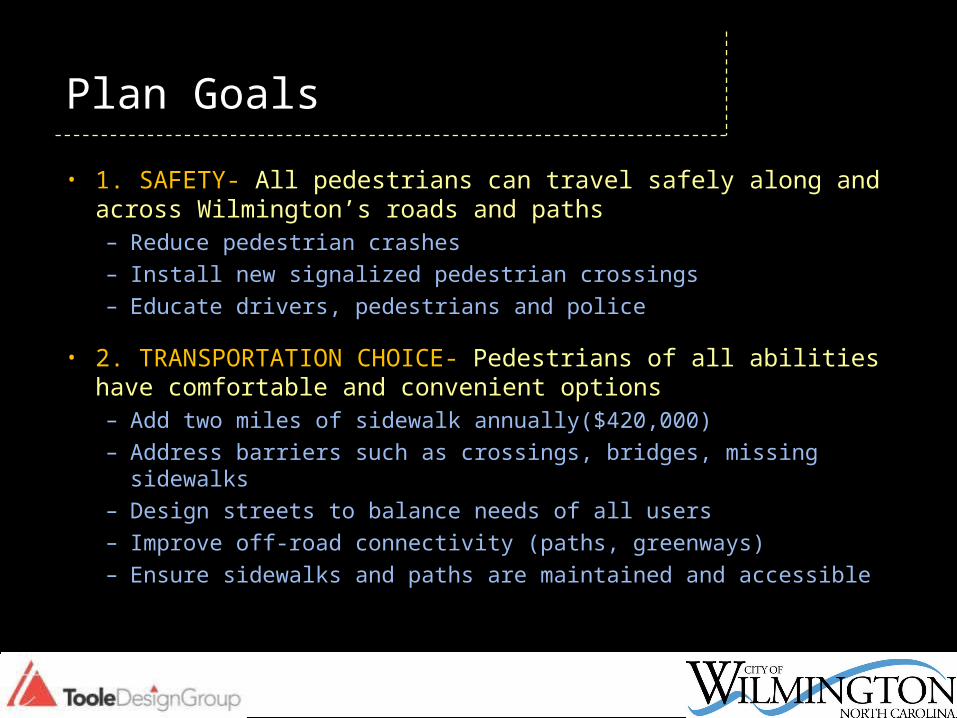
Plan Goals
• 1. SAFETY- All pedestrians can travel safely along and across Wilmington’s roads and paths– Reduce pedestrian crashes– Install new signalized pedestrian crossings– Educate drivers, pedestrians and police
• 2. TRANSPORTATION CHOICE- Pedestrians of all abilities have comfortable and convenient options– Add two miles of sidewalk annually($420,000)– Address barriers such as crossings, bridges, missing sidewalks– Design streets to balance needs of all users– Improve off-road connectivity (paths, greenways)– Ensure sidewalks and paths are maintained and accessible

Plan Goals
• 3. BUILT ENVIRONMENT, LAND USE AND CONNECTIVITY- Development enhances the pedestrian experience and encourage walking– New regulations promote pedestrian-scaled development– Require pedestrian connections to adjoining properties,
sidewalks and neighborhoods
• 4. EDUCATION, AWARENESS AND ENFORCEMENT- Drivers, pedestrians and officials understand pedestrian rights and laws. Increased pedestrian activity – Public service announcements and marketing campaigns– Promote walking and bicycling (e.g. Walk to School Day,
Wilmington Walks

Plan Goals
• 5. HEALTH- Wilmington’s residents are physically active and can make more pedestrian trips– Recommend daily levels of physical activity– Improve air quality through reduced routine car trips
• 6. ECONOMIC DEVELOPMENT- Visitors and customers have an attractive and inviting walking environment– Pedestrian lighting in busy pedestrian areas– Include benches, plantings and other amenities in
streetscape improvement projects– Continue to revitalize commercial areas (e.g. downtown
Wilmington) that attract tourists and shoppers

What’s in the Plan?
• Planning Inputs– Review of adopted plans and policies (City & NCDOT)– Assessment of planned and proposed projects (City &
NCDOT)– Stakeholder Input
• Public surveys and questionnaires• Interviews with City staff, NCDOT, WAVE Transit, New
Hanover County Schools, etc.
– Extensive field assessment– Data analysis
• Demand for pedestrian facilities• Crash data• Stakeholder comments

What’s in the Plan?
• Facility Recommendations (Infrastructure)– Sidewalks, crossings, signals, etc.– Project phasing– Approximate cost– Funding opportunities
• Policy Recommendations– Make sure improvements happen during:
• New road projects• With road repaving or upgrade• NCDOT projects• Development projects

What’s in the Plan?
• Design Standards– Road markings (intersections/crossings)– Parking lot design– Medians and pedestrian islands
• Program Recommendations– Enforcement– Driver and Pedestrian Education– Encouragement
• Implementation and Funding– Phasing– Responsibility– Funding strategies

planning inputs

Planning Context
– Choices: Wilmington Future Land Use Plan
– Wilmington Vision 2020: Downtown Waterfront Plan
– WMPO Long Range Transportation Plan
– Cape Fear Historic Byway Corridor Management Plan
• Several complementary goals, priorities and strategies in other plans.
Sidewalk Priority Areas Map from Choices: Wilmington Future Land Use Plan

Online and In-Person Surveys
• Web based survey available from February through June• In-person survey conducted at Downtown at Sundown,
Saturday Farmer’s Market, Juneteenth Festival

Pedestrian Survey
• Unsafe and uncomfortable crossings the most critical issue for pedestrians (online 67% , in-person 29%)
• Factors making it unpleasant to walk– Missing sidewalks– Drivers not stopping for pedestrians– Heavy traffic and fast moving vehicles
• Areas where improvements are needed– On major corridors – 80%– Near highway interchanges – 65%– Near parks and recreation areas – 50%
• 76% said they would accept longer car trips if it made it safer to walk

Public Comments
• “The existing built environment does not support pedestrian travel”
• “There are very few places that one does not require a car to get to”
• “Over 50% of bus stops do not have sidewalks”
• “Very few kids walk or bike to school”
• “At most major intersections, there are no pedestrian cross-walks or "Walk" lights - cars rule”

Staff and Agency Interviews
• City Departments– Engineering– Traffic Engineering – Police– Parks, Recreation & Downtown Services– Planning
• NCDOT– Division 3– Division of Bicycle and Pedestrian Transportation
• Cape Fear Public Transportation Authority (WAVE Transit)
• New Hanover County Public Schools

Field Analysis
• The Good– Lots of people walking– Good network downtown
• The Bad– Missing sidewalks along
arterials and in newer areas
– Many signals without ped signals or crosswalks
– Drivers don’t yield to peds

Pedestrian Crash Statistics
• Wilmington second for number of crashes per capita
Top 10 North Carolina Cities for Pedestrian Crashes (2001-2005)
Number of Crashes
Percent of NC Total Population
Crashes per 10,000 People
Asheville 246 2.02 71,119 34.59 Wilmington 324 2.66 99,623 32.52 Gastonia 220 1.81 67,776 32.46 Charlotte 1730 14.20 671,588 25.76 Greensboro 595 4.88 247,183 24.07 Durham 510 4.18 217,847 23.41 Raleigh 840 6.89 375,806 22.35 Fayetteville 343 2.81 171,853 19.96 High Point 171 1.40 86,211 19.84 Winston-Salem 298 2.45 215,348 13.84

Pedestrian Crash Statistics
• Cost of pedestrian crashes to Wilmington’s economy– Includes medical costs, public services, loss of productivity, employer cost, property damage and
change in quality of life
Cost of Pedestrian Crashes (1997-2005)
Injury TypeCumulative Injuries
1997-2005Cost per Injury1 Total
K Type Injury (fatality) 20
$4,200,00
0 $
84,000,000
A Type Injury (disabling) 45 $240,000 $
10,800,000
B Type Injury (evident) 207 $71,000 $
14,697,000
C Type Injury (possible) 240 $35,000 $
8,400,000 O Type Injury (property damage only) 29 $4,800
$ 139,200
Unknown 26
Total 567 $ 118,036,200
1 Estimate in 2007 dollars

Identify Areas of Highest Demand for Pedestrian Facilities
Population Density
+School Proximity
+Park Proximity
+Allowable
zoning density
Demand for Pedestrian Facilities
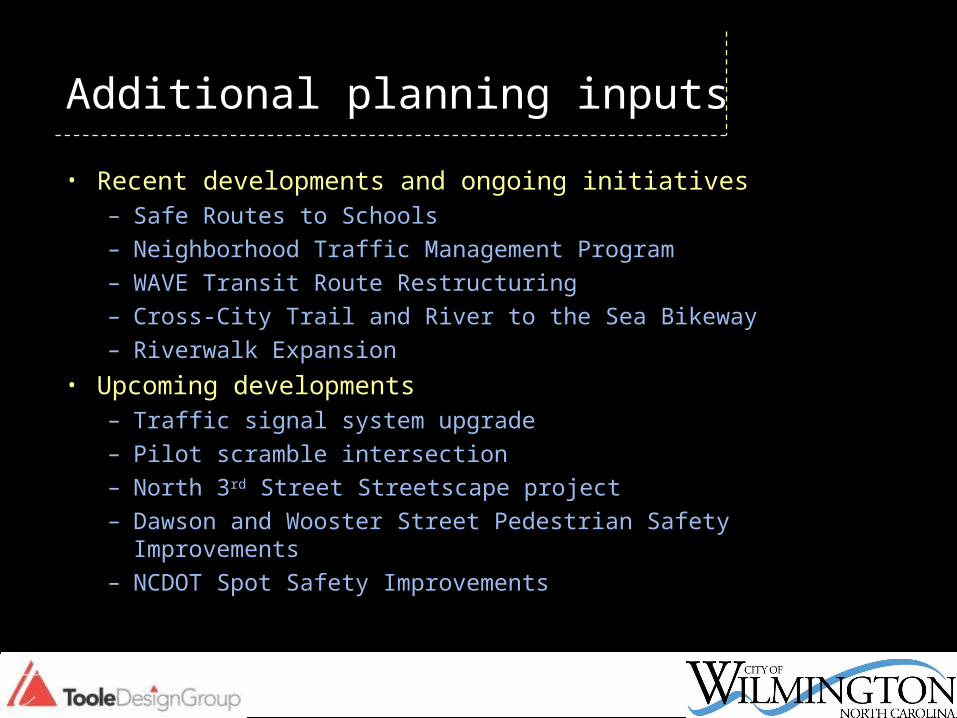
Additional planning inputs
• Recent developments and ongoing initiatives– Safe Routes to Schools– Neighborhood Traffic Management Program– WAVE Transit Route Restructuring– Cross-City Trail and River to the Sea Bikeway– Riverwalk Expansion
• Upcoming developments– Traffic signal system upgrade– Pilot scramble intersection– North 3rd Street Streetscape project– Dawson and Wooster Street Pedestrian Safety Improvements– NCDOT Spot Safety Improvements

pedestrian facility recommendations

Map Existing Conditions
• Existing sidewalks– Almost 290
miles
• Existing signalized intersections
• Existing pedestrian signal heads
• Existing trails and multi-use paths

Recommended Improvements
• 450 miles of new sidewalks• 182 signal improvements
– Retrofit pedestrian signals and crosswalks to existing traffic signals– Install new traffic signals with pedestrian signals– Install pedestrian hybrid signals (HAWKs) and Rapid Flash Beacons
• Phased over 20 years
• Prioritized areas with highest pedestrian demand
• Identified implementation and funding strategies– Grants (State, Federal, Non-profit)– Public/private partnerships– Concurrent with development– Capital improvement plan– Concurrent with road improvement projects

Project Phasing
Improvements
Short(0-5 Years)
Medium(5-10 years)
Long(10-20 years)
Sidewalks 26 miles 206 mi. 240 mi.
Cost (approx.) $3.5 mil. $27 mil. $31 mil.
Signal/crossings
90 50 28
Cost (approx.) $4.1 mil. $1.9 mil. $1 mil.
Where (generally)
Downtown, older suburbs, along major arterials
Older suburbs, newer areas, arterials and major collectors
Newer suburbs, minor collectors


policy recommendations

Policy Recommendations
• Changes to Land Development Code
• Fee-in-lieu of constructing sidewalks• Install crosswalks and pedestrian
signals on all legs at signalized intersections
• Reduce crossing distances
• Reduce turning vehicle speeds
• New pedestrian signal types– HAWK– Rapid Flash Beacon

Fee in Lieu of Constructing Sidewalks
Concept• Allows applicants to
contribute money to sidewalk fund instead of building sidewalk
• Sidewalk projects can be phased or consolidated
• Money can be used to build facilities in places where they are most needed- even off-site.
Recommendation• City would establish fees for
pedestrian facilities
• Similar to park fees
• City would identify pedestrian benefit zones (next slide)
• Money must be spent within a defined time period

Pedestrian Benefit Zones
Concept• Complements Fee in
Lieu program
• Funds spent near the development and will benefit pedestrians in that zone
• Zones should focus on improving continuity and road crossings

Considerations• Higher speeds contribute to
increased likelihood of injury or death when hit
• Reduced speed limits provides opportunity to reduce travel lane widths-
• Pedestrian median refuges may be provided without increasing overall road width
• Wilmington may request speed limit reductions/modifications along NCDOT roadways within city limits
Intersections and Roadway DesignPosted Speed Limit Reductions

Intersections and Roadway DesignPosted Speed Limit Reductions
Recommendation• Speed limits based
on road classification and development character
• Lower speeds where pedestrians are likely to be present– Downtown– Commercial areas– Neighborhoods

design details

Design Details
• Driveway design• Crosswalk marking
– Signalized intersections– Non-signalized
intersections– Midblock crossings
• Crossing islands and medians
• Parking lot design
e.g. Proposed Crossing Island Detail

programs
education, encouragement and enforcement

Education, Encouragement and Enforcement
Education• Safe Routes to Schools
– Provides funds to support projects and programs
• NHTSA Child Pedestrian Safety Curriculum– Develops safe walking skills
in elementary school kids
• Collaboration with Media– Newspapers, web, radio
and television
Encouragement• Walk to School Day
– Annual event celebrating kids and parents walking
• Walking and Running Clubs– Regularly scheduled
events– Clubs for all ages and
abilities

Education, Encouragement and Enforcement
Enforcement• Police training
– Pedestrian laws, rights and responsibilities
– Accurate crash reporting– NCDOT officer training
curriculum
• Targeted enforcement– Improve driver and pedestrian
behaviors• Jaywalking and failure to yield
– Crosswalk stings– Speed control

implementation and funding

Questions?