WAC Watershed Forestry Bus Tour Activity Kit Recommended ...
64
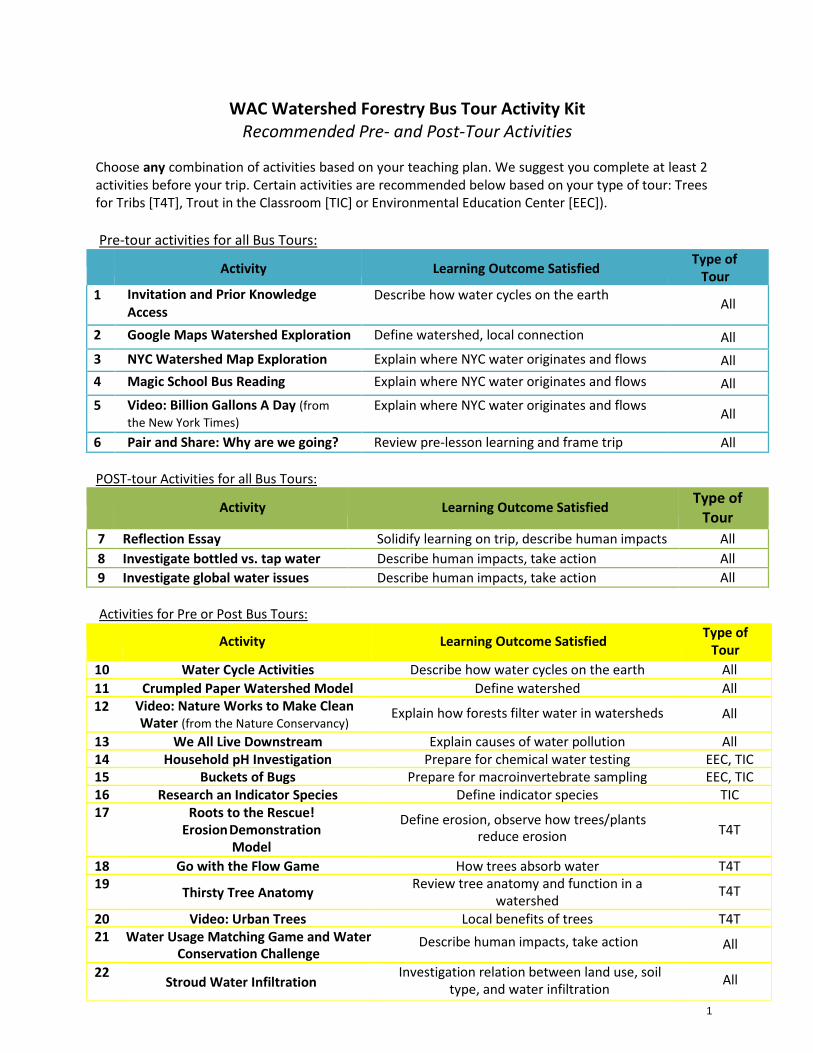
1 WAC Watershed Forestry Bus Tour Activity Kit Recommended Pre- and Post-Tour Activities Choose any combination of activities based on your teaching plan. We suggest you complete at least 2 activities before your trip. Certain activities are recommended below based on your type of tour: Trees for Tribs [T4T], Trout in the Classroom [TIC] or Environmental Education Center [EEC]). Pre-tour activities for all Bus Tours: Activity Learning Outcome Satisfied Type of Tour 1 Invitation and Prior Knowledge Access Describe how water cycles on the earth All 2 Google Maps Watershed Exploration Define watershed, local connection All 3 NYC Watershed Map Exploration Explain where NYC water originates and flows All 4 Magic School Bus Reading Explain where NYC water originates and flows All 5 Video: Billion Gallons A Day (from the New York Times) Explain where NYC water originates and flows All 6 Pair and Share: Why are we going? Review pre-lesson learning and frame trip All POST-tour Activities for all Bus Tours: Activity Learning Outcome Satisfied Type of Tour 7 Reflection Essay Solidify learning on trip, describe human impacts All 8 Investigate bottled vs. tap water Describe human impacts, take action All 9 Investigate global water issues Describe human impacts, take action All Activities for Pre or Post Bus Tours: Activity Learning Outcome Satisfied Type of Tour 10 Water Cycle Activities Describe how water cycles on the earth All 11 Crumpled Paper Watershed Model Define watershed All 12 Video: Nature Works to Make Clean Water (from the Nature Conservancy) Explain how forests filter water in watersheds All 13 We All Live Downstream Explain causes of water pollution All 14 Household pH Investigation Prepare for chemical water testing EEC, TIC 15 Buckets of Bugs Prepare for macroinvertebrate sampling EEC, TIC 16 Research an Indicator Species Define indicator species TIC 17 Roots to the Rescue! Erosion Demonstration Model Define erosion, observe how trees/plants reduce erosion T4T 18 Go with the Flow Game How trees absorb water T4T 19 Thirsty Tree Anatomy Review tree anatomy and function in a watershed T4T 20 Video: Urban Trees Local benefits of trees T4T 21 Water Usage Matching Game and Water Conservation Challenge Describe human impacts, take action All 22 Stroud Water Infiltration Investigation relation between land use, soil type, and water infiltration All
Transcript of WAC Watershed Forestry Bus Tour Activity Kit Recommended ...
1
WAC Watershed Forestry Bus Tour Activity Kit Recommended Pre- and Post-Tour Activities
Choose any combination of activities based on your teaching plan. We suggest you complete at least 2 activities before your trip. Certain activities are recommended below based on your type of tour: Trees for Tribs [T4T], Trout in the Classroom [TIC] or Environmental Education Center [EEC]).
Pre-tour activities for all Bus Tours:
Activity Learning Outcome Satisfied Type of
Tour 1 Invitation and Prior Knowledge
Access Describe how water cycles on the earth All
2 Google Maps Watershed Exploration Define watershed, local connection All 3 NYC Watershed Map Exploration Explain where NYC water originates and flows All 4 Magic School Bus Reading Explain where NYC water originates and flows All 5 Video: Billion Gallons A Day (from
the New York Times) Explain where NYC water originates and flows All
6 Pair and Share: Why are we going? Review pre-lesson learning and frame trip All
POST-tour Activities for all Bus Tours:
Activity Learning Outcome Satisfied Type of Tour
7 Reflection Essay Solidify learning on trip, describe human impacts All 8 Investigate bottled vs. tap water Describe human impacts, take action All 9 Investigate global water issues Describe human impacts, take action All
Activities for Pre or Post Bus Tours:
Activity Learning Outcome Satisfied Type of Tour
10 Water Cycle Activities Describe how water cycles on the earth All 11 Crumpled Paper Watershed Model Define watershed All 12 Video: Nature Works to Make Clean
Water (from the Nature Conservancy) Explain how forests filter water in watersheds All
13 We All Live Downstream Explain causes of water pollution All 14 Household pH Investigation Prepare for chemical water testing EEC, TIC 15 Buckets of Bugs Prepare for macroinvertebrate sampling EEC, TIC 16 Research an Indicator Species Define indicator species TIC 17 Roots to the Rescue!
Erosion Demonstration Model
Define erosion, observe how trees/plants reduce erosion T4T
18 Go with the Flow Game How trees absorb water T4T 19 Thirsty Tree Anatomy Review tree anatomy and function in a
watershed T4T
20 Video: Urban Trees Local benefits of trees T4T 21 Water Usage Matching Game and Water
Conservation Challenge Describe human impacts, take action All
22 Stroud Water Infiltration
Investigation relation between land use, soil type, and water infiltration
All

2
Pre-Trip Activities 1. Invitation and Prior Knowledge Access
Objective: Elicit student understanding of the water cycle and how water flows across a landscape in order to select appropriate activities. Materials: None Time: 10 minutes
a. Divide students into pairs. b. Ask each pair to discuss their answer to the following question for about 2 mins. Remind
them after 1 min to switch speakers if this has not yet happened. Question: Where does rain come from and what happens to it when it falls?
c. Choose a few volunteers to share their answers with the whole group. d. Assess whether or not the optional Water Cycle activity is necessary. e. Explain that the rest of the lesson will involve learning concepts to prepare for the
upcoming field trip to [Your Destination Here].
2. Google Maps Watershed Exploration Objective: Learn about the people and things in your local community’s watershed. Materials: Computer, projector, internet access, links below Time: 45-60 minutes Part I:
a. Explain that the goal of this lesson will be to learn about the people and things in the local community’s watershed.
b. Open Google maps (maps.google.com). Enter your school address and allow the page to load. If you haven’t spent serious time exploring Google maps, do, because there are some amazing features. Some tips on using Google maps to the fullest extent:
i. While looking at the colored map, click the three horizontal bars to the left of your location search bar in the upper left corner. From this menu, select “Terrain” to see the topography (shape of the land).
ii. Click on the square that says “Earth” in the lower left corner of your screen to see satellite images of real trees and buildings. While in “Earth” view, hold down on the “Ctrl” button and click and drag the mouse cursor around. The land will tilt and you will see the topography and satellite imagery together.
iii. If available, also click on the street view pictures at the bottom. The ones with a camera icon are normal pictures. The ones with a circular 3D arrow allow you to use the right and left arrow keys or to click on the top, bottom, left or right of the screen where a white box pops up to see a ground level 360 degree and skyward view. Click the left-pointing arrow in the black box in the upper left of the screen to return to satellite or map view.
iv. For slow internet connections, it might be useful to pre-load websites or take screen shots for future use.
c. Ask students to make observations (“I notice…”) about what they see as you explore. Prompt them to look at buildings, man-made infrastructure, and natural features.
d. Ask students to discuss with a partner for 2 minutes the answer to the following question: If it rained, where would the water go?
e. Explain to students that you are going to trace the path of water. (Teacher note: Keep in mind that water flows over ground as runoff and may also flow underground to reach a lake or stream. Not all locations will have a visible stream directly on the property and so to trace the water, you must think about where the water will end up if it follows the path of least resistance downhill.)
i. Click and hold down on the screen and drag to move the map in the direction of the nearest river or lake. (You may have to research your local watershed beforehand. Enter your zip code or click on your state here

3
http://cfpub.epa.gov/surf/locate/index.cfm to find your local watershed). Have students help you decide which direction to go next. Tips:
i. Sometimes it is helpful to first zoom out to locate nearby water. ii. Use your collective knowledge about the location of hills as a guide as well. iii. If you are having trouble seeing the flow of water (it’s difficult in highly
developed areas and areas of heavy tree cover), try clicking back on map view in the lower left corner to see the schematic blue representations. Go back and forth to see how these bodies of water look in real life.
ii. Once you find the nearest large body of water, zoom out (if you haven’t already done so) using the (-) button on the lower right to see the full view of your school and the closest body of water.
iii. Zoom out further to investigate where the water ultimately goes: Hudson River? Delaware River? Atlantic Ocean?
iv. If your school is in NYC, try tracing the Hudson River backwards to see where it originates.
f. Ask students to look at the overall landscape. Discuss with a partner for 2 minutes and then share a few answers with the class to the following question: What are some things you see on this map that could pollute the water flowing through the watershed?
Part II (requires students to have some familiarity with maps): g. Explain that it can be hard to “see” the boundaries of a watershed. The next website uses
the United States Geological Survey’s data to zoom in on a watershed map. h. Visit the USGS “Science in Your Watershed: Locate Your Watershed” page
at http://water.usgs.gov/wsc/map_index.html. i. Ask students to locate your state. Click on the Mid-Atlantic watershed to zoom to the next
level. j. Have students help you choose successive smaller and smaller watershed regions until you
have found the smallest one on the map. i. Hover your mouse over a blue stream or body of water to make its name to pop up. ii. Eventually, a final click will take you to an information page. This page is no longer
relevant to the lesson except for the name of the watershed sub-region displayed in the title. If you reach this page, hit back.
iii. Explain that each small watershed is part of the big “Mid-Atlantic” region watershed. Big watersheds are made up of smaller watersheds because smaller streams flow into bigger streams, rivers and eventually the ocean.
Part III: k. Locate the watershed you will be visiting on your bus tour in both Google maps and the
USGS Locate Your Watershed Page. l. Ask students to discuss in pairs for 2 minutes and then choose volunteers to share
answers to this question: What are some differences between the two watersheds?
3. NYC Watershed Map Exploration Objective: Develop/review map literacy and become familiar with the parts of the NYC Watershed and water supply system in relationship to your own location. Materials: Copies of Watersheds & Working Landscapes: The New York City Water Supply System factsheet and map and optional Student worksheet (attached). Time: 20 minutes
a. Use the attached map to locate both your school and the site you will be visiting on the NYC Water Supply Map. You can also find the map on the NYC DEP website (http://www.nyc.gov/html/dep/html/drinking_water/wsmaps_wide.shtml) to project it.
b. Ask students to make observations (“I notice…”) about things on the map. Lead students through a guided exploration by asking some of the following questions. You may use the attached worksheet to guide your exploration, too:
• What part of the United States are you looking at?

4
• Which way is North? How do you know? • Show me with your fingers how long 10 miles is on this map. How do you know? • Point to New York City on this map. Point to the Hudson River. Point to the
Atlantic Ocean. • Point to approximately where your school is on this map. Point to approximately
where your home is on this map. • Our drinking water comes from the dark red and blue areas. These areas are the NYC
Watershed. What is a watershed? • Put your fingers tips together, palms down, to make a model of a mountain or hill.
If it rained on your model, where would the water go? Why? • Where do you think the rainwater that falls in the Watershed areas end up? How
does the water get there? • There are 3 key areas on this map: New York City, Croton Watershed and
Catskill/Delaware Watershed. Find the Croton Watershed. What do you think this area is? (Hint: Read “Watersheds & Working Landscapes: The New York City Water Supply System” on the back of your map)
• Find the Catskill/Delaware Watershed. What do you think this area is? • Who has ever been to the Croton Watershed area? (Hint: Have you ever been to
Westchester County? Putnam County?)
• Who has ever been to the Catskills/Delaware Watershed area? (Hint: Have you ever been to the Catskills, Frost Valley YMCA, The Ashokan Center?)
• What do you think is similar about these areas? (Hint: What state are they located in? [New York State] What features do they all have in common? [They all have water, land, and people live there]
• What do you think is different about these areas? (Hint: How many people do you think live there? What kind of buildings do you think are built there? How many trees and forests do you think grow there? How much pollution do you think is there?)
• Which area do you think has the cleanest water in its lakes, ponds, streams and rivers? Why do you think so?
• New York City collects water from the upstate watershed for people to drink and use. Have you used water today? How?
• How do you think NYC gets the water from the watershed down to the city? How is the water transported? (Hint: Look at the orange dashed lines for a clue)
• Point to a reservoir in the Catskills/Delaware Watershed. • What is the name of your reservoir? • Where do you think the water in your reservoir comes from? • With your finger, trace the path that the water from your reservoir takes to get
down to the city. • How many miles do you think the water has traveled? (Hint: Use the black and
white scale on the map to measure the length of your route.) • The forests and trees in the watershed filter out pollution and keep the water
clean and safe to drink. Most of our water does NOT have to be filtered by expensive technology because the trees do the work for us!
• What types of pollution do you think the trees filter out? c. Explain that NYC residents get their water from land and streams north of the city. Rain falls,
flows into streams, then collects in manmade lakes called reservoirs. Giant underground pipes called aqueducts bring the water from the reservoirs down to the city. The reservoirs and pipes have modified the watershed’s natural flow of water to make a man-made water supply system. You will be exploring this watershed and water supply system on the field trip. Do you also live in the watershed?

5
4. Read The Magic School Bus At the Waterworks Objective: Understand the parts of the NYC Watershed and water supply system and how they function. Materials: Book by Joanna Cole about the NYC Water Supply System Time: 25-30 minutes, depending on discussion time
a. Request a copy from WAC or a free classroom set of books from NYC-DEP. b. Introduce the activity by asking students a series of questions:
Who has used water today? How have you used it? How else is water used in our daily lives? (for example, firefighting, transportation, and by plants and animals)
Where do you think the water is from? How could we find out where it comes from?
Do you think the water is clean? What evidence do you have to back up your claim?
Do you think it’s important to have clean, healthy water? Why is it important? Where do you think the water goes after you’ve used it? What evidence do you
have to back up your claim? c. Read The Magic School Bus at the Waterworks. Have students discuss with a partner for 2
minutes and then share some answers with the class to the following question: Where does NYC’s water come from and how is it kept clean? What surprised you about the book?
d. Wrap-up: Have students discuss with a partner for 2 minutes and then share some answers with the class to the following question: Based on the book what would you like to explore more closely or learn more about during your upcoming Watershed Forestry Bus Tour?
5. Video: Billion Gallons A Day (from The New York Time, 6.5min)
Objective: Understand the parts of the NYC Watershed and water supply system, their history and how they function. Materials: Web link, computer, projector Time: 15-20 minutes, depending on discussion time
a. Introduce the activity by asking students a series of questions: Who has used water today? How have you used it? How else is water used in our
daily lives? (for example, firefighting, transportation and by plants and animals) Where do you think the water is from? How could we find out where it comes
from? Do you think the water is clean? What evidence do you have to back up your
claim? Do you think it’s important to have clean, healthy water? Why is it important? Where do you think the water goes after you’ve used it? What evidence do you
have to back up your claim? b. To find out where our water comes from and how it is kept clean, watch this video from The
New York Times: https://www.youtube.com/watch?v=vIKFpQhVqI4 c. Have students discuss with a partner for 2 minutes and then share some answers with the
class to the following question: Where does NYC’s water come from and how is it kept clean? What surprised you about the video?
d. Wrap-up: Have students discuss with a partner for 2 minutes and then share some answers with the class to the following question: Based on the video, what would you like to explore more closely or learn more about during your upcoming Watershed Forestry Bus Tour?
6. Pair and Share: Why are we going on the field trip?
Objective: Guide students through reflection of pre-tour lessons and solicit expectations for purpose of Bus Tour. Materials: None Time: 15 minutes

6
a. Pair students and ask them to discuss the following question for 2 minutes: Based on what you have learned today, why do you think we are going on a bus tour fieldtrip?
b. Ask for volunteers to share with the whole class. c. Facilitate the discussion to be sure students have a good understanding of why they will be
going on the field trip.
Post-Trip Activities 7. Guided Reflection
Objective: Synthesize information, experiences, and feelings from before, during and after the Bus Tour in order to build understanding of NYC watershed forestry and your students’ relationship with and responsibility for their water supply. Materials: Choose from one of the reflection tools below. Time: Variable. 10-45 minutes in class or assigned as homework.
a. Reflection Essay. Use any combination of the following prompts to guide students’ written reflections.
i. What happened? • Describe what you did on our Watershed Forestry Bus Tour. • What was your favorite part of the experience? Why? • What was the most surprising part of your experience? Why? • How did this experience help you better understand ideas or subjects we have been
studying? • What did you learn that you didn’t know before? • Which scientific terms make better sense now? • What skills did you develop through the activities on your Watershed Bus Tour? • Describe the Reservoir we visited and explain its function in the NYC watershed and
drinking water system. • Describe the tree planting/trout release/waste water treatment/Model Forest and
how that will help protect our local waterways. • What did the experience remind you of? • Through this Watershed Bus Tour experience, what did you learn about yourself,
working with others, including people in your class, and your community? • Five years from now, what do you think you will remember about this
experience? ii. How did you feel?
• How did you feel being at the site in the Watershed? • What quote best captures how you are feeling about the experience? • How did the experience feel compare to what you expected? • Were there any differences between your expectations for the Watershed Bus Tour
and the actual experience? • How did you make a difference today? How does this make you feel?
iii. What are your ideas? • What can we all do to help protect water quality? • What skills did you learn on the trip that you can take back with you to use after the
trip? • How will you use what you learned in this experience in different situations? • What words of advice can you give students who will go on the trip next year? • What ideas do you have for improving any part of the Watershed Bus Tour?
iv. What questions do you have? • What do you want to know more about after having this experience? • Who would you like to talk with more about the ideas and issues we learned
on our trip? b. 3-2-1 Reflection Tool. Ask students to write down 3 things they learned, 2 connections they can

7
make between the experience and a text(s), and 1 question they have related to the experience.
c. Artistic Reflection. Students may use any of the following methods to reflect on one or more of the questions from above:
a) Write: Haiku, poem, song, rap b) Draw: Picture, picture book, cartoon strip, collage c) Create a sculpture out of clay, found objects, recyclables, etc. d) Photography: Photo collage, album, photo story book e) Drama: Role play, write and perform a skit, mime, movement/dance, video
d. Creative Group Reflection. Have students enter class after the Watershed Bus Tour to find their workspace covered in butcher paper. In silence, students represent their thoughts and feelings of the experience through art. After drawing for 10 minutes on the communal mural, each student adds one word. Then each person takes 5 words from the mural and composes a poem or rap. Afterward, discuss both the process and the product.
8. Investigate bottled water vs. tap
Objective: Explore the economic difference between bottled water and tap water Materials: A space to save leftover water bottles, calculator Time: 20-25 mins
a. Start a class project to collect and save all the bottled water that students drink within 1 week
b. After the week, count the amount of bottled water used i. Ask the students to estimate the amount of money spent towards
each bottle c. Complete the Bottled Water Vs. Tap worksheet (see attached) d. Compare the results with their initial estimates e. Ask and discuss possible ways to reduce the amount of bottled water used
9. Global Water Issues
Objective: Investigate some of the global water problems experienced across the world. Materials: Web link, Computer, Projector Time: 45 mins
a. Ask the class why water is important b. Show video-Why care about water
?(2.5min) http://video.nationalgeographic.com/video/env-freshwater-whycare
c. Begin a discussion about what people in other countries have to do for their water d. Visit https://global.nature.org/our-global-solutions/water for articles relating to
what communities must do. e. Have students break into groups of 4-5
a. Each group can pick 1 article to read together and then give a short presentation to the class
i. Presentation must include: 1. What’s the article/problem 2. Who’s the most effected 3. Where they are in the world 4. Why this is important
Activities for either Pre or Post Trip 10. Water Cycle Activities
Objective: Review major phases of the water cycle in preparation for understanding watershed form and function. Three activity options and 2 online resources:

8
a. The Water Cycle: See attached. Complete the diagram, more general, shorter time. Lesson from the Catskills Sense of Place Curriculum Module I, also accessible online here: http://catskillcenter.org/sense-of-place/
b. The Water Cycle Mingle: See attached. Act out phases of water cycle in group game, more general content, active, shorter time.
c. Trees, Forests, and the Water Cycle Activity: See attached. Small group activity, more detailed, active, longer time. Lesson from the Catskills Sense of Place Curriculum Module I, also accessible online here: http://catskillcenter.org/sense-of-place/
d. Animated Water Cycle Model: http://www.phschool.com/atschool/phsciexp/active_art/water_cycle/index.htm l
e. Interactive Water Cycle Diagram: http://earthguide.ucsd.edu/earthguide/diagrams/watercycle/
11. Crumpled Paper Watershed Model Objective: Understand the form and function of a watershed and investigate what natural and human features can make water cleaner or more polluted in a watershed. Materials: Per group of 4 students: One sheet giant easel paper; water resistant surface or outdoor space; water spray bottle (or any bottle with a small hole in the top to pour water slowly); black and green permanent markers; blue and other color washable markers. This can also be done individually or in pairs with 8.5x11in paper in small trays. Time: 35-40 minutes
a. Divide students into groups of 4 and distribute supplies. b. Ask students to pour a drop of water on the flat paper and to make observations to their
group about what happens. (Coach students to observe what they see using the sentence starter “I notice…”)
c. Ask students to fold their paper in half so that it now has a ridge in the middle. d. Direct students to pour drops of water on each side of the ridge and say observations (“I
notice…”) to their group members about what is happening. e. Ask a few students to share their answers with the whole class. How did the water
behave differently when poured on flat versus sloped paper? f. Ask students to crumple their paper into a tight ball and then to loosely unfurl it on
the surface so that it retains mountains and valleys. g. Explain that this is a model of a real landscape. Ask students to add various features to the
model, pacing as necessary: i. Trace the ridgelines with black permanent marker
ii. Draw trees in green permanent marker where they think they will be iii. Use blue washable marker to show where water might flow or collect. iv. Use any other colors to add things people might build in this landscape (roads,
houses, trails, shops, boat launches, factories, etc.) h. Once all models are finished or attention starts to wane, direct students to spray/slowly
pour water everywhere on their model to simulate a rainstorm. i. Ask students to make observations about what is happening (“I notice…”). j. Call on volunteers to share what they notice with the group. k. Explain the definition of a watershed (Teacher background: A watershed is “the area of land
that drains its water into a specific body of water” or “the area of land over which raindrops would flow downhill to replenish a specific body of water”. In the context of a kitchen sink, the drain would represent a body of water and the basin the watershed land.)
i. Have students look at their lakes and rivers and choose one. Ask them to find all of the places on their crumpled paper that drain water into that particular lake or river.
ii. Ask a group to share this with the whole class looking on. iii. Explain that all of these places combined make up the “watershed” for that lake or
river. iv. How many watersheds can you find on your model?

9
v. What evidence do you think we could find of water flowing through a real watershed in our community?
12. Video: Nature Works to Make Clean Water (from The Nature Conservancy, 4
minutes): Objective: Understand how natural ecosystems (especially trees and forests) filter water in watersheds and protect water quality for human consumption. Materials: Web link, computer, projector Time: 15-20 minutes, depending on discussion time
a. Instruct students to keep track of all the ways in which forested landscapes help keep water clean as they watch this video from The Nature Conservancy: https://www.natureworkseverywhere.org/resources/how-natural-areas-filter-water/
b. Share and discuss what students found in small groups and then as a large class. c. Wrap-up: Have students discuss with a partner for 2 minutes and then share some
answers with the class to the following question: Based on the video, what would you like to explore more closely or learn more about during your upcoming Environmental Education Center visit? Or, based on the video and our Environmental Education Center visit, what would you like to explore more closely or learn more about?
13. We All Live Downstream
Objective: Understand how water and pollutants move in a landscape and affect people and places downstream. Materials: Paper, pens/pencils/colored pencils/markers, a large number (~50+) of some small object (ex: beads, poker chips, pencils, marbles), rope or chalk Time: 45-60 minutes, depending on discussion time
a. Ask students to recall a time when they have had a positive experience near a body of water. Give them time to share this story with a partner.
b. Tell students to imagine that they have just inherited a piece of land along a river. Some of them will be randomly chosen (by calling out a birth month or day) to construct something in particular, but the rest will be free to build whatever they would like.
c. Hand out a piece of paper and drawing materials to all students and give them time to make their drawings (about 10 minutes). As this begins, instruct the randomly chosen students that they must include, as part of their drawing, one of the following: wastewater treatment plant, factory with a sluice pipe, horse farm with a lot of manure runoff, shopping mall with a large parking lot.
d. Lay out a rope or draw a blue line in chalk on a sidewalk. Ask students to place their drawing where they would like along the river. They may not move someone’s previously placed drawing.
e. Ask each student to briefly share what they drew (this can take a while, so hold students to brevity).
f. Pair students and have them spend 2 minutes discussing the following question: What positive or negative impacts on the health of the river do you see from the drawings?
g. Give each student a few of the small objects and designate a direction to be downstream. Go down the line, starting from upstream, and ask students to share what they discussed. For every negative effect on the river, the student gets to pass a small object down the line (it gets passed from person to person). For every positive effect on the river (such as plants, trees, natural areas, parks, etc.), the student gets to take one small object that “flows” by them and take it out of circulation by giving it to you.
h. At the end of the sharing session, ask who has the most objects. The students furthest downstream should have an annoying amount of these objects. Ask the group: How do different ways of using land affect water quality? What types of land use create positive effects? What types of land use create negative effects?
i. Pair students and have them spend 2 minutes discussing the following question: Should

10
people protect water quality for users downstream? Why or why not? j. Have some students share. Introduce the importance of protecting drinking water quality and
aquatic organisms if these topics do not come up. k. Wrap-up: Have students discuss with a partner or write a short paragraph about how the
upcoming/recent Trout in the Classroom field trip is related to what they just learned. Have students predict what types of land use they expect to see or discuss the type of land use they did see on the trip. What do they think the environment will look like where they release their trout? Did reality match their predictions?
14. Household pH Investigation
Objective: Understand an essential measure of water quality, pH, and practice measuring pH levels. Materials: Several safe household substances (ex: milk, lemon juice, coffee, tea, tap water, distilled water, vinegar, laundry detergent); small cups; pH paper1
Time: 30-45 minutes a. Gather your household substance samples and pour a small amount of each into a cup.
Instruct students not to drink or eat anything during this activity. b. Assess student knowledge about pH (you may wish to incorporate this activity into your
chemistry units for deeper understanding; this activity focuses on pH as an indicator for water quality and living organisms in lakes and streams).
c. Ask students, “Who feels very alive today?” Give this volunteer a pH paper strip and ask him or her spit on or lick it.
d. Compare the color of the strip to the color scale. It should read close to 7. e. Explain that you just did a pH test, a chemical test that indicates how acidic or basic a
substance is. f. Instruct students to test the household substances you have prepared. g. Review the student results. Which substances are acids or bases? h. Pair students and have them discuss for 2 minutes and then share some answers as a whole
class for the following question: How do these pH tests relate to the health of the aquatic creatures you will be seeing on your fieldtrip?
i. Explain that: i. pH of liquids and soil is important in the natural world because too much acid or
base can make it impossible for living things to survive. ii. The scale goes from 0-14 and the important thing to know here is that aquatic
creatures like fish, frogs, and insects require a pH within a close range of the neutral 7. Too much departure from this range leads to death for aquatic creatures.
j. Ask students to respond in writing to this prompt: What do you expect the pH of the stream to be on your field trip or what do you think the pH of the stream on the field trip was? What are some other ways you could measure water quality? Summarize sources of pollution that might affect water quality.
1 “pH paper” is relatively inexpensive and widely available. For example, search “Hydrion pH Test Papers”
on Ward’s Science and you can buy 5 rolls for under $25. For smaller quantities, try a general online search for “pH paper”. Be sure the range is at least 1-12.
15. Buckets of Bugs
Objective: Macroinvertebrates need trees growing along the streams they live in to provide shade for cool, oxygen-rich water, and fallen leaves as a food source. Investigating the number and diversity of macroinvertebrates in a stream can tell us about the health of the stream and streamside forests. Materials: See attached lesson from the Catskills Sense of Place Curriculum Module I, also accessible online here (scroll to the bottom): http://catskillcenter.org/sense-of-place/

11
Time: 30-45 minutes
16. Research an Indicator SpeciesObjective: The presence and number of trout in a stream is an indication of how healthy the streamecosystem is, in other words trout are an indicator species of stream health. Your students willresearch a variety of indicator species for different ecosystems.Materials: Pictures of lichen, amphibians, macroinvertebrates, trout, box turtle; internet access orfield guidesTime: 30 minutes plus 45 minutes for research in class or as homework, extra time for optionalvideo a. Find pictures of a few organisms that qualify as indicator species (lichen, amphibians,
macroinvertebrates, trout, box turtle…). Lay them out on a table and have students explore the pictures.
b. Ask each student to find a partner and share for 2 minutes about what he or she alreadyknows about some of the organisms in the pictures. Hear some volunteer responses with the whole class.
c. Explain that all of these organisms are “indicator species”. Like the trout you are raising/haveraised, they are very sensitive to their environments and can give us a warning that something is wrong. An indicator species is the first to struggle when environmental quality decreases.
d. Optional: Watch the video, Ranger Nick: Signs of Healthy Creeks and Streams, to learn aboutIndicator Species https://mywoodlot.com/index.php?option=com_zoo&task=item&item_id=299&cate%20gory_id=72&Itemid=181
e. Ask students to explain the definition of an indicator species in their own words to apartner. Can they think of any other examples of indicator species?
f. Instruct each student to choose an indicator species to investigate. Either as homework or inclass, ask students to research this organism using credible online sources or field guides. Students should answer the following questions:
a. Where does my indicator species live?b. What does my indicator species need to survive? Food? Habitat?c. Are there any examples of this indicator species being negatively impacted by
environmental pollution? If so, describe. If not, predict how you would know if theorganism’s environment were to degrade in the future.
g. Optional: Have students give a presentation or share what they find with a small group.h. Wrap-up reflection: Have students predict what the environment will look like where they
release their trout/discuss what it looked like. How will we know whether or not the river wevisit(ed) is healthy enough for our trout? Discuss in partners or small groups for 2 minutes andthen as a whole group.
17. Roots to the Rescue! Erosion Demonstration ModelObjective: Students build models that explore how rain causes soil erosion on different types of landcover (bare soil, mulch, growing plants). Impacts on downstream water quality are investigated.Materials: See attached lesson.Time: 30-45 minutes, including time to build the model Discussionquestions to connect demonstration with field trip:
• Which model might represent the farm fields?
• What types of materials might runoff the farm fields into a nearby stream during a rainstorm?
• What impacts might this runoff have on the health of the environment?• Which model might be like the riparian (stream side) forest?• How might trees and other plants affect soil erosion?

12
• Ho might trees create “mulch” in the environment?• Why is it helpful for water quality to plant trees near a stream?• How does/did this relate to your field trip when you will be planting/have planted trees
along a stream on a farm?18. Go with the Flow Game
Objective: Understanding the way that runoff flows and the way this impacts water quality in thebodies of surface water in a watershed. Students will also learn about the ecological functions playedby forests, wetlands, riparian zones, and even engineered landscape features like swales and stormwater basins in slowing and filtering water as it flows through a watershed, therefore mitigatingsome of the impacts of non-point source pollution and erosion.Materials: Can be played outside, preferably on a grassy hill, or indoors in a gym or cafeteria space.See attached lesson.Time: 20-40 minutes, depending on how many rounds/variations you do.
19. Thirsty Tree AnatomyObjective: Conduct close observation of trees in local environment, identify at least 3 differentparts of a tree and describe how these tree parts interact with water. Students will be able toexplain how trees help maintain water quality in a watershed.Materials: See attached lesson plan.Time: 35-50 min, depending on whether or not you go outdoors and discussion time.
20. Video: Urban Trees (from The Nature Conservancy, 4.5 minutes)Objective: Understand the function of trees in urban environments and predict how upstate and cityforests may be similar and different.Materials: Web link, computer, projectorTime: 15-20 minutes, depending on discussion time
a. Have students record ways in which urban trees benefit people while watching thisvideo: https://www.youtube.com/watch?v=lYhuiP43Ip0&list=PL- o5jtJniubZl4mxT6_K6IuZ7-gbJM50_&index=10 .
b. Share and discuss what students found in small groups and then as a large class.c. Ask students to discuss with a partner for 2 minutes and then share some answers with the
class for the following question: How do you expect the forest we will be planting at ourTrees for Tribs site to be different from the urban forest? Or How was the forest where we plantour Trees for Tribs different from the urban forest?
21. Water Usage Matching Game and Water Conservation ChallengeObjective: Understand how much water is used for common daily activities, monitor weekly water usage and develop and implement strategies for conserving more water in daily life. Materials: water usage matching cards (attached), copies of Weekly Water Use Report Card with optional Water Use Math Quiz on the back (attached), index cards (2 per student)
Time: 20 minutes Part I; 30 minutes Part II; homework time to fill out water log Part I:
a. Lead students in a human spectrum activity.i. One end of the classroom represents extreme water wasting and the other end of the
classroom represents extreme water conservation.ii. Explain that this lesson will help students explore their personal water usage.
iii. Ask students to honestly rate where they fall along this spectrum and to stand in thecorresponding location in the classroom. Prompt students if necessary to think about howthey use water for the sink, toilet, shower, clothes washer, etc.
b. Have students form small groups of 3-4 and hand out water usage matching cards. Challengestudents to find the correct matches. After a few minutes, reveal the answers.
c. Discuss as a large group: Was anything surprising?d. Have students return to their seats and hand out either the Water Use Calculations (data collected over
one week) or My Typical Day Water Use Calculator (data collected over one day) worksheets.

13
Tell students that this will be a homework assignment over the next day or week. Ask students to read over it to see if they have any questions.
Part II: e. Depending on which worksheet is chosen, have students calculate their water usage for
the week or day. This could be a good opportunity for a math extension.
f. Pair students and have them discuss with a partner for 2 minutes and then share somevolunteer answers with the whole class for each of the following questions:
i. What are some simple ways you or your family could reduce water usage?ii. Why would you be motivated to do so? For the second question, connect back to
your bus tour field trip if students do not do so automatically. Consider the following: Respect and honor the land, people, and infrastructure upstate that is responsible for keeping water clean and transporting it to the city; Forests filter water; Energy and money required to UV disinfect and filter the water with technology, materials required to maintain reservoirs, dams, aqueducts, energy and money required to treat wastewater, etc.
g. Ask students to make a pledge about how they would like to conserve water. Have them writetwo index card copies of the pledge.
h. Display pledges prominently in the classroom and refer back to them occasionallythroughout the year. Send the second copy home with students with the instructions thatthey should share it with their family.
22. Stroud Water InfiltrationObjective: Experiment with different land uses and soil types in an interactive model toobserve what happens to water after a rain event.Materials: web link, computer,projector Time: 30 mins
a. Pose these questions to the class:i. “Does soil come in different types?”ii. “Can the way water moves and acts depend on the soil type?”iii. “Do some soil types allow more water to soak through?”iv. “Can human activities and development change how much soil soaks through?”
b. Define Water Infiltration- the process in which ground water enters the soilc. Have students brainstorm about how much water infiltrates the soil after a rainstorm in
their town.d. Ask what factors can either increase/decrease the amount of infiltration.
i. i.e. land type, amount of rain, soil type, etc. e. Visit https://app.wikiwatershed.org/ and https://runoff.app.wikiwatershed.org/f. Students can compare and contrast different soil conditions and land use to observe and
hypothesize the best situations for the most soil infiltration.g. Ask students what would likely happen in their area based off their land useh. Students can brainstorm to develop creative ideas on how to decrease the amount of
runoff

LESSON 1 Activity 3 Page 1
The Water Cycle
Grades:
4th - 7th
Objective:
Students will learn that all water on Earth is part of a continuous process driven by natural forces such as the sun and gravity. This activity will explain how water moves and changes from one form to another, as well as how our water supplies are continuously replenished.
Method:
Students receive an incomplete diagram of the water cycle on which they label and color the different paths and processes of water movement. Either an overhead of the diagram is used, or it can be drawn on a blackboard, and filled in as students fill in the blanks.
Materials:
Handouts of the diagram (enclosed), an overhead (optional), crayons or markers for each student.
Time:
Preparation Time: 15 minutes Class Time: 30 minutes
Procedure:
1. Explain that all water on Earth is currently in one of the stages of the water cycle. Randomlypick a beginning point, stressing that there is no beginning or end to the water cycle. Be sure the students understand that the sun is the driving force behind this process. �
2. Hand out a copy of the unlabeled water cycle diagram, one per student.
3. Let’s say we started in the ocean. Have students label the ocean. Then, have them color thearrow above the ocean blue (for water). Ask them what process the arrow represents, and have students label EVAPORATION. Explain that when the sun heats water it turns to water vapor. Water also evaporates from land or even from plants (called transpiration). Students write water vapor in the empty space since it’s invisible.
4. Next is the atmosphere. Label the cloud, and have students color the arrow and label itCONDENSATION. As water vapor cools, it returns to its liquid state, forming clouds. �

LESSON 1 Activity 3 Page 2
5. Have students label the arrow PRECIPITATION, and color it blue. PRECIPITATION occurswhen clouds become saturated with water -- consequently, rain or snow is released. �
6. Briefly explain the concept of topography and how water can do one of two things once it fallson land: flow above ground until it reaches a water body (RUNOFF -- label and color) or percolate down through soil due to gravity (INFILTRATION -- label and color). �
7. Explain how RUNOFF eventually evaporates, beginning the cycle again. It may reach theocean before it evaporates, or it may not. �
8. The water that soaked into the ground does not stay still. It moves as GROUNDWATERFLOW. The water eventually returns to the surface at a spring or water body, allowing the cycle to continue.
Assessment:
1. Use the enclosed quiz as an assessment. Quiz answers:
1. Yes, all water on Earth is part of the water cycle.2. No, cycles do not have a beginning or an end.3. Water does not always follow the same route through the water cycle. It can skip overone phase in the diagram and move to another. 4. A raindrop could skip infiltrating or running off the ground in a number of ways. Twoways are: 1. The drop could evaporate before it reaches the ground. 2. The drop could land directly in a lake, stream, ocean, etc. 5. Liquid, gas (water vapor), and solid (ice crystals in clouds).
NYS Learning Standards:
English Standard 1 - Language for Information and Understanding: Listening and Reading
Math, Science, and Technology Standard 4 - Physical Setting 2,3; The Living Environment 6
Source: This activity developed by Nathan Chronister and MJ Reiss.


LESSON 1 Activity 3 Page 5
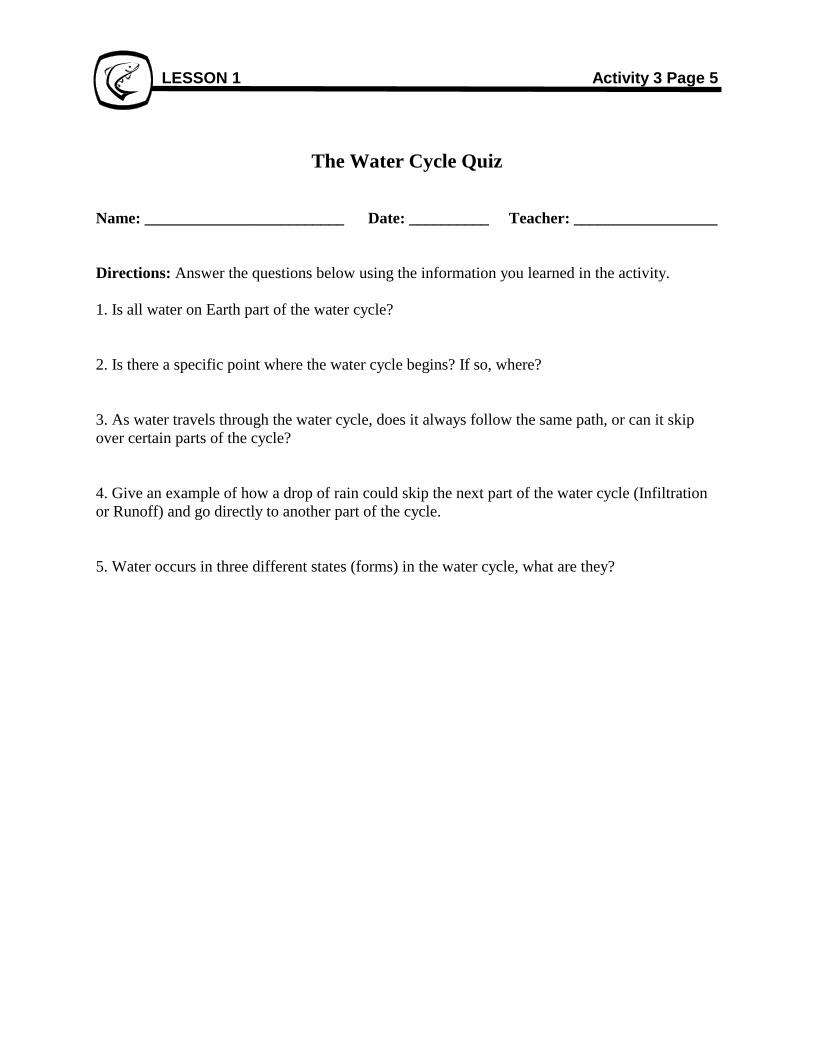
The Water Cycle Quiz
Name: _________________________ Date: __________ Teacher: __________________
Directions: Answer the questions below using the information you learned in the activity.
1. Is all water on Earth part of the water cycle?
2. Is there a specific point where the water cycle begins? If so, where?
3. As water travels through the water cycle, does it always follow the same path, or can it skipover certain parts of the cycle?
4. Give an example of how a drop of rain could skip the next part of the water cycle (Infiltrationor Runoff) and go directly to another part of the cycle.
5. Water occurs in three different states (forms) in the water cycle, what are they?


Trees, Forests, and the Water Cycle
Grades:
4th - 12th; Extension: 7th - 12th
Objective:
Students will learn what role trees and forests play in the water cycle. Students will gain a greater understanding of the dynamics of a forest ecosystem by seeing that trees are dependent upon, and play a part in, Earth's processes, including the water cycle. They will also learn that the water cycle is the system by which Earth's fixed amount of water is collected, purified, and distributed from the environment to living things and back to the environment.
Method:
Students will act out the paths that water takes in the water cycle. They will describe the importance of the water cycle to living things and the importance of plants in the water cycle.
Materials:
Cut out paper strips for Catskill water cycle game, a different color for each destination; copies of “Water Cycle Score Sheet” (one for each student); envelopes for paper strips; watch or stopwatch; plastic bags; twist ties or string; small graduated cylinders; the Multiple Intelligences sheet (in the appended material).
Overview:
In addition to clouds, oceans, rivers, and valleys, living organisms are part of the water cycle. All living things need water to live because it is essential to their bodily functions. Plants and animals take in water and return it to the atmosphere as vapor (breathing, transpiring) or to the soil as liquid (excreting).
Forests greatly affect watersheds. Trees, small plants, and forest litter absorb rainwater, reducing erosion and runoff. Leaves capture up to 60 percent of precipitation. When rain falls on bare ground, the full force of raindrops can wash soil into streams, making them muddy. But when rain falls on the forest, it drips down through leaves and branches to the forest floor. The forest canopy, as well as layers of plant litter under trees, protects the soil from the full force of rain. Tree roots hold the soil in place so that it doesn't wash away.
Plants use water to transport nutrients and minerals necessary for growth. Plants also use water in photosynthesis. Since most photosynthesis takes place in leaves, and the leaves of a plant can be many feet above ground level, how does water from the soil get to these leaves? Transpiration (evaporation of water from pores, or stomata, on trunk, stem, and leaf surfaces) aids plants in
LESSON 3 Activity 6 Page 1

transporting water upward through their tissues. Root pressure, the cohesive and adhesive qualities of water (capillary action), and evaporation all contribute to water's circulation through a plant.
Evaporation is most likely the main process whereby water moves up the plant. When the water molecules reach the stomata of the leaves, they are exposed to air and the sun's energy. The exposed molecules receive heat energy from the sun and begin to move faster. This motion makes it easier for the molecules to break away and become water vapor. However, a tension still exists among the water molecules. As one molecule is drawn away, it pulls on the other nearby water molecules, pulling those molecules to the surface.
Plants can absorb large quantities of water; however, they lose most of this water through transpiration. Transpiration coupled with evaporation of surface water is called evapotranspiration. It plays a crucial role in the water cycle. Evapotranspiration returns water to its gaseous state, in which it is carried by winds through the atmosphere until it condenses and returns to Earth as precipitation.
Forests help improve water quality by filtering out impurities that could be potentially harmful in streams or groundwater. As water is absorbed by tree roots and then transpired through leaves, impurities (many of which are good for a tree) remain in the tree.
Although the gradual wearing down and erosion of soil is a natural process, without proper management human activities such as clearing vegetation for development, logging, dam building, farming, and draining wetlands will increase the rate of erosion in watersheds and can reduce water quality. By the same token, reforestation, use of best management practices in forestry and farming, certain types of landscaping, and restoring wetlands can reverse those trends.
Procedure:
Note: Photocopy each part of the Water Cycle game on a different color paper. Cut the strips apart. Mark each of six envelopes with a large label for each of the following: Cloud, Mountain, Stream, Groundwater, Ocean, and Plant. Put the strips in the corresponding envelope. Use the envelopes to set up six stations around the room.
Intro: Ask: “What is a cycle?” (a sequence of recurring events). Invite students to name some cycles that are part of their lives (morning, afternoon, night; fall, winter, spring, summer). If you haven’t covered the water cycle, ask students whether they have heard of it before. Divide the class into pairs. Ask pairs to write down words that describe what they know about the water cycle or what they think the term water cycle might mean. Then ask them to write their own description of the water cycle. Ask for volunteers to share their descriptions with the class.
Show students the water cycle diagram in Lesson 1. Make sure that students understand the terms evaporation, groundwater, and condensation. Introduce the term transpiration. Use the following questions to focus students’ attention:
LESSON 3 Activity 6 Page 2

• If every living thing needs so much water, how come water isn't used up?• Where does the water go when a puddle dries up?• Why don't oceans and lakes dry up like puddles do?• Where does rainwater come from?• Do you think water always follows the same path as shown in the diagram?
1. Explain that the water cycle is really a simplified model for looking at the “journey” of a watermolecule. So students may learn more about the different paths water might take, have them play a game in which each group will be a water molecule.
2. Divide students into five approximately equal groups, and have each group begin at one of thestations. Give each group a scorecard to record the path they will follow in the game. Later, students will have the chance to compare scorecards and will have the opportunity to depict their journey in a variety of ways (using multiple intelligences).
3. One student from each group should remove a strip from the envelope at their station. Theyshould read the strip to the group and write the following on their water cycle score sheet: their station stop, what happens to them, and their destination. Have them return the strip to the envelope. When you call out “cycle”, groups should move to the next station as directed on the strip.
4. Groups should repeat step 3 above, continuing their journeys until their score sheet iscomplete.
5. Students can complete the activity in two ways:1. Have students go back to their seats and individually write a brief story from a watermolecule's point of view that describes their journey through the water cycle. 2. Groups can depict their journey using one of the following skills: verbal/linguistic,musical/rhythmic, bodily/kinesthetic, visual/spatial, or logical/mathematical. (See Multiple Intelligences sheet in the appended material)
Extension: This activity works best on sunny days after a rainstorm or after an area has been watered.
1. Divide class into small groups. Give each group an empty plastic bag.
2. Identify trees or shrubs on the school grounds. Assign each group a plant.
3. Have each group carefully place its bag over a limb of its tree or shrub. (Facing the sun worksbest) Tie the bag with a twist tie or string. Each group should count and record the number of leaves in its bag.
4. Challenge the students to develop a method to estimate the number of leaves on their tree orshrub. Have each group record the estimated number of leaves on its tree or shrub.
LESSON 3 Activity 6 Page 3

5. Leave the bags on the plants for 24 hours. Have the groups carefully remove the bags at the same time and take them back to the classroom.
6. Have each group carefully open their bag and transfer its contents to a small graduated cylinder. Measure the amount of water in the cylinder. Have students calculate the transpiration rate for their whole plant based on their estimation of the number of leaves on the plant.
7. Pool the class data on the chart. Have students estimate the number of days in the growing season. Calculate the transpiration rate for each plant for the growing season.
Assessment:
1. Where does rainwater come from? Do you think water always follows the same path as shown in the water cycle diagram? Where does the water go when a puddle dries up?
2. Make sure that all groups completed their score sheet. Does their story about their journey (or other depiction using multiple intelligences) follow their score sheet? Are the steps in their journey consistent with natural processes?
3. If the class completed the extension activity: Are their data somewhat reasonable? Ask if they are surprised by the transpiration rate they calculated. What are some of the many variables that could affect the data collected?
NYS Learning Standards:
Arts Standard 1 - Creating, Performing, and Participating in the Arts: Theatre
English Standard 1 - Language for Information and Understanding: Speaking and Writing Standard 2 - Language for Literary Response and Expression: Speaking and Writing
Math, Science, and Technology Standard 1 - Analysis, Inquiry, and Design: Scientific Inquiry Standard 3 - Mathematics: Uncertainty Standard 4 - Science: Physical Setting 2,4; The Living Environment 6
Source: Activities adapted from Project Learning Tree, Water Wonders, and Project WET, Thirsty Plants. Adapted by Donna Rogler, Catskill Forest Association.
LESSON 3 Activity 6 Page 4
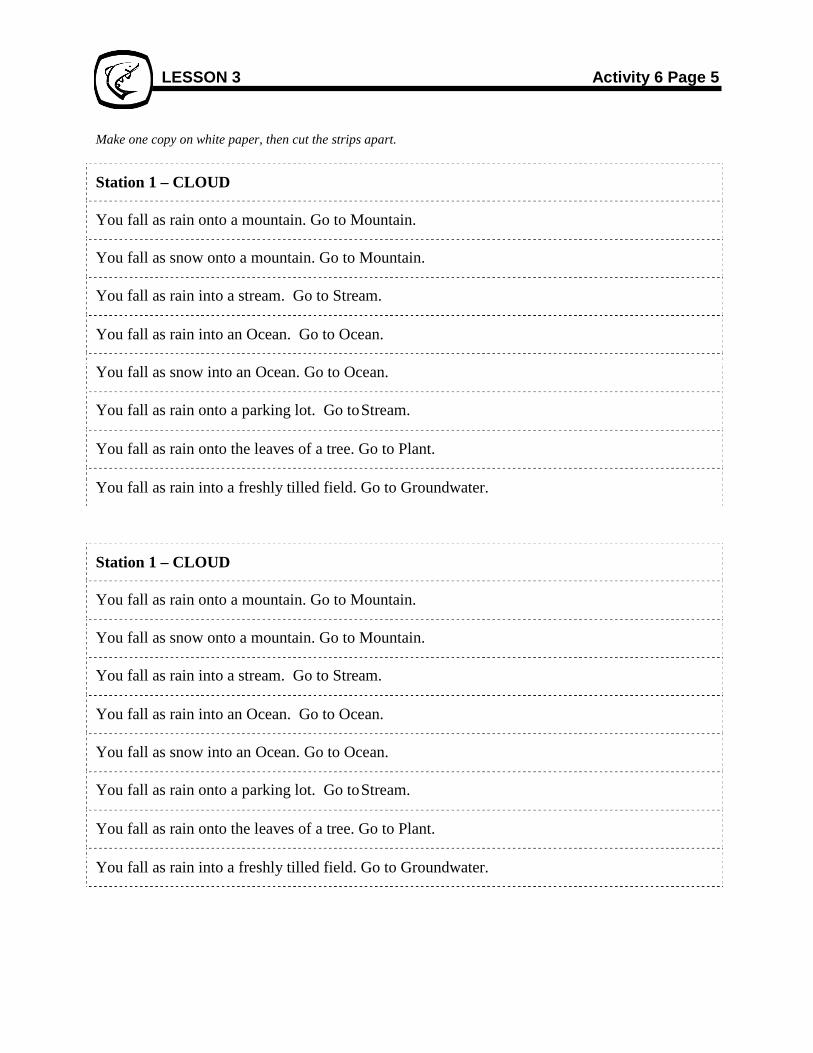
Make one copy on white paper, then cut the strips apart.
LESSON 3 Activity 6 Page 5
Station 1 – CLOUD
You fall as rain onto a mountain. Go to Mountain.
You fall as snow onto a mountain. Go to Mountain.
You fall as rain into a stream. Go to Stream.
You fall as rain into an Ocean. Go to Ocean.
You fall as snow into an Ocean. Go to Ocean.
You fall as rain onto a parking lot. Go to Stream.
You fall as rain onto the leaves of a tree. Go to Plant.
You fall as rain into a freshly tilled field. Go to Groundwater.
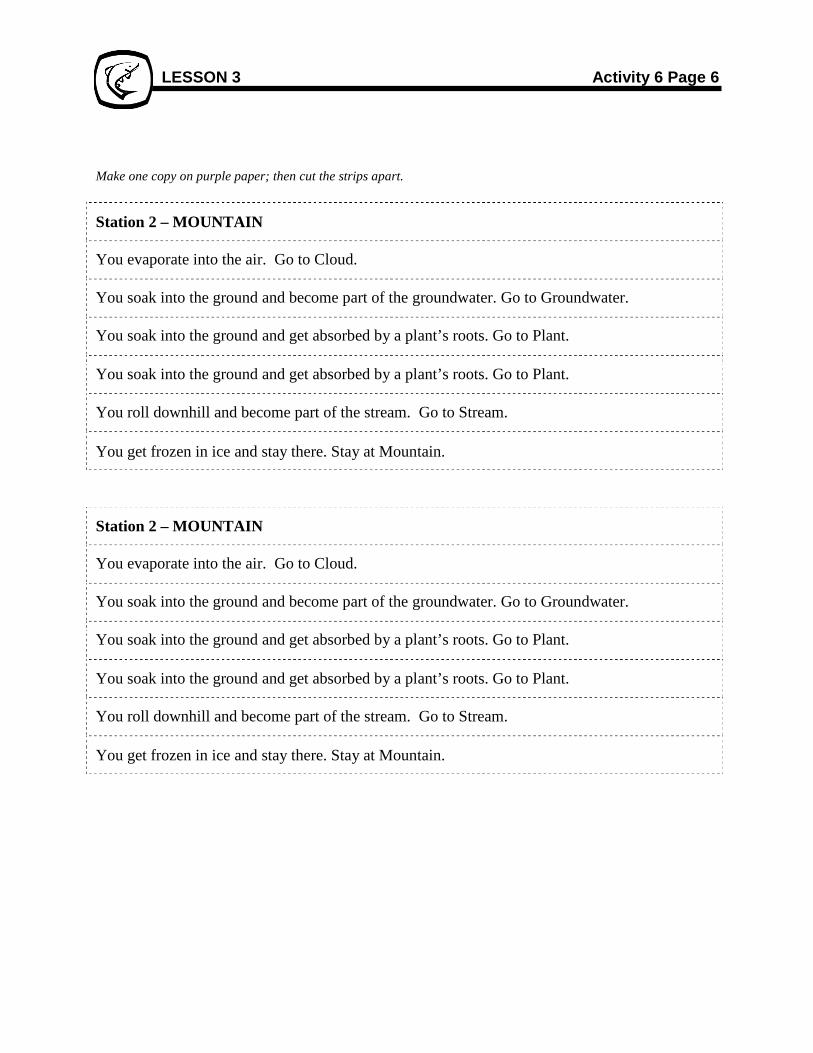
Make one copy on purple paper; then cut the strips apart.
LESSON 3 Activity 6 Page 6
Station 2 – MOUNTAIN
You evaporate into the air. Go to Cloud.
You soak into the ground and become part of the groundwater. Go to Groundwater.
You soak into the ground and get absorbed by a plant’s roots. Go to Plant.
You soak into the ground and get absorbed by a plant’s roots. Go to Plant.
You roll downhill and become part of the stream. Go to Stream.
You get frozen in ice and stay there. Stay at Mountain.
Make one copy on blue paper; then cut the strips apart.
LESSON 3 Activity 6 Page 7
Station 3 – OCEAN
You are one of countless water molecules in an ocean and you stay there. Stay at Ocean.
You are one of countless water molecules in an ocean and you stay there. Stay at Ocean.
You evaporate into the air. Go to Cloud.
You evaporate into the air. Go to Cloud.
A kelp plant takes you in, releases you through its leaf, and transpires you back into the ocean. Go to Plant, but do not draw a card. Return to Ocean.
You are one of countless water molecules in an ocean and you stay there. Stay in Ocean.
Make one copy on gray paper; then cut strips apart.
LESSON 3 Activity 6 Page 8
Station 4 – STREAM
You evaporate into the air. Go to Cloud.
You evaporate into the air. Go to Cloud.
You continue rolling downhill and become part of the ocean. Go to Ocean.
You continue rolling downhill and become part of the ocean. Go to Ocean.
Station 4 – STREAM
You evaporate into the air. Go to Cloud.
You evaporate into the air. Go to Cloud.
You continue rolling downhill and become part of the ocean. Go to Ocean.
You continue rolling downhill and become part of the ocean. Go to Ocean.

Make one copy on tan paper; then cut the strips apart.
LESSON 3 Activity 6 Page 9
Station 5 – GROUNDWATER
You become part of an underground stream that flows to an ocean. Go to Ocean.
You become part of an underground stream that flows to an ocean. Go to Ocean.
You become part of an underground stream that flows to a spring, where you become part of a stream. Go to Stream.
You become part of an underground stream that flows to a spring, where you become part of a stream. Go to Stream.
A plant takes you in through its roots. Go to Plant.
You are pumped out of the ground to irrigate a farm. Go to Plant.

Make one copy on green paper; then cut the strips apart.
LESSON 3 Activity 6 Page 10
Station 6 – PLANT
The plant transpires you through its leaves into the air as vapor. Go to Cloud.
The plant transpires you through its leaves into the air as vapor. Go to Cloud.
The plant transpires you through its leaves into the air as vapor. Go to Cloud.
The plant uses you for photosynthesis. Stay in Plant.
The plant uses you to grow. Stay in Plant.

WATER CYCLE SCORE SHEET
Name:
STATION STOP WHAT HAPPENS DESTINATION
Ex. Cloud Falls as rain Mountain
1
2
3
4
5
6
7
8
9
10
LESSON 3 Activity 6 Page 11

TRANSPIRATION EXPERIMENT
GROUP
Plant name or description
Water Transpired
(mL)
Water Transpired from entire plant
Transpiration per growing season
GROUP 1
GROUP 2
GROUP 3
GROUP 4
GROUP 5
Questions:
1. Which plant transpired the most water?
2. Which plant transpired the least water?
3. Estimate the amount of water each plant would transpire in one growing season. Assume a constant rate of transpiration.
LESSON 3 Activity 6 Page 12


Watersheds & Working Landscapes: The New York City Water Supply System
What are watersheds? • A watershed is the area of land that sheds all of its surface water and groundwater into a common water body,
such as a stream, river, lake, or reservoir. • Every water body has its own watershed. • All of the earth’s land drains into some water body, therefore we all live in a watershed.
What is the New York City water supply system? • NYC’s water supply comes from reservoirs in upstate NY. The land that sheds its water into these reservoirs is
the NYC Watershed. • There are two NYC Watershed regions - the older Croton Watershed and the newer Catskill/Delaware Watersheds. • 19 reservoirs and 3 lakes provide more than 9 million consumers with more than 1 billion gallons of safe, clean
drinking water every day. • Thousands of people in dozens of communities were forced to relocate when the water supply reservoirs
were constructed. • Water travels primarily by gravity up to 125 miles through large underground aqueducts and tunnels before
reaching NYC faucets. • On average, 90% of NYC’s water is supplied by the Catskill/Delaware Watersheds, which are currently unfiltered.
What are working landscapes? • A working landscape is an area where people live and work in a way that allows the natural ecosystem to be
sustained. Such an area can support economic, social, and environmental needs by considering the residents who live and work there as well as non-residents who benefit from the goods and services produced by the land.
• Approximately 72% of the NYC Watershed landscape is forestland and 8% is farmland. • 68% of the NYC Watershed is privately owned, 17% is owned by NY State and 15% is owned by NYC
(reservoirs, buffer lands, recreational lands). • More than 250,000 people live in the NYC Watershed, most of them in the Croton Watershed region in suburban
Westchester and Putnam Counties. • NYC works in partnership with upstate watershed communities to protect water quality through well-managed
working landscapes of forests and farmlands. Why are working landscapes important for watershed protection? • Well-managed farms and forests preserve water quality
and are preferred land uses for watershed protection. • A “working” landscape provides multiple benefits:
– jobs – food – wood products – safe drinking water – rural character – recreation & tourism opportunities – biodiversity – community economic viability – open space

Where in the WORLD are we?!?!:
NYC Water Supply System Map Exploration Guiding Questions
1. Take a look at the map. Discuss what places or features you recognize. Write down a short description of what do you think this map is about. (Hint: Does your map have a title?):
2. Point to New York City. Find your borough and point to where your school and home are (approximately).
3. Point to North? Discuss how you know this is north. Locate the compass on the map. Point to west, east, and south.
4. Find the scale on the map. Draw a line below that represents 10 miles on your map. Approximately how many miles long is Manhattan? Use a piece of string to help measure:
DRAW HERE:
5. Point to the Hudson River. Write what body of water it drains to:
Understanding the NYC Watershed and Water Supply System:
6. Our drinking water comes from the 2 large areas north of the city that are shaded green. Write down the names of these areas and some of the types of water bodies do you find in them:
7. What is a watershed? A watershed is an area of land that drains all of its water downhill into one body of water. Hold out your hand, palm facing up. Pretend your hand represents an area of land. If it rained on this ‘land,’ discuss with your group where would the water go. Write down why the water would end up there:
8. What is a reservoir? A reservoir is a manmade lake made by damming a river to make the water back up and collect behind it. Write down the names of 1 reservoir in the Catskill Delaware Watershed and 1 reservoir in the Croton/East of Hudson Watershed and the names of the rivers that were dammed to make each of these reservoirs:
9. Write down where the water in the rivers and reservoirs comes from: (Hint: Think about the water cycle).

10. Discuss how clean you think the water is in the rivers and reservoirs. Write down some things that you think could affect how clean or dirty it is:
11. Discuss where the water goes after it hits the ground when it rains in New York City? Write down why you think we don’t drink THIS water:
12. When it rains in the NYC Watershed, the rain flows downhill and ends up in rivers and reservoirs. Discuss how you think New York City gets the water from the reservoirs all the way down to the city for people to use. Write down what map features help explain how the water gets transported:
_
The Journey of a Drop of Water:
13. Place a blue bead anywhere in the NYC Watershed area. This blue bead represents a drop of water. Use a piece of string to trace the journey of your water drop from where it landed in the watershed all the way down to NYC. Answer the following questions:
a. What river and reservoir do you flow to? _
b. What aqueduct(s) do you flow through? _
c. What counties do you travel through?
d. How many miles did your drop travel to get to NYC? Use string and the map scale to measure the length of your journey:
e. The trees and forests in the watersheds filter out pollution and keep the water clean. Most of our water does NOT have to be
filtered by a filtration plant because the trees filter it for us. What types of pollution do you think trees filter out?
14. Describe the journey of your drop of water to the whole group. Please include in your story where you started, what you flowed through, where you ended up, how far you traveled, and what made you cleaner and dirtier along your way.
The Story of my Water Drop: _

Buckets of Bugs
Grades:
3rd - 12th
Objective:
Students become familiar with several types of the macroinvertebrates they may find in a stream. This activity also shows students how to determine the level of impact that pollution has had on a stream. By looking for certain types of macroinvertebrates, students will be able to decide if a stream is “impacted” or “non-impacted”.
Method:
Each group of students will be given a fictitious stream sample on cards. They will identify each specimen and follow a set of screening criteria to analyze their stream’s health.
Materials:
Six (or more) plastic containers (16 oz.), cut-outs of the macroinvertebrates (sheets enclosed), copies of the Biological Data Sheet (see appendix) stonefly, mayfly, or caddisfly picture (enclosed) for each student, overheads (Biological Data Sheet, caddisfly), identification key from appendix for each group (two versions depending on grade level), and crayons.
Time:
Preparation Time: 30 minutes Class Time: 30-45 minutes
Procedure:
1. Preparation: Make six copies of each macroinvertebrate card sheet. Cut out along the lines.Divide up the cards into the different buckets, putting at least 10 in each bucket. We suggest that you purposely create one or two buckets representing non-impacted streams, and at least one group have an extremely impacted stream. This is accomplished by strategically placing certain cards. Non-impacted streams would include: mayflies, stoneflies, caddisflies, water pennies, and hellgrammites. A very impacted stream would consist mostly of aquatic worms. A moderately impacted sample would have a random assortment of the various creatures.
2. Begin by reviewing the three body segments of an insect, as well as the differences betweenthe mayfly, stonefly, and caddisfly. Hand out the large drawings so that each student has either a mayfly, stonefly, or caddisfly. Students will color each segment a different color: head=red, thorax=green, abdomen=blue. Legs, wing pads, antennae, etc. are part of the segment to which
LESSON 2 Activity 2 Page 1

they attach and should be colored accordingly. Use the overhead to point out the three segments. The thorax/abdomen boundary is less clear on the caddisfly, so you need to emphasize that the part with legs is the thorax; everything behind that is the abdomen.
3. Explain how the body segments are used for identification: The STONEFLY has gills on its thorax, whereas the MAYFLY has gills on its abdomen. You can’t always go by the number of tails; some mayflies have only two. Have students who have colored their body segments correctly stand up and point out the segments and gill locations to the class.
4. Tell the class that they are going to be given a bucket with specimens collected from a stream. Their job is to sort through the aquatic insects and determine whether their stream is IMPACTED or NON-IMPACTED. Introduce these two terms. IMPACTED means a stream has had some impact from pollution. NON-IMPACTED means that there is no sign of pollution. These streams have the highest water quality. There are many degrees of how impacted a stream is, from very impacted, to just slightly impacted, to not impacted at all.
5. Once the difference between impacted and non-impacted is clear, divide the class into groups of no more than four. The number of groups should equal the number of buckets.
6. Give each student a copy of the Biological Data Sheet. Give each group an identification key and a container with cards. Put up the overhead of the Biological Data Sheet, and have students fill out the upper portion of their own data sheets. Explain how to fill out the data sheet based upon their sample, up to the Screening Criteria section. This section will be done as a class.
7. Instruct the groups to sort and identify the invertebrates. They can use their knowledge of mayflies, stoneflies, and caddisflies, plus the identification key. After they have the types and numbers recorded, they can add up the totals for their group.
8. When all of the groups are finished and the buckets have been collected, explain the section on the data sheet entitled Screening Criteria For Non-Impacted Streams. This method for classifying streams is used by the Department of Environmental Conservation (DEC).
Note: Ignore the requirement for 3 species of mayflies since we aren’t really at the stream. Also, make sure the students understand they should only check the box that deals with worms if they do not have any. It is the opposite of the other four boxes.
9. After you have gone through each criterion with the class, ask each group how many boxes they have checked and what that means in terms of impacted and non-impacted.
LESSON 2 Activity 2 Page 2

Options:
1. The last two pages in this activity provide a more advanced option for practicing identification skills. Using the sheet of actual size insect drawings, students complete the Hudson Basin River Watch “Biotic Index” data sheet found in the appendix. Use this activity with the more advanced identification key, also found in the appendix.
Assessment:
1. Use the enclosed quiz as an assessment. Answers are provided on the answer key.
NYS Learning Standards:
Math, Science, and Technology Standard 1 - Analysis, Inquiry, and Design: Scientific Inquiry 1 Standard 4 - Science: The Living Environment 1, 5, 7
Source: Activity developed by Nathan Chronister and Aaron Bennett.
LESSON 2 Activity 2 Page 3

LESSON 2 Activity 2 Page 4

LESSON 2 Activity 2 Page 5

LESSON 2 Activity 2 Page 6

© Tamara R. Sayre
LESSON 2 Activity 2 Page 7

© Tamara R. Sayre
LESSON 2 Activity 2 Page 8

Buckets of Bugs Quiz
Name: Date: Teacher:
Directions: Answer the questions below using the information you learned in the activity.
1. What is the difference between an impacted stream and a non-impacted stream?
2. List three types of aquatic insects you would expect in a non-impacted stream?
3. What is the best way to tell stoneflies and mayflies apart? (Hint: It is not by counting their tails!)
4. What is a macroinvertebrate?
5. Do all macroinvertebrates that live in streams and ponds breathe oxygen from the water?
LESSON 2 Activity 2 Page 9

Buckets of Bugs Quiz
ANSWER KEY
Name: Date: Teacher:
Directions: Answer the questions below using the information you learned in the activity.
1. What is the difference between an impacted stream and a non-impacted stream? An impacted stream has pollution in it and a non-impacted stream doesn’t.
2. List three types of aquatic insects you would expect in a non-impacted stream? Any three of these: mayfly, stonefly, caddisfly, water penny, beetle.
3. What is the best way to tell stoneflies and mayflies apart? (Hint: It is not by counting their tails!)
Mayflies have gills on their abdomens. Stoneflies do not.
4. What is a macroinvertebrate? It’s an animal without a backbone that you don’t need a microscope to see.
5. Do all macroinvertebrates that live in streams and ponds breathe oxygen from the water? No. Some breathe from the surface.
LESSON 2 Activity 2 Page 10

J
•-··.I -iJll
=....... ,. "'-"""t ., ·· .(
47
·

Benthic Macroinvertebrate Major Group Biotic Index Worksheet
ANSWER KEY
Major group
A # of Organisms in
Sub-sample
B Assigned Biotic Index
C Biotic Value for
Group Mayfly 12 2 24 Stonefly 4 1 4 All Caddisfly except Netspinner 3 3 9 Netspinner Caddisfly 4 5 20 Dobsonfly, Fishfly 1 4 4 Alderfly 0 4 0 Water Penny 1 4 4 Whirligig Beetle 0 4 0 Other Beetles 2 5 10 Crane Fly 2 4 8 Watersnipe Fly 0 4 0 Black Fly 2 5 10 Midge 2 6 12 Dragonfly 2 3 6 Damselfly 1 7 7 Crayfish 2 6 12 Scud 1 6 6 Sowbug 1 8 8 Clam 0 6 0 Snail 2 7 14 Leech 0 7 7 Aquatic Worm 2 9 18 TOTALS D 44 E 183
Instructions: (Try to pick up at least 100 individual organisms.) Using the “BMI Sorting” worksheet, count the number of organisms for each major group identified in your sub-sample and record in column A. Sum the total of that column and record in D. Multiply the number of organisms in each Major Group by the assigned biotic index value (see column B) and record the results in column C. Sum the total of that column and record in E. To get the Biotic Index Score, divide E by D.
E total biotic value Biotic Index Score= =
D total # organisms in your sample
Biotic Index:
0-4.5
non-impacted
4.51-6.50
slightly impacted
6.51-8.50
moderately impacted
8.51-10
severely impacted
4.16

Benthic Macroinvertebrate Major Group Biotic Index Worksheet
Name(s) School/Group Stream Date(s) Sampled Site Replicate
Major group
A # of Organisms in
Sub-sample
B Assigned Biotic Index
C Biotic Value for
Group Mayfly 2 Stonefly 1 All Caddisfly except Netspinner 3 Netspinner Caddisfly 5 Dobsonfly, Fishfly 4 Alderfly 4 Water Penny 4 Whirligig Beetle 4 Other Beetles 5 Crane Fly 4 Watersnipe Fly 4 Black Fly 5 Midge 6 Dragonfly 3 Damselfly 7 Crayfish 6 Scud 6 Sowbug 8 Clam 6 Snail 7 Leech 7 Aquatic Worm 9 TOTALS D E
Instructions: (Try to pick up at least 100 individual organisms.) Using the “BMI Sorting” worksheet, count the number of organisms for each major group identified in your sub-sample and record in column A. Sum the total of that column and record in D. Multiply the number of organisms in each Major Group by the assigned biotic index value (see column B) and record the results in column C. Sum the total of that column and record in E. To get the Biotic Index Score, divide E by D.
E total biotic value Biotic Index Score= =
D total # organisms in your sample
Biotic Index:
0-4.5 non-impacted
4.51-6.50 slightly impacted
6.51-8.50 moderately impacted
8.51-10 severely impacted
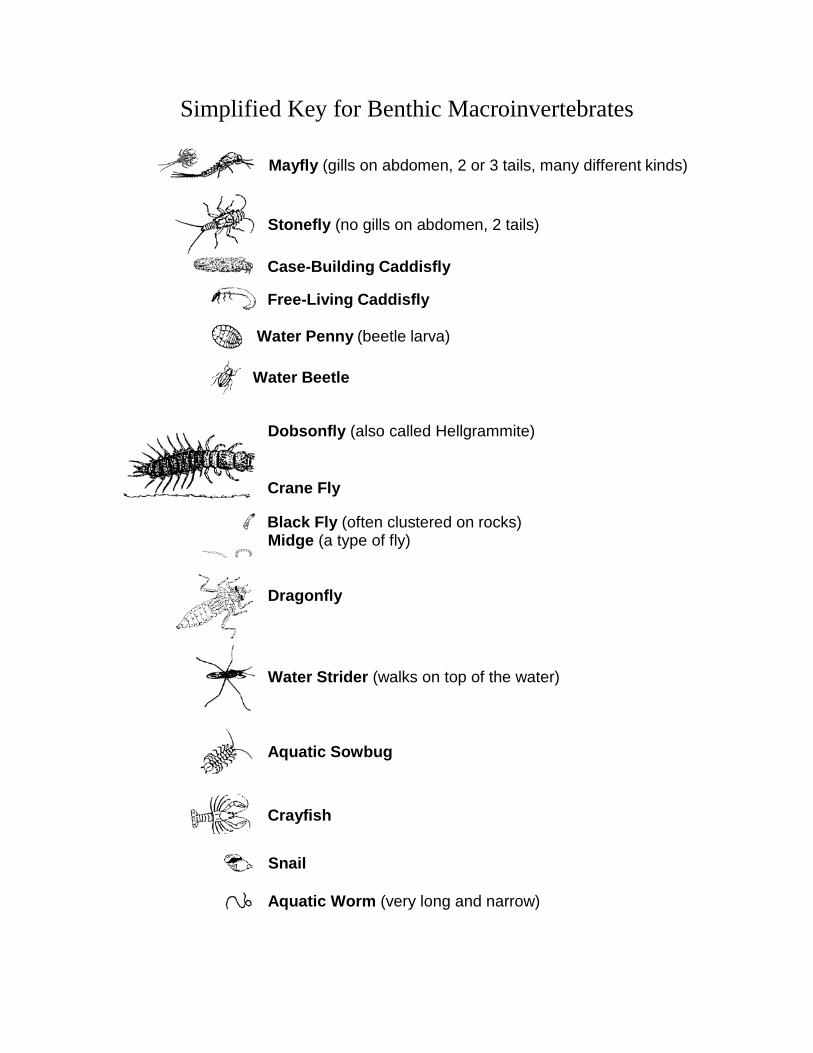
Simplified Key for Benthic Macroinvertebrates
Mayfly (gills on abdomen, 2 or 3 tails, many different kinds)
Stonefly (no gills on abdomen, 2 tails)
Case-Building Caddisfly
Free-Living Caddisfly
Water Penny (beetle larva)
Water Beetle
Dobsonfly (also called Hellgrammite)
Crane Fly
Black Fly (often clustered on rocks) Midge (a type of fly)
Dragonfly
Water Strider (walks on top of the water)
Aquatic Sowbug
Crayfish
Snail
Aquatic Worm (very long and narrow)


Roots to the Rescue! Plant and Soil Erosion Demonstration
Topic: Watershed Forestry – Plants reduce erosion and help protect water quality in a watershed • Plant roots hold soil in place and reduce the amount of soil that washes away (erosion) during a rain storm • Plant material on the ground blocks rain drops from hitting bare soil, loosening it, and washing it away (erosion)
Objective: Students will compare soil erosion in 3 model landscapes: 1. Bare soil; 2. Groundcover; 3. Growing plants. They will predict what will happen when it rains on each landscape and then create a rainstorm and observe and record their observations. Students will be able to explain how plants help maintain water quality in a watershed by reducing erosion and apply this understanding to watershed stewardship.
Materials: 3 metal baking pans or 3 2L bottles, soil, grass seed, mulch or dead leaves and sticks, 2-3ft of string or wire, watering can (ideally with sprinkler head).
Introduction (indoors):
1. Review Key Terms: As a class, review the definition of a watershed:
• A watershed is an area of land that drains (or sheds) all of its surface and ground water into a common body of water, like a river, lake, or reservoir.
Review the basic parts of the water cycle:
• Water is constantly moving through the environment in a cycle. Water circulates between the earth's oceans,
atmosphere, and land. Water falls from the atmosphere as rain and snow, flows across the surface as runoff in streams and underground as groundwater, and returns to the atmosphere by evaporation and transpiration.
2. Brainstorm Different Types of Places in a Landscape: When you walk down the street or go for a drive, you see different places, like buildings, roads, parking lots, fields, gardens, parks and woods. Think of your walk/drive/bus ride to school. Turn to a partner and work together for 45 seconds to write down as many different kinds of things you see around you on your way to/from school.
You might see buildings, roads, parking lots, shopping centers, homes, lawns, parks, gardens and woods. Now imagine there’s a BIG dark grey cloud floating over the land. What do you think will happen when it rains on these different areas? Where will the rain go? How will it move? How clean or dirty is will the rain water be after it falls on these different places?
With your partner, pick one of the places that you wrote down and discuss the following questions: When it rains there, where will the rain water go? How will it move? How clean or dirty will this water be? Ask 2-3 groups to share out their predictions.
Introduce the concept of erosion:
• Erosion is the slow wearing away of the land (soil and rocks) by rain, wind and glaciers.
Erosion is when rain hits the ground and washes away materials like soil and rocks. Have you ever seen erosion happening? Have you ever seen evidence that erosion has happened before? (For example, gullies in a dirt path, piles of sand on the side of the road, worn down stone buildings or monuments, the Grand Canyon.)
3. Let’s Model and Test It!: We are going to create models of 3 different types of land, predict what will happen when it rains on them, and test our predictions. We might learn something from our models that helps us understand what

happens to the surface of the land when it rains in real life.
How could we create a model of some of these places and test what happens when it rains? What materials could we use to create different types of places? How could we create a rainstorm? How might we discover if the land is being eroded when it rains?
Plant and Soil Erosion Demonstration: (Check out this “funsciencedemos” video called “Soil and Erosion” to get familiar with the setup of the demonstration: https://www.youtube.com/watch?v=im4HVXMGI68)
1. Create 3 Land Models. Fill 3 metal baking pans or 3 2L bottles (lying on their sides with a long strip cut off the tops) about 2/3rds full with soil. If using metal pans, cut a dime-sized drainage hole in the bottom center edge of the pan. Create the following land types:
A. Bare soil - lightly pat down the soil. Add nothing. All done! B. Groundcover – Lightly pat down the soil and add a 1-2 inch layer of dead leaves, sticks, and/or mulch to the
surface. C. Growing Plants – sprinkle about 1 teaspoon of grass seed on top of the bare soil and lightly pat down. Water
lightly every other day. Seeds should germinate in 3-4 days and grass should be several inches tall in 1-2 weeks. (Check your grass seed packet for details).
If using metal pans, position plastic cups below the drainage holes in the bottom center edge of each pan. For 2L bottles, use string or wire to attach a small plastic cup to the open mouth of each bottle:
2. Make it Rain! Once the grass is 1 or more inches high, it’s time to make it rain. Review students’ predictions about what will happen when it rains on different types of land cover. Have students write down their predictions to the following questions for each of the 3 model landscapes in their science notebooks:
1. Where will the rain go? 2. How will it move? 3. How clean or dirty will the water be that funs off this land?
Assign the following student volunteer roles for each model: 1. Rainmaker 2. Collector 3. Timer. For Model A (bare soil), ask the Rainmaker to fill a watering can with 2-3 cups of water. Before it rains, the Collector should position themselves below the drainage hole with several empty cups to catch any runoff. The Timer begins timing when the Rainmaker starts to pour the rain water slowly, gently and evenly over the model. The Timer stops the clock when the runoff stops flowing.
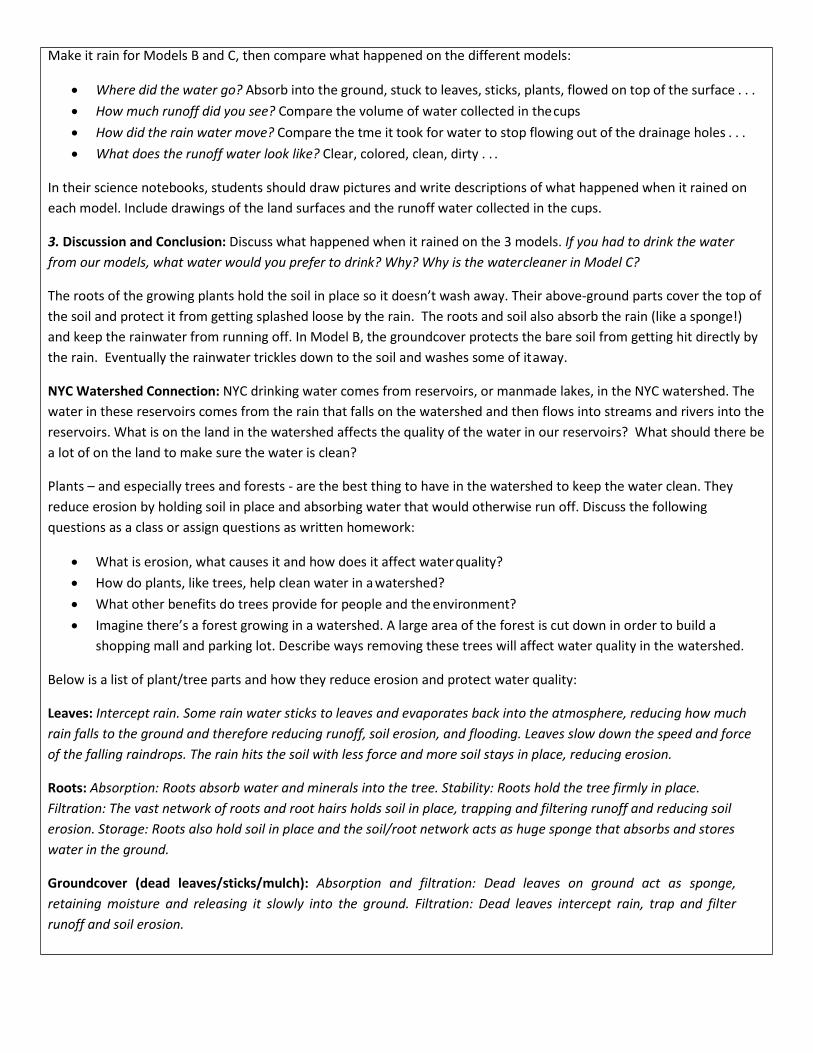
Make it rain for Models B and C, then compare what happened on the different models:
• Where did the water go? Absorb into the ground, stuck to leaves, sticks, plants, flowed on top of the surface . . . • How much runoff did you see? Compare the volume of water collected in the cups • How did the rain water move? Compare the tme it took for water to stop flowing out of the drainage holes . . . • What does the runoff water look like? Clear, colored, clean, dirty . . .
In their science notebooks, students should draw pictures and write descriptions of what happened when it rained on each model. Include drawings of the land surfaces and the runoff water collected in the cups.
3. Discussion and Conclusion: Discuss what happened when it rained on the 3 models. If you had to drink the water from our models, what water would you prefer to drink? Why? Why is the water cleaner in Model C?
The roots of the growing plants hold the soil in place so it doesn’t wash away. Their above-ground parts cover the top of the soil and protect it from getting splashed loose by the rain. The roots and soil also absorb the rain (like a sponge!) and keep the rainwater from running off. In Model B, the groundcover protects the bare soil from getting hit directly by the rain. Eventually the rainwater trickles down to the soil and washes some of it away.
NYC Watershed Connection: NYC drinking water comes from reservoirs, or manmade lakes, in the NYC watershed. The water in these reservoirs comes from the rain that falls on the watershed and then flows into streams and rivers into the reservoirs. What is on the land in the watershed affects the quality of the water in our reservoirs? What should there be a lot of on the land to make sure the water is clean?
Plants – and especially trees and forests - are the best thing to have in the watershed to keep the water clean. They reduce erosion by holding soil in place and absorbing water that would otherwise run off. Discuss the following questions as a class or assign questions as written homework:
• What is erosion, what causes it and how does it affect water quality? • How do plants, like trees, help clean water in a watershed? • What other benefits do trees provide for people and the environment? • Imagine there’s a forest growing in a watershed. A large area of the forest is cut down in order to build a
shopping mall and parking lot. Describe ways removing these trees will affect water quality in the watershed.
Below is a list of plant/tree parts and how they reduce erosion and protect water quality:
Leaves: Intercept rain. Some rain water sticks to leaves and evaporates back into the atmosphere, reducing how much rain falls to the ground and therefore reducing runoff, soil erosion, and flooding. Leaves slow down the speed and force of the falling raindrops. The rain hits the soil with less force and more soil stays in place, reducing erosion.
Roots: Absorption: Roots absorb water and minerals into the tree. Stability: Roots hold the tree firmly in place. Filtration: The vast network of roots and root hairs holds soil in place, trapping and filtering runoff and reducing soil erosion. Storage: Roots also hold soil in place and the soil/root network acts as huge sponge that absorbs and stores water in the ground.
Groundcover (dead leaves/sticks/mulch): Absorption and filtration: Dead leaves on ground act as sponge, retaining moisture and releasing it slowly into the ground. Filtration: Dead leaves intercept rain, trap and filter runoff and soil erosion.
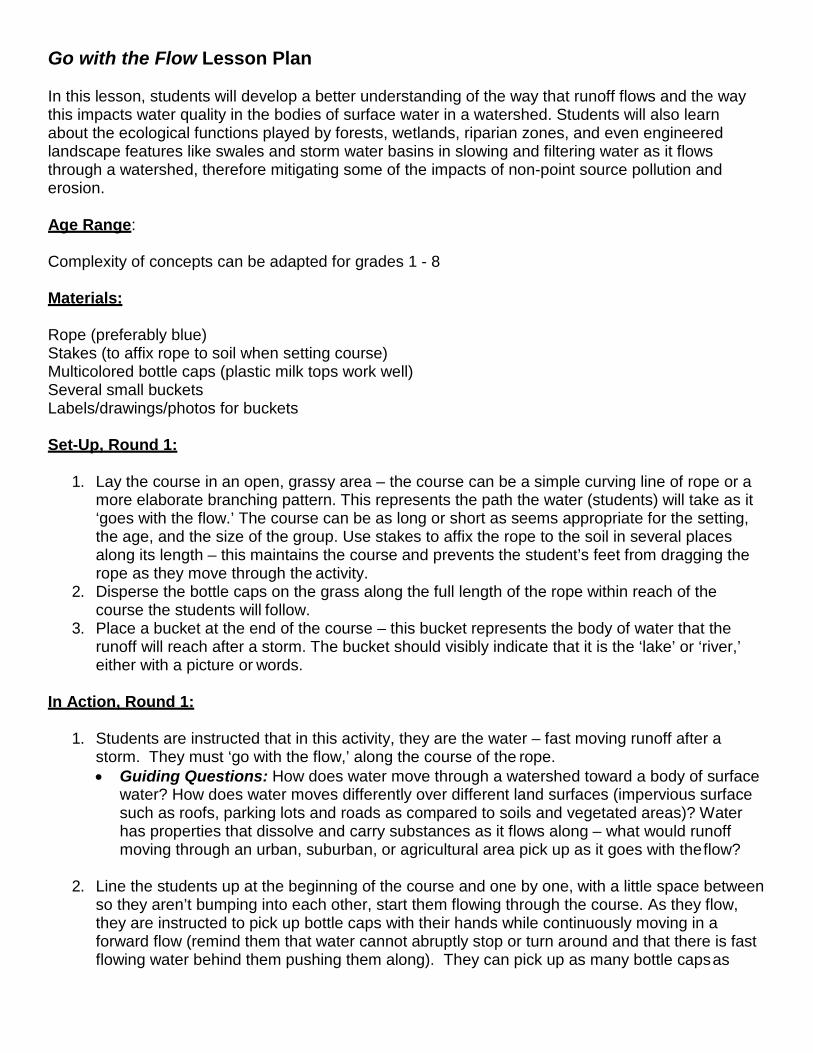
Go with the Flow Lesson Plan
In this lesson, students will develop a better understanding of the way that runoff flows and the way this impacts water quality in the bodies of surface water in a watershed. Students will also learn about the ecological functions played by forests, wetlands, riparian zones, and even engineered landscape features like swales and storm water basins in slowing and filtering water as it flows through a watershed, therefore mitigating some of the impacts of non-point source pollution and erosion.
Age Range:
Complexity of concepts can be adapted for grades 1 - 8
Materials:
Rope (preferably blue) Stakes (to affix rope to soil when setting course) Multicolored bottle caps (plastic milk tops work well) Several small buckets Labels/drawings/photos for buckets
Set-Up, Round 1:
1. Lay the course in an open, grassy area – the course can be a simple curving line of rope or amore elaborate branching pattern. This represents the path the water (students) will take as it‘goes with the flow.’ The course can be as long or short as seems appropriate for the setting,the age, and the size of the group. Use stakes to affix the rope to the soil in several placesalong its length – this maintains the course and prevents the student’s feet from dragging therope as they move through the activity.
2. Disperse the bottle caps on the grass along the full length of the rope within reach of thecourse the students will follow.
3. Place a bucket at the end of the course – this bucket represents the body of water that therunoff will reach after a storm. The bucket should visibly indicate that it is the ‘lake’ or ‘river,’either with a picture or words.
In Action, Round 1:
1. Students are instructed that in this activity, they are the water – fast moving runoff after astorm. They must ‘go with the flow,’ along the course of the rope.• Guiding Questions: How does water move through a watershed toward a body of surface
water? How does water moves differently over different land surfaces (impervious surfacesuch as roofs, parking lots and roads as compared to soils and vegetated areas)? Waterhas properties that dissolve and carry substances as it flows along – what would runoffmoving through an urban, suburban, or agricultural area pick up as it goes with the flow?
2. Line the students up at the beginning of the course and one by one, with a little space betweenso they aren’t bumping into each other, start them flowing through the course. As they flow,they are instructed to pick up bottle caps with their hands while continuously moving in aforward flow (remind them that water cannot abruptly stop or turn around and that there is fastflowing water behind them pushing them along). They can pick up as many bottle caps as

their hands can hold, but they will likely be dropping some along the way and they must leave them behind to continue flowing.
3. When they reach the endpoint (bucket representing water body) they deposit all their bottle
caps inside.
4. When the last of the water from the storm has completed the course, gather to examine the body of water, which is now filled with bottle caps. • Guiding Questions: What do the bottle caps represent? What type of pollution is likely to
be moved by storm water? What is non-point source pollution and why is it such a concern for water quality? Can the bottle caps represent anything that may not be easily detectable in the water simply by looking at it? Where is water typically channeled off of impervious surfaces like roads and parking lots in towns and cities? What impact dos this make on water quality?
Set-Up, Round 2 – same as above, in addition:
1. Along the length of the rope course, place buckets at even intervals within reach of the path the students will flow along. These buckets represent feature that slow and filter water as it moves through a watershed: forests, wetlands, riparian buffers, etc - these buckets should also be labeled in some way to indicate their function.
In Action, Round 2:
1. After re-dispersing the bottle caps along the course in the same manner as in round one and adding the additional buckets at intervals along the course, line the students up to flow through a second time. Explain that this time, the water will not flow quickly and directly into the body of water, but will pass through other features as it goes with the flow through the watershed. These features act as buffers and filters for storm water, so as they pass each bucket, they must deposit whatever they are carrying before continuing along the course. If anything remains in their hands when they reach the body of water at the end, they can deposit it there.
2. When the last of the water from the storm has completed its course, again gather the students
to examine the contents on the buckets – this time comparing how the body of water at the end of the course looks after the storm (it will contain only a small number of bottle caps). • Guiding Questions: What role did the features (forest, wetland, riparian area, etc) play in
improving surface water quality? How can larger ‘visible’ pollutants, like litter, as well as smaller ‘invisible’ pollutants, like nutrients, bacteria, or chemicals be prevented from entering surface water? Can eroded soil affect water quality, and how do forests/wetland/riparian areas help to control this? Which areas are most sensitive to this type of non-point source pollution?
Lesson adapted by Sarah Archbald, Environmental Education Consultant

“Thirsty Tree Anatomy” Lesson Plan
Tyler Van Fleet, Watershed Educator, Watershed Agricultural Council Date: 2/16/16
Topic: Watershed Forestry – How Trees Function in a Watershed: • Different parts of trees interact with water in different ways• Trees function to maintain clean water in a watershed
Objective: Students will be able to identify at least 3 different parts of a tree and describe how these tree parts interact with water. Students will be able to explain how trees help maintain water quality in a watershed.
Materials: Science notebooks, pencil, an outdoor space with multiple trees and/or shrubs growing (or pictures of several trees and shrubs hung up on classroom walls)
Motivation: Students will select a favorite tree and spend time drawing and labeling familiar parts of their tree. They will connect the function of the different parts of their tree to their prior knowledge of the water cycle and understand how important trees are for keep their own drinking water clean.
Introduction (indoors):
1. Review Key Terms: As a class, review the definition of a watershed:
• A watershed is an area of land that drains (or sheds) all of its surface and ground water into a common body ofwater, like a river, lake, or reservoir.
Review the basic parts of the water cycle:
• Water is constantly moving through the environment in a cycle. Water circulates between the earth's oceans,atmosphere, and land. Water falls from the atmosphere as rain and snow, drains through the land asgroundwater and in streams and rivers, and returns to the atmosphere by evaporation and transpiration.
2. Brainstorm Tree Anatomy: Trees grow in watersheds. Throughout the water cycle, water interacts with trees indifferent ways and the trees help clean the water. Ask students to turn to a partner and work together for 45 seconds to write down as many different parts of a tree as they can.
After 45 seconds, ask students to raise their hands and keep them raised if they came up with 3 parts, 5 parts, 8 parts, etc. Do this until just one group is still raising their hands. Ask the group that came up with most tree parts to list them all for the class.
3. Tree Parts and the Water Cycle: Let’s imagine one tree. It is growing in a watershed and the water cycle is happeningall around it. Ask students to raise their hands to describe some ways our tree will interact with water?
• Rain falls on tree leaves• Tree roots suck up water from the soil• Water evaporates out of a tree through transpiration• Groundwater flows through the soil and tree roots
Now you’re going to spend some time observing one special tree to discover even more ways that trees keep water clean in a watershed.
Main Activity (Preferably outdoors):
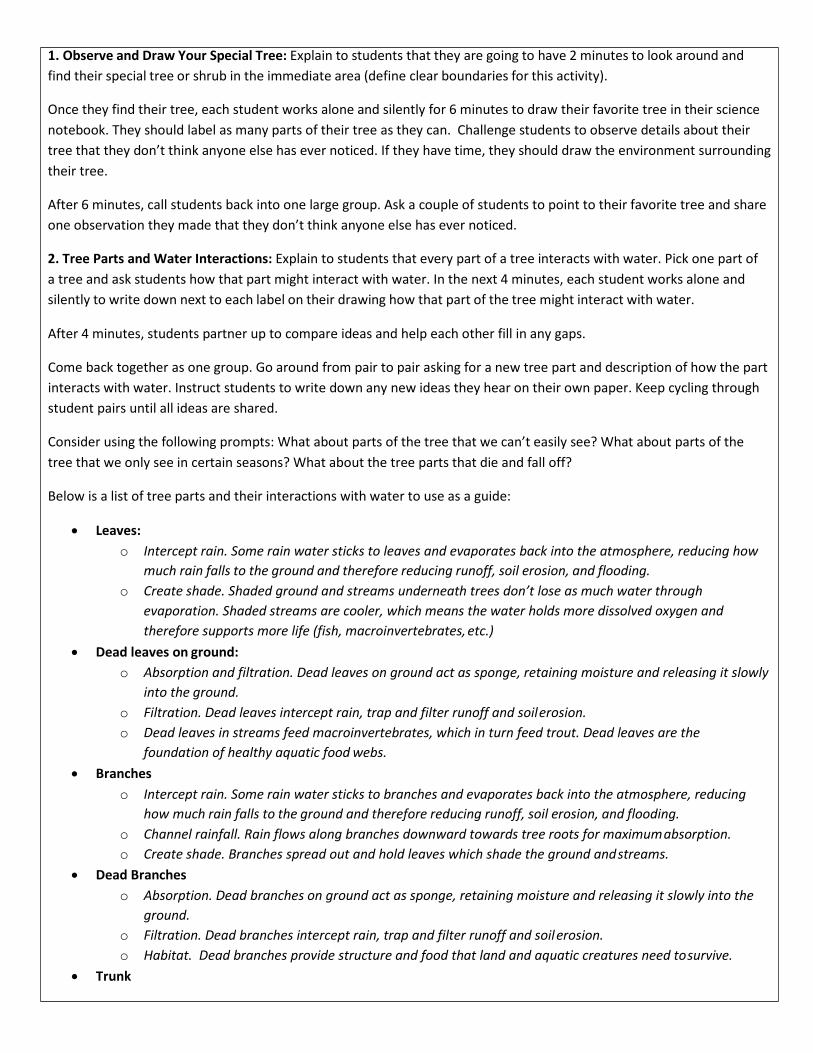
1. Observe and Draw Your Special Tree: Explain to students that they are going to have 2 minutes to look around andfind their special tree or shrub in the immediate area (define clear boundaries for this activity).
Once they find their tree, each student works alone and silently for 6 minutes to draw their favorite tree in their science notebook. They should label as many parts of their tree as they can. Challenge students to observe details about their tree that they don’t think anyone else has ever noticed. If they have time, they should draw the environment surrounding their tree.
After 6 minutes, call students back into one large group. Ask a couple of students to point to their favorite tree and share one observation they made that they don’t think anyone else has ever noticed.
2. Tree Parts and Water Interactions: Explain to students that every part of a tree interacts with water. Pick one part ofa tree and ask students how that part might interact with water. In the next 4 minutes, each student works alone and silently to write down next to each label on their drawing how that part of the tree might interact with water.
After 4 minutes, students partner up to compare ideas and help each other fill in any gaps.
Come back together as one group. Go around from pair to pair asking for a new tree part and description of how the part interacts with water. Instruct students to write down any new ideas they hear on their own paper. Keep cycling through student pairs until all ideas are shared.
Consider using the following prompts: What about parts of the tree that we can’t easily see? What about parts of the tree that we only see in certain seasons? What about the tree parts that die and fall off?
Below is a list of tree parts and their interactions with water to use as a guide:
• Leaves:o Intercept rain. Some rain water sticks to leaves and evaporates back into the atmosphere, reducing how
much rain falls to the ground and therefore reducing runoff, soil erosion, and flooding.o Create shade. Shaded ground and streams underneath trees don’t lose as much water through
evaporation. Shaded streams are cooler, which means the water holds more dissolved oxygen andtherefore supports more life (fish, macroinvertebrates, etc.)
• Dead leaves on ground:o Absorption and filtration. Dead leaves on ground act as sponge, retaining moisture and releasing it slowly
into the ground.o Filtration. Dead leaves intercept rain, trap and filter runoff and soil erosion.o Dead leaves in streams feed macroinvertebrates, which in turn feed trout. Dead leaves are the
foundation of healthy aquatic food webs.• Branches
o Intercept rain. Some rain water sticks to branches and evaporates back into the atmosphere, reducinghow much rain falls to the ground and therefore reducing runoff, soil erosion, and flooding.
o Channel rainfall. Rain flows along branches downward towards tree roots for maximum absorption.o Create shade. Branches spread out and hold leaves which shade the ground and streams.
• Dead Brancheso Absorption. Dead branches on ground act as sponge, retaining moisture and releasing it slowly into the
ground.o Filtration. Dead branches intercept rain, trap and filter runoff and soil erosion.o Habitat. Dead branches provide structure and food that land and aquatic creatures need to survive.
• Trunk

o Transport. Water and minerals move up from the ground into the leaves to be used in photosynthesis.Sugars produced by photosynthesis move from the leaves to all other parts of the tree.
o Storage. The trunk stores water for the tree to use.• Bark
o Protection. Bark protects the insides of the tree from drying out and become diseased.• Roots
o Absorption. Roots absorb water and minerals into the tree.o Stability. Roots hold the tree firmly in place.o Filtration. The vast network of roots and root hairs holds soil in place, trapping and filtering runoff and
soil erosion.o Storage. Roots also hold soil in place and the soil/root network acts as huge sponge that absorbs and
stores water in the ground.• Nuts, Seeds
o Uses absorbed water to grow, will produce the next generation of trees that will help clean the water.• Buds, Flowers
o Uses absorbed water to grow and develop into leaves and flowers.• Lichen
o Different organism living on tree bark. Lichen catches and absorbs water to use for growth.
3. Conclusions and Discussion: Each part of a tree interacts with water in important ways. Take all of a tree’s partstogether and it’s clear that a tree helps clean the water. Look at many trees all together (forests!) and we can understand how critical forests are for water quality in a watershed.
Our drinking water comes reservoirs, or manmade lakes, that are filled with rain, streams, and groundwater flowing into them from the surrounding watershed lands. Do you think it’s important to have forests growing in our watersheds? Why?
Discuss the following questions as a class or assign questions as written homework:
• How are a tree and the water cycle related?• List 3 tree parts and describe how they interact with water.• Do you think trees are important for having good water quality?• What other benefits do trees provide for people and the environment?• How do trees affect water quality in a watershed?• Imagine there’s a forest growing in a watershed. A large area of the forest is cut down in order to build a
shopping mall and parking lot. Describe 3 effects that this removal of trees will have on water quality in thewatershed.

WATER USAGE MATCHING CARDS. They are currently correctly matched. Cut apart for students.
Gallons used per minute in a shower with a non-water-
saving showerhead 5.5 gallons
Gallons used to take a bath with the tub full 36 gallons
Gallons used per flush by an old toilet 5 gallons
Gallons used per flush by a low-flow toilet 1.6 gallons
Gallons wasted per minute by running the bathroom tap 2 gallons
Gallons used per day by the average US family 400 gallons
Gallons used per day by the average New York City
resident 80 gallons

Water Use Calculation
Use this sheet to record how much water you use in one week. Then, answer the questions on the other side of this paper with information you have collected here. Note that all measurements are approximate. Make a checkmark everytime you do each activity.
SUN MON TUES WED THURS FRI SAT Weekly Total
How many showers did you take? ________ How long are your showers? ________ How many baths? ________
A non-water- saving showerhead uses 5 gallons per minute. Water conserving showerheads use 2 gallons per minute. A full tub uses 36 gallons.
SUN MON TUES WED THURS FRI SAT Weekly Total
How many times did you flush the toilet? ________
Most toilets use 5 gallons a flush. Water-saving, high efficiency, toilets use 1.28 gallons per flush.
SUN MON TUES WED THURS FRI SAT Weekly Total
How many times did you brush your teeth? ________
Brushing your teeth with the water running uses about 4 gallons. Turning the water off when you’re not rinsing uses less
than a quarter or .25 gallons.
SUN MON TUES WED THURS FRI SAT Weekly Total
How many times did you wash your hands or face? ________
Washing your hands or face with the water running uses about 4 gallons. Turning the water off saves 3 gallons, using
only 1 gallon each time you wash up.
SUN MON TUES WED THURS FRI SAT Weekly Total
How many times did you do the dishes? ________
Washing dishes with the water running uses about 15 gallons in 5 minutes. Filling the sink/ washing dishes without
water running uses only 5 gallons.

Use the information from your weekly water use report card on the other side to figure out how much water you useon an average day.
Add your average daily totals to find out approximately how much water you use every day at home.
Is your average daily total more or less than the New York City average of 75 gallons a day? ____________
Is it more or less than the Canadian average of 50-60 gallons a day? ____________
What are some ways to reduce your water consumption? ________________________________________________________________________________________________________________________________________________________________________________________________________________________________________________________________________________________________________________________________________________________________________________________________________
Multiply the number of showers you took ________ by the number of minutes
per shower________ by the amount of water your showerhead uses per
minute ________ (5 or 2 gallons) = ________ gallons.
Multiply the number of baths you took ________ by 36 gallons = ________
gallons. Add your shower and bath totals = ________ gallons.
Divide by 7 and put your answer in the box to the right.
Multiply the number of times you flushed the toilet ________ by the amount
of water your toilet uses with each flush ________ (5 or 1.28 gallons)
= ________ gallons.
Divide by 7 and put your answer in the box to the right.
Multiply the number of times you brushed your teeth ________ by the
amount of water you used with each brushing ________ (4 or .25 gallons)
= ________ gallons.
Divide by 7 and put your answer in the box to the right.
Multiply the number of times you washed your hands or face ________ by the
amount of water you used with each washing ________ (4 or 1 gallons)
= ________ gallons.
Divide by 7 and put your answer in the box to the right.
Multiply the number of times you did the dishes ________ by the amount of
water you used ________ (15 or 5 gallons) = ________ gallons.
Divide by 7 and put your answer in the box to the right.
Average daily bath/shower
water use:
gallons
gallons
gallons
Total Average daily
water use:
gallons
gallons
Average daily toilet water
use:
gallons
Average daily teeth-
brushing water use:
gallons
Average daily hand/face
washing water use:
gallons
Average daily dishwashing
water use:
gallons

My Typical Day Water Use CalculatorActivity: Record and calculate how much water you use approximately, in one day.
How many times do you usually flush the toilet in a day?
How much water does your toilet use for each flush?
Flushing the toiletMany toilets use 5 gallons each flush. Water-saving, high efficiency toilets use 1.28 gallons each flush.
Total gallons
Brushing your teethBrushing your teeth with the water running uses about 4 gallons. Turning the water off when you're not rinsing uses less than a quarter or .25 gallons. How many times do you usually brush your teeth in a day?
How much water do you use each time you brush your teeth?
Total gallons
How many times do you wash your hands in a day?
How much water do you use each time you wash your hands?
Washing your handsWashing your hands or face with the water running uses about 4 gallons. Turning the water off saves 3 gallons, using only 1 gallon each time you wash up.
Total gallons
How many minutes do you usually spend washing dishes in a day?
How much water do you use each time you wash dishes?
Washing dishesWashing dishes with the water running uses about 4 gallons a minute. Filling the sink or washing dishes without water running uses only 5 gallons.
Total gallons
How many minutes do you usually spend in the shower?
How much water does your showerhead use each minute?
Taking a showerA non-water-saving showerhead uses 5 gallons a minute. Water conserving showerheads use 2 gallons each minute.
Total gallons
Approximate total daily water useAdd up each section to calculate your total water usage for a typical day.
Total gallons
=
=
=
=
=
X
X
X
X
X
+
gallons
gallons
gallons
gallons
gallons
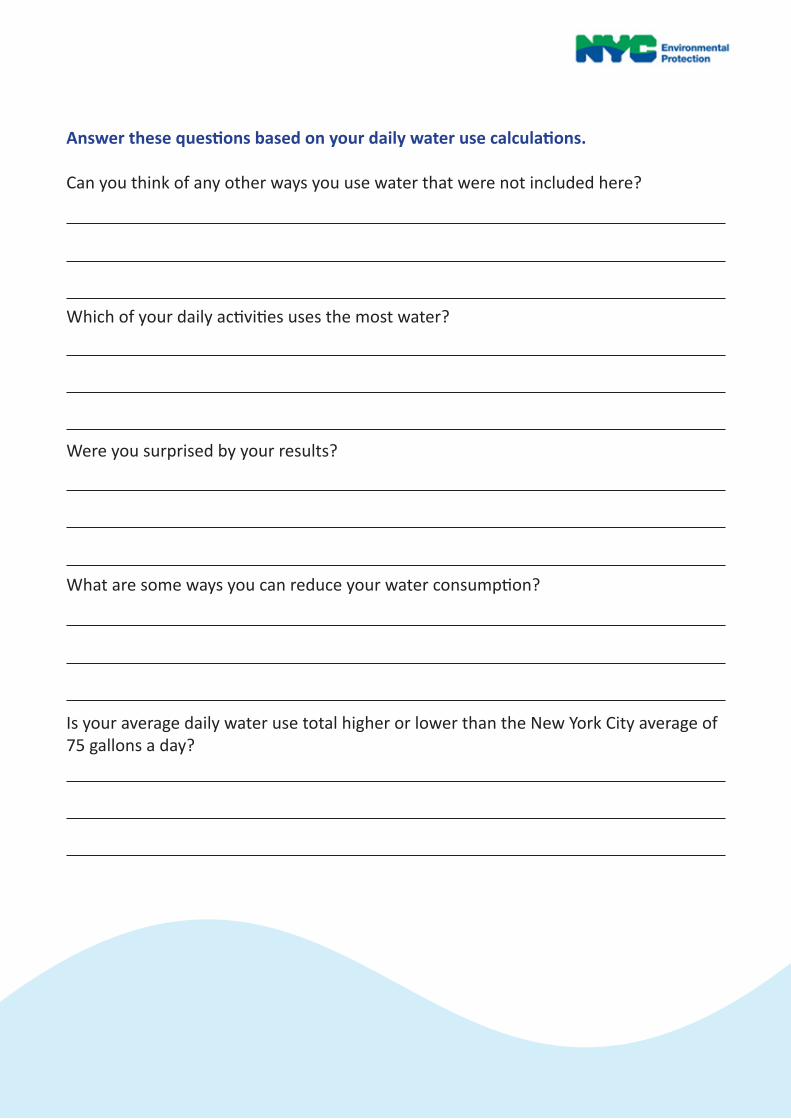
Answer these questions based on your daily water use calculations.
Can you think of any other ways you use water that were not included here?
Which of your daily activities uses the most water?
Were you surprised by your results?
What are some ways you can reduce your water consumption?
Is your average daily water use total higher or lower than the New York City average of 75 gallons a day?