
*WA TER 2010
142
COLUMBUS WATER STUDY FOR *WA TER 2010 2041484 City of Columbus, Nebraska WELLS ENGINEERS ENVIRONMENTAL, INC. h Association WHh BRUCE GJLMORE AND ASSOCIATES, INC. JACOBSON HELGOTH CONSULTANTS 8 fV) oo -•V £. T
Transcript of *WA TER 2010

COLUMBUS WATER STUDY
FOR
*WA TER 20102041484
City of Columbus, Nebraska
WELLS ENGINEERS ENVIRONMENTAL, INC.
h Association WHhBRUCE GJLMORE AND ASSOCIATES, INC.
JACOBSON HELGOTH CONSULTANTS
8fV)oo
-•V
£. T

WELLS ENGINEERS ENVIRONMENTAL, INC
11237 CHICAGO CIRCLEOMAHA, NEBRASKA 68154-2634(402) 330-0203
May 20, 1991 Re: Columbus Water StudyWEE No. 900494
Merlin E. Lindahl, P.ECity EngineerCity of Columbus2424 14th St.Columbus, NE 68601-5028
Dear Mr. Lindahl:
In accordance with our engineering agreement dated May 7, 1990, weare herewith submitting thirty copies of our report entitled"Columbus Water Study" which outlines an improvement plan for yourwaterworks system.
The conclusions and recommendations of our study are summarized inthe Executive Summary which follows this letter. Detailedinformation is presented in the body of the report. We haveenjoyed making this study for you and want to thank you and theCity for your assistance and cooperation during the course of ourstudy.
Respectfully submitted,
WELLS ENGINEERS ENVIRONMENTAL, INC
Robert D Catton, P.E Ronald J Sova, P EVice President Project Engineer
RJS:rbEnclosures
RS05201L
»-» 3-
Si01 -*•

COLUMBUS WATER STUDYCOLUMBUS, NEBRASKA
PREPARED BY
WELLS ENGINEERS ENVIRONMENTAL, INC11237 CHICAGO CIRCLEOMAHA, NE 68154402/330-0202
COMMISSION NO 900494
IN ASSOCIATION WITH
BRUCE GILMORE AND ASSOCIATES, INCAND
JACOBSON HELGOTH CONSULTANTS %•-»O
APRIL 8, 1991 £to

EXECUTIVE SUMMARY
The purposes of this engineering study and report are to 1) analyze the existing watersystem, 2) review historical population and water use records and make future projections,3) identify and evaluate sources of supply and treatment alternatives and 4) recommendimprovements necessary to meet the twenty-year requirements of the City of Columbus,Nebraska in compliance with the Safe Drinking Water Act
The existing source of supply, storage reservoirs and water quality for the City of Columbuswere analyzed The existing supply of water for the City is obtained from eight wells witha pumping capacity of approximately 12 million gallons per day (mgd) The City currentlyhas approximately 5 million gallons of water storage available in elevated and ground-levelreservoirs Water quality analysis data of water within the existing distribution systemindicates the water is hard and exhibits concentrations of iron and manganese of 1 0 mg/1and 0 6 mg/1, respectively These concentrations exceed levels, established by the UnitedStates Environmental Protection Agency, above which the aesthetic quality of drinking watermay be adversely affected
The volatile organic chemical, tnchloroethylene (TCE) has been detected in the City's wellslocated m the Downtown area The TCE contamination in the wells has resulted in the Citybeing in violation of Federal Drinking Water Standards The City currently is operatingunder an exemption from the Federal regulation for TCE It is anticipated this exemption,obtained from the Nebraska Department of Health, will expire in June, 1993 Treatmentfor the removal of TCE from the drinking water has been determined to be more costlythan developing a new uncontammated source of supply
The City of Columbus has a population of 19,480 people with a projected year 2010population of 26,000 people The 1990 average day and maximum day water demands were
^ .4 7 mgd and 10 7 mgd, respectively The projected 2010 average day and maximum day %l-»
water demands are 7 5 mgd and 20 mgd, respectively °ooco

Two water system plans to bring the City in compliance with the Safe Drinking Water Actand to meet increasing water demands were evaluated The first plan is based upon thedevelopment of a well field north of Columbus in the vicinity of Lake Babcock The secondplan is based on the development of a well field south of Columbus near the Loup River
Based on available water quality analysis data, the aquifer north of Columbus has acombined iron and manganese concentration of approximately 0 3 mg/1 which is significantlybelow the existing distribution system's concentrations The quality of water in the aquiferappears sufficient to meet the Safe Drinking Water Act with treatment of only disinfectionWater samples must be taken during aquifer testing to confirm the quality of this aquiferBased on available water quality analysis data, the aquifer south of Columbus has iron andmanganese concentrations of 0 7 mg/1 and 0 5 mg/1, respectively Treatment for iron andmanganese removal from the water obtained from this aquifer is recommended
Both water system plans include the development of Wellhead Protection programs intendedto prevent groundwater pollution from entering the water supply The programs mayincorporate zoning and ordinances, agricultural best management practices and groundwatermonitoring plans
The water system plans include water distribution system and storage reservoir
improvements based on computer modelling and analysis of the existing system Thedistribution system projects are intended to increase the delivery capabilities from the newsource of supply and maintain adequate system pressures during peak demand conditions
The recommendation of this report is to proceed with the water system plan establishing asource of supply from the north The plan includes the immediate actions of aquifer testing,well field construction including disinfection, distribution improvements and phasing outsome of the existing TCE contaminated wells in order to meet Federal Drinking WaterStandards prior to the expiration of the TCE regulation exemption Aquifer testing isnecessary to confirm that adequate recharge from Lake Babcock and the Loup River is >
77available in the area for long-term planning The first five years of the recommended plan, QQ
f\j -*00 »<*> »oo -*•
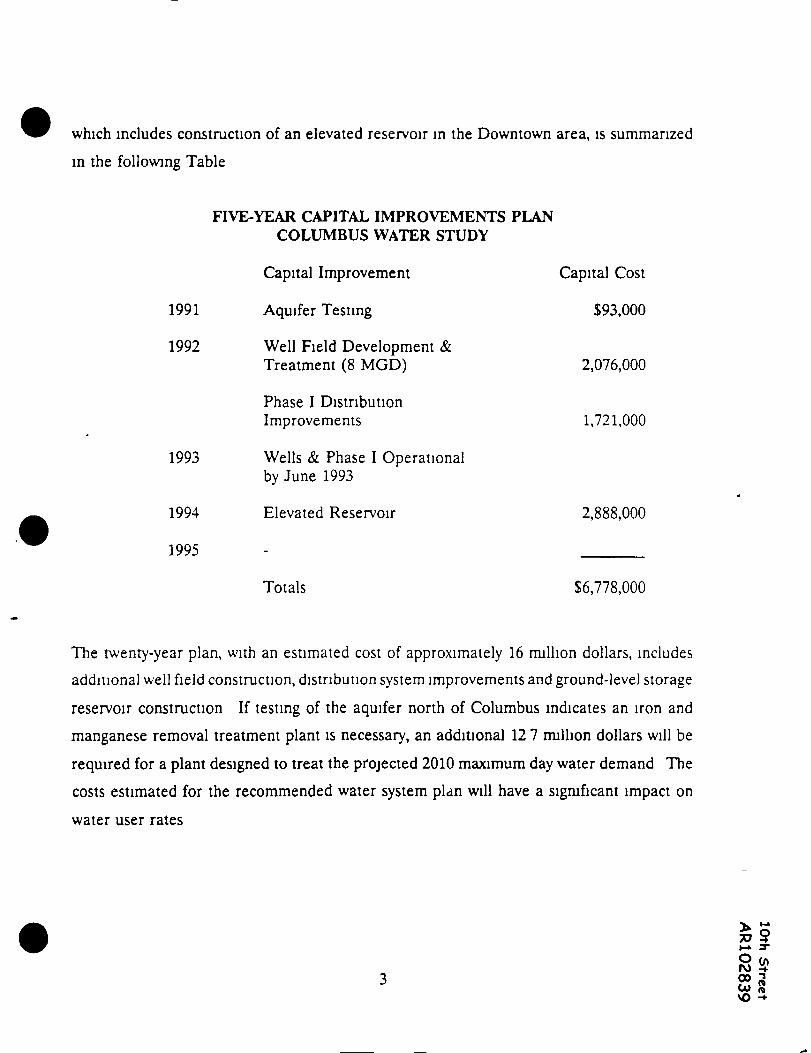
which includes construction of an elevated reservoir in the Downtown area, is summarizedin the following Table
FIVE-YEAR CAPITAL IMPROVEMENTS PLANCOLUMBUS WATER STUDY
Capital Improvement Capital Cost
1991 Aquifer Testing $93,000
1992 Well Field Development &Treatment (8 MOD) 2,076,000
Phase I DistributionImprovements 1,721,000
1993 Wells & Phase I Operationalby June 1993
1994 Elevated Reservoir 2,888,000
1995 - _____
Totals $6,778,000
The twenty-year plan, with an estimated cost of approximately 16 million dollars, includesadditional well field construction, distribution system improvements and ground-level storage
reservoir construction If testing of the aquifer north of Columbus indicates an iron andmanganese removal treatment plant is necessary, an additional 12 7 million dollars will berequired for a plant designed to treat the projected 2010 maximum day water demand Thecosts estimated for the recommended water system plan will have a significant impact onwater user rates
00 nU> raVO •+

TABLE OF CONTENTSCOLUMBUS WATER STUDY
PAGFSECTION I - INTRODUCTION
PURPOSE 1-1SCOPE 1-1
SECTION II - POPULATION AND WATER USAGE PROJECTIONSINTRODUCTION II-lHISTORICAL POPULATION RECORD II-lPOPULATION PROJECTIONS II 2HISTORICAL WATER USAGE II-4ESTIMATED FUTURE DEMAND REQUIREMENTS II 10
SECTION III - EXISTING WATER SUPPLY AND QUALITY GOALSINTRODUCTION III-lEXISTING WELL SUPPLY III-lEXISTING WATER QUALITY III-3COLUMBUS WATER QUALITY GOALS III 9
SECTION IV - SUPPLY CONSIDERATIONSINTRODUCTION IV 1FUTURE PUMPAGE REQUIREMENTS IV-1WELL FIELD ALTERNATIVES IV-4
EXISTING DOWNTOWN WELL FIELD IV 8NORTH ALTERNATIVE SITE IV 12SOUTH ALTERNATIVE SITE IV-13
WELL HELD COSTS IV-15
SECTION V - WELLHEAD PROTECTION PROGRAMINTRODUCTION V 1WELLHEAD PROTECTION ACTIVITIES V 1COLUMBUS WELLHEAD PROTECTION ALTERNATIVES V 3
NORTH ALTERNATIVE SITE V 6SOUTH ALTERNATIVE SITE V 7
WHP DEVELOPMENT COST PROJECTIONS V 8
SECTION VI WATER TREATMENTINTRODUCTION Vl-1TREATMENT PLANT SIZE VI 1TREATMENT ALTERNATIVES AND SOLIDS HANDLING Vl-1
ALTERNATIVE I - HARDNESS REDUCTION VI-2ALTERNATIVE II - IRON AND MANGANESE REDUCTION VI-7ALTERNATIVE III - DISINFECTION VI 10
TREATMENT ALTERNATIVES AND SOLIDS HANDLING COSTS Vl-11

SECTION VII - DISTRIBUTION SYSTEM AND WATER STORAGEINTRODUCTION VIMMUNICIPAL FIRE PROTECTION REQUIREMENTS VII 1
REQUIRED FIRE FLOWS VII 1WATER SUPPLY CAPACITY VII 3DISTRIBUTION SYSTEM VIM
EVALUATION OF EXISTING DISTRIBUTION SYSTEM VI1-5COMPUTER MODELING AND CALIBRATION VII-7COMPUTER SIMULATION OF EXISTING SYSTEM VII 8COMPUTER SIMULATION OF EXISTING STORAGE AND SUPPLY VII-11
FUTURE DISTRIBUTION AND STORAGE NEEDS VII 12DISTRIBUTION SYSTEM VII-12WATER STORAGE VII 15
PROPOSED IMPROVEMENTS - DISTRIBUTION VII 17PHASE I (1991-1995) VII 18PHASE II (1995-2000) VII-21PHASE III (2001 2005) VII 23PHASE IV (2006 2010) VII 26
PROPOSED IMPROVEMENTS - WATER STORAGE VII-27DISTRIBUTION AND WATER STORAGE COSTS VII 27
SECTION VIII - SUPPLY, TREATMENT AND DISTRIBUTION ALTERNATIVESINTRODUCTION VI11 1NORTH SITE WATER SYSTEM VIII 1SOUTH SITE WATER SYSTEM VIII 2HARDNESS REDUCTION VIII 5DUAL DISTRIBUTION SYSTEM VIII 7
SECTION IX - RECOMMENDATIONSINTRODUCTION IX 1WELL HELD DEVELOPMENT IX-1
AQUIFER TESTING IX 2NORTH WELL HELD DEVELOPMENT IX 2
DISTRIBUTION SYSTEM AND WATER STORAGE IX 3DISTRIBUTION SYSTEM IX 3WATER STORAGE IX 5
RECOMMENDED ALTERNATIVE COSTS IX 5
SECTION X - FINANCING OF PROPOSED WATER SYSTEM IMPROVEMENTSINTRODUCTION X-lFINANCIAL X 1
WATER RATES X 1EXISTING AND ESTIMATED FUTURE REVENUE X-lFUTURE EXPENDITURES AND FINANCING REQUIREMENTS X-2
APPENDIX A - WATER QUALITY REGULATIONS AND GOALSAPPENDIX B (SEPARATE VOLUME) - GEOLOGICAL INFORMATIONAPPENDIX C (SEPARATE VOLUME) - COMPUTER MODEL AND SIMULATIONS
Oroto
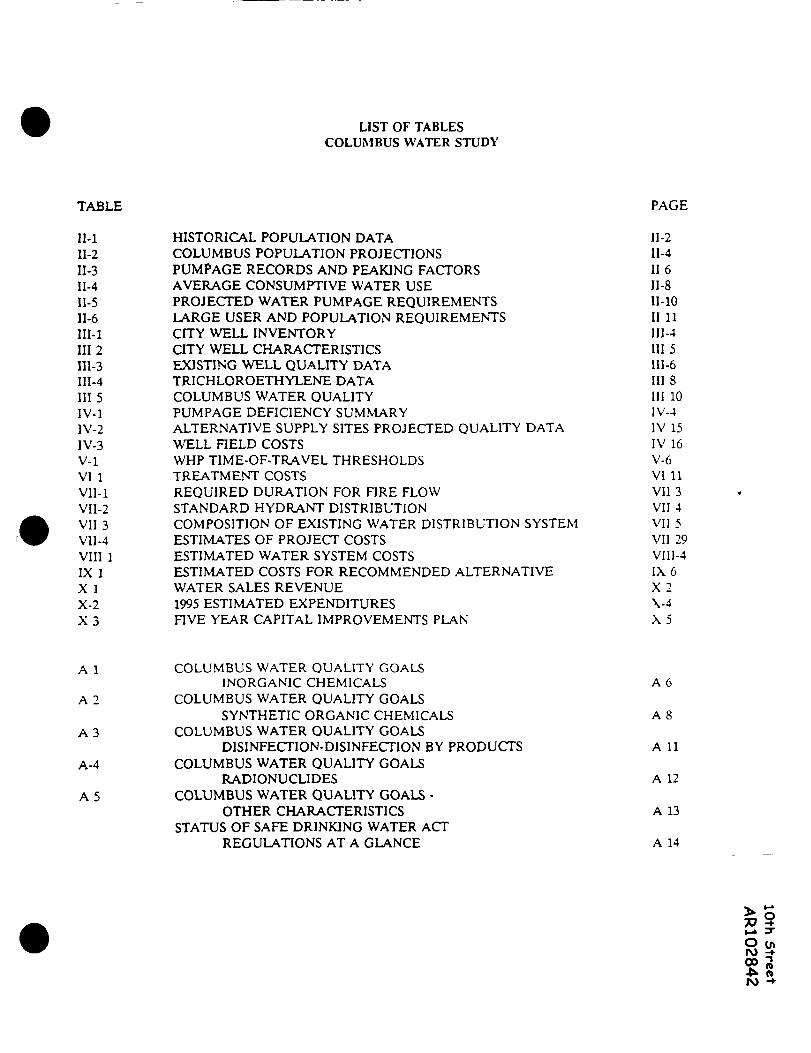
LIST OF TABLESCOLUMBUS WATER STUDY
TABLE PAGE
II-l HISTORICAL POPULATION DATA II-2II-2 COLUMBUS POPULATION PROJECTIONS II-4II-3 PUMPAGE RECORDS AND PEAKING FACTORS II 6II-4 AVERAGE CONSUMPTIVE WATER USE II-811-5 PROJECTED WATER PUMPAGE REQUIREMENTS 11-10II-6 LARGE USER AND POPULATION REQUIREMENTS II 11III-l CITY WELL INVENTORY HI-4III 2 CITY WELL CHARACTERISTICS III 5HI-3 EXISTING WELL QUALITY DATA HI-6HI-4 TRICHLOROETHYLENE DATA III 8III 5 COLUMBUS WATER QUALITY HI 10IV-1 PUMPAGE DEFICIENCY SUMMARY IV-41V-2 ALTERNATIVE SUPPLY SITES PROJECTED QUALITY DATA IV 15IV-3 WELL FIELD COSTS IV 16V-l WHP TIME-OF-TRAVEL THRESHOLDS V-6VI 1 TREATMENT COSTS VI 11VII-1 REQUIRED DURATION FOR FIRE FLOW VII 3VII-2 STANDARD HYDRANT DISTRIBUTION VII 4VII 3 COMPOSITION OF EXISTING WATER DISTRIBUTION SYSTEM VII 5VI1-4 ESTIMATES OF PROJECT COSTS VII 29VIII 1 ESTIMATED WATER SYSTEM COSTS VIII-4IX 1 ESTIMATED COSTS FOR RECOMMENDED ALTERNATIVE IX 6X 1 WATER SALES REVENUE X 2X-2 1995 ESTIMATED EXPENDITURES \-4X 3 FIVE YEAR CAPITAL IMPROVEMENTS PLAN X 5
A 1 COLUMBUS WATER QUALITY GOALSINORGANIC CHEMICALS A 6
A 2 COLUMBUS WATER QUALITY GOALSSYNTHETIC ORGANIC CHEMICALS A 8
A 3 COLUMBUS WATER QUALITY GOALSDISINFECTION-DISINFECTION BY PRODUCTS A 11
A-4 COLUMBUS WATER QUALITY GOALSRADIONUCLIDES A 12
A 5 COLUMBUS WATER QUALITY GOALS -OTHER CHARACTERISTICS A 13
STATUS OF SAFE DRINKING WATER ACTREGULATIONS AT A GLANCE A 14
"I•-» 3^O (r>r\> -
ro

LIST OF FIGURESCOLUMBUS WATER STUDY
FIGURE PAGE
II-l HISTORICAL AND PROJECTED POPULATION II 3II-2 TOTAL SYSTEM PUMPAGE II-7II-3 CONSUMPTIVE USE AND EVAPORATION II 9HI-1 WATER SUPPLY SYSTEM SCHEMATIC HI 2IV-1 PUMPAGE DEFICIENCY IV 3IV-2 NITRATE-NITROGEN DATA MAP 1V-7IV-3 WELL HELD ALTERNATIVES IV-9IV-4 CAPITAL COSTS FOR TCE REMOVAL UTILIZING
PACKED TOWER AERATION IV 11V-l TIME-OF-TRAVEL LIMITS ALTERNATIVE SITES V 4V-2 TIME OF TRAVEL LIMITS EXISTING WELLS V 5VI 1 HARDNESS REDUCTION TREATMENT ALTERNATIVE
FLOW SCHEMATIC VI 3VI 2 HARDNESS REDUCTION SOLIDS HANDLING FLOW SCHEMATIC VI 6VI-3 IRON AND MANGANESE REDUCTION TREATMENT ALTERNATIVE
FLOW SCHEMATIC \ I 8VII 1 EXISTING WATER SYSTEM 1990 VII-6VII 2 REQUIRED FIRE DEMANDS EXISTING DISTRIBUTION SYSTEM VII 10VII-3 PRESSURE CONTOUR MAP OF EXISTING SYSTEM AVERAGE
DAILY WATER DEMAND WELL NO 15 OFF VII 13VI1-4 PRESSURE CONTOUR MAP OF EXISTING SYSTEM PEAK DAILY
DEMAND 12 MGD WELL NO 15 OFF VII 14VII 5 PROPOSED IMPROVEMENTS PHASES 1-4 VII 20
> Q73 ?»-» y83
SECTION IINTRODUCTION
PURPOSE
The purpose of this engineering study and report is to analyze the existing water system,identify and evaluate sources of supply and treatment alternatives, and outline therecommended improvements necessary to meet the twenty-year requirements of the City ofColumbus, Nebraska in compliance with the Safe Drinking Water Act
SCOPE
In accordance with the Basic Engineer Services "Scope of Services", the following tasks havebeen performed
Historical population trends and future population projections have beenrespectively reviewed and forecast
Existing commercial, industrial and residential water use trends have beeninvestigated, and the future demand requirements for these individualcategories projected on the basis of anticipated growth and populationestimates
Existing well capacities and chemical and physical characteristics have beenreviewed and tabulated
Current and proposed Federal drinking water regulations and their potentialimpacts on current and future processes and disinfection techniques have beenreviewed and considered in the establishment of water quality goals
^ •-»1-1 21
*is

Alternative water supply sources have been identified and characterized, withpreliminary well spacings and estimates of probable cost developed
Water treatment methods, meeting both present and future requirements,have been determined on the basis of the chemical characteristics of the watersupply sources, including estimates of probable project costs and operationand maintenance costs
Sludge quantities resulting from water treatment have been calculated anddisposal alternatives evaluated
The distribution network and storage have been computer modeled, includingtime simulation of system operation The existing water system andimprovement projects have been respectively evaluated and identified basedon various current and projected flow conditions
Water system alternatives incorporating supply, treatment and distributionhave been identified and evaluated
A water system plan for initial and long-term requirements has beenrecommended including project and operation and maintenance costs
Water use fees have been reviewed and the requirements for financing the
improvements have been identified
Estimates of project design and construction schedules have been made
The results and findings of this study have been set forth in a reportencompassing the priority, preliminary project cost, operation andmaintenance cost and financing requirements of the recommendedimprovements
1 - 2

SECTION IIPOPULATION AND WATER USAGE PROJECTIONS
INTRODUCTION
The past and current conditions that exist within the Columbus area are the basis on whichfuture water supply demands have been developed and evaluated Conditions discussed inthis section include historical population records, population projections, historical waterusage and estimated future demand requirements
HISTORICAL POPULATION RECORD
The City of Columbus is located on the eastern edge of the agricultural Central PlatteRegion in Platte County Columbus serves as the center of trade, employment andindustrial growth for surrounding counties including Boone, Butler, Colfax, Mernck, Nanceand Polk According to the 1981 City of Columbus Comprehensive Plan, the surroundingcounties have generally shown population declines for the past several decades, primarilyas a result of changes in the agricultural economy influencing migration out of the areaPlatte County was in this declining growth pattern until 1950 when the trend was reverseddue to industrial expansion Since 1950, Platte County has experienced population increases,
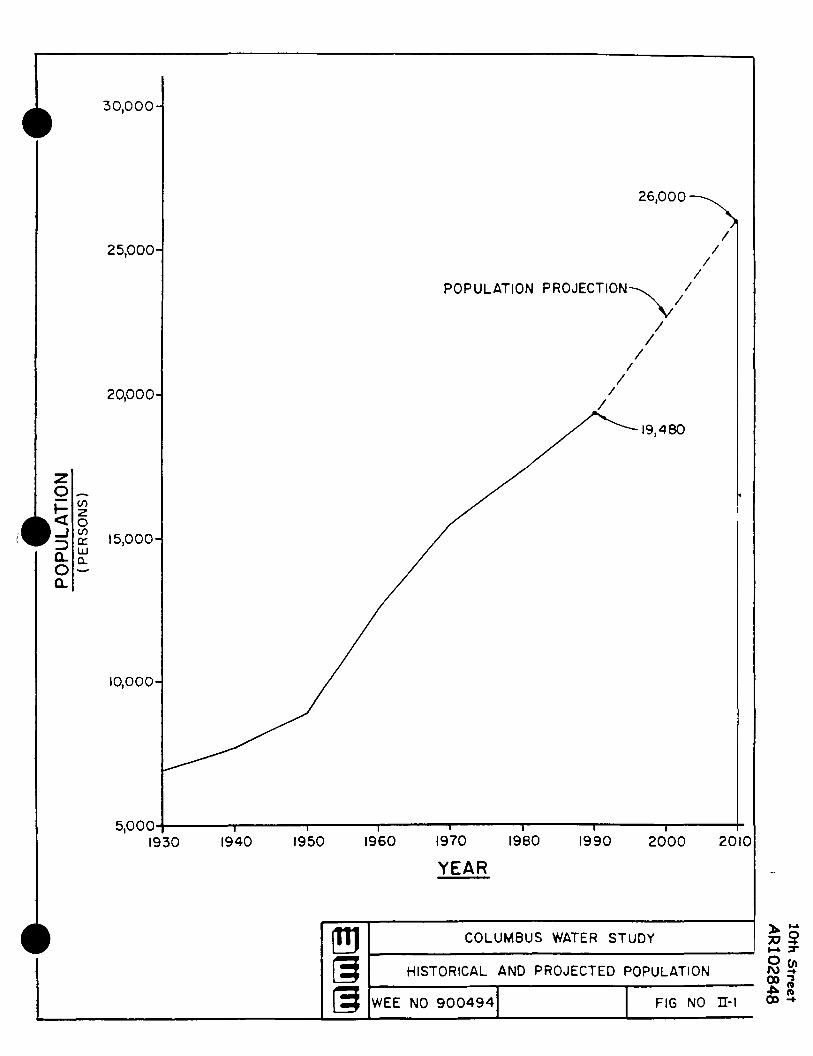
although the rate of increase has been decreasing Since experiencing over forty and twentypercent growth in the 1950's and 1960's respectively, Columbus has had approximately atwelve percent growth for each of the immediate past two decades The population ofColumbus is 19,480 according to the final results of 1990 Census Historical populationdata for Columbus and Platte County are provided in Table II-1

TABLE II-lHISTORICAL POPULATION DATA
COLUMBUS WATER STUDY
Year City of Columbus* Platte County*(persons) (persons)
1930 6,898 21,1811940 7,632 20,1911950 8,884 19,9101960 12,476 23,9921970 15,471 26,544
1980 17,328 28,8521990 19,480 29,820
"Source US Census Bureau
POPULATION PROJECTIONS
Future population projections depict the historical trend of population growth for the City
of Columbus The 1981 City of Columbus Comprehensive Plan developed populationprojections to the year 2000, utilizing computer programs which considered trends in birth
and mortality rates and net-m-migration Projecting from 1970, the 2000 population forColumbus was expected to be 24,003 with an anticipated 1990 population of 20,518 Final1990 Census information indicates a Columbus population of 19,480 For this study,projections were made to 2010 by assuming population growth will occur from 1990 to 2000at the same rate as anticipated in the 1981 Comprehensive Plan and by utilizing straight line
extrapolation from 2000 to 2010 The historical population records and populationprojections for Columbus are graphically shown in Figure II-l Population projections forColumbus are summarized in Table II-2
, 1 - 2 qro
POPU
LATI
ON
(PE
RS
ON
S)
m m (0 o o .(> ID o z o W
o o r~ > z o m o H m o TJ o c r~ > o
o o CD C m t/5 H C D

TABLE II-2COLUMBUS POPULATION PROJECTIONS
COLUMBUS WATER STUDY
Year City of Columbus(persons)
1995 21,1202000 22,7802005 24,3902010 26,000
The projected 2010 population of 26,000 reflects a 33 5 percent increase in the 1990population of 19,480 people
HISTORICAL WATER USAGE
A water system does not produce or serve water at a constant rate The rate vanesconsiderably over the year, during the day, in various sections of the country, and indifferent types of communities The characteristics of the community being served largelyaffect system requirements in that the type and extent of air-conditioning, lawn sprinklinguse, the relative amount of commercial and industrial development, and the percentage ofcustomers metered greatly influence the magnitude of demands
Because of the individual water use characteristics of a particular community, past watersystem records serve as the primary basis for predicting future requirements Records ofpast water system requirements maintained by the City have been used in the preparationof this report The City determines daily total system pumpage by measuring flow with flowmeters on pump discharge lines, and for those pumps without flow meters, calculatingpumped flow by multiplying the pump discharge rating by pump running time recorded onpump running time meters
n-4 SO (/»
S•&•vO

The annual average daily, maximum day and maximum month pumpage for the 1960 to1990 period of record are shown in Table II-3 No records are available which indicatemaximum hourly demands The average daily pumpage has increased sporadically fromapproximately 1 6 million gallons per day (mgd) in 1960 to approximately 4 7 mgd in 1990This trend is graphically depicted in Figure II-2 Average daily pumpage increaseddramatically in 1979, 1984 and 1987 and decreased dramatically in 1981, 1982 and 1986These fluctuations in pumpage are in part due to climatic changes and additional industrialdevelopment
The estimated average daily per capita consumption for the period of 1970 to 1990 isillustrated in Table II-4 Similar to the trend for average daily pumpage, the average daily
per capita consumption has increased and decreased sporadically The increases and
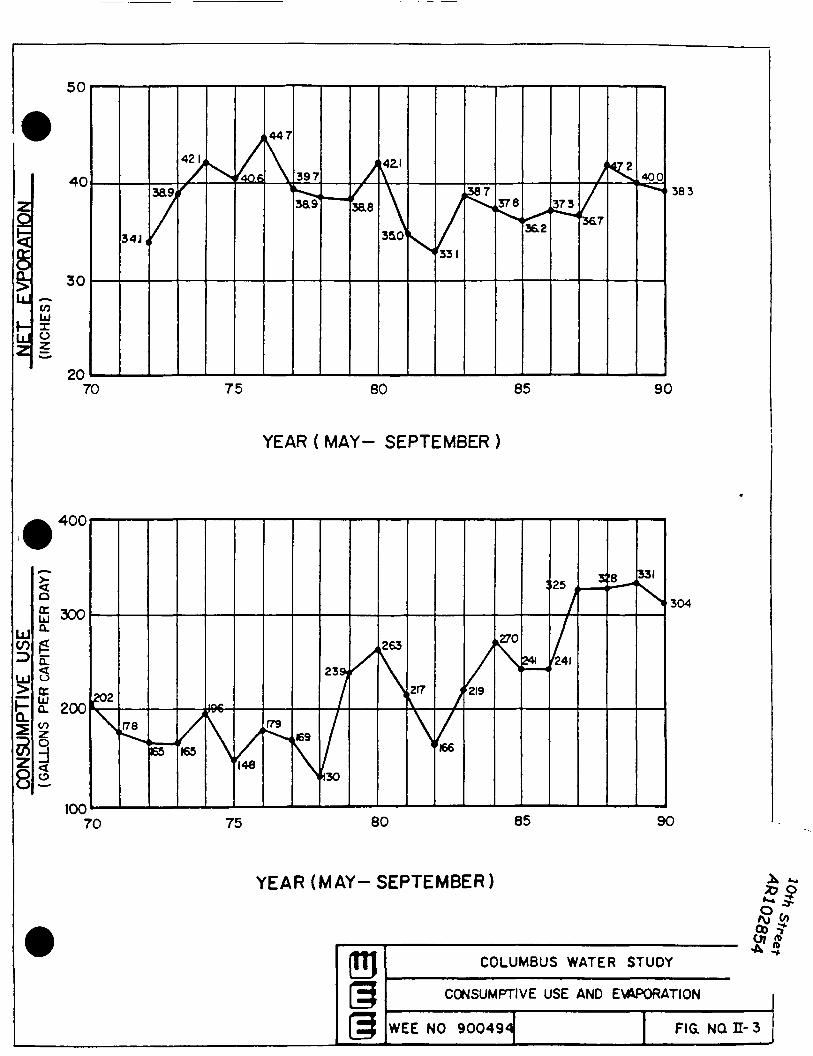
decreases in per capita consumption may be attributed to the same causes of thefluctuations in average daily pumpage Domestic consumption increases occur in dry years,in large part due to summer month lawn irrigation There appears to be a direct
relationship between per capita usage and net evaporation during the months of Maythrough September Net evaporation statistical information, defined as the amount of
evaporation in inches from an evaporation pan, was obtained from the U S Weather Service
from the nearest weather service station, with evaporation statistics, located in Omaha Netevaporation and per capita usage for May through September are plotted on Figure II-3
In general, net evaporation peaks and valleys on the plot correspond with peaks and valleys
on the consumptive use plot Exaggerated peaks in consumptive use in 1984 and 1987 mayalso be attributed to the new industrial demands of Douglas and Lomason in early 1984 andof Behlen and Appleton in late 1986 Evaporation and associated demands for domesticwater use outside the house and industrial development appear to be the driving factors inper capita consumption fluctuations
IN)o>01O

TABLE II-3PUMPAGE RECORDS AND PEAKING FACTORS
COLUMBUS WATER STUDY
Year
1960196119621963196419651966196719681969197019711972197319741975197619771978197919801981198219831984198519861987198819891990
AverageDay(mgd)
164170165183174170198198204214214200191195228190207215195304326287245271340354335428441441467
MaximumDay(mgd)
3274383535645144 116424636035316436005 135 16
4775925938067957756378831021958892
1097109810461070
ge Ratiolum Ratio
RatioMaximumDay toAvg Dav
199258214308295242324234296248300300269265
230275304265244270260326300271266256249237229
267326
MaximumMonth(mgd)
2813132803673423144263473524214 193743373605683113413953035056295724 10541669610536833791806744
AverageMaximum
RatioMaximumMonth toAvg Dav
172184170200197184215175173197196187177185249163165184155166193199168200197172160195179183159
184249
II-6 00Ul

UJ5crUJo<QL
UQ_
I960 2010
COLUMBUS WATER STUDY
TOTAL SYSTEM PUMPAGE
WEE NO 900494 FIG NO H-2
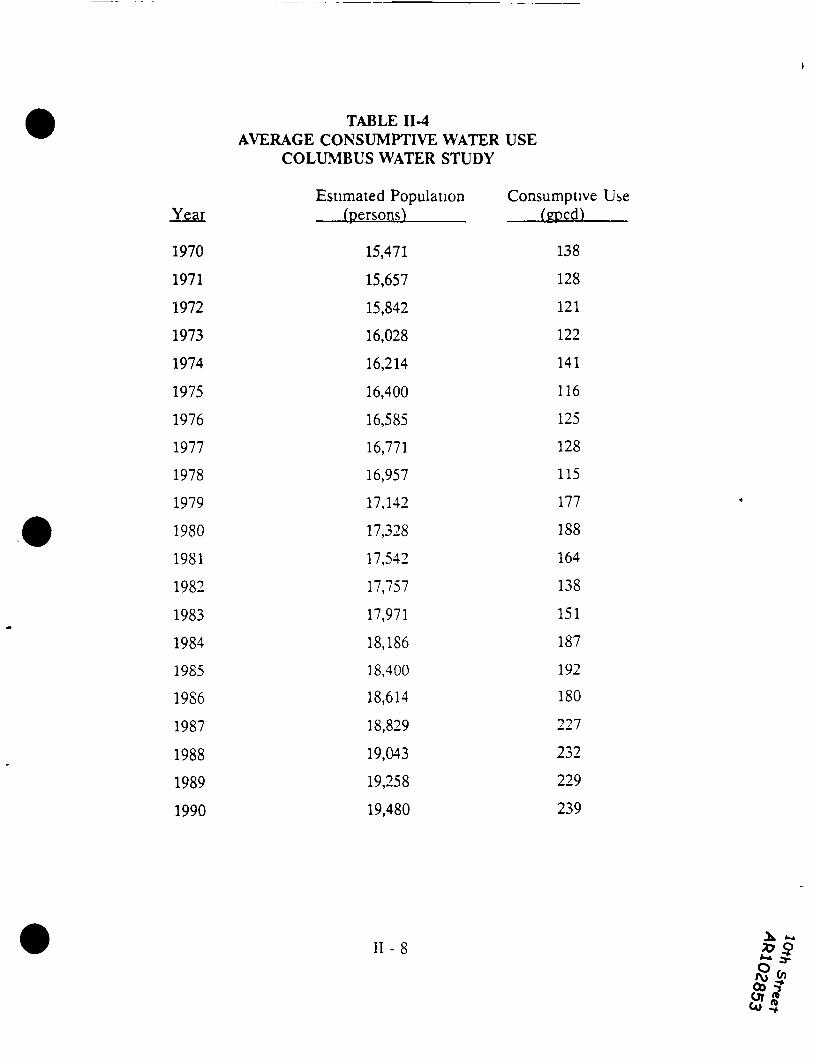
TABLE II-4AVERAGE CONSUMPTIVE WATER USE
COLUMBUS WATER STUDY
Estimated Population Consumptive UseYear (persons)_____ (gpcd)
197019711972197319741975197619771978197919801981198219831984198519861987
198819891990
15,47115,65715,84216,02816,214
16,40016,58516,77116,95717,14217,32817,54217,75717,97118,18618,40018,614
18,82919,04319,25819,480
138128121122141116125128115177188164
138151187192180227
232229239
I I - 8
UJoz
383
70
400
UJCO
UJ
Q_
300
tco! 200in
d<
100
202
70
75
YEAR ( MAY- SEPTEMBER )
f79
217\
304
75 80 65 90
YEAR (MAY- SEPTEMBER)
COLUMBUS WATER STUDY
CONSUMPTIVE USE AND EVAPORATION
WEE NO 900491 FIG NQ E- 3

Recorded maximum day and maximum month pumpages are shown in Table II-3 Theratios of maximum day pumpage to average day pumpage have varied from 1 99 to 3 26 withan average of 2 67 The ratios of maximum month pumpage to average day pumpage havevaried from 1 55 to 2 49 with an average of 1 84 These averages have remained fairlyconstant dating back to 1960
ESTIMATED FUTURE DEMAND REQUIREMENTS
Based upon the analysis of the past 20 years of water records in five-year increments, theconsumptive water use has increased at a rate of approximately 20 gallons per capita perday (gpcd) every five years If this trend continues, the per capita usage may reach 310 gpcdin 2010 Although per capita usage is expected to increase, it is anticipated the rate ofincrease will decline and a per capita usage of 275 - 300 gpcd for 2010 is expected Byincorporating the increase in per capita usage with the population projections, it isanticipated that a 2010 population of 26,000 people would require approximately 7 5 mgdto meet average daily demands Peaking factors developed previously were used to projectmaximum day and maximum month pumping requirements The pumpage requirements aretabulated in Table II-5 and illustrated on Figure II-2
TABLE II-5PROJECTED WATER PUMPAGE REQUIREMENTS
COLUMBUS WATER STUDY
Average Day Maximum Day Maximum MonthlyRequirements Requirements Requirements
Year (mgd) (mgd) (mgdl
139 96158 109180 12420 1 13 9
n - i o 2
1995200020052010
52596775
3*01 -*

The projected water use can be subdivided into two categories, a domestic relatedPopulation requirement and an industrial-commercial related Large User requirement In1989, the Large User demand which consisted of the consumptive use of Dale Electronics,Douglas and Lomason, Becton-Dickenson, Behlen and Appleton approximated an averageday usage of 1 54 mgd In terms of the total 1989 average day demand, the Large User andPopulation requirements were 35 percent and 65 percent respectively The projected LargeUser and Population requirements are presented in Table II-6
TABLE II-6LARGE USER AND POPULATION REQUIREMENTS
COLUMBUS WATER STUDY
Year
199520002005
2010
TotalAverage DayRequirements
(mgd) _
52596775
Large UserAverage DayRequirements
(mgd)
182 12 4
26
PopulationAverage DayRequirements
(mgd)
34
38434 9
II - 11

SECTION IIIEXISTING WATER SUPPLY AND QUALITY GOALS
INTRODUCTION
The City of Columbus currently obtains its supply of water from aquifers underlying theColumbus area, with saturated thicknesses of up to 100 feet The quality of these aquifersand Columbus' short-term/long-term water quality goals are the basis on which futuretreatment alternatives will be developed and evaluated This section includes discussionsof the existing well supply and water quality and presents the Columbus water quality goals
EXISTING WELL SUPPLY
The supply of water for the City of Columbus is presently obtained from eight wells Six ofthe wells are located in a well field in Downtown Columbus One well is located north oftown near Lake Babcock and another well is located east of town near the Loup River
Canal and Highway 30 A schematic diagram of the Columbus water supply system isillustrated in Figure III-l
Five of the wells (Wells 1, 2, 8, 11 and 13) in the Downtown well field pump to the existingwater treatment plant and ground level reservoir located near 28th Avenue and 10th Street
These wells currently have capacities ranging from 740 gallons per minute (gpm) to 1,670gpm with a total combined pumping capacity of 5,350 gpm Water pumped to the ground
level reservoir, which has a total capacity of one million gallons, is eventually pumped intothe distribution system by high service pumps The other well in the Downtown well field,Well No 12, currently pumps to two steel tank reservoirs which have a combined capacityof 990,000 gallons These tanks are located adjacent to the railroad tracks in the vicinityof 32nd Avenue Well No 12 currently has a capacity of 1,460 gpm and can also be valved
in - l o J00 T1
01 £N -»•

3,000,000 GAL.RESERVOIR
RAILROAD TANKS730.00O GAL. AND260,000 GAL.
> VICLL NO 14
DISTRIBUTIONSYSTEM
PUMPINGSTATION
ELJEMXTED RESERVOIR(29QPCOGAU
GROUND LEVEL RESERVOIRTOTAL CAPACITY I.OOO.OOO GAL
ALTITUDE VALVEELEMOTED RESERVOIR(180,000 GAL )
WATER PLANTBUILDING
COLUMBUS WATER STUDY
WATER SUPPLY SYSTEM SCHEMATIC
WEE NO 900494 FIG NO JJI-1

to pump to the water treatment plant rather than into the steel tanks The water in thesteel tanks is pumped into the distribution system by high service pumps
To meet the needs of an expanding community, two wells have been constructed at thenorth and east edges of the distribution system Well No 14 was constructed in 1981 north
'Z-?e0,4G&of town near 33rd Avenue and Lake Babcock This well currently has a capacity of 1,660 /gpm, and cycles on/off based on fluctuating water levels in the nearby three million gallonground-level reservoir Well No 15 was constructed in 1986 east of town near the LoupCanal and Highway 30 This well currently has a capacity of 1,150 gpm and cycles on/offbased on fluctuating water levels in the nearby 180,000 gallon elevated reservoir
The City's eight wells currently in service have a total theoretical combined pumpingcapacity of approximately 9,620 gpm (approximately 13 8 million gallons per day) However,this capacity is never achieved because of flow restrictions in the piping at the existing 3mgd water treatment plant which limit the output from the Downtown well fieldTabulations of well construction parameters and pumping characteristics for the City's wellsare presented in Table III-l and Table 111-2
EXISTING WATER QUALITY
The results from a recent quality analysis of the City's wells currently in use are presented
in Table HI-3 In general, the groundwater is characteristically hard and exhibitsconcentrations of iron and manganese exceeding secondary maximum contaminant levels(SMCLs) established by the United States Environmental Protection Agency The SMCLsare Federally non-enforceable goals for contaminants that may adversely affect the aestheticquality of drinking water A detailed discussion of drinking water regulations is presentedin the following section and in the Appendix
UlvO

WELLLOCATION
WHENBUILT
CASINGSIZE(IN)
HOLESIZE(IN)
4
8
10
1/2 block Southof Elev Tank 1948
Alley between8th & 9th St,27th & 28th Ave 1961
10th Si & 30th Ave 1957
Between 9th &10th St Westside 30th Ave 1962
22nd Si & 22nd Ave 1954
18 18
16
16
12
16
36
42
42
42
TABLF l l l - ICITY WELL INVENTORY
COLUMBUS WATER STUDY
SCREEN MATERIAL
60' - Armco shutterscreen
60' 3/1 6" stainlesssteel shutter screen
60' - 6 ga bronze
50' - 7 ga stainlesssteel shutter screen
40' - Bronze shutter screen
CASING MATERIAL
Armco casing
POWER
Electric
cast iron
steel
stainless steeland cast iron
Electric
Electric
Electric
Electric
11
12
13
14
15
North side 10thSt between28th & 29th Ave 1970 16 42
50' East ofR R Tanks 1971 15
West ofR R Tanks 1975 17
At 3 MG Tank 1981 19near Ldkc Babcock
23rd St &Loup Canal 1986 16
09830W4.33 J4S M4-OT
42
36
36
30
70 - 7 ga stainlesssteel shutter
47' - stainless slccl
60' concrete
39 7 ga stainlesssteel
45 - stainless steel
cast iron
steel
concrete
steel
steel
Electric
Electric w/StandbyNatural Gas Engine
Electric
Electric w/StandbyProp me Engine
Electric

TABLE III-2CITY WELL CHARACTERISTICS
COLUMBUS WATER STUDY
DISCHARGE
WELLNO
1
2
4
8
10**
11
12
13
14
15
WELLDEPTH00
100
100
110
108
110
142
150
150
144
125
WELL
Original(gpm)
940
890
600
1,900
710
1,650
2,000
1,500
1,500
1,000
CAPACITYMarch1990*(gpm)
1,125
1,050
1,320
740
1,670
1,460
765
1,660
1,150
* Source Layne-Western Company, Inc Service** Well No 10 was removed from service in 198S
I98ZOISV4.33 J4.S H4OT
t
PRESSUREMarch1990*(psig)
10
8
22
15
17
31
35
18
75
Records
STATIC
Original00
20
20
12
12
25
14
17
15
73
11
•
LEVELSMarch1990'00
18
185
17
17
20
22
16
77
12
SPECIFIC CAPACIT'March, 1990*(gpm/ft of drawdown)
304
238
719
865
352
662
283
220
215
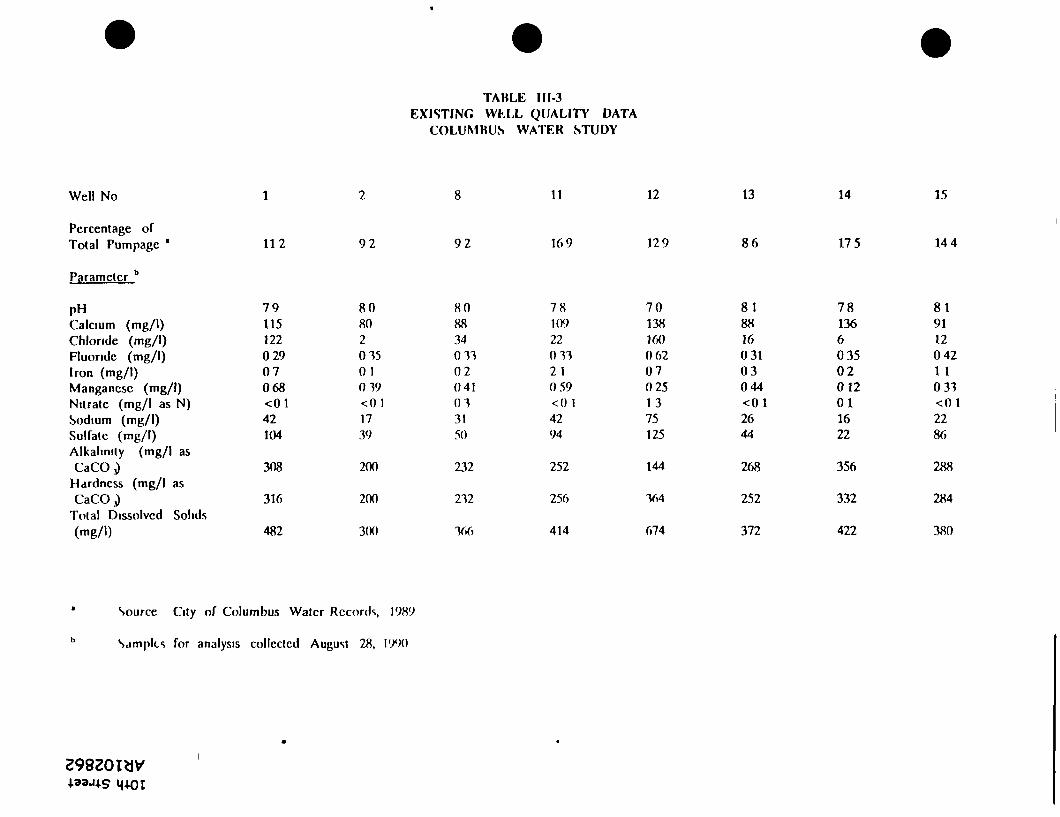
TABLE 111-3EXISTING WLLL QUALITY DATA
COLUMBUS WATER STUDY
Well No
Percentage ofTotal Pumpagc *
Parameter b
PHCalcium (mg/1)Chloride (mg/l)Fluonde (mg/l)Iron (mg/l)Manganese (mg/l)Nitrate (mg/l as N)Sodium (mg/l)Sulfale (mg/l)Alkalinity (mg/l asCaCOJ
Hardness (mg/l asCaCOj)
Total Dissolved Solids(mg/l)
112 92 92
11
169
12
129
13
86
14
175
15
144
7911512202907068<0 142104
308
316
482
8080201501019<0 11739
200
200
3(X)
808834Oil02041013150
232
212
166
7810922Oil2 1059<() 14294
252
256
414
70138160062070251375125
144
164
674
81881603103044<0 12644
268
252
372
78136603502012011622
356
332
422
8191120421 1031<0 12286
288
284
380
Source City of Columbus Water Records, 1989
Samples for analysis collected August 28, 1990
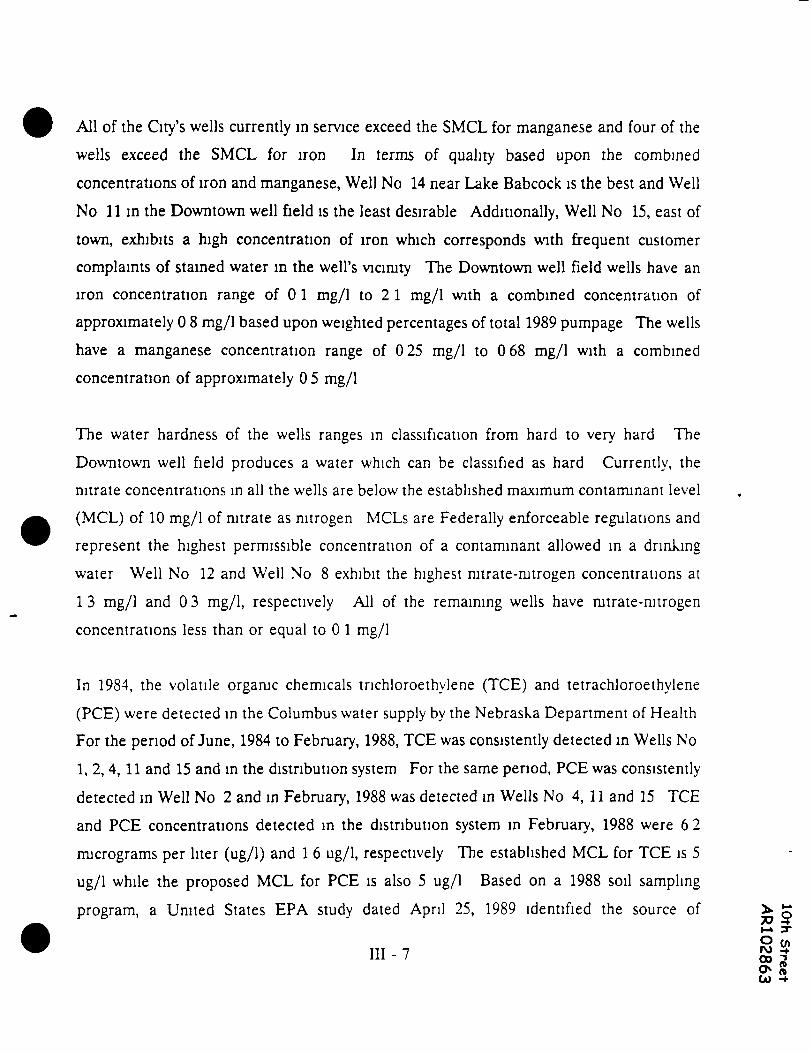
All of the City's wells currently in service exceed the SMCL for manganese and four of thewells exceed the SMCL for iron In terms of quality based upon the combinedconcentrations of iron and manganese, Well No 14 near Lake Babcock is the best and WellNo 11 in the Downtown well field is the least desirable Additionally, Well No 15, east oftown, exhibits a high concentration of iron which corresponds with frequent customercomplaints of stained water in the well's vicinity The Downtown well field wells have aniron concentration range of 0 1 mg/1 to 2 1 mg/1 with a combined concentration ofapproximately 0 8 mg/1 based upon weighted percentages of total 1989 pumpage The wellshave a manganese concentration range of 025 mg/1 to 068 mg/1 with a combinedconcentration of approximately 0 5 mg/1
The water hardness of the wells ranges in classification from hard to very hard TheDowntown well field produces a water which can be classified as hard Currently, thenitrate concentrations in all the wells are below the established maximum contaminant level(MCL) of 10 mg/1 of nitrate as nitrogen MCLs are Federally enforceable regulations and
represent the highest permissible concentration of a contaminant allowed in a drinkingwater Well No 12 and Well No 8 exhibit the highest nitrate-nitrogen concentrations at1 3 mg/1 and 0 3 mg/1, respectively All of the remaining wells have nitrate-nitrogenconcentrations less than or equal to 0 1 mg/1
In 1984, the volatile organic chemicals tnchloroethylene (TCE) and tetrachloroethylene(PCE) were detected in the Columbus water supply by the Nebraska Department of HealthFor the period of June, 1984 to February, 1988, TCE was consistently detected in Wells No1, 2, 4, 11 and 15 and in the distribution system For the same period, PCE was consistentlydetected in Well No 2 and in February, 1988 was detected in Wells No 4, 11 and 15 TCEand PCE concentrations detected in the distribution system in February, 1988 were 6 2micrograms per liter (ug/1) and 1 6 ug/1, respectively The established MCL for TCE is 5ug/1 while the proposed MCL for PCE is also 5 ug/1 Based on a 1988 soil samplingprogram, a United States EPA study dated April 25, 1989 identified the source of *> £
111-7 §SSs

contamination as an area behind an operating dry cleaner in the downtown vicinity Since
1988, sampling for TCE's in the City's wells has continued, with detection of TCE in WellNo 8 in October of 1989 The results of these analyses are presented in Table HI-4 InJanuary, 1989, the City complied with a request from the Nebraska Department of Healthto discontinue pumping Well No 4 and restrict the use of Wells No 2 and 11 to onlyessential needs The request was subsequently complied with in an attempt to reduce theTCE concentrations in the distribution system to below the MCL Sampling in July, 1990indicated a TCE concentration of 6 8 ug/1 in the discharge from the existing water plant (i eDowntown well field discharge) and also detected TCE in Well No 12 Presently, SverdrupCorporation, in association with the United States EPA, is conducting a remedialinvestigation and feasibility study in order to determine the extent of the contamination and
to identify remedial alternatives
TABLE HI-4TRICHLOROETHYLE1SE DATA
COLUMBUS WATER STUDYTRICHLOROETHYLENE CONCENTRATION
(ug/DSampleDate 03/16/88 12/27/88 10/04/89 02/28/90
Well No
1 1000 000 360 4702 600 1015 1610 1010
4a 1100 2016 3350 22208 000 000 170 51011 800 847 1100 118012 000 000 000 NSb
13 000 000 000 NS14 0 00 107 0 00 NS15 500 000 000 NS
Well No 4 pumping discontinued in January, 1989NS - No Sample >
III - 8 o

Data available on the quality of water within the distribution system including inorganics,metals, tnhalomethanes, radionuchdes and other characteristics are presented in Table III-5The samples for analysis were taken at the water plant and are reflective of the quality ofthe Downtown well field The quality of water at points within the distribution system inthe vicinity of Wells No 14 and 15 will be effected by the quality of those wells
COLUMBUS WATER QUALITY GOALS
This section defines the Columbus Water Quality Goals (Goals) which will be used to helpdetermine short-term and long-term treatment needs for the City of Columbus The Goalswere established with the cooperation and input from the City of Columbus The Goals arebased on the Safe Drinking Water Act of 1974 (SDWA) and 1986 amendments andAmerican Water Works Association (AWWA) position papers
The SDWA and amendments are summarized in Appendix A to provide the rationale forthe development of drinking water standards The SDWA was signed into law in December1974 and mandated the establishment of drinking water regulations to all public watersystems in the United States The United States Environmental Protection Agency(USEPA) was authorized to set national drinking water regulations, conduct special studiesand research, and oversee implementation of the act Under the SDWA, both NationalInterim Primary Drinking Water Regulations (NIPDWR) (health related federally
enforceable standards) and National Secondary Drinking Water Standards (NSDWS)(aesthetic related federally non-enforceable standards) were adopted In 1986, the SDWAwas amended to strengthen it with respect to the regulation setting process and groundwaterprotection The water quality regulation components of the 1986 amendments to the SDWAare summarized in the Appendix
III - 9
01

TABLE III-5COLUMBUS WATER QUALITY
COLUMBUS WATER STUDY
Inorganics (1986 Analysis)
Calcium (mg/1) 85Chloride (mg/l) 12Fluoncle (mg/1) 045Iron (mg/1) 1 0Manganese (mg/1 06Nitrate (mg/1 as N) 0 5Sodium (mg/1) 20Sulfate (mg/1) 50
Inorganic Heavy Metals (1990 Analysis)
Arsenic (mg/1) <0005Barium (mg/1) 0380Cadmium (mg/1) <0001Chromium (mg/1) <0001Lead (mg/1 <0001Mercury (mg/1) <0001Selenium (mgl) <0001Silver (mg/1) <0001
Trihalomethanes (1989 Analysis)
Bromoform (ug/I) LTMDL*Chloroform (ug/1) 4 5Bromodichloromethane(ug/1) 2 2
Dibromochloromethane(ug/I) LTMDL*
Total Trihalomethanes(ug/1) 6 7
Other Characteristics (1986 Analysis)
Alkalinity (mg/1 asCaC03) 300
Hardness (mg/1 asCaCO3) 300
Total DissolvedSolids (mg/1) 400
* LTMDL - Lower than minimumdetection limit
Radionuchdes (1989 Analysis)
Gross Alpha (pci/1) 3 5
998ZOI3V433J^S

AWWA's position on water quality is important even though it is not a regulatory agencybecause it helps provide direction for water quality goal development The AWWA hasposition statements with respect to some finished water quality parameters The waterquality positions, as confirmed by the AWWA Board of Directors are as follows
Nitrate - The recommended operating level and goal is less than 10 mg/1 asN No cases of methemoglobmemia have been reported where the water supply containsless nitrate than the recommended operating level
Phenols - The recommended operating level and goal is less than 0 002 mg/1at the point of chlonnation Concentrations as low as 0 002 mg/1 phenol in source waterwill cause objectionable taste and odors when chlorinated because of the formation ofchlorinated phenols Phenols are defined as hydroxy derivatives of benzene and itscondensed nuclei
*
Taste and Odor - The recommended operating level for odor is less than 3threshold odor numbers (TON) Taste should be non-offensive
Chloride - The recommended operating level is less than 250 mg/1 of chloridein finished water and a goal of less than 100 mg/1
Corrosivity - The finished water should be neither corrosive or leave excessiveor undesirable deposits on water conveying structures
In establishing Columbus Water Goals (Goals), the most recent quality data from thedistribution system were compared to the various Federally regulated and non-regulatedcontaminant levels in Tables A-l through A-5 in the Appendix The purpose of thecomparison was to determine what existing water contaminant levels, if any, exceed or comeclose to exceeding regulated or non-regulated limits In general, water quality goals were _,
2 im - 1 1 S<?
oo

established at the most restrictive of federally enforceable or non-enforceable promulgatedor proposed levels However, if quality data were available which indicated more restrictivepromulgated or proposed Federal goals could be achieved, they were established as theGoals The results of the comparison are discussed as follows
Inorganic Chemicals (IOC) - Iron and manganese levels were found to exceedthe SMCL No other IOC water quality data were found to exceed present or proposedfederal limns or goals However, water quality data for aluminum, antimony, asbestos,beryllium, copper, cyanide, nickel, nitrite, thallium and zinc were not available
Synthetic Organic Chemicals (SOC)
Pesticides, Herbicides and PCBs - Water quality data are not availablefor the contaminants included in the future SOC Phase II and SOC Phase V rules in TableA-2
Volatile Organic Chemicals (VOC) - Cis-l,2-Dichloroethylene, o-Dichlorobenzene, para-Dichlorobenzene, trans-l,2-Dichloroethylene, Tolulene, Benzene,Carbon tetrachlonde, 1,2-Dichloroethane, 1,1-Dichloroethylene, Ethylbenzene, 1,1,1-Tnchloroethane, l,l,2Tnchloroethane, 1,2-Dichloropropane and vinyl chloride levels appearto be below federal limits Although Tetrachloroethylene and Tnchloroethylene have been
detected m the Downtown well field, the Goals have been established at the enforceableMCL Currently, the Tnchloroethylene concentration exceeds the MCL Water quality
data are not available for the remaining contaminants included m the future SOC Phase IIand Phase V rules in Table A-2
Disinfection-Disinfection By-Products (D-DBP) - Of the 13 disinfectants anddisinfection by-products listed in Table A-3, only total tnhalomethanes (TTHM) have apublished proposed limit of either 25 or 50 ug/1 and a MCL of 100 ug/1 The TTHM level
III - 12 o2 «O" woo -*
data suggests compliance with both the current MCL and the proposed limits Water qualitydata and limits for the other contaminants are not available for discussion
Radionuchdes - No radionuclide water quality data were available other thanGross alpha which did not exceed present federal limits
Other Parameters or Characteristics - Of the characteristics and parameterslisted in Table A-5, water quality data are available only for total dissolved solids and pHwhich meet the respective SMCLs
III - 13 8°o

SECTION IVSUPPLY CONSIDERATIONS
INTRODUCTION
The City of Columbus currently has the pumping capacity which exceeds the presentmaximum-day demands of the distribution system However, water quality conditions andfuture demand requirements dictate the need for development of an additional source orsources of supply This section of the report defines future pumping requirements anddescribes three possible sources of supply capable of satisfying short-term/long-termrequirements for the City
FUTURE PUMPAGE REQUIREMENTS
Although the City of Columbus has the pumping capacity available to meet the currentmaximum day demands of the water distribution system, water quality conditions may limitthe utilization of this pumping capacity As reported previously, the TCE concentration atpoints within the distribution system in July 1990 exceeded the established MCL of 5 ug/1In order to reduce the TCE concentration in the distribution system, the two most TCEcontaminated wells in the Downtown well field (Wells No 2 and 11) must be removed fromservice if treatment for TCE removal is not provided Additionally, in terms of short-term
pumping requirements and water quality improvement, the City should considerdiscontinuing pumping Well No 15 because of its high iron content and associated frequentcustomer complaints in the well's vmcimty
In terms of long-range pumping requirements, the City may need to remove Wells No 1,8 and 12 m the Downtown well field from service This may be required if their TCEconcentrations increase, producing water in the distribution system with levels above theMCL and treatment for TCE removal is not provided As the City develops a new source
ooo

or sources of supply to replace wells taken out of service or to increase the City's pumpingcapacity, consideration should be given to centralizing the source of supply Assuming TCEcontaminated wells are taken out of service, phasing out the remaining wells in theDowntown well field may also be required as well maintenance and repair costs increase orif TCE migrates towards the active wells A centralized water supply outside of the Citywould allow the City to develop well head and well field protection plans to help preventdegradation of the water quality However, if the City phases out the Downtown well field,pumping one or more wells in the well field may have to continue to prevent a rise ingroundwater levels Such a rise may result in flooded basements in portions of the City thathad not experienced this problem to date Depending on the quality of this water, it mayor may not be pumped into the distribution system
The City's well supply must have a combined firm capacity capable of meeting projectedmaximum-day demand requirements Firm well capacity is defined as the total availablewell pumping capacity assuming the largest well to be out-of-service The City's two largestwells (Wells No 11 and 14) each have a capacity of approximately 2 4 mgd In the variousscenarios of projected firm pumpage deficiency described below, one of these two activewells have been assumed to be out-of-service Firm pumpage deficiency until 2010,considering various scenarios of utilizing the existing City wells, is illustrated in Figure IV-1and summarized in Table IV-1 The Scenario 1 line represents firm pumpage capacity ifthe City continues to use all existing wells The Scenario II line represents firm pumpage
capacity if the City phases out Wells No 2 and 11 because of TCE contamination andphases out Well No 15 because of its high iron content In this scenario, Wells No 2 andII are phased out immediately and Well No 15 is phased out prior to 1995 The ScenarioIII line represents phasing out all the City's wells except Well No 14 by 2005 Scenario IIIis the same as Scenario II until 2000 At 2000, Wells No 1 and 8 are phased out and thenat 2005, Wells No 12 and 13 are phased out
IV - 2
s

20
15-
10-
Id
5-
MAXIMUM DAYPUMPAGE REQUIREMENTS
SCENARIO I - FIRM PUMPAGE AVAILABLE(UTILIZE ALL EXISTING WELLS)
.WELLS 2 8 1 1 ABANDONED
_ _, SCENARIO IT -FIRM PUMPAGE AVAILABLE
-WELL 15 ABANDONED
L
WELLS I 8 8ABANDONED
TJ SCENARIO HI- FIRM PUMPAGE AVAILABLE
r—WELLS 12 8 13
L_
ABANDONED
1990 1995 2000 2005
YEAR
2010
b COLUMBUS WATER STUDY
PUMPAGE DEFICIENCY
WEE NO 900494 FIG NO IT-1
23srv> •*
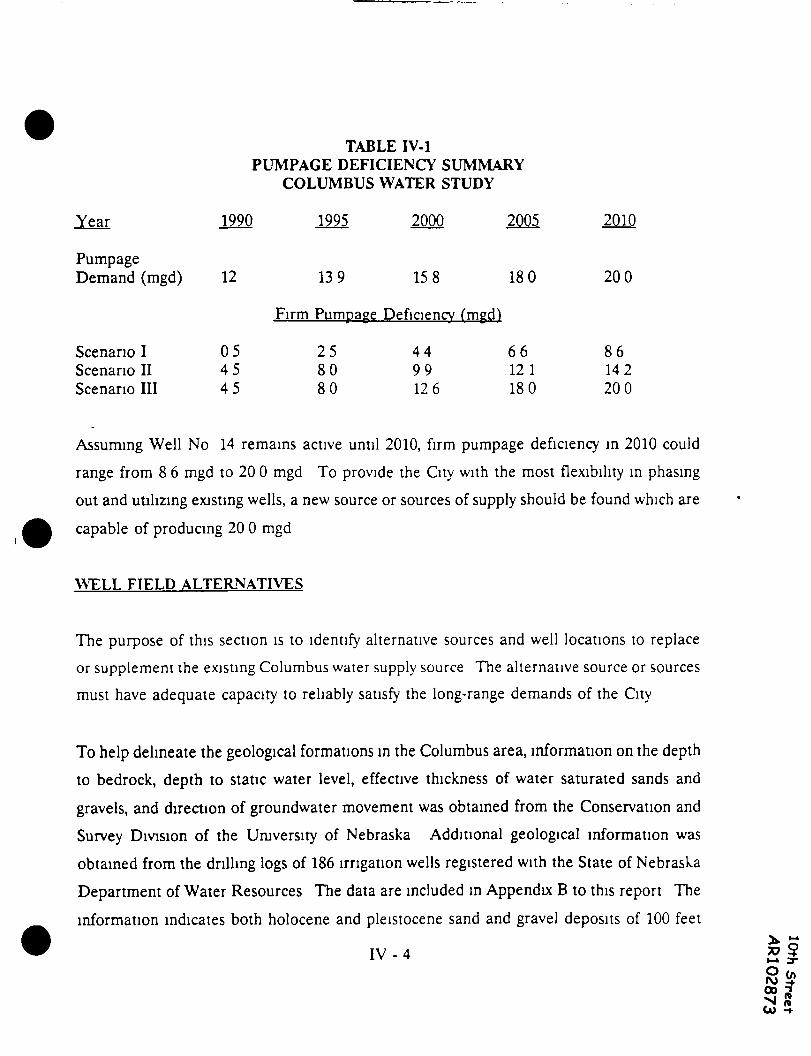
TABLE IV-1PUMPAGE DEFICIENCY SUMMARY
COLUMBUS WATER STUDY
PumpageDemand (mgd)
1990
12
1995
139
2000
158
2005
180
2010
200
Firm Pumpage Deficiency (mgd)
Scenario IScenario IIScenario III
054545
258080
4499126
66121180
86142200
Assuming Well No 14 remains active until 2010, firm pumpage deficiency m 2010 couldrange from 8 6 mgd to 20 0 mgd To provide the City with the most flexibility in phasingout and utilizing existing wells, a new source or sources of supply should be found which are
capable of producing 20 0 mgd
WELL FIELD ALTERNATIVES
The purpose of this section is to identify alternative sources and well locations to replaceor supplement the existing Columbus water supply source The alternative source or sourcesmust have adequate capacity to reliably satisfy the long-range demands of the City
To help delineate the geological formations in the Columbus area, information on the depthto bedrock, depth to static water level, effective thickness of water saturated sands andgravels, and direction of groundwater movement was obtained from the Conservation andSurvey Division of the University of Nebraska Additional geological information wasobtained from the drilling logs of 186 irrigation wells registered with the State of NebraskaDepartment of Water Resources The data are included in Appendix B to this report Theinformation indicates both holocene and pleistocene sand and gravel deposits of 100 feet
IV -4
0° 3as

or more in thickness exist in the immediate vicinity of the City of Columbus, north to LakeBabcock and eastward Sand formations are more shallow in depth to the west and southof the City The direction of groundwater movement in the Columbus area is generally ina southeasterly direction with depth to groundwater ranging from 5 to 10 feet within the Cityto 60-70 feet near Lake Babcock
The quality of water in the aquifer in the Columbus area varies spatially and possiblyvertically In some areas, a clay lense exists in the 60- to 70-foot depth range separating theaquifer into two or more sand sections The water quality may vary with depth due to thepresence of these clays
A contaminant of major focus in this study is nitrate-nitrogen According to Exner andSpaulding,(1) the Central Platte River Valley alluvial aquifer with Columbus on the easternedge has experienced an increase in nitrate-nitrogen content at a rate of approximately 0 4to 1 mg/1 per year, with areas of nitrate-nitrogen concentrations exceeding 20 mg/1 Thisincrease is most probably due to the fact that Central Platte River Valley is an intensiveagricultural area The combination of fertilized and irrigated agriculture, shallow watertables and high permeable soils make this area susceptible to groundwater pollution (2)
Nitrogen applied in fertilizers is leached through the permeable soil layers as nitrate intothe shallow groundwater by rainfall and irrigation Exner and Spaulding (1^ also indicatenitrate-nitrogen levels exceeding 10 mg/1 have been detected east of Columbus in Colfax
and Dodge Counties
(1) Exner, Mary E , and Roy F Spaulding Occurrence of Pesticides and Nitrate mNebraska's Groundwater, 1990 Water Center, Institute of Agriculture and NaturalResources, the University of Nebraska
(2) University of Nebraska-Lincoln Conservation and Survey Division GroundwaterPollution Potential in Nebraska, 1983 •v. H»
"S»-» ^O (/>IV) %00 2xi 8
I V - 5

To help assess the nitrate contamination levels in the aquifer in the Columbus area, theresults of nitrate analyses performed by various agencies were obtained The agencies whichprovided nitrate information include the Lower Platte North Natural Resources District, theLower Loup Natural Resources District, the Nebraska Department of Health, the NebraskaDepartment of Environmental Control, and the Institute of Agricultural and NaturalResources of the University of Nebraska The samples for analysis were obtained primarilyfrom private domestic and irrigation wells Additional samples were obtained fromirrigation wells as part of this study with analysis performed by the State Health Lab Thenitrate information is illustrated on Figure IV-2
Nitrate-nitrogen concentrations in the wells range from less than 0 1 mg/1 to 35 mg/1Generally, isolated cases of high nitrate concentrations can be attributed to point sourcecontaminations originating at discrete locations such as barnyards and feed lots Dispersedlevels of high nitrate concentrations can be attributed to non-point sources of contaminationNon-point sources such as leachate from agricultural fields which have received anapplication of commercial fertilizer or manure do not have a single point of origin Twoareas of high nitrate concentrations which appear to be widespread or originating from non-point sources are evident on Figure IV-2 One area is located approximately 5 milesnortheast of Columbus This area has nitrate-nitrogen concentrations in the range of 20
mg/1 to 35 mg/1 interspersed with nitrate levels of less than 5 mg/1 The second area issouthwest of Columbus between the Loup and Platte Rivers, west of Highway 81 This areaextends to Duncan with nitrate concentrations generally exceeding 15 mg/1 in the areabetween the Platte River and Highway 30
According to EPA, the most effective treatment method for nitrate removal is ion exchangewith an amon resin Although ion exchange can be effective at nitrate removal, somedisadvantages of ion exchange include spent regenerant disposal, variable effluent qualitywith respect to background ions, non-feasibility at high levels of total dissolved solids and ^
»-*
I V - 6 So

10th StreetAK102876
LEGEND10-DOMESTIC WELL NO,N (m«/ll
IO IRHWATION WELL
NITRATE-NITROGEN DATA MAP
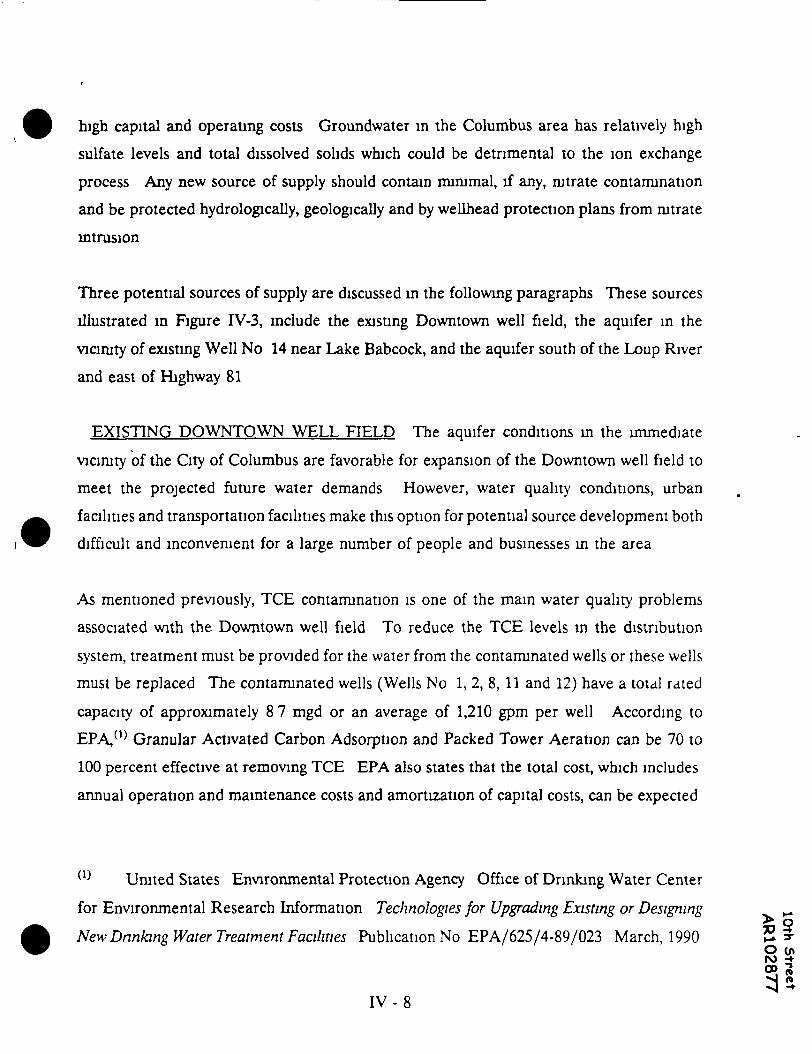
high capital and operating costs Groundwater in the Columbus area has relatively highsulfate levels and total dissolved solids which could be detrimental to the ion exchangeprocess Any new source of supply should contain minimal, if any, nitrate contaminationand be protected hydrologically, geologically and by wellhead protection plans from nitrateintrusion
Three potential sources of supply are discussed in the following paragraphs These sourcesillustrated in Figure IV-3, include the existing Downtown well field, the aquifer in thevicinity of existing Well No 14 near Lake Babcock, and the aquifer south of the Loup Riverand east of Highway 81
EXISTING DOWNTOWN WELL FIELD The aquifer conditions in the immediatevicinity of the City of Columbus are favorable for expansion of the Downtown well field tomeet the projected future water demands However, water quality conditions, urbanfacilities and transportation facilities make this option for potential source development bothdifficult and inconvenient for a large number of people and businesses in the area
As mentioned previously, TCE contamination is one of the main water quality problemsassociated with the Downtown well field To reduce the TCE levels in the distributionsystem, treatment must be provided for the water from the contaminated wells or these wellsmust be replaced The contaminated wells (Wells No 1, 2, 8, 11 and 12) have a total ratedcapacity of approximately 8 7 mgd or an average of 1,210 gpm per well According toEPA,(1) Granular Activated Carbon Adsorption and Packed Tower Aeration can be 70 to100 percent effective at removing TCE EPA also states that the total cost, which includesannual operation and maintenance costs and amortization of capital costs, can be expected
(1) United States Environmental Protection Agency Office of Drinking Water Centerfor Environmental Research Information Technologies for Upgrading Existing or Designing
a
>New Dnnhng Water Treatment Facilities Publication No EPA/625/4-89/023 March, 1990
I V - 8

10th StreetAkl02878
/ EXISTING WELL
NORTH ALTERNATIVESITE
EXISTING WELL
EXISTING DOWNTOW
^-N _ :
SOUTH ALTERNATIVESITE
COLUMBUS WATER STUDY
WELL FIELD ALTERNATIVES

to be less for Packed Tower Aeration than Granulated Activated Carbon Adsorption for
TCE removal A capital cost curve developed from information from EPA for 99 percentremoval of TCE using Packed Tower Aeration is illustrated in Figure IV-4 The capital costelements include the tower or column, internal column parts, packing material, blower(s),
clearwell, booster pumps(s) and any associated piping
From Figure IV-4, the capital costs for providing Packed Tower Aeration for the 8 7 mgd
of TCE contaminated water is approximately 1 8 million dollars However, this cost doesnot include site-specific costs such as raw water-holding tanks, a blower building, chemical
facilities, noise control installations, and air emission control EPA research indicates thatadding a vapor phase carbon adsorption unit to manage air emissions from Packed Tower
Aeration operations can double the costs for this option
In lieu of providing treatment for TCE removal, new wells could be constructed which
produce water containing minimal, if any, TCE To date, TCE has not been detected inWell No 13, one of the western-most wells in the Downtown well field It may be possible
to locate wells in the Downtown well field away from the TCE contamination Based onthe cost estimates developed in subsequent sections of this study for 20 mgd well field wi th2 mgd wells, estimated construction cost of a replacement well field is $150,000 per mgd or
1 3 mil l ion dollars for 8 7 mgd Included in this cost is construction of wells, pumps houseswell field piping, access roads telemetry and standbv power
Although both costs are approximations and do not include engineering legaladministrative, land acquisition and contingency costs, it appears that the cost for replacing
the TCE contaminated wells will be less than the cost for providing treatment for TCEremoval Furthermore, if the Downtown well field is expanded to meet future pumpingrequirements including the possible replacement of the TCE contaminated wells, it will be
very difficult to establish land management practices to protect the aquifer in an existingurban setting It is therefore recommended that additional water supply be developed
«w i-»outside of the Citv £ 9
•" 9** M»H* ^O inS-4
IV - 10 *>S

1
fe 100
1
50
10
H 5°CO
8Js2«^Jw
J| 1 0
0 5
0 10
X
s*
s
/'
05 10
*
/
/
/
50 10
«
50 100
FLOW(MGD)
COST CURVE ($1989) DEVELOPEDFROM INFORMATION FROM EPA(3)
»
e>*
COLUMBUS WATER STUDY £
CAPITAL COSTS FOR TCEUTILIZING PACKED TOWER
WEE NO 900494
REMOVAL 6AERATION c
FIG. IT- 4
> (ft
\l

NORTH ALTERNATIVE SITE The aquifer in the vicinity of existing Well No 14 nearLake Babcock has the potential to be developed as the City's long-term source of supplyThis alternative site is identified as the North Alternative Site on Figure IV-3 This aquiferis split by a blue clay layer from approximately 100 to 110 feet in depth with Well No 14'sscreen placed only in the lower gravel formation The water from this well has the lowestmanganese level (0 12 mg/1) of any of the City's wells currently in service The water is veryhard, with trace levels of dissolved iron Thick clay deposits to approximately 40 feet indepth separate Lake Babcock and the Loup River Power Canal from the aquifer Staticwater level at Well No 14 in March, 1990 was reported to be 77 feet below the land surfacein the vicinity
The presence of the lake limits farming in the vicinity adding to the protection of theaquifer from nitrate and other contamination in the vicinity The thick clay cover turther
helps protect the aquifer from non-point source nitrate contamination The aquifer is verypermeable in this vicinity, with Well No 14 having an initial well specific capacity of 375gpm/ft of drawdown and a 1,500 gpm pumping rate Another favorable feature of this areais that a 3 million gallon storage tank exists next to Well No 14 connected to the City witha 24-inch diameter pipe line
Although the North Alternative Site appears to have several advantages it may have limnedcapacity The thick clay deposits which separate Lake Babcock and the Loup River PowerCanal from the aquifer may severely limit the recharge from these sources, limiting the total
yield potential of the aquifer in the area Currently, Well No 14 has a nitrate-nitrogenconcentration of 0 1 mg/1 As described previously, this area is provided with protectionfrom non-point source contamination by the lake and by the thick clay deposits Additionalprotection could be obtained from a Wellhead Protection Plan However, if recharge fromthe lake and canal is limited, the development of a well field in this area could create adepression of the hydraulic gradient The depression could result m the migration of nitratecontaminated water into the area from areas bevond those which would be protected ^ _.
2?IV - 12 § <S

A possible approach in this area may be to construct a series of 2 mgd wells at well spacingsof approximately 1,500 feet Development would begin south of Lake Babcock in thevicinity of Well No 14, spread to the east crossing the Loup River Power Canal and extendnorth along the east side of Lake Babcock and Lake North This suggested developmentplan must be confirmed by aquifer testing
Groundwater quality data in this vicinity were available from the City's records of Well No14, previous data collected during the development of Well No 14, sample data collectedas part of this study, and data from the Lower Platte North Natural Resources District Thisinformation was used to project the quality of water in this aquifer and is summarized inTable IV-2
SOUTH ALTERNATIVE SITE The area south of the Loup River and east of Highwa\81 shows favorable geologic and hydrologic conditions to warrant consideration as analternative water supply area This area is identified as the South Alternative Sue on FigureIV-3
Water quality conditions in this area dictate that wells be located close to the Loup Riverrather than further south towards the Platte River, since the general water quality of theLoup River is better than that of the Platte River with a lower total dissolved solidscontent In most years, the water flows in the Loup River would supply a substantial
majontv of the recharge to the aquifer, assuming the well field was properly designed The
Loup River also serves as a hydrologic barrier for the migration of contaminants from thedowntown area located north of the river The Loup River and Platte River combined mavalso provide a hydrologic barrier for the migration of contarrunants from the west
A possible disadvantage of the south site is that trace levels of atrazine have been detectedin the Platte River down stream from Columbus and in the Loup River Power CanalHowever, most of the Loup River drainage basin is used for range land, and therefore is not ^ Q
>-» 3-
IV-13 f foo nro -f

extensively treated with pesticides Provisions could be made for the addition of powderedactivated carbon, carbon filtration or ozone oxidation in the future to remove trace levels
of atrazme or other chemicals if they were present in the water supply at levels exceedingthe Federal regulations
A disturbing trend is that as irrigation expands in the Loup River water shed, both withsurface water impoundments and irrigation wells equipped with center pivots, the flow ofthe Loup River system is decreasing There may be in the future a few days or even severalweeks of no flow in the Loup River channel Consequently, this would impact the rechargeto the wells It appears, however, that the aquifer thickness should be sufficient to supportthe well vield for several weeks
One possible approach in this area would be to construct a series ot 1 mgd wells at wellspacings ranging from 400 to 1,000 feet This suggested development plan must beconfirmed by aquifer testing the same as of the North Alternative site
The closest known high nitrate concentration in the groundwater to the south site is locatedapproximately 1 5 miles to the west of the proposed well field area The City's wastesatertreatment plant outfall would limit well development to the east of the site Some zoning
wellhead protection, or land management conirol should be exercised if the south a l ternate eis selected for the future water supplv
The closest available groundwater quality data in this vicinity was available from the Citv'srecords of the Downtown well field and data from the Lower Loup Natural ResourcesDistrict This information was used to project the quality of water in this aquifer which issummarized in Table IV-2
IV - 14 g o»IV) *£ 3CO w

TABLE IV-2ALTERNATIVE SUPPLY SITESPROJECTED QUALITY DATACOLUMBUS WATER STUDY
North SouthAlternative Alternative
Parameter Site Site
Calcium (mg/1) 125 100Chloride (mg/1) 5 50Fluonde (mg/1) 04 04Iron (mg/1) 03 07Manganese (mg/1) 01 05pH 80 78Nitrate (mg/1 as N) < 1 < 1Sodium (mg/1) 20 30Sulfate (mg/1) 25 75Alkalinity (mg/1 as CaCO3) 350 280Hardness (mg/1 as CaCO3) 330 290Total Dissolved Solids (mg/1) 420 435
WELL FIELD COSTS
The costs associated with aquifer testing, and well field construction for the NorthAlternative Site and the South Alternative Site are presented in Table 1V-3 Aquifer test ing
costs include piezometer installations, test pumping, data collection and data analysis TheSouth Sue testing costs also include the construction of a test well, whereas existing \VellNo 14 will be used as the test well in the North Site study Well field construction costsinclude wells pumps, houses, well field piping, access roads, telemetry, standby power,engineering, land acquisition around the pump houses and contingency costs for theproposed well field developments described previously The well field construction costs donot include primary electrical service, electrical power distribution and electrical substationsOperation and maintenance costs include labor, power and maintenance material for an
%k-average daily demand of 7 5 mgd £•-»
IV - 15 8

TABLE IV-3WELL FIELD COSTS
COLUMBUS WATER STUDY
North Site South Site
Aquifer Testing $37,000Well Field Construction S4.600.00Q
$56,000S6.600.000
Total Capital Costs
Annual Operation &Maintenance
$4,637,000
$172,000
$6,656,000
$203,000
IV- 16 O y>ro :+» 300 («01 •+
SECTION VWELLHEAD PROTECTION PROGRAM
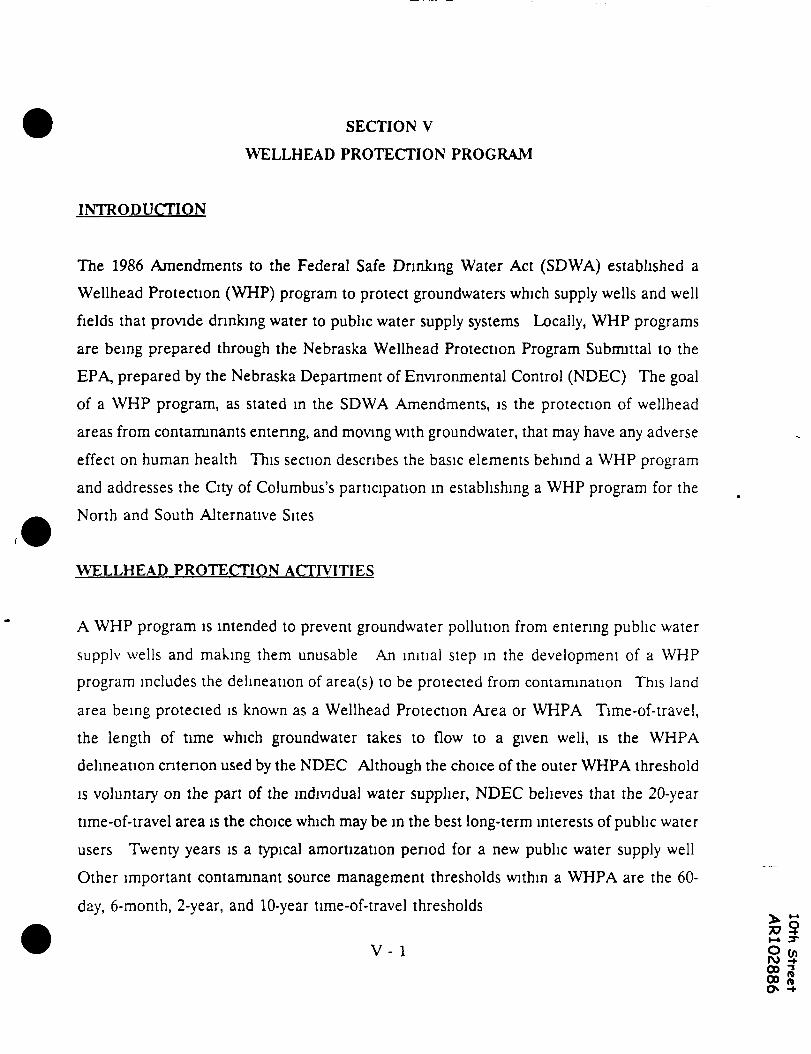
INTRODUCTION
The 1986 Amendments to the Federal Safe Drinking Water Act (SDWA) established aWellhead Protection (WHP) program to protect groundwaters which supply wells and wellfields that provide drinking water to public water supply systems Locally, WHP programsare being prepared through the Nebraska Wellhead Protection Program Subnuttal to theEPA, prepared by the Nebraska Department of Environmental Control (NDEC) The goalof a WHP program, as stated in the SDWA Amendments, is the protection of wellheadareas from contaminants entering, and moving with groundwater, that may have any adverseeffect on human health This section describes the basic elements behind a WHP programand addresses the City of Columbus's participation in establishing a WHP program for theNorth and South Alternative Sites
WELLHEAD PROTECTION ACTIVITIES
A WHP program is intended to prevent groundwater pollution from entering public water
supplv wells and making them unusable An ini t ia l step in the development of a WHPprogram includes the delineation of area(s) to be protected from contamination This land
area being protected is known as a Wellhead Protection Area or WHPA Time-of-travel,the length of time which groundwater takes to flow to a given well, is the WHPAdelineation criterion used by the NDEC Although the choice of the outer WHPA thresholdis voluntary on the part of the individual water supplier, NDEC believes that the 20-yeartime-of-travel area is the choice which may be in the best long-term interests of public waterusers Twenty years is a typical amortization period for a new public water supply wellOther important contaminant source management thresholds within a WHPA are the 60-day, 6-month, 2-year, and 10-year time-of-travel thresholds
828sO •+

To estimate tune-of-travel radii, the NDEC uses a cylindrical displacement formula Thismethod does not attempt to deal directly with hydraulic conductivity Instead, it assumesthat with time, a pumping well gradually empties the water from a cylinder-shaped volumeof aquifer whose axis is the well This method also assumes that groundwater flows inwardto replace the removed water such that there is no change in the saturated thickness of theaquifer The formula used is as follows
L =
Where L = time-of-travel threshold, in feetQ = Pumping rate, cubic feet/dayt = time-of-travel (time of travel in days)n = Effective porosity, assumed by NDEC to be 02 for
alluvial aquifersb = Aquifer thickness, in feetTT = 3 1416
Important activities that are required for the establishment of a WHP program include
Analysis of existing groundwater field dataDelineation of WHPAs
Education of economic development entities concerning WHPContaminant source inventoryMarking of WHPA boundariesSupplementary water testing in existing wellsHydrogeologic field investigationsConstruction and sampling of groundwater monitoring wellsSiting of new supply wells
00 to

Contaminant source managementPurchase of land or certain rights attached theretoRelocation of water supply wells or potential contaminant sourcesCompensation for condemned property or other rights
Although WHPAs are shown on a map as ground surface areas, they are actually threedimensional, including portions of the groundwater aquifer, the unsaturated soil above thewater table, the atmosphere, and any surface water passing near the public water supplywell
COLUMBUS WELLHEAD PROTECTION ALTERNATIVES
WHP programs presented in this section were developed for the two potential alternativesites in this study, by calculating 60-day, 6-month, 2-year, 10-year, and 20-year time-of-travelthresholds for both the North and South Alternative Sites The scenario presented for bothsites uses the average day pumpage requirement of 7 5 mgd as projected for the year 2010
and total aquifer thicknesses identified on maps prepared by the Conservation and SurveyDivision of the University of Nebraska The North Alternative Site was developed using a10-well well field at spacings of approximately 1,500 feet The South Alternative Site wasdeveloped using a 20-well well field at spacings of approximately 700 feet The calculatedtime-of-travel radii for the average day requirement as well as the maximum davrequirement 20 mgd are presented in Table V-l with the 10-year and 20-year thresholds foraverage day requirements illustrated in Figure V-l The 10-year and 20-year time-of-travelthresholds for the existing downtown well field, as determined by the NDEC, are illustratedin Figure V-2 The NDEC utilized pumping records and drilling logs obtained from the Cityin their calculations of time-of-travel thresholds
O (ftIt

10th StreetAR102889
10 YEAR^TIME-OF-TRAVEL LIMITS
NORTH ALTERNATIVESITE
TIME-OF-TRAVEL LIMITS
SOUTH ALTERNATIVE »SITEYEAR
-OF-TRAVEL LIMITS
COLUMBUS WATER STUDYflME-OF-TRAVEL LIMITS
ALTERNATIVE SITESITIME-OF-TRAVEL LIMITS

XISTING WELL
20 YEARTIME-OF-TRAVEL LIMITS
10 YEARTIME-OF-TRAVEL LIMITS
EXISTING WELL
-^EXISTING DOWNTOWNWELL FIELD
COLUMBUS WATER STUDYTIME-OF-TRAVEL LIMITS
EXISTING WELLS
WEE NO 900494068ZOI8V

TABLE V-l
WHP TIME-OF-TRAVEL THRESHOLDS
COLUMBUS WATER STUDY
Time-of-Travel
60-day6-month
2-year10-year20-year
NORTH Al
North Site7.5 mgd
310540118030624480
TERNATIVE SITE The
North Site20 mgdTime-of-Travel
tfeert
50591021405227
7540
North Alternative
South Site75 mgd
Thresholds
21036786521403092
Site may be suitable
South Site20 mgd
3416761517
35975155
for thedevelopment of a WHPA Since the regional direction of groundwater flow is fromnorthwest to southeast, the presence of Lake Babcock to the north and west of thisalternative serves as a barrier to the movement of both point and non-point sourcecontamination into this area The thick clay deposits above the aquifer also act to impedethe movement of nitrates down into the main water-bearing strata
The land area that does surround this alternative is either agricultural or rural-residentialA preliminary survey of the area indicated major point-sources of contamination to beminimal The Columbus Campus of the Plane Technical Community College, as well asseveral rural subdivisions are located within the 20-year and 10-year time-of-travelthresholds Neither, however, appear to pose any significant contamination threat A smallfeedlot operation was observed approximately 1/2 to 3/4 of a mile southeast of this siteHowever, its location is hydrauhcally downgradient and should not pose an immediate -v ~
g 5V - 6 § < ?oo 3vo £

contamination threat Groundwater quality monitoring would be capable of detecting theinflow of contaminants from this potential source
To enhance continued protection against the locating of contamination sources into thisWHPA, the purchase of available land or certain rights attached to the land should beconsidered
Zoning ordinances should also be adopted to prevent the locating of contaminant sourcesinto this area Agricultural best management practices (BMPs) would help to keep nitratelevels from increasing
SOUTH ALTERNATIVE SITE The South Alternative Sue appears to be a somewhatmanageable WHPA, although a higher potential for groundwater contamination does existThe Loup River acts as a hydrologic barrier to the movement of contamination from thenorth and northwest The time-of-travel thresholds for the South Alternative Sue weredrawn to reflect this hydrologic barrier However, with the major TCE contamination thatexists north of this site and documented reductions in the seasonal flow of the Loup River,it cannot be assumed the contamination which has occurred in the Downtown well field willnot move into this area A contingency plan may be necessary to provide for a source ofuseable water should this scenario occur
Another potential non-point source of contamination is the high concentrations of nitrates
that have been found in wells west of this area Groundwater wells as near as 1 5 milesfrom this site have been found to contain concentrations of nitrates as high as 34 0 mg/1 asnitrogen From preliminary hydrogeologic data, it appears that flows of the Plane and LoupRivers could create a localized gradient that may keep the high levels of nitrate fromentering this WHPA However, maximum pumping of this well field during dry years maycreate a gradient that could pull in the higher nitrate levels
V - 7 » Sr\> •+

A thorough groundwater monitoring plan should be adopted to ensure detection of thepotential migration of nitrates into this WHPA
The land area surrounding the South Alternative Site is a combination of agricultural andcommercial to the west, residential and commercial to the northwest and north, andresidential, agricultural, and light manufacturing to the east The Platte River borders theSouth Alternative Site on the south A preliminary site survey of the area indicated severalcommercial businesses within the 20-year and 10-year time-of-travel areas are of a naturethat may contain above and/or underground storage tanks These businesses include avehicle body shop that may have previously been a gas station and a trading post that mayhave previously sold gasoline The City of Columbus's wastewater treatment plant andoutfall is located directly across the Loup River at the eastern edge of the well fieldAlthrough this location is hydrauhcally downgradient from the South Alternative Sue,development of the well field should not extend to the east past the treatment plant outfall
WHP DEVELOPMENT COST PROJECTIONS
Preliminary budgetary estimates of costs associated with establishing a WHP program atthese two alternative sites suggest the North Alternative Site to be a more cost-effectiveoption As a result of the South Alternative Site's location adjacent to the Columbus cnvlimits, a WHP program at this site would require a potentially lengthy contaminant sourceinventory, a comprehensive zoning ordinance to prevent the locating of any new potentialcontaminant source into the WHPA, and a contingency plan to locate and develop alternatesources of potable water capable of providing water should a loss of all or part of the supplyoccur Until such time as a WHP program is designed and detailed alternatives analyzed,a meaningful estimate of costs or cost comparisons does not appear feasible However,according to the Nebraska Wellhead Protection Program Subrmttal to EPA, a public watersupplier in 1989-90 who owns five wells, inventories 25 management sources, and installs 15monitoring wells 150 feet deep could expect to spend approximately $30,000 for a WHP £
V 8 8V - 8 0>jo00

program The same supplier who spends about $1,000 every two years to test water qualityat each of the 15 monitoring wells would spend approximately $8,000 on water qualitytesting in 1989-90
V - 9CO
SECTION VIWATER TREATMENT
INTRODUCTION
Considering the water quality of the sources identified for the City of Columbus as possiblewell field alternatives, treatment alternatives are available to attain the water quality goalscomplying with the Safe Drinking Water Act Possible treatment schemes include hardnessreduction, iron and manganese reduction or disinfection A description of these treatmentschemes including discussions of solids handling and treatment costs are presented in thissection
TREATMENT PLANT SIZE
*
The design capacity of a treatment plant should be adequate to meet the future maximumday demand requirements projected for the study period Based on this criteria, a treatmentplant with a design capacity of 20 mgd will be needed to meet the maximum day demandprojected for the City of Columbus in 2010 Therefore, for the purpose of this study,individual unit processes have been preliminarily sized to meet this demand in accordancewith standard design practices
TREATMENT ALTERNATIVES AND SOLIDS HANDLING
Three treatment alternatives are discussed in this section Alternative I - HardnessReduction, Alternative II - Iron and Manganese Reduction, and Alternative III -Disinfection only Each alternative will meet the requirements of the 1986 Safe DrinkingWater Act and amendments for both MCLs and SMCLs The key differences between thealternatives are the amounts of hardness and iron and manganese removed Solids handlingfor each alternative when applicable is also discussed ^ ^
V I - 1 ||»
Si

ALTERNATIVE I - HARDNESS REDUCTION This treatment alternative consists ofa water treatment system incorporating lime softening, coagulation, sedimentation,recarbonation, rapid sand filtration, and disinfection These processes are illustrated inFigure VI- 1
Lime Softening Lime softening, coagulation and sedimentation will occur in solidscontact basins, which have proven to be an efficient and effective method for softening andclarification Each umt combines the process of mixing, coagulation, flocculation andsedimentation in a single-compartmented tank
Hardness is caused by divalent metallic cations Such ions are capable of reacting w ith soapto form precipitates and with certain amons present in the water to form scale Theprincipal hardness-causing cations are calcium and magnesium, with ferrous iron andmanganous ions also contributing hardness By selectively removing calcium hardnessthrough the addition of quicklime (CaO) to water, total hardness can be reduced to a finalhardness of 50 mg/1 to 60 mg/1 as calcium carbonate (CaCO3) However, softening to thisdegree is not normally provided by municipalities Therefore, for this study, the hardnesswas assumed to be reduced from approximately 310 mg/I to 175 mg/1 as CaCO3 Theequations illustrating the selective calcium removal softening process are illustrated below
CaO + H:O - Ca(OH):
Ca(HCO3), + Ca(OH)2 - 2 CaCO3 i + 2 H2OThe calcium is removed as a carbonate precipitate A secondary benefit to the lime
softening process is the removal of iron and manganese as carbonate precipitates
At maximum water production of 20 mgd, four solids contact basins will be operated inparallel At average water production of 7 5 mgd, only two solids contact basins will beoperated in parallel In each case, lime and alum will be added Alum will also be usedto help solids coagulate and settle

,W WATERLIME AND ALUMADDITION (TYP) SOUDS
CONTACTBASIN
SOUDSCONTACTBASIN
SOUDSCONTACTBASIN
SOUDSCONTACTBASIN
CO, ADDITION-
iFILTERS
RECARBONATIONBASINS
I
1FILTERS FILTERS FILTERS
i-DISINFECTION
ICLEARWELL
I
TO DISTRIBUTION SYSTEM
COLUMBUS WQTER STUDY
HARDNESS REDUCTION TREATMENTALTERNATIVE FLOW SCHEMATIC
WEE NQ900494 FIG TH-\

Recarbonation Recarbonation is required to stabilize the softened water Softenedwater is normally super-saturated with calcium carbonate which will precipitate as scale onfilter media and in pipelines Precipitation of calcium carbonate can be minimized byconverting carbonate ions (CO3
=) to a bicarbonate (HCO3~) form Association of thebicarbonate and calcium ions results in formation of a relatively soluble calcium bicarbonate(Ca(HCO3)2) compound The equation below summarizes the overall chemical reactioninvolved in this stage of the recarbonation process (addition of carbon dioxide)
CO, + CaCO3 + H,O - Ca(HCO3),
The proposed recarbonation system for this treatment alternative will consist of two basinsusing liquid CO, as the CO, source
The solids contact basins previously described for lime softening and the basins describedfor recarbonation were preliminarily sized to treat all water passing through the plant Sinceselective softening can produce a water softer than the assumed effluent, another hardnessreduction alternative may be to provide a higher degree of softening for part of the waterfollowed with blending to reduce the recarbonation requirement If contact time is providedfor the blended water, this may also provide the desired iron and manganese removal forthe by-pass water Pilot studies must be performed to confirm this possibility and clanfvpossible advantages
Filtration Rapid sand filtration, utilizing four filters, will be employed for removal
of nonsettleable floe and impurities remaining after chemical coagulation and sedimentationof the softened water in the solids contact basins The suspended particles removed in thefiltration process will consist of hardness and iron and manganese precipitates
£

Clearwell A clearwell, with a capacity of 750,000 gallons, will serve two purposesto provide adequate chlorine contact time for disinfection and to relieve the filters fromhaving to accommodate fluctuations in water demand
The treatment system must provide for a 4 log (99 99 percent) mactivation of viruses Thehardness reduction and filtration process in a well-operated conventional plant is expectedto have a 2 log (99 percent) virus removal Therefore, the disinfection system must providefor the remaining 2 log virus mactivation Disinfection will be achieved by free chlorineresidual
Virus mactivation by disinfection is achieved through the disinfectant concentration and thecontact time referred to as CT Contact time, T, is the time in minutes it takes water duringpeak hourly flow, to move between the point of disinfectant application and a point whereresidual disinfectant concentration, C, is measured prior to the first customer Residualdisinfectant is the concentration of the disinfectant in mg/1 at a point before or at the firstcustomer, which is the water treatment plant
CT for a given log mactivation of viruses and pH range is dependent on water temperatureFor example, at 2 log virus mactivation and a water temperature of 5°C and a pH in therange of 6-9, the required CT is 4, at a water temperature of 20°C and a pH in the range
of 6-9, the required CT is 1 The CT for this alternative will vary between 1 and 4 since the
water temperature and pH will vary between the limits previously discussed The clearwellwill be baffled to assure that the required CT is maintained
Solids Handling Solids will be generated from the solids contact basins sludge andfilter backwash water as shown in Figure VI-2 These solids will be primarily calciumcarbonate with a pH between 10 and 11 The estimated solids production is 3000 poundsof dry solids for million gallons of water produced
I-* 3-O en
VT <; ^ H-1 " 5 3

RAW WATER SOLIDSCONTACTBASIN
RECARBONATIONBASIN
xCO
CD
RAPID SANDFILTER
a:
EQUALIZATIONBASIN
OVERFLOW RETURN
SLUDGE
OVERFLOW RETURN
FILTRATE TO SANITARY SEWER
BELTFILTERPRESS
DEWATERED SLUDGEHAULED TO LANDFILL
SLUDGETHICKENER
THICKENEDSLUDGE
TODISTRIBUTIONSYSTEM
SEDIMENTATIONBASIN
SLUDGE
COLUMBUS WATER STUDYHARDNESS REDUCTION
SOLIDS HANDLING FLOW SCHEMATIC
WEE NQ9 00494 FIG -2
0063018V

Filter backwash water will be returned to the headworks of the treatment plant after beingtreated Backwash water will be first discharged to one equalization basin, and thenpumped at a constant rate to one sedimentation basin Overflow from the basin will berecycled to the head of the plant Basin sludge will be discharged to two gravity thickenersSludge from the solids contact basins will be discharged to the same two gravity thickenersthickening solids from the sedimentation basin
Gravity thickener solids will be dewatered by two belt filter presses Overflow from thegravity thickeners will be recycled to the head of the treatment plant Dewatered solids,estimated at between 50 and 60 percent solids, will be disposed at a landfill or in a landapplication program Belt press filtrate will be discharged to the sanitary sewer system Fora treatment facility associated with and located near the North Alternative Well Field Sue,a sanitary sewage pump station and forcemam will be required
ALTERNATIVE II - IRON AND MANGANESE REDUCTION This treatmentalternative consists of aeration, pH adjustment, oxidation and detention, rapid sandfiltration, and disinfection The processes are illustrated in Figure VI-3
Aeration Aeration is desirable to introduce oxygen to aid in the oxidation of iron
and manganese ions to their relatively insoluble state Aeration also removes a portion ofthe carbon dioxide and hydrogen sulfide that is commonly present in groundwaters, thereby
raising the pH and contributing to the oxidation process The resulting insoluble ferric andmanganic compounds are then mechanically removed by filtration
A total of six aerator units will be required at maximum water production with two aeratorsbeing used at average water production
51V , - 7 f?
o 8

^ —— RAW WATER
' ,-LJL, r-UJ- *or o: or on ccO O O O O£ I § § 1hJ UJ LU UJ Ld
D:
1Ul
T T TTTi '
DETENTION TANK
i '
i i r
- —— NaOH ft. Clj FEED
«
i
FILTERS FILTERS FILTERS FILTERS
t————— DISINFECTION
CLEARWELL
' —— i ——TO DISTRIBUTION SYSTEM
! '
[!T| COLUMBUS WATER STUDY
@ IRON AND MANGANESE REDUCTION TREATMENTALTERNATIVE FLOW SCHEMATIC
(Z| WEE.N0900494 FIG "21 - 3
AR
102902

pH Adjustment. Oxidation and Detention Aerated water will be discharged to atank with a detention time of approximately one hour Chlorine will be added to oxidizethe iron and manganese The pH will be adjusted to 9 0 to 9 5 with sodium hydroxide, toenhance the rate of oxidation of manganese The one-hour detention will allow sufficienttime for oxidation to proceed and for oxidized iron and manganese to agglomerate to afilterable size The length of detention must be confirmed by pilot plant studies
Rapid Sand Filtration Rapid sand filtration, using four filters, will be used toremove insoluble ferric and manganic compounds The coating of the oxidized manganeseoxide on the filter media also serves as a catalysis to adsorb and oxidize residual solublemanganese in the applied water All that is required is to have the manganous ions in thewater come in contact with previously precipitated manganese oxide The autocatalyticaction is "self serving", producing additional manganese oxide at pH's above 8, and therebymaking more of it available for further adsorption of any manganous ions that may bepresent in the water
Clearwell The clearwell, with a capacity of 750,000, will provide adequate chlorinecontact time for disinfection and will relieve the filters from having to follow fluctuationsin water demand
The treatment system must provide for a 4 log mactivation of viruses The iron andmanganese oxidation followed by filtration is expected to have a 1 log (90 percent) virusremoval Therefore, the disinfection system must provide the remaining 3 log (99 9 percent)virus mactivation Disinfection will be achieved by free chlorine residual The CT for thisproject will vary between 2 at 20°C and 6 at 5°C The clearwell will be baffled to assurethat the required CT is maintained
l-» 3-
o o>VI - 9 |

Solids Handling Solids will be generated from the filter backwash water Thesesolids will be primarily ferric and manganic precipitates The estimated solids productionis 20 pounds of dry solids per million gallons of water produced
Filter backwash water will be returned to the headworks of the treatment plant after beingtreated Backwash water will be first discharged to one equalization basin The water willthen be pumped at a constant rate to one sedimentation basin Overflow from the basin willbe recycled to the head of the plant Basin sludge will be discharged to the sanitary sewersystem For a treatment facility associated with and located near the North Alternative WellField Site, a sanitary sewage pump station and forcemam will be required
ALTERNATIVE III - DISINFECTION This treatment alternative includes thedisinfection of well water by free residual chlorine, and is applicable only to the NorthAlternative Well Field Site Water at this site has lower iron and manganese levels whichat this time are generally acceptable for public water systems Since the iron andmanganese concentrations are low, chlonnation of the water may not cause an appreciableamount of ferric and manganic compounds to precipitate in the reservoirs or distributionsystem If deposition of iron and manganese is a problem, sequestering agents may berequired to minimize the problem Pilot studies will be required to confirm the necessityand type of sequestering agent necessary The iron and manganese concentrations in thewater at the South Alternative Well Field Sue are considerably higher, exceeding theSMCLs Therefore, treatment by disinfection alone will not be considered for the South
Site
Each well will have its own disinfection system Disinfection will be achieved by freechlorine residual The disinfection system must be capable of 4 log mactivation of virusesand CT for this project will vary between 3 at 20°C and 8 at 5°C
The required CT can be achieved in the transmission line for those wells located the >>farthest distance from the storage reservoir Wells located close to the reservoir will most o
VOlikely need additional contact time, which can probably be provided in the reservoir The o
VI - 10

available reservoir contact time will need to be verified either by tracer studies ortheoretical calculations
TREATMENT ALTERNATIVES AND SOLIDS HANDLING COSTS
Capital costs and operation and maintenance costs for each treatment alternative areprovided m Table VI-1
TABLE VI-1TREATMENT COSTS
COLUMBUS WATER STUDY
Treatment Alternative Estimated Capital Costs Estimated Annual O&M Costs
I - Hardness Reductionand Solids Handling $17,458,000* $968,000
III - Iron and ManganeseReduction and SolidsHandling $12,687,000' $496,000
III- Disinfection (10 wells) $590,000 $102,000
* Estimated capital costs include $225,000 for a sanitary sewage pump station andforcemam required for a treatment facility associated with the North Alternative Well FieldSite
Capital costs include construction, contingencies, engineering, land, legal, fiscal, andadministrative costs, and interest during construction Operation and maintenance costsinclude labor, power, maintenance material, fuel, chemicals, and sludge disposal whenapplicable, based on an average daily flow of 7 5 mgd
v i - n o »Si01 5
SECTION VIIDISTRIBUTION SYSTEM AND WATER STORAGE
INTRODUCTION
The City of Columbus currently has approximately 110 miles of water mam pipe and 5 5million gallons of ground level and elevated storage in the distribution and storage systemComputer modeling and analysis of the distribution and storage system was performed todetermine the capabilities of the existing system and the required improvements for thefuture system to satisfy various flow requirements A description of the existing system anda phased improvement program for the distribution and storage system is included in thissection
MUNICIPAL FIRE PROTECTION REQUIREMENTS
As part of the procedures in establishing fire insurance rates in a community, the GeneralInsurance Services Office (ISO) has developed a standard schedule for gradingmunicipalities with regard to their fire defenses and physical conditions Fire defenses areweighted for evaluation on the basis of 40 percent for water supply, 50 percent for firedepartment, and 10 percent for receiving and handling fire alarms The reliability andadequacy of the following major water supply items are considered in the evaluation watersupply works, water supply main capacity, and fire hydrant distribution, type, and condition
All of the components' functions m supplying required fire flows are evaluated The mostrecent ISO survey for Columbus, Nebraska, was in November of 1984 in which the Cityscored a 65 48 percent credit out of a possible 100 points A copy of the ISO report on the1984 survey is included in the Appendix
REQUIRED FIRE FLOWS Required fire flows are based on the rate of flow neededto confine a major fire to the buildings within a block or other group complex
2iVII - 1 o ttro -«•

Determination of this flow depends on size, materials of construction, occupancy, andexposure of the buildings within and surrounding the block The minimum and themaximum basic fire demands for a single fire are 500 gpm and 3,500 gpm, respectively Themaximum basic fire flow is used by the ISO in determining the classification of the City, butis not necessanly the highest required fire flow condition in the municipality Protectionavailable for locations with fire flow requirements greater than the 3,500 gpm basic fire flowis also considered in the ISO grading schedule, but with a smaller potential deficiencyRequired fire flow at locations tested within the city by the ISO in 1984 ranged from a lowof 1,000 gpm in various residential areas to a high of 5,500 gpm in some industrial andcommercial areas
Since a municipality will have domestic and commercial water demands at the same timewhen fighting fires, an adequate system must be able to deliver the required fire flow forthe specified duration, plus provide for municipal consumption at the maximum daily rateThe maximum daily consumption is defined by the ISO as the greatest total amount of waterused during any 24-hour period in the past three years, expressed in gallons per minute
Duration Major components of the water system must have the ability to deliver themaximum daily consumption rate for several days, plus the required fire flow for the number
of hours specified at any time during this interval The period may be five, three, or twodays, depending on the system component under consideration and the anticipated out-of-
service time needed for maintenance and repair work The required fire flow durationdepends on the rate of flow required and is as shown IP Table VII-1

TABLE VIMREQUIRED DURATION FOR FIRE FLOW
COLUMBUS WATER STUDY
Required Fire Flow Required Duration(Gallons per Minute) (Hours')
5,500 55,000 54,500 44,000 43,500 33,000 32,500 and less 2
Pressure The pressure in a distribution system must be high enough to permitpumper trucks to obtain adequate flows from hydrants In general, a minimum residualpressure of 20 psi is required during flow to overcome friction loss in the hydrant andsuction hose Higher pressure is needed where pumper trucks are not used
WATER SUPPLY CAPACITY In evaluating a system, the ability to maintain themaximum daily consumption rate plus fire flow at minimum pressure, is considered with oneor two pumps out of service To have no insurance grading deficiency, the capacityremaining with the two most important pumps out of service, in conjunction with storage,must provide this flow for the specified duration any time during a five-day maximum
consumption period In evaluating the contribution of stored water, only the normalminimum daily amount maintained is considered available for fire fighting In determiningthe fire flow from storage, it is necessary to calculate the rate of delivery Even though theamount available in storage may be great, the flow to a hydrant cannot exceed the carryingcapacity of the mains, and the residual pressure at the point of use cannot be less than 20
psi
VII - 3 8O00

DISTRIBUTION SYSTEM Proper layout of supply mains, arteries, and secondarydistribution feeders is essential for delivering required fire flows The lines must beproperly spaced, sized, and looped for mutual support and reliability of service Further,the system must be equipped with a sufficient number of valves so that a pipeline breakdoes not affect more than one-quarter mile of arterial mains, 500 feet of mains incommercial districts, or 800 feet of mains in other districts
Spacing of fire hydrants is based on required fire flow with the average area served notexceeding that given in Table VII-2 Hydrants must have at least two outlets, one must bea pumper outlet and the other must be at least 2-1/2 inch nominal size The streetconnection, not less than six inches in diameter, must be provided with a gate valve to allowease of maintenance The shutoff valve in a hydrant must be designed to remain closed ifthe barrel is broken
TABLE VII-2STANDARD HYDRANT DISTRIBUTION
COLUMBUS WATER STUDY
Fire Flow Required Avg Area/Hydrant(GPM) (Square Feet)
1,000 or less 160,0001,500 150,0002,000 140,0002,500 130,0003,000 120,0003,500 110,0004,000 100,0004,500 95,0005,000 90,0005,500 85,000
VII - 4
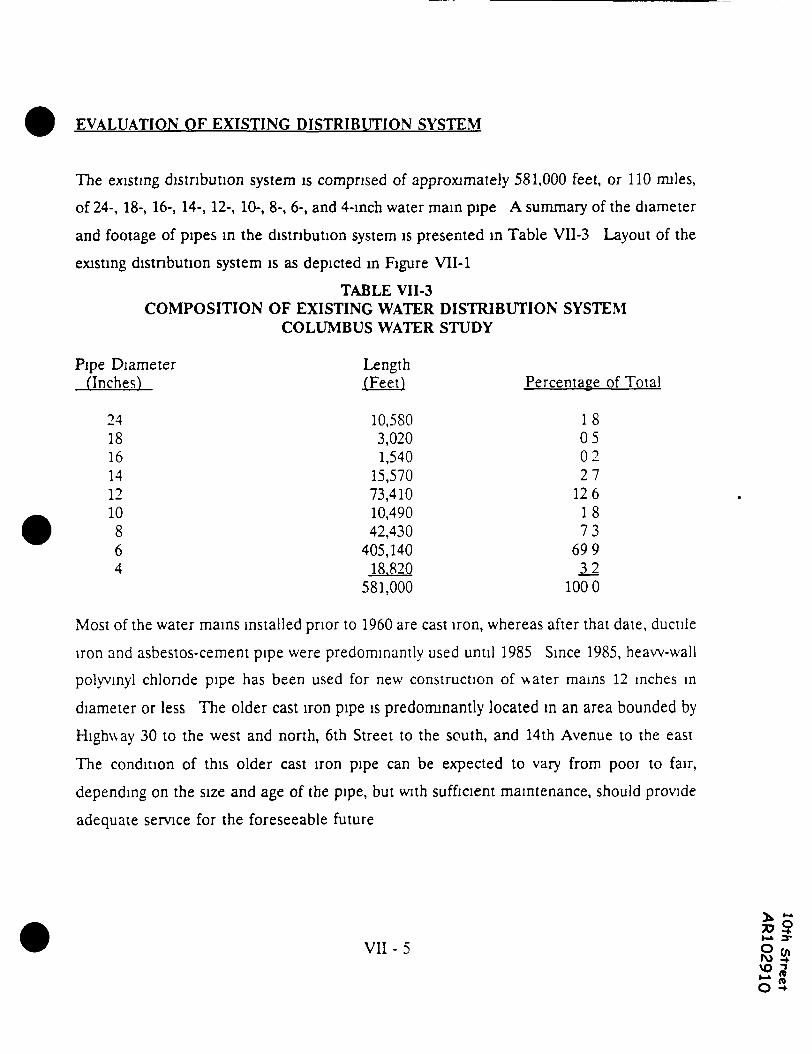
EVALUATION OF EXISTING DISTRIBUTION SYSTEM
The existing distribution system is comprised of approximately 581,000 feet, or 110 miles,of 24-, 18-, 16-, 14-, 12-, 10-, 8-, 6-, and 4-inch water main pipe A summary of the diameter
and footage of pipes in the distribution system is presented in Table VII-3 Layout of theexisting distribution system is as depicted in Figure VII-1
TABLE VII-3COMPOSITION OF EXISTING WATER DISTRIBUTION SYSTEM
COLUMBUS WATER STUDY
Pipe Diameter Length(Inches) (Feet) Percentage of Total
24 10,580 1818 3,020 0516 1,540 0214 15,570 2712 73,410 12610 10,490 188 42,430 7 36 405,140 6994 18.820 12
581,000 1000
Most of the water mains installed prior to 1960 are cast iron, whereas after that date, ductileiron and asbestos-cement pipe were predominantly used until 1985 Since 1985, heaw-wallpolyvmyl chloride pipe has been used for new construction of water mams 12 inches in
diameter or less The older cast iron pipe is predominantly located in an area bounded byHighway 30 to the west and north, 6th Street to the south, and 14th Avenue to the east
The condition of this older cast iron pipe can be expected to vary from pooi to fair,depending on the size and age of the pipe, but with sufficient maintenance, should provideadequate service for the foreseeable future
V l l - 5
sio "
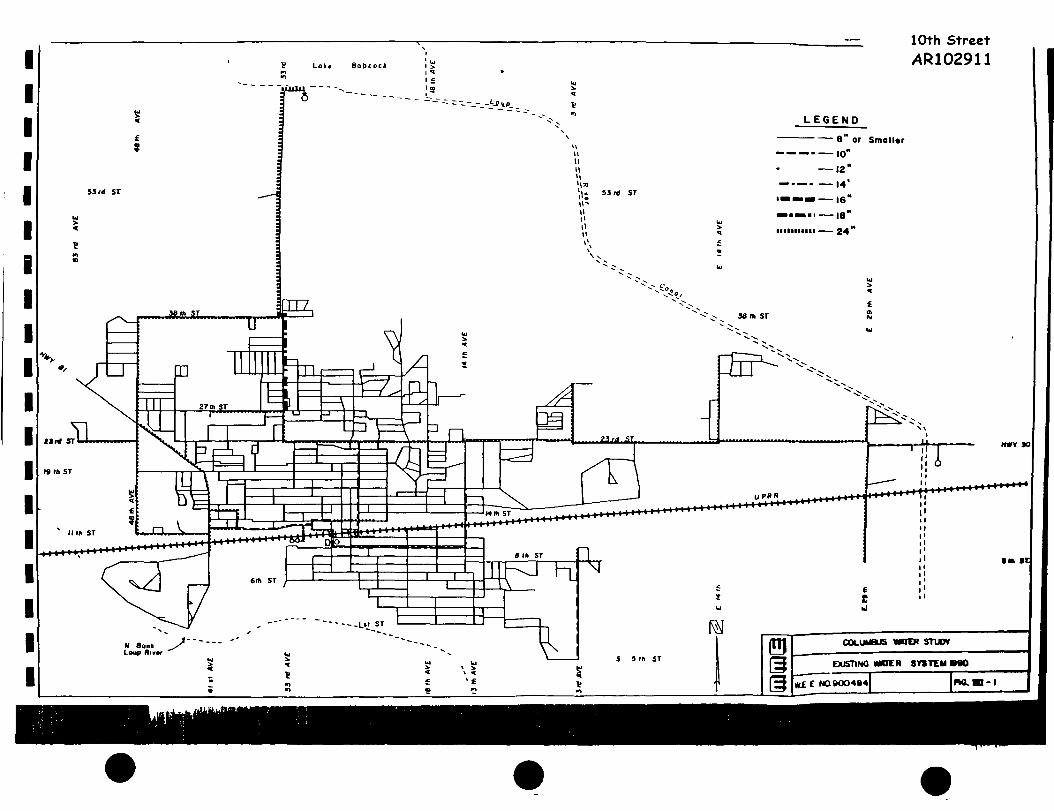
10th Street/VR102911
EXISTING MOER SYSTEM MO

The existing distribution system has approximately 740 fire hydrants located throughout thesystem, the majority of which are Mueller hydrants equipped with 5-1/4-mch pumper outletsPressure tests were run on 21 fire hydrants by ISO as part of their fire protection evaluationin November, 1984 The pressure tests were performed to see if there were any lowpressure areas in the distribution system, and to determine flows available at the hydrantsfor fire fighting purposes In October, 1990, additional field testing of hydrants at 40different locations was performed as part of this study for the purpose of calibrating acomputer model of the water distribution system and to determine available flows Resultsof these additional pressure tests may also be found in the Appendix of this report
COMPUTER MODELING AND CALIBRATION In order to evaluate the City ofColumbus water system, a computer model of the distribution network, including watersupply and storage, was created utilizing the "Kentucky" water system analysis program asdeveloped by the University of Kentucky All existing water mains larger than four inchesin diameter were included in the model Water mains smaller than four inches in diameterwere excluded as they are hydrauhcally insignificant in evaluating the system To properlymodel the existing system, physical data including length, diameter, and assumed interiorroughness of over 1,100 existing water mams, as well as topographic information andestimated water demand for over 700 junctions or pipe intersections, were obtained andincorporated into the program Existing water storage facilities wells, and high serxicebooster pumps were also included in the program to simulate actual pressure conditions
experienced and measured in the field With the exception of interior pipe roughness andjunction demands, all data input into the program was derived from City records, as-builtplans, water maps, and in some cases, field measurements Distribution of water demandin the existing system was ascertained from the City's billing records and by plotting thelocation and average metered water use of all of the approximately 7,000 existing watercustomers, and then distributing these demands to nearby pipe junctions Interior roughnessof the water mains was initially assumed based on age and composition of the various linesand then adjusted until computer simulated results and field flow and pressure
£?V I I - 7 o

measurements were correlated Storage tank water levels and metered water supply at allentry points to the distribution system were recorded during the field pressure tests toenhance calibration and accuracy of the model
COMPUTER SIMULATION OF EXISTING SYSTEM In order to evaluate the Cityof Columbus water system, computer simulations of the existing distribution network wereanalyzed under various conditions, including peak daily demand, average daily demand, andpeak demand plus the required fire flow and/or basic fire flow in those areas surveyed bythe ISO in 1984, as well as some additional areas of concern As previously stated, in orderto have no insurance grading deficiency, the capacity of the water system in conjunction withstorage must provide the required fire flow during peak demand with the tv.o mostimportant pumps out of service To meet this condition, simulations for the existing systemwere conducted with two of the three high service pumps located in the existing water plantout of service Existing Wells No 12, 14, and 15, which supply water to the distributionsystem at additional points away from the existing water plant, were assumed to be pumpingat peak capacity The remaining high service pump in the water plant was also assumed tobe running at capacity
Eleven of the twenty-one areas tested by the ISO in 1984 showed deficient available fireflows Figure VII-2 indicates areas tested by the ISO and simulated in this report Those
areas shown as deficient in tests conducted by the ISO also proved deficient in computersimulations at the present peak daily water demand of 12 mgd The results of computer
simulations to each of those areas tested, as well as pressure contour maps for each of thespecific fire demands, are included in the Appendix of this report
South of 10th Street, the City generally shows poor performance m providing required fireflows for fire demands other than residential fires requiring less than 1,000 gpm In thisarea, the distribution network is comprised entirely of six-inch and four-inch mams with nocross connecting mains located within 1/4-mile of each other in many areas These factors, ^ M£<?
!-» 3-
VII - 8 8 $*° n

coupled with the age of some of the cast iron pipe mams in this area, leads to an inadequateability to meet required higher fire demands, as shown in Figure VII-2
Computer simulations show that the northeast area of the city near 38th Street and 23rdAvenue is unable to meet fire demands of a 1,000 gpm recommended fire during times ofpeak water use, due to a lack of any large diameter mains feeding this area Fire flows musttravel nearly one mile through 6-inch diameter mains and limited cross connections froma 12-inch diameter main on Highway 30 and an 18-inch diameter main on 33rd Avenue tothe point of demand
The distribution network bounded by 23rd Street to the north, 14th Street to the south, andbetween 18th and 37th Avenues, is acceptable for most residential fire conditions but isdeficient for higher commercial and institutional fire requirements An insufficient numberof cross-connecting mains, coupled with the network being comprised of small diameter andolder cast iron pipe, limits flows in this area of the network
The existing six- and eight-inch water mains within the industrial area south of Highway 30between 10th and 14th Avenues are not sufficiently large enough to meet the normal highwater demands and the relatively high potential fire demands of up to 5,000 gpm v, i thm thisportion of the Cuv
Computer simulations show that the far eastern edge of the distribution system near Behlen
Manufacturing is incapable of meeting the maximum basic fire demand of 3,500 gpm asdefined by the ISO During periods of peak or near peak water demands within the city,the eastern area of the distribution network relies almost exclusively on Well No 15 and thewater tower located near the Loup River Canal for water supply This is due to theremoteness of this area from the Downtown well field and the north water storage reservoir
v n - 9

10th StreetAR102915
3,500 - Required Fire Flow A* DeterminedBy ISO ( G PM )
• —— Insufficient Flow To Meet Req'd FireDemand A« Tested By ISO-1984And/Or Computer Modeling
Sufficient Flow To Meet Req'd FireDemand A* Tested By I SO-1984 AndAt Verified By Computer Modeling
HCOUIREDJWE DCMANMEXIITTMC
Capacity of Well No 15, combined with the elevated water storage tank located nearBehlen's facility, is not sufficient to meet the simulated fire demand
The west end of the distribution system on Highway 81 west of 48th Avenue is alsoincapable of meeting a basic commercial fire demand of 3,500 gpm during periods of peakwater demand The remoteness of the western end of the system from existing water supp'yand storage facilities necessitates a larger diameter main than the existing eight-inch line onHighway 81 to adequately serve commercial development in this area
COMPUTER SIMULATION OF EXISTING STORAGE AND SUPPLY In additionto checking the adequacy of the distribution network to meet required fire demands ofspecific duration in various cases, extended period simulations were also conducted on thesystem at existing peak and average water demand conditions These simulations were runto determine the general response of the existing storage and supply facilities to each otherand the distribution network under various conditions
Currently, water supply enters the distribution system at four locations (1) from the highservice booster pumps located in the existing water plant on 10th Street and 28th Avenue,(2) from high service booster pumps located adjacent to the steel storage tanks on 32ndAvenue and south of the railroad tracks, (3) from Well No 14 located adjacent to thethree-milhon-gallon reservoir near Lake Babcock, and (4) from Well No 15 located nearthe Loup Canal and Highway 30
Computer simulations during the existing peak water demand of 12 mgd shows that the
eastern area of the distribution system, from approximately 3rd Avenue and east, reliessignificantly on Well No 15 near the Loup Canal to provide for adequate water supply and
VII-11
pressure During periods of average water demand, adequate supply and water pressurescan be maintained in the eastern part of the City with Well No 15 not pumping into thesystem as shown in the pressure contour map illustrated in Figure VII-3 Figure VII-4 showsthe low pressures in the system at peak demand and Well No 15 not pumping
Extended simulations at existing peak and average demands show that the three-milhon-gallon-storage reservoir near Lake Babcock is almost exclusively dependent on the adjacentWell No 14 for water supply Head losses through the distribution network, the nearly four-mile separation between this north storage reservoir and the Downtown well field, and theclose proximity of the downtown elevated tank to that same well field, prevents the highservice pumps located downtown from being able to fil l the north reservoir The 290,000-gallon elevated storage tank downtown will, as simulated in all cases, overflow prior to anysignificant filling of the north reservoir by the downtown wells
FUTURE DISTRIBUTION AND STORAGE NEEDS
A description of the future needs of the distribution system and water storage are providedin the following paragraphs
DISTRIBUTION SYSTEM Future needs of the distribution system include thereplacement of smaller diameter mains where improved capacity is required for adequate
fire protection, the elimination of as many of the dead-end lines as possible by looping thoselines with other lines, construction of additional large diameter mams to serve the expandingareas on the periphery of the City, and construction of new large diameter mam supply and
feeder lines from future well fields to storage facilities and mam artenals if the Downtownwell field is removed from service These improvements are in addition to the expansionof service into new developing areas of the City
8 <»VII - 12 vo J

icii ••••••""••••••».......,:::.w /•v/ X. PRESSURE CONTOUR
IN P&l , SHOWN THUS
sreaoryy
COLUMBUS WATER STUDY
PRESSURE CONTOUR MAP OF EXIS TING SAVERAGE DAILY WATER DEMAND- OFF
WEENa90049i FIG "5ZH-3
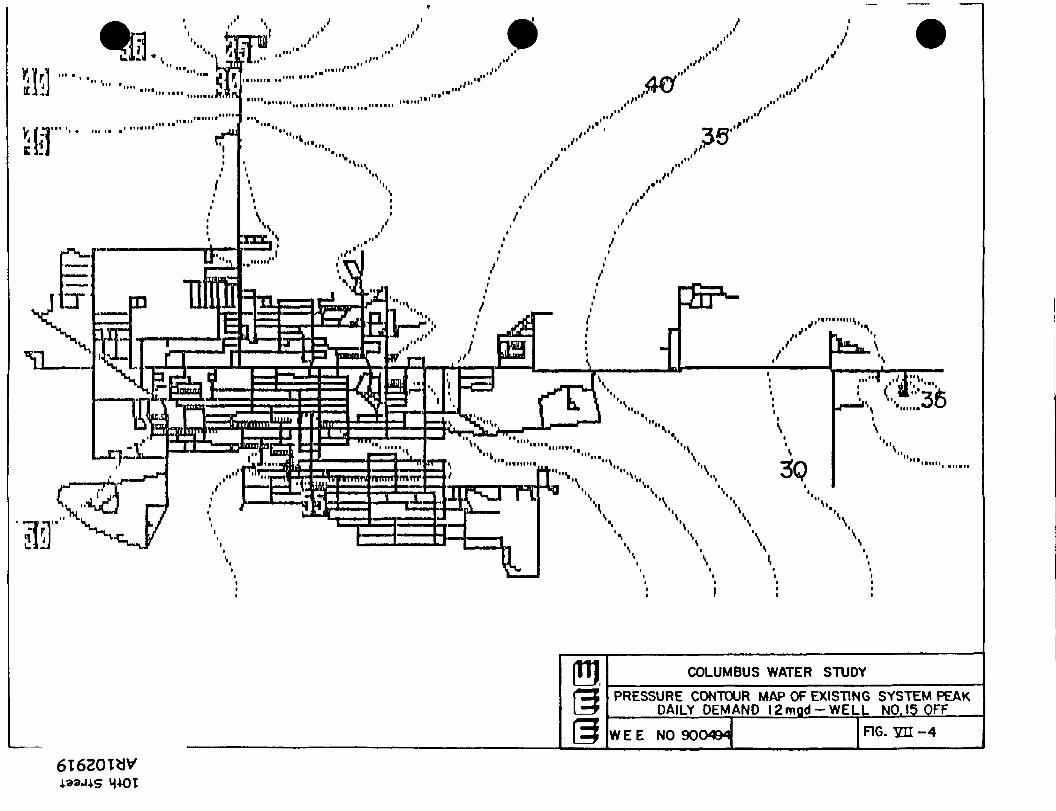
6T6ZOTW4.33J4-S M-K)t
COLUMBUS WATER STUDY
PRESSURE CONTOUR MAP OF EXISTING SYSTEM PEAKDAILY DEMAND l2mgd-WELL NO. 15 OFF
WEE NO 900494 FIG. TZn-4

If the Downtown well field and Well No 15 located on the east end of the City are phasedout in favor of a new and larger water supply, the pressure and flow patterns of the existingdistribution system will be greatly changed, as peak flow demands increase and the supplyentry points to the distribution network are changed
Development of a 20 mgd north well field near Lake Babcock will necessitate constructionof a new additional large diameter main feed line from this well field to the southern areaof the city in order to maintain adequate pressures and be capable of delivering this supplyto the system The existing 24-inch diameter mam that runs from the north three-rrullion-gallon storage reservoir to the north end of the distribution network at 38th Street and 33rdAvenue is insufficient to deliver an 8 0 to 20 0 mgd supply from this site and to allow thenorth reservoir to float on the system
Development of a 20 mgd south well field south of the Loup River will also require theconstruction of a new large diameter feed line from this well field to the existing threemillion gallon reservoir, if existing and future water storage to the north is to float on thesystem and control the south well field
WATER STORAGE The existing three-milhon-gallon reservoir south of Lake Babcockas well as the elevated storage tanks located downtown and at the east end of the City near
Behlen, provide the operating pressure for the system These storage facilities, inconjunction with ground storage reservoirs at the water plant and steel tanks south of therailroad tracks, provide storage capacity for supplementing the water supply componentsunder conditions when the system demand exceeds the well capacity Fire flowrequirements can be met in this manner by supplementing the water available from existingwells
Consideration should be given to adding additional storage With the development of a new
well field south or north of the City and the possible elimination of all of the downtov-n ,73 5
wells, water levels within the existing steel storage tanks south of the railroad and groundstorage facility located at the water plant could no longer be manually controlled by turningon and off various wells Installation of electric control valves could be used to controlwater levels in these tanks However, control of the high service booster pumps would bemore complicated in preventing too little or too much on and off cycling depending on thesource(s) of water supply
Currently, the Nebraska Department of Health recommends providing a storage volume of100 gallons per population served or the average daily water demand, whichever is greaterBased on this criteria, the City of Columbus should have a total of 7 5 million gallons ofstorage capacity to adequately meet storage requirements up to the year 2010 If theexisting ground storage and elevated tank downtown are maintained in the system, the citywill require two million gallons of additional storage If the downtown storage facilities areremoved from the system due to their age, increased maintenance, or control problems inregulating and joining these components within the new water supply, then an additional 4 5million gallons of storage will be required
There are several advantages of elevated storage over ground-level storage They includethe following (1) all of the water is available for use since the entire volume is elevatedin the air and provides for and maintains the system s operating pressure, (2) the water
obtained from the city wells must be pumped only once since the excess water pumped tothe system flows to the elevated storage, and (3) there is increased reliability since all of thewater is stored at a sufficient height to be available for use with no booster pumps andauxiliary power unit requirements during periods of power outages
The advantages of ground-level storage tanks are generally lower initial construction costsand large storage capacity
305»-» 3-O (ft
VII - 16 NO j?ro m

An additional ground-level tank constructed near Lake Babcock and the existing three-rrulhon-gallon reservoir combines the advantages of both systems The topography north ofColumbus is sufficiently high enough in elevation to provide adequate pressure for thesystem eliminating the need for a booster pump station, making this alternative lessexpensive than comparable storage m an elevated tank located closer to the distributionsystem However, the possible ramifications of locating all storage near Lake Babcock inconjunction with the potential well field sites must be considered If the source of supplyis from the North Alternative Site consideration should be given to locating 2 5 milliongallons of elevated-storage near the Downtown area and 2 million gallons of ground storagenear Lake Babcock Elevated-storage near Downtown would help maintain pressures during
peak demands and provide that area with a supply of water in the vicinity in the event thetransmission mains from the North Alternative Site are interrupted However, computersimulations of elevated storage located near Downtown and near the same static hydraulicgradient of the existing 3 million gallon ground reservoir near Lake Babcock indicate thatduring peak demands, the full storage capabilities of the elevated reservoir cannot beutilized Because of head losses through the distribution network and the nearly four-mileseparation between the Downtown area and the existing north ground storage reservoir onwhich system pressures will ride, the hydraulic gradient in the Downtown area may be asmuch as 30 feet below the gradient at the North Site Reservoir during peak demands Thishvdraulic gradient depression will result in the elevated reservoir being at levels less than
full during peak demands If the source of supply is from the South Alternative Sue closerto the Downtown area, 4 5 million gallons of ground storage should be considered near LakeBabcock In this case, storage for the Downtown area will be provided in the aquifer itselfand in the treatment facilities as previously described
PROPOSED IMPROVEMENTS • DISTRIBUTION
As outlined in the preceding section, the needs of the City of Columbus water system arefairly extensive in nature due to the change in location of the future water supply, increasing
sVII - 17 qro
roro

future water demands, and existing deficiencies in meeting required fire flows Proposedimprovements to the distribution system are based on a future 20 mgd water supply fromthe north or south well field alternatives in which the existing City wells are phased out ofservice Since acceptability of the proposed well sites in regard to ultimate capacity cannotbe accurately determined until development begins, the proposed distribution improvementshave been sized to allow an ultimate 20 mgd supply capacity from either site and allow foiwater levels within existing and proposed future storage reservoirs north of the City tocontrol pumping of the wells, and to ride on and control the operating pressure of thesystem
Since it is not possible to meet all of the needs of the system at once due to the size andexpense of the needed improvements and the financial constraints of the City, theimprovements have been broken down into four five-year phases The phases and requireddistribution improvements are matched to the expected peak future water demands anddevelopment of a new well field as the existing wells are phased out of service
PHASE I (1991 - 1995^ Peak water demand for the City of Columbus is expected to
grow from the present 11 0 - 12 0 million gallons per day to 13 9 mgd in the year 1995 By1995, the city is expected to remove existing Wells No 2 and 11 due to TCE contamination,and Well No 15 due to its high iron content Elimination of the two downtown wells willreduce pumping capacity at this suppl) point to the distribution system Elimination of Well
No 15 east of the city, in conjunction with the reduced capacity of the Downtown well field,will adversely affect water pressures within the system during peak consumption, especiallyin the south and east areas of the community Computer extended-period simulations of thesystem during a peak consumption of 13 9 mgd with Wells No 2, 11, and 15 out of serviceresulted in low pressures of 5 to 15 psi in the east end of the distribution system and 25 psiin the south area of town Pressure contour maps and results of this simulation are includedin the Appendix As the existing wells are removed from service, development of an 8 0mgd well field to the north has been assumed to replace the wells taken out of service and ^
73to meet the increased peak water demands Under these conditions, the top priority in £
roconstructing distribution improvements is to increase the water delivery capability of the new vo£
VII - 18

north well field down to the existing distribution network and to maintain adequatepressures in the system during peak consumption
Construction of such distribution improvements in the first phase must correlate to theoverall distribution improvements required for an ultimate 20 mgd supply capacity from thissame well field or, alternatively, a 20 mgd supply from the south This is necessary to avoidconstruction of water mams that will be inadequate for future demands and will need to bereplaced
•
Figure VII-5 presented in this report depicts the distribution improvements required toprovide a 20 mgd supply from the north or south well field alternatives The system isidentical regardless of supply source, with the exception that if a 20 mgd supply from thesouth is ultimately developed, a river crossing from the south well field will be required andthe main feeder lines located in 4th Street will be slightly changed in size, as opposed to a20 mgd north supply In the event the north well field cannot achieve an ultimate 20 mgdcapacity, a split supply system may be necessary and the proposed distribution system canbe altered by a reduction in some of the water main sizes to the south Should this occur,the City may wish to re-evaluate the improvements based on computer simulations of knownand expected data at that time As previously stated, however, for the purposes of thisreport, the svstem layout is based on providing an adequate system for a single 20 mgd well
supply either from the north, if possible, or if required ultimate capacity or water quality notbe established to the north based on the north well field's initial testing and modeling,providing a single 20 mgd supply from the south In this manner, construction ofinadequately sized water mams to meet future water demands and control and operationof water storage facilities can be avoided
VII-19 gVO
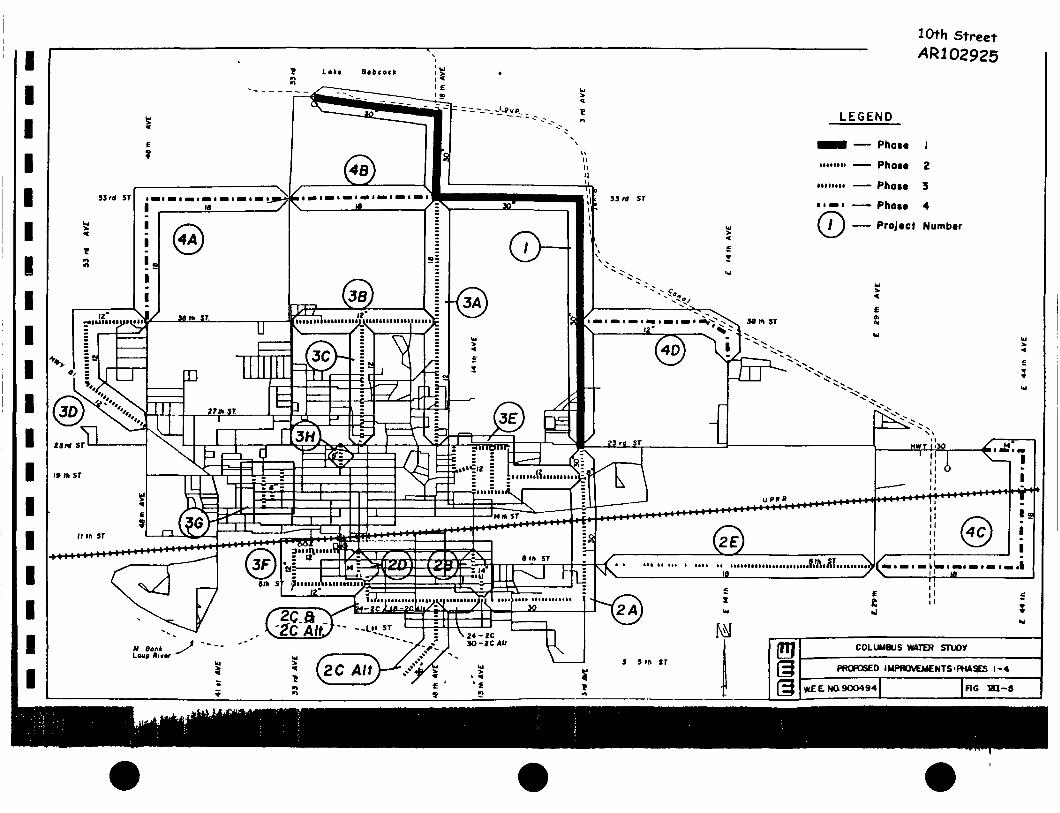
10th Street4R102925
— Pho§« IPhoM z
mi,,,, —— Phot* 3
•' — • —— Phot* 4
(Ij —— Project Numb«r
= ,%••=« = ——T,———s;J r - . ;iiiiMilliiiiiiiiii
PROPOSED IMPROVEMENTS-PHASES 1-4

Phase I improvements consist of the construction of a 30-inch diameter transmission linefrom the north well field to U S Highway 30 The transmission line will connect to theexisting 24-inch main at the three-milhon-gallon ground storage reservoir south of LakeBabcock The transmission line will cross the highway at 3rd Avenue and connect to theexisting 12-inch arterial mam running east and west from this point Based on computersimulations, Phase I improvements are necessary to provide adequate pressure and serviceto the city during peak demands and with existing Wells No 2, 11, and 15 removed fromservice Construction of Phase I will enable an 8 0 mgd supply from the north well field tobe delivered to the distribution system and allow the existing three-milhon-gallon reservoirto control the north well field and ride the system
PHASE II (1995 - 2000) By the year 2000, peak water demand for the City of Columbusis expected to reach 15 8 mgd During this interval, existing Wells No 1 and 8 are expectedto be removed from service leaving only Wells No 12 and 13 operable in the Downtownwell field With removal of all but two of the Downtown wells, water supply into thedistribution network will be much more dependent on the new well field to furnish water
supply and distribution improvements to provide adequate delivery Phase II improvementswill coincide with a continued development of the north well field or, alternatively, withinitial development of water supply from a well field south of the Loup River Phase IIimprovements are subdivided into four projects the priority of which will depend on sourceand location of supply and well field development
In the event of continued development of the north well field, Projects 2-A and 2-B are thefirst priority to be followed by Projects 2-C, 2-D, and 2-E Should the north well field proveincapable of providing the ultimate 20 mgd supply required, Projects 2-C Alternate, 2-A, and2-B are priorities, followed by Projects 2-D and 2-E The water mams in Projects 2-A, 2-C,and 2-C Alternate are sized based on a 20 mgd single source supply from the north or southwell fields In the event a single supply source is not developed in favor of a two-well field
V I I - 2 1^oro
arrangement, the size of these mains may be reduced based on revised computersimulations, data, and future conditions present at that time
Project 2-A involves the extension of the 30-inch diameter main feed line from the southside of U S Highway 30, south to 4th Street extended east, along 3rd Avenue, and then westalong 4th Street to 13th Avenue The 30-inch mam will be connected to all of the smallerdiameter mams crossed along the route Project 2-A also includes construction of an eight-inch diameter main from 3rd Avenue, east along 19th Street as extended, to the existing six-inch mam on West Calle Columbo in the Christopher's Cove area
Project 2-B involves the construction of a new 14-inch diameter main from the 30-inch lineon 4th Street north along 13th Avenue to 7th Street, then west one block to 14th Avenue,and finally north along 14th Avenue to the existing 14-inch line located on 10th StreetProject 2-B is a necessary complement to Project 2-A to adequately connect the 30-inchmain feed line to the network of existing large diameter mains in the system Existingsmaller diameter mams will be connected to the new 14-inch line as they are encountered
Project 2-C involves the construction of a 24-inch diameter main along 4th Street from itsconnection to the new 30-inch line at 13th Avenue, east to 25th Avenue extended south,then north along 25th Avenue to 6th Street The water mams for Alternate 2-C are sizedbased on a 20 mgd water supply from the north well field
Project 2-D is a necessary complement to Project 2-C in order to connect the existing andnew large diameter arterial and mam feed lines Project 2-D involves constructing a 14-inchdiameter mam from its connection to the mam feed line at 6th Street and 25th Avenue then
north along 25th Avenue to 7th Street, then west one block to 26th Avenue, and finallynorth along 26th Avenue to the existing 14-inch diameter mam located on 10th Street Aswith all of the projects, existing smaller diameter mams will be cross-connected to the new
larger diameter mam
V I I - 22VO 2ft * ™f\> («

Project 2-C Alternate will be constructed if a 20 mgd water supply from a well field southof the Loup River is developed This project would be in lieu of proposed Project 2-C
Project 2-C Alternate will involve construction of a 36-inch diameter transmission line fromthe south well field across and underneath the Loup River to 18th Avenue as extendedsouth, and then north along 18th Avenue to 4th Street
At 4th Street and 18th Avenue, a 30-inch diameter mam will be constructed east along 4thStreet to 13th Avenue, connected to Projects 2-A and 2-E An 18-inch diameter main wouldbe constructed west along 4th Street from 18th Avenue to 25th Avenue, and then north to6th Street where it will connect to the south end of Project 2-D As previously stated,should a split water supply be developed, the proposed water main sizes in Phase II mav bereduced depending on conditions and future water supply required from the south well fieldAny such reduction in the proposed water mam sizes will need to be evaluated based onrevised computer simulations and criteria at that time
4
Project 2-E involves the construction of an 18-inch diameter main east along 8th Street fromthe existing 12-inch mam on 1st Avenue to the existing 12-inch mam at East 29th AvenueThe new mam will provide a loop for much of the east end of the distribution system andwill appreciably enhance water supply to that area Project 2-E will also provide a mainfeed line to any future development east of 3rd Avenue and south of U S Higrmav 30
PHASE III C20Q1 - 2005) By the end of the year 2005, peak water demand for the Cityof Columbus is expected to reach 18 million gallons per day During the period from 2001to 2005, all remaining existing wells in the downtown area are expected to be removed fromservice Phase III improvements will continue to enhance the delivery system from the newwell field to the distribution network, improve service to current developments located onthe periphery of the system, and improve capacity in those areas identified in this reportwhere existing mams have been found inadequate to meet fire demands
VII - 23 £
8*00 -»•

Project 3-A consists of the construction of a new 18-inch diameter mam along 18th Avenuefrom 53rd Street south to 38th Street, and a 12-inch diameter main along 18th Avenue from38th Street to U S Highway 30 The 18-inch main will be connected at the north end to the30-inch diameter main feed line constructed in Phase I The 12-inch diameter main willconnect on the south end to the existing 12-inch arterial line running east-west on U SHighway 30 This project is necessary to meet future demands for the system
Project 3-B consists of the construction of a 12-inch water main along 38th Street from 18thAvenue to 33rd Avenue The main would connect to the 18-inch and 12-inch linesconstructed under Project 3-A on the east end and to the existing 18-inch mam located at38th Street and 33rd Avenue on the west end This project, in conjunction with Project 3-A,will improve delivery of water supply and fire protection adequacy in this area of the City
Project 3-C consists of the construction of a 12-inch main along 26th Avenue from 38thStreet to the existing 12-inch main located in U S Highway 30 This project, as withProjects 3-A and 3-B, will improve fire protection adequacy in this area of the City andprovide an additional feed line to supply the existing 6-inch mams in the area
Project 3-D consists of the construction of a 12-inch mam from the existing 12-inch line at38th Street and 48th Avenue, thence west on 38th Street extended, to a point west of 53rdAvenue, thence south to U S Highway 81, and thence southeast along U S Highway 81where it will connect to the existing 12-inch main on 48th Avenue This project is requiredto meet the basic fire demand in this area, as well as future commercial development
Project 3-E consists of the construction of a 12-inch water main on 12th and 14th Avenuesfrom U S Highway 30 to 17th Street, a 12-inch main on 16th Avenue from U S Highway30 south to 20th Street, a 12-inch main on 17th Street from 14th Avenue to 10th Avenue,a 12-inch mam on 20th Street from 16th Avenue to 14th Avenue, a 12-inch main on thesouth side of U S Highway 30 from 14th Avenue to 10th Avenue and connecting to the
•v. •-*»lVII - 24 5 Jro 5*° nro ra

existing 12-inch mam on the south side of the highway at 14th Avenue and the north sideof the highway at 10th Avenue, a 12-mch mam on 10th Avenue from 17th Street to 19thStreet, and a 12-mch water mam on 19th Street from 10th Avenue to 3rd Avenue Thesewater mains are required in order to meet the high fire demand and water use requirementsof industries in this area The mains will also provide an additional connection of theexisting 14-inch arterial supply line on 14th Avenue with the new 30-inch mam to beconstructed as part of Project 2-A
Project 3-F consists of the construction of a 12-inch water mam along 6th Street from 25thAvenue west to U S Highway 30, then north along U S Highway 30 to 10th Street, andfinally east along 10th Street to the existing 14-inch main on 28th Avenue An additional12-mch water main will also be constructed from 10th Street and approximately 31st Avenuenorth to the discharge side of the high service booster pumps located south of the railroadtracks This project will enhance fire protection for the southwestern portion of the City andprovide an additional cross connection for existing main feed lines south and north of therailroad tracks
Project 3-G consists of the construction of 6-inch water mams on 34th Avenue from 20tbStreet to 17th Street, on 35th Avenue from 17th Street to 16th Street, on 36th Avenue from19th Street to 15th Street, and on 37th Avenue from 19th Street to 18th Street Thesemains will provide additional fire protection for this portion of the cnv where inadequate
cross connections now exist between the existing 6-inch mains
Project 3-H consists of the construction of an 8-inch water mam along 28th Avenue fromthe existing 12-inch main on U S Highway 30 south to 20th Street This main is requiredto meet fire protection requirements in this area, including the existing YMCA
V I I - 2 5 o j

PHASE IV (2006 - 2010) By the year 2010, basic water demand for the City ofColumbus is expected to reach 20 mgd During this interval, the last of the existing supplywells is expected to be removed from service and, thus, all water supply will be furnishedby the new well field Phase IV improvements will provide additional feed mains toenhance water supply to existing areas of the City and to provide service to future areas ofdevelopment
Project 4-A consists of the construction of an 18-inch water mam along 53rd Street, from33rd Avenue where it will connect to the existing 24-inch main, west to 48th Avenue, thensouth along 48th Avenue, as extended north, to 38th Street where it will connect to theexisting 12-inch mains Project 4-A will provide additional water supply to the northwestarea of the city, enhancing fire protection in this area, as well as providing for growth northof 38th Street and west of 33rd Avenue
Project 4-B consists of the construction of an 18-inch water main on 53rd Street, from 18thAvenue to 33rd Avenue This mam will provide additional supply to the northwest area ofthe city and will provide for growth north of 38th Street between 33rd and 18th Avenues
Project 4-C consists of the construction of an 18-inch water mam along 8th Street, from East29th Avenue across the Loup River canal, to East 44th Avenue, then north along 44thAvenue from 8th Street to U S Highway 30 A 14-inch water main will be construcied
along U S Highway 30 from East 44th Avenue to the existing 14-inch mam east of BehlenManufacturing Company This project will allow the existing 14-inch mam serving theBehlen Manufacturing area to be looped with the main distribution system Constructionof these mains will also provide for a 3,500 gpm basic fire demand in the area east of East29th Avenue and will provide water supply to any future development in this area
Project 4-D consists of the construction of a 12-inch water mam east along 38th Street fromthe 30-inch mam feed line on 3rd Avenue to East 14th Avenue, then south along East 14th
V1I-26
!2s

Avenue to the existing 12-inch mam on Kozy Drive This project will close the loop on theexisting 12-inch mam running north on East 14th Avenue, where it currently dead ends atKozy Drive The project will improve service in this area and allow for future growth
PROPOSED IMPROVEMENTS - WATER STORAGE
As discussed previously in this report, construction of additional ground-level storage northof the City near Lake Babcock and/or construction of elevated storage near Downtown isdependent on the location of the source of supply If the South Well Field Alternative isdeveloped, a 4 5 million gallon ground-storage reservoir should be constructed south of LakeBabcock between 18th and 33rd Avenues, to meet the future storage demands of the Cityof Columbus If the North Well Field Alternative is developed, a 2 5 million gallon elevatedstorage reservoir should be constructed near Downtown and a 2 million gallon ground-levelstorage reservoir should be constructed near Lake Babcock between 18th and 33rd Avenues
In order to enhance the ability of the system to maintain adequate pressures as the sourceof water supply is changed, the construction of any ground-storage facilities should becompleted once Phases I and II of the distribution system are completed by year 2000Elevated storage should be constructed within the next five years to replace the sixty-fiveyear old elevated reservoir located in Downtown
DISTRIBUTION AND WATER STORAGE COSTS
To provide budget information on the proposed distribution and storage improvements,
preliminary cost estimates have been prepared and are shown in Table VII-4 The costestimates are based on 1991 construction cost figures and, as such, will need to be updatedthrough the years Material and equipment costs have been determined from review ofcurrent costs of local construction projects of a similar nature, as well as consultation withvarious materials and equipment manufacturers and suppliers Costs have recently stabilized ^ |>
»-» 3"
VII - 27 §

somewhat but have continued to increase for both materials and labor, resulting in increasedconstruction costs in recent years Indications are that this trend will continue to someextent in the future However, the costs presented in this report should be fairly accuratefor the next six to nine months
OVII - 28
CJ n

TABLE VII-4ESTIMATES OF PROJECT COST
COLUMBUS WATER STUDY
Project 1
Construct 30" DIP - 24,000 LF $1,248,000Construct Fittings & Valves 98,000Reconnect Existing Lines & Services 20,000Construct Drainage Ditch Crossing 25,000Remove & Replace Streets & Walks 18,000Miscellaneous Related Construction 2,000Engineering & Inspection 155,000Project Administration, Bond Counsel,Legal, Publishing, Contingencies,Interest During Construction, etc 155.000
TOTAL ESTIMATED PROJECT COST $1,721,000
Project 2-A
Construct 30" D I P - 9,810 L F $550,000Construct 8" PVC DR 18 - 25 L F 1,000Construct Fittings & Valves 111,000Reconnect Existing Lines & Services 20,000Construct Railroad Crossing - Addition 7,000Remove & Replace Streets & Walks 21,000Miscellaneous Related Construction 2,000Engineering & Inspection 78,000Project Administration, Bond Counsel,Legal, Publishing, Contingencies,Interest During Construction, etc 78.000
TOTAL ESTIMATED PROJECT COST 4\<,. $868,000
»S?VII - 29 *
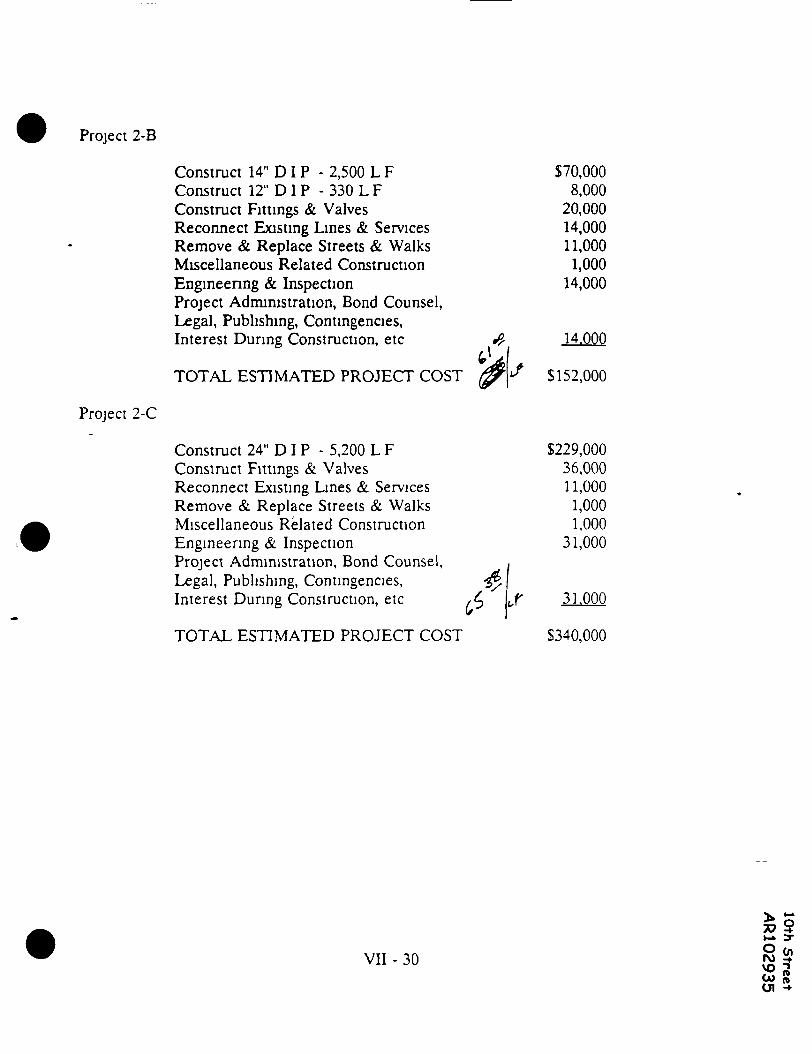
Project 2-B
Project 2-C
Construct 14" D I P - 2,500 L FConstruct 12" DIP - 330 L FConstruct Fittings & ValvesReconnect Existing Lines & ServicesRemove & Replace Streets & WalksMiscellaneous Related ConstructionEngineering & InspectionProject Administration, Bond Counsel,Legal, Publishing, Contingencies,Interest During Construction, etc
TOTAL ESTIMATED PROJECT COST
Construct 24" D I P - 5,200 L FConstruct Fittings & ValvesReconnect Existing Lines & ServicesRemove & Replace Streets & WalksMiscellaneous Related ConstructionEngineering & InspectionProject Administration, Bond Counsel,Legal, Publishing, Contingencies,Interest During Construction, etc
TOTAL ESTIMATED PROJECT COST
$70,0008,00020,00014,00011,0001,00014,000
$229,00036,00011,0001,0001,000
31,000
.f 31.000
$340,000
VII - 30 -fn
Ot
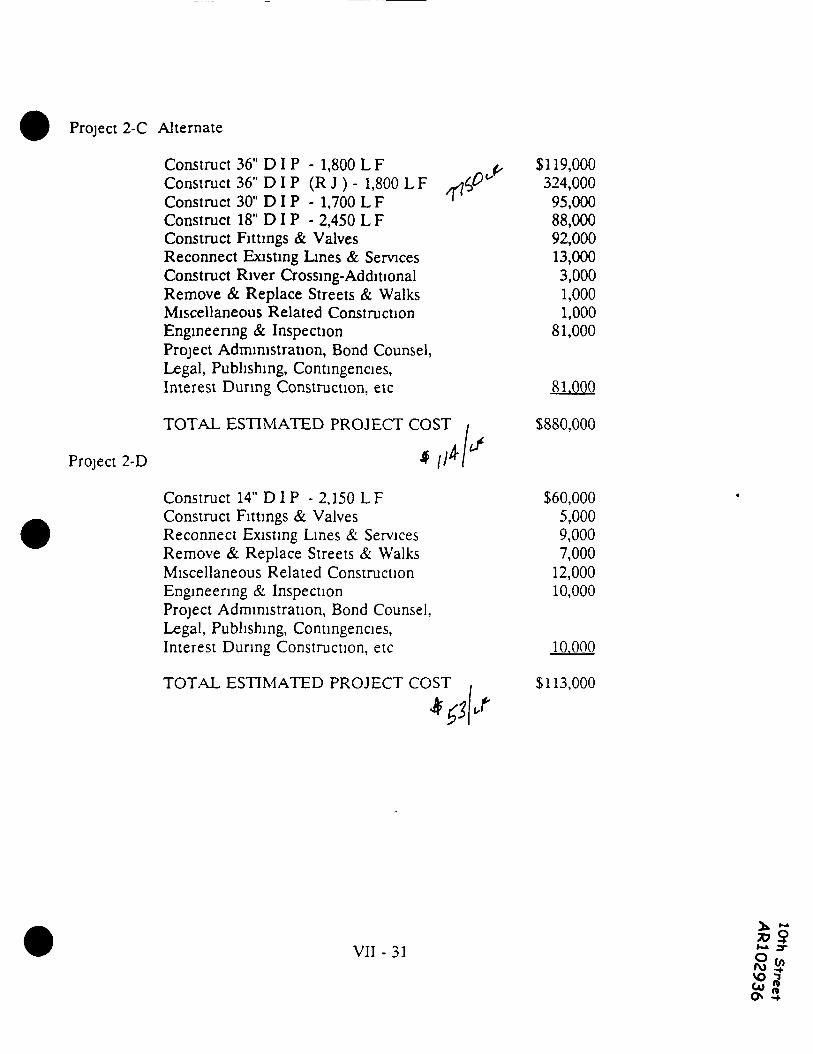
Project 2-C Alternate
Project 2-D
Construct 36" D I P - 1,800 L FConstruct 36" DIP (R J ) - 1,800 L FConstruct 30" D I P - 1,700 L FConstruct 18" D I P - 2,450 L FConstruct Fittings & ValvesReconnect Existing Lines & ServicesConstruct River Crossing-AdditionalRemove & Replace Streets & WalksMiscellaneous Related ConstructionEngineering & InspectionProject Administration, Bond Counsel,Legal, Publishing, Contingencies,Interest During Construction, etc
TOTAL ESTIMATED PROJECT COST
Construct 14" D I P -2 ,150LFConstruct Fittings & ValvesReconnect Existing Lines & ServicesRemove & Replace Streets & WalksMiscellaneous Related ConstructionEngineering & InspectionProject Administration, Bond Counsel,Legal, Publishing, Contingencies,Interest During Construction, etc
TOTAL ESTIMATED PROJECT COST
$119,000324,000
95,00088,00092,00013,0003,0001,0001,000
81,000
81.000
$880,000
$60,0005,0009,0007,000
12,00010,000
10.000
$113,000
VII - 31
co

Project 2-E
Project 3-A
Project 3-B
Construct 18" D I P - 9,300 L FConstruct Fittings & ValvesReconnect Existing Lines & ServicesRemove & Replace Streets & WalksMiscellaneous Related ConstructionEngmeenng & InspectionProject Administration, Bond Counsel,Legal, Publishing, Contingencies,Interest During Construction, etc
TOTAL ESTIMATED PROJECT COST
Construct 18" D I P - 5,270 L FConstruct 12" PVC DR 18 - 5,480 L FConstruct Fittings & ValvesReconnect Existing Lines & ServicesRemove & Replace Streets & WalksMiscellaneous Related ConstructionEngineering & InspectionProject Administration, Bond Counsel,Legal, Publishing, Contingencies,Interest During Construction, etc
TOTAL ESTIMATED PROJECT
Construct 12" PVC DR 18 - 4,040 L FConstruct Fittings & ValvesReconnect Existing Lines & ServicesConstruct Drainage Ditch CrossingRemove & Replace Streets & WalksMiscellaneous Related ConstructionEngineering & ConstructionProject Administration, Bond Counsel,Legal, Publishing, Contingencies,Interest During Construction, etc 4
TOTAL ESTIMATED PROJECT COST
VII - 32
$350,00018,00018,0003,0001,000
41,000
41.000
$457,000
$190,00099,00039,000
9,0005,0007,000
38,000
$73,0009,0007,000
25,00020,0005,000
15,000
J 15.000
$169,000
S<?\O T
35
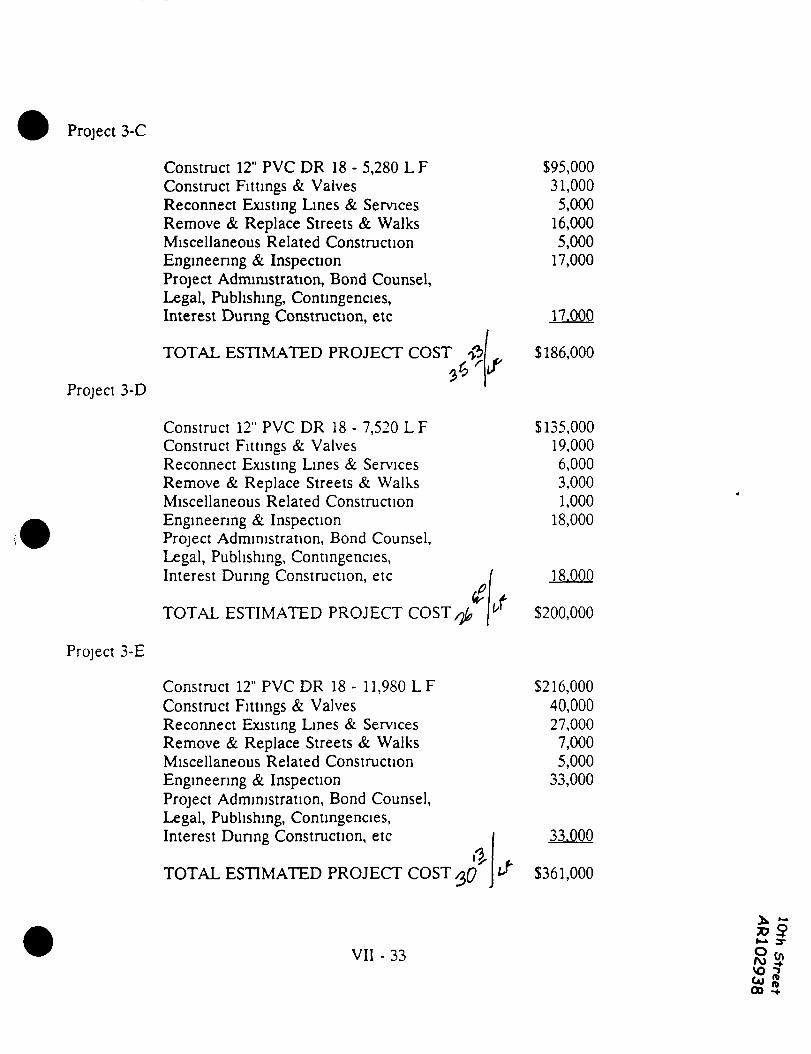
Project 3-C
Project 3-D
Project 3-E
Construct 12" PVC DR 18 - 5,280 LFConstruct Fittings & ValvesReconnect Existing Lines & ServicesRemove & Replace Streets & WalksMiscellaneous Related ConstructionEngineering & InspectionProject Administration, Bond Counsel,Legal, Publishing, Contingencies,Interest Dunng Construction, etc
TOTAL ESTIMATED PROJECT COST
Construct 12" PVC DR 18 - 7,520 LFConstruct Fittings & ValvesReconnect Existing Lines & ServicesRemove & Replace Streets & WalksMiscellaneous Related ConstructionEngineering & InspectionProject Administration, Bond Counsel,Legal, Publishing, Contingencies,Interest During Construction, etc
TOTAL ESTIMATED PROJECT
Construct 12" PVC DR 18 - 11,980 LFConstruct Fittings & ValvesReconnect Existing Lines & ServicesRemove & Replace Streets & WalksMiscellaneous Related ConstructionEngineering & InspectionProject Administration, Bond Counsel,Legal, Publishing, Contingencies,Interest During Construction, etc
TOTAL ESTIMATED PROJECT
{/
$95,00031,0005,000
16,0005,000
17,000
17.000
$186,000
$135,00019,0006,0003,0001,000
18,000
18.000
$200,000
$216,00040,00027,0007,0005,000
33,000
33.000
$361,000
VII - 33\o iCo £o> "

Project 3-F
Project 3-G
Project 3-H
Construct 12" PVC DR 18 - 4,820 L FConstruct Fittings & ValvesReconnect Existing Lines & ServicesRemove & Replace Streets & WalksMiscellaneous Related ConstructionEngineering & InspectionProject Administration, Bond Counsel,Legal, Publishing, Contingencies,Interest During Construction, etc
TOTAL ESTIMATED PROJECT COST
Construct 6" PVC DR 18 - 2,970 LFConstruct Fittings &. ValvesReconnect Existing Lines & ServicesRemove & Replace Streets & WalksMiscellaneous Related ConstructionEngineering & InspectionProject Administration, Bond Counsel,Legal, Publishing, Contingencies,Interest During Construction, etc
TOTAL ESTIMATED PROJECT COST
Construct 8" PVC DR 18 -960 LFConstruct Fittings & ValvesReconnect Existing Lines & ServicesRemove & Replace Streets & WalksMiscellaneous Related ConstructionEngineering & InspectionProject Administration, Bond Counsel,Legal, Publishing, Contingencies,Interest During Construction, etc
TOTAL ESTIMATED PROJECT COST
$87,00013,00015,00013,0004,000
14,000
14.000
$160,000
$33,0008,0006,000
10,0004,0007,000
$13,0003,0002,0003,0002,0003,000
3.000
$29,000
VII - 34 oro*>oo\O

Project 4-A
Project 4-B
Project 4-C
Construct 18" D I P - 10,500 L FConstruct Fittings & ValvesReconnect Existing Lines & ServicesRemove & Replace Streets & WalksMiscellaneous Related ConstructionEngineering & InspectionProject Administration, Bond Counsel,Legal, Publishing, Contingencies,Interest During Construction, etc
TOTAL ESTIMATED PROJECT COST
Construct 18" D I P - 5,250 LFConstruct Fittings & ValvesReconnect Existing Lines & ServicesRemove & Replace Streets & WalksMiscellaneous Related ConstructionEngineering & InspectionProject Administration, Bond Counsel,Legal, Publishing, Contingencies,Interest During Construction, etc
TOTAL ESTIMATED PROJECT COST
Construct 18" D I P - 10,500 L F (ifrConstruct 14" D I P - 2,350 L FConstruct Fittings & ValvesConstruct Drainage Ditch CrossingConstruct Railroad Crossing - AdditionReconnect Existing Lines & ServicesRemove & Replace Streets & WalksMiscellaneous Related ConstructionEngineering & InspectionProject Administration, Bond Counsel,Legal, Publishing, Contingencies,Interest During Construction, etc
TOTAL ESTIMATED PROJECT COST
$378,00054,0003,0001,0001,000
48,000
48.000
$533,000
$189,00032,0005,0001,0001,000
25,000
25.000
$278,000
$378,00059,00017,00010,0007,0001,0002,0001,000
52,000
52.000
$579,000
VII - 358<512

Project 4-D
Construct 12" PVC DR 18 - 8,300 LF $149,000Construct Fittings & Valves 30,000Reconnect Existing Lines & Services 2,000Remove & Replace Streets & Walks 1,000Miscellaneous Related Construction 1,000Engmeenng & Inspection 20,000Project Administration, Bond Counsel,Legal, Publishing, Contingencies,Interest During Construction, etc 20.000
TOTAL ESTIMATED PROJECT COST /» $223,000
VII - 36

Storage Reservoirs
Construct 4 5-Milhon GallonPrestressed Concrete Ground LevelWater Storage ReservoirConstruct Pipe Fittings & ValvesMiscellaneous Related ConstructionEngineering & InspectionProject Administration, Bond Counsel,Legal, Publishing, Contingencies,Interest During Construction, etc
TOTAL ESTIMATED PROJECT COST
Construct 2 5-Milhon GallonElevated Water Storage ReservoirConstruct Pipe Fittings & ValvesMiscellaneous Related ConstructionEngineering & InspectionProject Administration, Bond Counsel,Legal, Publishing, Contingencies,Interest During Construction, etc
TOTAL ESTIMATED PROJECT COST
$1,365,00037,0003,000
154,000
154.000
$1,713,000
$2,300,00062,000
6,000260,000
260.000
$2,888,000
Construct 2 0-Milhon GallonPrestressed Concrete GroundWater Storage ReservoirConstruct Pipe Fittings & ValvesMiscellaneous Related ConstructionEngineering & InspectionProject Administration, Bond Counsel,Legal, Publishing, Contingencies,Interest During Construction, etc
TOTAL ESTIMATED PROJECT COST
S 830,00022,0003,00094,000
94.000
$1,043,000
3-
(/>
VII - 37 n

SECTION VIIISUPPLY, TREATMENT AND DISTRIBUTION ALTERNATIVES
INTRODUCTION
A long-range water system plan should be developed for the City of Columbus, consideringsupply, treatment and distribution factors The purpose of the plan is to provide a watersystem capable of satisfying maximum demands with water complying with the Safe DrinkingWater Act This section identifies two water system alternatives and presents additionaldiscussions on hardness reduction and a dual distribution system
NORTH SITE WATER SYSTEM
The North Site Water System is based upon developing a 20 mgd water supply from theaquifer, north of Columbus, previously identified as the North Alternative Site A well fieldat this sue would be located along the south and east sides of Lake Babcock and LakeNorth The presence of the lakes and the clay layers of overburden provide the aquifer withsome protection from point and non-point source contamination The land area at this siteis agricultural and rural-residential Protection from contamination could also be enhancedby a Wellhead Protection Plan consisting of land acquisition, zoning ordinances and/oragricultural best management practices Aquifer testing must be performed to verify thatrecharge conditions are adequate to support the development of the proposed well fieldWithout adequate recharge conditions in the well field area, water supply may be limited,well head protection areas may be forced to encompass vast areas or contamination fromareas beyond the well head protection area may be drawn into the water supply
The water in the aquifer can be classified as very hard with levels of iron and manganeseapproaching or slightly exceeding the secondary maximum contaminant levels (SMCL's)The iron and manganese levels in the water from the existing City well located in this
vin -1

aquifer are significantly less than the overall levels in the City's current finished water Thequality of water in the aquifer appears to be sufficient to meet the Safe Drinking Water Actwith treatment of only disinfection and possibly fluondation Water samples should betaken during aquifer testing to confirm the quality of this aquifer Complete testing shouldbe performed to determine the levels of inorganic chemicals, organic chemicals, disinfectionby-products precursors and radionuchdes included in either promulgated or proposed federalregulations
Each well in the well field will be equipped with chlonnation and fluondation equipmentin the well houses In order to comply with the anticipated groundwater disinfectionrequirements, the wells will be piped directly to storage Piping to storage, rather thandirectly to the distribution system, will provide the contact time necessary to ensure that therequired bacterial and viral mactivation is obtained
Distribution system improvements will include the construction of an additional 2 0 milliongallons of ground-storage near Lake Babcock, 2 5 million gallons of elevated-storage nearDowntown and phased distribution system piping projects These projects, identified inSection VII of this report, have been prioritized to distribute water throughout the systemproviding adequate system pressures as flow demands increase and to satisfy fire demands
Capital and operation and maintenance costs for aquifer testing, well field construction,
treatment and distribution system improvements are presented in Table VIII-1
SOUTH SITE WATER SYSTEM
The South Site Water System is based upon developing a 20 mgd water supply from theaquifer, south of Columbus, previously identified as the South Alternative Site A well fieldat this sue would be located south of the Loup River between the Loup and Platte RiversThe well field would extend east from Highway 81 to near the City's sewage treatment plant
nn

outfall near the confluence of the Loup and Platte Rivers The proximity of the Loup andPlatte Rivers in this area may create a hydrologic barrier helping prevent the migration ofcontaminants from the west in between the two rivers and from other directions outside ofthe rivers into the proposed well field
The land area at this site is a combination of agricultural, commercial, residential and lightmanufacturing This site has a higher potential for groundwater contamination because ofthe shallow depth to groundwater and the lack of significant overburden A WellheadProtection Plan will require a contaminant source inventory, zoning ordinances to preventthe locating of new potential contaminant sources in the area and a contingency plan tolocate and develop alternate sources should contamination move in from other areasAquifer testing must be performed to confirm the proposed development plan and developa future groundwater management plan to ensure the protective hydrologic gradient ismaintained
The water in the aquifer at this site can be classified as hard, with levels of iron andmanganese over two and ten times the SMCL's, respectively Treatment for iron andmanganese removal from the water obtained from this aquifer is recommended Treatmentfor iron and manganese removal will include aeration, pH adjustment, oxidation anddetention, rapid sand fil tration and disinfection as discussed previously in Section VI Apotential treatment plant site is located north of the Loup River in the Pawnee Park areaof Columbus
Water samples should be collected during aquifer testing to confirm the quality of thisaquifer Complete testing should be performed to determine the levels of inorganicchemicals, organic chemicals, disinfection by-products precursors, and radionuchdes includedin either promulgated or proposed federal regulations Following quality analysis, benchand/or pilot scale testing should be performed to determine treatment effectiveness andtreatment plant design criteria
>VIII - 3 2 *
O enro $£ 3-&> (0Ul •+
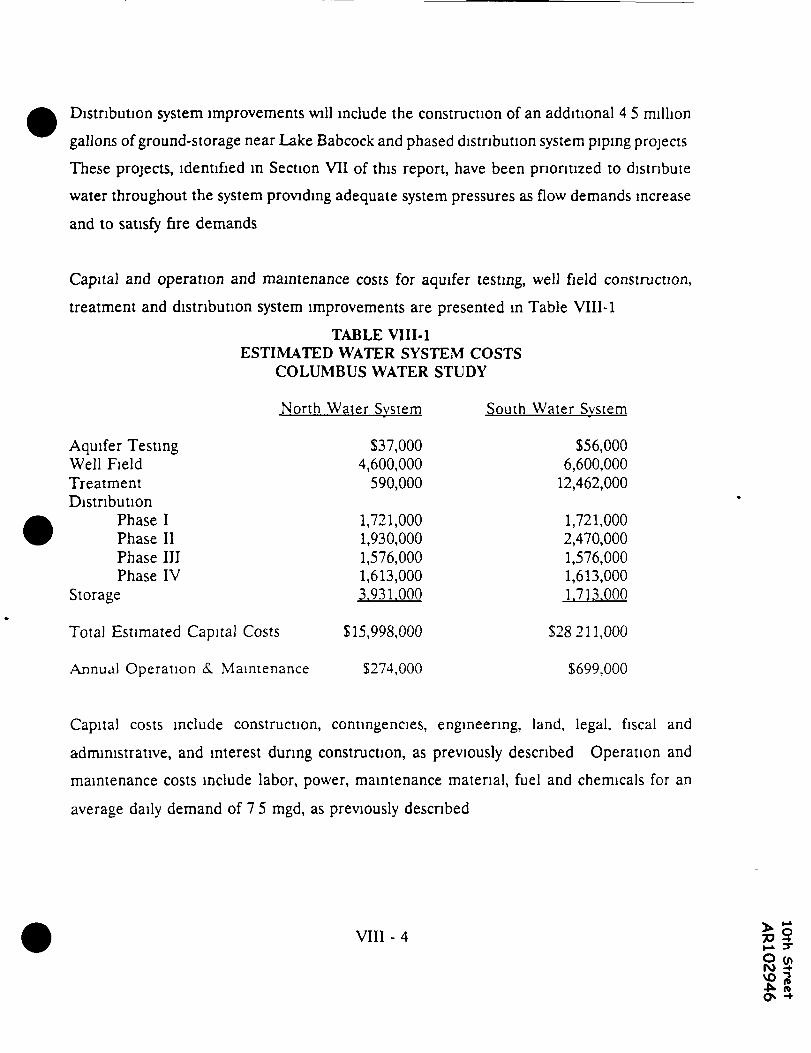
Distribution system improvements will include the construction of an additional 4 5 milliongallons of ground-storage near Lake Babcock and phased distribution system piping projectsThese projects, identified in Section VII of this report, have been prioritized to distributewater throughout the system providing adequate system pressures as flow demands increaseand to satisfy fire demands
Capital and operation and maintenance costs for aquifer testing, well field construction,treatment and distribution system improvements are presented in Table VIII-1
TABLE VIII-1ESTIMATED WATER SYSTEM COSTS
COLUMBUS WATER STUDY
North Water System South Water System
Aquifer Testing $37,000 $56,000Well Field 4,600,000 6,600,000Treatment 590,000 12,462,000Distribution
Phase I 1,721,000 1,721,000Phase II 1,930,000 2,470,000Phase III 1,576,000 1,576,000Phase IV 1,613,000 1,613,000
Storage 3.931.000 1.713.000
Total Estimated Capital Costs $15,998,000 $28211,000
Annual Operation &. Maintenance S274,000 $699,000
Capital costs include construction, contingencies, engineering, land, legal, fiscal andadministrative, and interest during construction, as previously described Operation andmaintenance costs include labor, power, maintenance material, fuel and chemicals for anaverage daily demand of 7 5 mgd, as previously described
VIII - 4 30 3"
O (flro +

HARDNESS REDUCTION
An alternate treatment scheme which could be incorporated into either the north or southwater system involves hardness reduction, as previously discussed Hardness reduction, viachemical precipitation, will also accomplish iron and manganese removal Hardnessreduction is not required in order to comply with the Safe Drinking Water Act, althoughmany advantages are obtained from softening This section of the report summarizesfindings concluded from previous studies regarding the economic aspects of water softeningMany of the substances contained in natural waters have chemical properties which areunfavorable to industrial and domestic use of the water Most of these undesirableproperties are popularly referred to as "hardness" Hardness, if present in significant
concentrations, is of particular concern to the individual customer in terms of
The consumption of soaps and detergents
The adverse effect on clothing and other articles being cleansed
The shortened life of pipes and fixtures, heating systems and boiler shells andtubes
The unsuitabili ty for many industrial processes
The aforementioned affects have been shown to be adversely magnified with an increase inhardness
Studies have shown that softening the entire supply at a treatment plant is more economical,(even though only a portion of the water is used for laundry, bathing, cleaning and cooking
purposes where softening is needed) than to soften in the home In the home, softeningmay be accomplished by (a) a home-owned ion exchange softener, (b) a serviced softener,
VIII - 5 o
or (c) by the use of larger quantities of soaps and detergents The use of soaps anddetergents has proven to be the most costly way to soften water
Study data indicates that a definite savings in soaps, synthetic detergents, general householdcleaners, scounng compounds, bleaches and other additives results when softened water isavailable Other advantages of soft water include
Savings on fuel for heating soft water by the elimination of deposits of scale,which retard heat flow
Less wear fabrics washed in soft water
Less wear on utensils
Retention of natural color and appearance of food and us digestiveproperties, when cooked in soft water
Better skin care
Reduct ion oi pipe corrosion and reduction of the potential ot "at the tap"lead
Most of the Columbus home owners have resorted to treatment of their own supply byrenting a home softening unit According to local sales representatives, rental and service
charges currently cost the individual customer approximately $240 per year The use of thistype of unit will be reduced and in most cases may be eliminated completely if hardnessreduction in a central treatment plant is provided The individual customer cost for softwater from a central hardness reduction plant could be approximately twenty-five to thirty
percent less than in-home softening, considering only financing and operating cost of the73 5
VIII - 6 8

softening aspects of the treatment facility Water softened by in-home softening unitsgenerally has the majority, if not all, of the hardness removed, whereas generally only aportion of the hardness is removed at a central hardness reduction plant Therefore, theadvantages cited previously for soft water may be greater in in-home softened water ratherthan central plant softened water Additionally, only a portion of all water used (generallyonly drinking, bathing and wash water) is treated by in-home softening units, whereas allwater from a central treatment facility, including water for irrigation, is treated
DUAL DISTRIBUTION SYSTEM
The potential for a dual water distribution system (dual system) for Columbus has beenconsidered and determined to be a non-viable long-term water system alternative A dualsystem is a potentially valuable management tool for communities and regions that havelimited supplies of high-quality water treatable to the federal drinking water standards Sucha system distributes two grades of water to the same service area, one potable and the otherperhaps non-potable The quality, quantity and pressure available in each system arefunctions of the sources and intended use for each grade of water The dual systems maycover a complete service area or only portions of a service area The non-potable water canbe derived from the reuse of wastewater or can be a raw water source with poor quahrvinc luding high organics, heavy metal, and total dissolved solids content Distribution of thenon-potable water requires a complete separate distribution system Concerns about dualdistribution systems include the following
Public health
Cross-connection control must be provided
Improper use of non-potable water must be strictly controlled
v m - 7Si\0 ™

The non-potable system must be clearly marked and identified
Close surveillance and monitoring of the non-potable system is necessary'
Safeguards to minimize the effects of human carelessness must be established
In order to provide a complete dual system in Columbus, the approximately 110 miles ofexisting water mains would have to be duplicated As previously discussed, the aquifers inthe Columbus vicinity are capable of producing a high quality water to meet the long rangedemands of the City The quality of the aquifers is such that minimal, if any, conventionaltreatment is required According to AWWA, there is a definite annual cost difference in
favor of conventional treatment systems over dual systems where conventional treatment issufficient For the reasons cued, a dual system is not considered an applicable water systemfor Columbus
VIII-8 o-vo •»

SECTION IXRECOMMENDATIONS
INTRODUCTION
As a result of the findings of this study, the recommendations presented in this section havebeen established to best enable the City of Columbus to expand its facilities to meet theanticipated growth of the community Recommendations are presented for aquifer testing,well field development and distribution system and water storage projects
WELL FIELD DEVELOPMENT
An adequate water supply exists in the vicinity of Columbus, with several alternatives or acombination of alternatives available as the source The South Sue may have the most yieldpotential with the best quality of water with respect to hardness and total dissolved solidsHowever, the site is vulnerable to contamination from intense farming if such shoulddevelop in the well field area Therefore, some degree of land use control would be neededin this area Water treatment for the removal of iron and manganese is recommended atthis sue The North Site has a much better natural protection of the aquifer bv the presenceof Lake Babcock and Lake North and the th ick clav overburden, but mav have l imnedrecharge and yield potential This groundwater is harder and has a higher level ot total
dissolved solids However, iron and manganese levels may be below secondary maximumcontaminate levels, eliminating the need for treatment other than disinfection
Ultimately, the best water system for the City of Columbus may be a combination of the twoalternatives This may include the immediate development of wells at the North Site forshort-term water supply to reduce the TCE contamination problem and to keep pace withthe increasing water demands If the yield potential of the North Site is found inadequate,the South Sue may then be developed as the long-term water supply source with theadditional contributions from the north sue to help meet peak demands
IX- 1

The recommendation of this report is to proceed with the North Site water system and thedevelopment of the North Well Field to meet the short-term (3 - 5 year) demands of thewater system Development of the North Site as a long-term water supply is contingentupon the results of aquifer testing
AQUIFER TESTING The City should proceed immediately with aquifer testing of boththe North and South Sites Analysis of the North Site will determine its safe yield and itspotential as a long-term water supply Testing will also determine individual well designcriteria and well spacings Analysis of the South Site will provide invaluable informationfor its development as a long-term source of supply should the North Site be determinedto have limited safe yield
NORTH WELL FIELD DEVELOPMENT .As mentioned previously, the North Site
should be developed to meet the short-term demands of the water system Thedevelopment of the North Site is recommended due to its overall water qualitv and theminimal treatment required to meet the Safe Drinking Water Act This development willhelp the City meet the uater demands during the next several years and help reduce theTCE contamination problem Satisfying the short-term demands also provides the City withtime for engineering, planning, land acquisition and construction of a long-term water supply
and possible t reatment faci l i t ies If aquifer testing indicates the North Site is a viable long-term \ \ater source it should be developed as such If the safe yield of the North Site is
l imited, the short-term development can be used to supplement other water supplies dur ing
peak periods
Well Field Construction The proposed development plan for the north well fieldis construction of 2 mgd wells at well spacings of approximately 1,500 feet Initialdevelopment will place one well west and one or two wells east of the existing well andreservoir Continued development of the well field will be to the east, south of the LoupRi\er Canal Ult imately , wells will be located east of Lake Babcock, north of the canal
ilI X - 2 Is\o 201 8ro •+

This will require a mam crossing of the canal The wells will be manifolded, discharginginto storage The supply of water into the distribution system will come from storage, notdirectly from the wells
Each of the wells will be in individual well houses of masonry construction The mam roomin the well houses will contain the well pump, well pump controls, electrical and standbypower, in some cases Enough standby power will be provided to ensure average daydemands can be met during a complete well field electrical loss A separate room, withexterior access only, will contain chlonnation equipment
DISTRIBUTION SYSTEM AND WATER STORAGE
Recommended distribution system and water storage improvement projects ident i f iedpreviously and discussed here are based on the development of a 20 mgd water supply froma single source and allow for water levels within existing and future storage to controlpumping of the wells and the operating pressure of the system The North Well Field
should be developed to satisfy short-term requirements In the event the North Well Fieldcannot achieve the desired 20 mgd capacity, a split supply system will be necessarv and theproposed distribution system may need alteration
DISTRIBUTION SYSTEM The previous discussions related to the distr ibution system
and \\ater storage identified improvement projects in four five-year phases These phasesare based on well field development and increases in water demands as the existing wellsare phased out of service The priorities of the phases are summarized below
Phase I (1991-1995) - Increase the delivery capability of the new North Well Fieldto the existing network and maintain adequate system pressures
TV 1 »-* ="IX •3 8 a32CU •+
Phase II (1995-2000) - Continue increasing the water delivery capability of NorthWell Field or begin initial development of water supply capabilities from the SouthWell Field Priorities are dependent upon source and location of supply
Phase III (2001-2005) - Enhance delivery system from new well field, improve serviceto the distribution system periphery and improve network distribution for firedemands
Phase IV (2006-2010) - Enhance water supply to existing areas and provide serviceto future areas of development
The distribution system projects can essentially be categorized into two groups The firstgroup (the Phase 1 project and the top priority projects in Phase 2) are intended to increasethe delivery capabilities of the new well field(s) to the distribution network and maintainadequate system pressures during peak conditions These projects are the highest priority
distribution system projects The projects were sized based upon a 20 mgd source fromeither the North or South Sites with the projects being nearly identical for either sourceShould aquifer testing indicate the North Site cannot be developed into a 20 mgd sourceand a combination of sources is necessarv, these projects will still be the highest prioritiesalthough pipe sizes may be reduced
The second group of projects (the low priority projects in Phase 2 and Phase 3 and 4projects) are primarily intended to improve the service, including satisfying fire demands,within and near the periphery of the distribution network as the community develops These
projects are the same whether the source of supply is from the north or south or is acombination of the two The projects were phased in accordance with anticipated growthpatterns of the community during the next two decades The City should verify growthpatterns and re-calculate pipe sizes using the distribution network computer model as theseprojects are phased in, especially those projects intended to improve service at the . ^
distribution system periphery »-» 3-8<?VO T
8!I X - 4

WATER STORAGE A 25 million gallon elevated-storage reservoir should beconstructed near the Downtown area and a 2 0 million gallon ground-storage reservoirshould be constructed south of Lake Babcock between 18th and 33rd Avenues to meet thefuture storage demands of the City of Columbus Elevated storage near the Downtown areaprovides that area with a supply of water in the vicinity in the event the transmission mamsfrom the North Site Well Field are interrupted In order to enhance the ability of thesystem to maintain adequate pressures as a new source of water supply is developed,construction of the ground-storage facility should be completed after Phases I and II of thedistribution system are completed However, construction of the elevated-storage reservoirshould be completed within the next five years The recommendation to construct bothground- and elevated-storage is predicated on the North Site being a viable long-term sourceof supply If the North Site is not a viable long-term source, 4 5 million gallons of ground-storage should be provided near Lake Babcock In this case, storage for the Downtown areawill be provided in the aquifer itself and in the treatment facilities, as previously described
RECOMMENDED ALTERNATIVE COSTS
Capital costs and operation and maintenance tests for the recommended altername are
provided in Table IX-1
I X - 5

TABLE IX-1ESTIMATED COSTS FOR RECOMMENDED ALTERNATIVE
COLUMBUS WATER STUDY
Aquifer Testing $93,000Well Field 4,600,000Treatment 590,000Distribution
Phase I 1,721,000Phase II 1,930,000Phase III 1,576,000Phase IV 1,613,000
Storage 3.931.000
Total Estimated Capital Costs $16,054,000
Annual Estimated Operation and Maintenance $274,000
Capital costs include construction, contingencies engineering, land, legal, fiscal andadministrative, and interest during construction, as previously described Operation andmaintenance costs include labor, power, maintenance material, fuel and chemicah for anaverage daily demand of 7 5 mgd, as previously described

SECTION X
FINANCING OF PROPOSED WATER SYSTEM IMPROVEMENTS
INTRODUCTION
The financing and scheduling section of this report is presented as a guide for furtherconsideration into the development and construction of proposed water systemimprovements The impact on water user rates of financing proposed improvements duringthe next five years is discussed City Officials must work closely with their financialconsultants in preparing a detailed financial program
FINANCIAL
Existing water rates, existing and estimated future revenues and future expenditures andfinancing requirements are discussed below
WATER RATES The primary source of revenue for the operation, maintenance anddebt service payment associated with the water system at Columbus is generated from watersales During the past five years, approximately 90 percent of water svstem receipts havebeen from water use charges with the remaining 10 percent from sales tax permits finespenalties, etc The present rate for each customer is SO 32 per one thousand gallons ot
water used
EXISTING AND ESTIMATED FUTURE REVENUE The yearly gross receipts fromall water system revenues and revenues from water sales for the period of 1985 to 1990 arepresented in Table X-l Fiscal years for the City of Columbus are from August 1 to Julv31 For this report, data obtained from fiscal year reports will be listed in the calendar yearin which the fiscal year ends Future revenue projections are based upon the existing waterrate structure and the projected average daily per capita usages previously determined All
II
\0

water system revenues have been projected based on the water sales revenues being 90percent of all revenues Estimated gross receipts from all water system revenues andrevenues from water sales for the period of 1991 to 1995 are presented in Table X-l
TABLE X-lWATER SYSTEM REVENUESCOLUMBUS WATER STUDY
Water Sales Revenues Water System RevenuesYear ______(£|_____ _____($)
1985 387,759 89 437,088 621986 347,287 65 366,725 931987 424,75424 489,144891988 504,27696 543,517681959 551,52363 599,3329919901991' 560,64000 623,000001992' 572,32000 635,900001993' 584,00000 649,000001994* 597,68000 662,000001995* 607,36000 674,85000
Projected
FljTURE EXPENDITURES AND FINANCING REQUIREMENTS Financing andexpenditure requirements for the next five years have been determined for three watersystem plans All three plans are based upon the development of a 20 mgd source of supply
at the North Site previously identified The ramifications on the proposed water system ofaquifer testing determining the availability of this site as a long-term source of supply havebeen previously discussed Should the North Site be determined to be non-viable as a long-term source of supply, water system and associated financial plans must be adjusted
The first plan, Plan 1, is the previously recommended plan of aquifer testing, North WellField development and distribution system and water storage improvements In this plan
x - 201oo

during the next five years, financing will be required for aquifer testing, development of thenorth well field, including provisions for disinfection at each well house, construction of anelevated-storage reservoir and Phase I distribution system improvements The remainingtwo plans are the same as Plan 1 with regard to aquifer testing, development of the northwell field, and distribution system and water storage improvements However, for thepurpose of determining what impact the construction of a treatment facility may have onwater rates within the next five years, a treatment plant has been assumed to be constructedand become operational by 1995 Iron and manganese removal and hardness reductionfacilities will be incorporated into Plans 2 and 3, respectively
Annual financing requirements, Operation and maintenance costs and total annualexpenditures are presented in Table X-2 All financing requirements are based upon a 7%rate of interest and a 20-year amortization period Total annual expenditures are basedupon annual financing requirements and estimated operation and maintenance costs of boththe existing system and proposed improvements Existing system operation and maintenancecosts were estimated, with assistance from the City, for 1995 based on the previous five yearsof City records and accounting for a decline in operating costs as existing wells are removedfrom service
v.*I-*O
%U1vo
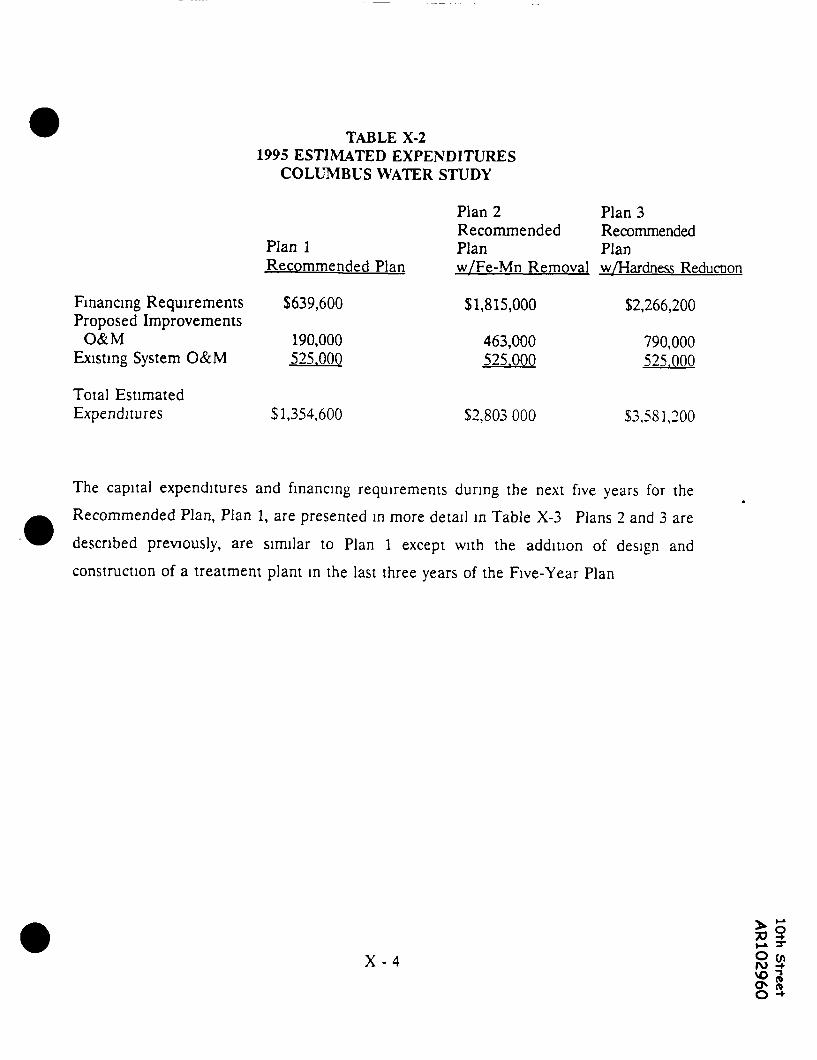
Financing RequirementsProposed Improvements
O&MExisting System O&M
Total EstimatedExpenditures
TABLE X-21995 ESTIMATED EXPENDITURES
COLUMBUS WATER STUDY
Plan 1Recommended Plan
$639,600
190,000525.000
51,354,600
Plan 2 Plan 3Recommended RecommendedPlan Planw/Fe-Mn Removal w/Hardness Reduction
$1,815,000
463,000525.000
$2,803 000
$2,266,200
790,000525.000
$3,581,200
The capital expenditures and financing requirements during the next five years for theRecommended Plan, Plan 1, are presented in more detail in Table X-3 Plans 2 and 3 aredescribed previously, are similar to Plan 1 except with the addition of design andconstruction of a treatment plant in the last three years of the Five-Year Plan
X - 4 Oron(0

TABLE X-3FIVE-YEAR CAPITAL IMPROVEMENTS PLAN
COLUMBUS WATER STUDY
Capital Improvement Capital Cost
1991 Aquifer Testing $93,000
1992 Well Field Development &Treatment (8 MOD) 2,076,000
Phase I DistributionImprovements 1,721,000
1993 Wells and Phase I oeprational bvJune, 1993
1994 Elevated Reservoir 2.888.000
1995 -
Totals $6,778,000
X C O (ft- -> \ 5*

APPENDIX A
WATER QUALITY REGULATIONS AND GOALS
COLUMBUS WATER STUDY
In 1986, the SDWA was amended to strengthen it with respect to the regulation settingprocessing and groundwater protection The water quality regulation components of the1986 amendments to the SDWA are summarized as follows
Maximum contaminant level goals (MCLGs) and maximum contaminant levels(MCLs) must be established by the USEPA for 83 contaminants listed in the AdvancedNotice for Proposed Rule Makings of March 4, 1982 and October 5, 1983 Of the 83 listedcontaminants, seven substitutes are allowed if they pose a greater health risk MCLGs areFederally nonenforceable health goals for public water systems, and are defined as thehighest permissible concentration of a contaminant allowed in a drinking water at whichno known or anticipated health effects will occur MCLs are Federally enforceableregulations and are the highest permissible concentration of a contaminant allowed in adrinking water
USEPA was to specify an additional list, i e , the 1988 Drinking Water PnontvList (DWPL), of contaminants or contaminant groups that occur in drinking water, or are
anticipated to occur in drinking water, that pose a health risk and that may warrantregulation under the SDWA There are 53 contaminants or contaminant groups on the 1988list Proposed MCLGs and MCLs for a minimum of 25 of these contaminants orcontaminant groups are published, and final MCLGs and MCLs are to be published by
January 22, 1993 The 1988 DWPL must be updated trienmally The USEPA mustpromulgate 25 National Primary Drinking Water Regulations (NPDWR) from the DWPLwithin 3 years of publishing the triennial list
Disinfection is required of all public water supplies with some variances
A- 1VO

Criteria was established under which filtration could be required for publicsystems using surface water sources
Throughout the discussion which follows, reference is made to proposed maximumcontaminant levels (PMCLs), proposed maximum contaminant level goals (PMCLGs),secondary maximum contaminant levels (SMCLs) and proposed secondary maximumcontaminant levels (PSMCLs) SMCLs are federally non-enforceable goals for contaminantsthat may adversely affect the aesthetic quality of drinking water Proposed levels and goalsfor these contaminants have not yet been promulgated
To assist in the development of short term/long term Goals, the SDWA regulations bothpresent and future, were considered The regulations include inorganic chemicals (lOCs)synthetic organic chemicals (SOCs) including volatile svnthetic organic chemicals (VOCs),disinfection and disinfection by-products, radionuchdes, microorganisms and turbidity Inaddition, non-regulated water quality constituents such as hardness, etc and federallyregulated non-enforceable SMCLs for pH, color, foaming agents, corrosion, total dissolvedsolids, and odor and the American Water Works Association's (AWWA's) position on waterquality parameters are discussed
Inorganic chemicals contaminant levels are listed in Table A-l along with water quahtv
goals The final IOC rule for Phase II was published in January, 1991 The final IOC rulefor Phase V of the USEPA promulgation program is scheduled for publication in March
1992 EPA has requested the deadline for publication of the final lead and copper rule beextended until April, 1991
Contaminant levels and contaminant level goals and water quality goals for SOCs areprovided in Table A-2 SOCs include VOCs, drinking water chemicals, pesticides, herbicidesand PCB's The final SOC Phase II rule was published in January, 1991 The final SOCPhase V rule is scheduled for publication in March 1992 ^
A-2 §
U)

The Disinfection - Disinfection By-Products Rule (D-DBP) (Phase VIA) will regulatedisinfectants and a variety of disinfection by-products (ozonation and chlonnation) andinclude mandatory groundwater disinfection requirements (GWDR) The D-DBP rule willbe published for public comment in late 1991 and is expected to be promulgated in 1993The EPA has developed a working list of approximately 40 disinfectants, chlonnation by-products, and ozonation by-products MCLs or treatment technique requirements could beestablished for some or all the candidate disinfectants and contaminants Table A-3illustrates those contaminants and disinfectants that are the most likely or have somepotential of being regulated under the D-DBP Rule according to AWWA
The proposed GWDR requires that all public water systems using any groundwater sourcemust disinfect unless it can obtain a variance from the State Under the GWDR, theUSEPA is proposing to regulate viruses, Legionella, and Heterotrophic Plate Count (HPC)The MCLGs for viruses and Legionella are zero No MCLG is proposed for HPC becausethis represents both innocuous and pathogenic bacteria and therefore USEPA could not seta particular HPC (other than at zero) at which no adverse health effects occur EPAbelieves an MCLG of zero is inappropriate since the SDWA would then require EPA topromulgate an MCL as close to zero as feasible The health benefits of meeting a levelnear zero versus some higher level (e g, 500 per 100ml) are unquantifiable and probablvnegligible, if any Also, excessive amounts of disinfectant would be needed to achieve sucha level which could result in excessive disinfection by-products in the finished waterDisinfection technique requirements are established in lieu of MCLs for viruses, HPC and
Legionella Treatment techniques will be based on Chlorine Time (CT), the product ofresidual concentration (mg/1) and contact time (minutes) or ultra violet (UV) disinfection
conditions Under the proposed GWDR, CT is a function of the required level ofmactivation of microorganisms (most likely 99 99 percent for viruses), disinfectant used,water temperature and pH
A-3 s

According to the EPA's Guidance Manual for Compliance with the Filtration andDisinfection Requirements for Public Water Systems Using Surface Water Sources.(Manual), the Primary Agencies have the responsibility for determining whether watersupplies must meet the requirements of the GWDR or Surface Water Treatment Rule(SWTR) For Nebraska, the Primary Agency will be the Nebraska Department of HealthThe SWTR applies to water systems that use surface water sources or groundwater sourcesunder the direct influence of surface water The basis for this rule is the assumption thatall surface waters and groundwaters under the direct influence of surface water are at risk,at least to some degree, from contamination by Giardia lamblia and other protozoa, viruses,and pathogenic bacteria The SWTR requires a 99 9 percent and 99 99 percent mactivationof Giardia and viruses, respectively In addition, the residual chlorine disinfectant in treatedwater at the point of entry into the water system cannot be less than 0 2 mg/1 for more than4 hours The Manual indicates that while paniculate analysis probably provides the mostdirect evidence that pathogens from surface water could be migrating into a ground watersource, other qualitative parameters such as turbidity, temperature, pH and conductivitycould provide supportive, but less direct, evidence The protocol proposed by the NebraskaDepartment of Health includes procedures for determining whether a groundwater sourceis under the direct influence of surface water by both paniculate and qualitative analyses
Establishing Goals for the D-DBP rule is di f f icul t , if not impossible, unti l the proposed ruleis published in September 1991 At this time, draft MCLGs have been calculated for mostdisinfectants and DBP contaminants, but health effects information for some is incomplete
Therefore, MCLG numbers for disinfectants and DBPs are not available for discussionexcept for total tnhalomethanes which are in draft form The Goal for total
tnhalomethanes is based on the MCL under consideration Goals for the GWDR areprovided in Table A-3 based on MCLs and MCLGs currently under consideration
The radionuchde rule (Phase III) will establish MCLGs and MCLs for radon-222, radium-226, radium-228, natural uranium, and beta particle and photon emitters The proposed rule . „
o
A-4 S ^flV "
01 *

is scheduled for publication at the earliest by February, 1991 and the final rule is scheduledfor publication in November 1992 Table A-4 provides CMCLs and CMCLGs (MCLs andMCLGs under consideration) for the Phase III rule as well as radionuchdes already includedin the NIPDWR Water quality goals are also provided in Table A-4
The total conform rule was published on June 29, 1989 Total cohforms include fecalcoliform and E coli The MCLG is zero The MCL is based on the presence - absence (P-A) of total cohforms In the case of Columbus (analyzing less than 40 samples per month),no more than 1 sample per month may be positive for total coliform The Goal for totalcoliform should be zero
Table A-5 provides limitations for federally regulated water contaminants and characteristicsthat are not classified as lOCs, SOCs, D-DBP, radionuchdes, or cohforms Thesecontaminants and characteristics are entitled "Other Characteristics"
A - 5

TABL1( O I l ' M B U S WATER If^ALm C.OAI S
INOIU.ANIC CHEMICA1S (K)C's)COIUMBUS WATER STUDY
CONTAMINANT
123456789
10II12131415161718192021222324252627
AluminumAntimony OOI/0005C 'd
ArsenicAsbestosBariumBeryllium O O O I C
CadmiumChlorideChromiumCopperCyanide 0 2FluondeIronLeadb'h
ManganeseMercuryMolybdenumNickel 0 lc
Nitrate as NNitrite as NSeleniumSilverSodiumSulfate 400/500c'e
Thallium 0 002/0 00lc'd
V inadium4Zinc
PMCLmg/1
MCI GniR/l
MCLmg/l
MCLGmc/l
SMCLniR/l005-02 8
ooov
zero
02 L
O l 1
0057 mill fibers/I 7 mill I ibcrs/l
2 O8 2 0B
400/5000 0005L
c e
00058
0 I8
I 3
4 0
0002
a'8I0
005
00058
O l 8
1 1
4 0
250
1 0
2 00 3
00028
I0ng
005
005
0 I8
250
5 0
GOALSmg/l<005<0003<005
<7 mill fibers/I<20<OOOI<0005<IOO f
<0 I<l 0<02<20<03<OOI5<005<0002
<0 1<IO<l 0<005<0 I
<250<OOOI
<50
4.33J4.S

TABLE A-1
a - Nitrite and nitrate together cinnot exceed 10 mg/l as N
Copper and Lead Rule - EPA announced final rule on May 7, 1991
c - IOC and SOC Phase V Rule -proposed rule is out for public comment and final rule is scheduled for publicationin March 1992
EPA is considering proposing (uo MCLs based on 5 or 10 times the minimum detection limit
A
EPA is proposing two alternative options
f - AWWA position
8 - Final IOC Phase II Rule is effect ive July 30, 1992
No MCL for lead All water purveyors, regardless of population served, must monitor for lead in high-riskhomes If 10 percent of the homes monitored have at the tip levels of 0015 mg/l or greater, the water purveyormust take the necessary steps to reduce lead content
Bold faced lOC's do not have MCLs or PMCI s it this time
89630W

TABLLCOI UMBUS WATER QUALITY GOA1 S
SYNTMI TIC ORGANIC CHEMICALS (SOC's)COLUMBUS WATER STUDY
Volat i l e Synthetic Organic Chemicals (VOCs)
CONTAMINANT
1 Benzene2 Carbon Tetrachlonde3 o-Dichlorobenzene4 para-Dichlorobenzene5 1,2-Dichloroethane6 1,1-Dichloroethylene7 Cis-l ,2-Dichloro-
ethylene8 trans-l,2-Dichloro-
ethylene9 1,2-DichIoropropane10 Di(ethylhexyl)adipate11 Di(ethylhexpy)phthalate12 Dichloromethane (methylene
chloride)13 Ethylbenzene14 Hexachlorobenzene15 Hexachlorocyclo-
pentadiene (HEX)16 Monochlorobenzene17 PA Hs[ Benzo(a)py rene]b
18 Styrene19 2,3,7,8-TCDD(Dioxm)20 Tetrachloroethylene
PMCLd PMCLG'1
mg/l mg/l
0 5 0 50 004 zeroe0 005 zero
0001 zero
005 005
0 0002 zero
5 x IO"8 zero
MCI.mg/l0005000506C
007500050007
007C
O l c
0005C
07C
O l c
O l c
0005C
MCLGmg/lzerozero06C
0075zero0007
007C
O I C
0C
07C
O I C
O I C
oc
PSMCL GOALSmg/l mg/l
<0005<0005<06
0 005a <0 005<0005<0007
<007
<0 1<0005<05<0004
<0005<07<OOOI
0 008a <0 008<0 1<0 0002<0 1<5 x IO"8
<0005
69630W4.33 J4-S
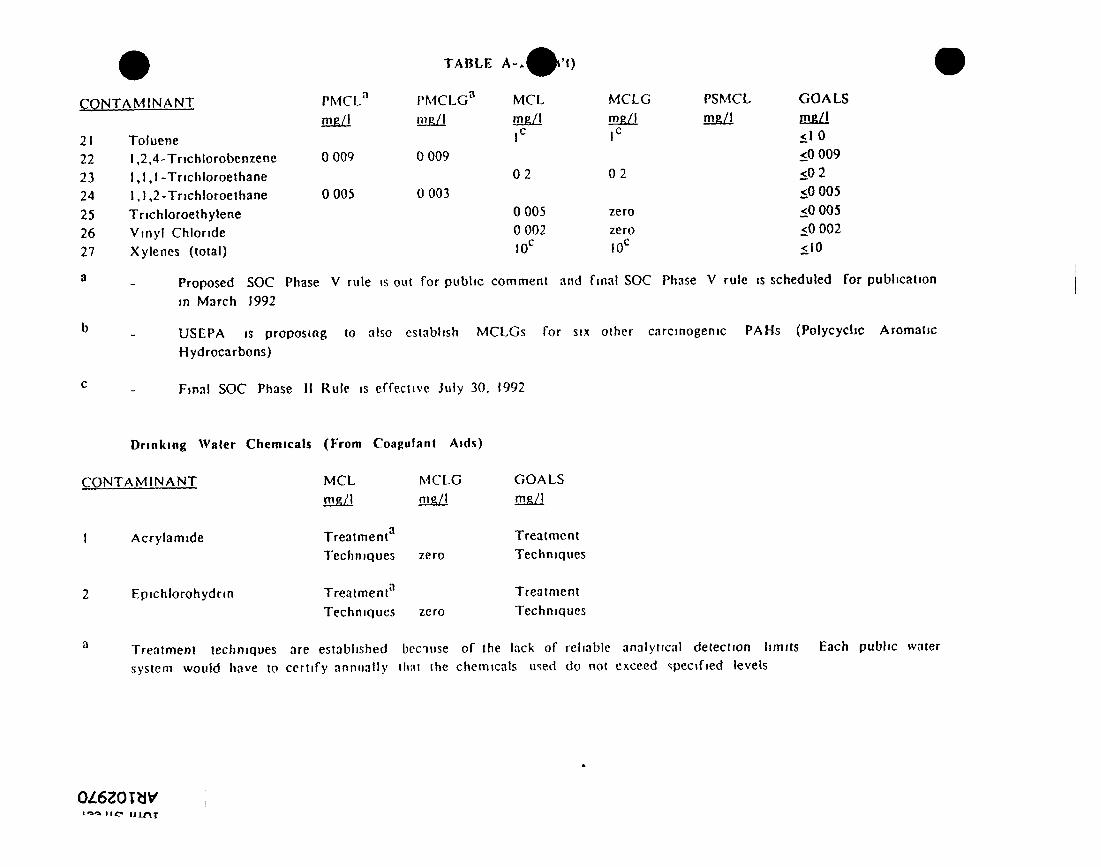
TABLE
CONTAMINANT
21 Toluene22 1,2,4-Tnchlorobervzene23 1,1,1-Tnchloroethane24 1,1,2-Tnchloroethane25 Tnchloroethylene26 Vinyl Chloride27 Xylenes (total)
PMCLa
omZi
0009
0005
PMCLG8
mR/l
0009
0003
MCL
TC
02
00050002IOC
MCLn^l
02
zerozeroIOC
PSMCLmR/l
GOALSmg/1^ °<0 009<0 2<0005<0 005<0 002<IO
Proposed SOC Phase V rule is out for public comment and final SOC Phase V rule is scheduled for publicationin March 1992
USEPA is proposing to also establish MCLGs for six other carcinogenic PAHs (Polycyclic AromaticHydrocarbons)
Final SOC Phase 11 Rule is effective July 30, 1992
Drinking Water Chemicals (From Coagulant Aids)
CONTAMINANT
1 Acrylamide
2 Epichlorohydun
Treatment techniques are established bcciuse of the lack of reliable analytical detection limits Each public watersystem would have to certify annually that the chemicals used do not exceed specified levels
MCLmg/l
Treatment3
Techniques
•X
Treatment1
Techniques
MCLGmg,/l
zero
zero
GOALSm&/l
TreatmentTechniques
TreatmentTechniques

iffsl
ITABLE A-
sticides, Herbicides, PCBS
CONTAMINANT
1 Alachlor2 Aldicarb3 Aldicarb Sulfone4 Aldicarb Sulfoxide5 Atrazme6 Carbofuran7 Chlordane8 Dalapon9 Dibromochloropropane
(DBCP)10 2,4-DI I Dmoseb12 Diquat13 Endothall14 Endrin15 Ethylene Dibromide
(EDB)16 Glyphosphate17 Heptachlor18 Heptachlor Epoxide19 Lmdane20 Methoxychlor21 Oxamyl(Vydate)22 PCBs23 Pentachlorophenol24 Picloram25 Simazine26 Toxaphene27 2,4 5-TP (Silvex)
a
PMCLa
mR/l
02
00070020 10002
PMCLG3
mR/l
0 2
00070020 10002
MCLb
mR/l000200030003000300030040002
00002007
00002
MCLGb
mR/lzero0001000100020003004zero
zero007
PSMCL GOALSmR/l mg/l
<0002<0001<0001<0002<0003<004<0002<0"2
<0 0002<007<0007<002<0 1<0002
0 7
0 2
0 50001
0 7
0 2
0 50001
0 00005 zero
000040000200002004
000050001
0003005
zerozero00002004
zero
zero005
<0 00005<07<0 0004<0 0002<0 0002<004<02<0 0005<OOOI<05< O O O I<0003<005
Proposed SOC Phase V rule is out for public comment and fiml SOC Phase V rule is scheduled for publicationin March 1992Final SOC Plnse II rule is elTcciisc July 30, 1992

QUA1TABLE
COM1MBUS WATER QlJAl ITY GOAI SDISINFECTION -DISINFECTION BY-PRODUCTS (D-DBP)
COLUMBUS WATER STUDY
DISINFECTANTS, DBFAND MICROBIALS
12345,678910II121314
15
16
Q
Total tnhalomethanesHaloacetic acidsc
Chlorine dioxideChlonted
Chlorated
Chlormed
ChlorammeChlropicrin0
Cyanogen chloride0
Hydrogen peroxide6
Bromatee
lodate6
Formaldehyde6
Viruses
Legionella
Heterotrophic
bcdef
Plate Count (HPC)
25 or 50 ug/1
TreatmentTechniqueTreatmentTechniqueTreatmentTechniquef
CMCLG' MCL
0 I mg/l
zero
zero
None
GOALS
25 or 50 ug/1
TreatmentTechniqueTreatmentTechniqueTreatmentTechnique
Proposed D-DBP rule (Phase VIA) scheduled for publicnlion m 1993 and the final rule is scheduledpublication in 1995 MCLs and MCLGs under considerationEPA maximum contaminant level under considerationChlormalion by-productsDisinfectantsOzonation by-productsCMCL to be achieved by treatment technique, i e CT or UV disinfection conditions
for
4.33JIS
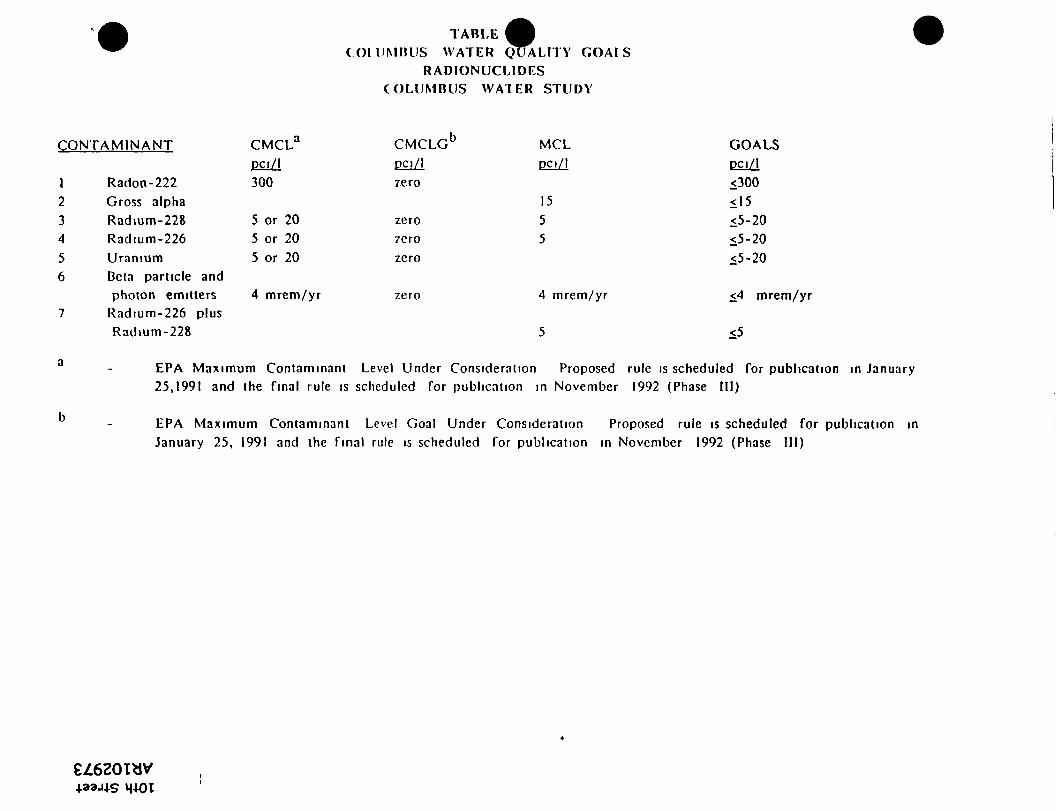
CONTAMINANT
1 Radon-2222 Gross alpha3 Radium-2284 Radium-2265 Uran ium6 Beta particle and
photon emitters7 Radium-226 plus
Radium-228
CMCLd
PCI/1
300
5 or 205 or 205 or 20
4 mrem/yr
TABLEC O I U M B U S WATER QUALITY GOAI S
RADIONUCLIDESC O L U M B U S W A T E R STUDY
CMCLG1
pci/lzero
zerozerozero
zero
MCLpci/l
1555
4 mrem/yr
5
GOALSpci/l<300< I 5<5-20<5-20<5-20
<4 mrem/yr
<5
EPA Maximum Contaminant Level Under Consideration Proposed rule is scheduled for publication in January25,1991 and the f ina l rule is scheduled for publ ica t ion in November 1992 (Phase 111)
EPA M a x i m u m Contaminant Level Goal Under Consideration Proposed rule is scheduled for publicat ion inJanuary 25, 1991 and the f i n a l ru le is scheduled for publ ica t ion in November 1992 (Phase I I I )
ezezotav

TABLJC O I U M B U S WATER QUALITY GOALS
O T H E R CHARACTERISTICSCOLUMBUS WATER STUDY
Parameter or Characterist ic
ColorPHOdor
Foaming agentsTotal dissolved solidsCorrosivity
Turbid i ty
MCL
15 cu6 5 - 8 53 threshold odornumber05 mg/l500 mg/lNon-corrosive
I NTU
GOALS
15 cu6 5 - 8 5<3 threshold odornumber<0 5 mg/l<500 mg/lNon-corrosive and noexcessive or undesirabledeposits<l NTU
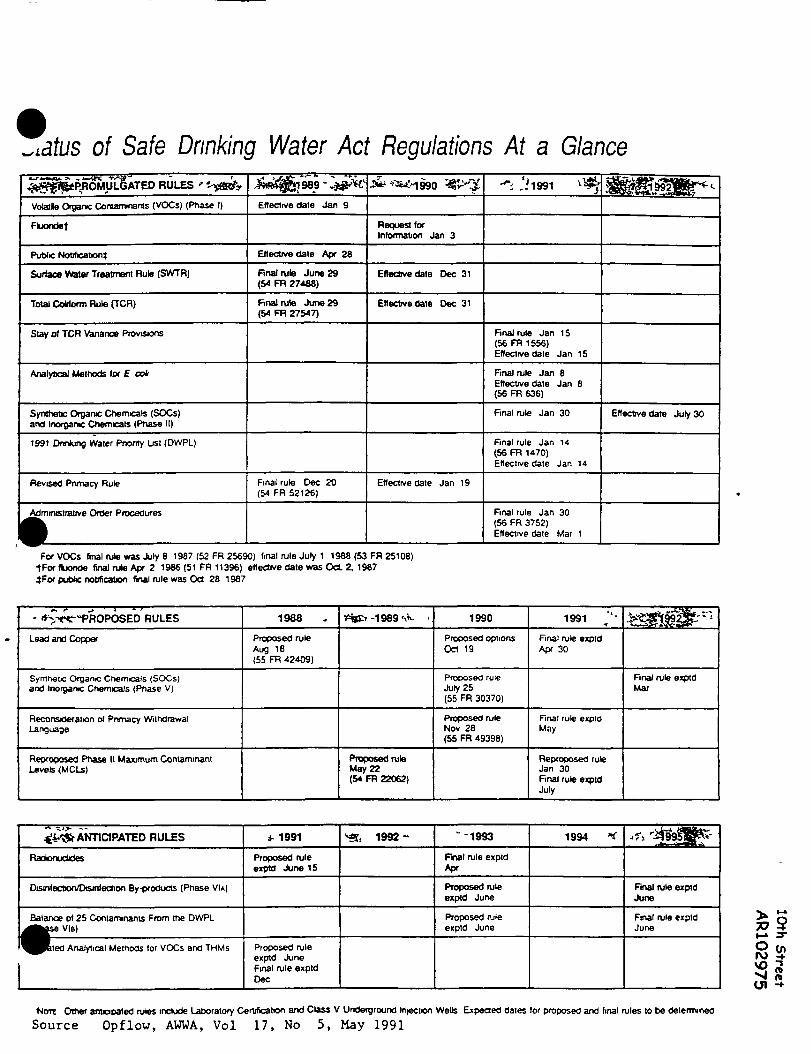
of Safe Drinking Water Act Regulations At a Glance^ f f>ROMuClSATED RULES ' i-tfsfy
Volalle Orgar»c Contaminants (VOCs) (Phase I)
Fluondet
Public Notification}
Surface Water Treatment Rule (SWTR)
Total CoWorm Rule (TCR)
Stay of TCR Variance Provisions
Analytical Methods for £ CD*
Synthetic Organic Chemicals (SOCs)and Inorganic Chemicals (Phase II)
1991 Dimkmg Water Pnorrty Ust (DWPL)
Ftevised Pnmacy Rule
^Admmisiraiive Order Procedures
Jm(^1989-^W
Effective date Jan 9
Effective date Apr 28
Final rule June 29(54 FR 27488)
Final rule June 29(54 FR 27547)
Final rule Dec 20(54 FR 52126)
.& Ofc!»|990 ^SjK-3
Request forInformation Jan 3
Effective date Dec 31
Eriertve bate Dec 31
Effective date Jan 1 9
•"; ^1991 ^
Final rule Jan 1 5(56 FR 1556)Effective date Jan 15
Final rule Jan 8Effective date Jan 8(56 FR 636)
Final rule Jan 30
Final rule Jan 14(56 FR 1470)Effective date Jan 14
Final rule Jan 30(56 FR 3752)Effective dale Mar 1
SKSS^SM^
Effective date July 30
For VOCs final rule was July 8 1987 (52 FR 25690) final rule July 1 1988 (53 FR 25108)•fFor fluonde final rule Apr 2 1986 (51 FR 11396) effective date was Oct. 2, 1987$For public notification final rule was Od 28 1987
- av^TROPOSED RULES
Lead and Copper
Synthetic Organic Chemicals (SOCs)and Inorganic Chemicals (Phase V)
Reconsideration of Pnmacy WithdrawalLanguage
Reproposed Prase II Maximum ContaminantLevels (MCLs)
1988
Proposed ruleAug 18(55 FR 42409)
l%£T-1989*xH. ,
Proposed ruleMay 22(54 FR 22062)
1990
Proposed optionsOcl 19
Proposed ruleJuly 25(55 FR 30370)
Proposed ruleNov 28(55 FR 49398)
1991
Final rule exptdApr 30
Final rule expidMay
Reproposed ruleJan 30Final rute exptdJuly
Final rule exptdMar
i Br ANTICIPATED RULES
Radonucibes
DismfectJon/DtsmfeOion By-products (Phase VIA)
Balance of 25 Contaminants From the DWPL^KgseVlB)
' ^bted Analytical Methods tor VOCs and THMs
*1991
Proposed ruleexpid June 15
Proposed ruleexptd JuneFinal rule exptdDec
SS, 1992 ~ "-1993
Final rule exptdApr
Proposed ruleexptd June
Proposed ruleexptd June
1994 * ^OSZLFinal rute exptdJune
Fmal rule exptdJune
ro
U1n
NOTE Other anticipated rules include Laboratory Certification and Class V Underground Injection Wells Expected dates for proposed and final rules to be determinedSource Opflow, AWWA, Vol 17, No 5, May 1991